Embed Size (px)
Citation preview
Using Visual Literacy Skills to Encourage
Communicative Language Practice
Katie Subra
Image source: http://wordclouds.com
Objectives
I will:
Discuss benefits of using visuals in English
language classrooms
Explain activities that incorporate signs and
infographics
You will:
Discover activities and resources adaptable to
your classroom
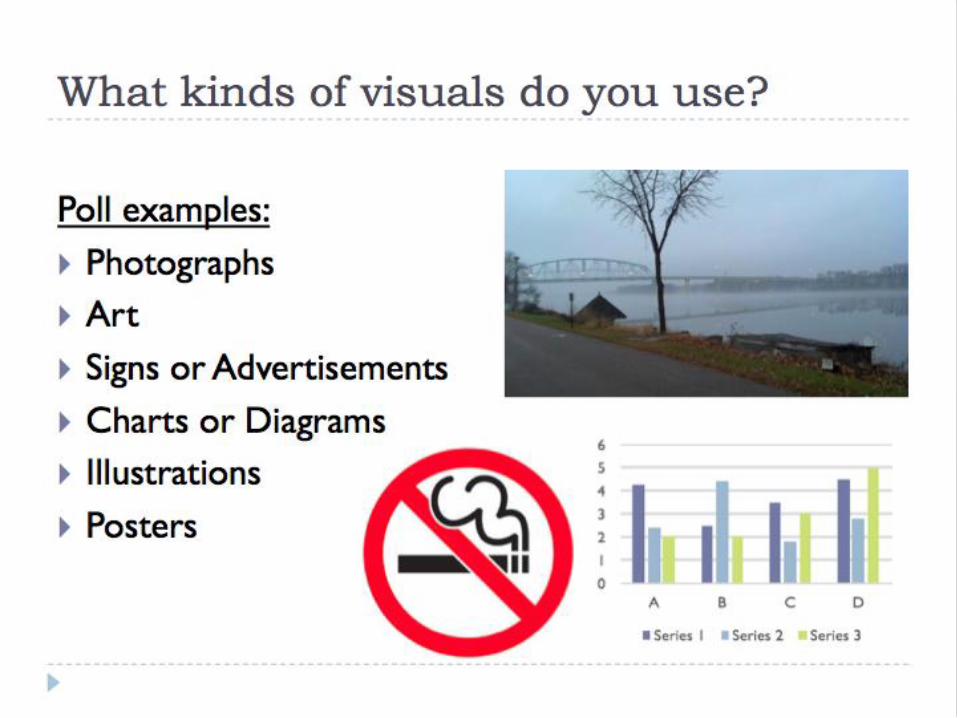
What kinds of visuals do you use?
Poll examples:
Photographs
Art
Signs or Advertisements
Charts or Diagrams
Illustrations
Posters
What other kinds of visuals do you use?
Poll examples:
Photographs
Art
Signs
Advertisements
Charts
Diagrams
Illustrations
Posters
New ideas:
Maps
Timelines
Graphic novels
Comics
Flags
Symbols
Posters
Brochures
Flyers
Film
What is literacy?
Knowledge or ability that relates to a specific topic
Literacy examples: Digital
Cultural
Nutritional
Mathematical
What is visual literacy?
Here is how I “see” it:
Visual literacy is the ability to read and
understand a variety of visuals in a given
environment.
Example:
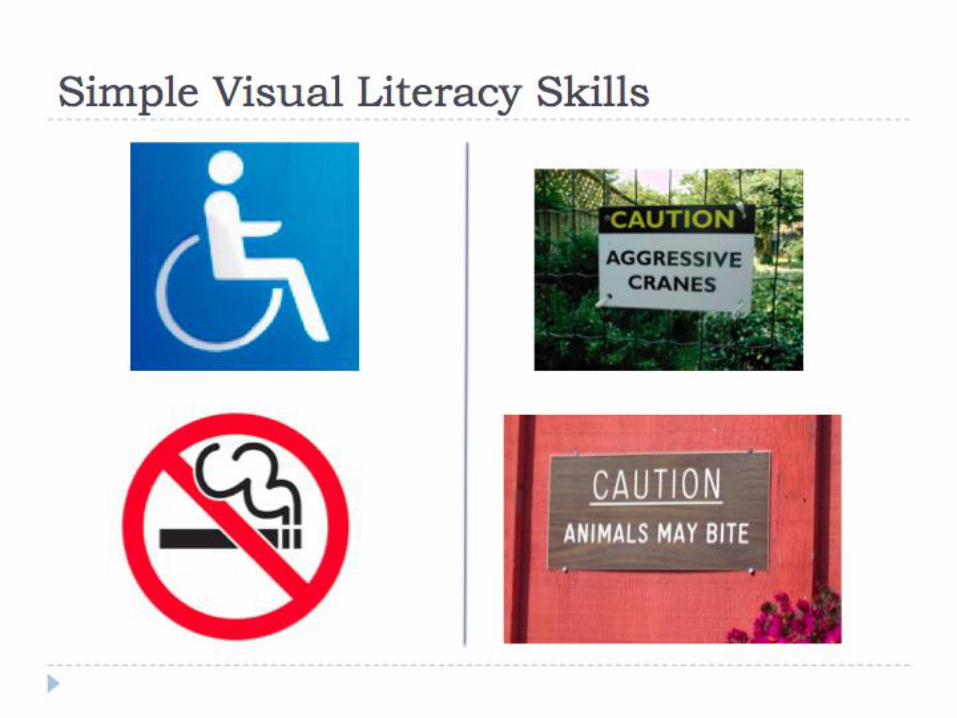
Simple Visual Literacy Skills
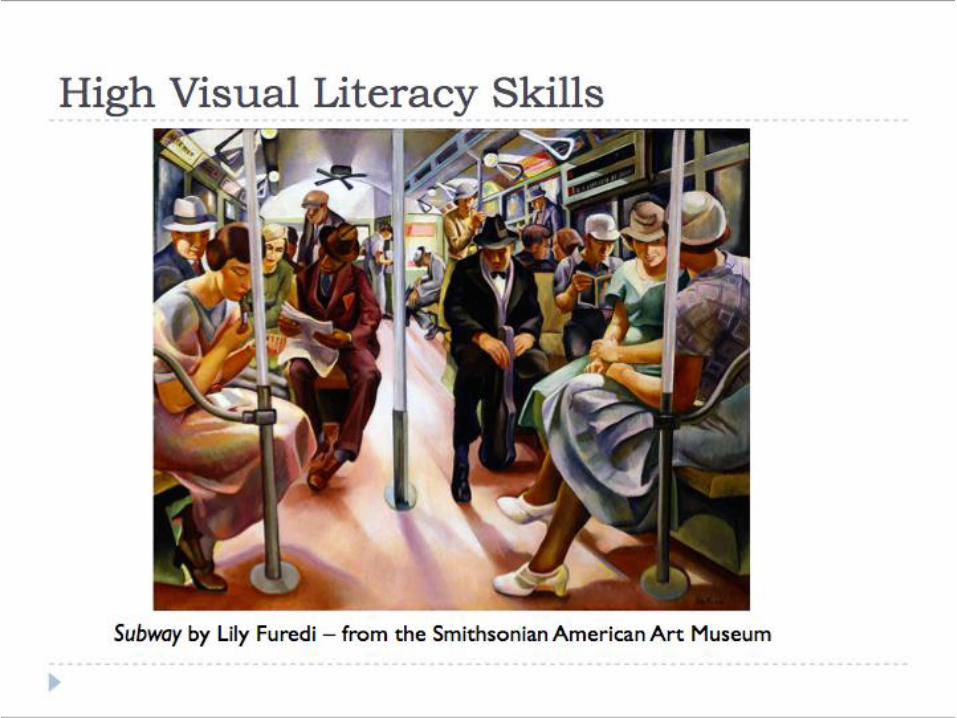
High Visual Literacy Skills
Subway by Lily Furedi – from the Smithsonian American Art Museum
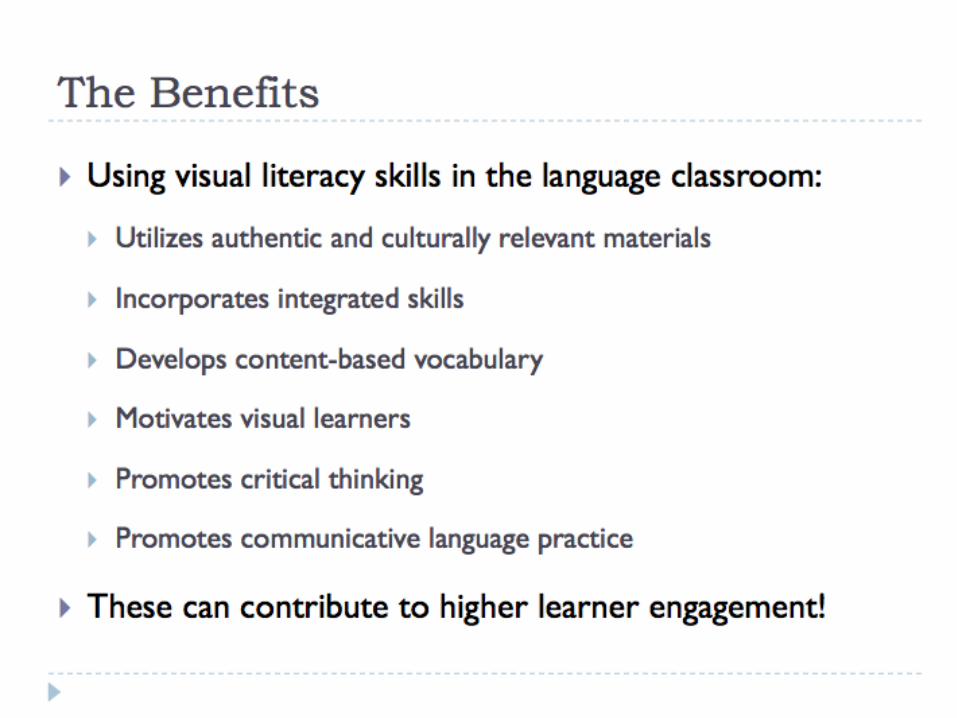
The Benefits
Using visual literacy skills in the language classroom:
Utilizes authentic and culturally relevant materials
Incorporates integrated skills
Develops content-based vocabulary
Motivates visual learners
Promotes critical thinking
Promotes communicative language practice
These can contribute to higher learner engagement!
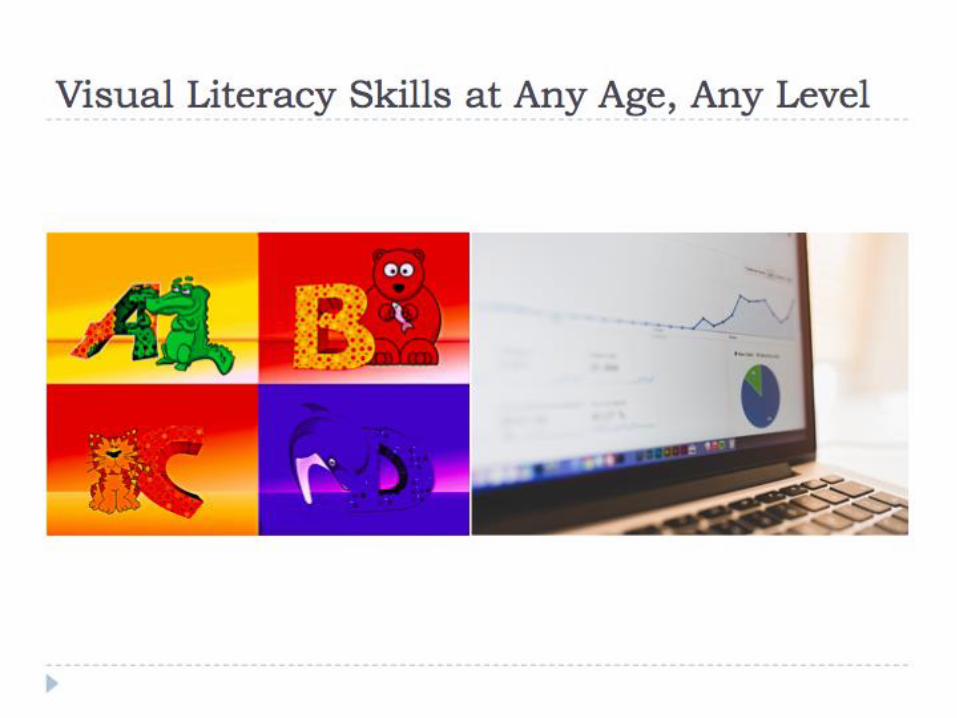
Visual Literacy Skills at Any Age, Any Level
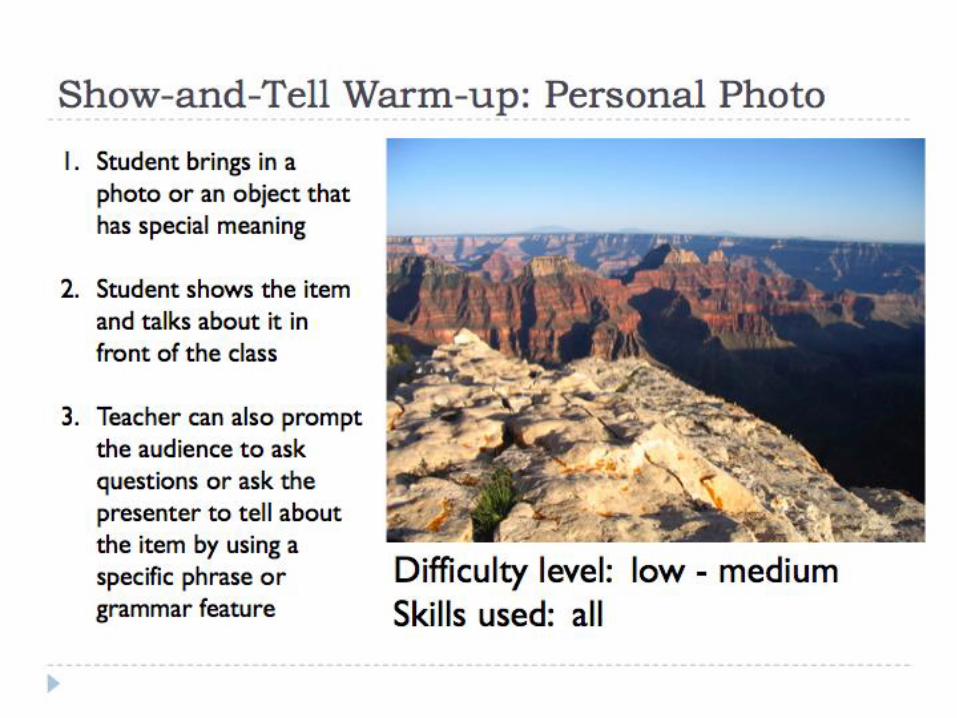
Show-and-Tell Warm-up: Personal Photo
Difficulty level: low - medium
Skills used: all
1. Student brings in a
photo or an object that
has special meaning
2. Student shows the item
and talks about it in
front of the class
3. Teacher can also prompt
the audience to ask
questions or ask the
presenter to tell about
the item by using a
specific phrase or
grammar feature
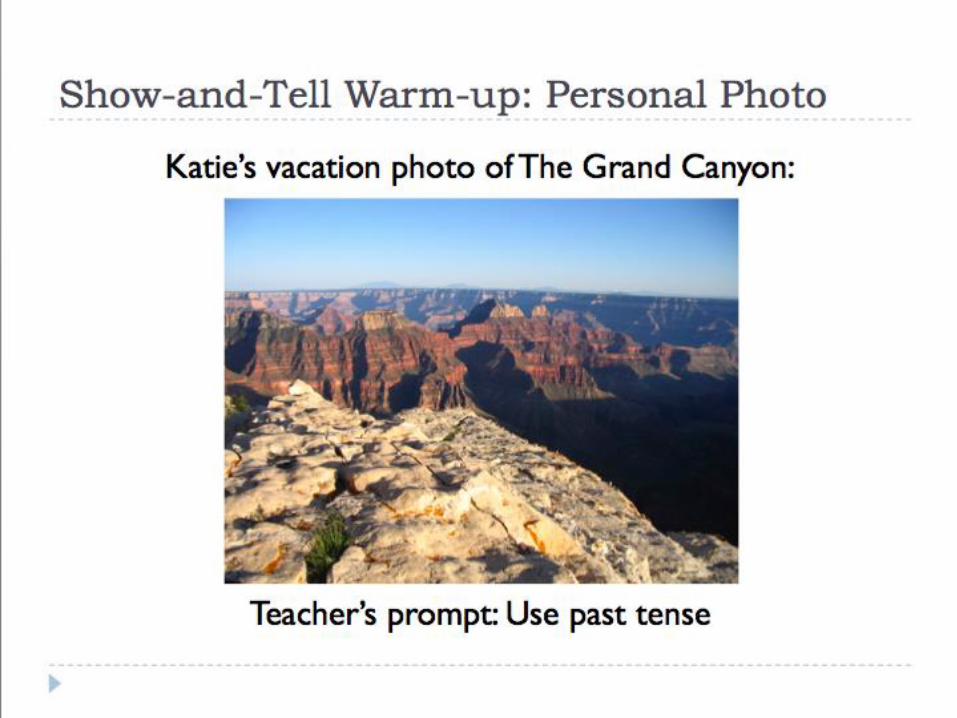
Show-and-Tell Warm-up: Personal Photo
Katie’s vacation photo of The Grand Canyon:
Teacher’s prompt: Use past tense
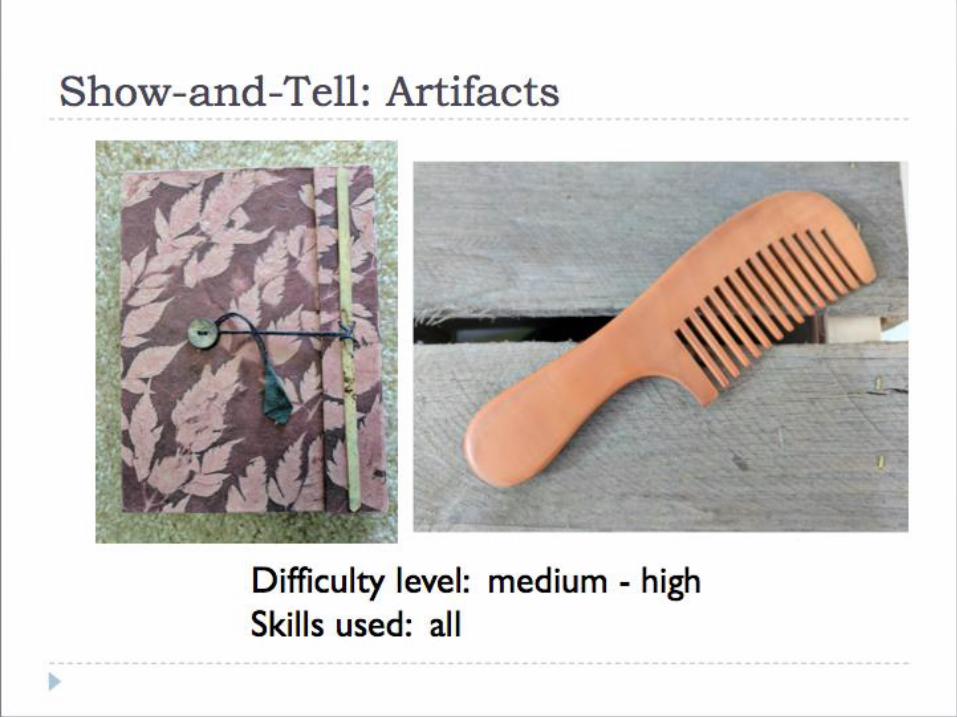
Show-and-Tell: Artifacts
Difficulty level: medium - high
Skills used: all
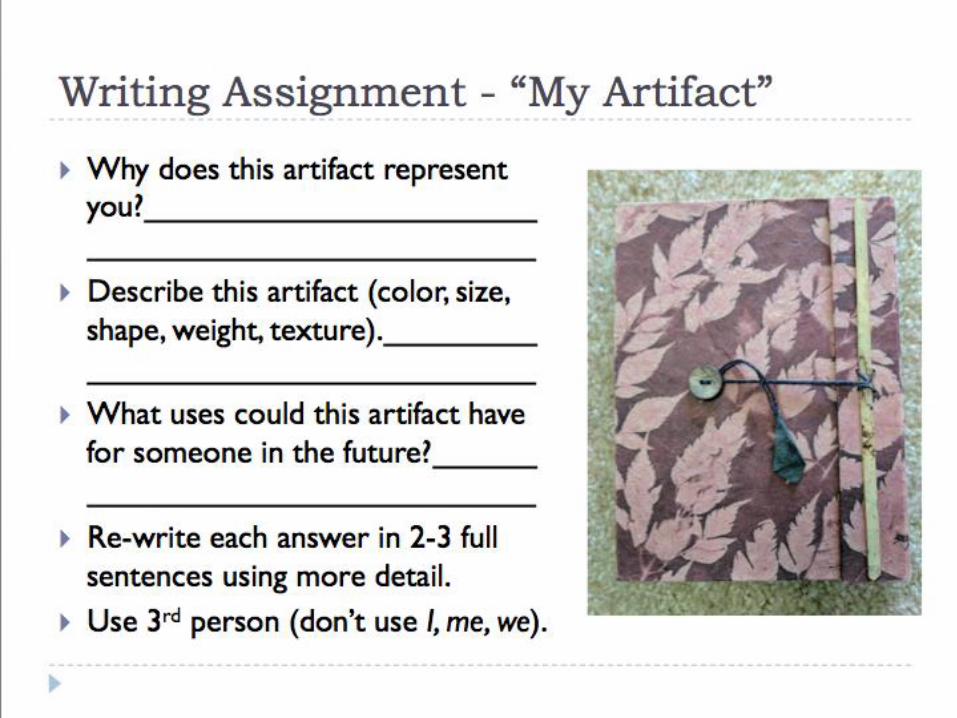
Writing Assignment - “My Artifact”
Why does this artifact represent
you?
Describe this artifact (color, size,
shape, weight, texture).
What uses could this artifact have
for someone in the future?
Re-write each answer in 2-3 full
sentences using more detail.
Use 3rd person (don’t use I, me, we).
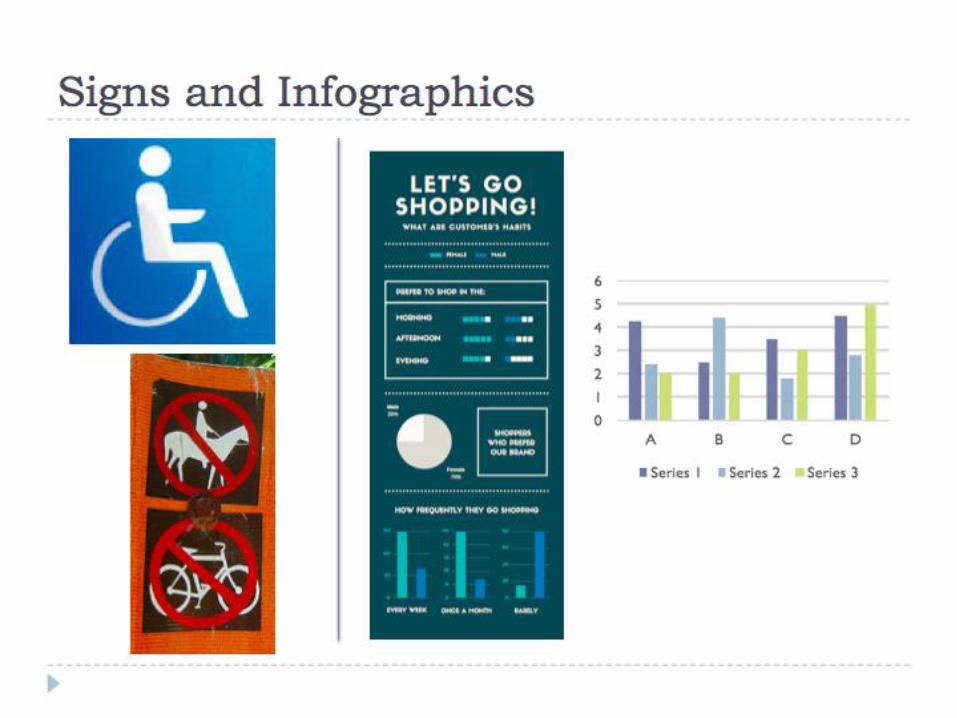
Signs and Infographics
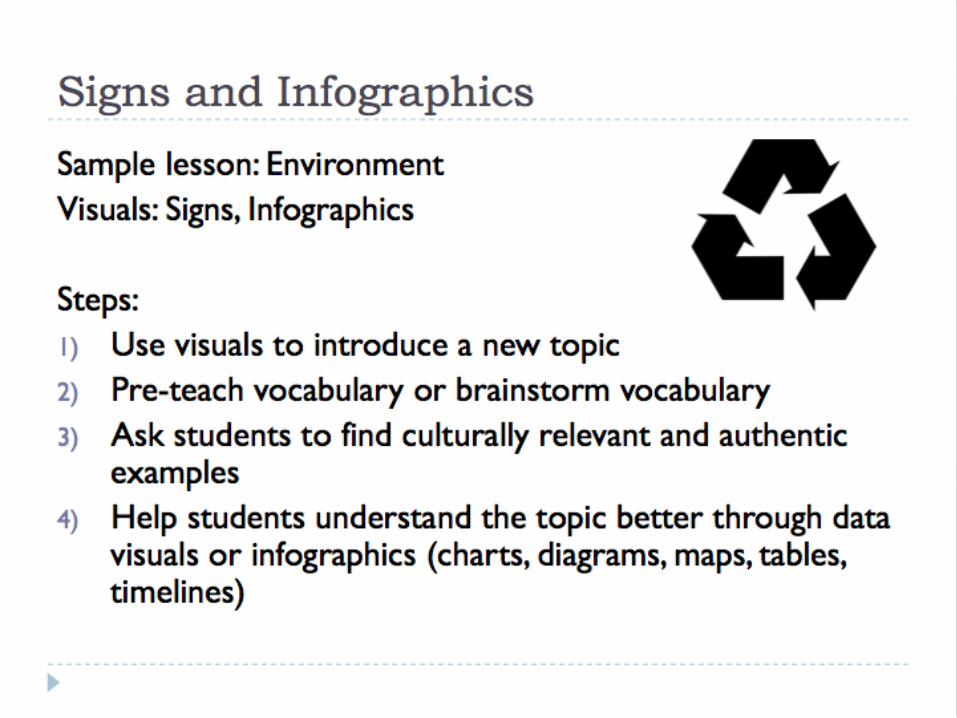
Signs and Infographics
Sample lesson: Environment
Visuals: Signs, Infographics
Steps:
1) Use visuals to introduce a new topic
2) Pre-teach vocabulary or brainstorm vocabulary
3) Ask students to find culturally relevant and authentic examples
4) Help students understand the topic better through data visuals or infographics (charts, diagrams, maps, tables, timelines)
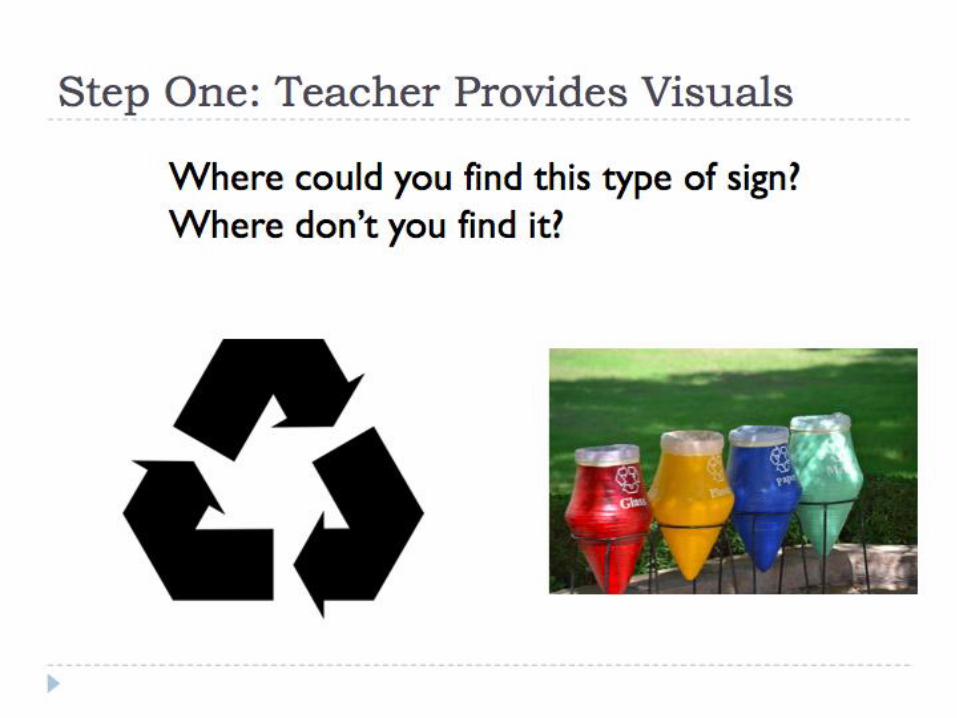
Step One: Teacher Provides Visuals
Where could you find this type of sign?
Where don’t you find it?
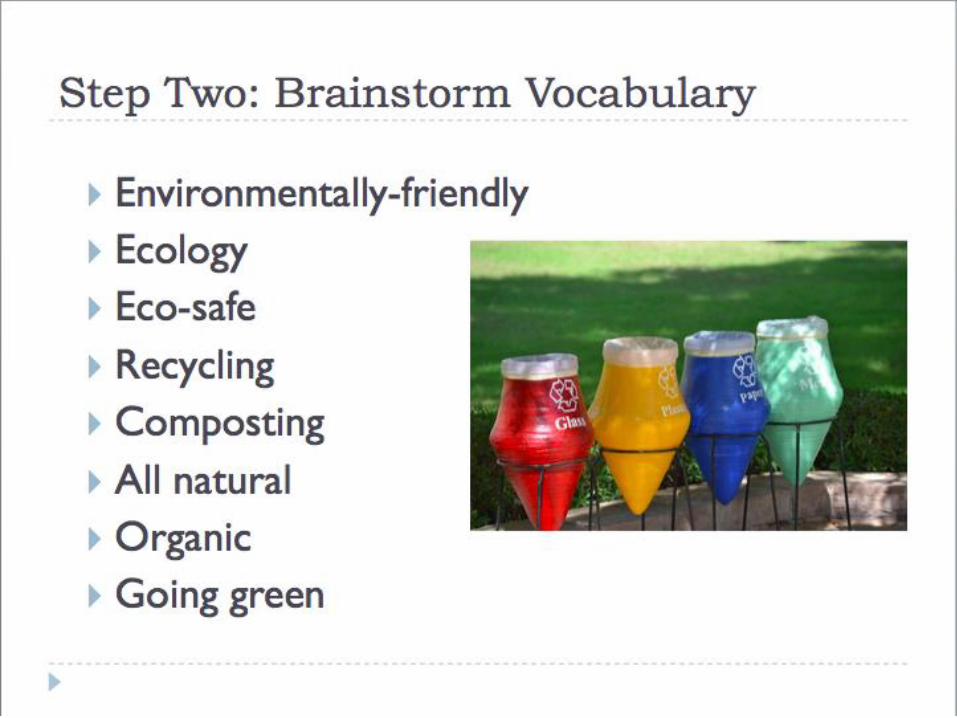
Step Two: Brainstorm Vocabulary
Environmentally-friendly
Ecology
Eco-safe
Recycling
Composting
All natural
Organic
Going green
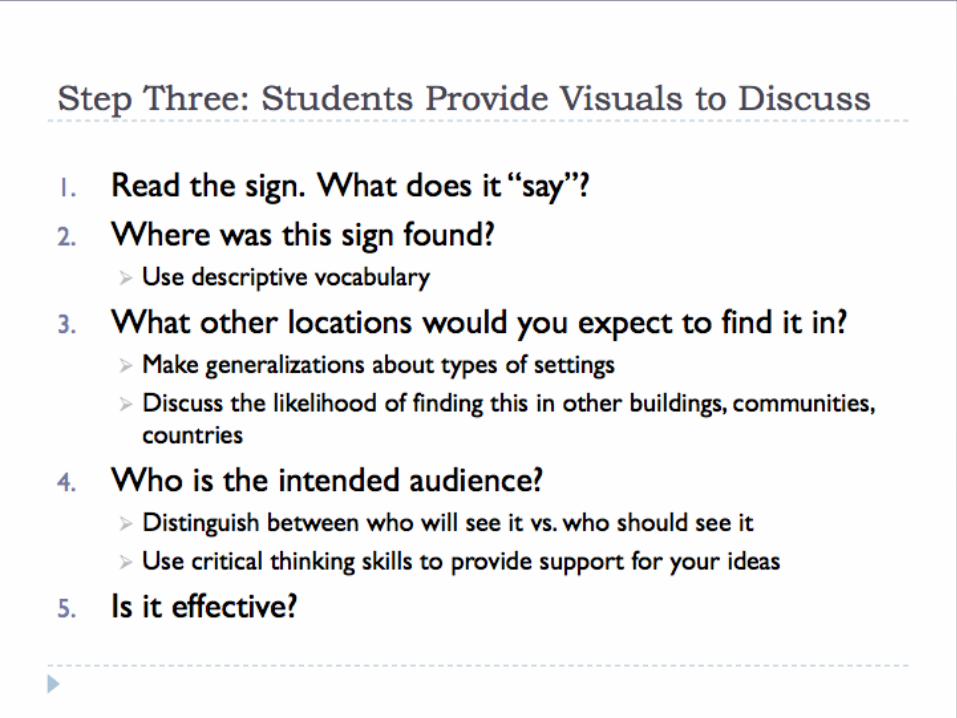
Step Three: Students Provide Visuals to Discuss
1. Read the sign. What does it “say”?
2. Where was this sign found?
Use descriptive vocabulary
3. What other locations would you expect to find it in?
Make generalizations about types of settings
Discuss the likelihood of finding this in other buildings, communities,
countries
4. Who is the intended audience?
Distinguish between who will see it vs. who should see it
Use critical thinking skills to provide support for your ideas
5. Is it effective?
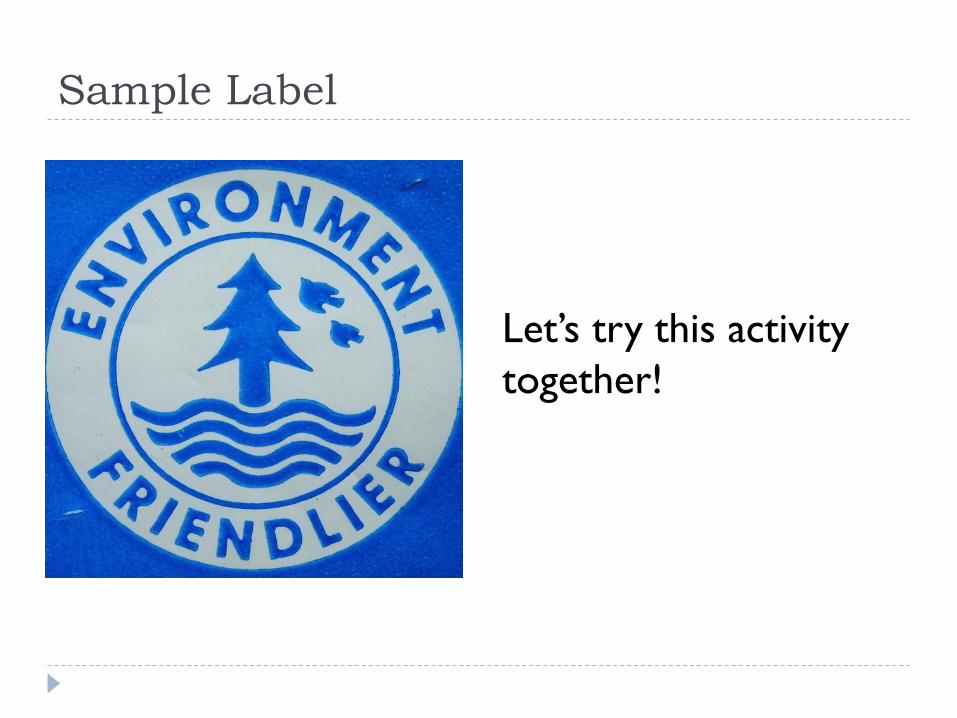
Sample Label
Let’s try this activity
together!
Resources for Signs/Labels
Search for sources online:
Photos in these slides were taken with my
own camera or taken from Open Educational
Resources online:
https://pixabay.com
http://eng.letscc.net
http://www.photosforclass.com/
Resources for Signs/Labels
Students can take photos of or make notes
about signs:
Public spaces
Retail spaces
Labels from household products
Remind students: Pay attention to postings that
discourage photography!
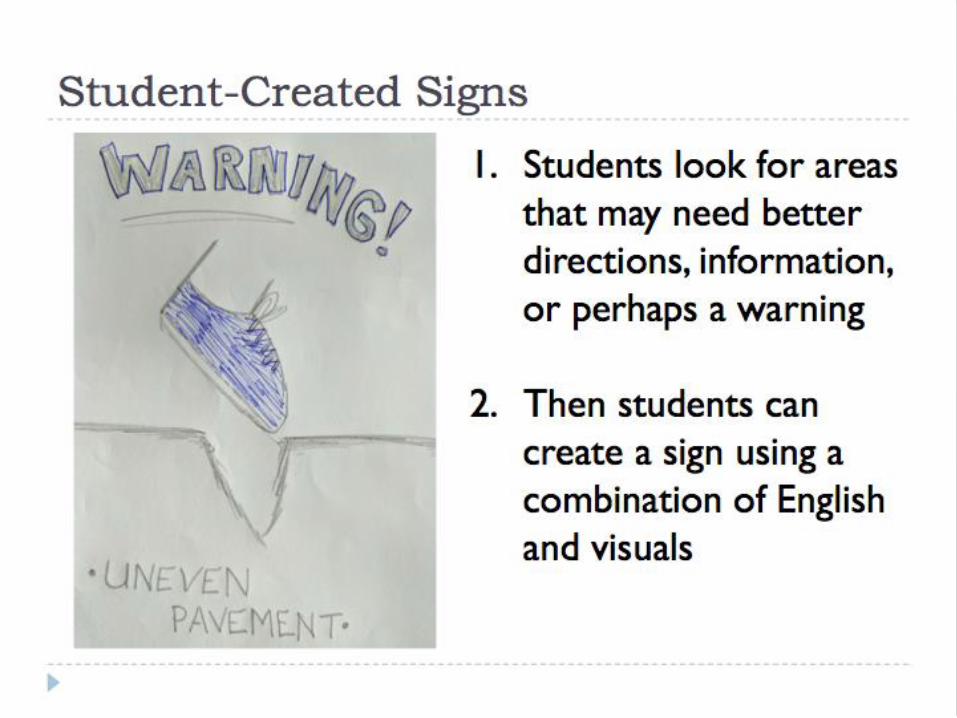
Student-Created Signs
1. Students look for areas
that may need better
directions, information,
or perhaps a warning
2. Then students can
create a sign using a
combination of English
and visuals
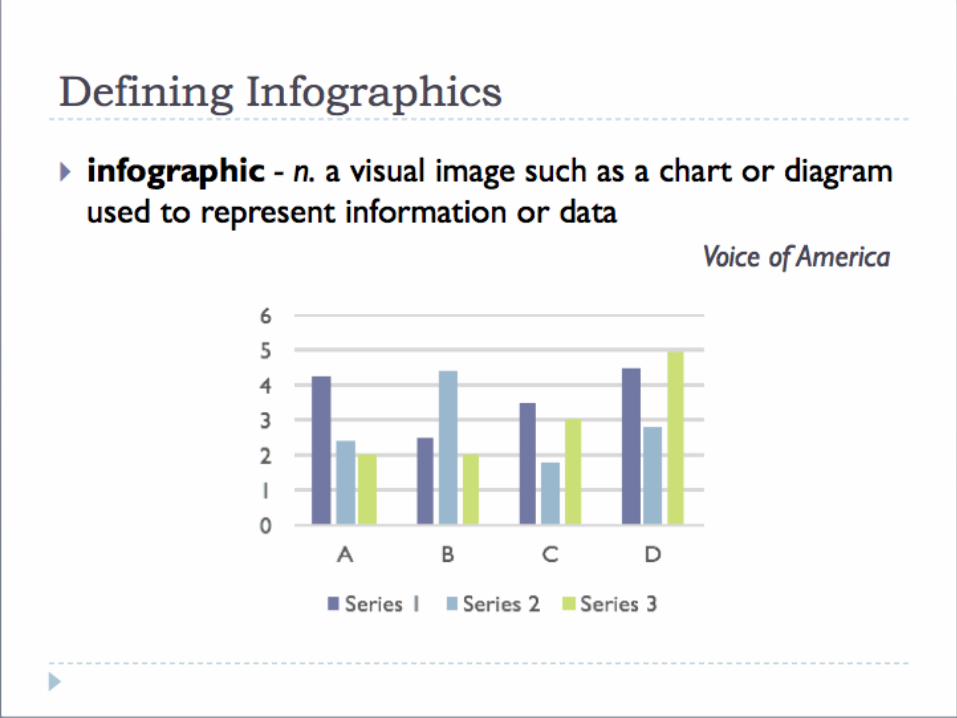
Defining Infographics
infographic - n. a visual image such as a chart or diagram
used to represent information or data
Voice of America
Thoughts on Infographics
“Our brain can digest the facts presented on
an infographic three times faster than reading
it in text since it’s an illustrated format.”
Infographics can range from very simple
charts to complex images with multiple
layers of data.
Bit Rebels
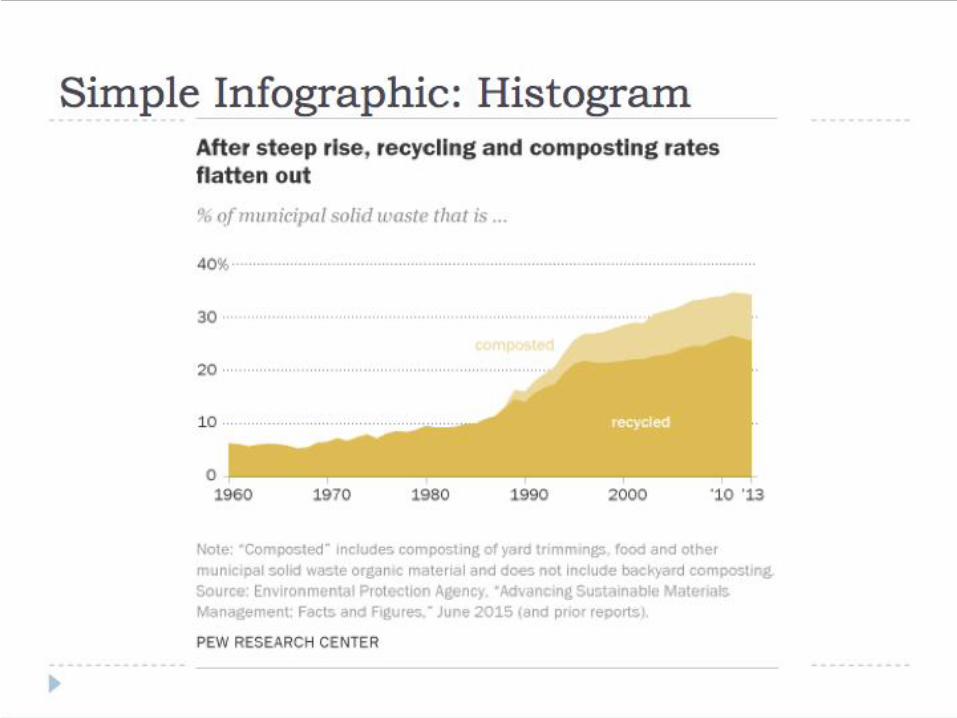
Simple Infographic: Histogram
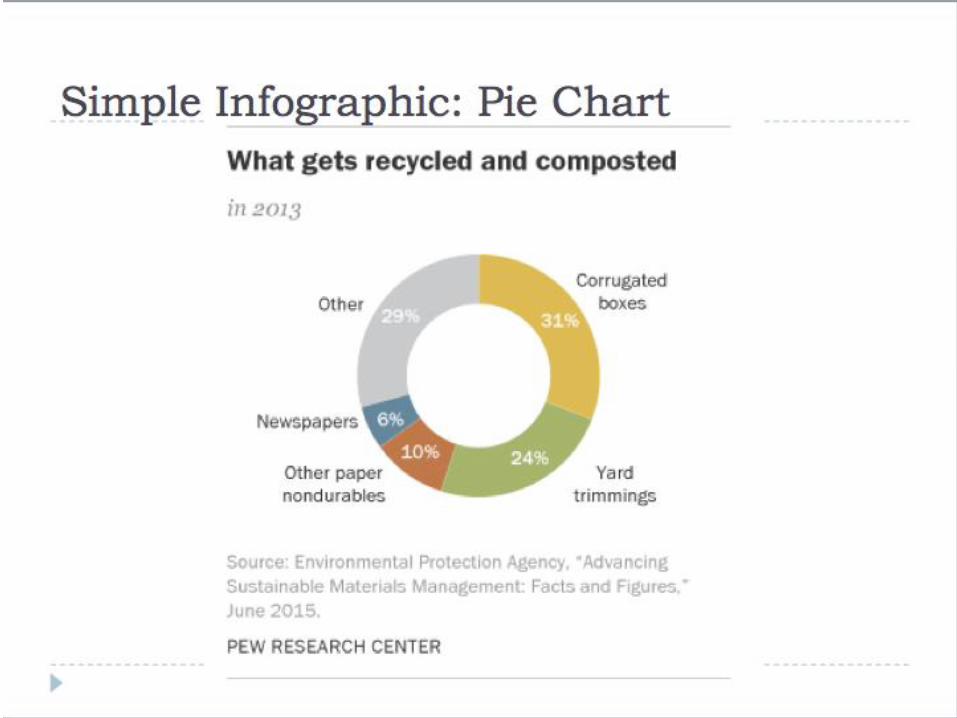
Simple Infographic: Pie Chart
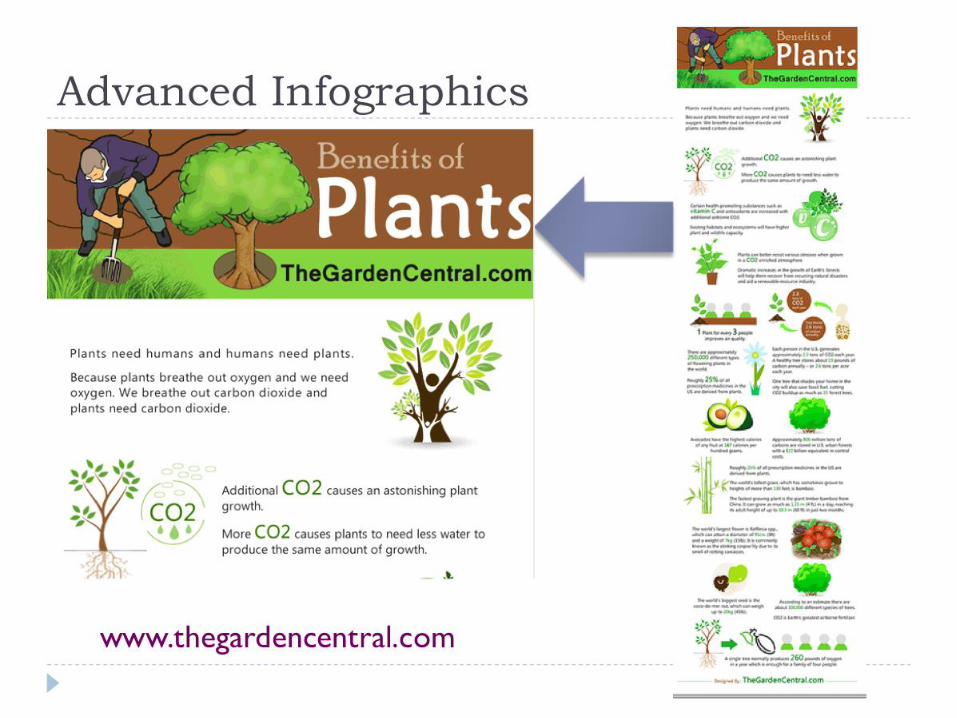
Advanced Infographics
www.thegardencentral.com
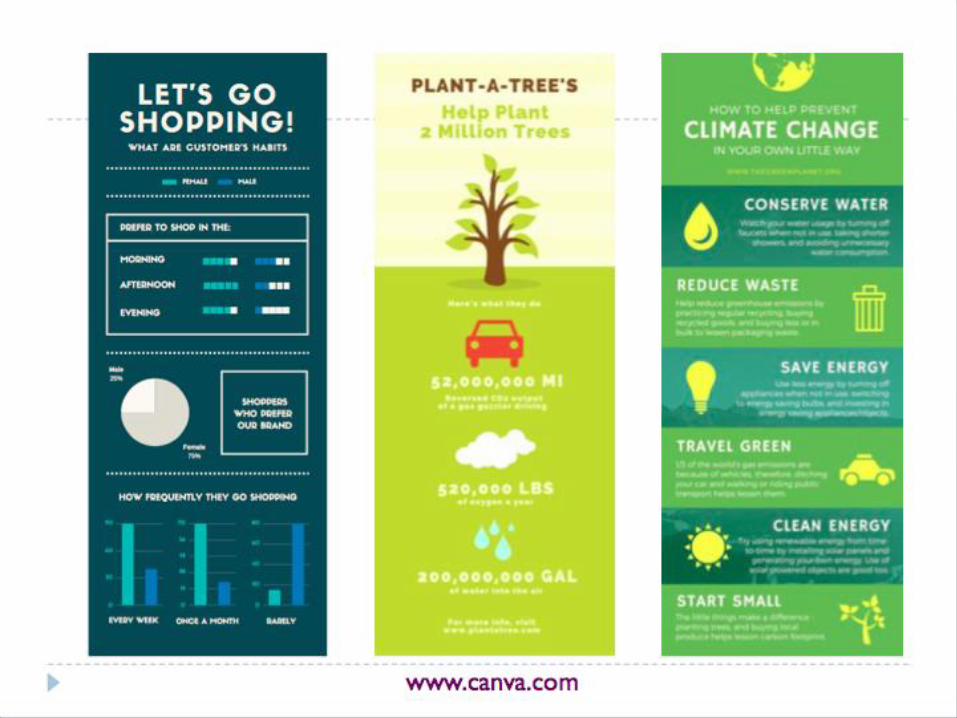
www.canva.com
Using Infographics
Think about your classroom, school, or library.
Perhaps you have already seen infographics
posted on the walls there.
Think about the advertisements, articles,
textbooks, and other outside visuals that you
see every day.
Where do you see infographics?
Where to Find Infographics
Graphs.net Infographics Album on Flickr
http://bit.ly/2l07hDq
Pew Research Center
http://pewresearch.org
Let’s cc – Search for Infographics + Topic
http://eng.letscc.net
Student-created infographics
How to Create Infographics
Combine pictures with charts created by students using paper, magazines, or markers
Use a free online resource, such as: Canva – www.canva.com
Piktochart – https://piktochart.com
Venngage – https://venngage.com
Other resources listed in pre-reading material from Voice of America
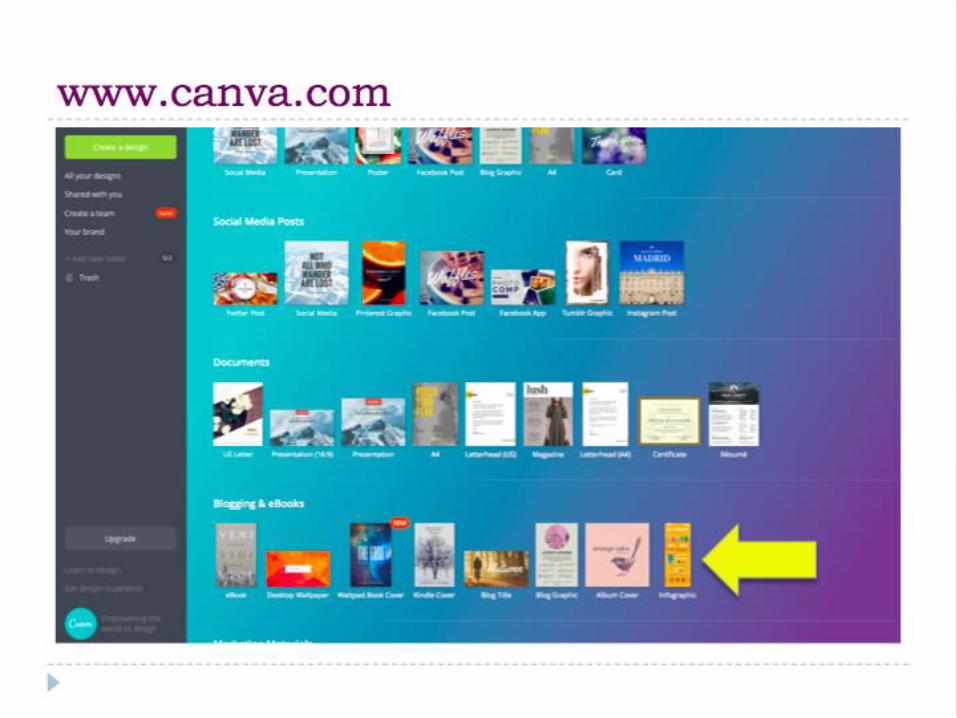
www.canva.com
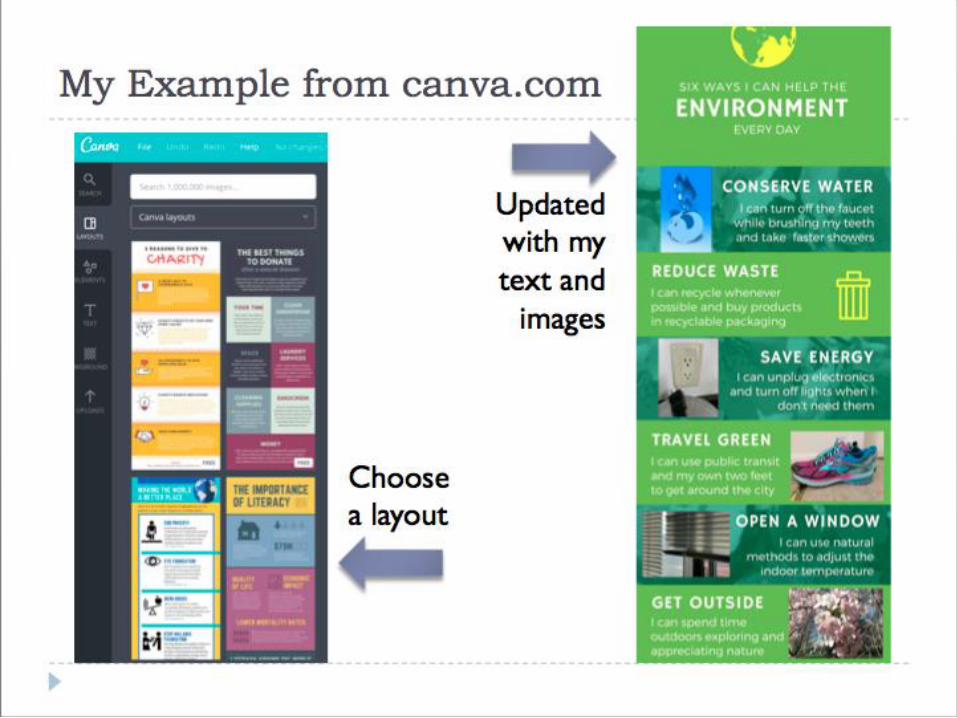
My Example from canva.com
Updated
with my
text and
images
Choose
a layout
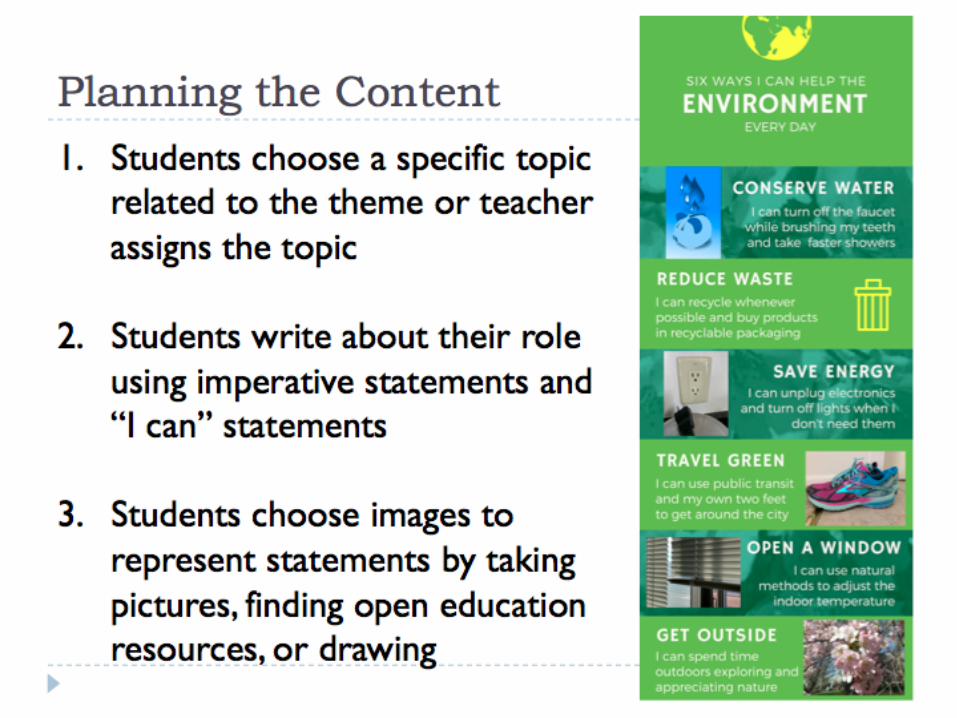
Planning the Content
1. Students choose a specific topic
related to the theme or teacher
assigns the topic
2. Students write about their role
using imperative statements and
“I can” statements
3. Students choose images to
represent statements by taking
pictures, finding open education
resources, or drawing
Start Gradually
Build a class collection of visuals related to
each new theme that your class discusses
Having too many visuals won’t be a problem
Incorporate Show-and-Tell activities with
simple visuals in the beginning and complex
visuals later on
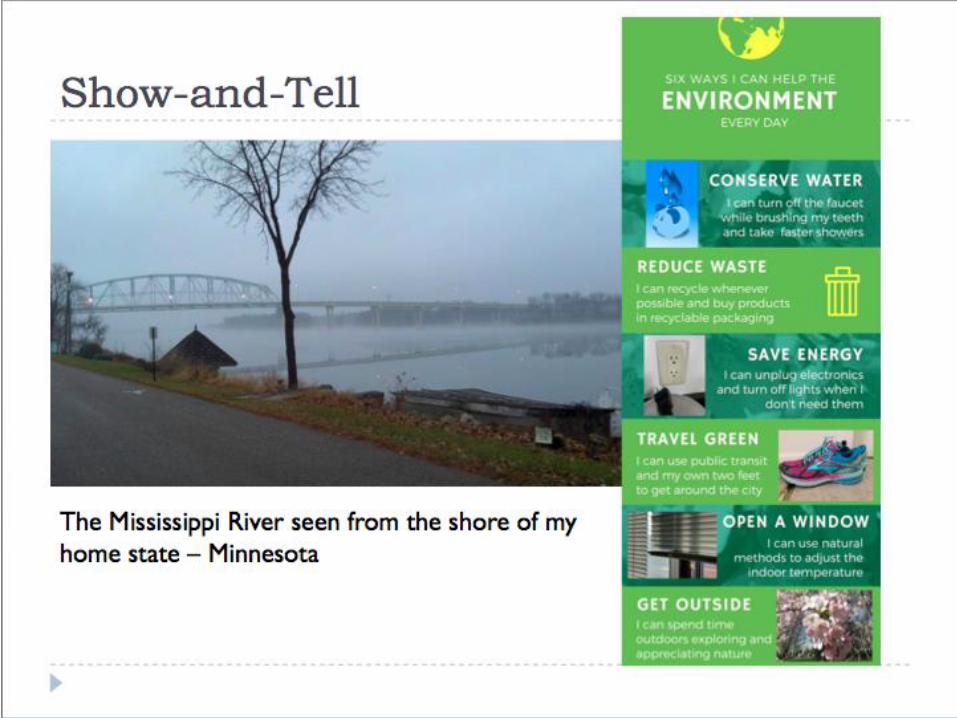
Show-and-Tell
The Mississippi River seen from the shore of my
home state – Minnesota
Do What Comes Naturally
Variety and relevance are important
Your students are already visually literate
in their native language, so allow them to
apply these skills in English as well
Reflections
What new vocabulary will I want to teach for discussing visuals?
Where can your students find visuals?
Where will you find visuals?
At what stage in a lesson should you introduce visuals?
References and Resources
“Funkadelic Facts about Infographics” by BitRebels, retrieved
from www.bitrebels.com, 2011.
"Learning to Look" by the National Education Association,
retrieved from www.nea.org, 2017.
“Recycling perceptions, realities vary widely in U.S.” by Drew
DeSilver for www.pewresearch.org, 2016.
“Subway” by Lily Furedi, retrieved from
www.smithsonianeducation.org, 2017.
"The Neglected Tools Can Work for You" by Mac M. Ramirez
for English Teaching Forum, 2012, 50(4).
"Tools to Create Infographics" by Carolyn Nicander Mohr
for http://learningenglish.voanews.com/, 2016.