Embed Size (px)
Citation preview

Dr. Mahmoud Al-Sibai
Head of IWRM Program, ACSAD
Regional Workshop on Linking Regional Climate
Model Projections to Hydrological Models 26-28 June 2013
Beirut, Lebanon
Using Water Evaluation and Planning System
(WEAP) for Assessing Climate Change Impacts
on Groundwater Resources

Introduction
The situation of Water Resources in
MENA region is characterized by
scarcity, drought frequency and at the
same time by increasing demands
caused by rapid population growth
and inefficient use of water especially
by the agricultural sector.
The groundwater extractions often
exceed the natural recharge volumes,
resulting in a decline of the
groundwater table and in a
deterioration of the soil and water
qualities (e.g. salinization).

Water authorities often derive their water
supplies from several sources, which
may include surface reservoirs, rivers,
groundwater wells or combinations of these sources.
To identify the best combination of supply sources in the long term, or to determine the most effective way of managing existing systems, decision-makers need a lot of information to account for all of the hydrologic, hydraulic, water quality, and economic relationships within the system.
A Decision Support System (DSS) is needed to be used to develop water resources management plans, adaptable operating rules for water systems and regional policies.

“Management, Protection and Sustainable
Use of Groundwater and Soil Resources in the Arab
Region”
between
The Arab Centre for the Studies of Arid Zones and Dry Lands
(ACSAD), Damascus, SYRIA
www.acsad.org, www.acsad-bgr.org
and
The Federal Institute for Geosciences and Natural Resources (BGR),
Hannover, GERMANY
www.bgr.de, www.acsad-bgr.org
Funded by the German Federal Ministry for Economic Cooperation
and Development, www.bmz.de
Technical Cooperation Project:

A Decision Support System
for Water Management (DSS)
- Aim of the Project? to develop and apply a :
user-friendly
efficient
inexpensive
easily sharable
water planning and management tool
and make it available in order to work together towards a more integrated water resources management in the Middle East and beyond
DSS Platform: WEAP as a DSS Platform
• Provides a common framework and a
transparent set of data that can be explored by all stakeholders and decision-makers
Scenarios can be easily developed to explore options for the future
Implications of various policies can be evaluated


Decision Support – Water Management - Water Balance/ Abstraction Limits/ Safe Yield
- Current hydrological year planning
- Long term planning and scenario comparison
Model accuracy (modeled/measured) - River gauges
- Observation wells
- Results by other modelling approaches
- General Monitoring data visualization
MODFLOW
& Others
Results
Project Database
Databases
Data Acquisition
Printed
Archives
Field Survey/
Sampling
WEAP
Scenario
UPDATE
DSS-DESIGN:

9
WEAP Schematic
Weap features
Drag and drop
into the schematic
GIS features
Load vector (shp) or
Raster layers as background
into the schematic


RESERVOIR

RESERVOIR

Priority Allocation of Water
Resources
• Demand Priorities
• Supply Preferences
Allocation Order
Using the demand priorities and supply preferences, WEAP determines the
allocation order to follow when allocating the water. The allocation order
represents the actual calculation order used by WEAP for allocating water.

Data View Data is
displayed
numerically and
graphically

Results View Results can be
displayed in
wide range of
formats and
scales
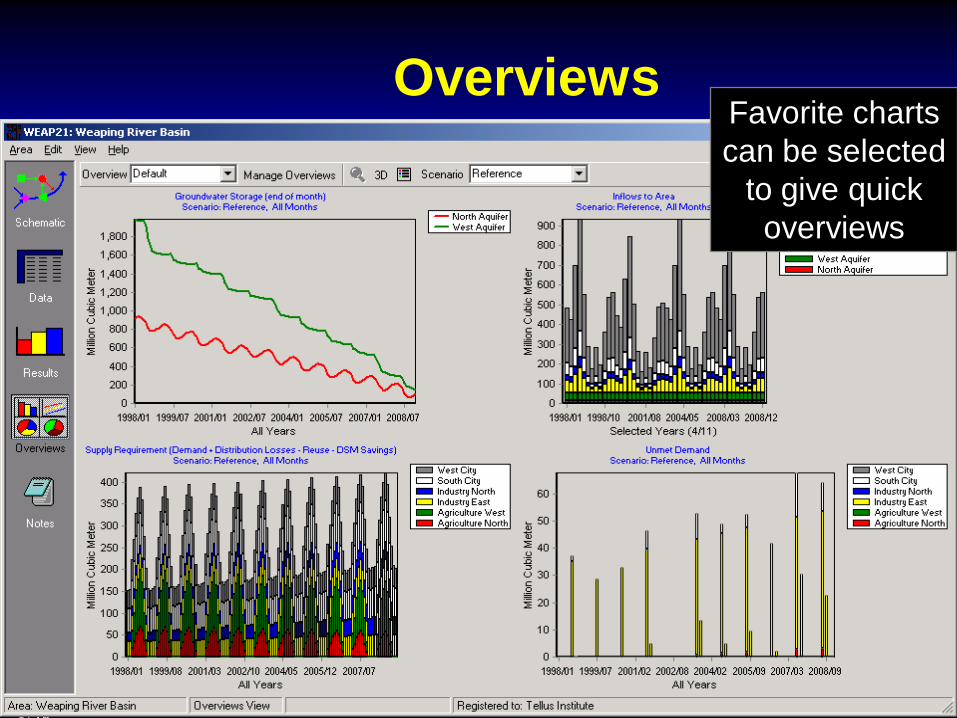
Overviews Favorite charts
can be selected
to give quick
overviews

WEAP development through this
cooperation project
1- MODFLOW
– Ground Water modeling
MODFLOW is a three-
dimensional finite-difference
groundwater modeling platform
created by USGS.

Water Evaluation and Planning System(www.weap21.org – Stockholm Environmental Institute)
Water management and planning model
and remote control of MODFLOW to
calculate:
-groundwater recharge
-irrigation demand
-detailed water balances for defined spatial
planning units
Resolution:
-catchment/ landuse class/ MF raster
Input:
-climate data
-abstraction data (domestic)
-soil and crop data
-planning scenario setup
Licence:
-free to all Arab government and
research institutions
LINKED DSS - MODELING COMPONENTS (calibrated alone beforehand)
MODFLOW GW-FLOW-MODEL
Modflow 2000
WEAP – MODEL (WEAP21)
Mathematical flow model to calculate:
Groundwater:
-level
-storage
-river interaction
-discharge at springs
Resolution:
-as raster (here 200x200m)
Input:
-3D geometry of the aquifer
-permeabilities
-boundary conditions
Licence:
-free

Weap – Modflow interaction
(for each WEAP timestep)
WEAP:
Calculates GW recharge,
abstraction rates, river stage
for one timestep (based on
parameters defined for the
respective WEAP-scenario)
WEAP:
Transcribes the result
into a Modflow-
conformal
ascii-file (*.rch, *.wel,
*.riv)
WEAP:
Runs mf2k.exe
Modflow:
Calculates cell-head,
storage volumes, flows
…
WEAP:
Reads the Modflow result-
files and updates the
WEAP-internal parameters
Next time step

Link MODFLOW Cells to WEAP Elements
MODFLOW
modeling information is
related to grid-cells with a
specific row-column-layer
address
grid has a defined
geographic position
WEAP
modeling information is
related to abstract elements
like “subcatchment” or
“groundwater node”
Only numerical data is used
for calculation but no
geographic information
Problem:
As both models have to communicate with each other,
each of the WEAP-items has to know, for which MODFLOW-cells
it’s information is valid and vice versa.
Solution: A linkage acts as a “dictionary” between WEAP and MODFLOW
Linkage = the attribute table of a GIS-shapefile

WEAP development through this
cooperation project
2- MABIA:
• Enhanced soil water balance model MABIA Method is a daily simulation of
transpiration, evaporation, irrigation requirements and scheduling, crop growth and yields, and includes modules for estimating reference evapotranspiration and soil water capacity.
The MABIA Method uses the ‘dual’ Kc method, as described in FAO Irrigation and Drainage Paper No. 56

3- MODPATH:
• MODPATH is a groundwater particle tracking post-processing package that was developed to compute three-dimensional flow paths using output from steady-state or transient groundwater flow simulations by MODFLOW. Its purpose is to evaluate advective transport through a model - MODPATH tracks the trajectory of a set of particles from user-
defined starting locations using the MODFLOW solution as the
flow field. The particles can be tracked either forward or
backward in time. Particle tracking solutions have a variety of
applications, including the determination of zones of influence
for injection and extraction wells.
WEAP development through this
cooperation project

26
WATER EVALUATION & PLANNING SYSTEM - www.weap21.org
MODFLOW MODEL
2) FAO, IRRIGATION DEMAND ONLY
3) FAO RAINFALL-RUNOFF MODEL
(ETref, Kc)
4) SOIL MOISTURE MODEL
(soil, plant & climate parameters)
GW-RECHARGE/IRRIGATION
DEMAND AND SURFACE RUNOFF
CALCULATIONS IN WEAP:
1) ENTER AS HARD DATA
wellfields
artificial recharge
QUAL2K MODEL
5) MABIA MODEL
(soil, plant & climate parameters)

Scenario analysis
At the heart of WEAP is the concept of scenario analysis. Scenarios
are self-consistent story-lines of
how a future system might
evolve over time in a particular socio-economic setting and under a particular set of policy and technology conditions.
Using WEAP, scenarios can be built and then compared to assess their water requirements, costs and environmental impacts.

• Scenarios in WEAP encompass any
factor that can change over time,
including those factors that may change
because of particular policy
interventions, and those that reflect
different socio-economic assumptions.
• Sensitivity analyses may also be done
by varying uncertain factors through
their range of plausible values and
comparing the results
policy interventions, different socio-economic assumptions……
29
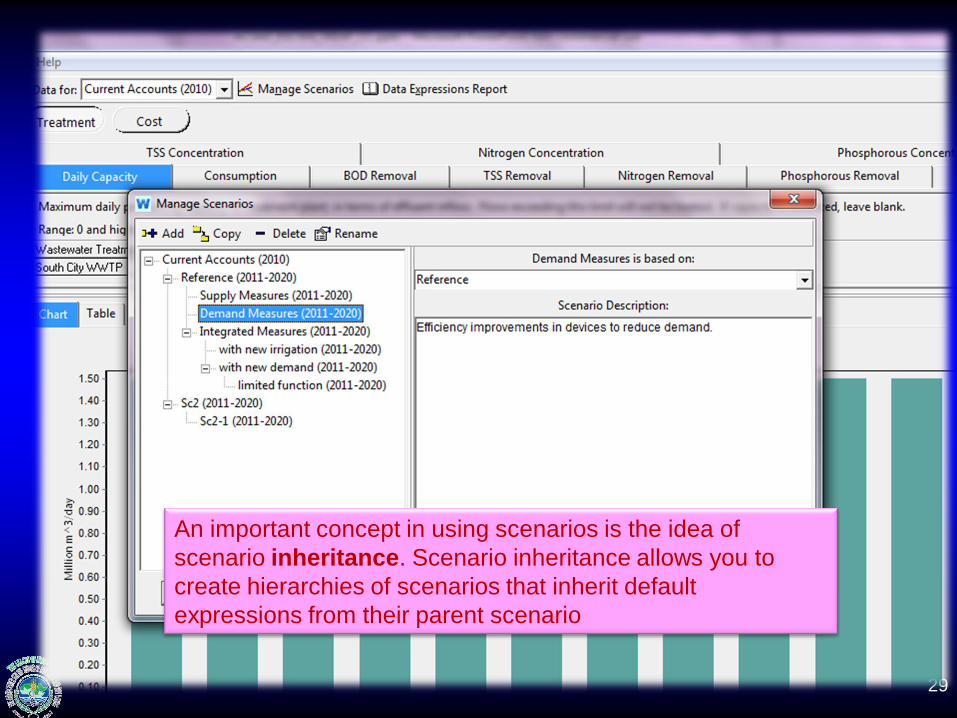
An important concept in using scenarios is the idea of
scenario inheritance. Scenario inheritance allows you to
create hierarchies of scenarios that inherit default
expressions from their parent scenario

• The scenarios can address a broad range of "what if"
questions, such as:
– What if population growth and economic development
patterns change?
– What if reservoir operating rules are altered?
– What if groundwater is more fully exploited?
– What if water conservation is introduced?
– What if ecosystem requirements are tightened?
– What if new sources of water pollution are added?
– What if a water recycling program is implemented?
– What if a more efficient irrigation technique is implemented?
– What if the mix of agricultural crops changes?
– What if climate change alters the hydrology?
Scenarios – What if....

PILOT STUDY I:
Zabadani Basin
SYRIA
DSS - APPLICATIONS
PILOT STUDY II:
Berrechid Basin
MOROCCO
Hydraulic Basin Agency (ABH) of
Bouregreg and Chaouia
Basins, Benslimane

PILOT AREA I:
ZABADANI BASIN, SYRIA
• Area 165 km².
• Existing Water Conflict between
multi-groundwater users
(Drinking Water – Damascus/
local, Agriculture, Tourism)
• The Climate of the Antilebanon
Mountain Range, is a
Mediterranean climate with
precipitation occurring between
October and May. For the
reference year 2004/2005 the
range of precipitation was
between 400 and 1000 mm with
an average of 714 mm/y.

Arab-German Cooperation Project (www.acsad-bgr.org):
Management, Protection and Sustainable Use of Water and Soil
33

Arab-German Cooperation Project (www.acsad-bgr.org):
Management, Protection and Sustainable Use of Water and Soil
34

Arab-German Cooperation Project (www.acsad-bgr.org):
Management, Protection and Sustainable Use of Water and Soil
Complexe
Tectonics,
Geology &
Hydrogeology

Stakeholder Participation
The initial task has been to divide the basin into spatial subunits. Together with the members of the DSS steering committee the Zabadani basin was subdivided into 11 subcatchments,
being crucial to the water management planning.
Their out- lines have been determined by
aggregating the major drinking water well fields and
if possible follow surface watersheds
37
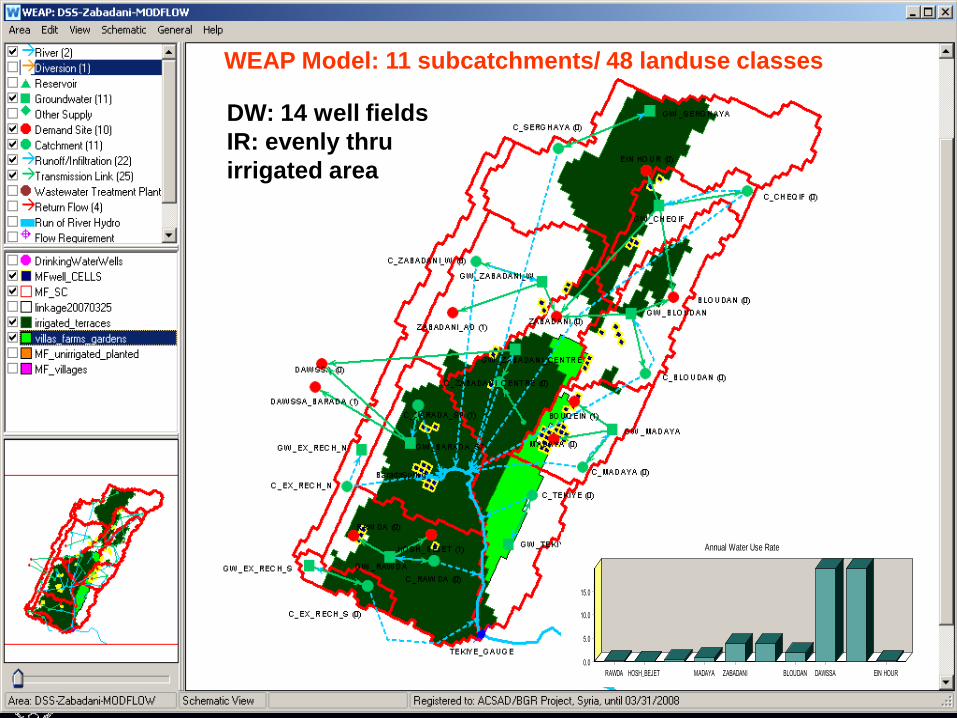
WEAP Model: 11 subcatchments/ 48 landuse classes
DW: 14 well fields
IR: evenly thru
irrigated area
Annual Water Use Rate
RAWDA HOSH_BEJET MADAYA ZABADANI BLOUDAN DAWSSA EIN HOUR
Million m
^3
15.0
10.0
5.0
0.0

Modflow model
The studied area was divided
to 124 (rows)*27 (columns) *
3 (layers) = 27528 cells
The dimension of the cells is
200m by 200m

39
groundwater head 3D-view

40
0. BaradaSpring
0. Headflow
Streamflow (below node or reach listed)
Scenario: no change, All months, River: BaradaSpring
Oct
2004
Nov
2004
Dec
2004
Jan
2005
Feb
2005
Mar
2005
Apr
2005
May
2005
Jun
2005
Jul
2005
Aug
2005
Sep
2005
Millio
n C
ubic
Mete
r
11.5
11.0
10.5
10.0
9.5
9.0
8.5
8.0
7.5
7.0
6.5
6.0
5.5
5.0
4.5
4.0
3.5
3.0
2.5
2.0
1.5
1.0
0.5
0.0
GW-MODEL
RESULTS
(MODFLOW 2000)
Groundwater level Barada Spring discharge

Scenarios
Two sets of scenarios have been calculated
by the DSS,
– a historic scenario (1998-2007) in order to
check the calibration accuracy of the models
and
– a planning scenario set (2005-2017) of three
different climate/demand change scenarios.
42

RESULTS OF THE DSS-SYSTEM
C_BARADA_SP
Catchment Precipitation
Scenario: no change, All months
Oct
1997
May
1998
Dec
1998
Jul
1999
Feb
2000
Sep
2000
Apr
2001
Nov
2001
Jun
2002
Jan
2003
Aug
2003
Mar
2004
Oct
2004
May
2005
Dec
2005
Jul
2006
Feb
2007
Sep
2007
Milli
met
er
400
300
200
100
0
A) Historic scenario 1998 - 2007
to evaluate the DSS accuracy (wet/dry years)
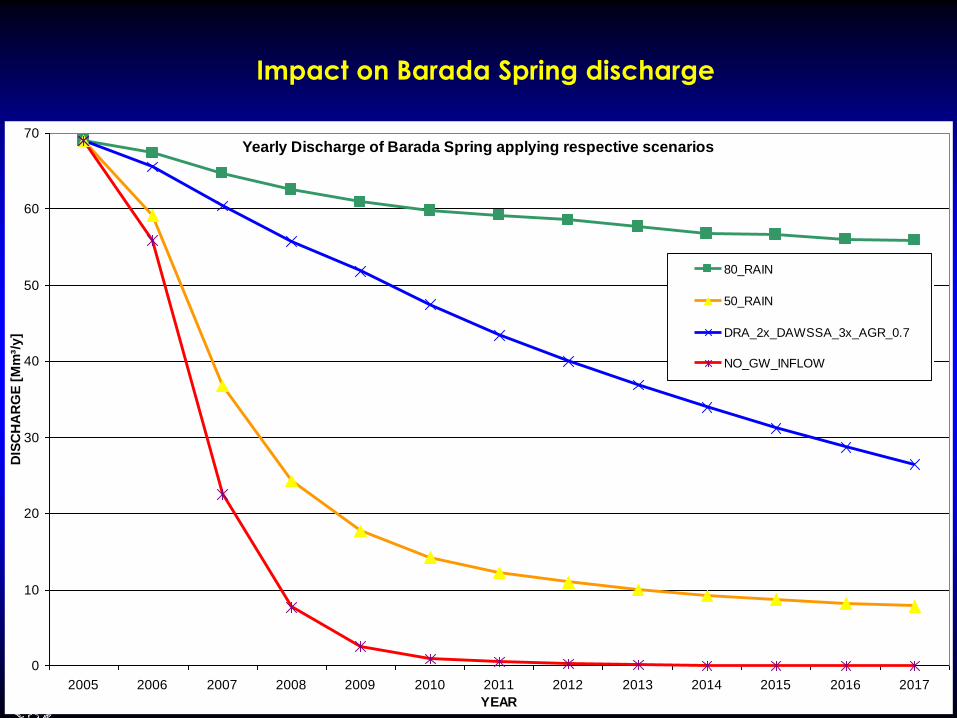
B) Planning scenarios 2005 – 2017
impacts of demand changes, climate change, boundary condition
changes,…
1) 50_rain: 50% of the annual rain
2) 80_rain: 20% decrease of annual rainfall
3) DRA_2x_DAWSSA_3x_AGR_0.7:
increase in drinking water abstraction/
reduction in irrigation
4) no GW – inflow: no groundwater inflow
from outside the basin.

44
Results A): groundwater head 2D-view, time series
dry years
wet year

• Climate change scenario (80_rain): Long-term climate change impacts have been assessed by Kunstmann et al. (2007) by downscaling the global B2 climate scenario model of ECHAM4 to a resolution of 18km x 18km in the eastern Mediterranean/Near East region. Preliminary calculation results have been derived for two thirty year (1961-1990 and 2070- 2099) time periods.
• The graph indicates a decrease in precipitation and by averaging the yearly precipitations in the two time periods, a decrease in precipitation of twenty percent can be calculated.
• This decrease of twenty percent was applied to the planning scenario 2005-2017 in order to see on an even shorter time scale and more drastically the impact of possible decreases in precipitation. Further refinements of these climate models may give a better prediction basis.


• Drought cycle scenario (50_rain): The historic precipitation measurements show that there is roughly every five to thirteen years a „drought“ year with less than half of the mean annual rainfall.
• From 1999 to 2001 there had been three „drought“ years in a row, causing severe impacts on the domestic and irrigation water supply. Therefore an additional planning scenario was created by reducing the average precipitation of the year 2004/ 2005 to 50% and calculating the impacts of consecutive drought years.


49
Results B: groundwater level

50
Results B): groundwater storage
51
Yearly Discharge of Barada Spring applying respective scenarios
0
10
20
30
40
50
60
70
2005 2006 2007 2008 2009 2010 2011 2012 2013 2014 2015 2016 2017
YEAR
DIS
CH
AR
GE
[M
m³/
y]
80_RAIN
50_RAIN
DRA_2x_DAWSSA_3x_AGR_0.7
NO_GW_INFLOW
Impact on Barada Spring discharge
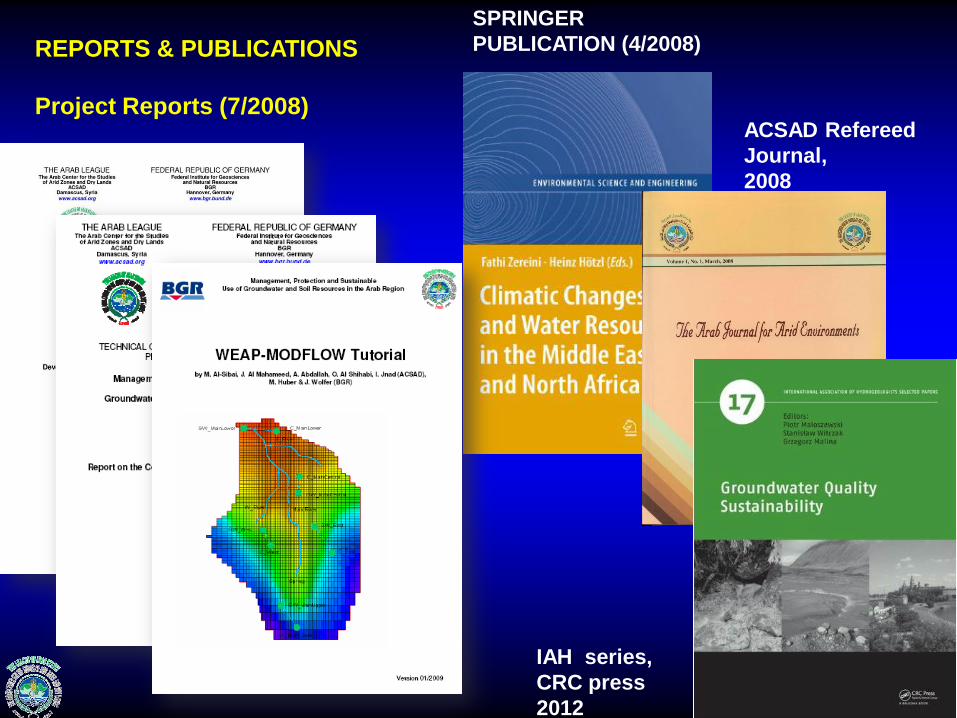
REPORTS & PUBLICATIONS
Project Reports (7/2008)
IAH series,
CRC press
2012
SPRINGER
PUBLICATION (4/2008)
ACSAD Refereed
Journal,
2008

All documents, tutorials and tools
are available for downloading…
• http://www.bgr.bund.de/EN/Themen/Wasser/Projekte/lau
fend/TZ/Acsad/dss_fb_en.html?nn=1546392

54
,
THANK YOU!