Embed Size (px)
Citation preview
AMRICAN JOURNAL OF UNDERGRADUATE RESEARCH VOL. 10, NO. 2
21
Using Web 2.0 Data to Estimate Alcohol-Related Travel
William Conroy and Duncan Smith Department of Geography University of Washington
Box 353550, Smith Hall 408 Seattle, Washington 98195 USA
Received: May 2, 2011 Accepted: August 9, 2011
ABSTRACT
Using ArcGIS, the locations of pubs, clubs, and bars were geocoded onto the street network of Seattle. Upon calculating the density of these drinking establishments throughout the city, the six densest areas, representing nightlife districts, were converted to polygons. Using publicly available check-in data from Gowalla, user check in data within these six polygons was obtained. After cross referencing the Gowalla users’ legal names with the Washington State Voter Registration Database, straight line distances between their legal addresses and bars patronized were calculated. As a result, distance traveled profiles were calculated for each nightlife district.
I. INTRODUCTION
Alcohol-impaired vehicle operation
inflicts a significant social and economic cost on society. In the year 2005 alone, more than seventeen thousand people in America died in alcohol-related motor vehicle crashes. It is estimated that alcohol related crashes in the U.S. cost about $51 billion each year. [3] In an effort to help reduce the potential negative impacts of going out at night, the aim of this project is to determine which bars and nightlife districts are more likely to produce trips that would involve the operation of a car while intoxicated.
In order to estimate alcohol related travel, check-in data from 406 Gowalla users was cross referenced by name with addresses listed in Washington state voter records. From this data, it can be determined how far residents of the Puget Sound region travel to participate in Seattle nightlife activities. Through the identification of nightlife hotspots, it will be possible to create a statistical profile of distance travelled for entire nightlife districts. Should the distances from their home address to these alcohol establishment be large enough to be unwalkable, it can be assumed
that an impaired vehicular trip home, either by driving, taking a cab, or riding home with a different driver, will take place. By comparing the statistical profiles of distance traveled, the hotspots that have the highest average distance travelled can be targeted by city and state law enforcement for focused DUI prevention and enforcement efforts. Additionally, should a spatial pattern of patronage exist, bars could use this information to focus marketing efforts in these locales.
The scope of this project focuses on places which fit our definition of “heavy drinking locations” within the city of Seattle. As many people who frequent these bars are from the suburbs, the scope of our Gowalla users spans the entire Seattle Metropolitan Statistical Area. All distances will be measured as straight “as the crow flies” lines.
II. BACKGROUND AND RELATED
RESEARCH
While much research exists on the detrimental health effects of alcohol, studies focusing on the drinking behaviors at bars and the effects of public transportation on
AMRICAN JOURNAL OF UNDERGRADUATE RESEARCH VOL. 10, NO. 2
22
drunk driving are less prevalent. In his article “Developing a theory of nightclub location choice,” Steven Crim’s work provided insights on how bar and nightclub locations are chosen and the effects this has on patronage. Specifically, his research on the clustering of nightlife locations lead us to analyze the travel behaviors to nightlife districts as opposed to specific bars and clubs. Bars and clubs co-locate to benefit from the increased foot traffic that each additional club or bar brings, and by co-locating, they are able to attract more people together than they would if each bar was located by itself. As a result, someone who goes out is more likely to be going out to a certain nightlife district as opposed to a specific bar. Furthermore, nightlife districts are typically geared towards attracting a person of a certain socioeconomic or demographic background. As a result, while Gowalla check-ins are only limited to specific locations, it is likely that a person visiting a bar in a certain district will be likely to visit other bars in the same district even if they do not provide check-in data that states this.
Another article that was of use to this project was the Gruenewald et al. article “Beverage Sales and Drinking and Driving: The Role of On-Premise Drinking Places.” This article studied arrest reports of DUIs in Perth, Australia to determine where the person was drinking that night in order to characterize the bars that were producing the most drunk drivers. Unsurprisingly, the researchers discovered that establishments selling higher volumes of beer and spirits produced larger amounts of DUI offenders. This paper provided a framework for determining which places should be included in our analysis and which should be omitted. By choosing only the locations which were focusing on alcohol sales, we were able to accurate hotspots of areas that would produce possible DUIs. III. RESEARCH DESIGN AND
METHODS
As alcohol is served in many locations throughout the city in many different social contexts, the first task of this project was to identify which locations were more likely to produce intoxicated patrons. Serving alcohol in Washington state requires
a permit from the Washington State Liquor Control Board, and each permit has a permission rating which allows for certain types of alcohol to be served in certain ways. Data on every active liquor license in the state is made available monthly on the WSLCB website. As a result, at the time of analysis the data was less than two months old.
The types of liquor license in state of Washington are defined as:
Beer/wine rest-beer: Restaurant that sells only beer for on premise consumption
Beer/wine rest - beer w/taproom: Restaurant that sells only beer for on premise consumption and has a restricted “lounge” area.
Beer/wine rest-beer/wine: Restaurant that sells beer and wine for on premise consumption
Beer/wine rest-wine: Restaurant that sells only wine for on premise consumption
Beer/wine rest - wine w/taproom: Restaurant that sells only wine for on premise consumption and has a restricted “lounge” area.
Beer/wine rest-beer/wine ferry boat: Beer and wine on premise consumption on a ferry.
Hotel: For a restaurant in a hotel that has beer and wine for on premise consumption with a restricted bar area.
Private club - beer/wine: A private club must be operational for 1 year prior to applying for license (must be non-profit organization). To sell beer and/or wine for on-premises consumption. Beer and wine may be sold either on tap or in opened bottles or cans. Private Club licensees may not sell beer or wine for off-premises consumption.
Private club-spirits/beer/wine: A private club must be operational for 1 year prior to applying for license (must be non-profit organization). To sell spirits, beer and/or wine by the individual serving for on-premises consumption. Beer and wine may be sold either on tap or in opened bottles or cans. Private Club
AMRICAN JOURNAL OF UNDERGRADUATE RESEARCH VOL. 10, NO. 2
23
licensees may not sell beer or wine for off-premises consumption.
Snack bar: To sell beer for on-premises consumption by open bottle or can only. Snack Bar licensees cannot sell tap beer or beer to go.
Spirits/br/wn rest convention ctr: Must have more than one room for conventions. The restaurant and convention center must be a spirits/beer/wine plus.
Spirits/br/wn rest lounge + : To sell spirits, beer, and wine by the individual serving for on-premises consumption. Beer and wine may be sold either on tap or in opened bottles or cans. Issued only to restaurants that meet specific food service, kitchen equipment, and floor space requirements. With more than 50% dedicated dining.
Spirits/br/wn rest lounge - : To sell spirits, beer, and wine by the individual serving for on-premises consumption. Beer and wine may be sold either on tap or in opened bottles or cans. Issued only to restaurants that meet specific food service, kitchen equipment, and floor space requirements. With less than 50% dedicated dining.
Spirits/br/wn rest nonpublic + : To sell spirits, beer, and wine by the individual serving for on-premises consumption. Beer and wine may be sold either on tap or in opened bottles or cans. Issued only to restaurants that meet specific food service, kitchen equipment, and floor space requirements. With more than 50% dedicated dining 'May be non-profit organization (usually profit organization) – may be referred to as a “club” because of restriction. Must be operational for 1 year prior to applying for license.
Spirits/br/wn rest nonpublic - : To sell spirits, beer, and wine by the individual serving for on-premises consumption. Beer and wine may be sold either on tap or in opened bottles or cans. Issued only to restaurants that meet specific food service, kitchen equipment, and floor space requirements. With less than 50% dedicated dining May be non-
profit organization (usually profit organization) – may be referred to as a “club” because of restriction. Must be operational for 1 year prior to applying for license.
Spirits/br/wn rest service bar: To sell spirits, beer, and wine by the individual serving for on-premises consumption. Beer and wine may be sold either on tap or in opened bottles or cans. Issued only to restaurants that meet specific food service, kitchen equipment, and floor space requirements. There is no lounge area, only a service area to pick up the drinks.
Spirits/br/wn rest ship/lounge + : To sell spirits, beer, and wine by the individual serving consumption aboard a ship or vessel. Beer and wine may be sold either on tap or in opened bottles or cans. More than 50% dedicated dining.
Spirits/br/wn rest ship/lounge - : To sell spirits, beer, and wine by the individual serving consumption aboard a ship or vessel. Beer and wine may be sold either on tap or in opened bottles or cans. With less than 50% dedicated dining.
Sports entertainment facility: To sell spirits, beer, and wine by the individual glass for on-premises consumption at locations approved by the Liquor Control Board. Issued only to establishments that offer sporting events/entertainment for an admission charge.
Tavern-beer: To sell beer for on-premises consumption, either on tap or in opened bottles or cans. Persons under 21 years of age are not allowed on the premises.
Tavern-beer/wine: To sell beer and/or wine for on-premises consumption, either on tap or in opened bottles or cans. Persons under 21 years of age are not allowed on the premises.
Tavern-wine: To sell wine for on-premises consumption, either on tap or in opened bottles or cans. Persons under 21 years of age are not allowed on the premises. [4]
AMRICAN JOURNAL OF UNDERGRADUATE RESEARCH VOL. 10, NO. 2
24
As this project focuses on the travel associated with heavy drinking, for our analysis we selected the following liquor licenses for our analysis, and will refer to them as “Heavy Drinking Locations” for the rest of the project: Spirits/br/wn rest lounge, + & – ; Sports entertainment facility; Tavern-beer, Tavern-beer/wine, and Tavern-wine.
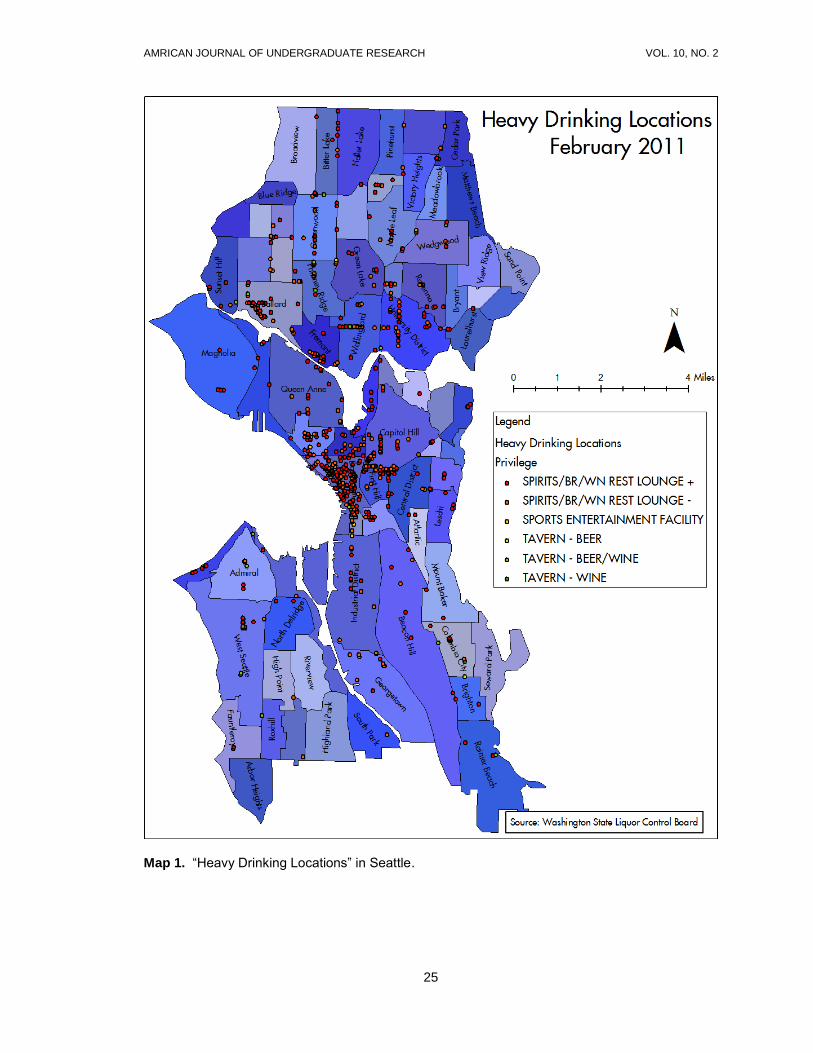
By selecting these categories of licenses, the analysis will exclude locations that are restaurants which primarily sell food and focus on locations where it is most customary to consume alcohol to the point of intoxication. Of the 1,621 total liquor licenses in Seattle during February 2011, 810 of them fall into our definition of “Heavy Drinking Locations,” and are displayed in Map 1.
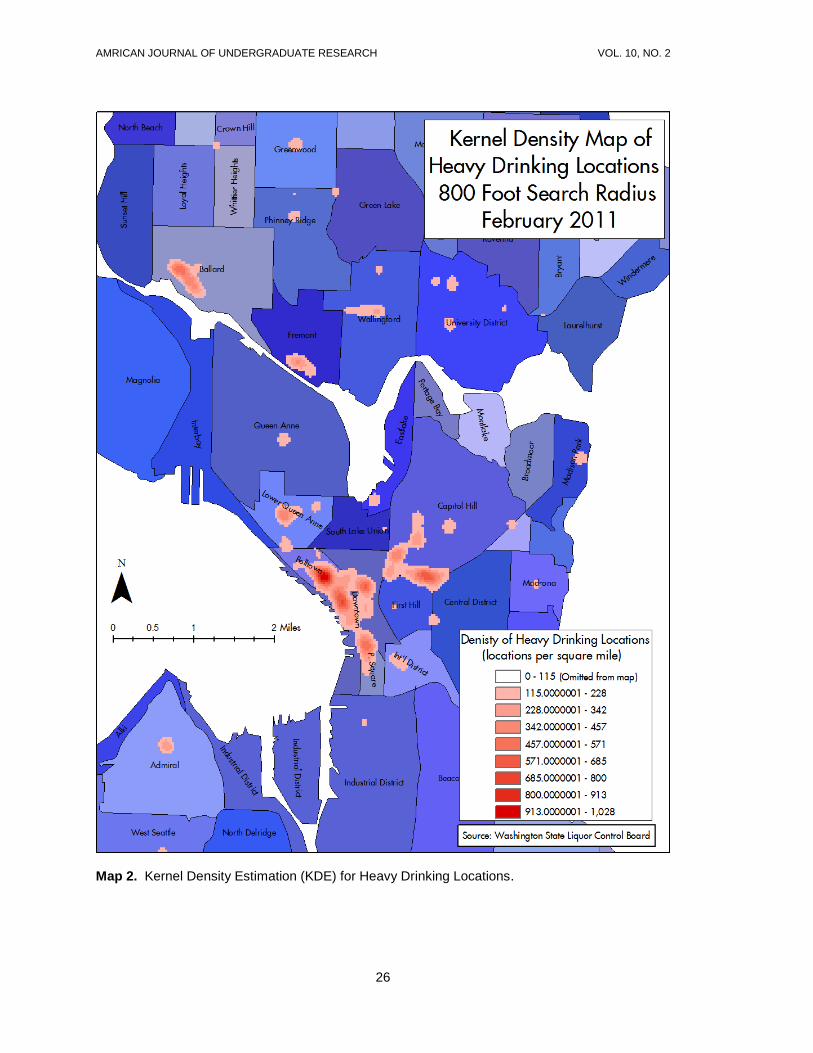
In order to properly determine which areas are likely to attract many patrons, the identification of nightlife hotspots was necessary. While many residents of the greater Seattle region would be able to name several high profile nightlife areas of the city, our method uses the kernel density estimation (KDE) formula to quantitatively determine which areas are hotspots within the city. Choosing a search radius of 800 feet (0.152 miles, about three city blocks) to reflect the short distance that one would likely be willing to travel between bars in a nightlife district, we performed the KDE on the 810 geocoded locations of “heavy drinking” liquor licenses. The formula for this operation is
, where equals the number of licenses
within 0.152 miles of the raster cell and equals the density calculated at that raster cell. In our definition of a hotspot, we chose a density value greater than or equal to 115 liquor licenses per square mile, or roughly 8 “heavy drinking” liquor licenses within a 0.152 mile radius. By identifying these hotspots, travel from the bars within the hotspot can be grouped to create a profile for travel statistics for each nightlife hotspot. These hotspots are mapped in Map 2. As nightlife districts reflect the benefit that bars have in creating foot traffic from clustering in the same locations, travel to these locations are not focused on visiting specific bars but rather on the entire nightlife district [1]. Upon producing these raster based hotspots, they were then converted to vector
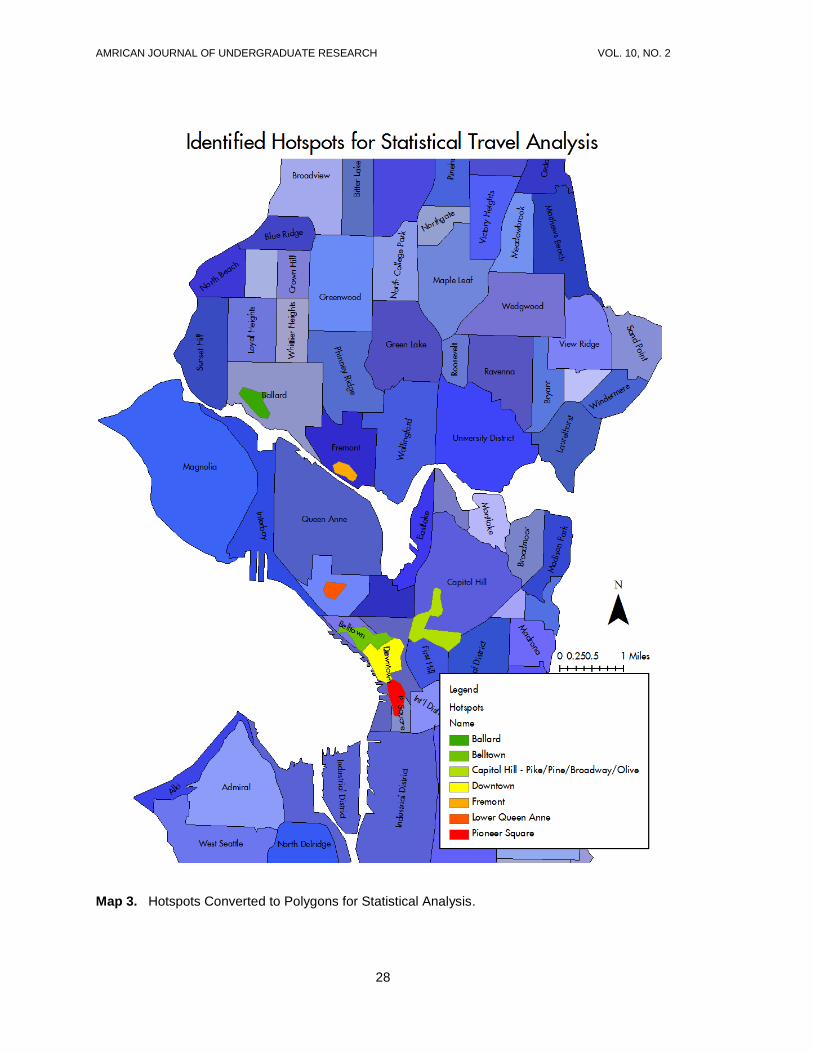
based polygon data for the purpose of statistical analysis of trips to each district. The top seven densest hotspots were chosen for statistical analysis and are shown and named in Map 3.
III. GOWALLA, FACEBOOK AND THE SECRETARY OF STATE The novel approach we took in this
research is the use of user-generated location data to directly measure alcohol-related travel. The use of purpose-made diaries for recording travel is fraught with potential experimental error—users may under-report their alcohol-related travel because they worry about complying with social norms, they may over-report to make themselves appear more interesting, or they may simply remember mistakenly. Gowalla check-ins happen at the time of drinking, and the service has measures in place to prevent a user from lying about their location. In particular, it is primarily used via a mobile app with access to a GPS sensor and as such has the potential to gather very accurate data on the spatial activities of their users.
All of this work was performed in a PostgreSQL database, using primarily purpose-built Ruby scripts for data gathering. PostGIS spatial extensions to PostgreSQL were used to perform many of the spatial analysis tasks.
First, we gathered the location and Gowalla ID numbers of all the venues categorized as “nightlife” in Seattle. We then used the Gowalla API to download the most recent 10 users (as of 16 February 2011) who had checked in at each of these 614 venues. Intermittently from 28 February and continuously from 09 March to 13 March, we ran a program to continuously download the recent check-ins of each user in the dataset, including the location of all other venues that they checked in to. The Gowalla API returns the last 10 check-ins for any user who has not enabled privacy settings, making it possible to get nearly complete data with occasional monitoring. Once this data-gathering phase was complete, we iterated through the users we had gathered and used the Facebook profile ID number that Gowalla exposes to determine what we considered to be the likely legal name of that user. Of the 1,785
AMRICAN JOURNAL OF UNDERGRADUATE RESEARCH VOL. 10, NO. 2
25
Map 1. “Heavy Drinking Locations” in Seattle.
AMRICAN JOURNAL OF UNDERGRADUATE RESEARCH VOL. 10, NO. 2
26
Map 2. Kernel Density Estimation (KDE) for Heavy Drinking Locations.
AMRICAN JOURNAL OF UNDERGRADUATE RESEARCH VOL. 10, NO. 2
27
Number of candidates
Count of cases
Mean Standard Deviation
1 260 2.59 3.17
2 50 2.92 2.54
3 33 2.12 1.63
4 11 1.89 1.40
5 9 1.62 0.92
6 6 1.36 1.09
7 6 1.14 1.25
8 3 0.65 0.26
9 0 – –
10 4 0.97 1.09
11 4 1.71 0.18
12 2 1.23 0.11
13 3 0.51 0.28
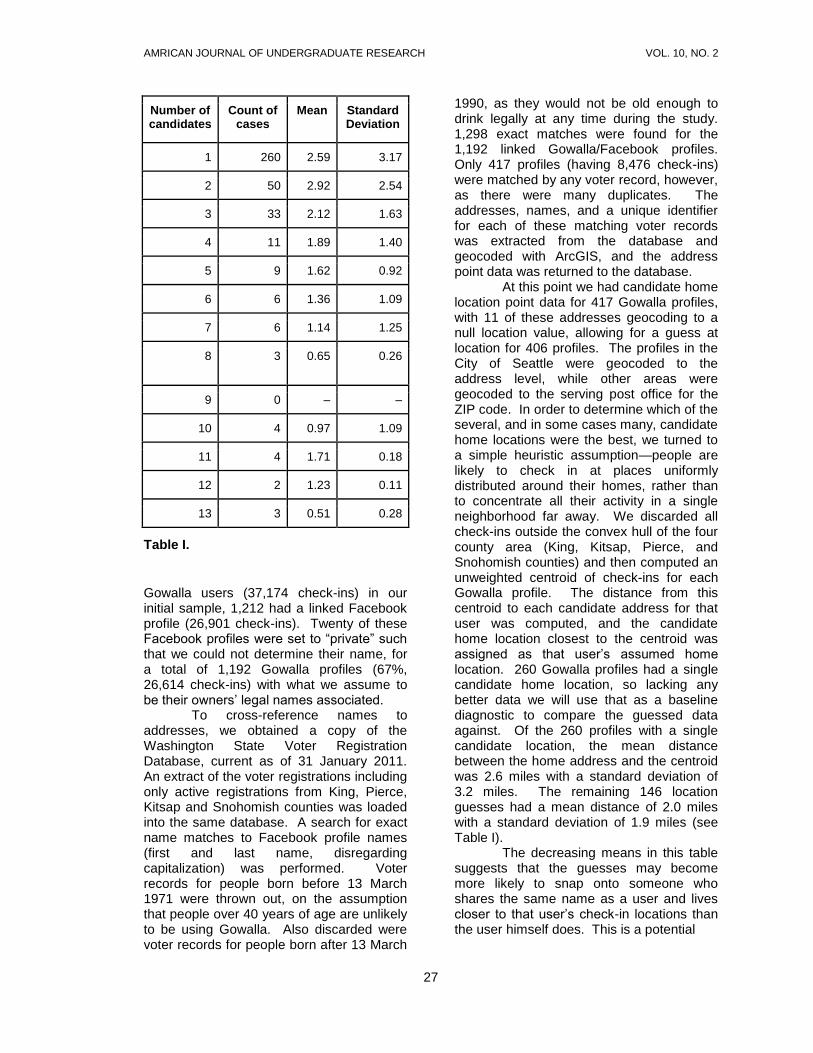
Table I.
Gowalla users (37,174 check-ins) in our initial sample, 1,212 had a linked Facebook profile (26,901 check-ins). Twenty of these Facebook profiles were set to “private” such that we could not determine their name, for a total of 1,192 Gowalla profiles (67%, 26,614 check-ins) with what we assume to be their owners’ legal names associated.
To cross-reference names to addresses, we obtained a copy of the Washington State Voter Registration Database, current as of 31 January 2011. An extract of the voter registrations including only active registrations from King, Pierce, Kitsap and Snohomish counties was loaded into the same database. A search for exact name matches to Facebook profile names (first and last name, disregarding capitalization) was performed. Voter records for people born before 13 March 1971 were thrown out, on the assumption that people over 40 years of age are unlikely to be using Gowalla. Also discarded were voter records for people born after 13 March
1990, as they would not be old enough to drink legally at any time during the study. 1,298 exact matches were found for the 1,192 linked Gowalla/Facebook profiles. Only 417 profiles (having 8,476 check-ins) were matched by any voter record, however, as there were many duplicates. The addresses, names, and a unique identifier for each of these matching voter records was extracted from the database and geocoded with ArcGIS, and the address point data was returned to the database.
At this point we had candidate home location point data for 417 Gowalla profiles, with 11 of these addresses geocoding to a null location value, allowing for a guess at location for 406 profiles. The profiles in the City of Seattle were geocoded to the address level, while other areas were geocoded to the serving post office for the ZIP code. In order to determine which of the several, and in some cases many, candidate home locations were the best, we turned to a simple heuristic assumption—people are likely to check in at places uniformly distributed around their homes, rather than to concentrate all their activity in a single neighborhood far away. We discarded all check-ins outside the convex hull of the four county area (King, Kitsap, Pierce, and Snohomish counties) and then computed an unweighted centroid of check-ins for each Gowalla profile. The distance from this centroid to each candidate address for that user was computed, and the candidate home location closest to the centroid was assigned as that user’s assumed home location. 260 Gowalla profiles had a single candidate home location, so lacking any better data we will use that as a baseline diagnostic to compare the guessed data against. Of the 260 profiles with a single candidate location, the mean distance between the home address and the centroid was 2.6 miles with a standard deviation of 3.2 miles. The remaining 146 location guesses had a mean distance of 2.0 miles with a standard deviation of 1.9 miles (see Table I).
The decreasing means in this table suggests that the guesses may become more likely to snap onto someone who shares the same name as a user and lives closer to that user’s check-in locations than the user himself does. This is a potential
AMRICAN JOURNAL OF UNDERGRADUATE RESEARCH VOL. 10, NO. 2
28
Map 3. Hotspots Converted to Polygons for Statistical Analysis.
AMRICAN JOURNAL OF UNDERGRADUATE RESEARCH VOL. 10, NO. 2
29
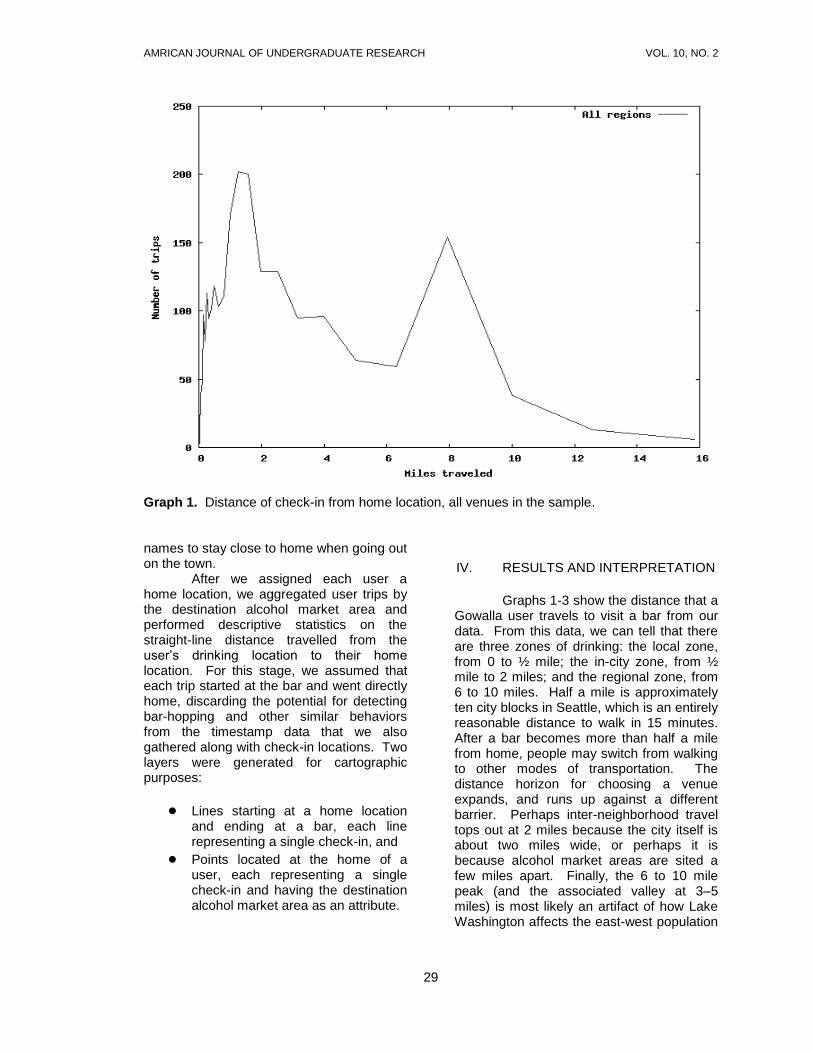
Graph 1. Distance of check-in from home location, all venues in the sample. names to stay close to home when going out on the town.
After we assigned each user a home location, we aggregated user trips by the destination alcohol market area and performed descriptive statistics on the straight-line distance travelled from the user’s drinking location to their home location. For this stage, we assumed that each trip started at the bar and went directly home, discarding the potential for detecting bar-hopping and other similar behaviors from the timestamp data that we also gathered along with check-in locations. Two layers were generated for cartographic purposes:
● Lines starting at a home location and ending at a bar, each line representing a single check-in, and
● Points located at the home of a user, each representing a single check-in and having the destination alcohol market area as an attribute.
IV. RESULTS AND INTERPRETATION
Graphs 1-3 show the distance that a
Gowalla user travels to visit a bar from our data. From this data, we can tell that there are three zones of drinking: the local zone, from 0 to ½ mile; the in-city zone, from ½ mile to 2 miles; and the regional zone, from 6 to 10 miles. Half a mile is approximately ten city blocks in Seattle, which is an entirely reasonable distance to walk in 15 minutes. After a bar becomes more than half a mile from home, people may switch from walking to other modes of transportation. The distance horizon for choosing a venue expands, and runs up against a different barrier. Perhaps inter-neighborhood travel tops out at 2 miles because the city itself is about two miles wide, or perhaps it is because alcohol market areas are sited a few miles apart. Finally, the 6 to 10 mile peak (and the associated valley at 3–5 miles) is most likely an artifact of how Lake Washington affects the east-west population
AMRICAN JOURNAL OF UNDERGRADUATE RESEARCH VOL. 10, NO. 2
30
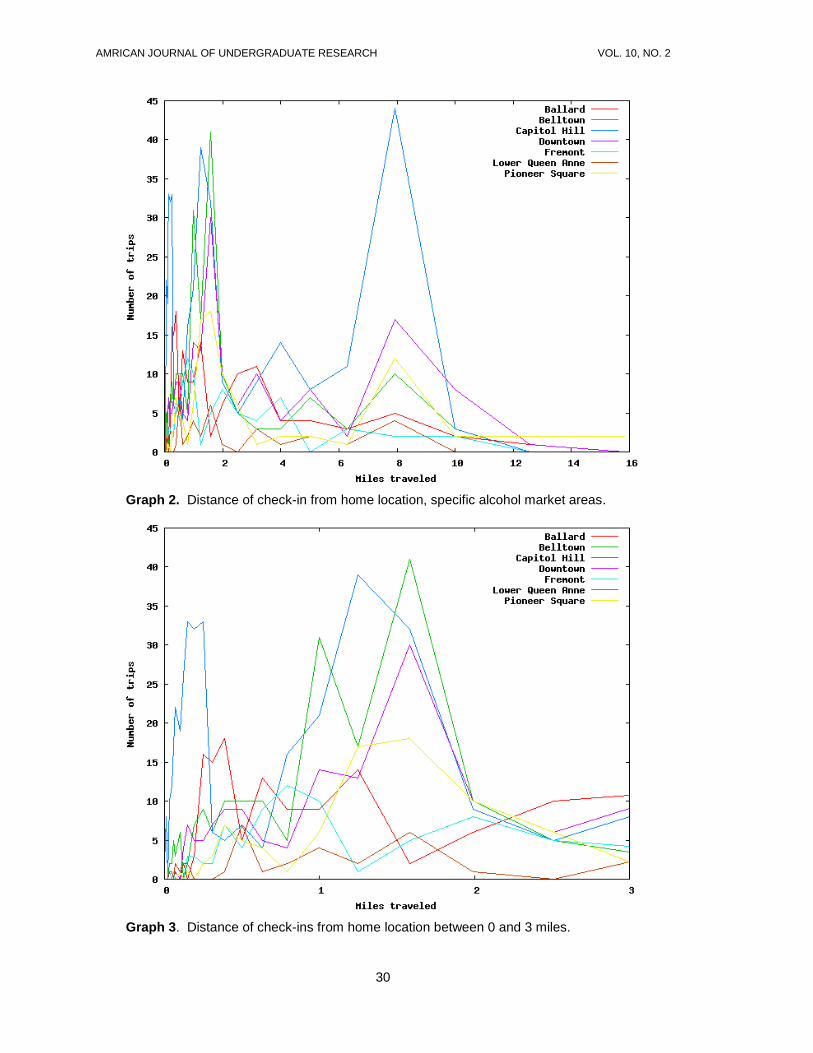
Graph 2. Distance of check-in from home location, specific alcohol market areas.
Graph 3. Distance of check-ins from home location between 0 and 3 miles.
AMRICAN JOURNAL OF UNDERGRADUATE RESEARCH VOL. 10, NO. 2
31
distribution in the city and the suburbs. Additionally, when looking at the graphs of commuter peaks, Ballard’s peak is rather small compared to the bar density that exists there. This is likely due to the poor access that Ballard has to I-5, limiting its accessibility to commuters.
V. CONCLUSION
In terms of using this data to target
possible DUIs, our data suggests that the neighborhoods of Capitol Hill and Downtown have a large amount of Gowalla users travelling distances that are fairly unwalkable. However, this data only represents the travel patterns of Gowalla users, which may not represent an accurate segment of the overall makeup of bar patrons within the city of Seattle. With a larger pool of diverse users, more accurate travel patterns could emerge.
While our data is somewhat noisy, our project has created a solid framework for spatial analysis of web 2.0 check-in data. Our project benefits from working with extremely current sets of data. State voter records and state liquor license data are both high quality data sets which are updated very frequently. Gowalla check-in data is also very timely, being updated constantly in real time. In comparison to other social science research, this data is extremely timely.
Our findings come with many caveats. First, users of Gowalla are not an accurate representation of every resident in the city of Seattle who frequents bars and clubs. As Gowalla users are likely to be young and wealthy enough to own a mobile device with a data plan, this skews the socioeconomic makeup of the data set away from a fully accurate representation of nightlife related travel. Additionally, we assume that a person returns directly home after a night out. This model does not take into account designated drivers, taxi rides, staying the night elsewhere, and public transportation. We also assumed that each user in question primarily lives at the address they are registered to vote at, an assumption which fails in the entirely common scenario where a person is registered to vote at a parent’s address but does not live there because they move frequently or are off at college.
This project could be improved in a variety of ways. Much more check-in data is needed for a comprehensive analysis. Early in our research, we explored our ability to obtain check-in data through Gowalla competitor Foursquare. Unfortunately, Foursquare is much more guarded with their user data, and as a result we were unable to obtain any large amounts of data from this site. This was a significant setback because, as of July 2010, Foursquare had over 1.9 million users compared to Gowalla’s 340,000. [5] Should we be able to obtain data from Foursquare, it could easily be put into the framework created for this project, and a much more in-depth analysis could take place. Also, with more time and check-in data, statistical profiles of each individual bar could be produced. With enough data on visitors, an accurate pattern of patronage for each bar could be produced. This data could be useful to bar and club owners for marketing purposes, something that Foursquare is pursuing aggressively. Foursquare’s management tools for businesses expose the gender breakdown by hour, for example, but they don’t go into the depth that we were able to in this exploration.
REFERENCES
1. Crim, Stephen J. “Developing a theory
of nightclub location choice”. MA Thesis. Massachusetts Institute of Technology. Dept. of Urban Studies and Planning (2008). Web: http://hdl.handle.net/1721.1/44354.
2. Gruenewald, Paul, Tim Stockwell, Andrea Beel, and Elena Dyskin. "Beverage Sales and Drinking and Driving: The Role of On-Premise Drinking Places." Journal of Studies on Alcohol. 60. (1999).
3. Jackson, Kirabo,. and Owens, Emily. “One for the road: Public transportation, alcohol consumption, and intoxicated driving.” Journal of Public Economics Volume 95, Issues 1-2, 106-121, (February 2011).
4. Lehman, Elizabeth. WSLCB. "Definitions of Permissions on Liquor Licences." Message to William Conroy. 18 (February 2011). E-mail.
5. Moore, Robert. “Foursquare Is Five Times Larger Than Gowalla And
AMRICAN JOURNAL OF UNDERGRADUATE RESEARCH VOL. 10, NO. 2
32
Growing 75 Percent Faster Every Day.” Techcrunch.com. July 2010. Accessed March 15, 2011.
http://techcrunch.com/2010/07/07/foursquare-gowalla-stats