Embed Size (px)
Citation preview
8/3/2019 USSBS Report 48, Japanese Merchant Shipbuilding
http://slidepdf.com/reader/full/ussbs-report-48-japanese-merchant-shipbuilding 1/61
THE UNITED STATES
STRATEGIC BOMBING SURVEY
Japanese
Merchant Shipbuilding
Military Supplies Division
January 1947

8/3/2019 USSBS Report 48, Japanese Merchant Shipbuilding
http://slidepdf.com/reader/full/ussbs-report-48-japanese-merchant-shipbuilding 2/61
8/3/2019 USSBS Report 48, Japanese Merchant Shipbuilding
http://slidepdf.com/reader/full/ussbs-report-48-japanese-merchant-shipbuilding 3/61
THE UNITED STATES
STRATEGIC BOMBING SURVEY
Japanese
Merchant Shipbuilding
Military Supply Division
January 1947
PUBLIC
8/3/2019 USSBS Report 48, Japanese Merchant Shipbuilding
http://slidepdf.com/reader/full/ussbs-report-48-japanese-merchant-shipbuilding 4/61
WAK 12 W*1
This report was written primarily for the use of the U. S. Strategic
Bombing Survey in the preparation of further reports of a more compre-
hensive nature. Any conclusions or opinions expressed in this report must
be considered as limited to the specific material covered and as subject to
further interpretation in the light of further studies conducted by the
Survey.

8/3/2019 USSBS Report 48, Japanese Merchant Shipbuilding
http://slidepdf.com/reader/full/ussbs-report-48-japanese-merchant-shipbuilding 5/61
I OKI WORDThe United States Strategic Bombing Sur-
\ ej was established by the Secretary of War on
November 1944, pursuant to a directive from
he late President Roosevelt. Its mission was
conduct an impartial and expert study of
effects of our aerial attack on Germany, to
used in connection with air attacks on Japan
to establish a basis for evaluating the im-
portance and potentialities of air power as an
of military strategy for planning
he future development of the United States
forces and for determining future eco-
nomic policies with respect to the national
A summary report and some 200 sup-
porting reports containing the findings of the
Survey in Germany have been published.
On 15 August 1945, President Truman re-
uested that the Survey conduct a similar study
f the effects of all types of air attack in the
war against Japan, submitting reports in dupli-to the Secretary of War and to the Secre-
tary of the Navy. The officers of the Survey
uring its Japanese phase were:
Franklin D'Olier, Chairman.
Paul H. Nitze,
Henry ('. Alexander, Vice-Chairmen.
Harry L. Bowman,
J. Kenneth Galbraith,
Rensis Likert,
Frank A. McNamee, Jr.,
Fred Searls, Jr.,
Monroe E. Spaght,
Dr. Lewis R. Thompson,
Theodore P. Wright,
I tin ctOT8.
Walter Wilds, Secretart/.
The Survey's complement provided for 300
civilians, 350 officers, and 500 enlisted men.
The military segment of the organization was
drawn from the Army to the extent of 60 per-
cent, and from the Navy to the extent of 40
percent. Both the Army and the Navy gave
the Survey all possible assistance in furnishing
men, supplies, transport, and information. The
Survey operated from headquarters established
in Tokyo early in September 1945, with sub-
headquarters in Nagoya, Osaka, Hiroshima and
Nagasaki, and with mobile teams operating in
other parts of Japan, the islands of the Pacific,
and the Asiatic mainland.
It was possible to reconstruct much of war-
time Japanese military planning and execution,
engagement by engagement, and campaign by
campaign, and to secure reasonably accurate
statistics on Japan's economy and war-produc-
tion, plant by plant, and industry by industry.
In addition, studies were conducted on Japan's
over-all strategic plans and the background ofher entry into the war, the internal discussions
and negotiations leading to her acceptance of
unconditional surrender, the course of health
and morale among the civilian population, the
effectiveness of the Japanese civilian defense
organization, and the effects of the atomic
bombs. Separate reports will be issued cover-
ing each phase of the study.
The Survey interrogated more than 700
Japanese military, government, and industrial
officials. It also recovered and translated manydocuments which not only have been useful to
the Survey, but also will furnish data valuable
for other studies. Arrangements have been
made to turn over the Survey's files to the
Central Intelligence Group, through which they
will be available for further examination and
distribution.
Ill

8/3/2019 USSBS Report 48, Japanese Merchant Shipbuilding
http://slidepdf.com/reader/full/ussbs-report-48-japanese-merchant-shipbuilding 6/61
8/3/2019 USSBS Report 48, Japanese Merchant Shipbuilding
http://slidepdf.com/reader/full/ussbs-report-48-japanese-merchant-shipbuilding 7/61
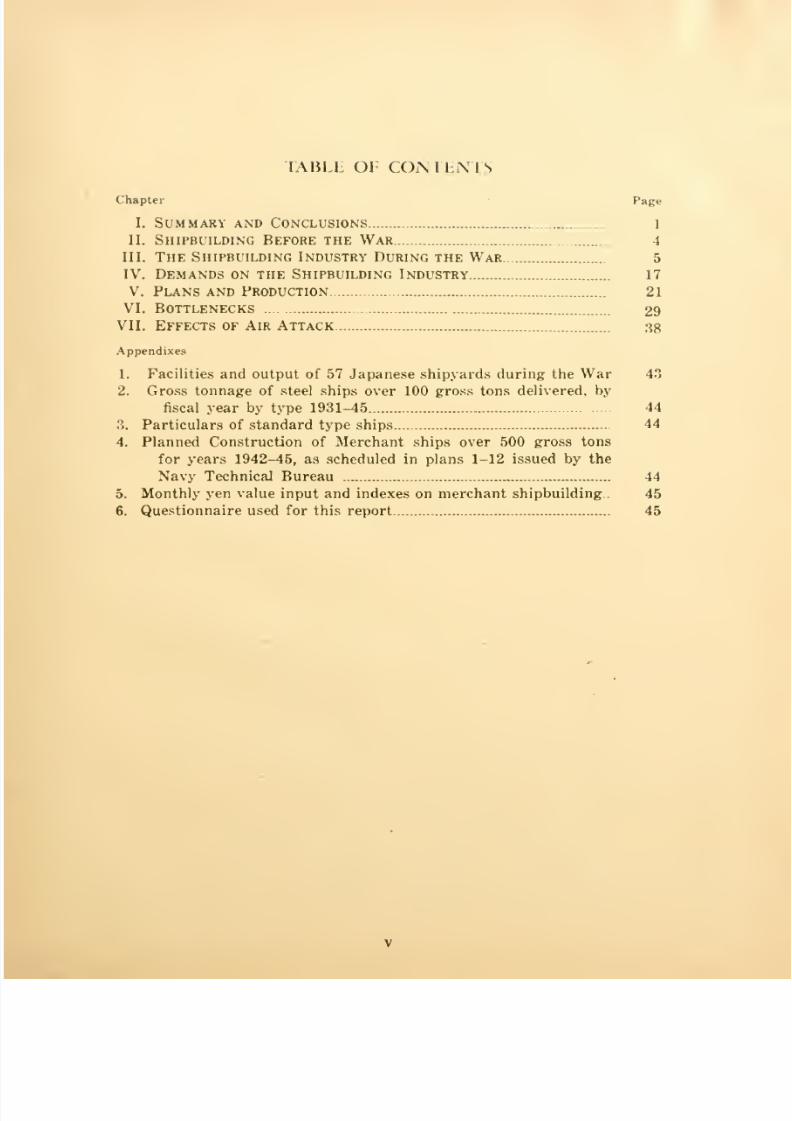
I Mil I OF CON l I N is
Chapter Page
I. Summary and Conclusions 1
II. Shipbuilding Before the War 4
III. The Shipbuilding Industry During the War 5
IV. Demands on the Shipbuilding Industry 17
V. Plans and Production 21
VI. Bottlenecks 29
VII. Effects of Air Attack 38
Appendixes
1. Facilities and output of 57 Japanese shipyards during the War 43
2. Gross tonnage of steel ships over 100 gross tons delivered, by
fiscal year by type 1931—45 44
3. Particulars of standard type ships 44
4. Planned Construction of Merchant ships over 500 gross tons
for years 1942-45, as scheduled in plans 1-12 issued by the
Navy Technical Bureau 44
5. Monthly yen value input and indexes on merchant shipbuilding.. 45
6. Questionnaire used for this report 45
8/3/2019 USSBS Report 48, Japanese Merchant Shipbuilding
http://slidepdf.com/reader/full/ussbs-report-48-japanese-merchant-shipbuilding 8/61
I IS I OF TABLES AND CHARTS
Table rage
1. Geographical distribution of wartime shipbuilding activity in
commercial shipyards <)
2. Distribution of commercial shipyards and their production ac-
cording to the degree of specialization by the yards in the
principal lines of final products during the war 10
3. Changes by fiscal years during the war in the total of operable
tonnage of Japanese steel merchant shipping over 500 gross
tons i$
4. Average monthly tonnage of planned and actual production of
powered and nonpowered wooden vessels by fiscal years during
the war 26
5. Relative importance of steel for merchant ships 32
6. Average monthly deliveries and consumption and average inven-
tories of rolled and special steel in merchant ship construction
by fiscal years 32
7. Effect of bombing on average monthly value added during 1945
in all work on merchant and naval ships and ship components
in the commercial shipyards in Japan 3*9
8. Effect of bombing on average monthly production, manhours,
and employment in 1945 in damaged yards, undamaged yardsin attacked areas and undamaged yards outside attacked areas 40
(harts
1. Monthly gross tonnage deliveries of wooden ships, steel tankers,
and other steel ships, April 1941 August 1945 2
2. Distribution of production and facilities among the six principal
classes of commercial shipyards during the war 7
3. Distribution of each principal line of shipbuilding activity shown
cumulatively among all producers in the order of their volume
of activity 8
4. Distribution of merchant tonnage delivered during the waramong shipyards according to the age and degree of speciali-
zation in the yards 12
5. Expansion of commercial shipyards during the war 14
6. Planned and actual monthly average rate of deliveries of tankers
and other merchant ships by fiscal years 22
7. Planned and actual annual production by standard ship types
for the fiscal year 1944 24
8. Monthly yen value input for principal classes of merchant ship
construction, April 1941-August 1945 28
9. Indexes of yen value input, man-hours worked and average
employment in the construction of steel ships by months 34
VI
8/3/2019 USSBS Report 48, Japanese Merchant Shipbuilding
http://slidepdf.com/reader/full/ussbs-report-48-japanese-merchant-shipbuilding 9/61
1. SI MMARV AM) CONCLUSION'S
Kffort to Meet the Demand for Ships
Beginning with the China incident in 1937,
the Japanese economy was constantly and in-
in need of more and more merchant
With the outbreak of war in December
1941, Japan began to suffer ship losses at a
teadily increasing rate which her naval and
forces were unable to check.
Not until the war had been in progress a full
didthe
Japanese bring themselves to con-
on merchant shipbuilding as if their
le economic and military position depended,
it did, on the adequacy of the merchant ma-
The largest commercial shipyards had
en preoccupied with the heavy naval ship
program and little had been done
expand or modernize established yards or to
new ones.
The 12 major commercial yar-fc which ac-
for about three-fourths of the total
work done on ships in all the yards during the
war, had been well established custom ship-
builders before the war—building and repair-
ing both merchant and naval ships to order
ith no great premium on volume production
employing the conventional shipbuilding
of the 20s and 30s. Shortly after
war was declared, the necessity for standardi-
ation of ship design was recognized, but the
12 types adopted were little more than official
for the more or less uniform ship de-
igns developed in various shipyards.
When the navy, which had assumed control
nd responsibility for shipbuilding from the
ommunications Ministry, initiated a genuine
to expand the volume of shipbuilding,
number of ship types was reduced to seven
nd several new yards, designed to produce
one type exclusively, were started. As the
pressure for more shipping increased, an exten-
ive program of small wooden ship construction
was laid out but did not get well under wayuntil the spring of 1943.
The Japanese were confronted with a great
increase in demand for petroleum transporta-
tion after the outbreak of war. The conduct of
the war brought about a large increase in
petroleum requirements at home which could
only be met by transportation over long dis-
tances as from Singapore and the NEI to Japan.
Inasmuch as Japan had relied heavily, before
the oil embargo by the Allies, on imports in
foreign bottoms from outside Greater East
Asia, her supply of facilities for overseas oil
transport was inadequate to meet the demand
for oil transportation. Hence, there existed a
great demand for the creation of additional
tanker tonnage.
More than 400,000 tons of cargo ships were
converted into tankers during the fiscal years
1941 and 1942 and almost 1,000,000 tons of
new tankers were built during the war, mostly
in 1943 and 1944. The Japanese were never
able to provide enough transportation for petro-leum products to meet the demands, however,
in spite of the delay in the incidence of effective
Allied attacks on tankers.
Tanker deliveries met schedules better than
other types of merchant ships because of the
higher priority assigned to tankers from De-
cember 1942 to January 1945. The priority
was implemented by the assignment of tanker
construction to what were considered the most
reliable shipyards. When it became apparent
in the spring of 1944 that production schedules
generally would not be met, previously sched-
uled cargo ship production was rescheduled
for completion as tankers. It was not until it
was considered no longer a worthy risk to send
tankers to the south that efforts to meet the
demand for new tankers ceased. That decision
was made in January 1945.
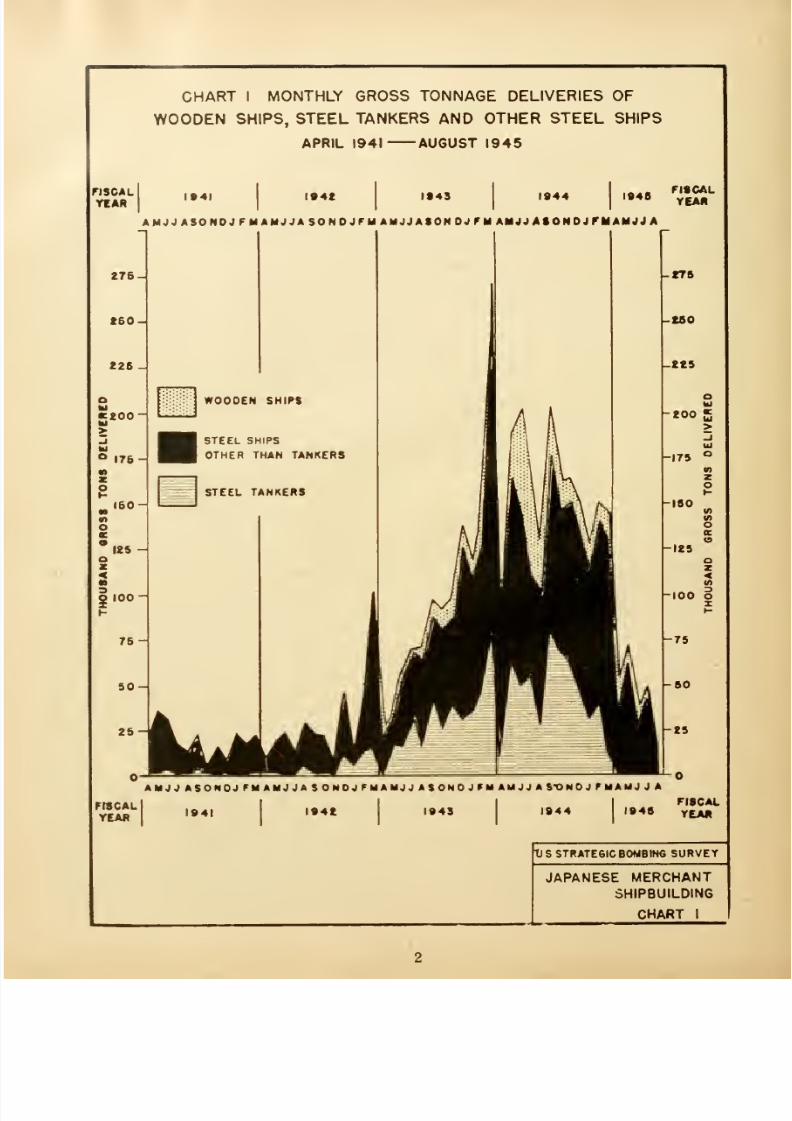
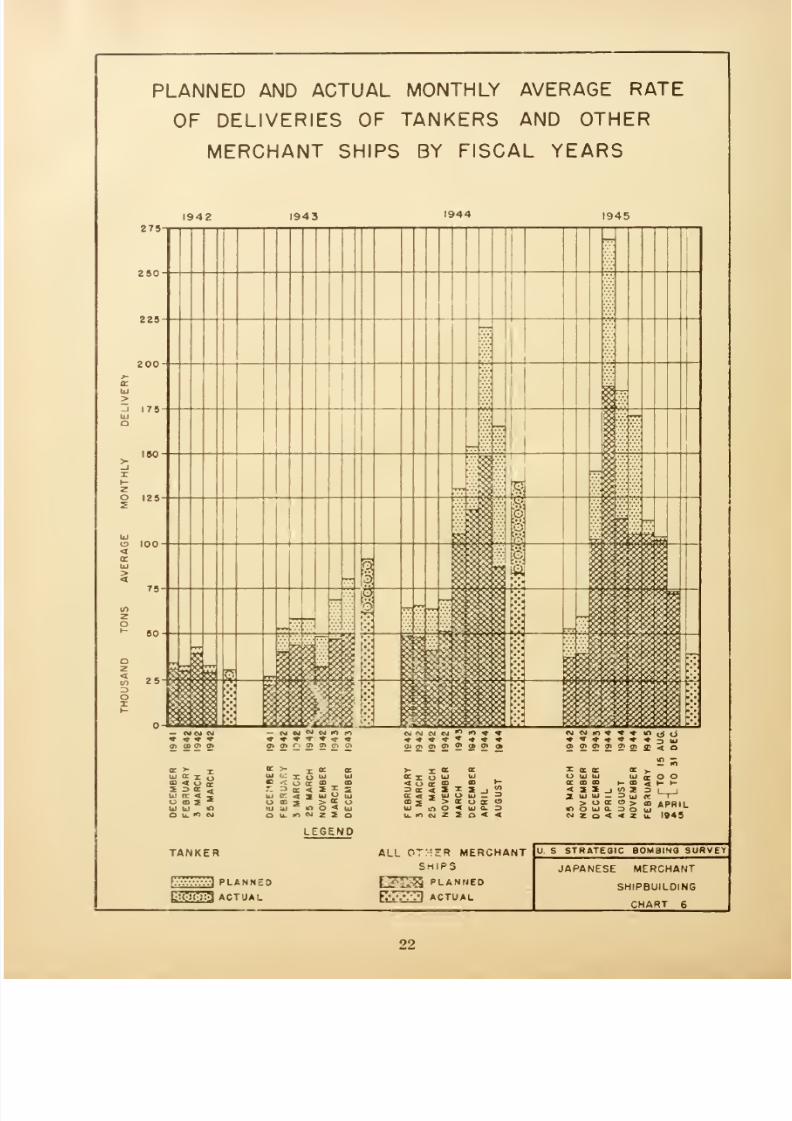
The monthly tonnage deliveries of steel mer-
chant ships other than tankers, of steel tankers
andof all wooden ships are
shownon
Chart1,
page 2.
8/3/2019 USSBS Report 48, Japanese Merchant Shipbuilding
http://slidepdf.com/reader/full/ussbs-report-48-japanese-merchant-shipbuilding 10/61
fiscal
YEAR
CHART I MONTHLY GROSS TONNAGE DELIVERIES OF
WOODEN SHIPS, STEEL TANKERS AND OTHER STEEL SHIPS
APRIL 1941 AUGUST 1945
1041 I94t 1*43 1944 1946
AMJJASONDJFMAMJJASONDJFMAMJJASONDJFMAMJJASONDjrMAMJJA
FISCALYEAN
FISCAL
YEAR
AMJJASONOJFMAMJJASONDJFMAMJJASONOJFMAMJJAS^>NOJFMAMJJA
1941 l»4£ 1943 IB44FI8CAL
I94S YtJU,
V S STRATEGIC BOMBING SURVEY
JAPANESE MERCHANTSHIPBUILDING
CHART I
8/3/2019 USSBS Report 48, Japanese Merchant Shipbuilding
http://slidepdf.com/reader/full/ussbs-report-48-japanese-merchant-shipbuilding 11/61
The volume of both ship deliveries and eco-
nomic input increased rapidly throughout 1943.
The lag in fluctuations in the rate of delivery
behind corresponding fluctuations in the rated
economic input averaged about 2 months. The
steel ship producers operated on a peak plateau
of production effort from January through Oc-
tober 1944 averaging about 134 million yen
input per month. Ship deliveries for the same
length period beginning and ending 2 monthslater averaged about 147,000 gross tons per
month. The period of peak activity in wooden
ship construction lasted from November 1943
through June 1944 during which time monthly
input averaged about 22,000 yen. Wooden ship
deliveries for the corresponding period of de-
livery averaged about 27,000 gross tons per
month.
Causes of the Failure
Inspite
of thestrenuous efforts and greatly
expanded volume of merchant ship production
during the war, new tonnage never exceeded
45 percent of the sinkings in any one year.
The greatest single cause of the failure to main-
tain an adequate merchant marine was the
Japanese' failure to prevent wholesale sinkings.
The shipbuilding industry had an impossible
task.
The basic limitations of the low skill level of
the average Japanese workman, the cramped
quarters occupied by the shipyards, the lack of
heavy duty cranes and equipment, and the un-
imaginativeness of Japanese industrial engi-
neering and management committed wartime
shipbuilding techniques very largely to the low
volume traditional methods which were only
partially offset by the simplification and econ-
omy of design (adopted at the expense of speed
and seaworthiness) of the standard ship types
put into production.
Once the decision was made to expedite mer-
chant ship construction, heavy naval ship con-
struction was curtailed, and the yards were
expanded to permit the rapid increase in the
volume of merchant shipbuilding. Before the
full capacity of the expanded yards was real-
ized, however, the whole program was over-
taken by the over-all shortage of steel in Japan.
Production was maintained through the peak
period by drastic cuts in steel priorities to ac-
tivity considered less essential and by drawing
down on steel stocks within the steel industrymaterials pipe-line and steel inventories in the
721360—47 2
shipyards. These temporary expedimts were
exhausted by the end of October 1944, and
beginning in November a precipitous decline
in the volume of ship construction set in.
Throughout the period of peak production the
extent to which employment had been expanded
and average man-hours per employee increased
indicates that shipbuilding was under some
strain for labor power but was not suffering
seriously for the lack of it.
Throughout 1945 the merchant ship con-
struction index continued to fall off at such a
rapid rate that production at levels higher than
those actually attained could easily have been
sustained with the steel stocks reported on
hand at the end of the war Production was
suffering from the effects of bombing.
The Effects of Air Attack
Between March 1945 and the end of the war,
about one-fourth of the floor space in the com-
mercial shipyards was destroyed by air attacks.
Most of the damage was done by direct hits or
spreading fires started by the IB urban area
attacks. Some damage was done by HE attacks
directed at nearby targets. Only one multiplane
attack was directed at a shipyard as such, how-
ever, during the entire air campaign against
the home islands. Most of the 17 shipyards
which lost more than 10 percent of their floor
space to attack before the end of June suffered
less than a 50 percent loss. Nevertheless, pro-duction in these yards took a substantial cut
from which it never recovered before the end
of the war. In the meantime, other yards lo-
cated in these same cities but undamaged by
the area attacks were able to continue produc-
tion as well or better than other undamaged
yards elsewhere in Japan even though the
average employment and man-hours fell off to
about the same degree as in the damaged yards.
The loss of production following the air attacks
is. therefore, associated with the demoraliza-
tion and disorganization of shipyard activities
caused by damage to facilities in the shipyards.
The Japanese were unable to restore such facili-
ties or to reorganize procedures so that produc-
tion could be continued without them.
Sufficient additional damage had been in-
flicted on the shipyards between the end of
June and the end of the war that, judged by
the effects of the earlier attacks, shipyard ac-
tivitycould have
continued onlyon a rapidly
declining scale if the war had been continued.
8/3/2019 USSBS Report 48, Japanese Merchant Shipbuilding
http://slidepdf.com/reader/full/ussbs-report-48-japanese-merchant-shipbuilding 12/61
In fact -the degree of interference with produc-
tion obtained from the comparatively light
damage suggests that an earlier attack on ship-
yards, particularly those located near the mine
fields that were sown by air, would have
speeded up the operation in the closing phases
of the war of the primary over-all factor in
Japan's downfall—her loss of merchant ships.
Scope and Sources of the Report
The analysis of the' effects of air attack on
Japanese merchant shipbuilding requires first
an analysis of the shipbuilding effort before
bombing began so that the effects thereof can
be seen in the light of other factors affecting
the final result. The commercial shipyards of
Japan, which built and repaired substantially
all of the merchant ships, were also heavily
engaged in the construction and repair of naval
ships. In some respects,therefore,
theanalysis
deals with the commercial shipyards as a whole
rather than exclusively with work on merchant
ships. To the extent to which data were avail-
able on Japanese operated shipyards outside
of Japan proper, they are included. That mate-
rial is confined to what was available in Japan
alter the end of the war and is therefore incom-
plete. This is not a serious shortcoming so far
as the total picture is concerned, however, as
the ship production thus omitted is known to
have been a very small percentage of total ship
production. -.:-'
All references to years in this report are to
the official Japanese fiscal year beginning 1
April of the same calendar year unless other-
wise specified in the context.
The primary source material for this report
is the collection of reports submitted by each
of 57 Japanese commercial shipyards to the
Bombing Survey in reply to the questionnaire,
shown in Appendix 6, prepared by this section
of the USSBS and circulated to the shipyards
through the General Maritime Board of the
Transportation .Ministry. The answers from 50
of the yards were substantially complete. Other
important sources include one or more interro-
gation and inspection visits by members of the
section to 12 yards in different parts of Japan,
interrogations of and reports from the ship-
building officials of the Transportation Min-
istry, the Navy Technical Bureau, the Ship-
building Control Association and Mitsubishi
Heavy Industries, and copies of plans and
studies made by the Navy Technical Bureau
during the war.
This repent was prepared under the supervi-
sion of Lt. James C. Pettee, USNR, with the
assistance of Mr. Norman F. Strachan from the
U. S. Maritime Service, Lt. (jg) Robert H.
Stern, USNR and 1st Lt. Theodore J. Lettes,
AUS.
II. SIIII'IH II l)l\(, HI FOR] I III W AK
Degree of Maritime Self-Sumciency
Japan became an important maritime nation
during the first world war when she was called
upon to carry as large a share of trade in the
Pacific as possible and to construct the ships
required for that purpose. Merchant shipbuild-
ing activity so increased in that period that in
1920 Japanese merchant tonnage afloat had
increased more than 600,000 tons over 1919.
During the entire war period Japan had nearly
doubled her tonnage afloat with ships con-
structed in her own shipyards At the end of
the war her flag was carried on about 3 million
tons of shipping and she carried about four-
fifths of her own greatly expanded overseas
trade. During the twenties, overseas trade re
vived from the postwar recession while ship
construction dwindled materially with the re-
sult that the degree of Japan's maritime self-
sufficiency declined considerably. During the
thirties, however, she began to regain it and by
1937 Japan carried more than half of her own
foreign trade and all of her coastwise, Korean,
Manchurian. and Formosan traffic. The frac-
tion of her overseas trade in her own bottoms
increased steadily to about two-thirds at the
outbreak of the recent war, at which time at
least three-fourths of the six million tons afloat
was Japanese built.
Japan's tanker position before the recent war
was in sharp contrast to the degree of over-all
maritime self-sufficiency indicated above. Up
to the outbreak of hostilities, she relied heavily
on foreign tankers for oil imports. At the time
of Pearl Harbor, she had only about 400,000
tons of tankers afloat of which she had de-
livered about 60 percent from her own yards in
the 6 years, 1934 through 1939.
8/3/2019 USSBS Report 48, Japanese Merchant Shipbuilding
http://slidepdf.com/reader/full/ussbs-report-48-japanese-merchant-shipbuilding 13/61
Rate of Ship Construction
Total ship tonnage delivered from Japanese
yards dwindled from approximately (ioo.ooo
tuns annually during the first war to 20,000 or
:?(). (iimi tons annually during must of the twen-
ties. I luring the depression in the early thirties,
the government offered subsidies for new con-
struction providing equivalent over-aged ton-
nage was scrapped. As a result, deliveries
reached 85,000 tons in 1931 and averaged morethan 100,000 tons annually during the succeed-
ing -I years.
With the increased commercial and military
activity in Manchuria and Korea during the
middle thirties, new merchant tonnage deliv-
eries increased rapidly until 1937, the year of
the China incident, when deliveries exceeded
440,000 tons. Although the demand for ship-
ping continued to rise as a result of both the
military operations in China and the increased
industrial production in Japan in support of
those operations, merchant ship tonnage de-
liveries declined steadily after 1937 to 238,000
tons in 1941. A summary of merchant shipping
delivered from 1 January 1931 to 15 August
1945 classified by type and by fiscal year of
delivery is given in Appendix 2.
factors Limiting Prewar Construction
The principal cause for the decline in produc-
tion from 1937 to 1941 was the diversion of
more and more shipyard capacity into the con-
struction of naval ships. Between 1938 and
1943 one battleship, six aircraft carriers and
five cruisers were built in the commercial ship-
yards. From L935 through 1937 the value of
work done on ships delivered from the commer-
cial yards was divided 05 percent for merchant
ships and 35 percent for naval ships. During
the ensuing period of heavy naval construction
the division became 56 percent merchant and
44 percent naval.
It was not until 1942 that the gradual rate of
yard expansion was enough to permit an in-
creasein
the merchanttonnage delivered de-
spite the completion of the heavy naval con-
struction program. Throughout the period 1935
to 1942 the total floor space and total length
of building ways increased gradually. In no
year, however, did the annual increase amount
to 15 percent and the average annual increase
was 8.2 percent and 8-1 percent for floor space
and way length respectively. Of the total in-
crease in floor space developed during this
period, 56 percent was in the 11 commercial
shipyards, which yards did over 90 percent of
the naval ship construction.
Position of Shipbuilding in the Peacetime Economy
The shipbuilding industry constituted an im-
portant part of the Japanese peacetime econ-
omy. In 1935 and 1937 the commercial ship-
yards employed, respectively, 2.3 percent and
3.1 percent of the workers employed in all
manufacturing. The value of the merchant
ships produced in the years immediately pre-
ceding the war was between 5 and 6 percent of
the total production of private producers'
capital goods, including all expansion in plants
and equipment.
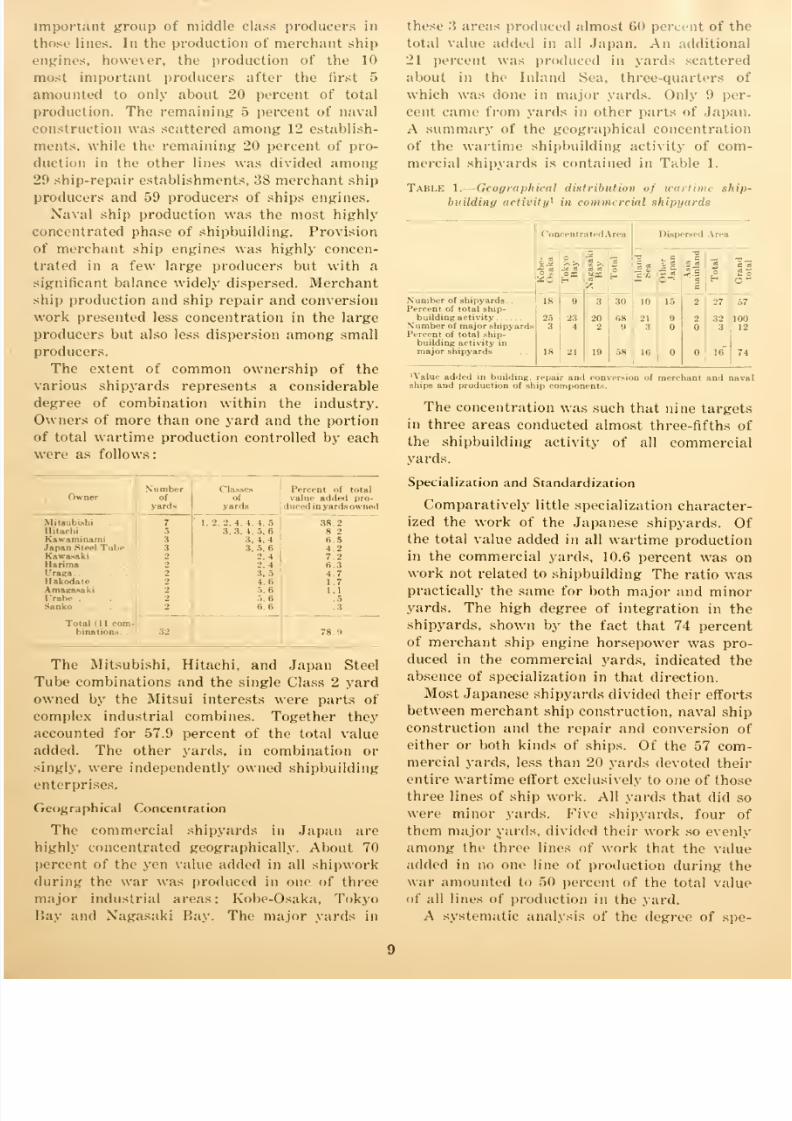
Ill THE SHIPBUILDING INDUSTRY DURING THE WAR
Position of Shipbuilding in the War Economy
The relative position of merchant shipbuild-
ing in the economy of Japan increased mate-
rially during the war, especially during 1943
and 1944. In 1942 the value of the merchant
shipping produced had increased to 9 percent
of the total production of private producers
capital goods. In 1943 and 1944 these ratios
were 16 and 14 percent, respectively. The rela-
tive share of workers in the commercial ship-
yards increased more or less steadily through-
out the war and in June- of 1944 included 8.9
percent of the total engaged in manufacturing.
In point of number of workers, shipbuilding in
the commercial yards had moved up from tenth
among the principal categories of manufactur-
ing in 1930 to third in June 1944, being ex-
ceeded on the latter date only by aircraft and
ordnance.
Concentration in Number and Size of Shipbuilding
Establishments
Substantially all work on merchant ships,
both construction, repair and conversion, was
done in commercial shipyards. Naval ship con-
struction and repair was divided between the
commercial shipyards and the five navy yards
in Japan. Many of the commercial yards in
Japan carry integration of shipbuilding process
to a high degree by manufacturing a large pro-
8/3/2019 USSBS Report 48, Japanese Merchant Shipbuilding
http://slidepdf.com/reader/full/ussbs-report-48-japanese-merchant-shipbuilding 14/61
portion of the ship components used in the yard.
Hence, a very considerable proportion of the
production of components, including ships en-
gines, is found in the commercial yards.
Data are at hand for 57 individual shipyards
that were producing or repairing steel ships
over 100 tons during the war. Although several
were commonly owned and operated by large
industrial interests such as Mitsubishi and
Hitachi, each operating yard is considered sep-
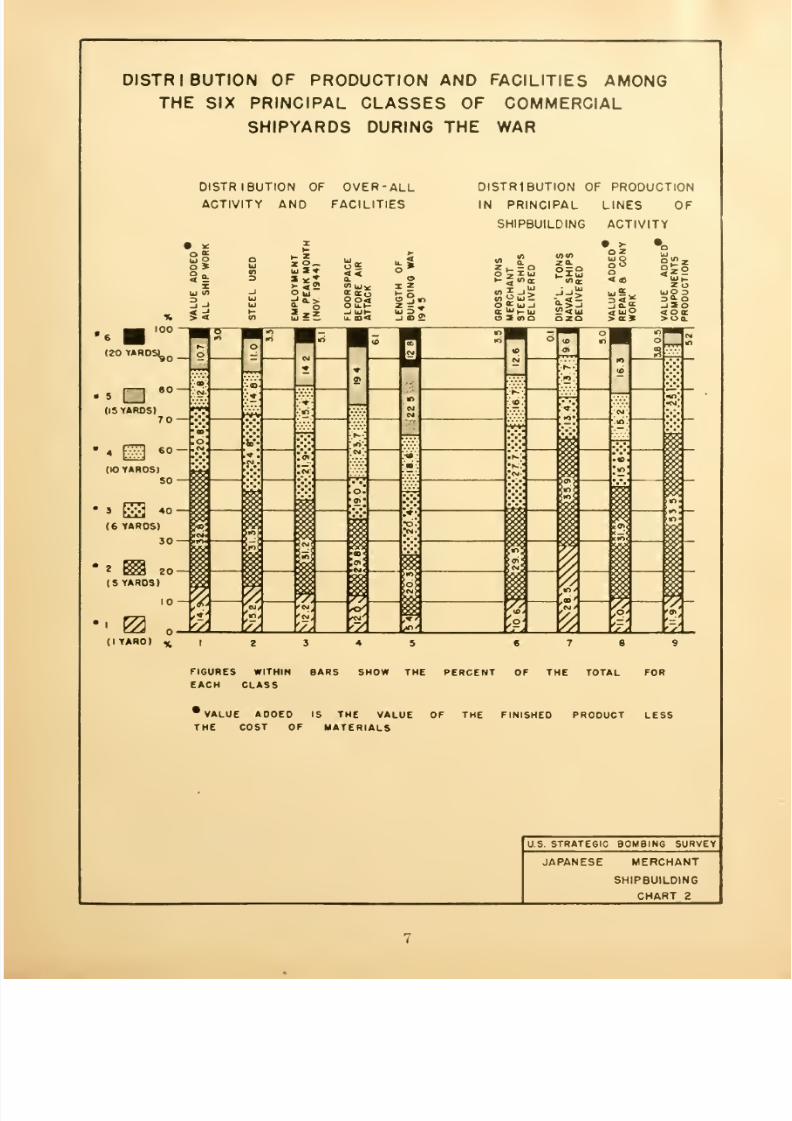
arately here. When the wartime total of work
of all kinds on ships is measured by the excess
of the final value of the work over and above
the cost of materials, the 57 yards fall into 6
distinct size classes. The 12 shipyards in the
first 3 classes are considered to be the major
shipyards of Japan and the remainder to be
minor. The six classes are constituted as
follows
CUm
8/3/2019 USSBS Report 48, Japanese Merchant Shipbuilding
http://slidepdf.com/reader/full/ussbs-report-48-japanese-merchant-shipbuilding 15/61
DISTRIBUTION OF PRODUCTION AND FACILITIES AMONG
THE SIX PRINCIPAL CLASSES OF COMMERCIAL
SHIPYARDS DURING THE WAR
DISTRIBUTION OF OVER- ALL
ACTIVITY AND FACILITIES
DISTRIBUTION OF PRODUCTION
IN PRINCIPAL LINES OF
SHIPBUILDING ACTIVITY
(I YARD) %
FIGURES WITHIN BARS SHOW THE PERCENT OF THE TOTAL FOR
EACH CLASS
w VALUE ADDED IS THE VALUE OF THE FINISHED PRODUCT LESS
THE COST OF MATERIALS
U. S. STRATEGIC BOMBING SURVE Y
JAPANESE MERCHANT
SHIPBUILDING
CHART 2
8/3/2019 USSBS Report 48, Japanese Merchant Shipbuilding
http://slidepdf.com/reader/full/ussbs-report-48-japanese-merchant-shipbuilding 16/61
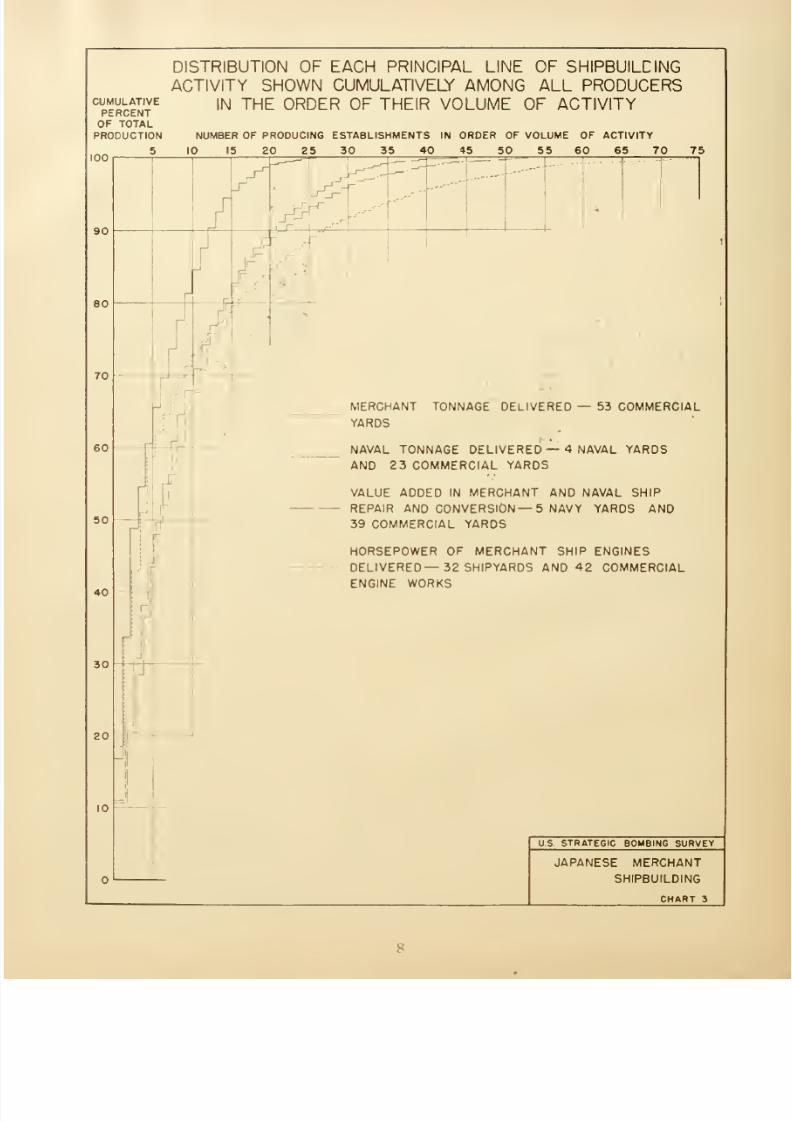
DISTRIBUTION OF EACH PRINCIPAL LINE OF SHIPBUILDING
ACTIVITY SHOWN CUMULATIVELY AMONG ALL PRODUCERS
°percentE
IN THE 0RDER 0F THEIR VOLUME OF ACTIVITY
OF TOTAL
PRODUCTION NUMBER OF PRO0UCIN6 ESTABLISHMENTS IN ORDER OF VOLUME OF ACTIVITY
5 10 15 20 25 30 35 40 45 50 55 60 65 70100
It
MERCHANT TONNAGE DELIVERED
YARDS
53 COMMERCIAL
NAVAL TONNAGE DELIVERED — 4 NAVAL YARDS
AND 23 COMMERCIAL YARDS
VALUE ADDED IN MERCHANT AND NAVAL SHIP
REPAIR AND CONVERSION— 5 NAVY YARDS AND
39 COMMERCIAL YARDS
HORSEPOWER OF MERCHANT SHIP ENGINES
DELIVERED— 32 SHIPYARDS AND 42 COMMERCIAL
ENGINE WORKS
US STRATEGIC BOMBING SURVEY
JAPANESE MERCHANT
SHIPBUILDING
CHART 3
8/3/2019 USSBS Report 48, Japanese Merchant Shipbuilding
http://slidepdf.com/reader/full/ussbs-report-48-japanese-merchant-shipbuilding 17/61
important group of middle class producers in
hose lines. In the production of merchant ship
however, the production of the 10
most important producers after the first 5
to only about 20 percent of total
roduction. The remaining 5 percent of naval
was scattered among 12 establish-
ments, while the remaining 20 percent of pro-
in the other lines was divided among
ship-repair establishments, 38 merchant ship
producers and 59 producers of ships engines.
Naval ship production was the most highly
phase of shipbuilding. Provision
merchant ship engines was highly concen-
trated in a few large producers but with a
balance widely dispersed. Merchant
production and ship repair and conversion
ork presented less concentration in the large
roducers but also less dispersion among small
producers.
The extent of common ownership of the
various shipyards represents a considerable
egree of combination within the industry.
wners of more than one yard and the portion
total wartime production controlled by each
ere as follows
Owner
8/3/2019 USSBS Report 48, Japanese Merchant Shipbuilding
http://slidepdf.com/reader/full/ussbs-report-48-japanese-merchant-shipbuilding 18/61
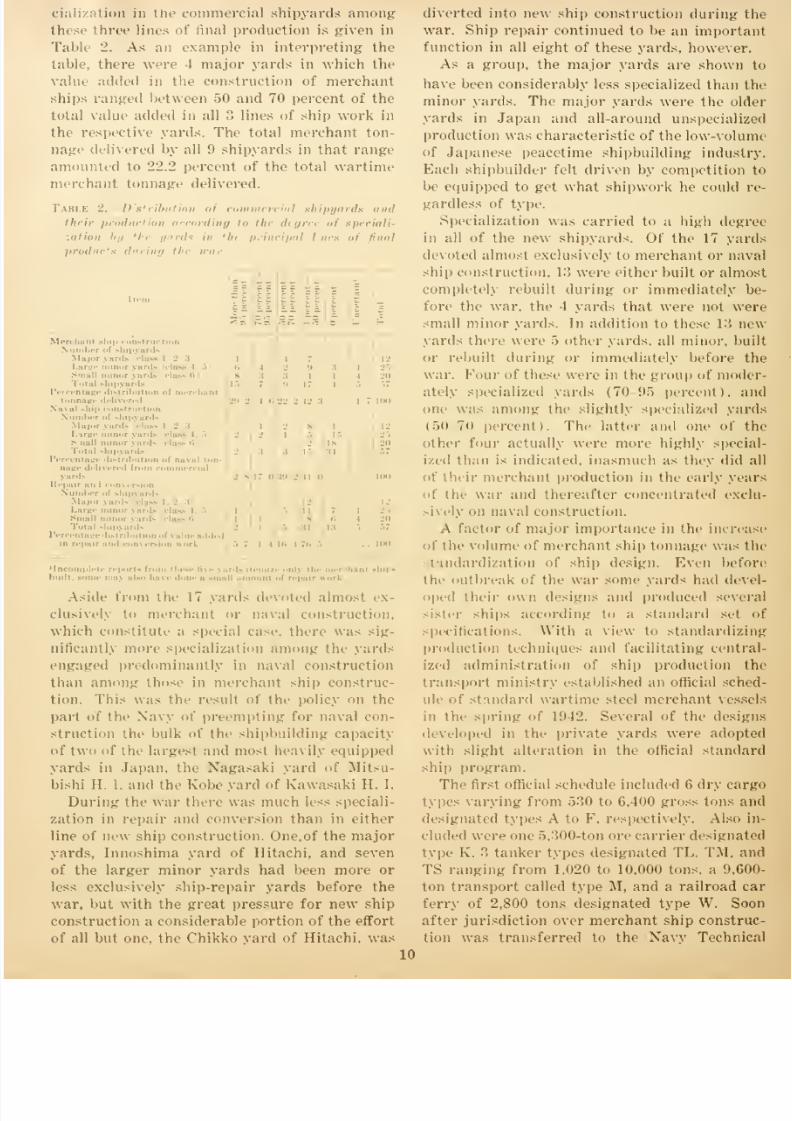
cialization in tne commercial shipyards among
these three lines of final production is given in
Table 2. As an example in interpreting the
table, there were 4 major yards in which the
value added in the construction of merchant
ships ranged between 50 and 70 percent of the
total value added in all :'> lines of ship work in
the respective yards. The total merchant ton-
nage delivered by all 9 shipyards in that range
amounted to 22:2 percent of the total wartime
merchant tonnage delivered.
Table 2. '.<of commercial shipyards and
ihi ii ..; spi ciali-
sation by '/ yards in Ihi principal lines <>i final
prod i the nit,
Merohsi
Small minor % nr.l- . i
( |i*lnliiit '
tonnage delivered
Naval ahipcoruti
Number of .hi]
Majoi
distribution "f naval ton-
.1 fr
-
8/3/2019 USSBS Report 48, Japanese Merchant Shipbuilding
http://slidepdf.com/reader/full/ussbs-report-48-japanese-merchant-shipbuilding 19/61
in the summer of 1942 thai unit modi-
the original official schedule by discontinu-
types !'•. C, F. and K and substituting type
for TS. Extensive changes in specifications
th<' six remaining types called for more
styling of the hull to facilitate produc-
as well as weaker construction; for ex-
wider spacing for members and elimi-
of double bottoms, and lighter engines
conserve materials and facilitate production.
sacrifice in speed and durability was
in the interest of increased production.
great bulk of wartime ship construction
liuili according to the specifications of this
By the end nf 1944 the Navy Technical Bu-
established a new set of ship designs
the lines of the hull and increasing
size of the engine. The change was intended
improve the ships' chances of eluding sub-
even if the rate of construction were
Tlie program to which the respective
types belonged came to be designated bj
1, 2, or •". to the letters designating
hull type; for example, 2TL is the 1.0,000-
tanker Unit according to the specifications
the Navy Technical Bureau's original pro-
The particulars on each of the standard
ships i- given in Appendix :!.
The establishment of a limited number of
type- of ships resulted in most ship-
in the reduction of the variety of ships
in any one period of time and therebj
a degree of specialization within the
of merchant construction. The degree
which the various shipyards confined their
ship construction effort to a few or
to one type of ship corresponded closely
the degree of specialization, in the respective
in merchant ship construction as against
other lin< of ship work. The higher order
specialization concerning the number of ship
built during the war was. like the other,
much further in the new yards.
For purposes of measuring specialization bj
of -hip built, differentiation is made only
tin- basic hull types. Some of the cargo
types, such as As and Es, were finished
tankers and at other times some tanker types
as TLs and T.Ms were finished as cargo
These variations and the different pro-
designations are not counted as distinc-types. Ships built during the war. but
721366 IT
before the final standardized program got un-
der way, may be typed roughly according to a
scale of S tonnage classes divided at 500, 1000,
2,000. 3,000, 5,000, 7.500 and 10.000 tons. Fish-
ing \i ssels, tugs and miscellaneous vessels, such
as dredges and power derricks, make 3 more
general types, giving a total of 24 categories
into which ships' hulls may be classified. Inas-
much as many of the nonstandard types were
similar to and predecessors of various stand-
ardized types, nonstandard ships of the same
tonnage class as standard ships built in the
same yard are not counted as a separate type.
In terms of the foregoing classification of
ships hulls, the degree of specialization by type
during the war is indicated in the following
schedule:
Diffcrentlhuirtypea buill
8/3/2019 USSBS Report 48, Japanese Merchant Shipbuilding
http://slidepdf.com/reader/full/ussbs-report-48-japanese-merchant-shipbuilding 20/61
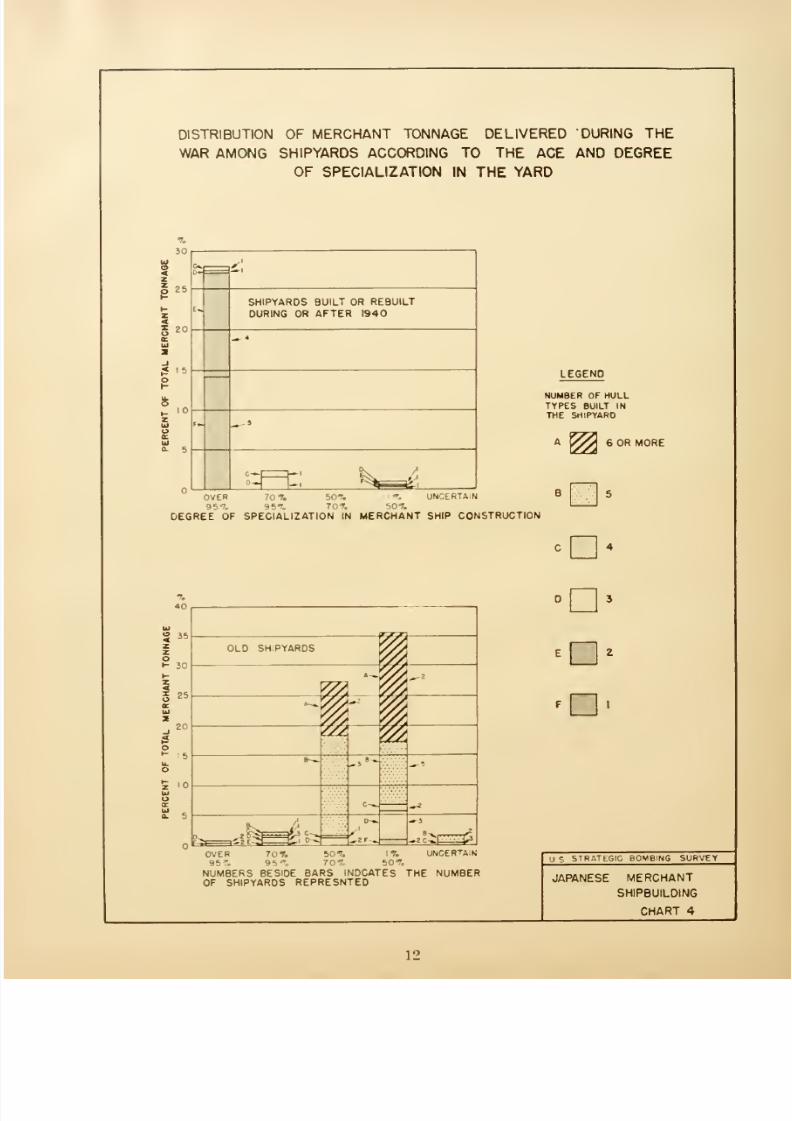
DISTRIBUTION OF MERCHANT TONNAGE DELIVERED DURING THE
WAR AMONG SHIPYARDS ACCORDING TO THE ACE AND DEGREE
OF SPECIALIZATION IN THE YARD
•Vj
8/3/2019 USSBS Report 48, Japanese Merchant Shipbuilding
http://slidepdf.com/reader/full/ussbs-report-48-japanese-merchant-shipbuilding 21/61
The other large producers of merchant ships
old yards, simultaneously and heavily en-
in naval ship construction or ship repair
conversion work. Furthermore, their mer-
ship building efforts were spread anion}?
or more types of ships.
Methods
The older shipyards of Japan built ships up
tin- keel on conventional end-launching'
ways. .Material was designed and fab-in the usual assortment of plate shops,
shops, forge shops, machine shops, car-
shops, pattern shops, etc. The yards
built their own ships engines were equipped
larger machine shops for the purpose.
These older yards were almost invariably
and not well organized for a smooth
of production. Their growth had been
hence, did not conform well to any
layout plan. The old yards, further-
were almost invariably seriously over-
Good sites for shipyards, expanses of
tlat land alongside deep water, are com-
limited in Japan because of the
of rugged terrain along the
The few places in Japan where consid-
flat area is adjacent to protected deep
are occupied by cities. Such expansion as
managed in the older yards, therefore, en-
either the creation of filled land in
sections of water front or the encroach-
on adjacent industrial properties for the
on the large city water fronts, whereas
other yards excavation and tunneling of
was involved. These means of expanding
for the yards were too expensive for
acetime purposes and too slow for wartime
hence most of the expansion under-
in the old yards either increased the
in the old area or was still incom-
when the war ended.
Taken together, the congestion and the lack
specialization in the old yards made a syste-
smooth, controlled flow of work prac-
impossible. Hence, there was an inevit-
preoccupation with this or that particular
from time to time resulting in erratic
in many of the yards, in the building
required for different ships of the same
similar type.
The shipyards which had been built or re-
during or immediately before the war not
held the advantage of a high degree of
specialization but also went far in a nig the
handicap of congestion. The four E-ship build-
ers were designed as complete operating units
before ground was broken and sites were se-
lected that provided adequate ground space
from the outset. The Koyogijima yard had the
usual rugged terrain to contend with, but inas-
much as its reconstruction was started in 1940,
time was available for considerable hill cutting
and tunneling for its new facilities.
Among the new yards, the full advantages
of planned layout and high specialization were
most nearly realized by the yards employing
modern ship-building procedures. Instead of
the conventional piecemeal construction on
single-position building ways, four of these new
yards built their ships in multiposition stages
either on rails or in drydocks and employed
block preassembly at least to some degree. The
advantage of the use of these techniques is in-
dicated by the fact that the one of the four
large scale producers of the 880-ton E-type
ship which employed the conventional single-
position techniques averaged 90 days each in
building 115 ships, while the other 3 yards took
an average of 34, 37, and 67 days to build 163,
154 and 136 ships, respectively.
The Koyogijima yard was the only yard
building ships over 1,000 tons which made any
fundamental departure from the traditional
shipbuilding procedures. The principal feature
of its reconstruction beginning in 1940 was the
building of a large graving dock capable of
handling two A-type ships abreast in three
different stages of construction, each stage
being in separate compartments. In the use
of block preassembly, welding and other mod-
ern techniques the Koyagijima yard did not dif-
fer materially from the other major yards. The
Kanagawa yard at Hitachi was designed to
include a similar building dock for A-type ships
but was started too late (1944) to be broughtinto volume production before the end of the
war. The failure to build or rebuild other large
ship producing yards before the war or in its
early stages reflects a lack of technological
imagination on the part of Japanese shipbuild-
ers and policy makers. This may have been
partially due to the preoccupation of most of
the leading shipbuilders with the heavy naval
construction program.
Welding was not highly developed in Japan-
ese shipbuilding. Even in the few yards pro-
13
8/3/2019 USSBS Report 48, Japanese Merchant Shipbuilding
http://slidepdf.com/reader/full/ussbs-report-48-japanese-merchant-shipbuilding 22/61
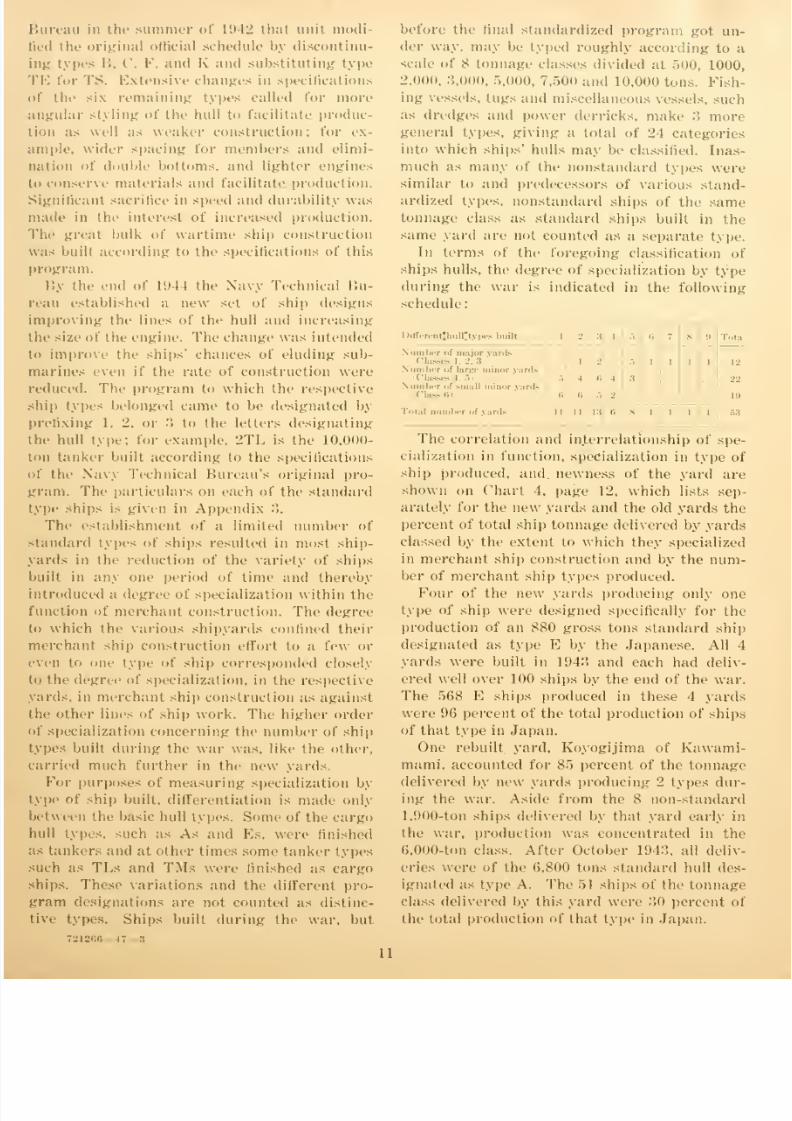
INOEX OF TOTAL
GROSS FLOOR SPACE(1941 = 100)
1941- 100
1942-111
1943- 146
1944- 170
1945- 178
EXPANSION OF COMMERCIAL SHIPYARDS DURING THE WAR
35 n
30
t-uj 25-ul
u.
20-Ul
K<
in
10zo
i 5 H
s
GROSS* FLOOR SPACE AT
END OF EACH FISCAL YEAR.
%93/1
(//,
I'A
L79/
/a
INDEX OF TOTAL
WAY LENGTH(1941.100)
1941- 100
1942-104
1943- 120
1944- 126
1945-126
* DOES NOT REFLECT REDUCTION DUE TO AIR ATTACKS
70-
60-
K 50
HI
I30
M
o 20-
x
10-
WAY LENGTH AT
END OF EACH YEAR
I1
i
NEW SHIPYARDS
(BUILT IN OR
AFTER 1940)
b7 5 A
iJiJi
OLD SHIPYARDS
1941 1942
INOEX OF TOTAL
EMPLOYMENT(1941.100)
1941-100
1942-129
I943-IB8
1944-226
1945-185
300-1
S 1
£ 250-(
o
a. 200-ZUl
150-o
1 ,00i
oi 50-t-
AVERAGE MONTHLY
EMPLOYMENT DURING
EACH FISCAL YEAR.
,9 8/ i1941 1942 1943 1944 1945
NUMBERS IN BARS REFLECT PERCENTAGE DISTRIBUTION OF TOTAL
BETWEEN OLD AND NEW SHIPYARDS.
US STRATEGIC BOMBING SURVEY
JAPANESE MERCHANT
SHIPBUILDING
CHART 5
11
8/3/2019 USSBS Report 48, Japanese Merchant Shipbuilding
http://slidepdf.com/reader/full/ussbs-report-48-japanese-merchant-shipbuilding 23/61
ducing the E-type ships the use of welding
varied from 50 to To percenl of all seams and
connections. For the larger type ships in the
large yards the percentage of welding ranged
from 10 to l"> percent, was generally about 30
percent. Only the simplest types of welding
were attempted. Large sect inns were always
riveted to avoid locked-in .-tresses.
1
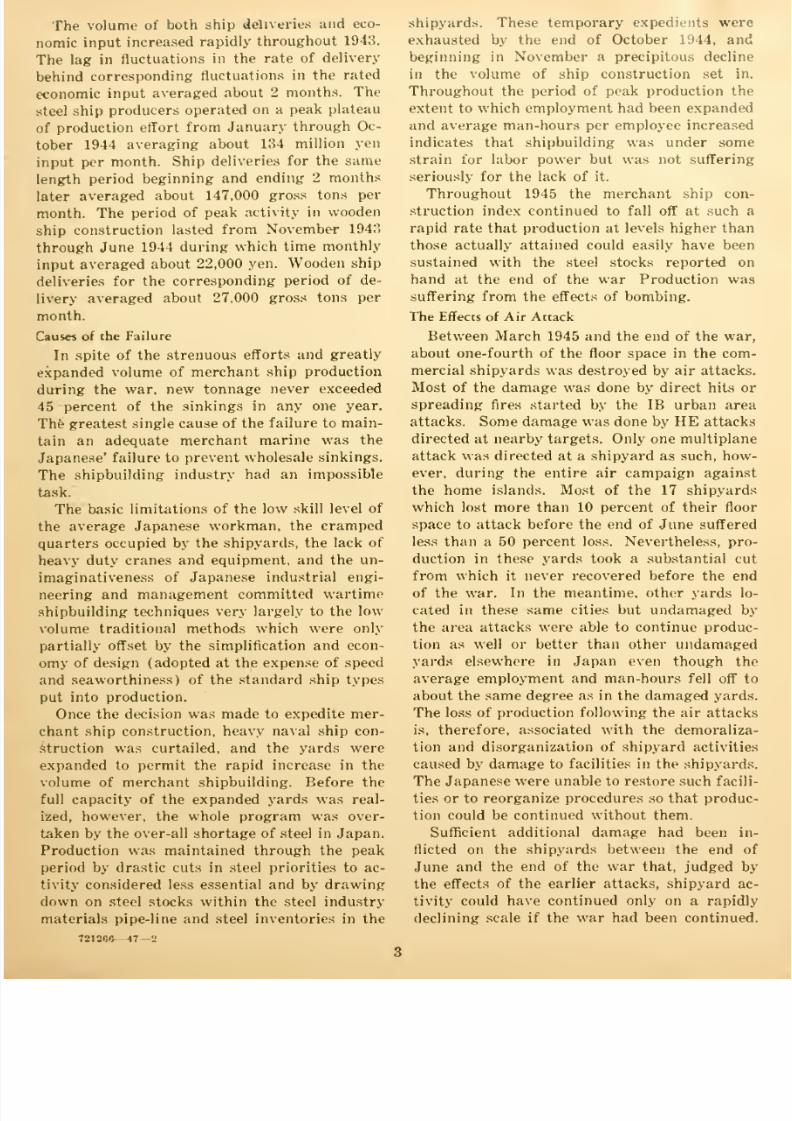
icpansioo and Changes Duringthe War
The Japanese delayed any important expan-
sion of their commercial shipyards for more
than a year after the outbreak of the war. The
industry increased by about one-third in 1943,
however, and substantia] new construction con-
tinued to the end of the war.
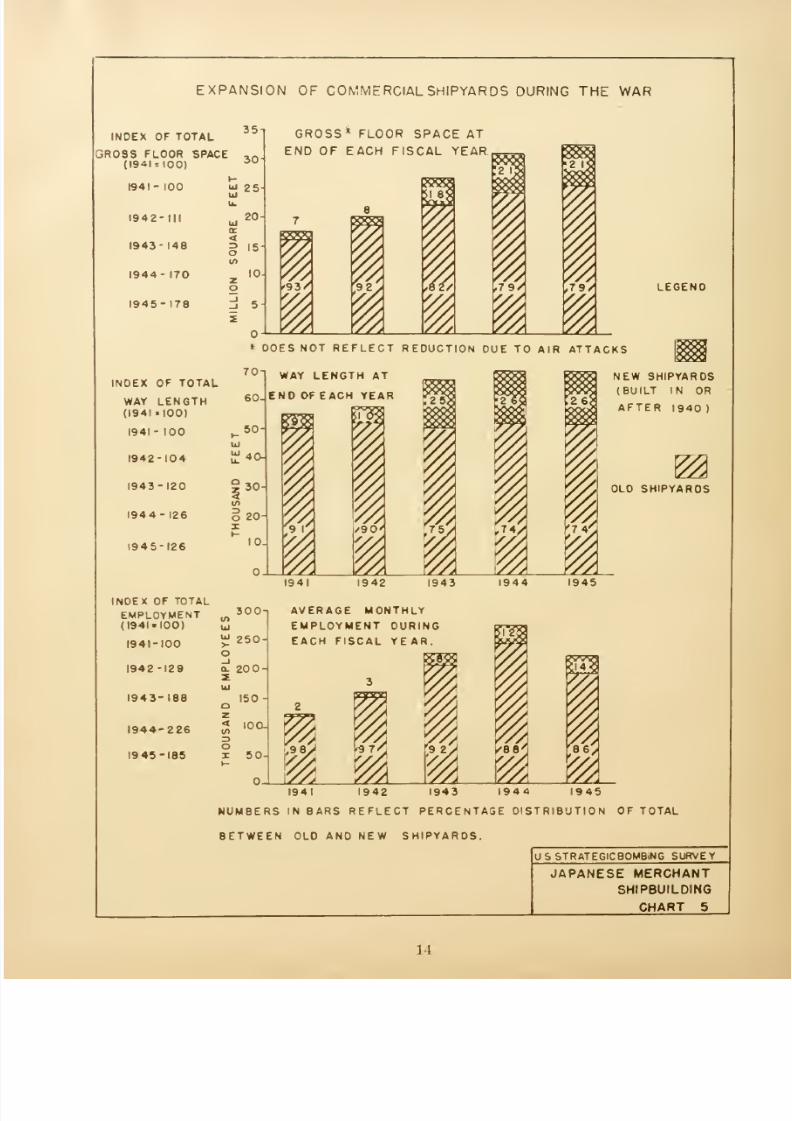
The extent to which the wartime expansion
was accomplished by the construction of new
yards as against the expansion of old yards is
best indicated by the distribution between them
of the increase in floor space and average em-
ployment. Of the new floor space built between
31 March 1942 and lo August 1945, 39 percent
was built in new yards started during or after
1940. The other 61 percent was built in the
older yards. The difference between the average
monthly employment in the fiscal year 1941 and
that of the wartime portion of the fiscal year
1945 was divided 28 percent in the new yards
and 72 percent in the old yards. Roughly one-
third of the increase in the dedication of thewhole economy to commercial shipyards took
the form of altogether new yards. The balance
went into the enlargement and strengthening
of the old yards.
The trends of total floor space under cover,
of total length of shipbuilding ways and of
average employment from time to time give
together a fair indication of the trend of pro-
duction capacity. Chart 5, page 14, shows the
totals of the first two of these items as of the
end of each fiseal year during the war and-how- average monthly employment for each
fiscal year. The chart shows the distribution in
each instance between the old yards and the
new yards which include all yards and construc-
tion of which was commenced during 1940 or
thereafter. There were 15 such yards distrib-
uted 5 each in (Masse- 1. :>. ami 6.
The Moor space represented on Chart 5 is the
total floor space constructed by the Japanese
less that removed by them. It does not reflect
the amount of floor space damaged or destroyed
by allied air attacks. Exact data an not avail-
able, but a considerable portion of he expan-
sion in floor space, especially in the older larger
yards, was in the form of dormitories and mess
halls for the large number of conscripted labor-
ers brought in to the shipyards during the war.
In the older yards most of the increase in plant
buildings were new machine shops and engine
making facilities.
Centralization of Control
Before the war there was little direct gov-
ernment control of shipbuilding. Subsidization
of ship construction and of the operating ship
lines which ordered the new ships gave the
government only an indirect voice in the ship-
building program. When war broke out the
.Ministry of Transport and Communications,
which had jurisdiction of shipbuilding inspec-
tion and repair, established over-all shipbuild-
ing plans covering the scheduled production for
all shipyards. In the period between the begin-
ning of the war and the end of March, four
different schedules indicating what each ship-
yard was expected to build were issued from
time to time. The fourth one, dated 25 March
1942, was the first to be issued after the adop-
tion of the first standardized ship program and
was, therefore, the first plan to include stand-
ardized ships.
To facilitate control of matters related toshipbuilding, the Transport and Communica-
tions Ministry established the Shipbuilding and
Repair Control Association (Toseikai) in Jan-
uary of 1942. It included all important ship-
builders, engine-makers, auxiliary and fittings
makers, and associations of wooden shipbuild-
ing yards and of small components manufac-
turers. The association administered the sched-
uling of ship repairs, and for new construction
acted as a clearing house between the govern-
ment and the industry in maintaining schedules,
fixing prices, standardizing specifications for
ships and components and procuring compon-
ents and labor.
Contracts with the shipyards for new ships
were made through the wholly-owned govern-
ment Industrial Equipment Corporation which
in turn sold the ships to the ship operators to
whom they had been allocated by the govern-
ment. The sale of the ships was at the sched-
uled standard cost established for all standard
ship types. Shipyards were indemnified by the
15
8/3/2019 USSBS Report 48, Japanese Merchant Shipbuilding
http://slidepdf.com/reader/full/ussbs-report-48-japanese-merchant-shipbuilding 24/61
Equipment Corporation for allowable costs in-
curred in excess of the standard.
By summer of 1942 it became apparent that
progress in merchant ship construction was
inadequate. For several years the navy had
engaged a progressively greater proportion of
the shipbuilding capacity for its own building
program. Both the army and navy took in-
creasingly larger shares of the available raw
materials and labor force leaving progressively
less for merchant ship construction. And the
program established by the Communications
Ministry involved too many types and was too
loosely administered to accomplish even the
best results possible under the circumstances.
In July 1942, responsibility for the construc-
tion of steel ships of more than 50 meters in
length was therefore transferred to the navy
department, where a merchant ship section was
created under the Navy Technical Bureau
(Konsei Hombu). The authority and respon-
sibility for allocating raw materials among
shipyards was also vested in the Bureau. Later,
responsibility for all steel ship construction.
repair and inspection was transferred to the
Navy. The Navy Ministry was further directed
to assist the Communications Ministry in the
procurement of engines for the wooden ships,
the construction of which remained under the
jurisdiction of the Communications Ministry
throughout the war.
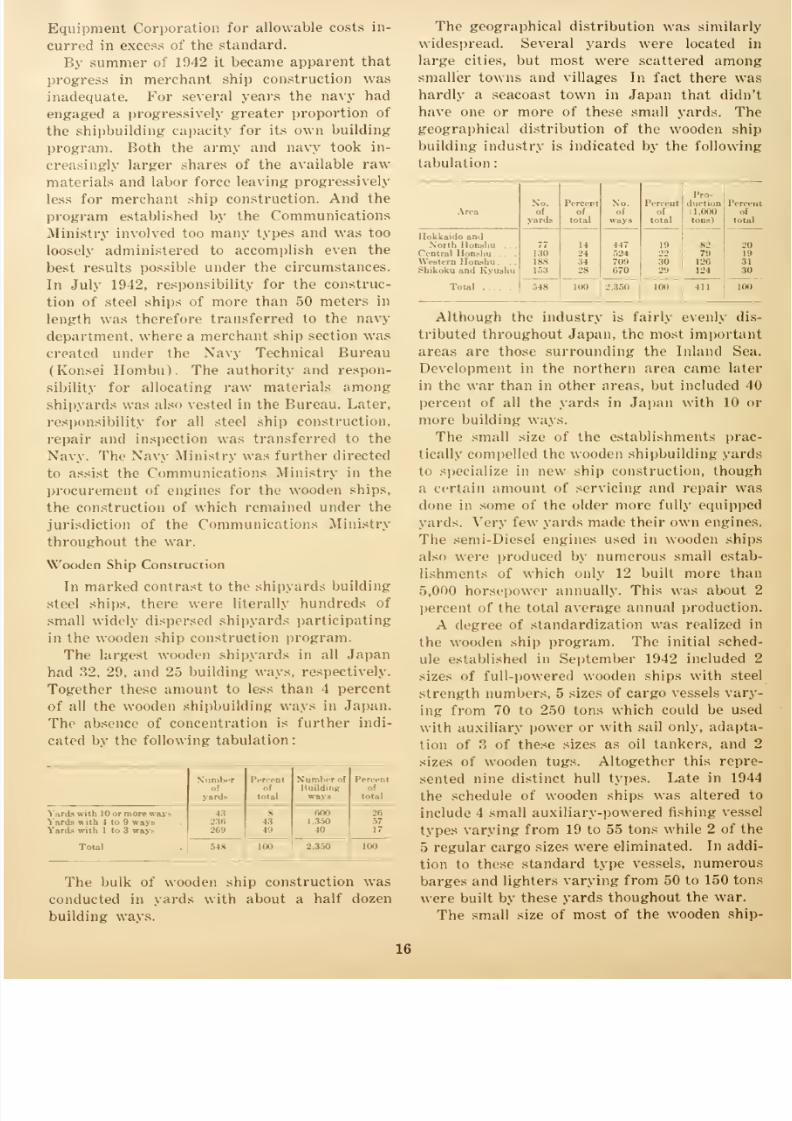
Wooden Ship Construction
In marked contrast to the shipyards building
steel ships, there were literally hundreds of
small widely dispersed shipyards participating
in the wooden ship construction program.
I'lir largest wooden shipyards in all Japan
had 32. 29, and 25 building ways, respectively.
Together these amount to less than 4 percent
of all the wooden shipbuilding ways in Japan.
The absence of concentration is further indi-
cated by the following tabulation:
8/3/2019 USSBS Report 48, Japanese Merchant Shipbuilding
http://slidepdf.com/reader/full/ussbs-report-48-japanese-merchant-shipbuilding 25/61
building yards resulted automatically in a high
• of specialization as to type of ship pro-
duced in a given yard. The techniques were
entirely traditional and were simple enough to
be \\ ithin the skill of the average Japanese car-
penter, which is generally Rood. As a large
proportion of the yards and an even larger pro-
portion of the workmen were newi ip work,
systematic instruction in the construction of
the standard types was undertaken by the Min-
istry of C tunication and Transportation
which had the over-all administrative responsi-
bility tor wooden ship construction through the
war.
i\. niMwnsoN mm miiimh ii.ding indi'siry
Shipping Needs
The wartime demand on shipyards for new
merchant ship tonnage depends on the prospect
that the tonnage afloat can, in the forseeable
future, meet the demand for overseas transpor-
tation. The prospective adequacy depends on
the existing amount of tonnage afloat, prospec-
ti\e losses, and the average ship performance
that can lie expected under forseeable operating
conditions taking into account the capabilities
and condition of the ships, the necessity for
convoying, circuitous routing, and similar mat-
ters. The prospective demand for overseas
transportation is twofold. To the extent that
military operations are overseas, initial move-
ments and supply maintenance must be pro-
vided by shipping. To the extent that the civil-
ian economy in each separate land mass is not
self-sufficient, either for its own maintenance or
for the required war production, raw materials
and processed goods must be shipped. The
demand for shipping on the part of both mili-
tary and civilian requirements depends not only
on the tonnage of such traffic but also the dis-
tances involved.
The heavy demand for shipping when the
Japanese were prosecuting aggressive warfare
in the Solomons and the Central Pacific is
brought out in the report of the Military Analy-
sis Section of the Survey. The utter lack of
self-sufficiency of the home economy in Japanproper in such vital respects as coal, iron, oil,
bauxite, and food is brought out in the report
of the Transportation Section of the Survey.
Afl Japan moved from a peacetime to a wartime
economy her relative lack of self-sufficiency in
the home islands increased because the shift
increased the relative importance of the de-
mand for precisely the raw materials which
she lacked at home.
The shift toward a wartime economy began
with the China incident in 1937 and acceler-
ated steadily up to and after the outbreak of
the war. The shift to a total war economy was
not fully realized until 1943. Hence on this
score alone, there was an ever increasing de-
mand for shipping from 1937 through 1943.
The preparation of an estimate of the ship
tonnage required to sustain the Greater East
Asia Co-prosperity economy at various as-
sumed levels and under various assumed war
circumstances would require quantitative esti-
mates of shipping needs which are beyond the
scope of this paper. It may be said, however,
that in view of the great increase in the de-
mands for shipping with the advent of war. the
adequacy of the Japanese merchant marine on
Pearl Harbor Day (including subsequent seiz-
ures and captures) to meet the demand for
shipping is doubtful. It has already been
pointed out that conversion to a total, war econ-
omy, entailed increased demands for shipping,
continued into 1943. Not until Japan gained
the extremely questionable advantage of short-
ened trip distances by being cut off from the
southern regions was there any appreciable
reduction in the economic demand for shipping.
Not until she ceased to attempt the defense of
outlying islands was there an appreciable
decrease in the military demand.
Shipping Available
Practically every one of the dynamic factors
affecting the availability of ton-mile overseascarrying capacity except new construction oper-
ated negatively for the Japanese throughout
the course of the war. Sinkings took progres-
sively higher percentages of her tonnage afloat;
time-consuming defense practices such as trav-
eling in convoy, circuitous routing, and travel-
ing only at night became more and more essen-
tial; the condition of the ships deteriorated as
a result of heavy usage and undermaintenance;
and as the composition of the merchant marine
changed with the slower, less seaworthy war-
17
8/3/2019 USSBS Report 48, Japanese Merchant Shipbuilding
http://slidepdf.com/reader/full/ussbs-report-48-japanese-merchant-shipbuilding 26/61
time standard types partially replacing prewar
ships, the average capabilities of the existing
tonnage declined.
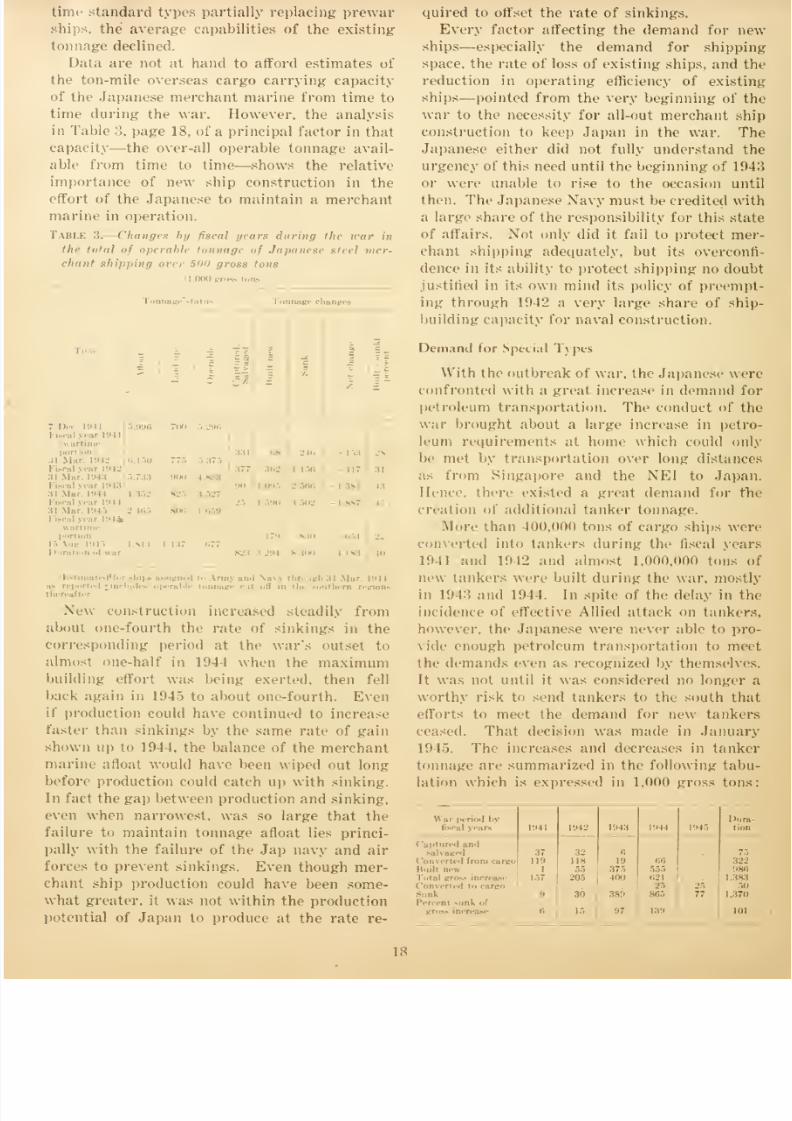
Data are not at hand to afford estimates of
the ton-mile overseas cargo carrying capacity
of the Japanese merchant marine from time to
time during the war. However, the analysis
in Table 3, page 18, of a principal factor in that
capacity—the over-all operable tonnage avail-
able from time to time—shows the relative
importance of new ship construction in the
effort of the Japanese to maintain a merchant
marine in operation.
I'miik :;. -Changes by fiscal years liming flu- war in
tit,- iniiil of operabU I 1 mer-
chant shipping over SOO gross tons
8/3/2019 USSBS Report 48, Japanese Merchant Shipbuilding
http://slidepdf.com/reader/full/ussbs-report-48-japanese-merchant-shipbuilding 27/61
Fortunately for the Japanese petroleum posi-
effective Allied attack on tankers was slow
n developing in spite of the preference of all
for tanker targets. Actually the Allied
orces thought they were sinking tankers. Per-
aps thej were somewhat misled by the fad
all of the wartime standard ships, cargo
well as tanker, were of the stacks aft design
considered characteristic of tankers
A- the volume of freight increased on the
railroads the demand for railroad
ferry service increased, especially on the
Hakodate-Aomori run connecting Hokkaido
Honshu. As this service was vital for
import of food and coal for Honshu, the
on these facilities grew steadily
the war and made the construction
additional ferries urgent.
Even in peacetime the Japanese had always
ade considerable use of small vessels of less
500 gross tons—both steel and wood.
vessels were used extensively in the all-
importanl coastwise trade, especially in the
Inland Sea. and made up a substantial propor-
ion of the large Japanese fishing fleet.
During the war new demands for these small
materialized rapidly. A considerable part
the larger ship tonnage previously engaged
n coastwise trade in Japan was diverted to
eas traffic. At first most of the traffic
had handled was transferred to the rail-
oads. As the railroads approached the satura-
point, the demand arose for large quan-
ities of small vessels, particularly auxiliary
powered wooden sailing ships traveling either
or in tows. Many of the better pre-
ar small vessels were themselves requisitioned
y the armed forces for use in conducting the
island warfare in the south and central Pacific.
ie air attack on shipping became felt in
home waters, the advantages of small vessels in
being a more dispersed target and being less
likely to explode mines increased the premium
n the use of this type of shipping and increased
the demand for their construction.
Certain special types of small vessels also
were needed urgently. New tugs, both for use
of the military and for handling the increased
volumes of port activity throughout greater
Ka-t Asia, were needed continuously. When
fond import-became
seriously impaired in the
latter phases of the war the premium on the
construction of small fishing rose
accordingly.
Diversionar) Demands tor Naval Construction
Mention has already been made of the limi-
tation of the construction of merchant ship
tonnage in the early stages of the war imposed
by the large amount of heavy naval ship con-
struction done in the commercial yards through
1942. Keels were laid in the commercial yardsfor the battleship Musashi, six aircraft car-
riers, and three cruisers from time to time
during the 4 years preceding the war. Two of
i In cruisers were delivered in 1940, two car-
riers and one cruiser were completed before
the war in 1941, the battleship and two carriers
were delivered in 1942, and two carriers in
1943. Three large carriers were started during
the war, in October 1942, April and July 1943,
respectively. The first was delivered in August
1944 and the other two never were completed.
Three more carriers were on the schedule of
the Nagasaki-Mitsubishi yard— the first of
which was to be started in October 1943—but
all three were canceled. The great bulk of the
heavy naval ship construction program for the
commercial yards was carried over from the
years immediately preceding the outbreak of
the war. Not until after July 1943, however,
did the navy cease to order large ships from the
commercial yards.
Three commercial yards were involved in
the construction of these ships. The battleship
and five carriers were built at the Nagasaki
yard, four carriers at the Kobe-Kawasaki yard
and the cruisers at the Yokohama-Mitsubishi
yard. The existence of a substantial diversion-
ary effect of this heavy naval ship construction
is shown by the comparison of the merchant
tonnage production of these three yards with
the production of all other commercial yards
in operation throughout the same period.
8/3/2019 USSBS Report 48, Japanese Merchant Shipbuilding
http://slidepdf.com/reader/full/ussbs-report-48-japanese-merchant-shipbuilding 28/61
was diverted without the construction of com-
pensating new merchant shipbuilding capacity
does, however, manifest a preoccupation on the
part of the navy with its own expansion pro-
gram.
With the conclusion of most of the work on
large fleet units in 1942 the dislacement ton-
nage of combatant naval ships delivered from
the commercial yards receded from 149,000 to
81,000 tons in the fiscal year 1943. The prin-
cipal items in the latter year were coast de-
fense ships (22.000 tons), destroyers (19,000
tons) and submarines (17,000 tons). In 1944
the production of destroyers in the commercial
yards declined somewhat, while submarine pro-
duction increased. The greal increase in the
tonnage of combatant ships (MS.ooo tons total
in 1044) came in the coast defense vessels;
82,001) tons of tlii- class of ship were delivered
from the commercial yards.
Of the L69 coasl defense ships built by the
Japanese during the war. 154 or 91 percent
were built by the commercial yards. While 11
commercial yards participated in this program,
80 percent of the total produced in commercial
yards came from major yards simultaneously
building A -type cargo ships or Tl.-ij pe tankers.
The choice lay between building more merchant
tonnage or sacrificing thai and building more
of these Kaibokan with the hope of keeping
existing merchant tonnage afloat No available
evaluation of their effectiveness is sufficiently
specific to permit an estimate of the tonnage of
merchant shipping saved by these ships. As an
antisubmarine weapon their speed (16.5 to L9
knots) was low and their durability had its
limitation. During 1944 the Kaibokan construc-
tion schedule for several yards was curtailed or
canceled and destroyers scheduled in their place.
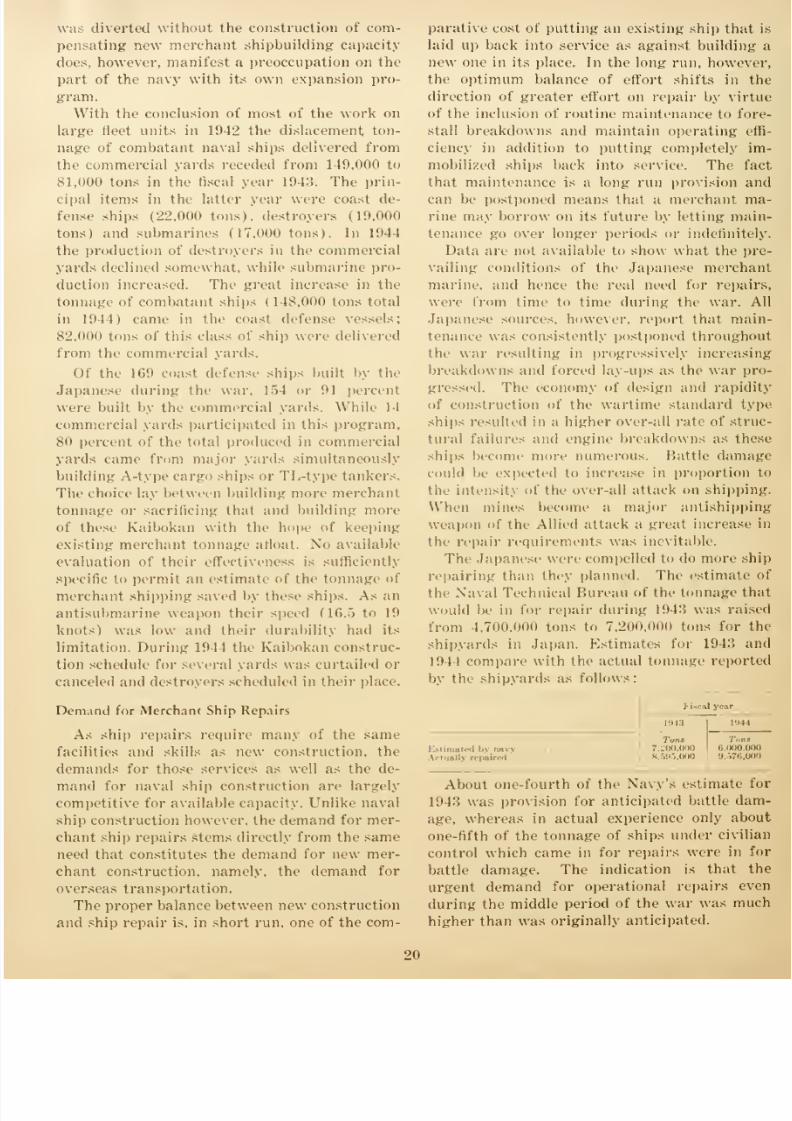
Demand for Merchant Ship Repairs
As ship repairs require many of the same
facilities and skills as new construction, the
demands for those service's as well as the de-
mand for naval ship construction are largely
competitive for available capacity. Unlike naval
ship construction however, the demand for mer-
chant ship repairs stems directly from the same
need that constitutes the demand for new mer-
chant construction, namely, the demand for
overseas transportation.
The proper balance between new construction
and ship repair is, in short run, one of the com-
parative cost of putting an existing ship that is
laid up back into service as against building a
new one in its place. In the long run, however,
the optimum balance of effort shifts in the
direction of greater effort on repair by virtue
of the inclusion of routine maintenance to fore-
stall breakdowns and maintain operating effi-
ciency in addition to putting completely im-
mobilized ships back into service. The fact
that maintenance is a long run provision and
can be postponed means that a merchant ma-
rine may borrow on its future by letting main-
tenance go over longer periods or indefinitely.
Data are not available to show what the pre-
vailing conditions of the Japanese merchant
marine, and hence the real need for repairs,
were from time to time during the war. All
Japanese sources, however, report that main-
tenance was consistently postponed throughout
the war resulting in progressively increasing
breakdowns and forced lay-ups as the war pro-
gressed. The economy of design and rapidity
of const ruction of the wartime standard type
ship.- resulted in a higher over-all rate of struc-
tural failure- and engine breakdowns as these
-hip- become more numerous. Battle damage
Could I"' expected to increase in proportion to
the intensity of the over-all attack on shipping.
When mines become a major antishipping
weapon of the Allied attack a greal increase in
the repair requirements was inevitable.
The Japanese were compelled to do more ship
repairing than they planned. The estimate of
the Naval Technical Bureau of the tonnage that
would lie in for repair during 101". was raised
from 1,700,000 tons to 7.200,000 tons for the
shipyards in Japan. Estimates for 194:? anil
1944 compare with the actual tonnage reported
by the shipyards as follows:
8/3/2019 USSBS Report 48, Japanese Merchant Shipbuilding
http://slidepdf.com/reader/full/ussbs-report-48-japanese-merchant-shipbuilding 29/61
The progressive increase in the percentage
of tonnage afloat that was laid up for repair
from time to time indicates the over-all effecl
of the policy of deferring maintenance in the
early stages of the war. the decline in the aver-
[uality of the merchant marine, and, par-
ticularly at the end, the effecl of battle damage
and general demoralization. The percentage
relationship of tonnage laid up to tonnage afloal
nil thedates
showninTable 3, page
isare
listed
below. The shipping cut <>fT in the smith amount-
ing to 184,000 tons on both 1945 dates is de-
ducted fn m both the tonnage afloat and ton-
nage laid up before the relationships are com-
puted for those dates.
7 December 1941
8/3/2019 USSBS Report 48, Japanese Merchant Shipbuilding
http://slidepdf.com/reader/full/ussbs-report-48-japanese-merchant-shipbuilding 30/61
PLANNED AND ACTUAL MONTHLY AVERAGE RATE
OF DELIVERIES OF TANKERS AND OTHER
MERCHANT SHIPS BY FISCAL YEARS
8/3/2019 USSBS Report 48, Japanese Merchant Shipbuilding
http://slidepdf.com/reader/full/ussbs-report-48-japanese-merchant-shipbuilding 31/61
plans were made. Bui for reasons which will
be examined later, production even a1 its peak
was considerably below the scheduled volume.
The third failure of the Japanese was the
precipitous decline in production in 1945, which
came with the general decline and demoraliza-
tion of all Japanese industry. That the failure
was much worse than had been anticipated is
shown by a comparison of the production plan
of April 1945 with actual production in that
year.
Representing as it dors the effort of the
Japanese planners to adjust merchant ship
production schedules to the decelerating pace of
Japanese industry, the plan of April 1945 is of
peculiar interest. The plan covered only the
first !i months of fiscal 1945. All previous plans
had covered at least a year in advance; some
had covered four. Also unlike the others, this
planset
up twodifferent goals.
A"primary"
goal of 567,000 tons was scheduled for approx-
imate completion in 6 months. The completion
of this program was considered absolutely es-
sential. A "secondary" goal of 666,000 tons
represented the continuation of the schedules
through most of the first 9 months of the fiscal
year. This objective was to be achieved if
materials were available. The comparison of
the actual average monthly rate of production
en 1 April and 15 August 1945 with the
corresponding rate scheduled in the April plan
shows deliveries for the period to have been
less than half the amount scheduled.
Tanker deliveries appear to have done better
at meeting schedules than other types of mer-
chant ships. The apparent superiority reflects
the higher priority assigned to tankers from
December 1942 to January 1945. The priority
was implemented by the assignment of tanker
construction to what were considered the most
reliable shipyards and when production began
to lag, previously scheduled cargo ship produc-
tion was rescheduled for completion as tankers.
The effect of the decision in January 1945 to
discontinue tanker production because of the
impossibility of continuing traffic with the
southern region is shown by the plans for 1945
announced in February and April 1945 and
completely confirmed by the fact that no tanker
tonnage at all was delivered in 1945.
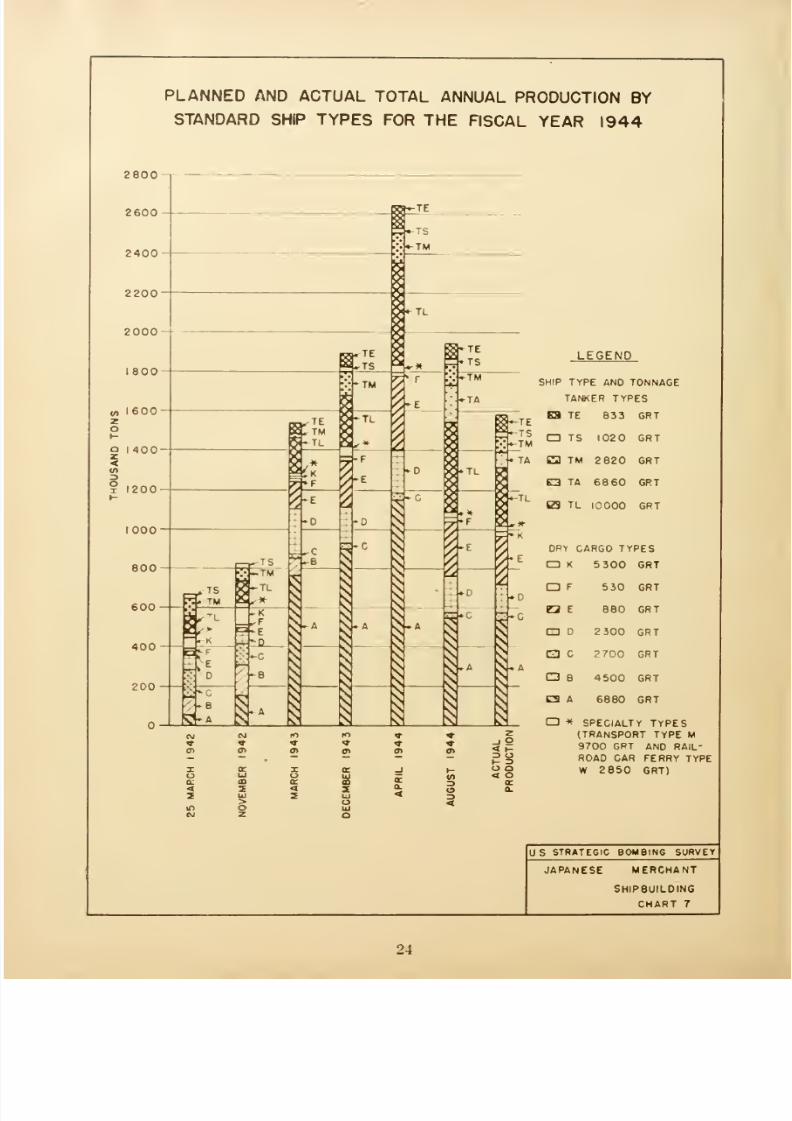
Planned and Actual Deliveries by Standard
Ship Type
Comparison of the relative importance of the
721266 47—5
different ship types in the various plans and in
the actual production for the fiscal ear 1944
summarizes the evolution of the importance of
the various types and, to a limited extent, re-
flects their relative performance in meeting
schedules. Plans for 1944 made in the early
years reflect the relative emphasis on the vari-
ous types then under construction except that
tandard ships, having been completed, have
disappeared from the schedules for 1944. Since
the wartime production peak was passed during
1944, the comparison of actual production to
lieak level schedules point out the ship types in
which hopes and disappointments were great-
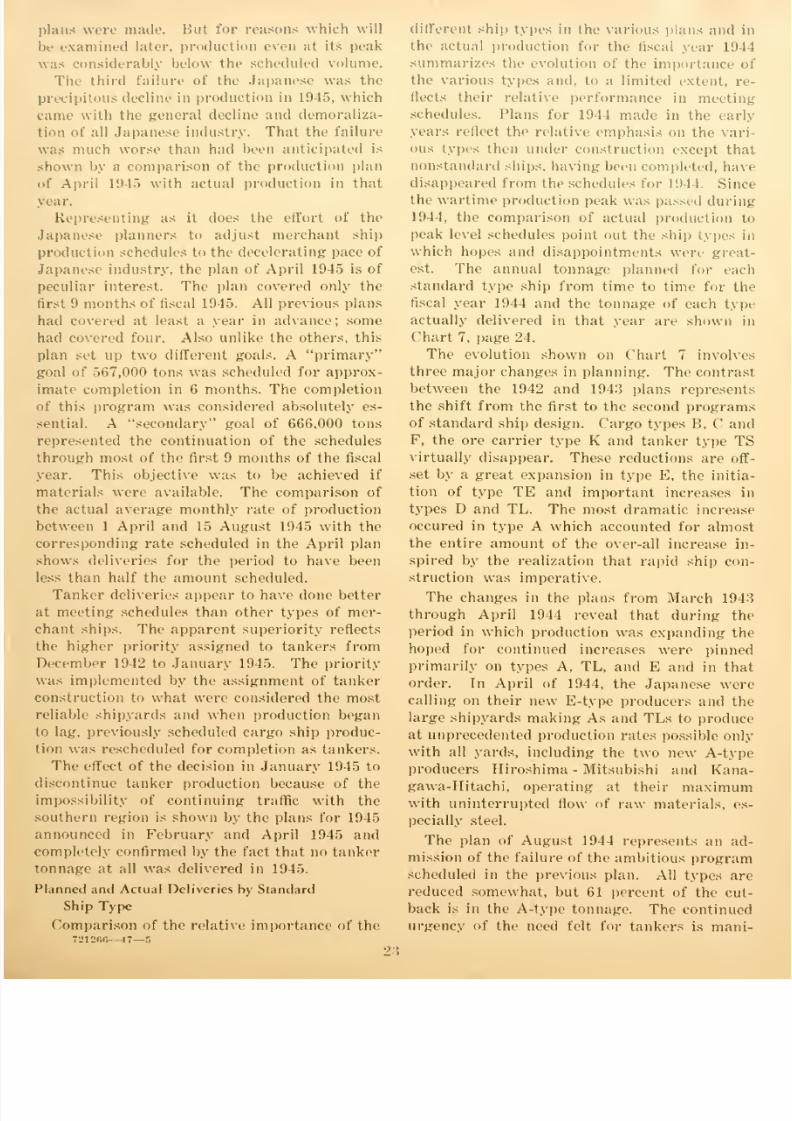
est. The annual tonnage planned for each
standard type ship from time to time for the
fiscal year 1944 and the tonnage of each type
actually delivered in that year are shown in
Chart 7, page 24.
The evolution shown onChart
7 involves
three major changes in planning. The con! rast
between the 1942 and 1943 plans represents
the shift from the first to the second programs
of standard ship design. Cargo types B, C and
F, the ore carrier type K and tanker type TSvirtually disappear. These reductions are off-
set by a great expansion in type E, the initia-
tion of type TE and important increases in
types D and TL. The most dramatic increase
occured in type A which accounted for almost
the entire amount of the over-all increase in-
spired by the realization that rapid ship con-
struction was imperative.
The changes in the plans from March 194.">
through April 1944 reveal that during the
period in which production was expanding the
hoped for continued increases were pinned
primarily on types A, TL, and E and in that
order. In April of 1944, the Japanese were
calling on their new E-type producers and the
large shipyards making As and TLs to produce
at unprecedented production rates possible only
with all yards, including the two new A-type
producers Hiroshima - Mitsubishi and Kana-
gawa-Hitachi, operating at their maximumwith uninterrupted flow of raw materials, es-
pecially steel.
The plan of August 1944 represents an ad-
mission of the failure of the ambitious program
scheduled in the previous plan. All types are
reduced somewhat, but 61 percent of the cut-
back is in the A-type tonnage. The continued
urgency of the need felt for tankers is mani-
23
8/3/2019 USSBS Report 48, Japanese Merchant Shipbuilding
http://slidepdf.com/reader/full/ussbs-report-48-japanese-merchant-shipbuilding 32/61
PLANNED AND ACTUAL TOTAL ANNUAL PRODUCTION BY
STANDARD SHIP TYPES FOR THE FISCAL YEAR 1944
LEGENDSHIP TYPE AND TONNAGE
TANKER TYPES
TE 833 GRT
TS 1020 GRT
a TM 2820 GRT
Q TA 6860 GRT
BS TL 10 000 GRT
ORY CARGO TYPES
CD K 5 300 GRT
530 GRT
880 GRT
2 300 GRT
2700 GRT
4500 GRT
6880 GRT
* SPECIALTY TYPES(TRANSPORT TYPE M
9700 GRT AND RAIL-
ROAD CAR FERRY TYPE
W 2 850 GRT)
US STRATEGIC BOMBING SURVEY
JAPANESE MERCHANT
SHIPBUILDING
CHART 7
24
8/3/2019 USSBS Report 48, Japanese Merchant Shipbuilding
http://slidepdf.com/reader/full/ussbs-report-48-japanese-merchant-shipbuilding 33/61
by the fact that in spite of the large
in A-type hulls. 26 percent of the
ships scheduled in August were to be
as tankers. Similarly, in spite of an
percenl reduction in all type E's, the number
be finished as tanker-type TE is increased.
The decision in January 1945 to cancel the
construction program resulted in a
declining rate of tanker delivery in the
quarter of the fiscal year. Hence, a com-
among types of the degrees to which
achieved scheduled production must omit
period. The percentage by which three-
of the annual production scheduled in
August plan was met at the end of the third
of the fiscal year 1944 CM Dec. 1944)
shown in the following tabulation for ship
involving more than 20.000 tons actual
in that period.
ypes:
Tankrr types:
/'. r, , ill
A TL 67
I) TA . 58
E '.'-' TM 01
TE 99
As among the cargo types, the fact that the
showing is made by type D is un-
a reflection of the fact that this type
produced in small numbers by a substan-
number of tin- larger minor yards. Fifteen
yards built type I) ships, no one of
delivered more than 15 ships of this type
the entire war.
The Matsunoura-Harima yard, which built
of the type TE ships, not only did better
the "> type E cargo ship builders in point
keeping up to schedule, but also produced
-hips in fiscal 1944, while the other yards
producing 111. 82. and 71 ships, respec-
The construction of E-type tankers had
assigned to the best yard. Similarly the
of type TM, approximately the
size ship as cargo type D, had been as-
almost exclusively to major yards —the superior performance.
'flu- failure of type TL production to exceed
the volume scheduled in August,
type A cargo came within 93 percent of
reflects the desperate tanker position
Japanese found themselves during this
That they felt the position to be des-
is confirmed by the decision in the
plan to order a number of the scheduledships completed as tankers. Two fac-
onl ribute to 1 lie apparent r^i in per-
formance on TLs and A cargo si
The large tankers were assigned to (he four
most heavily equipped commercial yards in
Japan—Nagasaki and Yokohama yards of Mit-
subishi, Kobe - Kawasaki and Aioi-Harima.
These yards were at the same time heavily en-
gaged in the construction of naval ships and
other types of merchant ships. Th. :; major
yards which built 72 percent of the A-type
ships during the war. Kovagijima-Kawamin-
ami, Tamano-Mitsui, and Kobe-Mitsubishi, con-
centrated much more exclusively on this one
type ship and hence were better able to meet
their schedules.
The other factor contributing to the con-
trast makes the difference in performance seem
more apparent than real. Because of the
greater intensity in the demand for tankers
throughout this period, the scheduled produc-tion of large tankers was raised much more
readily and was lowered much more reluctantly
than the schedules for the large cargo ships.
This is shown in the following relationships of
tonnages scheduled in the various plans for
types TL and A (cargo only) respectively:
ri i Ti- co
8/3/2019 USSBS Report 48, Japanese Merchant Shipbuilding
http://slidepdf.com/reader/full/ussbs-report-48-japanese-merchant-shipbuilding 34/61
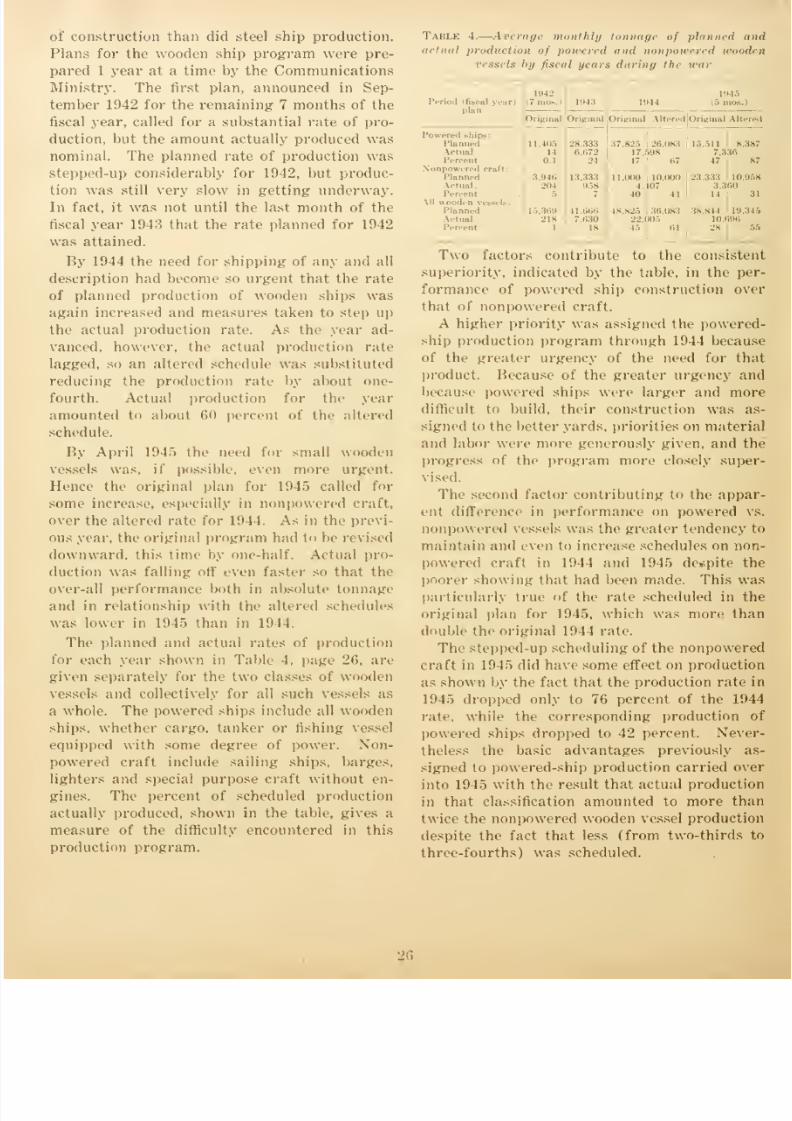
oi' construction than did steel ship production.
Plans for the wooden ship program were pre-
pared 1 year at a time by the Communications
Ministry. The first plan, announced in Sep-
tember 1942 for the remaining 7 months of the
fiscal year, called for a substantial rate of pro-
duction, but the amount actually produced was
nominal. The planned rate of production was
stepped-up considerably for1942,
but produc-
tion was still very slow in getting underway.
In fact, it was not until the last month of the
fiscal year 1943 that the rate planned for 1942
was attained.
By 1944 the need for shipping of any and all
description had become so urgent that the rate
of planned production of wooden ships was
again increased and measures taken to step up
the actual production rate. As the year ad-
vanced, however, the actual production rate
lagged, so an altered schedule was substituted
reducing the production rate by about one-
fourth. Actual production for the year
amounted to aboul 60 percent of the altered
schedule.
By April 1945 the need for small wooden
vessels was, if possible, even more urgent.
Hence the original plan for 1945 called for
some increase, especially in nonpowered craft.
over the altered rate for 19 1 1. As in the previ-
ous year,the
original program had to berevised
downward, this time by one-half. Actual pro-
duction was falling off even faster so that the
over-all performance both in absolute tonnage
and in relationship with the altered schedules
was lower in 1915 than in 1944.
The planned and actual rates of production
for each year shown in Table 1. page -'>. are
given separately for the two classes of wooden
vessels and collectively for all such vessels as
a whole. The powered ships include all wooden
ships, whether cargo, tanker or fishing vessel
equipped with some degree of power. Non-
powered craft include sailing ships, barges,
lighters and special purpose craft without en-
gines. The percent of scheduled production
actually produced, shown in the table, gives a
measure of the difficulty encountered in this
production program.
Table 4. Averagi monthly
act/ml production of powered
uessi Is by fiscal yi are
tonnagi nf planned and
and nonpowi i d wood* n
during //<< war
r;tl yearplan
PoweredPlanned
al
Mered craft
Planned
mlAM wooili-n \ easels
Planii.
Aotual
Percent
HO J
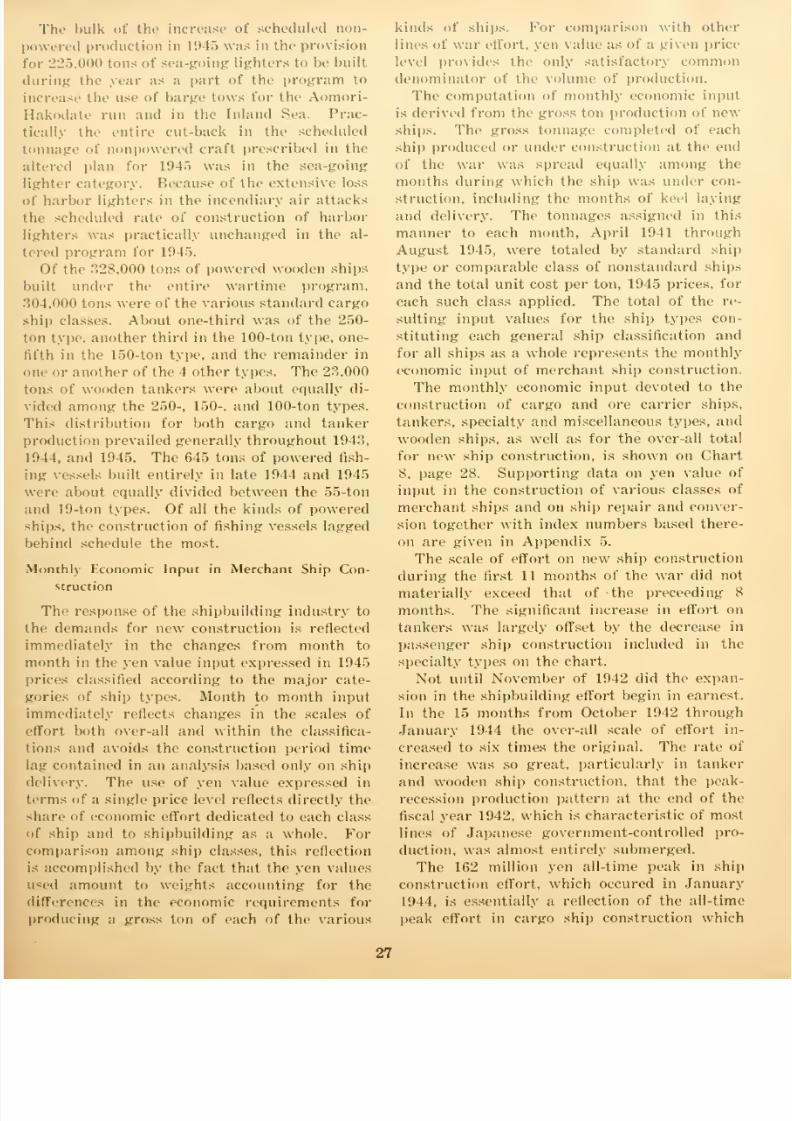
8/3/2019 USSBS Report 48, Japanese Merchant Shipbuilding
http://slidepdf.com/reader/full/ussbs-report-48-japanese-merchant-shipbuilding 35/61
The bulk of the increase of scheduled non-
production in L945 was in the provision
220,000 tons of sea-going lighters to be built
the year as a part of the program to
the use of barge tows for the Aomori-
run and in the Inland Sea. Prac-
the entire cut-back in the scheduled
of nonpowered crafi prescribed in the
plan for 1945 was in the sea-going
category. Because of the extensive loss
harbor lighters in the incendiary air attacks
scheduled rate of construction of harbor
was practically unchanged in the al-
program for 19 15.
the 328,000 tons of powered wooden ships
under the entire wartime program,
tons were of the various standard cargo
classes. About one-third was of the 250-
type, another third in the 100-ton type, one-
inthe
150-ton type, and the remainder in
or another of the 4 other types. The 23,000
of wooden tankers were about equally di-
among the 250-, 150-, and 100-ton types.
distribution for both cargo and tanker
prevailed generally throughout 1943,
1 I. and 1945. The 645 tons of powered fish-
vessels built entirely in late 1944 and 1945
about equally divided between the 55-ton
19-ton types. Of all the kinds of powered
the construction of fishing vessels lagged
schedule the most.
Economic Input in Merchant Ship Con-
struction
The response of the shipbuilding industry to
demands for new construction is reflected
in the changes from month to
in the yen value input expressed in 1945
classified according to the major cate-
of ship types. Month to month input
reflects changes in the scales of
both over-all and within the classifica-
and avoids the construction period time
contained in an analysis based only on ship
The use of yen value expressed in
of a single price level reflects directly the
of economic effort dedicated to each class
ship and to shipbuilding as a whole. For
among ship classes, this reflection
accomplished by the fact that the yen values
amount to weights accounting for the
in the economic requirements fora gross ton of each of the various
kinds of ships. For comparison with other
lines of war effort, yen value as of a given price
level providi the only satisfactory common
denominator of the volume of production.
The computati E monthly economic input
i- derived from the gross ton production of new
ships. The gross tonnage completed of each
ship produced or under construction at the end
of the war was spread equally among the
months during which the ship was under con-
struction, including the months of keel laying
and delivery. The tonnages assigned in this
manner to each month, April 1941 through
August 1945, were totaled by standard ship
type or comparable class of nonstandard ships
and the total unit cost per ton, 1945 prices, for
each such class applied. The total of the re-
sulting input values for the ship types con-
stituting each general ship classification and
for all ships as a whole represents the monthly
economic input of merchant ship construction.
The monthly economic input devoted to the
construction of cargo and ore carrier ships,
tankers, specialty and miscellaneous types, and
wooden ships, as well as for the over-all total
for new ship construction, is shown on Chart
8, page 28. Supporting data on yen value of
input in the construction of various classes of
merchant ships and on ship repair and conver-
sion together with index numbers based there-
on are given in Appendix 5.
The scale of effort on new ship construction
during the first 11 months of the war did not
materially exceed that of -the preceeding 8
months. The significant increase in effort on
tankers was largely offset by the decrease in
passenger ship construction included in the
specialty types on the chart.
Not until November of 1942 did the expan-
sion in the shipbuilding effort begin in earnest.
In the 15 months from October 1942 through
January 1944 the over-all scale of effort in-
creased to six times the original. The rate of
increase was so great, particularly in tanker
and wooden ship construction, that the peak-
recession production pattern at the end of the
fiscal year 1942, which is characteristic of most
lines of Japanese government-controlled pro-
duction, was almost entirely submerged.
The 162 million yen all-time peak in ship
construction effort, which occured in January
1944, is essentially a reflectionof
theall-time
peak effort in cargo ship construction which
27
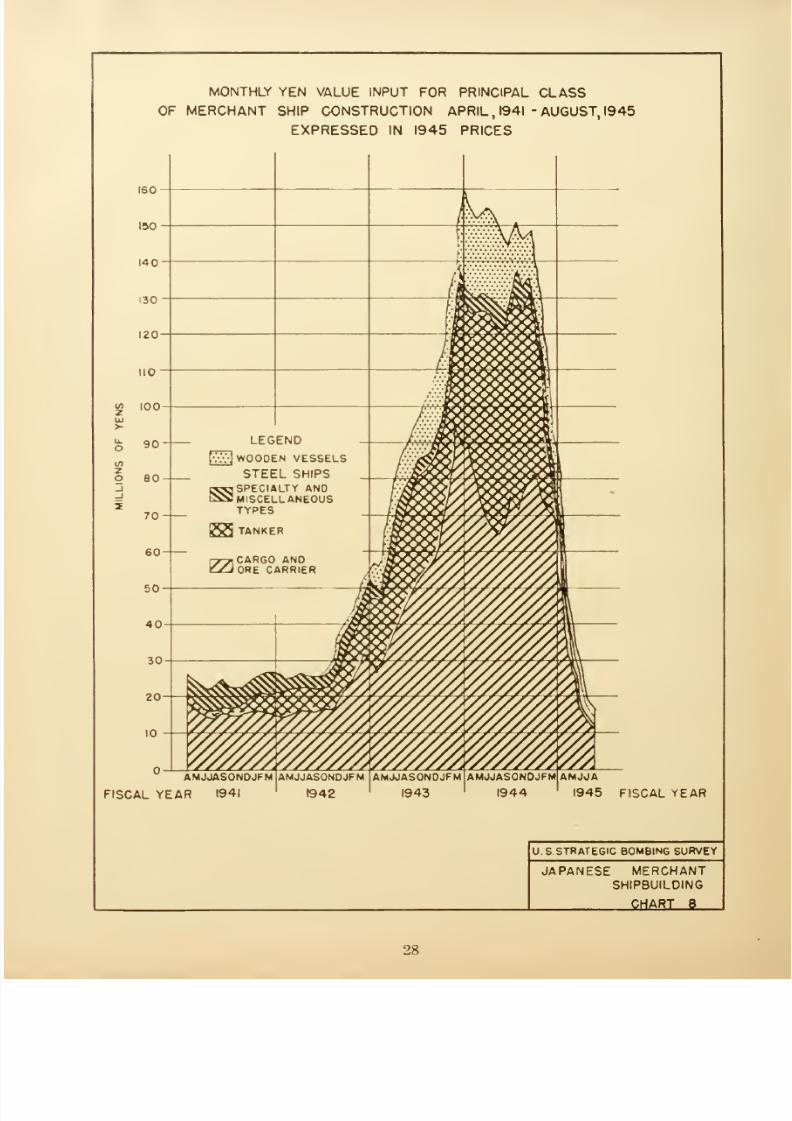
8/3/2019 USSBS Report 48, Japanese Merchant Shipbuilding
http://slidepdf.com/reader/full/ussbs-report-48-japanese-merchant-shipbuilding 36/61
MONTHLY YEN VALUE INPUT FOR PRINCIPAL CLASS
OF MERCHANT SHIP CONSTRUCTION APRIL , 1941 - AUGUST, 1945
EXPRESSED IN 1945 PRICES
AMJJASONOJFM
FISCAL YEAR 1941
AMJJASONOJFM
1942
AMJJASONOJFM
1943
AMJJASONOJFM AMJdA
1944 ' 1945 FISCAL YEAR
U S STRATEGIC BOMBING SURVEY
JAPANESE MERCHANTSHIPBUILDING
CHART 8
28

8/3/2019 USSBS Report 48, Japanese Merchant Shipbuilding
http://slidepdf.com/reader/full/ussbs-report-48-japanese-merchant-shipbuilding 37/61
in turn, the characteristic year-end
in effort to meel quotas and earn bonuses
for the fiscal year. As the fiscal
ended, the efforl on tankers continued to
at a pace sufficient in April to offsel
usual recession after the year-end rush.
cargo ship efforl continued to decline
May, June, and July of 1944 because of
diversion of more and mure effort into
construction; keels for 11 of the 13
TA tankers were laid in those 3
The net decline from April to July
the total steel ship construction effort may
attributed t<> the interruptions and delays
from the shifts in production program
cargo to tanker types. After the effort
tanker- reached its peak in July, it tapered
gradually during the ensuing three months
October. In the meantime the cargo
efforlrecovered
considerably so that in
and again in October the over-all effort
steel ships exceeded that of any previous
except January mil.
While steel ship production was being main-
throughout the summer and fall of 1944,
if by forced draft effort, the wooden ship
effort rose gradually from January
it- slightly higher all-time peak in .May 1944,
fell away rapidly, especially in July and
The shipbuilding industry as a whole may be
to have been operating at the maximum
rate achieved during the entire war from Jan-
uary through May of 1944. The portion of the
industry engaged in steel ship construction con-
tinued its maximum level of effort, except for
losses due to shifts in type of ship built, through
October 1911.
While the over-all shipbuilding effort re-
quired only L5 months to increase to (3 time
its original size, during the 10-month period
following ( >ctoher 1944. it had fallen to between
one-twelfth and one-eleventh of the October
scale of effort. The sharpest drop was from
February to March 1945, when tanker con-
st nut ion was virtually abandoned and cargo
construction took its first severe cut. From
March to the end of the war, effort was little
more than nominal in any line but cargo ships.
Even in that line the rate of decline indicated
that significant effort could not be continued
more than 2 months at most.
Ships which had been started as tankers in
November and December were later scheduled
for completion as cargo ships after January.
This explains the sharp decline in tanker con-
struction which occurred during November.
despite the delay until January in the decision
to stop tanker construction. The change in
type resulted, in this study, in their being
classed retroactively as having been cargo
ships throughout the period of their con-
struction.
VL BO'lTLUNECKS
nherent Limitations
The comparatively undeveloped technologi-
methods of ship construction employed by
rapanese, even in the newest and best of
their shipyards, imposed a much slower, less
rate of production in terms of man-
power and raw materials than was achieved
in the United States. There can be no compari-
son between the output that could be expected
from a given commitment of manpower and
raw materials in the shipyards of the two coun-
tries. The difference in technology was such
that continued applications of manpower and
materials during a given period in any of the
Japanese yards would cease to bring a material
increase in tonnage, while an American yardwith comparable capital investment would still
be producing at a rate considerably below ca-
pacity. Hence, it would be useless to estimate
what Japanese production might have been
in terms of American rates of production.
Such rates could not have been achieved even
if the other bottlenecks could have been re-
moved.
These technological limitations indicated in
Chapter III, consisted of such shortcomings
as the congested and unsystematic shipyard
layouts, the lightweight equipment inadequate
for extensive ship section fabrication and pre-
assembly, and poorly developed techniques for
cutting and welding plate. Such limitations
arose from the lack of foresight and creative
engineering on the part of shipyard operatorsand responsible government agencies and from
29
8/3/2019 USSBS Report 48, Japanese Merchant Shipbuilding
http://slidepdf.com/reader/full/ussbs-report-48-japanese-merchant-shipbuilding 38/61
a comparatively low level of skill on the part of
the average Japanese shipyard workers.
Closely related to the technological limitation
and similarly inherent as a limitation on pro-
duction regardless of the more variable factors,
was the confused and ineffectual character of
the administration and supervision of the ship-
building program.
In the early stages of the war, there was nocivilian government authority strong enough to
provide effectual control of the program. The
Minisl ry of Transportation and Communication
did not have the staff, the imagination or the
prestige to promote a large scale expansion in
merchant shipbuilding. Schedules and ship
designs were established largely al the behesl
of the large commercial shipbuilders and no
new large yards independent of the established
producers were fostered. No civilian authority
ed in the Japanese Government which
could stand up to the army or navy in the
scramble for raw materials and production
capacity. As a result, allocations to merchant
ship construction had to be made from what
remained after the armed forces' programs
were satisfied.
When the navy finally took over the control
and responsibility for the merchant ship pro-
gram many of the weaknesses of the civilian
control were overcome. The Navy Technical
Bureau had the staff, technical competence and
prestige to initiate changes in the schedules and
ship designs. Also, having the responsibility
for getting volume production, the navy was
compelled to make important sacrifices in its
own program in order to meet new obligations.
Even the navy administration, however, had
the shortcomings and weaknesses characteristic
of most Japanese administration. Priorities.
schedules, materials and labor allocations and
similar administrative decisions were horn of
compromises, were more or less ambiguous.
and were constantly undergoing changes. Ad-
herence to these measures was not always
persistently enforced; in too many instances
such decisions were made when it was known
that they could not be made to stick.
Delays in Expansion Prior to Peak Effort
Several factors limited the expansion of
shipbuilding at the outset, but were at least
partially overcome and amounted, therefore,
to delays in the program rather than over-all
bottlenecks.
The Japanese were slow to recognize the
magnitude of the demand for new tonnage that
continued prosecution of the war would require.
This lack of appreciation of the urgency of the
program contributed to the delay in expanding
the program to the extent that ultimately was
attained. If the urgency had been recognized
sooner, the transfer of control to the navy, the
reduction in number and greater simplification
of the standard ship designs, the construction
of new shipbuilding capacity and a greater sac-
rifice of competitive demands might all have
been accomplished sooner with a consequent
large increase in production at an earlier date.
Competitive demands for raw materials and
production capacity held such priority for a
full year after the outbreak of war that no
material increase in merchant shipbuilding waspossible during that period. The most serious
diversion, as has already been shown, was the
preoccupation of several of the largest com-
mercial yards with heavy naval ship con-
struction.
Finally, one of the most serious factors de-
laying I he increase in the rate of shipbuilding
was the delay in the expansion of existing
yards and. even more serious, the delay in
construction of new yards. As shown on
Chart 1. page 12, the over-all expansion in
gross floor space from '<l March 1942 to 15
August 1945 was 7* percent. The timing and
distribution of that expansion between old and
new yards is shown by the following percent-
: the o\ er-all total
:
8/3/2019 USSBS Report 48, Japanese Merchant Shipbuilding
http://slidepdf.com/reader/full/ussbs-report-48-japanese-merchant-shipbuilding 39/61
rcent of the deficil of A-ship deliveries
the amount scheduled for L944 in the
1944 plan. In this instance, then, the
of the delay in the construction of these
yards not only was a delay in the increase
the volume of production hut also carried
as a limitation of the peak of production
by the industry when it was most fully
Capacity and Peak Production
The amount of physical plant available for
the technological capabilities of the
plant and the administrative compe-
of the control of the industry together
the industrial capacity limitation on
rate of production attained by the shipbuild-
industry during the period of peak produc
The other bottleneck factors simply con-
delays in the growth of the rate ofinasmuch as they were largely
:ome in the process of reaching the peak.
none of the aforementioned factors could
been responsible for the precipitous de-
in the rate of production, or they would
prevented the attainment of the peak.
new bottlenecks responsible for the large
in production also may have been felt
during the period of peak produc-
to have prevented the full utilization of the
capacity for shipbuilding even dur-
the peak period. The extent to which the
industrial capacity was utilized during the
of peak production must await analysis
the new factors that caused the decline.
Several methods are available for ascertain-
the capacity of the industrial plant in exis-
al a given time. A direct assessment of
would require two steps. First, an
estimate would have to be made of
maximum rate of production in each exist-
shipyard of the type of ship for which the
was besl titted. These estimates would
to take into account the technological
of the yard and its operators.
an appropriate allowance on an in-
wide basis would have to be made for
and inefficiencies imposed on the
by changes in specifications and the
slip-ups characteristic of Japan-
administration. Tin' time available in
Japan did not permit a systematic evaluation
of either of these steps.
Another basis available for ascertaining ca-
pacity is the maximum construction effort
scheduled by the Japanese for each of the
shipyards. Aside from the practical difficulty
of determining whether additional yard ex-
pansion was contemplated by the schedule
makers before the scheduled rate was to be
attained, there arc the theoretical objections
to scheduled production as a measure of capac-
ity. Undoubtedly, the maximum scheduled
scale of efforl included, for purposes of creat-
ing incentives, a margin the realization of
which the planners themselves actually did not
anticipate. Furthermore, the advance schedul-
ing could not anticipate the interruptions and
inefficiencies imposed by changes in plans and
other controlling circumstances that actually
materialized to limit the capacity.
The only satisfactory available measure of
capacity is the actual effort expended during
the period of peak shipbuilding activity. The
chief reservation in making that use of the
peak rate of production is the extent to which
the factors that later precipitated the steep de-
cline may already have been felt in sufficient
force during the peak production period to have
limited the production effort short of actual
capacity. Whether or not this was the case and
the extent of the unused capacity if there was
any are considered after a discussion of the
production factors responsible for the decline.
Steel Supply
The increase in the share of the Japanese
war economy dedicated to merchant ship con-
struction is indicated by the sharp increase in
the share of available steel assigned to that
effort. The desperate effort to maintain ship
construction despite the decline in availablesteel in the later stages of the war is manifested
by the continued increase in the fraction of steel
deliveries channeled into merchant ship con-
struction even after steel production had begun
its decline. The relationship of steel delivered
for work on merchant shipping to total steel
deliveries and production is shown in table 5,
page :12. The data are taken from Appendix
Tables 12 and 14 of the report of the Basic
Materials Section on Coke, Iron and Steel.
31
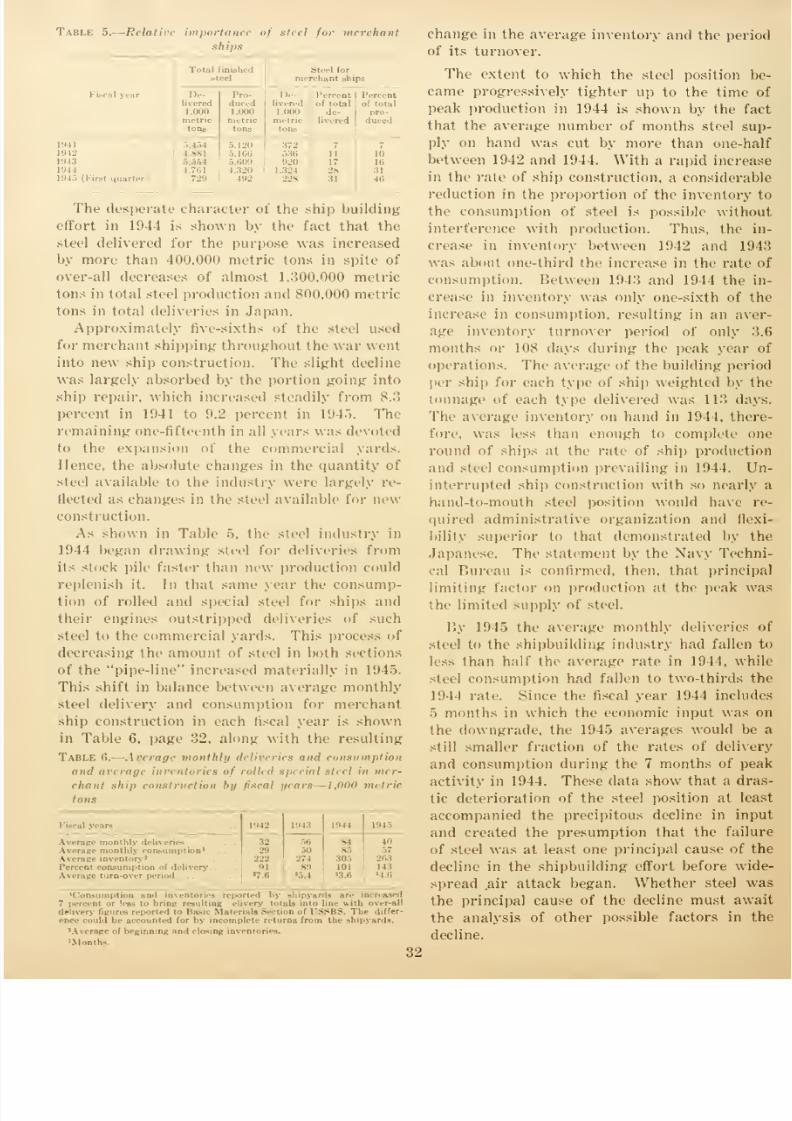
8/3/2019 USSBS Report 48, Japanese Merchant Shipbuilding
http://slidepdf.com/reader/full/ussbs-report-48-japanese-merchant-shipbuilding 40/61
Table 5. Relatir, importance of sti 1 1 for merchant
ships
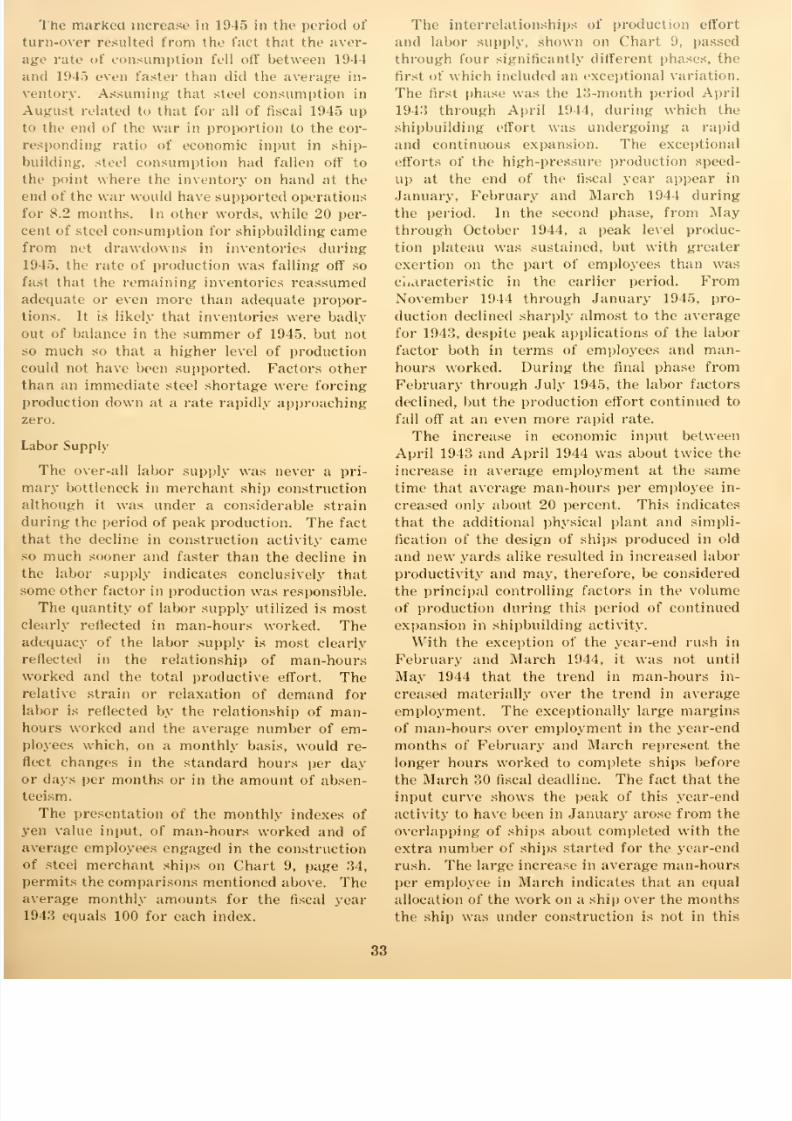
8/3/2019 USSBS Report 48, Japanese Merchant Shipbuilding
http://slidepdf.com/reader/full/ussbs-report-48-japanese-merchant-shipbuilding 41/61
The marked increase in 194") in the period of
resulted from the fad that the aver-
ratf of consumption fell off between 1944
1945 even faster than did the average in-
Assuming thai steel consumption in
related to that for all of fiscal L945 up
the end of the war in proportion to the cor-
ratio of economic input in ship-
steel consumption had fallen off to
point where the inventory on hand at the
of the war would have supported operations
8.2 months. In other words, while 20 per-
of steel consumption for shipbuilding came
net drawdowns in inventories during
the rate of production was falling off so
that the remaining inventories reassumed
or even more than adequate propor-
It is likely that inventories were badly
of balance in the summer of 1945, but not
much so that a higher level of production
not have been supported. Factors other
an immediate steel shortage were forcing
down at a rate rapidly approaching
Supply
The over-all labor supply was never a pri-
bottleneck in merchant ship construction
it was under a considerable strain
the period of peak production. The fact
the decline in construction activity camemuch sooner and faster than the decline in
labor supply indicates conclusively that
other factor in production was responsible.
The quantity of labor supply utilized is most
reflected in man-hours worked. The
of the labor supply is most clearly
in the relationship of man-hours
and the total productive effort. The
strain or relaxation of demand for
is reflected by the relationship of man-
worked and the average number of em-
which, on a monthly basis, would re-
changes in the standard hours per day
days per months or in the amount of absen-
The presentation of the monthly indexes of
value input, of man-hours worked and of
employees engaged in the construction
steel merchant ships on Chart 9, page 34,
the comparisons mentioned above. The
monthly amounts for the fiscal year
equals 100 for each index.
The interrelationships of production effort
and labor supply, shown on Chart 9, passed
through four significantly different phases, the
first of which included an exceptional variation.
The first phase was the l.",-month period April
1943 through April 1944, during which the
shipbuilding effort was undergoing a rapid
and continuous expansion. The exceptional
efforts of the high-pressure production speed-
up at the end of the fiscal year appear in
January, February and March 1944 during
the period. In the second phase, from May
through October 1944, a peak level produc-
tion plateau was sustained, but with greater
exertion on the part of employees than was
characteristic in the earlier period. From
November 1944 through January 1945, pro-
duction declined sharply almost to the average
for 1943, despite peak applications of the labor
factor both in terms of employees and man-
hours worked. During the final phase from
February through July 1945, the labor factors
declined, but the production effort continued to
fall off at an even more rapid rate.
The increase in economic input between
April 1943 and April 1944 was about twice the
increase in average employment at the same
time that average man-hours per employee in-
creased only about 20 percent. This indicates
that the additional physical plant and simpli-
fication of the design of ships produced in oldand new yards alike resulted in increased labor
productivity and may, therefore, be considered
the principal controlling factors in the volume
of production during this period of continued
expansion in shipbuilding activity.
With the exception of the year-end rush in
February and March 1944, it was not until
May 1944 that the trend in man-hours in-
creased materially over the trend in average
employment. The exceptionally large margins
of man-hours over employment in the year-end
months of February and March represent the
longer hours worked to complete ships before
the March 30 fiscal deadline. The fact that the
input curve shows the peak of this year-end
activity to have been in January arose from the
overlapping of ships about completed with the
extra number of ships started for the year-end
rush. The large increase in average man-hours
per employee in March indicates that an equal
allocation of the work on a ship over the months
the ship was under construction is not in this
33
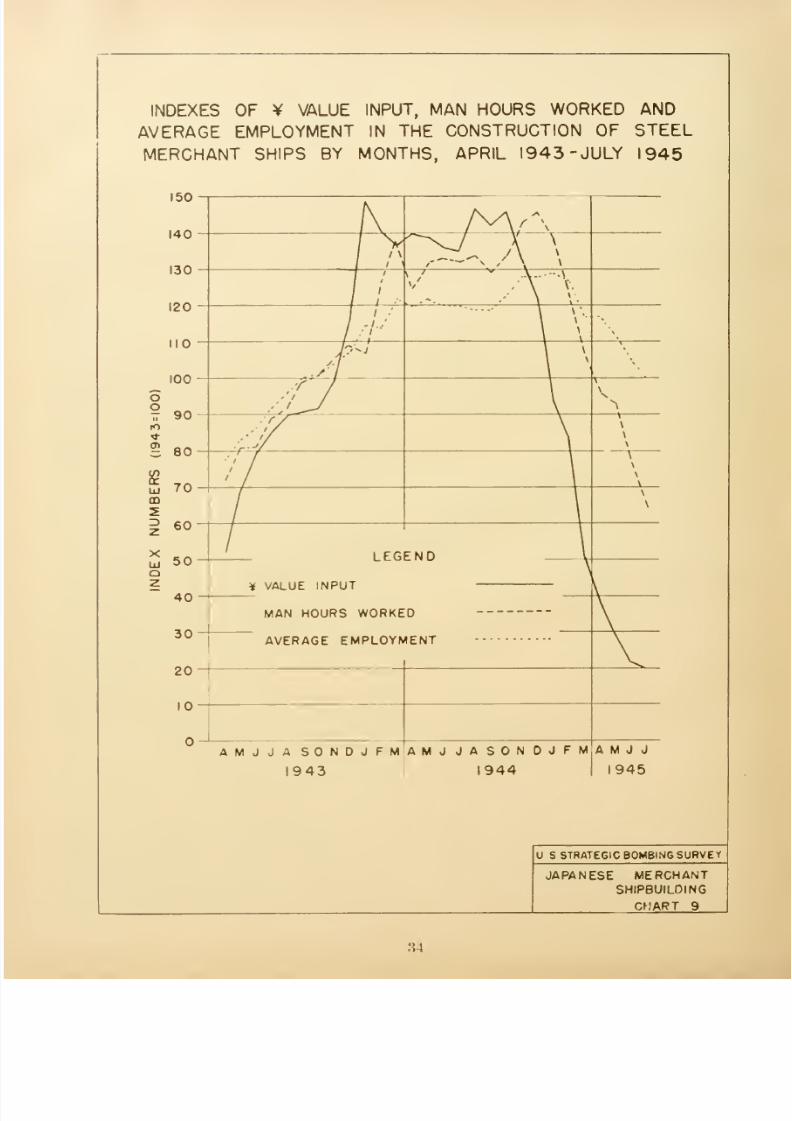
8/3/2019 USSBS Report 48, Japanese Merchant Shipbuilding
http://slidepdf.com/reader/full/ussbs-report-48-japanese-merchant-shipbuilding 42/61
INDEXES OF ¥ VALUE INPUT, MAN HOURS WORKED AND
AVERAGE EMPLOYMENT IN THE CONSTRUCTION OF STEEL
MERCHANT SHIPS BY MONTHS, APRIL 1943 -JULY 1945
IOU
8/3/2019 USSBS Report 48, Japanese Merchant Shipbuilding
http://slidepdf.com/reader/full/ussbs-report-48-japanese-merchant-shipbuilding 43/61
an accurate reflection of the distribu-
of economic input. In any event, the fad
a near peak production rate was main-
in April 1944 with the comparatively
increase in man-hours per employee over
average prevailing during L943 indicates
excepl for the exceptional year-end surge,
peak plateau of production prevailing from
to October 1944 was reached without
great strain on the labor force. Hence, it mayconcluded, the attainment of that level of
was not seriously retarded by any
of labor supply.
Beginning in .May of 1944, however, the
of the peak level of productive
through October 1944 did require a
and sustained increase in hours per
This indicates the labor situation
significantly tighter during this period
it had been during 1943. That the total
increased more during this period than
id the total man-hours indicates the labor sup-
at least up to the August-October produc-
peak, had not been a primary limiting
in production. The fact that a mate-
higher labor supply both in terms of
and employees was applied in De-
" !• creates the presumption that it could
been applied between August and October
it had been required during the peak pro-
period.
By .January 1945, the end of the third phase,
had fallen steadily to less than two-
the production in October 1944, despite
fact that in November, December, and
both employment and man-hours were
at unprecedented peak levels. This
a frantic but futile effort to maintain
rate of ship production in the face of the
re steel shortage that made itself felt most
during this period.
Apparently the futility was reflected back
the labor effort in February because, for
first time in more than a year, the average
worked per employee fell below the aver-
for fiscal 1943, thus marking the beginning
the final phase in the interrelationships
the labor factors and production. By1945, the end of the period under analysis,
employment had fallen steadily to the
average. The increase in absenteeism in
shipyards, clue primarily to urban areaattacks and food shortages, resulted
in a steady but more rapid decline in man-hours
worked to a level in July L945 slightly below the
lowest in fiscal L943. But these declines in the
labor supply cannot be held responsible for the
decline in production, because that was even
more drastic throughout the period, ending in
Julj a! only one-fifth of the average for fiscal
L943 and two-fifths of i he lowest in that year.
The quality of the labor in the commercial
shipyards of Japan, although never goodenough to permit the use of many technological
improvements known to the -Japanese, deterior-
ated rapidly during the last 12 months of Hie
war. Experience varied considerably among
the yards but in some the number of regular
employees had been cut to less than one-third
the prewar level in the late fall of 1944 as a
result of the draft for the armed services. This
process was accentuated during the last year of
the war as the Philippine, Iwo Jima, and Oki-
nawa campaigns brought the war closer and
closer to Japan. In the meantime, the labor
force in the shipyards was maintained and
even increased by the assignment of one or
another of the various classes of compulsory
labor. The average composition of the labor
force of eight representative large yards during
October and November 1944 was as follows:
Percent
Conscripted Japanese Labor IE
Regular employees 20Students (mostly boys) 10
Civil prisoners (Japanese) I1
Korean conscripts 8
Women (mostly clerical) 4
Prisoners of war ::
i inn -c conscripts 1
loo
The conscripted labor was generally low-
quality unskilled labor with little or no mechan-
ical experience. The Japanese conscripted
labor, composing almost one-half of the entire
labor force during this period, consisted of
unskilled males unfit for military service who
had been brought in from the agricultural re-
gions of Japan.
The necessity of relying increasingly on such
low grade labor provided manj headaches for
the shipyard managers and the resulting rate
of production was. no doubt, lower than would
have obtained with higher grade labor. But
inasmuch as this substitution of low grade laborwas well under wav before October 1944 and
:::,
8/3/2019 USSBS Report 48, Japanese Merchant Shipbuilding
http://slidepdf.com/reader/full/ussbs-report-48-japanese-merchant-shipbuilding 44/61
up through that month, productivity had actu-
ally been increasing, it cannot be concluded that
the low quality of labor precipitated the steep
decline in production that continued from Octo-
ber to the end of the war.
Components Supply
The most important ship component requir-
ing advance manufacture is, of course, the
ship's engine, including the boiler for steam-
driven engines. Generally speaking, the pro-
duction of ship's engines kept apace the pro-
duction of hulls.
As mentioned on page 6, 60 percent of the
wartime horsepower production of merchant
ship engines tame from 5 producers, while the
remainder was divided equally between the 10
next largest producers on the one hand and the
remaining ">!> producers on the other. All of
the 15 large producers were commercial ship-
yards except the two Hitachi engine plants, one
at Hitachi and one in Tokyo, which were owned
by one of the industrial combines heavily en-
gaged in shipbuilding:. Practically all of the
turbine and reciprocating engines and the
boilers for ships larger than type I> were built
in these 1") establishments. The myriad non-
shipyard enginemakers, ranging in size from
comparatively small to tiny, were engaged pri-
marily in making Diesel engines for the type-E
ships and were the principal source for thattype of engine. None of the four new yards
specializing in E-ships made their own engines.
Comparison of the dates that engines were
available at the shipyard with dates of launch-
ing show only occasional delays in the delivery
of the larger types of ships attributable to
delay in engine production. A greater degree
of difficulty was experienced with E-type en-
gine deliveries, but by the time this became
serious in the spring of 1945 the production
of E-type ships had been reduced and such as
were scheduled were to be equipped with coal
burning reciprocating machinery because of
the scarcity of Diesel oil. Hence, a new set
of producers, principally smaller commercial
shipyards, were called upon for engines for
this class and engines were supplied as rapidly
as the hulls were built.
These Japanese shipyard officials who were
interrogated stated that engine deliveries held
up construction in some instances, but were not
generally an important factor in the slow-down
of the construction program. Neither was any
crippling over-all shortage of any other ship
component reported.
Although irregularities in the flow of com-
ponents to the fitting quays effected occasional
delays in ship construction, there was no over-
all shortage of ships engines or other compon-
ents relative to the volume of shipbuilding per-
mitted by other limiting factors.
Bottlenecks in the Wooden Ship Construction
Program
The very poor showing made in wooden ship
construction up to the summer of 1943 was due
to the difficulties and delays in building new
yards, in obtaining priorities and establishing
channels for timber, steel and labor and in
strengthening the administrative machinery
for control of the standard ship program.
By December 1943 the capacity to produce
wooden ship hulls had so increased that the
demand for engines could not be satisfied by
the haphazard system under which their pro-
duction had been administered. Hence a sys-
tem of close coordination of engine procurement
with the performance in hull construction in the
various yards was inaugurated by the Trans-
portation Ministry which was also able to se-
cure better steel priorities from the navy for
engine production. Relieved of the bottleneck
on steel and ship's engines, wooden ship pro-duction quickly rose to a peak plateau which
lasted through June 1944.
The supply of timber and labor for hull con-
struction were the primary limiting factors on
wooden ship construction during the peak
period from December 1943 through June 1944.
The timber difficulty lay principally in the
shortage of labor to cut it and in the extreme
difficulty of transporting it to the shipyards.
The yards with the best production records dur-
ing this period were the yards that owned and
cut their own timber at sources close to the
shipyard. The fact that the wooden shipbuild-
ing yards were never assigned conscripted labor
as were many of the larger industries was only
partially offset by the fact that they were small,
widely scattered enterprises located, for the
most part, outside of the large industrial centers
of Japan and could, therefore, draw from local
labor supplies. In general they could not obtain
enough help to sustain the maximum rate of
production possible during the period when
36
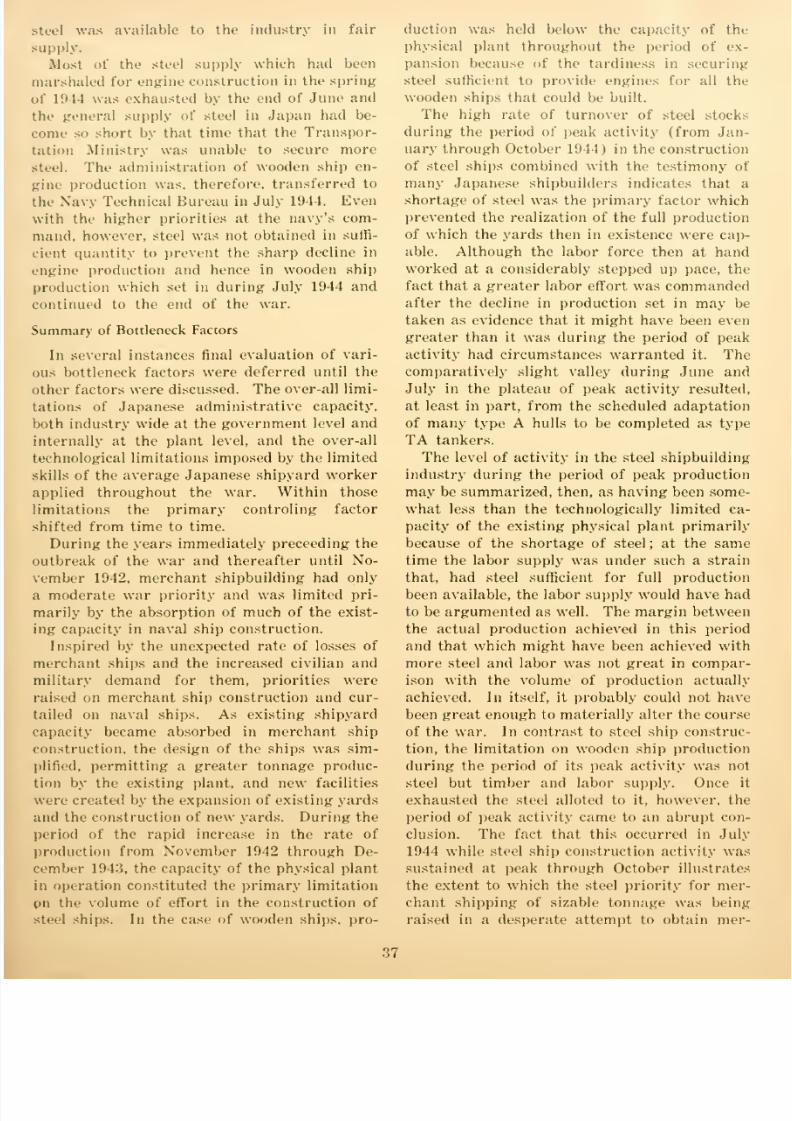
8/3/2019 USSBS Report 48, Japanese Merchant Shipbuilding
http://slidepdf.com/reader/full/ussbs-report-48-japanese-merchant-shipbuilding 45/61
was available to the industry in fair
Mosl ni' the steel supply which had been
for engine construction in the spring
l'.'ll was exhausted by the end of June and
general supply of steel in Japan had he-
so short by thai time that the Transpor-
Ministry was unable to secure more
The administration of wooden ship en-
production was, therefore, transferred to
Navy Technical Bureau in July 1944. Even
the higher priorities at the navy's com-
however, steel was not obtained in suffi-
it quantity to prevent the sharp decline in
production and hence in wooden ship
which set in during July 1944 and
to the end of the war.
of Bottleneck Factors
In severalinstances final evaluation of vari-
bottleneck factors were deferred until the
factors were discussed. The over-all limi-
of Japanese administrative capacity,
industry wide at the government level and
nternally at the plant level, and the over-all
limitations imposed by the limited
of the average Japanese shipyard worker
throughout the war. Within those
the primary controling factor
from time to time.
During the years immediately preceeding the
of the war and thereafter until No-
1942, merchant shipbuilding had only
moderate war priority and was limited pri-
arily by the absorption of much of the exist-
capacity in naval ship construction.
Inspired by the unexpected rate of losses of
ships and the increased civilian and
demand for them, priorities were
aised on merchant ship construction and cur-
on naval ships. As existing shipyard
became absorbed in merchant ship
the design of the ships was sim-
lified, permitting a greater tonnage produc-
ion by the existing plant, and new facilities
created by the expansion of existing yards
the construction of new yards. During the
period of the rapid increase in the rate of
production from November 1942 through De-
L943, the capacity of the physical plant
in operation constituted the primary limitation
the volume of effort in the construction ofteel ships. In the case of wooden ships, pro-
duction was held below the capacity of th>'
physical plant throughout the period of ex-
pansion because of the tardiness in securing
steel sufficient to provide engines for all the
wooden ships that could be built.
The high rate of turnover of steel stocks
during the period of peak activity (from Jan-
uary through October 1944) in the construction
of steel ships combined with the testimony of
many Japanese shipbuilders indicates that a
shortage of steel was the primary factor which
prevented the realization of the full production
of which the yards then in existence were cap-
able. Although the labor force then at hand
worked at a considerably stepped up pace, the
fact that a greater labor effort was commanded
after the decline in production set in may be
taken as evidence that it might have been even
greater than it was during the period of peak
activity had circumstances warranted it.
Thecomparatively slight valley during June and
July in the plateau of peak activity resulted,
at least in part, from the scheduled adaptation
of many type A hulls to be completed as type
TA tankers.
The level of activity in the steel shipbuilding
industry during the period of peak production
may be summarized, then, as having been some-
what less than the technologically limited ca-
pacity of the existing physical plant primarily
because of the shortage of steel ; at the sametime the labor supply was under such a strain
that, had steel sufficient for full production
been available, the labor supply would have had
to be argumented as well. The margin between
the actual production achieved in this period
and that which might have been achieved with
more steel and labor was not great in compar-
ison with the volume of production actually
achieved. In itself, it probably could not have
been great enough to materially alter the course
of the war. In contrast to steel ship construc-
tion, the limitation on wooden ship production
during the period of its peak activity was not
steel but timber and labor supply. Once it
exhausted the steel alloted to it, however, the
period of peak activity came to an abrupt con-
clusion. The fact that this occurred in July
1944 while steel ship construction activity was
sustained at peak through October illustrates
the extent to which the steel priority for mer-
chant shipping of sizable tonnage was beingraised in a desperate attempt to obtain raer-
37
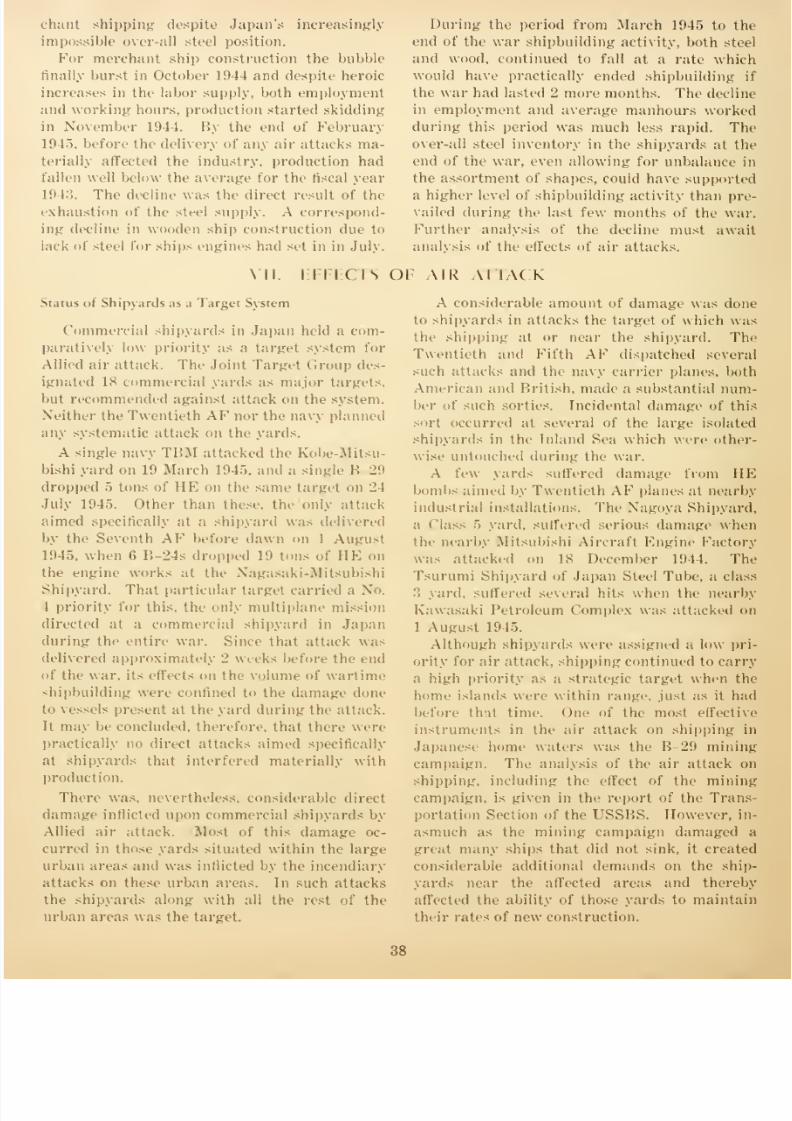
8/3/2019 USSBS Report 48, Japanese Merchant Shipbuilding
http://slidepdf.com/reader/full/ussbs-report-48-japanese-merchant-shipbuilding 46/61
ehanl shipping despite Japan's increasingly
impossible over-all steel position.
For merchant ship construction the bubble
finally burst in October 1944 and despite heroic
increases in the labor supply, both employment
and working hours, production started skidding
in November 1944. P>y the end of February
1945, before the delivery of any air attacks ma-
terially affected the industry, production had
fallen well below the average tor the fiscal yearL943. The decline was the direcl resull of the
exhaustion of the steel supply. A correspond-
ing decline in wooden ship construction due to
lack nf steel for ships engines had set in in July.
During the period from March 1945 to the
end of the war shipbuilding activity, both steel
and wood, continued to fall at a rate which
would have practically ended shipbuilding if
the war had lasted 2 more months. The decline
in employment and average manhours worked
during this period was much less rapid. The
over-all steel inventory in the shipyards at the
end of the war, even allowing for unbalance in
the assortment of shapes, could have supporteda higher level nf shipbuilding activity than pre-
sided during the last few months of the war.
Further analysis of the decline must await
analysis of the effects <>f air attacks.
\ II. NIK IS ()l \IK \l I \( K
Status of Shipyards as a Target System
Commercial shipyards in Japan held a com-
paratively low priority as a targel system for
Allied air attack. The Joint Targel Grou]
ignated is commercial yards as major targets,
!>ut recommended against attack on the system.
Neither the Twentieth AF nor the navy planned
any systematic attack on the yards.
A single navy TBM attacked the Kobe-Mitsu-
bishi yard on 19 March 1945, and a single 1'. -'>
dropped 5 tuns of II F on the same target on - 1
July 1945. Other than these, the only attack
aimed specifically at a shipyard was delivered
by the Seventh AF before dawn on 1 August1945, when 6 B-24s dropped 19 tons of HE on
the engine works at the Nagasaki-Mitsubishi
Shipyard. That particular targel carried a No.
I priority for this, the only multiplane mission
directed at a commercial shipyard in Japan
during the entire war. Since that attack was
delivered approximately 2 weeks before the end
of the war. its effects on the volume of wartime
shipbuilding were confined to the damage done
sels presenl at the yard during the attack.
It may be concluded, therefore, that there were
practically no direcl attacks aimed specifically
at shipyards that interfered materially with
production.
Then- was. nevertheless, considerable direct
damage inflicted upon commercial shipyards by
Allied air attack. Most of this damage oc-
curred in those yards situated within the large
urban areas and was inflicted by the incendiary
attacks on these urban areas. In such attacks
the shipyards along with all the rest of the
urban areas was the target.
A considerable amount of damage was done
to shipyards in attacks the target of which was
the shipping at or near the shipyard. The
Twentieth and Fifth
AFdispatched several
such attacks and the navy carrier planes, both
American and British, made a substantial num-
ber of such soilies. Incidental damage of this
sort occurred at several of the large isolated
shipyards in the Inland Sea which were other-
wise untouched during the war.
A few yards suffered damage from II
bombs aimed by Twentieth AF planes at nearby
industrial installations. The Nagoya Shipyard,
a Class •"> yard, suffered serious damage when
the nearby Mitsubishi Aircraft Engine Factorywas attacked on IS December 1911. The
Tsurumi Shipyard of Japan Steel Tube, a class
•". yard, suffered several hits when the nearby
Kawasaki Petroleum Complex was attacked on
1 August 1945.
Although shipyards were assigned a low pri-
ority for air attack, shipping continued to carry
a high priority as a strategic targel when the
home islands were within range, just as it had
before that time. One of the most effective
instruments in the air attack on shipping in
Japanese home waters was the B-29 mining
campaign. The analysis of the air attack on
shipping, including the effect of the mining
campaign, is given in the report of the Trans-
portation Section of the USSBS. However, in-
asmuch as the mining campaign damaged a
gnat many ships that did not sink, it created
considerable additional demands on the ship-
yards near the affected areas and thereby
affected the ability of those yards to maintain
their rates of new construction.
38
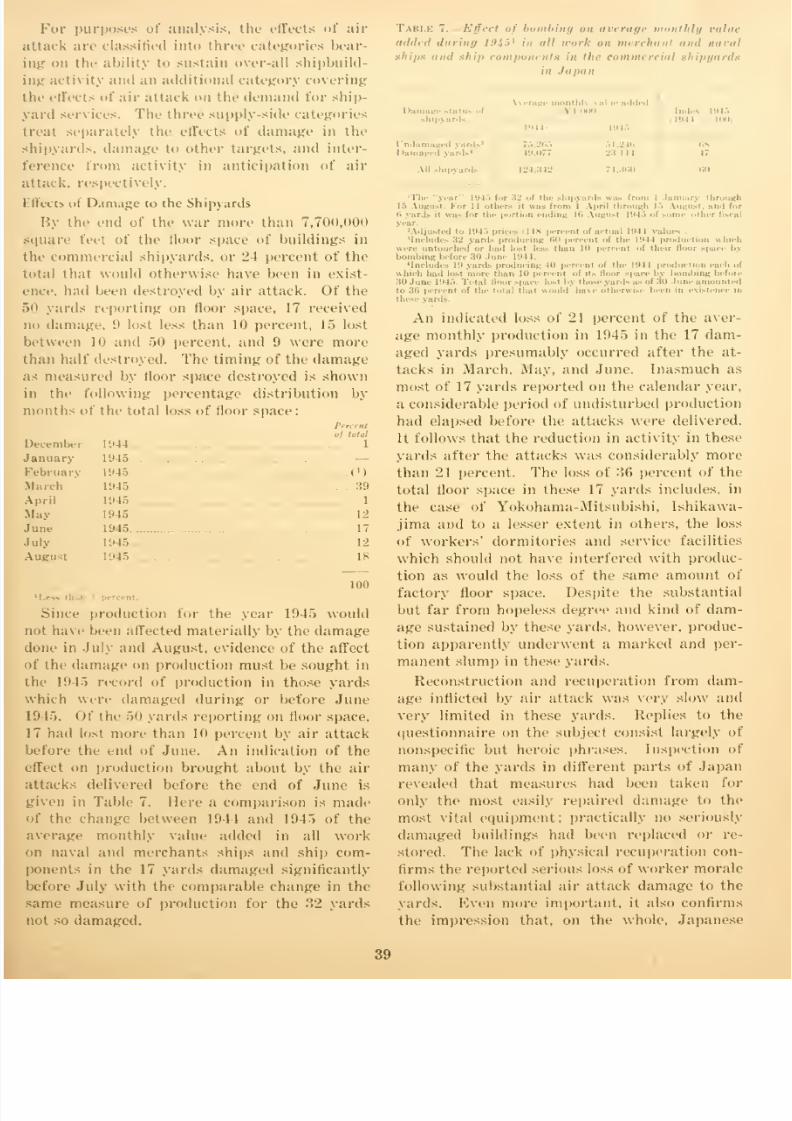
8/3/2019 USSBS Report 48, Japanese Merchant Shipbuilding
http://slidepdf.com/reader/full/ussbs-report-48-japanese-merchant-shipbuilding 47/61
For purposes of analysis, the effects of air
arc classified into three categories bear-
on the ability to sustain over-all shipbuild-
activity and an additional category covering
effects of air attack on the demand for ship-
sen ices. The three supply-side categories
separately the effects of damage in the
damage to other targets, and inter-
from activity in anticipation of air
respectively.
dI Damage to the Shipyards
By th( em! of the war nmiv than 7,TOO,000
feel of the floor -pace of buildings in
immercial shipyards, or 21 percent of the
thai would otherwise have been in exist-
had been destroyed by air attack. Of the
yards reporting on floor space. 17 received
damage, '.' lost less than 10 percent, L5 losl
10 and 50 percent, and !• were more
half destroyed. The timing of the damagemeasured by floor space destroyed is shown
the following percentage distribution by
of the total loss of floor space:
uf total
1944 1
1945 —1945 (M
1945 39
1
1945 12
1945 17
1945 VI
1945 is
100
Since production for the year 1945 would
have been affected materially by the damage
in July and August, evidence of the affect
the damage on production must be sought in
1945 record of production in those yards
were damaged during or before June
Of the 50 yards reporting on floor space,
had losl more than 10 percent by air attack
the end of June. An indication of the
on production brought about by the air
delivered before the end of June is
in Table 7. Here a comparison is made
the change between 1944 and 194~> of the
monthly value added in all work
naval and merchant-; ships and ship com-
in the 17 yards damaged significantly
July with the comparable change in the
measure of production for the 32 yardsso damaged.
• bombing o\
added during 1945* in all u-urk on merchant and naval
ships and ship components in the commercial shipyards
in Japan
Damaecshipj

8/3/2019 USSBS Report 48, Japanese Merchant Shipbuilding
http://slidepdf.com/reader/full/ussbs-report-48-japanese-merchant-shipbuilding 48/61
shipyard management was not sufficiently ver-
satile to overcome the disruptions and irregu-
larities imposed by the air attack damage to
the extent necessary for a reasonable recovery
of productive activity. It may be concluded,
then, that any substantial amount of physical
damage to the average shipyard was enough to
effect a considerable and comparatively perma-
nent reduction in productive activity in that
yard.
Damage from air attack was reported from
only 41 wooden ship construction yards, or 16
percent of the total of 548 such yards in Japan.
About half of those damaged were totally
destroyed. Several were damaged in March
1945, but more than half of those damaged were
attacked in July and August. Most of the yards
affected were damaged in the urban areas at-
tacks or in attacks on the wooden ships in or
near the yards. By the time the attacks weredelivered, production of wooden ships had
fallen off to such an extent because of the lack
of engines, that it is doubtful that the damage
inflicted on the comparatively small fraction of
all the shipyards materially affected the volume
of wooden ship construction.
Effects on Shipbuilding of Damage to Other Targets
The effects on shipbuilding of the damage
inflicted by air attack mi the portions of the
economy that support shipbuilding are difficult
to measure because they are largely merged
with all other factors that affect the volume of
support. For example, it is difficult to say how
much of the shipyards' labor difficulty was due
to absenteeism traceable to air attack, to ab-
senteeism attributable to other causes, or to
the reduction in average skill of the labor force
on hand because of the drafting of the more
able men into the armed services. What can
he said of the effects on shipbuilding of damage
to other targets may be separately discussed
in terms of the effects on labor force, compo-
nents supply, and materials supply, respectively.
Testimony of shipyard managers indicates
that two factors were primarily responsible for
the reduction of the quantity of the labor force
applied in shipbuilding during 1945—absentee-
ism from the yards in areas affected by the
urban area raids resulting from the destruction
of homes, interru.pt ion of local transportation,
etc.. and absenteeism from all
yardsresulting
from the food shortage causing employees to
go into the rural areas several times each week
in search of food. No complaint was heard of
a shortage of employees on the pay rolls. That
the decline in manhours was considerably more
serious than the decline in employment is borne
out by the fact that computed on the same time
basis as the production rates shown in table 7,
page 91, the average monthly employment in
1945 was 92 percent of that for 1944 while the
comparable ratio for manhours was 74 percent.
The fact that the average monthly rate of
production in 1945 had fallen to 60 percent of
the 1914 rate, while manhours and employment
had fallen only to 74 and 92 percent, respec-
tively, indicates that some factor other than
absenteeism, as bad as it was, was a more
potent cause of the decline in over-all shipyard
activity. This point is emphasized by the com-
parison made in Table 8, of the production
andlabor force experience of the undamaged
shipyards located in cities subject to area raids
before •"><> June with that of the damaged ship-
yards and that of the undamaged shipyards
located in unattacked areas.
TABU S. Effect of bombing <>n average monthly pro-
duction, manhours, and employment in t945J in damaged
yards, undamaged yards in attacked areas, <m<l undam-
aged yards outside attacked areas
Damage *tatu* <>l
hipyanb

8/3/2019 USSBS Report 48, Japanese Merchant Shipbuilding
http://slidepdf.com/reader/full/ussbs-report-48-japanese-merchant-shipbuilding 49/61
This constitutes a clear indication
it was not labor shortage that reduced
in the damaged yards, and created the
that it was the physical damage
the yard itself that brought about the
Data on the volume of ship components pro-
outside shipyards are not available in
detail to reflect any effects of air
on nonshipyard producers. The extent
which both damaged and undamaged ship-
maintained components production in
much better than work directly on ships
shown in the following tabulation:
llndrxe!, 1945 (1944
< omponproduct
p/orl on
ships
flj
The increased emphasis in 1945 on com-production in the shipyards shown in
tabulation indicates increased difficulty in
components from nonshipyards pro-
Such difficulty undoubtedly was caused
part by air attack damage to such producers.
view of the fact that the shipyards, including
damaged by air attack, were able to sus-
a comparatively high rate of components
in 1945, and in view of the fact,
on page 6, that 74 percent of the total
of merchant ship engines produced
the war was produced in the commercial
it is not probable that a shortage
components was responsible for the reduc-
in the rate of ship construction in 1945
As shown in the report of the Transportation
of USSBS, the tightening of the ship-
blockade in May, June, and July 1945 by
air attacks on ships in Japanese home
and by the B-29 mining campaign
it increasingly difficult to produce steel
Japan. As shown in Tables 5 and 6, page
however, the Japanese were drawing steel
of the steel production pipe line supply
-hip construction in 1945. As shown on
75, by the end of the year steel require-
had fallen to the point where inventories
adequate for a considerable period of
from stocks alone. Therefore, even
the blockade had closed the steel mills down.
activity could have continued for
time so far as raw materials were con-
Air attack damage to targets supporting
shipyard activity interfered temporarily with
product ion in some of the shipyards but was not
as effective as physical damage to the shipyard
in bringing about a general reduction in the vol-
ume of shipyard activity below the limits es-
tablished by other factors.
Effects on Shipbuilding of Air Attack Precautions
Comparatively little effort was made to dis-
perse shipyards as a measure of air attack
precaution. Though the degree of plant and
geographical concentration (shown on pages 5
through 9) was great, it was not as great as
in other key industries such as aircraft and
motor vehicles. Furthermore, it would not be
possible to establish new yards on new sites in
a short time even if they were equipped with
the machinery from an existing yard. In com-
pliance with the general dispersal directives
issued after the first round of urban area at-
tacks, shipyards in the large cities began send-
ing about 10 percent of their machine tools to
less vulnerable locations. Only tools not vital
to the current volume of shipyard activity were
selected and they were only the lighter tools
which could be handled without heavy equip-
ment. Wartime shipyard production did not
suffer from this program, but inspection of the
equipment which had been returned in October
1945 showed that the tools had suffered consid-
erably from weather and lack of maintenance.
Air attack precautions in and about the ship-
yard were largely confined to personnel shelters
and in some instances a limited amount of blast
wall protection for vital machinery such as air
compressors and rotary electric converters. No
large scale protection for machine tools in gen-
eral was noted except in the few yards where
a considerable amount of tunneling had been
done to expand the available working areas for
yards surrounded by hills. In some instancesoperating machinery had been installed in these
tunnels to gain the protection afforded thereby.
The materials and effort involved in these air
attack precautions were not sufficient to have
detracted sufficiently from the materials and
labor available for work on ships
Changes in the Demand for Shipyard Services
During the Period of Air Attack
To remain in the war Japan had to get food,
coal, and iron from the Asiatic mainland.Therefore, in the face of her continuing loss of
41
8/3/2019 USSBS Report 48, Japanese Merchant Shipbuilding
http://slidepdf.com/reader/full/ussbs-report-48-japanese-merchant-shipbuilding 50/61
shipping through sinking and isolation in re-
mote regions, she had to continue new ship con-
struction or admit defeat.
On 27 and 30 March 1945 the Twentieth AFdropped more than 1,000 tons of mines and
thereafter reenforced the best original fields
and sowed new ones on a gradually increasing
scale until the end of the war. These mines
sank many ships, but their effect on shipyards
came in the form of a steeply increased volumeof damaged shipping requiring repair.
The last desperate efforts to protect the ship-
ping afloat from the increased direct attack by
aircraft and submarine also brought about a
sustained effort in the naval coast defense ship
construction program in the commercial yards.
The change between 1944 and 1945 in the
distribution of the total productive effort ap-
plied directly on ships is shown in the following
tabulation.
Percent of total work done directly on ships in commer-
cial yards
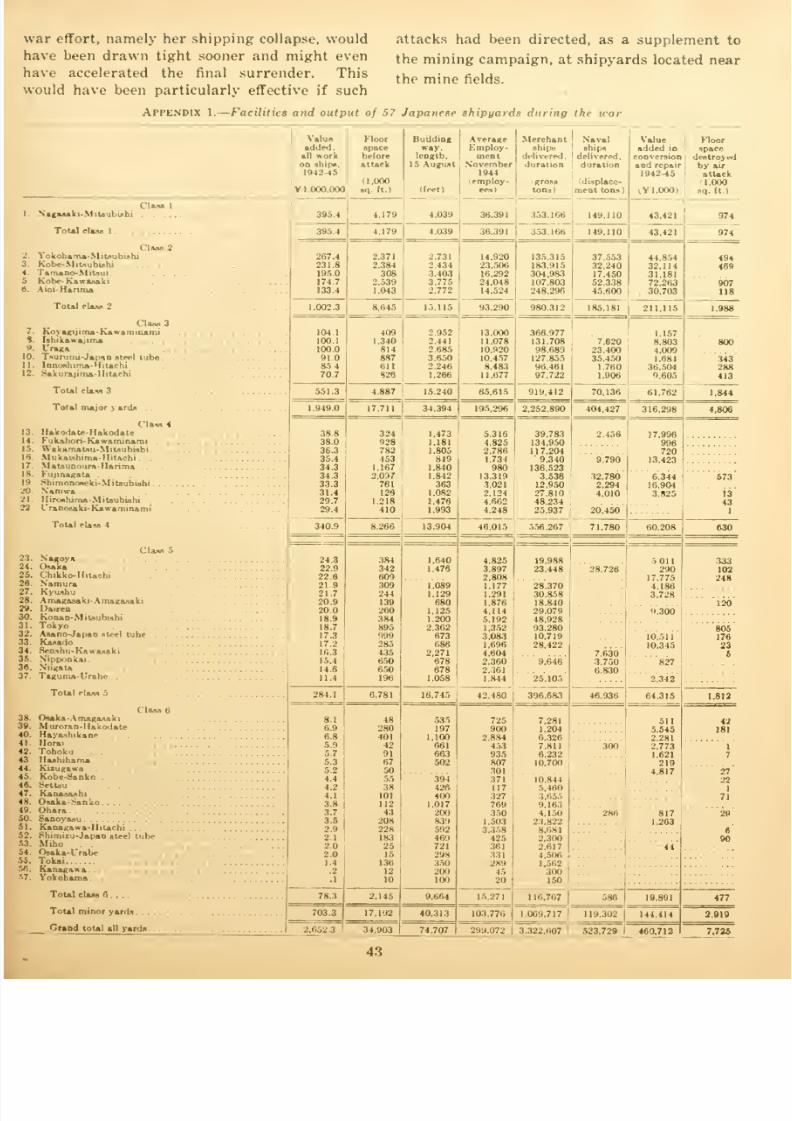
8/3/2019 USSBS Report 48, Japanese Merchant Shipbuilding
http://slidepdf.com/reader/full/ussbs-report-48-japanese-merchant-shipbuilding 51/61
effort, namely her shipping collapse, would
been drawn tight sooner and might even
accelerated the final surrender. This
have been particularly effective if such
Appendix 1. Facilities and output of 57 Japanese shipyards during the war
attacks had been directed, as a supplement to
the mining campaign, at shipyards located near
the mine fields.
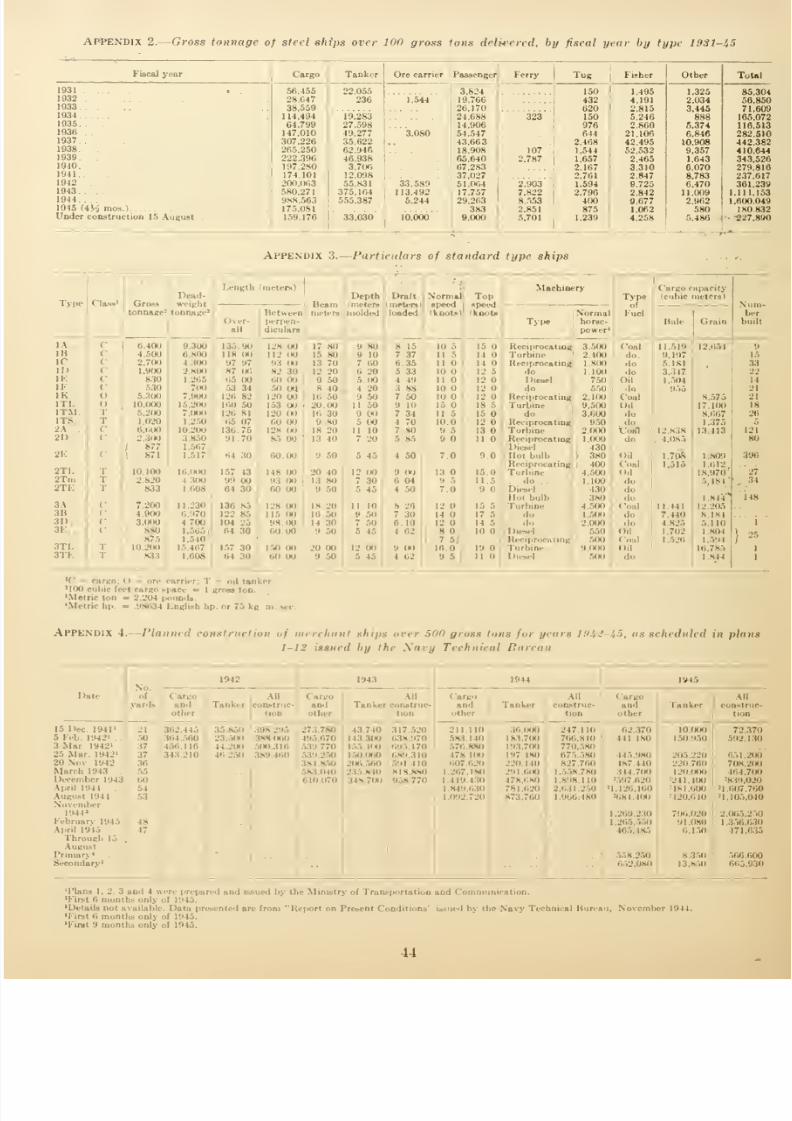
8/3/2019 USSBS Report 48, Japanese Merchant Shipbuilding
http://slidepdf.com/reader/full/ussbs-report-48-japanese-merchant-shipbuilding 52/61
APPENDIX 2. Gross tonnage of steel ships over 100 gross tuns 'delivered, by fiscal year by type 19S1-U5
Fiscal year

8/3/2019 USSBS Report 48, Japanese Merchant Shipbuilding
http://slidepdf.com/reader/full/ussbs-report-48-japanese-merchant-shipbuilding 53/61
Appendu .".. Monthly yen ruin, input and indexes on merchant shipbuilding
Liit ihip yen value ininit tiYl.OOO) 7 May 1946]
I [SCAL 1 I \l< nil
Ship iM-
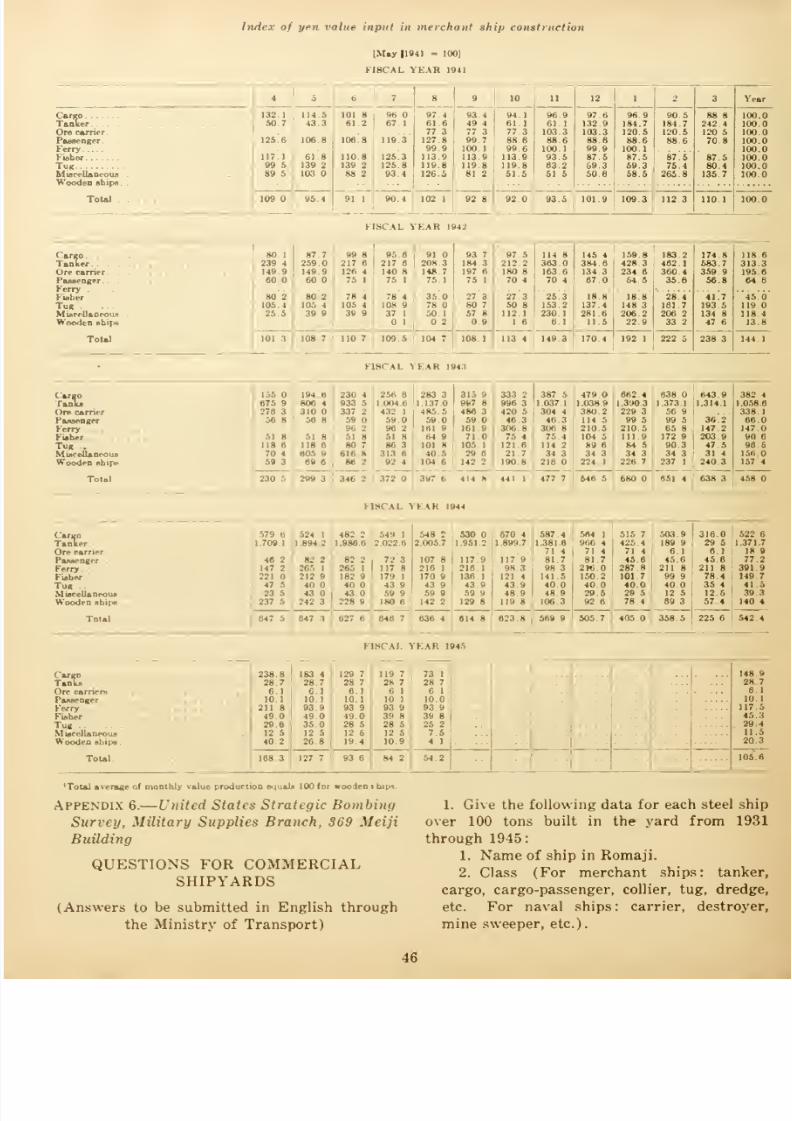
8/3/2019 USSBS Report 48, Japanese Merchant Shipbuilding
http://slidepdf.com/reader/full/ussbs-report-48-japanese-merchant-shipbuilding 54/61
Index of yen value input in merchant ship construct ion
lM»y 11941 - 1001
FISCAL YEAR 1941
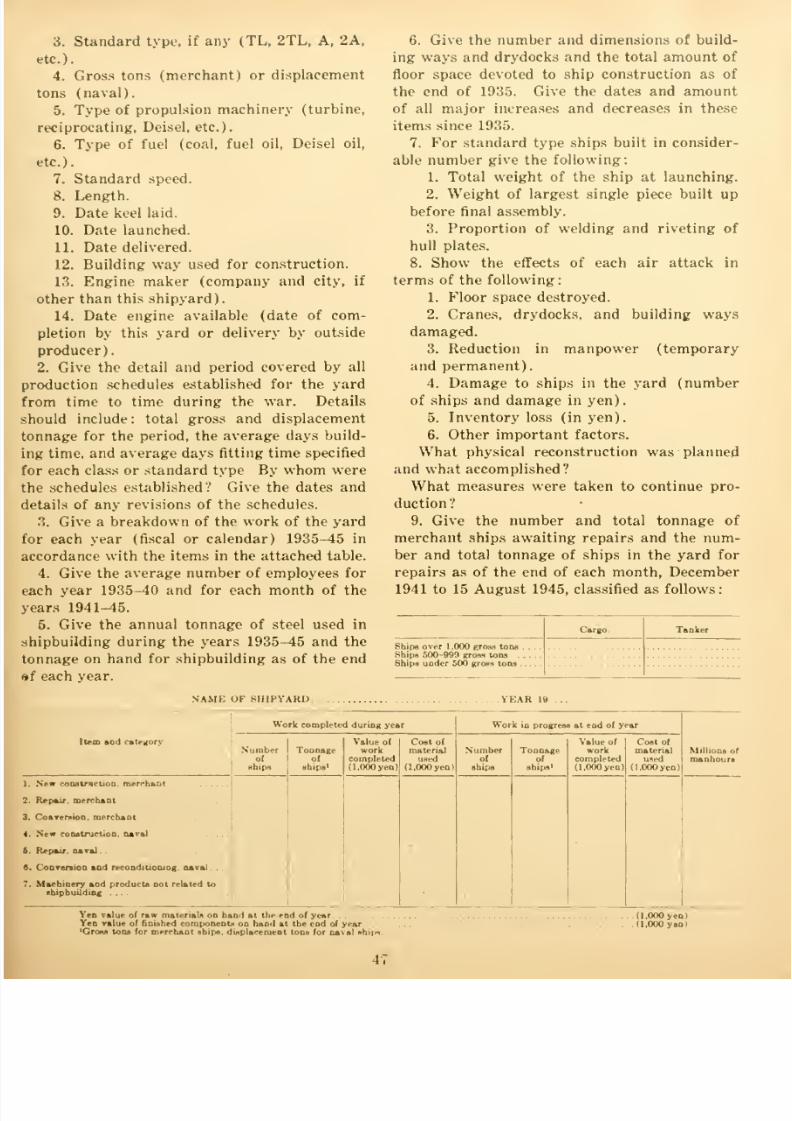
8/3/2019 USSBS Report 48, Japanese Merchant Shipbuilding
http://slidepdf.com/reader/full/ussbs-report-48-japanese-merchant-shipbuilding 55/61
3. Standard type, if any (TL, 2TL, A, 2A,
etc.).
4. Gross tons (merchant) or displacement
tons (naval).
5. Type of propulsion machinery (turbine,
reciprocating, Deisel, etc.).
6. Type of fuel (coal, fuel oil, Deisel oil,
etc.).
7. Standard speed.
8. Length.
9. Date keel laid.
10. Date launched.
11. Date delivered.
12. Building way used for construction.
13. Engine maker (company and city, if
other than this shipyard).
14. Date engine available (date of com-
pletion by this yard or delivery by outside
producer).
2. Give the detail and period covered by all
schedules established for the yard
time to time during the war. Details
include: total gross and displacement
for the period, the average days build-
time, and average days fitting time specified
each class or standard type By whom were
schedules established? Give the dates and
of any revisions of the schedules.
3. Give a breakdown of the work of the yard
each year (fiscal or calendar) 1935-45 in
with the items in the attached table.
4. Give the average number of employees for
year 1935-40 and for each month of the
1941-45.
5. Give the annual tonnage of steel used in
during the years 1935-45 and the
on hand for shipbuilding as of the end
each year.
6. Give the number and dimensions of build-
ing ways and drydocks and the total amount of
floor space devoted to ship construction as of
the end of 1935. Give the dates and amount
of all major increases and decreases in these
items since 1935.
7. For standard type ships built in consider-
able number give the following:
1. Total weight of the ship at launching.2. Weight of largest single piece built up
before final assembly.
3. Proportion of welding and riveting of
hull plates.
8. Show the effects of each air attack in
terms of the following
1. Floor space destroyed.
2. Cranes, drydocks, and building ways
damaged.
3. Reduction in manpower (temporary
and permanent).
4. Damage to ships in the yard (number
of ships and damage in yen).
5. Inventory loss (in yen).
6. Other important factors.
What physical reconstruction was planned
and what accomplished?
What measures were taken to continue pro-
duction?
9. Give the number and total tonnage of
merchant ships awaiting repairs and the num-ber and total tonnage of ships in the yard for
repairs as of the end of each month, December
1941 to 15 August 1945, classified as follows:
Ships over 1 ,000 gross tons .
Ships 500-999 gross tons .
Ships under 500 gross tons .
Cargo
NAME OF SHIPYARD YEAR 19
I tea and categorv
New construction, merchant
Repair merchant
Conversion, merchant
New construction, naval
Repair, naval.
Conversion and reconditioning, naval. .
Machinery and products not related to
shipbuilding
Work completed during year
Value of
workcompleted
(1.000 yen
Cost of
material
used
(1.000 yen)
Work in progress at end of year
Value of
workcompleted
(1,000 yen)
Cost of
material
used
(1,000 yen)
Yen value of raw materials on hand at the end of year . . .(1,000 yen)Yen value of finished components on hand at the end of year ... (1,000 yen)'Gross tons for merchant ships, displacement tons for naval ships.
i:

8/3/2019 USSBS Report 48, Japanese Merchant Shipbuilding
http://slidepdf.com/reader/full/ussbs-report-48-japanese-merchant-shipbuilding 56/61
UNITED STATES STRATEGIC BOMBING SURVEY
LIST OF REPORTS
The following is a bibliography of reports resulting
from the Survey's studies of the European and Pacific
wars. Certain of these reports may be purchased from
the Superintendent of Documents at the Government
Printing Office, Washington, I). C.
European War
OFFICE OF THE CHAIRMAN
1 The United States Strategic Bombing Survey:
Summary Report (European War)
2 The United States Strategic Bombing Survey:
Over-all Report (European War)
3 ' The Effects of Strategic Bombing on the German
War Economy
AIRCRAFT DIVISION
(By Division and Branch)
4 Aircraft Division Industry Report
5 Inspection Visits to Various Targets (Special
Report)
Airframes Branch
6 Junkers Aircraft and Aero Engine Works, Dessau,
Germany
7 Erla Maschinenwerke (I m 1> H, Heiterblick, Ger-
many
8 A T G Maschinenbau, GmbH, Leipzig < Mockau),
Germany
9 Gothaer Waggonfabrik, A G, Gotha, Germany
10 Focke Wulf Aircraft Plant, Bremen, Germany
ii nf u .. v ,• l Over-all Report1 ttesstei schmitl AG, i p
Augsburg, Germany J
p'
Appendices I, II, III
12 Dornier Works, Friedrichshafen & Munich. Ger-
many
13 Gerhard Fieseler Werke GmbH, Kassel, Ger-
many
14 Wiener Neustaedter Flugzeugwerke, Wiener Neu-
stadt, Austria
Aero Engines Branch
15 Bussing NAG Flugmotorenwerke GmbH, Bruns-
wick Germany
16 Mittel-Deutsche Motorenwerke GmbH, Taucha,
Germany
17 Bavarian Motor Works, Inc. Eisenach & Durrer-
hof, Germany
18 Bayerische Motorenwerke A G (BMWi Munich,
Germany19 Henschel Flugmotorenwerke, Kassel, Germany
Light Metal Branch
20 Light Metals Industry |Part 1, Aluminum
of Germany|Part II, Magnesium
21 Vereinigte Deutsche Metallwerke, Hildesheim,
Germany
22 Metallgussgesellschaft GmbH, Leipzig, Germany
23 Aluminiumwerk G m b H. Plant No. 2. Bitterfeld,
Germany
24 Gebrueder Giulini G m b H, Ludw igshafen, Ger-
many
25 Luftschiffbau .Zeppejin G m b II. Friedrichshafen
on Bodensee, Germany
26 Wieland Werke A G, Ulm, Germany
J7 Rudolph Rautenbach Leichmetallgiessereien, Sol-
'i. Germany
28 Lippewerke Vereinigte AAuminiumwerke A <;.
Lunen, Germany2:i Vereinigte Deutsche Metallwerke, Heddernheim,
< lermany
30 Duerener Metallwerke A G, Duren Wittenau-Ber-
lin &' Waren, Germany ., . •*»
"'
AREA STUDIES DIVISION
:il Ana Studies Division Report
\ Detailed Study of the Effects of Area Bombing
on Hamburg
A Detailed Study of the Effects of Area Bombingon Wuppertal
1 A Detailed Study of the Effects of Area Bombing
on Dusseldorf
35 A Detailed Study of the Effects of Area Bombing
on Solingen
36 A Detailed Study of the Effects of Area Bombing
on Remscheid
37 A Detailed Study of the Effects of Area Bombing
on Darmstadt
38 A Detailed Study of the Effects of Area Bombing
on Lubeck
39 A Brief Study of the Effects of Area Bombing on
Berlin, Augsburg. Bochum, Leipzig, Hagen,
Dortmund, Oberhausen, Schweinfurt, and
Bremen
CIVILIAN DEFENSE DIVISION
40 Civilian Defense Division—Final Report
41 Cologne Field Report
42 Bonn Field Report.
43 Hanover Field Report
44 Hamburg Field Report—Vol I, Text; Vol II,
Exhibits
45 Bad Oldesloe Field Report
46 Augsburg Field Report47 Reception Areas in Bavaria, Germany
48
8/3/2019 USSBS Report 48, Japanese Merchant Shipbuilding
http://slidepdf.com/reader/full/ussbs-report-48-japanese-merchant-shipbuilding 57/61
I < W II'MI \ I DIVISION
Electrical Branch
German Electrical Equipment Industry Report
Brown Boveri el Cie, Mannheim Kafertal, Ger-
many
Optical and Precision Instrument Branch
Optical an<l Precision Instrument Industry Report
Ibrasives Branch
The German Abrasive Industry
Mayer and Schmidt, Offenbach on Main, Ger-
many
Anti-Friction Branch
The German Anti-Friction Bearings Industry
Machine Tools Branch
Machine Tools & Machinery as Capital Equipment
Machine Tend Industry in Germany
Herman Kolh Co, Cologne, Germany
Collet and Engelhard, Offenbach, Germany
Xaxos Union, Frankfort on Main, Germany
MILITARY ANALYSIS DIVISION
The Defeat of the German Air Force
\ -Weapons (Crossbow) Campaign
Air Force Rate of Operation
Weather Factors in Combat Bombardment Opera-
tions in the European Theatre
Bombing Accuracy, USAAF Heavy and Medium
Bombers in the ETODescription of RAF Bombing
The Impact of the Allied Air Effort on German
Logu
MORALE DIVISION
The Effects of Strategic Bombing on German Mor-
ale (Vol. I and II)
Medical Branch
The Effect of Bombing on Health and Medical
Care in Germany
MUNITIONS DIVISION
Heavy Industry Branch
The Coking Industry Report on Germany
Coking Plant Report No. 1, Sections A, B, C, & DGutehoffnungshuette, Oberhausen, Germany
Friedrich-Alfred Huette, Rheinhausen, Germany
Neunkirchen Eisenwerke A (!, Neunkirchen, Ger-
many
Reichswerke Hermann Goering A G, Hallendorf,
Germany
August Thyssen Huette A G, Hamborn, Germany
Priedrich Krupp A (I, Borbeck Plant, Essen, Ger-
many
Dortmund Hoerder Huettenverein, A G, Dort-
mund, (iermany
Hoesch A G, Dortmund, (iermany
Bochumer Verein fuer Cusstahlfabrikation A G,
Bochum, Germany
Motor Vehicles and Tanks Branch
77 German Motor Vehicles Industry Report
78 Tank Industry Report
7'.i Daimler Benz A G, Cnterturkheim, Germany
80 Renault Motor Vehicles Plant, Billancourt, Paris
81 Adam Opel, Russelsheim, Germany
82 Daimler Benz-Gaggenau Works. Gaggenau, tier-
many
83 Maschinenfabrik Augsburg-Nurnberg, Nurnberg,
Germany
84 Auto Union A G, Chemnitz and Zwickau, Germany85 Henschel & Sohn, Kassel, Germany
86 Maybach Motor Works, Friedrichshafen, Germany
87 Voigtlander, Maschinenfabrik A G Plauen. (ier-
many
88 Volkswagenwerke, Fallersleben, Germany
89 Bussing NAG, Brunswick, Germany
90 Muehlenbau Industrie A (i (Miag) Brunswick,
Germany
91 Friedrich Krupp Grusonwerke, Magdeburg, Ger-
many
Submarine Branch
92 German Submarine Industry Report93 Maschinenfabrik Augsburg-Nurnljeig A (i. Augs-
burg, Germany
94 Blohm and Voss Shipyards, Hamburg, Germany
95 Deutsehewerke A G, Kiel, Germany
96 Deutsche Schiff und Masehinenbau, Bremen, Ger-
many
97 Friedrich Krupp Germaniawerft, Kiel, Germany
98 Howaldtswerke A G, Hamburg, Germany
99 Submarine Assembly Shelter, Farge, Germany
100 Bremer Vulkan, Vegesack, Germany
Ordnance Branch
101 Ordnance Industry Report
102 Friedrich Krupp Grusonwerke A G Magdeburg.
Germany
103 Bochumer Verein fuer Cusstahlfabrikation A G,
Bochum, Germany
104 Henschel & Sohn, Kassel, Germany
105 Rheinmetall-Borsig, Dusseldorf, Germany
106 Hermann Goering Werke, Braunschweig, Hallen-
dorf, Germany
107 Hannoverische Masehinenbau, Hanover, Germany
108 Gusstahlfabrik Friedrich Krupp, Essen, Germany
OIL DIVISION
109 Oil Division, Final Report
110 Oil Division, Final Report, Appendix
111 Powder, Explosives, Special Rockets and Jet Pro-
pellants, War Gases and Smoke Acid (Minis-
terial Report #1)
112 Underground and Dispersal Plants in Greater
Germany
113 The German Oil Industry, Ministerial Report
Team 78
11 1 Ministerial Report on Chemicals
Oil Branch
I 1
."> Ammoniakwerke Merseburg G m b H, Leuna, Ger-
many—2 Appendices
Hi; Braunkohle Benzin A G, Zeitz and Bohlen, Ger-
many Wintershall A G, Luetzkendorf, Germany
49
8/3/2019 USSBS Report 48, Japanese Merchant Shipbuilding
http://slidepdf.com/reader/full/ussbs-report-48-japanese-merchant-shipbuilding 58/61
117 Ludwigshafen-Oppau Works of I G Farbenindus-
trie A G, Ludwigshafen, Germany
118 Ruhroel Hydrogenation Plant, Bottrop-Boy, Ger-
many, Vol. I, Vol. II
119 Rhenania Ossag Mineraloelwerke A G, Harburg
Refinery, Hamburg, Germany
120 Rhenania Ossag Mineraloelwerke A G, Grasbrook
Refinery, Hamburg, Germany
121 Rhenania Ossag Mineraloelwerke A G, Wilhelms-
burg Refinery, Hamburg, Germany
122 Gewerkschaft Victor, Castrop-Rauxel, Germany,
Vol I and Vol II
123 Europaeische Tanklager und Transport A G,
Hamburg, Germany
124 Ebano Asphalt Werke A G, Harburg Refinery,
Hamburg, Germany
125 Meerbeck Rheinpreussen Synthetic Oil Plant
Vol I and Vol II
Rubber Branch
126 Deutsche Dunlop Gummi Co., Hanau on Main.
Germany
127 Continental Gummiwerke, Hanover, Germany
128 Huels Synthetic Rubber Plant
129 Ministerial Report on German Rubber Industry
Propellants Branch
130 Elektrochemischewerke, Munich, Germany
131 Schoenebeek Explosive Plant, Lignose Sprengstoff
Werke GmbH, Bad Salzemen, Germany
132 Plants of Dynamit A G, Vormal, Alfred Nobel &
Co, Troisdorf, Clausthal, Drummel and Dune-
berg, Germany
133 Deutsche Sprengchemie GmbH, Kraiburg, Ger-
many
OVERALL ECONOMIC EFFECTS DIVISION
134 Over-all Economic Effects Division Report
Gross National Product l Special papers
Kriegseilberichte ' which together
Herman Goering Works I comprise the
Food and Agriculture - above report
134a Industrial Sales Output and Productivity
PHYSICAL DAMAGE DIVISION
134b Physical Damage Division Report (ETO)
135 Villacoublay Airdrome, Paris, France
136 Railroad Repair Yards, Malines, Belgium
137 Railroad Repair Yards, Louvain, Belgium
138 Railroad Repair Yards, Hasselt, Belgium139 Railroad Repair Yards, Namur, Belgium
140 Submarine Pens, Brest, France
141 Powder Plant, Angouleme, France
142 Powder Plant, Bergerac, France
143 Coking Plants. Montigny & Lieee, Belgium
144 Fort St. Blaise Verdun Group, Metz, France
145 Gnome et Rhone, Limoges, France
146 Michelin Tire Factory, Clermont-Ferrand, France
147 Gnome et Rhone Aero Engine Factory, Le Mans.
France
148 Kugelfischer Bearing Ball Plant, Ebelsbach, Ger-
many
149 Louis Breguet Aircraft Plant, Toulouse, France150 S. N. C. A. S. E. Aircraft Plant, Toulouse, France
151 A. I. A. Aircraft Plant, Toulouse, France
152 V Weapons in London
153 City Area in Krefeld
154 Public Air Raid Shelters in Germany
155 Goldenberg Thermal Electric Power Station,
Knapsack, Germany
156 Brauweiler Transformer & Switching Station,
Brauweiler, Germany
157 Storage Depot, Nahbollenbach, Germany
158 Railway and Road Bridge, Bad Munster, Ger-
many
159 Railway Bridge, Eller, Germany160 Gustloff-Werke Weimar, Weimar, Germany
161 Henschell & Sohn GmbH, Kassel, Germany
162 Area Survey at Pirmasens, Germany
163 Hanomag, Hanover, Germany
164 M A N Werke Augsburg, Augsburg, Germany
165 Friedrich Krupp A G, Essen, Germany
166 Erla Maschinenwerke, GmbH, Heiterblick, Ger-
many
167 A T G Maschinenbau GmbH, Mockau, Germany
168 Erla Maschinenwerke GmbH, Mockau, Germany
169 Bayerische Motorenwerke, Durrerhof, Germany
170 Mittel-Deutsche Motorenwerke GmbH, Taucha,
Germany171 Submarine Pens Deutsche-Werft, Hamburg, Ger-
many
17ij Multi-Storied Structures, Hamburg, Germany
173 Continental Gummiwerke, Hanover, Germany
174 Kassel Marshalling Yards, Kassel, Germany
175 Ammoniawerke, Merseburg-Leuna, Germany
176 Brown Boveri et Cie, Mannheim, Kafertal, Ger-
many
177 Adam Opel A G, Russelheim, Germany
178 Daimler-Benz A G, Unterturkheim, Germany
179 Valentin Submarine Assembly, Farge, Germany
180 Volkswaggonwerke, Fallersleben, Germany
181 Railway Viaduct at Bielefeld, Germany182 Ship Yards Howaldtswerke, Hamburg, Germany
183 Blohm and Voss Shipyards, Hamburg, Germany
184 Daimler-Benz A G, Mannheim, Germany
185 Synthetic Oil Plant, Meerbeck-Hamburg, Germany
186 Gewerkschaft Victor, Castrop-Rauxel, Germany
187 Klockner Humboldt Deutz, Ulm, Germany
188 Ruhroel Hydrogenation Plant, Bottrop-Boy, Ger-
many
189 Neukirchen Eisenwerke A G, Neukirchen, Ger-
many
190 Railway Viaduct at Altenbecken, Germany
191 Railway Viaduct at Arnsburg, Germany
192 Deurag-Nerag Refineries, Misburg, Germany193 Fire Rails on German Cities
194 I G Farbenindustrie, Ludwigshafen, Germany,
Vol I and Vol II
195 Roundhouse in Marshalling Yard, Ulm, Germany
196 I G Farbenindustrie, Leverkusen, Germany
197 Chemische-Werke, Huels, Germany
198 Gremberg Marshalling Yard, Gremberg, Ger-
many
199 Locomotive Shops and Bridges at Hamm, Ger-
many
TRANSPORTATION DIVISION
200 The Effects of Strategic Bombing on GermanTransportation
50
8/3/2019 USSBS Report 48, Japanese Merchant Shipbuilding
http://slidepdf.com/reader/full/ussbs-report-48-japanese-merchant-shipbuilding 59/61
Rail Operations Over the Brenner Pass
Effects of Bombing on Railroad Installations in
Regensburg, Nurnberg and Munich Divisions
German Locomotive Industry During the WarGerman Military Railroad Traffic
UTILITIES DIVISION
German Electric Utilities Industry Report
1 to 10 in Vol I "Utilities Division Plant Reports"
11 to 20 in Vol II "Utilities Division Plant
Reports"
21 Rheinische-Westfalische Elektrizitaetswerk
A G
Pacific War
OFFICE OF THE CHAIRMAN
Summary Report (Pacific War)
Japan's Struggle to End The WarThe Effects of Atomic Bombs on Hiroshima and
Nagasaki
CIVILIAN STUDIES
Civilian Defense Division
Field Report Covering Air Raid Protection and
Allied Subjects, Tokyo, Japan
Field Report Covering Air Raid Protection and
Allied Subjects, Nagasaki, Japan
Field Report Covering Air Raid Protection and
Allied Subjects, Kyoto, Japan
Field Report Covering Air Raid Protection and
Allied Subjects, Kobe, Japan
Field Report Covering Air Raid Protection and
Allied Subjects, Osaka, Japan
Field Report Covering Air Raid Protection and
Allied Subjects, Hiroshima, Japan—No. 1
Summary Report Covering Air Raid Protection
and Allied Subjects in Japan
Final Report Covering Air Raid Protection and
Allied Subjects in Japan
Medical Division
The Effects of Bombing on Health and Medical
Services in Japan
The Effects of Atomic Bombs on Health and Medi-
cal Services in Hiroshima and Nagasaki
Morale Division
The Effects of Strategic Bombing on JapaneseMorale
ECONOMIC STUDIES
Aircraft Division
The Japanese Aircraft Industry
Mitsubishi Heavy Industries, Ltd.
Corporation Report Xo. I
(Mitsubishi Jukogyo KK)(Airframes & Engines)
Nakajima Aircraft Company, Ltd.
Corporation Report Xo. II
(Nakajima Hikoki KK)(Airframes & Engines)
18 Kawanishi Aircraft Company
Corporation Report Xo. Ill
(Kawanishi Kokuki Kabushiki Kaisha)
(Airframes)
19 Kawasaki Aircraft Industries Company, Inc.
Corporation Report Xo. TV
Kawasaki Kokuki Kogyo Kabushiki
Kaisha)
(Airframes & Engines)
20 Aichi Aircraft Company
Corporation Report Xo. V(Aichi Kokuki KK)(Airframes & Engines)
21 Sumitomo Metal Industries, Propeller Division
Corporation Report Xo. VI
(Sumitomo Kinzoku Kogyo KK, Puropera
Seizosho)
(Propellers)
22 Hitachi Aircraft Company
Corporation Report Xo. VII
(Hitachi Kokuki KK)(Airframes & Engines)
23 Japan International Air Industries, Ltd.
Corporation Report Xo. VIII
Nippon Kokusai Koku Kogyo KK)(Airframes)
24 Japan Musical Instrument Manufacturing Com-
pany
Corporation Report Xo. IX
(Nippon Gakki Seizo KK)(Propellers)
25 Tachikawa Aircraft Company
Corporation Report Xo. X(Tachikawa Hikoki KK)(Airframes)
26 Fuji Airplane Company
Corporation Report Xo. XI
(Fuji Hikoki KK)(Airframes)
27 Showa Airplane Company
Corporation Report Xo. XII
(Showa Hikoki Kogyo KK)(Airframes)
28 Ishikawajima Aircraft Industries Company, Ltd.
Corporation Report Xo. XIII
(Ishikawajima Koku Kogyo Kabushiki
Kaisha)
(Engines)
29 Nippon Airplane Company
Corporation Report Xo. XTV(Nippon Hikoki KK)(Airframes)
30 Kyushu Airplane Company
Corporation Report Xo. XV(Kyushu Hikoki KK)(Airframes)
31 Shoda Engineering CompanyCorporation Report Xo. XVI
(Shoda Seisakujo)
(Components)
32 Mitaka Aircraft Industries
Corporation Report Xo. XVII
(Mitaka Koku Kogyo Kabushiki Kaisha)
(Components)
51
8/3/2019 USSBS Report 48, Japanese Merchant Shipbuilding
http://slidepdf.com/reader/full/ussbs-report-48-japanese-merchant-shipbuilding 60/61
33 Nissan Automobile Company
Corporation Report No. XVIII
(Nissan Jidosha KK)
(Engines)
34 Army Air Arsenal & Navy Air Depots
Corporation Report No. XIX(Airframes & Engines)
35 Japan Aircraft Underground
Report No. XX
Basic Materials Division
36 Coal and Metals in Japan's War Economy
Capital Goods, Equipment and Construction Division
37 The Japanese Construction Industry
38 Japanese Electrical Equipment
39 The Japanese Machine Building Industry
Electric Power Division
40 The Electric Power Industry of Japan
41 The Electric Power Industry of Japan (Plant Re-
ports)
Manpower, Food and Civilian Supplies Division
42 The Japanese Wartime Standard of Living and
Utilization of Manpower
Military Supplies Division
43 Japanese War Production Industries
44 Japanese Naval Ordnance
45 Japanese Army Ordnance
46 Japanese Naval Shipbuilding
47 Japanese Motor Vehicle Industry
48 Japanese Merchant Shipbuilding
Oil and Chemical Division
49 Chemicals in Japan's War
50 Chemicals in Japan's War Appendix
51 Oil in Japan's War52 Oil in Japan's War—Appendix
Over-all Economic Effects Division
53 The Effects of Strategic Bombing on Japan's Wai
Economy (Including Appendix A: 1'. S. Eco-
nomic Intelligence on Japan—Analysis and
Comparison; Appendix B: Gross National Prod-
uct on Japan and Its Components ; Appendix C:
Statistical Sources).
Transportation Division
54 The War Against Japanese Transportation. 1941
1946
Urban Areas Division
55 Effects of Air Attack on Japanese Urban Econ-
omy (Summary Report)
56 Effects of Air Attack on Urban Complex Tokyo-
Kawasaki-Yokohama
57 Effects of Air Attack on the City of Nagoya
58 Effects of Air Attack on Osaka-Kobe-Kyoto
59 Effects of Air Attack on the City of Nagasaki
60 Effects of Air Attack on the City of Hiroshima
MILITARY STUDIES
Military Analysis Division
61 Air Forces Allied with the United States in the
War Against Japan
62 Japanese Air Power
63 Japanese Air Weapons and Tactics
64 The Effect of Air Action on Japanese Ground
Army Logistics
65 Employment of Forces Under the Southwest
Pacific Command66 The Strategic Air Operations of Very Heavy
Bombardment in the War Against Japan
(Twentieth Air Force)
67 Air Operations in China, Burma, India—World
WarII
68 The Air Transport Command in the War Against
Japan
69 The Thirteenth Air Force in the War Against
Japan
70 The Seventh and Eleventh Air Forces in the WarAgainst Japan
71 The Fifth Air Force in the War Against Japan
Naval Analysis Division
7J The Interrogations of Japanese Officials (Vols. I
and II)
73 Campaigns of the Pacific War74 The Reduction of
WakeIsland
75 The Allied Campaign Against Rabaul
76 The American Campaign Against Wotje, Maloe-
lap, Mille, and Jaluit (Vols. I. II and III)
77 The Reduction of Truk
78 The Offensive Mine Laying Campaign Against
Japan
79 Report of Ships Bombardment Survey Party
Foreword. Introduction. Conclusions, and Gen-
eral Summary
80 Report of Ships Bombardment Survey Party ( En-
closure A), Kamaishi Area
81 Report (>r Ships Bombardment Survey Party (En-
closureB). Hamamatsu Area
82 Report of Ships Bombardment Survey Party (En-
closure C), H itachi Area
83 Report of Ships Bombardment Survey Party (En-
closure I)). Hakodate Area
84 Report of Ships Bombardment Survey Party (En-
closure E), Muroran Area
85 Report of Ships Bombardment Survey Party (En-
closure F), Shimizu Area
B6 Keport of Ships Bombardment Survey Party (En-
closures G and H), Shionomi-Saki and Nojima-
Saki Areas
87 Report of Ships Bombardment Survey Party (En-
closure I), Comments and Data on Effectivenessof Ammunition
88 Report of Ships Bombardment Survey Party (En-
closure J). Comments and Data on Accuracy of
Firing
89 Report of Ships Bombardment Survey Party (En-
closure K), Effects of Surface Bombardments
on Japanese War Potential
Physical Damage Division
90 Effect of the Incendiary Bomb Attacks on Japan
(a Report on Eight Cities)
91 The Effects of the Ten Thousand Pound Bomb on
Japanese Targets (a Report on Nine Incidents)
92 Effects of the Atomic Bomb on Hiroshima, Japan
93 Effects of the Atomic Bomb on Nagasaki, Japan
52

8/3/2019 USSBS Report 48, Japanese Merchant Shipbuilding
http://slidepdf.com/reader/full/ussbs-report-48-japanese-merchant-shipbuilding 61/61
Effects of the Four Thousand Pound Bomb on
Japanese Targets (a Report on Five Incidents)
Effects of Two Thousand, One Thousand, and Five
Hundred Pound Bombs on Japanese Targ
Report on Bight Incidents I
A Report on Physical Damage in Japan i Sum-
mary Report)
G-2 Di\ ision
Japanese Military and Naval Intelligence
Evaluation of Photographic Intelligence in the
Japanese Homeland. Part I. Comprehensivi
!; port
Evaluation of Photographic Intelligence in the
Japanese Homeland, Part II, Airfields
Evaluation of Photographic Intelligence in the
Japanese Homeland, Part III. Computed BombPlotting
Ml