Embed Size (px)
Citation preview
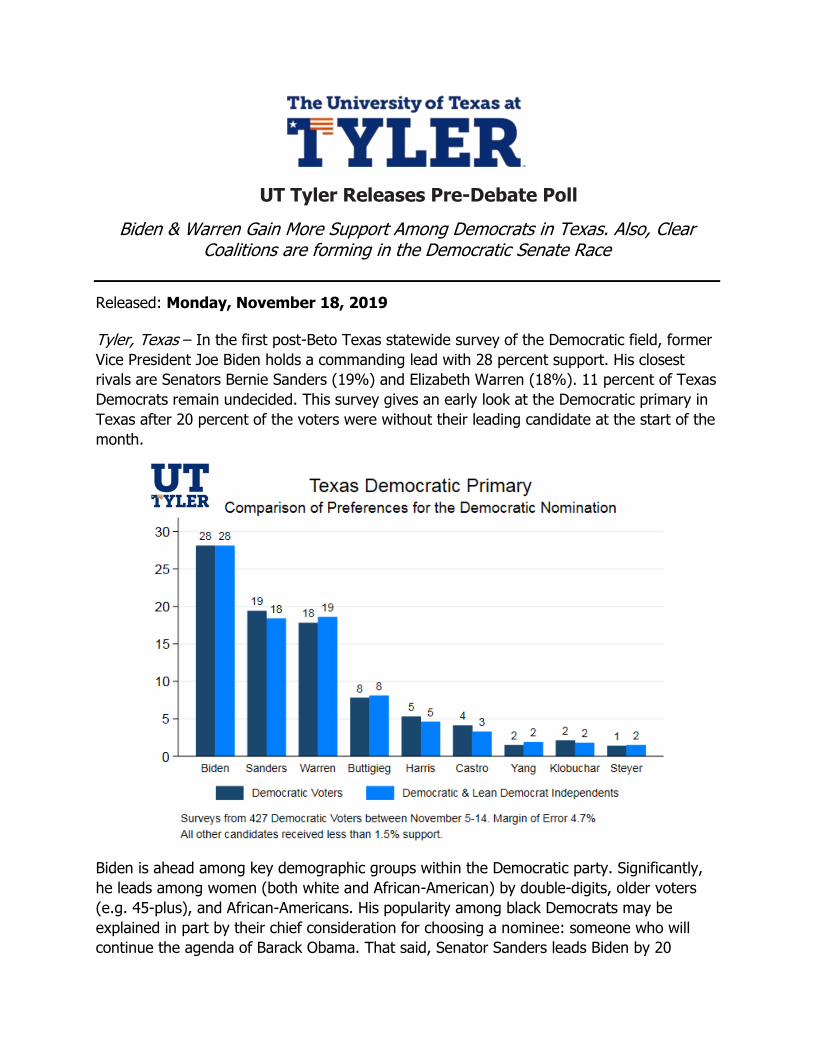
UT Tyler Releases Pre-Debate Poll
Biden & Warren Gain More Support Among Democrats in Texas. Also, Clear Coalitions are forming in the Democratic Senate Race
Released: Monday, November 18, 2019
Tyler, Texas – In the first post-Beto Texas statewide survey of the Democratic field, former
Vice President Joe Biden holds a commanding lead with 28 percent support. His closest
rivals are Senators Bernie Sanders (19%) and Elizabeth Warren (18%). 11 percent of Texas
Democrats remain undecided. This survey gives an early look at the Democratic primary in
Texas after 20 percent of the voters were without their leading candidate at the start of the
month.
Biden is ahead among key demographic groups within the Democratic party. Significantly,
he leads among women (both white and African-American) by double-digits, older voters
(e.g. 45-plus), and African-Americans. His popularity among black Democrats may be
explained in part by their chief consideration for choosing a nominee: someone who will
continue the agenda of Barack Obama. That said, Senator Sanders leads Biden by 20

percent among Latino Democrats and 27 percent among voters between the ages of 18
and 29 years.
Tracking Momentum Across Recent UT Tyler Polls
Candidate Change November September August July
Biden + 2.1% 28.1% 26.0% 23.0% 24.4% Sanders + 1.6% 19.4 17.6 16.0 15.4 Warren + 6.7% 17.8 11.1 10.3 10.6 Buttigieg + 4.6% 7.8 3.2 3.9 1.5 Harris - 0.1% 5.3 5.4 5.3 8.5 Castro +0.1% 4.1 4.0 4.0 3.3
The percentages above indicate the change in candidate support among self-identified
Democrats in each of the UT Tyler surveys that have occurred following previous candidate
debates. These trends in candidate support also look similar if we include independents that
lean towards the Democratic Party. The only exception with the more inclusive definition of
the electorate in the March primary is that support for Senator Sanders fades and support
for Senator Warren increases slightly.
SENATE DEMORCRATIC PRIMARY: CLEAR COALITIONS FORMING
The vast majority of Texas Democrats remain undecided on the U.S. senate primary. No
candidate is winning double-digit support nor leading outside of the margin of error.
Nonetheless, our results reveal stark racial contours among the supporters of the declared

candidates. MJ Hegar (a white woman) is leading by 5 percent among white voters
(followed by former U.S. Representative Chris Bell – a white man). Meanwhile, Texas state
senator Royce West, a black man, is leading among black voters by 12 percent. Finally,
Latina organizer and activist Cristina Ramirez is ahead with Latino Democrats by 19
percent.
PRESIDENTIAL APPROVAL DURING THE IMPEACHMENT INQUIRY
President Donald Trump’s job approval is up from our last survey in September. It now stands at 43 percent approval among all registered Texans. His disapproval stands at 49
percent with 8 percent not sure. When asked to consider what they currently know,
whether President Trump should or should not be impeached, 45 percent support
impeachment and 47 percent do not. 8 percent of respondents were not sure. Clearly,
these results indicate an ambivalence among Texans on the question of impeachment.
EARLY LOOK AT THE 2020 GENERAL ELECTION: FEWER UNDECIDEDS FOR EACH
MATCH UP
One year out from the 2020 election, President Trump is leading all Democrats in head to
head contests. He beats Joe Biden (+5), Bernie Sanders (+4), and Elizabeth Warren (+11).
Kamala Harris, Pete Buttigieg, and Julian Castro also trail Trump by double-digits.
Interestingly, Trump’s surging support in head to heads since September appears to be coming from previously undecided respondents.

POLICY ISSUES: INTEREST IN MANDATORY BUYBACK OF GUNS FADES
On gun issues, a plurality of Texans (42%) now disapprove of a mandatory buyback
program to turn in all assault weapons for payment (37% approve). This is a significant
shift from our September survey, which found a near majority approval for such a program.
Our November results indicate that both Republicans and Independents have changed their
minds. For instance, 33 percent of Texas Republicans approved of a mandatory buyback in
September, that number now stands at 17 percent. Overall, 21 percent of Texans are still
ambivalent about the issue.
Methodology
The UT Tyler-Texas Opinion Survey reflects a statewide random sample of 1,093 registered voters during the ten days between November 5 and November 14. The mixed mode sample includes 397 registered voters who took the survey by phone and 696 registered voters that were randomly selected from a panel of registered voters that have opted-in to take surveys through a company called Dynata. The online and phone surveys were conducted in English and Spanish. The data were weighted to be representative of the Texas register voter population. Iterative weighting was used to balance sample demographics to the state population parameters. The sample is balanced to match parameters for gender, age, race/ethnicity, and education using an iterated process known as raking. These parameters were derived from 2018 Current Population Survey to reflect Texas’s electorate. The use of these weights in statistical analysis ensures that the characteristics of the sample closely reflect the characteristics of registered voters in Texas. In this poll, the sampling error for 1,093 registered voters in Texas is +/- 2.96 percentage points at a 95 percent confidence interval. The survey’s design asked additional questions to 427 registered voters who identify with the Democratic Party as members or independents that lean towards the party (margin of error of +/- 4.7%). Visit http://www.uttyler.edu/politicalscience/pollingcenter for information about our studies.
A member of the prestigious UT System, The University of Texas at Tyler focuses on
student success and innovative research in the more than 80 undergraduate and
graduate degree programs offered. With more than 10,000 students, UT Tyler has
facilities in Tyler, Longview, Palestine and Houston.
FOR MORE INFORMATION, CONTACT BEVERLEY GOLDEN
[email protected] | 903.330.0495
FOR DETAILS ABOUT THE SURVEY, CONTACT MARK OWENS
[email protected] | 903.566.6281
##31##

Page 1 of 12 The University of Texas at Tyler Texas Opinion Survey: November 5-14, 2019
Center for
Opinion Research
Texas Opinion Survey Field Dates: November 5-14, 2019 N=1,093 Adults (Registered Voters) Margin of error: +/- 3.0% N=427 Democratic Primary Voters Margin of error: +/- 4.7%
Survey of Registered Voters in Texas
Are you very enthusiastic, somewhat enthusiastic, somewhat unenthusiastic, or very
unenthusiastic about voting in the March primary?
Weighted Strong Dem.
Weak Dem.
Ind. Dem
Ind. No party
Ind. Rep.
Weak Rep.
Strong Rep.
Very Enthusiastic 49.4% 71.8% 33.9% 38.3% 36.5% 35.7% 23.5% 61.7% Somewhat Enthusiastic 27.9 19.9 31.8 32.4 16.8 41.2 45.6 25.1 No opinion 11.1 4.0 26.5 6.7 5.1 8.5 12.3 6.1 Somewhat Unenthusiastic 6.5 0.9 4.8 10.8 27.0 7.9 14.4 5.0 Very Unenthusiastic 5.2 3.4 3.1 11.8 14.7 6.7 4.5 2.1
Total = 1,090 233 89 81 22 131 126 337
In the 2020 primary, do you plan to vote in the Democratic primary, Republican primary,
or not at all?
Weighted
Democratic primary 40.8% Republican primary 43.3 Neither 5.7 Not sure 10.2
Total = 1,090
Do you consider yourself to be a Republican, Democrat, or neither?
Weighted
Republican 38.9% Democrat 35.0 Neither 26.1
Total = 1,093

Page 2 of 12 The University of Texas at Tyler Texas Opinion Survey: November 5-14, 2019
[If Republican or Democrat] Do you consider yourself to be a strong [Republican/
Democrat] or not strong [Republican/ Democrat]?
OR [If independent, no preference, or other party] Do you think of yourself as closer to the
Republican Party or to the Democratic Party?
Weighted
Strong Republican 29.5% Not strong Republican 12.1 Lean Republican, Independent 11.8 Lean to no Party, Independent 2.0 Lean Democratic, Independent 7.3 Not strong Democrat 10.6 Strong Democrat 26.9
Total = 1,021
Using a 7-point scale where 1 is extremely liberal and 7 is extremely conservative, how
would you rate your political views.
Weighted Dem. Ind. Rep.
Extremely liberal 8.7% 17.1% 2.3% 4.8% Liberal 12.4 24.9 6.5 4.6 Slightly Liberal 8.5 12.2 14.3 2.2 Moderate, Middle of the Road 26.1 29.4 46.5 12.6 Slightly Conservative 12.0 8.1 14.8 13.9 Conservative 17.2 4.0 11.1 31.8 Extremely Conservative 15.1 4.3 4.5 30.1
Total = 1,000 365 217 418
In general, do you approve or disapprove of the way President Donald Trump is handling
his job as President?
Weighted Dem. Ind. Rep.
Approve 43.3% 7.0% 33.6% 81.5% Disapprove 49.0 86.5 54.3 12.2 Don’t Know 7.7 6.5 12.1 6.4
Total = 1,026 376 233 417
In general, do you approve or disapprove of the way Senator John Cornyn is handling his
job as Senator?
Weighted Dem. Ind. Rep.
Approve 36.1% 15.9% 22.2% 62.1% Disapprove 34.6 60.4 32.4 12.5 Don’t Know 29.3 32.4 45.4 25.4
Total = 1,027 376 233 418

Page 3 of 12 The University of Texas at Tyler Texas Opinion Survey: November 5-14, 2019
[If Democrat] Please list in order of importance the following characteristics you prefer in
a Democratic nominee for president.
Rank 1 Rank 2 Rank 3 Rank 4
Closest to [me] on the issues 36.5% 30.1% 18.1% 15.3% Supports the policy legacy of President Obama 30.5 17.7 20.2 31.6 Will appeal to independents 25.7 29.0 27.3 18.0 Will energize the base 20.2 27.0 26.7 26.0
Total = 422
[If Democrat or Independent closer to Democratic Party] Who is your FIRST CHOICE
candidate in the Democratic primary?
Dem. Ind.
(Lean D) All White Hispanic Black
Joe Biden 28.1% 28.2% 28.1% 33.2% 19.8% 30.9% Bernie Sanders 19.4 14.5 18.4 11.0 39.4 7.1 Elizabeth Warren 17.8 21.5 18.6 23.3 11.4 17.9 Pete Buttigieg 7.8 9.2 8.1 13.0 4.0 5.7 Kamala Harris 5.3 1.5 4.6 4.4 - 7.9 Julian Castro 4.1 - 3.3 1.3 6.2 3.0 Andrew Yang 1.5 3.3 1.9 - 3.9 3.0 Amy Klobuchar 2.1 0.8 1.8 2.0 2.4 0.9 Tom Steyer 1.4 - 1.5 0.5 2.3 - Tulsi Gabbard 0.8 2.4 1.1 1.4 1.7 - Marian Williamson 1.2 - 1.0 - - 4.3 Joe Sestak 1.1 - 0.9 - 3.1 - Cory Booker 0.4 0.9 0.5 0.6 - - John Delaney 0.1 - 0.1 - - - Michael Bennett - - - - - - Steve Bullock - - - - - - Wayne Messam - - - - - - Not Sure 8.8 17.6 10.6 9.4 3.8 18.1
Total = 324 103 427 260 58 62

Page 4 of 12 The University of Texas at Tyler Texas Opinion Survey: November 5-14, 2019
[If Democrat or Independent closer to Democratic Party] Who is your SECOND CHOICE
candidate in the Democratic primary?
Dem. Ind.
(Lean D) All White Hispanic Black
Joe Biden 16.4% 21.2% 17.3% 17.3% 18.0% 17.6% Elizabeth Warren 20.2 11.8 18.5 19.2 20.6 15.7 Bernie Sanders 16.4 9.7 17.3 8.9 13.4 14.2 Pete Buttigieg 10.8 11.3 10.6 18.5 6.0 1.1 Kamala Harris 8.6 7.9 8.4 6.8 8.4 12.4 Julian Castro 5.6 4.5 5.4 3.1 12.5 - Cory Booker 4.0 3.2 3.9 2.8 3.0 7.3 Amy Klobuchar 3.2 3.8 3.3 4.9 1.1 4.2 Tulsi Gabbard 2.5 - 2.0 1.3 2.8 3.0 John Delaney 1.3 0.3 1.1 0.2 2.3 - Marian Williamson 1.2 - 1.0 1.4 1.2 - Michael Bennett 0.9 - 0.7 - - 2.8 Joe Sestak 0.7 0.8 0.7 0.2 - 2.4 Wayne Messam 0.6 - 0.5 - 1.7 - Andrew Yang 0.5 2.2 0.8 1.9 - - Tom Steyer 0.4 0.7 0.5 0.4 1.2 - Not Sure 11.0 17.6 13.3 12.6 6.0 19.2
Total = 322 103 424 258 59 62
[If Democrat or Independent Lean Democrat] In the Texas Democratic primary for the
U.S. Senate, which candidate do you support?
Weighted White Hispanic Black
Cristina Tzintzún Ramirez 9.4% 4.1% 18.6% 9.9% M.J. Hegar 8.5 12.6 4.3 4.2 Royce West 8.3 7.2 0.5 22.3 Amanda Edwards 8.1 5.6 10.2 10.9 Chris Bell 7.4 7.3 8.6 5.9 Someone else 6.5 6.3 6.1 4.0 Not sure 51.9 57.0 51.7 42.9
Total = 427 260 59 63

Page 5 of 12 The University of Texas at Tyler Texas Opinion Survey: November 5-14, 2019
[If Republican] If the general election for president were held today, for whom would you
vote?
Weighted
Donald Trump 78.3% Mark Sanford 3.9 Joe Walsh 1.4 Bill Weld 0.9 Not sure 15.5
Total = 597
[If Republican CHOSE someone other than Donald Trump] If Donald Trump is the
Republican nominee, would you be willing to support the Democratic Nominee?
Weighted
Yes 46.7% No 27.2 Not Sure 26.2
Total = 77
If the general election for president were held today, for whom would you vote?
Weighted Dem. Ind. Rep.
Elizabeth Warren 34.6% 73.4% 28.4% 4.0% Donald Trump 45.7 4.4 37.7 88.5 Neither – Other 13.5 17.3 20.8 5.2 Not sure 6.1 5.0 13.2 2.4
Total = 1,086 323 299 464
If the general election for president were held today, for whom would you vote?
Weighted Dem. Ind. Rep.
Joe Biden 39.4% 76.9% 37.2% 7.2% Donald Trump 44.5 3.6 36.5 86.7 Neither – Other 11.9 16.9 17.2 3.9 Not sure 4.1 2.6 9.1 2.2
Total = 1,091 325 299 467
If the general election for president were held today, for whom would you vote?
Weighted Dem. Ind. Rep.
Kamala Harris 33.1% 67.5% 29.1% 4.8% Donald Trump 46.3 5.1 39.3 87.9 Neither – Other 14.8 22.8 20.2 4.0 Not sure 5.9 4.7 11.4 3.4
Total = 1,091 325 299 467

Page 6 of 12 The University of Texas at Tyler Texas Opinion Survey: November 5-14, 2019
If the general election for president were held today, for whom would you vote?
Weighted Dem. Ind. Rep.
Bernie Sanders 39.9% 82.0% 34.2% 5.8% Donald Trump 44.2 3.0 37.3 86.1 Neither – Other 11.4 11.9 20.0 5.3 Not sure 4.4 3.1 8.5 2.8
Total = 1,088 325 298 465
If the general election for president were held today, for whom would you vote?
Weighted Dem. Ind. Rep.
Pete Buttigieg 32.7% 65.4% 29.4% 5.5% Donald Trump 45.3 4.9 37.3 87.0 Neither – Other 14.7 24.0 19.6 3.0 Not sure 7.4 5.8 13.7 4.5
Total = 1,089 324 299 466
If the general election for president were held today, for whom would you vote?
Weighted Dem. Ind. Rep.
Julian Castro 34.2% 69.7% 29.5% 5.3% Donald Trump 45.2 5.2 37.9 86.2 Neither – Other 13.6 18.5 19.7 5.0 Not sure 7.1 6.7 13.0 3.5
Total = 1,088 324 299 465
Generations of slavery and discrimination have created conditions that make it difficult for
blacks to work their way out of the lower class.
Weighted
Strongly disagree 21.4% Somewhat disagree 20.9 Have a neutral position 15.7 Somewhat agree 19.4 Strongly agree 22.6
Total = 1,081

Page 7 of 12 The University of Texas at Tyler Texas Opinion Survey: November 5-14, 2019
Irish, Italians, Jewish and many other minorities overcame prejudice and worked their
way up. Blacks should do the same without any special favors.
Weighted
Strongly disagree 25.9% Somewhat disagree 20.6 Have a neutral position 21.5 Somewhat agree 14.6 Strongly agree 17.3
Total = 1,074
Based on what know today, do you believe that President Trump should be impeached?
Weighted Dem. Ind. Rep.
Should be impeached 44.8% 83.6% 41.1% 13.0% Should not be impeached 46.9 8.7 46.3 81.4 Neutral 8.2 7.8 12.7 5.6
Total = 1,090 324 299 467
Overall, do you agree or disagree that elected officials are doing enough to prevent mass
shootings?
Weighted Dem. Ind. Rep.
Strongly agree 8.1% 6.0% 4.3% 12.4% Agree 11.9 6.3 10.5 17.8 Somewhat agree 15.1 8.2 13.7 22.1 Somewhat disagree 16.8 13.5 19.3 18.0 Disagree 15.9 19.7 13.5 14.1 Strongly disagree 27.9 43.7 32.9 10.4 Not Sure 4.4 2.6 5.8 5.1
Total = 1,087 390 240 535
To what degree do you agree or disagree, over the last few years, trust of the police has
declined in your community?
Weighted White Hispanic Black
Strongly agree 8.9% 5.3% 11.9% 10.1% Agree 7.7 8.2 13.0 7.8 Somewhat agree 17.2 16.2 21.4 15.8 Somewhat disagree 15.5 14.4 22.1 13.7 Disagree 17.5 20.6 3.5 12.9 Strongly disagree 13.2 14.4 14.0 16.0 No Answer 20.1 20.9 14.1 23.7
Total = 1,087 799 94 84

Page 8 of 12 The University of Texas at Tyler Texas Opinion Survey: November 5-14, 2019
To what degree do you agree or disagree, over the last few years, there has been an
increase in tension between the police and minority communities?
Weighted White Hispanic Black
Strongly agree 11.8% 8.9% 15.2% 19.3% Agree 17.8 18.6 19.9 15.2 Somewhat agree 20.9 23.5 21.4 13.2 Somewhat disagree 9.1 7.6 11.4 11.2 Disagree 6.9 6.6 9.0 3.7 Strongly disagree 4.6 3.7 5.5 4.9 No Answer 28.9 31.0 17.6 32.6
Total = 1,083 799 93 84
To what degree do you agree or disagree, over the last few years, there has been an
increase in derogatory statements made about the police?
Weighted White Hispanic Black
Strongly agree 13.9% 15.7% 12.3% 14.1% Agree 15.1 17.0 15.1 8.8 Somewhat agree 17.3 18.3 19.5 15.6 Somewhat disagree 11.8 7.3 21.0 13.4 Disagree 6.4 6.4 4.8 11.7 Strongly disagree 6.7 4.2 10.3 11.5 No Answer 28.8 31.2 17.1 24.9
Total = 1,084 799 93 84
How do you primarily hear about instance of police behavior?
Weighted White Hispanic Black
Local news 43.3% 45.3% 42.9% 42.1% National news 47.6 47.9 50.0 37.9 Friends and Family 7.0 5.9 6.2 10.6 Neighbors 2.1 0.8 0.9 9.5
Total = 1,069 791 92 83
Should oversight of Police behavior be done internally, by a community based third party,
or federal agency?
Weighted White Ind. Rep.
Internal investigations by Police 24.5% 29.0% 17.5% 14.4% Community based organizations 34.6 33.3 35.3 40.2 Federal agency 24.3 19.6 31.3 36.8 Not sure 16.6 18.1 15.8 8.6
Total = 1,082 798 93 83

Page 9 of 12 The University of Texas at Tyler Texas Opinion Survey: November 5-14, 2019
Do you think the U.S. is very prepared, prepared, not very prepared or not prepared at all
to keep elections safe and secure?
Weighted Dem. Ind. Rep.
Very prepared 10.4% 5.1% 8.0% 16.9% Prepared 36.9 26.1 36.4 46.9 Not prepared 33.7 40.4 35.8 26.4 Not very prepared 16.8 27.1 17.8 6.7 Not sure 2.2 1.3 2.0 3.1
Total = 1,081 323 295 463
How likely or unlikely is it that a foreign nation will attempt to create confusion in the
upcoming election?
Weighted Dem. Ind. Rep.
Very likely 37.3% 45.1% 42.1% 27.1% Somewhat likely 30.5 32.3 27.8 30.8 Somewhat unlikely 13.8 9.7 9.7 20.3 Very unlikely 11.0 5.3 11.6 15.6 Not sure 7.4 7.7 8.8 6.3
Total = 1,079 323 295 461
On a scale of 1 to 5 where 1 means Strongly Support and 5 means Strongly oppose, do you
support or oppose a mandatory buyback program to turn in all assault weapons for
payment?
Weighted Dem. Ind. Rep.
Strongly support 18.2% 31.2% 15.0% 8.6% Support 18.8 29.9 19.2 8.6 Have a neutral position 21.0 25.5 18.4 18.6 Oppose 13.0 9.1 16.4 14.2 Strongly oppose 29.0 4.3 31.0 50.0
Total = 1,080 323 295 462
Demographic Questions
What do you identify as your racial or ethnic background?
Weighted
White, Non-Hispanic 57.1% Hispanic or Latino 21.7 Black or African American 13.3 Asian 1.1 Other 6.9
Total = 1,093
Page 10 of 12 The University of Texas at Tyler Texas Opinion Survey: November 5-14, 2019
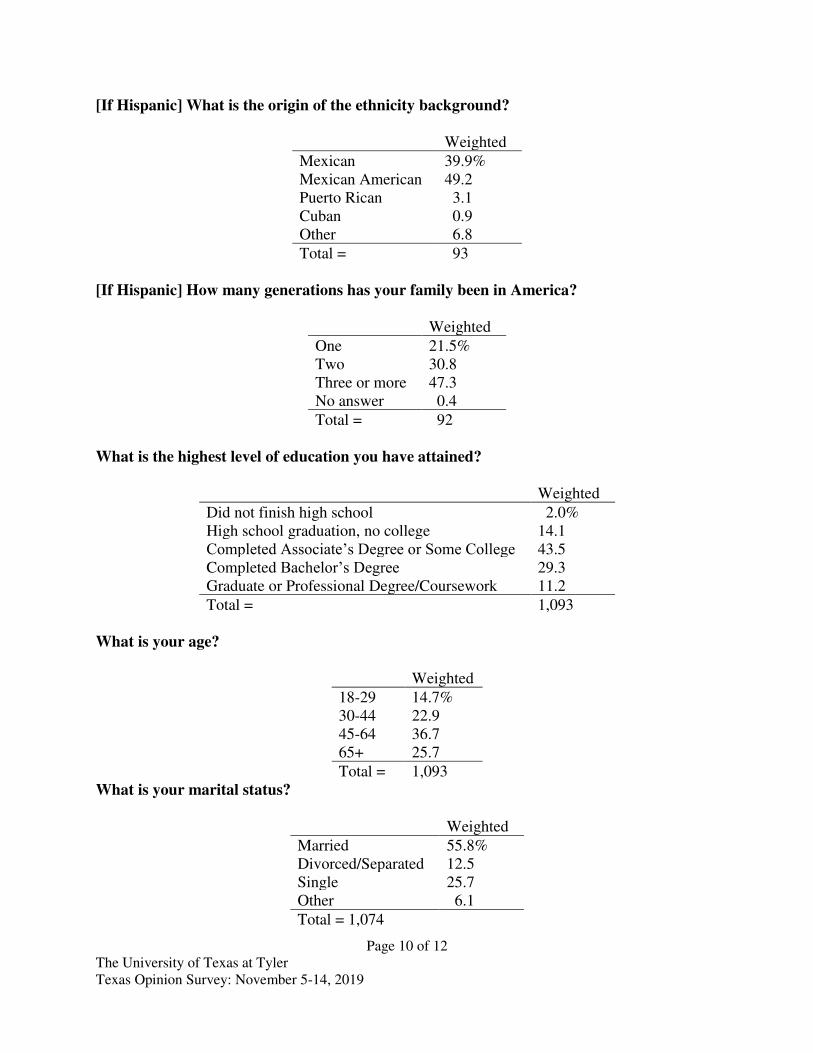
[If Hispanic] What is the origin of the ethnicity background?
Weighted
Mexican 39.9% Mexican American 49.2 Puerto Rican 3.1 Cuban 0.9 Other 6.8
Total = 93 [If Hispanic] How many generations has your family been in America?
Weighted
One 21.5% Two 30.8 Three or more 47.3 No answer 0.4
Total = 92 What is the highest level of education you have attained?
Weighted
Did not finish high school 2.0% High school graduation, no college 14.1 Completed Associate’s Degree or Some College 43.5 Completed Bachelor’s Degree 29.3 Graduate or Professional Degree/Coursework 11.2
Total = 1,093
What is your age?
Weighted
18-29 14.7% 30-44 22.9 45-64 36.7 65+ 25.7
Total = 1,093 What is your marital status?
Weighted
Married 55.8% Divorced/Separated 12.5 Single 25.7 Other 6.1
Total = 1,074
Page 11 of 12 The University of Texas at Tyler Texas Opinion Survey: November 5-14, 2019
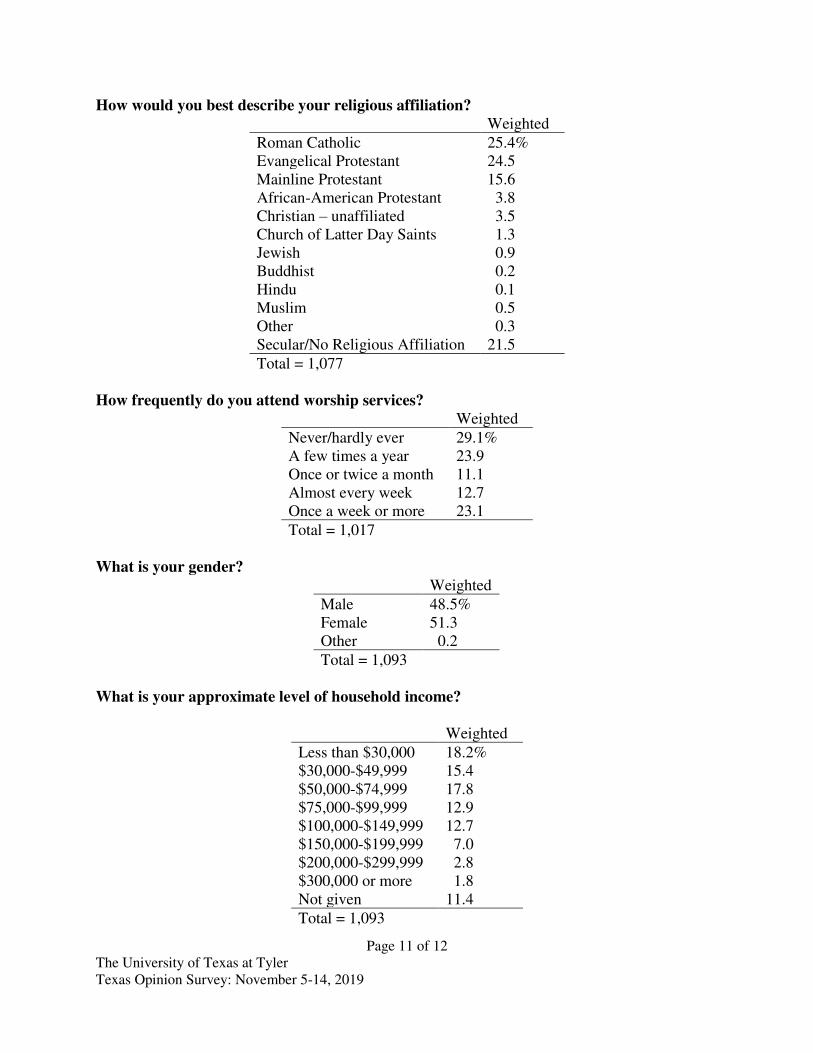
How would you best describe your religious affiliation?
Weighted
Roman Catholic 25.4% Evangelical Protestant 24.5 Mainline Protestant 15.6 African-American Protestant 3.8 Christian – unaffiliated 3.5 Church of Latter Day Saints 1.3 Jewish 0.9 Buddhist 0.2 Hindu 0.1 Muslim 0.5 Other 0.3 Secular/No Religious Affiliation 21.5
Total = 1,077
How frequently do you attend worship services?
Weighted
Never/hardly ever 29.1% A few times a year 23.9 Once or twice a month 11.1 Almost every week 12.7 Once a week or more 23.1
Total = 1,017
What is your gender?
What is your approximate level of household income?
Weighted
Less than $30,000 18.2% $30,000-$49,999 15.4 $50,000-$74,999 17.8 $75,000-$99,999 12.9 $100,000-$149,999 12.7 $150,000-$199,999 7.0 $200,000-$299,999 2.8 $300,000 or more 1.8 Not given 11.4
Total = 1,093
Weighted
Male 48.5% Female 51.3 Other 0.2
Total = 1,093

Page 12 of 12 The University of Texas at Tyler Texas Opinion Survey: November 5-14, 2019
Methodology The UT Tyler-Texas Opinion Survey reflects a statewide random sample of 1,093 registered voters during the ten days between November 5 and November 14. The mixed mode sample includes 397 registered voters who took the survey by phone and 696 registered voters that were randomly selected from a panel of registered voters that have opted-in to take surveys through a company called Dynata. The online and phone surveys were conducted in English and Spanish. The data were weighted to be representative of the Texas register voter population. Iterative weighting was used to balance sample demographics to the state population parameters. The sample is balanced to match parameters for gender, age, race/ethnicity, and education using an iterated process known as raking. These parameters were derived from 2018 Current Population Survey to reflect Texas’s electorate. The use of these weights in statistical analysis ensures that the characteristics of the sample closely reflect the characteristics of registered voters in Texas. In this poll, the sampling error for 1,093 registered voters in Texas is +/- 2.96 percentage points at a 95 percent confidence interval. The survey’s design asked additional questions to 427 registered voters who identify with the Democratic Party as members or independents that lean towards the party (margin of error of +/- 4.7%). Visit http://www.uttyler.edu/politicalscience/pollingcenter for more information about our
current and previous studies.