Embed Size (px)
Citation preview

Geotech Ltd. 245 Industrial Parkway North Aurora, ON Canada L4G 4C4
Tel: +1 905 841 5004 Web: www.geotech.ca Email: [email protected]
VTEM™ Plus
REPORT ON A HELICOPTER-BORNE VERSATILE TIME DOMAIN ELECTROMAGNETIC (VTEM™ Plus) AND MAGNETIC GEOPHYSICAL SURVEY
PROJECT: EAST ISA LOCATION: CLONCURRY, QUEENSLAND FOR: GEOSCIENCE AUSTRALIA SURVEY FLOWN: JUNE – NOVEMBER 2016 GEOTECH PROJECT: UT160090 GEOSCIENCE AUSTRALIA PROJECT: 1286
Project UT160090 VTEM ™ Plus Report on Airborne Geophysical Survey for Geoscience Australia
i
TABLE OF CONTENTS EXECUTIVE SUMMARY .................................................................................................. III 1. INTRODUCTION ......................................................................................................... 1
1.1 General Considerations ..........................................................................................................1 1.2 Survey location ......................................................................................................................2 1.3 Topographic Relief and Cultural Features ................................................................................3
2. DATA ACQUISITION ................................................................................................... 4 2.1 Flight Line Specifications ........................................................................................................4 2.2 Flying Height Specifications ....................................................................................................4 2.3 Survey Operations .................................................................................................................4 2.4 Procedures ............................................................................................................................7 2.5 Aircraft and Equipment ..........................................................................................................7
2.5.1 Survey Aircraft ................................................................................................................7 2.5.2 Electromagnetic System ..................................................................................................7 2.5.3 Full waveform vtem™ sensor calibration ......................................................................... 11 2.5.4 Airborne Magnetometer ................................................................................................. 11 2.5.5 GPS Navigation System - helicopter ................................................................................ 11 2.5.6 GPS Loop...................................................................................................................... 11 2.5.7 Inclinometer Loop ......................................................................................................... 11 2.5.8 Radar Altimeter ............................................................................................................. 12 2.5.9 Laser Altimeter ............................................................................................................. 12 2.5.10 Digital Acquisition System .............................................................................................. 12
2.6 Base Station ........................................................................................................................ 12 2.7 Test lines and calibration procedures .................................................................................... 13
2.7.1 Full Waveform VTEM Calibration .................................................................................... 13 2.7.2 High Altitude Calibration ................................................................................................ 13 2.7.3 Plate Test ..................................................................................................................... 14 2.7.4 Radar and Laser Altimeters ............................................................................................ 14
3. PERSONNEL............................................................................................................. 15 4. DATA PROCESSING AND PRESENTATION .................................................................... 16
4.1 Flight Path, Coordinates and parallax correction .................................................................... 16 4.2 Calculation of height of the EM transmitter receiver loop and magnetic sensor ........................ 17 4.3 Digital Elevation Model ......................................................................................................... 19 4.4 Electromagnetic Data ........................................................................................................... 19 4.5 Conductivity depth imaging .................................................................................................. 20 4.6 Magnetic Data ..................................................................................................................... 21
5. DELIVERABLES......................................................................................................... 22 5.1 Survey Report ..................................................................................................................... 22 5.2 Digital Data ......................................................................................................................... 22
Project UT160090 VTEM ™ Plus Report on Airborne Geophysical Survey for Geoscience Australia
ii
LIST OF FIGURES Figure 1: Survey location .....................................................................................................................1 Figure 2: Survey area location on Google Earth. ....................................................................................2 Figure 3: Flight path over a Google Earth Image. ..................................................................................3 Figure 4: VTEM™ Transmitter Current Waveform ..................................................................................7 Figure 5: VTEM™Plus System Configuration........................................................................................ 10 Figure 6: Location of the radar and laser altimeter test site on Google EarthTM image; Cloncurry airstrip 14 Figure 7: Calculation of EM transmitter loop height ............................................................................. 18
LIST OF TABLES Table 1: Survey Specifications..............................................................................................................4 Table 2: Survey schedule.....................................................................................................................4 Table 3: Off-Time Decay Sampling Scheme ..........................................................................................8 Table 4: Acquisition Sampling Rates ................................................................................................... 12 Table 5: Contents of the ASCII columns datasets for the point located EM data .................................... 22 Table 6: Contents of the ASCII columns dataset for the point located CDI data ................................... 23 Table 7: Contents of the ASCII columns datasets for the waveform data .............................................. 25 Table 8: List of gridded data included in the final dataset .................................................................... 25
APPENDICES
A. Survey location map ............................................................................................................... B. Survey area Coordinates ......................................................................................................... C. Flight Line Summary ............................................................................................................... D. Generalized Modelling Results of the VTEM System ................................................................... E. Conductivity Depth Images Multi Plots ..................................................................................... F. Test and Calibration Procedures ..............................................................................................

Project UT160090 VTEM ™ Plus Report on Airborne Geophysical Survey for Geoscience Australia
iii
EXECUTIVE SUMMARY EAST ISA CLONCURRY, QUEENSLAND From June 23rd, to November 4th 2016 Geotech Ltd. carried out a helicopter-borne geophysical survey over part of East Isa in Queensland. Operations were based at Cloncurry, Queensland. Principal geophysical sensors included a versatile time domain electromagnetic (VTEM™plus) full receiver-waveform system, and a caesium magnetometer. Ancillary equipment included a GPS navigation system, laser and radar altimeters, and inclinometer. A total of 15697 line-kilometres of geophysical data were acquired during the survey. In-field data quality assurance and preliminary processing were carried out on a daily basis during the acquisition phase. Preliminary and final data processing, including generation of final digital data products were undertaken from the office of Geotech Ltd. in Aurora, Ontario. Digital data includes all electromagnetic and magnetic data, conductivity imaging products, mulitplots plus ancillary data including the waveform. This survey report describes the procedures for data acquisition, processing, final image presentation and the specifications for the digital data set.
Project UT160090 VTEM ™ Plus Report on Airborne Geophysical Survey for Geoscience Australia
1
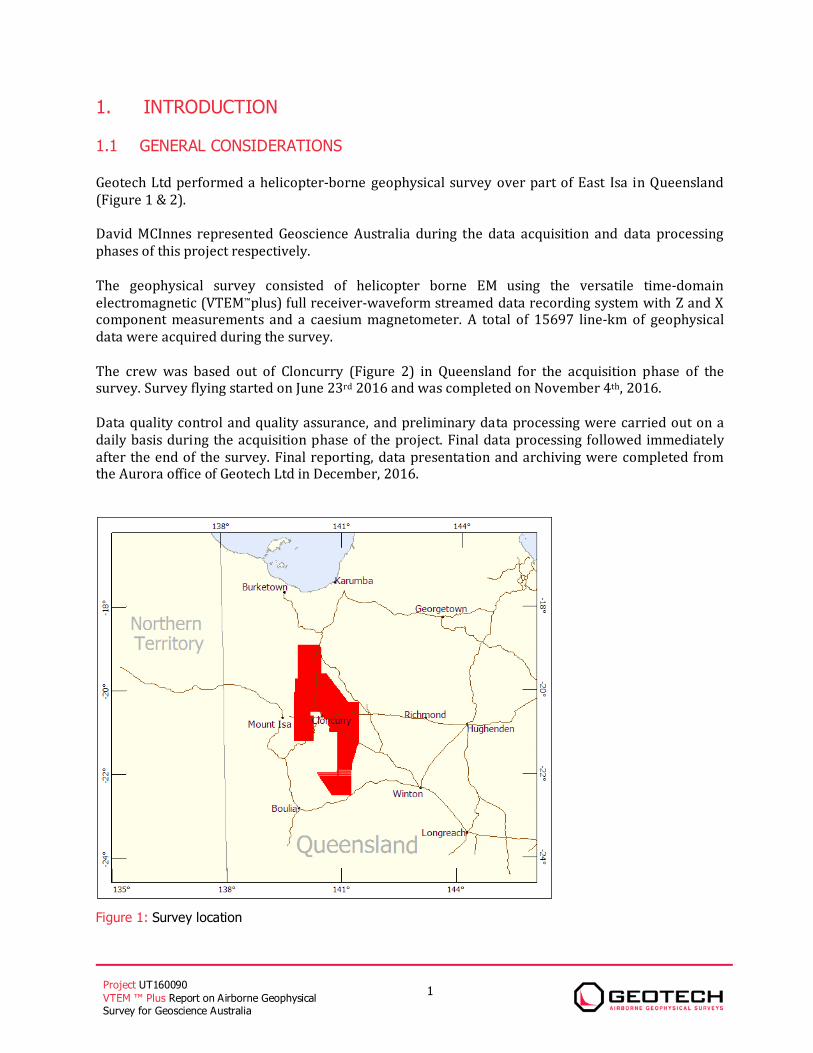
1. INTRODUCTION 1.1 GENERAL CONSIDERATIONS Geotech Ltd performed a helicopter-borne geophysical survey over part of East Isa in Queensland (Figure 1 & 2). David MCInnes represented Geoscience Australia during the data acquisition and data processing phases of this project respectively. The geophysical survey consisted of helicopter borne EM using the versatile time-domain electromagnetic (VTEM™plus) full receiver-waveform streamed data recording system with Z and X component measurements and a caesium magnetometer. A total of 15697 line-km of geophysical data were acquired during the survey. The crew was based out of Cloncurry (Figure 2) in Queensland for the acquisition phase of the survey. Survey flying started on June 23rd 2016 and was completed on November 4th, 2016. Data quality control and quality assurance, and preliminary data processing were carried out on a daily basis during the acquisition phase of the project. Final data processing followed immediately after the end of the survey. Final reporting, data presentation and archiving were completed from the Aurora office of Geotech Ltd in December, 2016.
Figure 1: Survey location
Project UT160090 VTEM ™ Plus Report on Airborne Geophysical Survey for Geoscience Australia
2
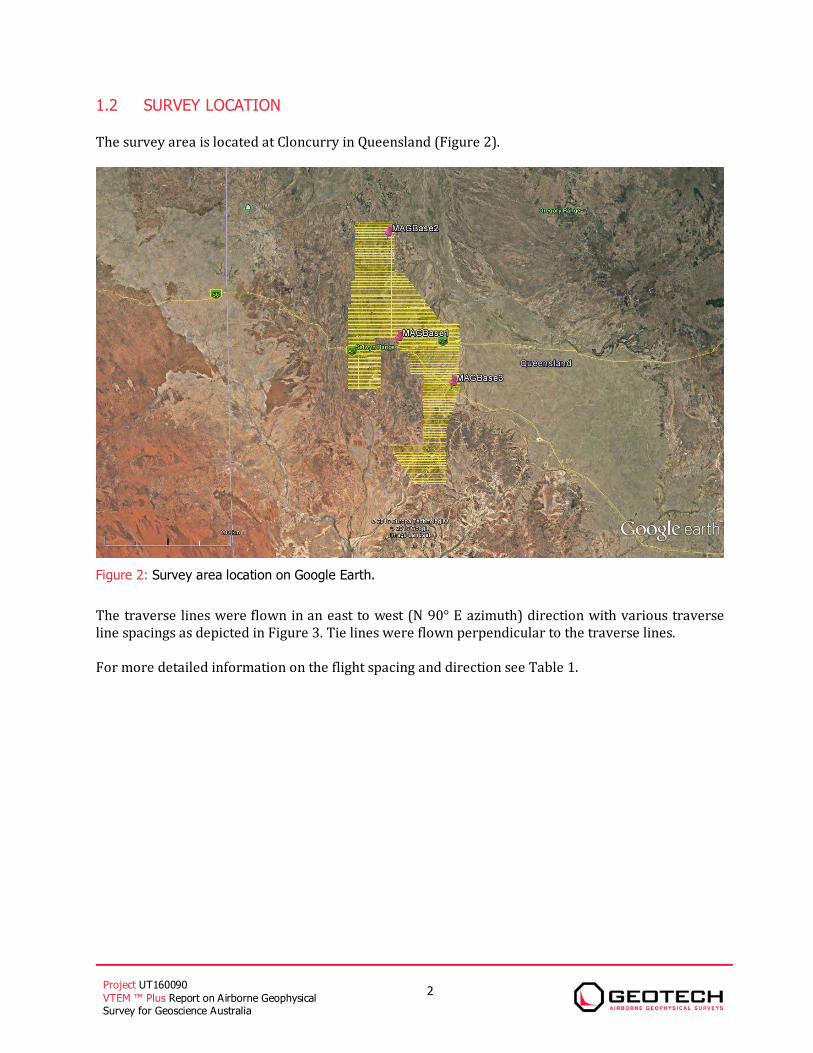
1.2 SURVEY LOCATION The survey area is located at Cloncurry in Queensland (Figure 2).
Figure 2: Survey area location on Google Earth. The traverse lines were flown in an east to west (N 90° E azimuth) direction with various traverse line spacings as depicted in Figure 3. Tie lines were flown perpendicular to the traverse lines. For more detailed information on the flight spacing and direction see Table 1.
Project UT160090 VTEM ™ Plus Report on Airborne Geophysical Survey for Geoscience Australia
3
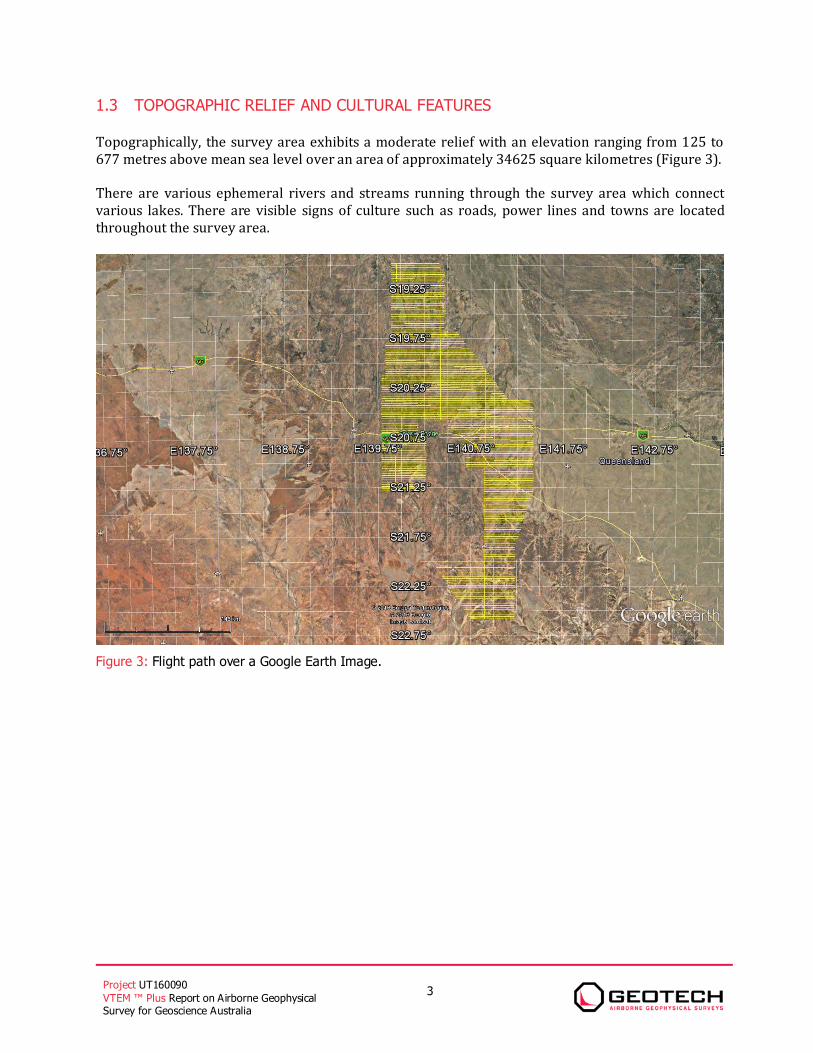
1.3 TOPOGRAPHIC RELIEF AND CULTURAL FEATURES Topographically, the survey area exhibits a moderate relief with an elevation ranging from 125 to 677 metres above mean sea level over an area of approximately 34625 square kilometres (Figure 3). There are various ephemeral rivers and streams running through the survey area which connect various lakes. There are visible signs of culture such as roads, power lines and towns are located throughout the survey area.
Figure 3: Flight path over a Google Earth Image.
Project UT160090 VTEM ™ Plus Report on Airborne Geophysical Survey for Geoscience Australia
4
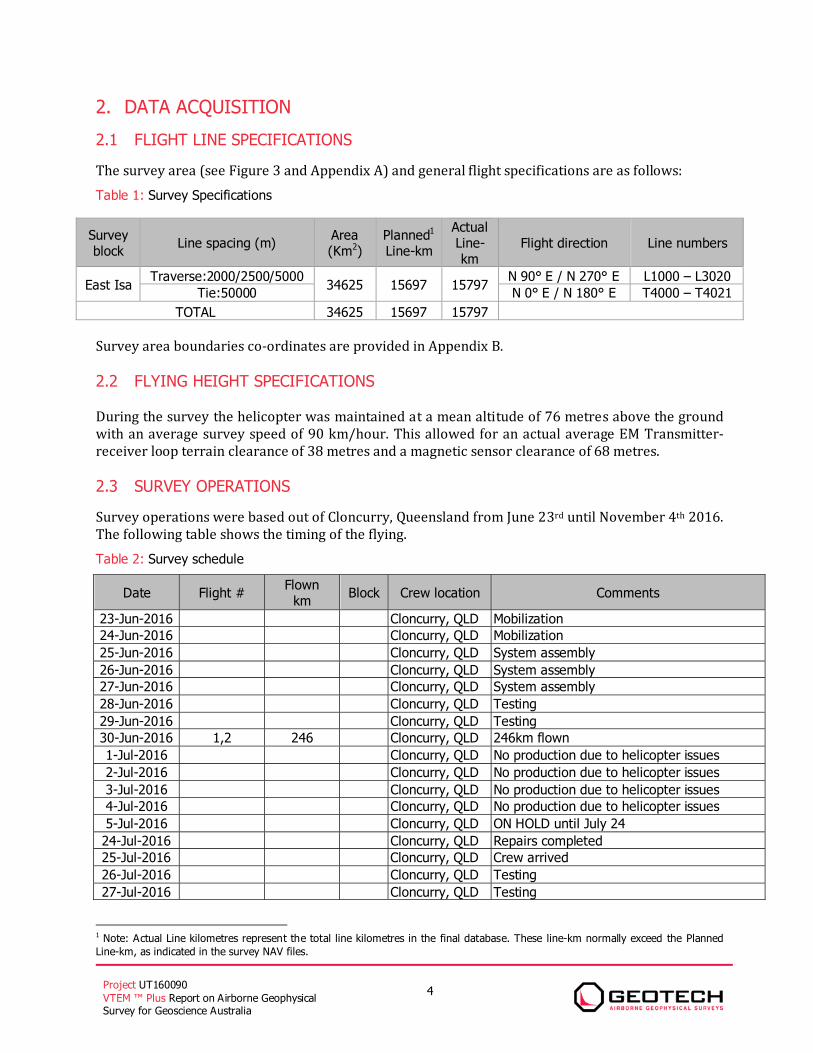
2. DATA ACQUISITION 2.1 FLIGHT LINE SPECIFICATIONS The survey area (see Figure 3 and Appendix A) and general flight specifications are as follows: Table 1: Survey Specifications
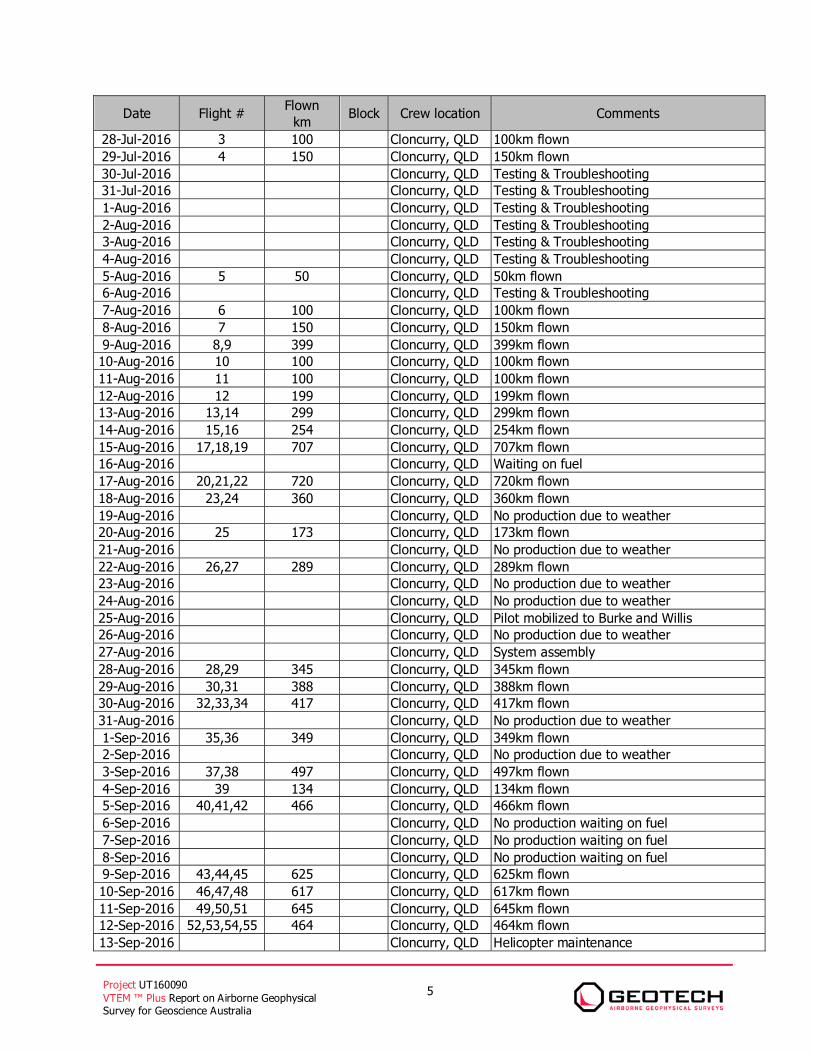
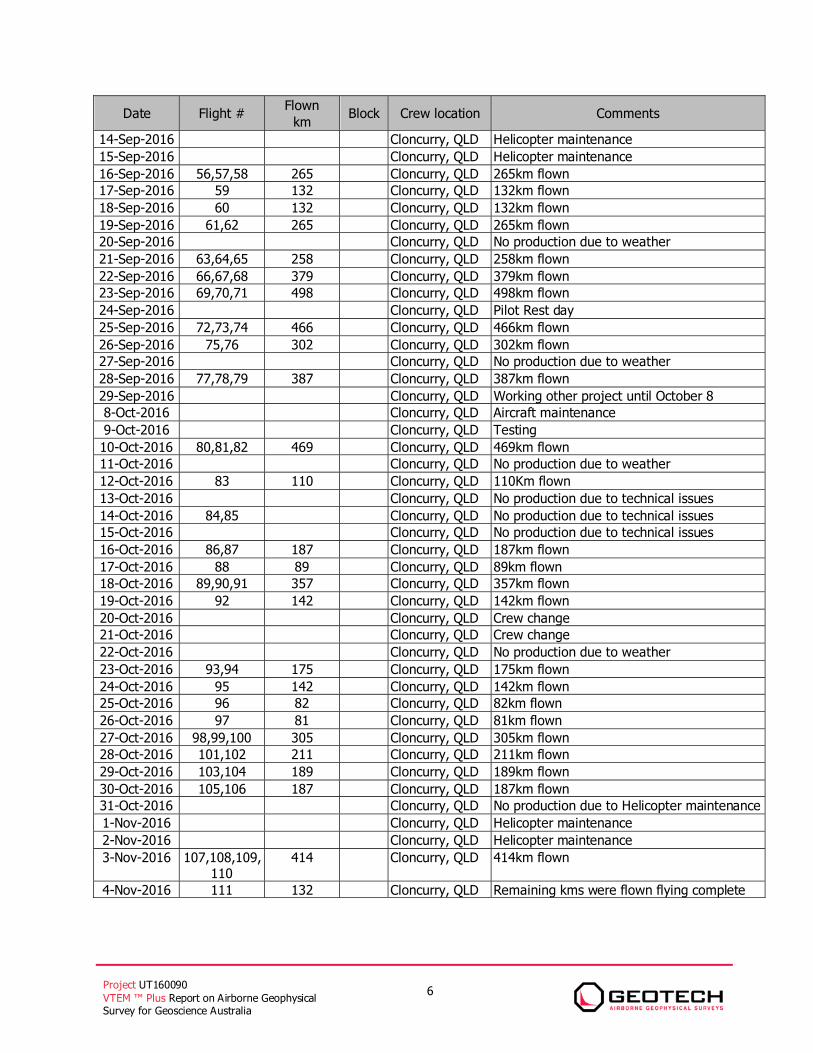
Survey area boundaries co-ordinates are provided in Appendix B. 2.2 FLYING HEIGHT SPECIFICATIONS During the survey the helicopter was maintained at a mean altitude of 76 metres above the ground with an average survey speed of 90 km/hour. This allowed for an actual average EM Transmitter-receiver loop terrain clearance of 38 metres and a magnetic sensor clearance of 68 metres. 2.3 SURVEY OPERATIONS Survey operations were based out of Cloncurry, Queensland from June 23rd until November 4th 2016. The following table shows the timing of the flying. Table 2: Survey schedule
Date Flight # Flown km Block Crew location Comments
23-Jun-2016 Cloncurry, QLD Mobilization 24-Jun-2016 Cloncurry, QLD Mobilization 25-Jun-2016 Cloncurry, QLD System assembly 26-Jun-2016 Cloncurry, QLD System assembly 27-Jun-2016 Cloncurry, QLD System assembly 28-Jun-2016 Cloncurry, QLD Testing 29-Jun-2016 Cloncurry, QLD Testing 30-Jun-2016 1,2 246 Cloncurry, QLD 246km flown 1-Jul-2016 Cloncurry, QLD No production due to helicopter issues 2-Jul-2016 Cloncurry, QLD No production due to helicopter issues 3-Jul-2016 Cloncurry, QLD No production due to helicopter issues 4-Jul-2016 Cloncurry, QLD No production due to helicopter issues 5-Jul-2016 Cloncurry, QLD ON HOLD until July 24 24-Jul-2016 Cloncurry, QLD Repairs completed 25-Jul-2016 Cloncurry, QLD Crew arrived 26-Jul-2016 Cloncurry, QLD Testing 27-Jul-2016 Cloncurry, QLD Testing
1 Note: Actual Line kilometres represent the total line kilometres in the final database. These line-km normally exceed the Planned Line-km, as indicated in the survey NAV files.
Survey block Line spacing (m) Area
(Km2) Planned1 Line-km
Actual Line-km
Flight direction Line numbers
East Isa Traverse:2000/2500/5000 34625 15697 15797 N 90° E / N 270° E L1000 – L3020 Tie:50000 N 0° E / N 180° E T4000 – T4021
TOTAL 34625 15697 15797
Project UT160090 VTEM ™ Plus Report on Airborne Geophysical Survey for Geoscience Australia
5
Date Flight # Flown km Block Crew location Comments
28-Jul-2016 3 100 Cloncurry, QLD 100km flown 29-Jul-2016 4 150 Cloncurry, QLD 150km flown 30-Jul-2016 Cloncurry, QLD Testing & Troubleshooting 31-Jul-2016 Cloncurry, QLD Testing & Troubleshooting 1-Aug-2016 Cloncurry, QLD Testing & Troubleshooting 2-Aug-2016 Cloncurry, QLD Testing & Troubleshooting 3-Aug-2016 Cloncurry, QLD Testing & Troubleshooting 4-Aug-2016 Cloncurry, QLD Testing & Troubleshooting 5-Aug-2016 5 50 Cloncurry, QLD 50km flown 6-Aug-2016 Cloncurry, QLD Testing & Troubleshooting 7-Aug-2016 6 100 Cloncurry, QLD 100km flown 8-Aug-2016 7 150 Cloncurry, QLD 150km flown 9-Aug-2016 8,9 399 Cloncurry, QLD 399km flown 10-Aug-2016 10 100 Cloncurry, QLD 100km flown 11-Aug-2016 11 100 Cloncurry, QLD 100km flown 12-Aug-2016 12 199 Cloncurry, QLD 199km flown 13-Aug-2016 13,14 299 Cloncurry, QLD 299km flown 14-Aug-2016 15,16 254 Cloncurry, QLD 254km flown 15-Aug-2016 17,18,19 707 Cloncurry, QLD 707km flown 16-Aug-2016 Cloncurry, QLD Waiting on fuel 17-Aug-2016 20,21,22 720 Cloncurry, QLD 720km flown 18-Aug-2016 23,24 360 Cloncurry, QLD 360km flown 19-Aug-2016 Cloncurry, QLD No production due to weather 20-Aug-2016 25 173 Cloncurry, QLD 173km flown 21-Aug-2016 Cloncurry, QLD No production due to weather 22-Aug-2016 26,27 289 Cloncurry, QLD 289km flown 23-Aug-2016 Cloncurry, QLD No production due to weather 24-Aug-2016 Cloncurry, QLD No production due to weather 25-Aug-2016 Cloncurry, QLD Pilot mobilized to Burke and Willis 26-Aug-2016 Cloncurry, QLD No production due to weather 27-Aug-2016 Cloncurry, QLD System assembly 28-Aug-2016 28,29 345 Cloncurry, QLD 345km flown 29-Aug-2016 30,31 388 Cloncurry, QLD 388km flown 30-Aug-2016 32,33,34 417 Cloncurry, QLD 417km flown 31-Aug-2016 Cloncurry, QLD No production due to weather 1-Sep-2016 35,36 349 Cloncurry, QLD 349km flown 2-Sep-2016 Cloncurry, QLD No production due to weather 3-Sep-2016 37,38 497 Cloncurry, QLD 497km flown 4-Sep-2016 39 134 Cloncurry, QLD 134km flown 5-Sep-2016 40,41,42 466 Cloncurry, QLD 466km flown 6-Sep-2016 Cloncurry, QLD No production waiting on fuel 7-Sep-2016 Cloncurry, QLD No production waiting on fuel 8-Sep-2016 Cloncurry, QLD No production waiting on fuel 9-Sep-2016 43,44,45 625 Cloncurry, QLD 625km flown 10-Sep-2016 46,47,48 617 Cloncurry, QLD 617km flown 11-Sep-2016 49,50,51 645 Cloncurry, QLD 645km flown 12-Sep-2016 52,53,54,55 464 Cloncurry, QLD 464km flown 13-Sep-2016 Cloncurry, QLD Helicopter maintenance
Project UT160090 VTEM ™ Plus Report on Airborne Geophysical Survey for Geoscience Australia
6
Date Flight # Flown km Block Crew location Comments
14-Sep-2016 Cloncurry, QLD Helicopter maintenance 15-Sep-2016 Cloncurry, QLD Helicopter maintenance 16-Sep-2016 56,57,58 265 Cloncurry, QLD 265km flown 17-Sep-2016 59 132 Cloncurry, QLD 132km flown 18-Sep-2016 60 132 Cloncurry, QLD 132km flown 19-Sep-2016 61,62 265 Cloncurry, QLD 265km flown 20-Sep-2016 Cloncurry, QLD No production due to weather 21-Sep-2016 63,64,65 258 Cloncurry, QLD 258km flown 22-Sep-2016 66,67,68 379 Cloncurry, QLD 379km flown 23-Sep-2016 69,70,71 498 Cloncurry, QLD 498km flown 24-Sep-2016 Cloncurry, QLD Pilot Rest day 25-Sep-2016 72,73,74 466 Cloncurry, QLD 466km flown 26-Sep-2016 75,76 302 Cloncurry, QLD 302km flown 27-Sep-2016 Cloncurry, QLD No production due to weather 28-Sep-2016 77,78,79 387 Cloncurry, QLD 387km flown 29-Sep-2016 Cloncurry, QLD Working other project until October 8 8-Oct-2016 Cloncurry, QLD Aircraft maintenance 9-Oct-2016 Cloncurry, QLD Testing 10-Oct-2016 80,81,82 469 Cloncurry, QLD 469km flown 11-Oct-2016 Cloncurry, QLD No production due to weather 12-Oct-2016 83 110 Cloncurry, QLD 110Km flown 13-Oct-2016 Cloncurry, QLD No production due to technical issues 14-Oct-2016 84,85 Cloncurry, QLD No production due to technical issues 15-Oct-2016 Cloncurry, QLD No production due to technical issues 16-Oct-2016 86,87 187 Cloncurry, QLD 187km flown 17-Oct-2016 88 89 Cloncurry, QLD 89km flown 18-Oct-2016 89,90,91 357 Cloncurry, QLD 357km flown 19-Oct-2016 92 142 Cloncurry, QLD 142km flown 20-Oct-2016 Cloncurry, QLD Crew change 21-Oct-2016 Cloncurry, QLD Crew change 22-Oct-2016 Cloncurry, QLD No production due to weather 23-Oct-2016 93,94 175 Cloncurry, QLD 175km flown 24-Oct-2016 95 142 Cloncurry, QLD 142km flown 25-Oct-2016 96 82 Cloncurry, QLD 82km flown 26-Oct-2016 97 81 Cloncurry, QLD 81km flown 27-Oct-2016 98,99,100 305 Cloncurry, QLD 305km flown 28-Oct-2016 101,102 211 Cloncurry, QLD 211km flown 29-Oct-2016 103,104 189 Cloncurry, QLD 189km flown 30-Oct-2016 105,106 187 Cloncurry, QLD 187km flown 31-Oct-2016 Cloncurry, QLD No production due to Helicopter maintenance 1-Nov-2016 Cloncurry, QLD Helicopter maintenance 2-Nov-2016 Cloncurry, QLD Helicopter maintenance 3-Nov-2016 107,108,109,
110 414 Cloncurry, QLD 414km flown
4-Nov-2016 111 132 Cloncurry, QLD Remaining kms were flown flying complete
Project UT160090 VTEM ™ Plus Report on Airborne Geophysical Survey for Geoscience Australia
7
2.4 PROCEDURES The on board operator was responsible for monitoring the system integrity. He also maintained a detailed flight log during the survey, tracking the times of the flight as well as any unusual geophysical or topographic features. On return of the aircrew to the base camp the survey data was transferred from a compact flash card (PCMCIA) to the data processing computer. The data were then uploaded via ftp to the Geotech office in Aurora for daily quality assurance and quality control by qualified personnel. 2.5 AIRCRAFT AND EQUIPMENT
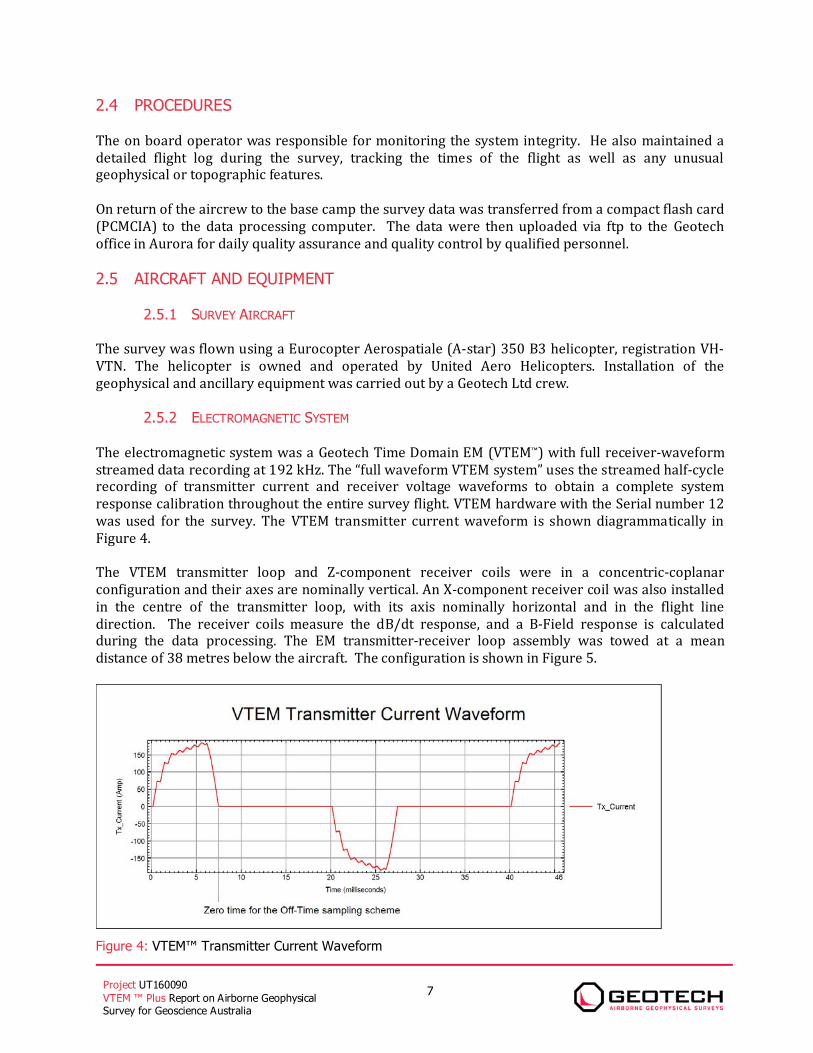
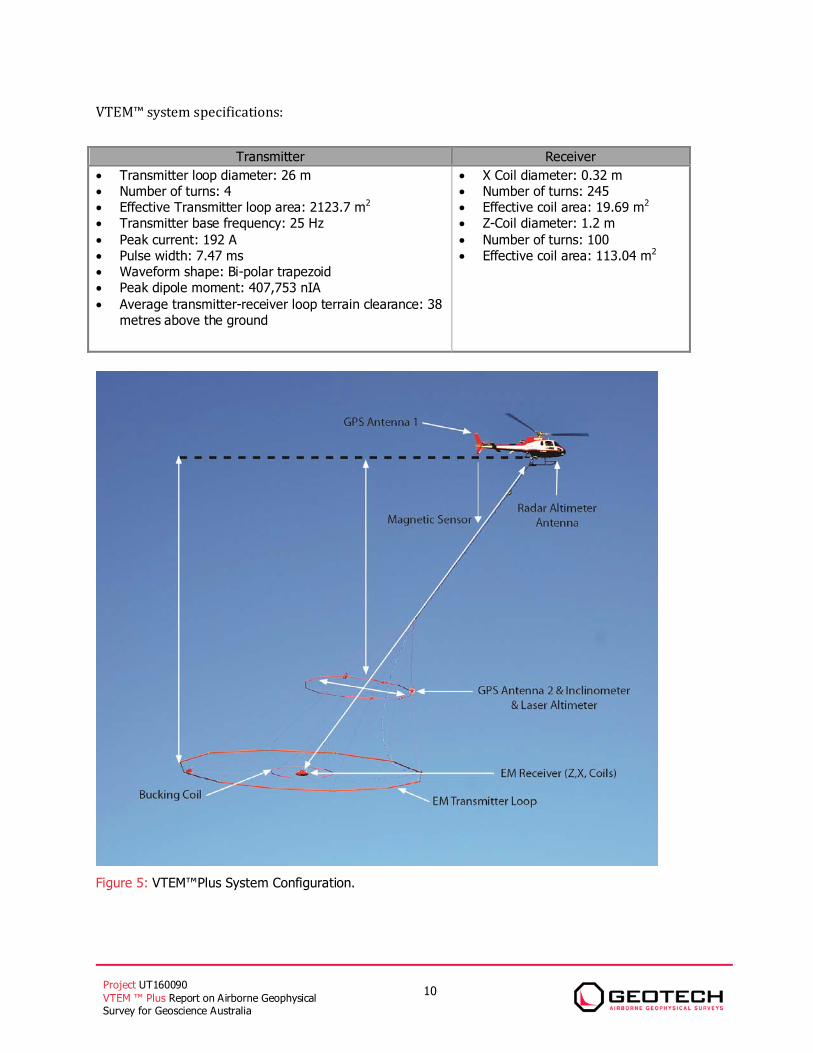
2.5.1 SURVEY AIRCRAFT The survey was flown using a Eurocopter Aerospatiale (A-star) 350 B3 helicopter, registration VH-VTN. The helicopter is owned and operated by United Aero Helicopters. Installation of the geophysical and ancillary equipment was carried out by a Geotech Ltd crew. 2.5.2 ELECTROMAGNETIC SYSTEM The electromagnetic system was a Geotech Time Domain EM (VTEM™) with full receiver-waveform streamed data recording at 192 kHz. The “full waveform VTEM system” uses the streamed half-cycle recording of transmitter current and receiver voltage waveforms to obtain a complete system response calibration throughout the entire survey flight. VTEM hardware with the Serial number 12 was used for the survey. The VTEM transmitter current waveform is shown diagrammatically in Figure 4. The VTEM transmitter loop and Z-component receiver coils were in a concentric-coplanar configuration and their axes are nominally vertical. An X-component receiver coil was also installed in the centre of the transmitter loop, with its axis nominally horizontal and in the flight line direction. The receiver coils measure the dB/dt response, and a B-Field response is calculated during the data processing. The EM transmitter-receiver loop assembly was towed at a mean distance of 38 metres below the aircraft. The configuration is shown in Figure 5.
Figure 4: VTEM™ Transmitter Current Waveform
Project UT160090 VTEM ™ Plus Report on Airborne Geophysical Survey for Geoscience Australia
8
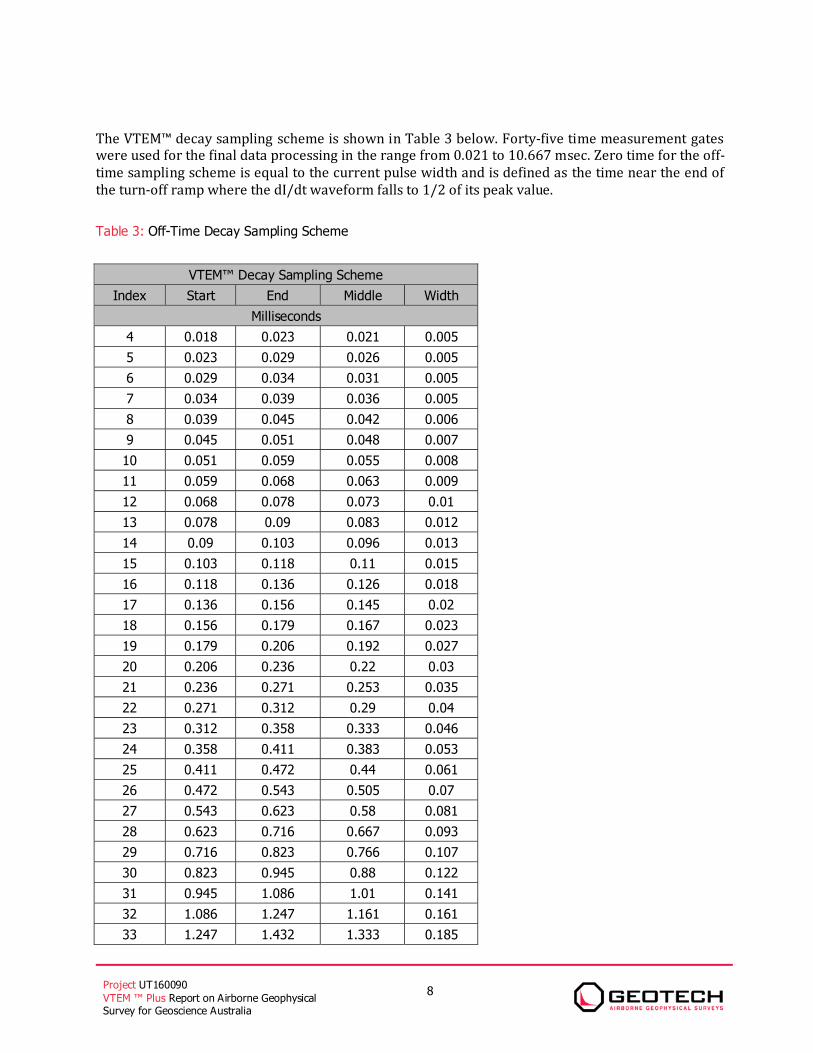
The VTEM™ decay sampling scheme is shown in Table 3 below. Forty-five time measurement gates were used for the final data processing in the range from 0.021 to 10.667 msec. Zero time for the off-time sampling scheme is equal to the current pulse width and is defined as the time near the end of the turn-off ramp where the dI/dt waveform falls to 1/2 of its peak value. Table 3: Off-Time Decay Sampling Scheme
VTEM™ Decay Sampling Scheme Index Start End Middle Width
Milliseconds 4 0.018 0.023 0.021 0.005 5 0.023 0.029 0.026 0.005 6 0.029 0.034 0.031 0.005 7 0.034 0.039 0.036 0.005 8 0.039 0.045 0.042 0.006 9 0.045 0.051 0.048 0.007 10 0.051 0.059 0.055 0.008 11 0.059 0.068 0.063 0.009 12 0.068 0.078 0.073 0.01 13 0.078 0.09 0.083 0.012 14 0.09 0.103 0.096 0.013 15 0.103 0.118 0.11 0.015 16 0.118 0.136 0.126 0.018 17 0.136 0.156 0.145 0.02 18 0.156 0.179 0.167 0.023 19 0.179 0.206 0.192 0.027 20 0.206 0.236 0.22 0.03 21 0.236 0.271 0.253 0.035 22 0.271 0.312 0.29 0.04 23 0.312 0.358 0.333 0.046 24 0.358 0.411 0.383 0.053 25 0.411 0.472 0.44 0.061 26 0.472 0.543 0.505 0.07 27 0.543 0.623 0.58 0.081 28 0.623 0.716 0.667 0.093 29 0.716 0.823 0.766 0.107 30 0.823 0.945 0.88 0.122 31 0.945 1.086 1.01 0.141 32 1.086 1.247 1.161 0.161 33 1.247 1.432 1.333 0.185
Project UT160090 VTEM ™ Plus Report on Airborne Geophysical Survey for Geoscience Australia
9
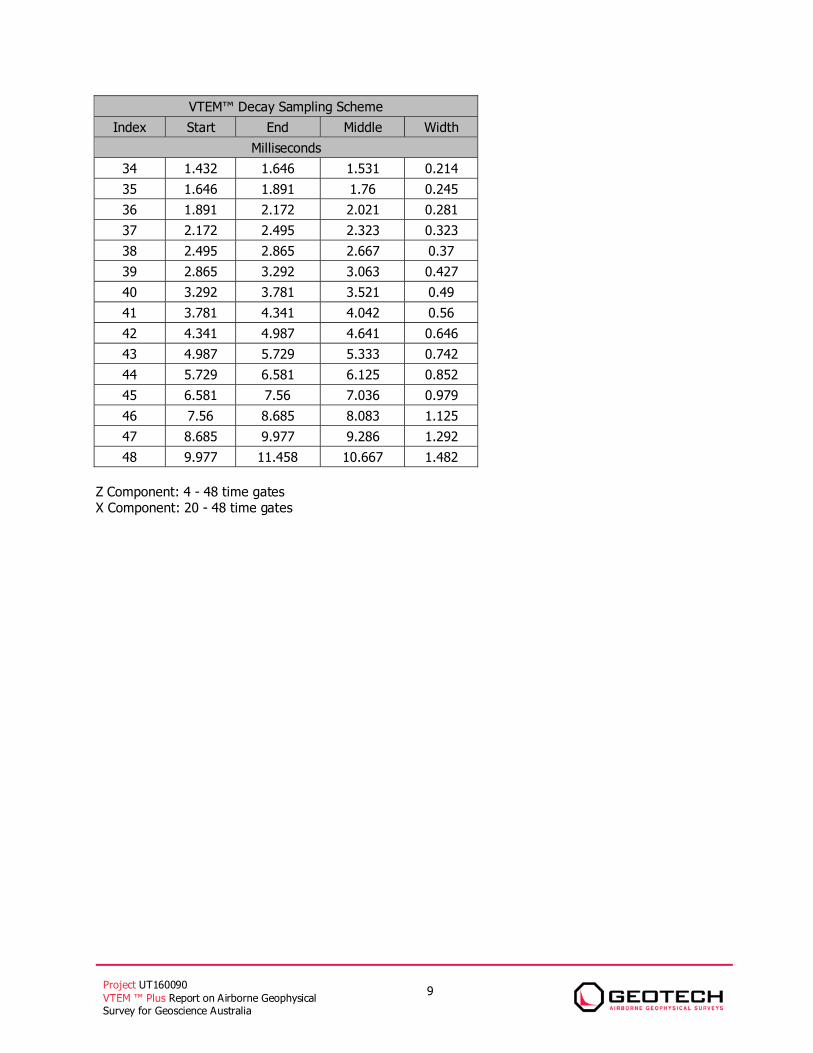
VTEM™ Decay Sampling Scheme Index Start End Middle Width
Milliseconds 34 1.432 1.646 1.531 0.214 35 1.646 1.891 1.76 0.245 36 1.891 2.172 2.021 0.281 37 2.172 2.495 2.323 0.323 38 2.495 2.865 2.667 0.37 39 2.865 3.292 3.063 0.427 40 3.292 3.781 3.521 0.49 41 3.781 4.341 4.042 0.56 42 4.341 4.987 4.641 0.646 43 4.987 5.729 5.333 0.742 44 5.729 6.581 6.125 0.852 45 6.581 7.56 7.036 0.979 46 7.56 8.685 8.083 1.125 47 8.685 9.977 9.286 1.292 48 9.977 11.458 10.667 1.482
Z Component: 4 - 48 time gates X Component: 20 - 48 time gates
Project UT160090 VTEM ™ Plus Report on Airborne Geophysical Survey for Geoscience Australia
10
VTEM™ system specifications: Transmitter Receiver
• Transmitter loop diameter: 26 m • Number of turns: 4 • Effective Transmitter loop area: 2123.7 m2 • Transmitter base frequency: 25 Hz • Peak current: 192 A • Pulse width: 7.47 ms • Waveform shape: Bi-polar trapezoid • Peak dipole moment: 407,753 nIA • Average transmitter-receiver loop terrain clearance: 38
metres above the ground
• X Coil diameter: 0.32 m • Number of turns: 245 • Effective coil area: 19.69 m2 • Z-Coil diameter: 1.2 m • Number of turns: 100 • Effective coil area: 113.04 m2
Figure 5: VTEM™Plus System Configuration.
Project UT160090 VTEM ™ Plus Report on Airborne Geophysical Survey for Geoscience Australia
11
2.5.3 FULL WAVEFORM VTEM™ SENSOR CALIBRATION The calibration is performed on the complete VTEM™ system installed in and connected to the helicopter, using special calibration equipment. The procedure takes half-cycle files acquired and calculates a calibration file consisting of a single stacked half-cycle waveform. The purpose of the stacking is to attenuate natural and man-made magnetic signals, leaving only the response to the calibration signal.
2.5.4 AIRBORNE MAGNETOMETER The magnetic sensor utilized is a Geometrics optically pumped caesium vapour magnetic field sensor mounted 10 metres below the helicopter (when flying), as shown in Figure 5. The sensitivity of the magnetic sensor is 0.02 nanoTesla (nT) at a sampling interval of 0.1 seconds. 2.5.5 GPS NAVIGATION SYSTEM - HELICOPTER The navigation system used was a Geotech PC104 based navigation system utilizing a NovAtel’s WAAS (Wide Area Augmentation System) enabled GPS receiver, Geotech navigate software, a full screen display with controls in front of the pilot to direct the flight and a NovAtel GPS antenna mounted on the helicopter tail (Figure 5). As many as 11 GPS and two WAAS satellites may be monitored at any one time. The positional accuracy or circular error probability (CEP) is 1.8 m, with WAAS active, it is 1.0 m. The co-ordinates of the survey area were set-up prior to the survey and the information was fed into the airborne navigation system. The second GPS antenna is installed on the additional magnetic loop together with Gyro Inclinometer. 2.5.6 GPS LOOP A NovAtel GPS antenna was installed on the front centre of the loop to accurately record the position of the loop (Figure 5). GPS data were sampled every 0.2 seconds. The final GPS coordinates were differentially corrected by post-processing the loop data along with GPS data obtained simultaneously from a base station setup nearby the survey area. Final horizontal coordinates are referenced to GDA94 MGA zone 54 and the height is referenced to the EGM96 geoid. The positional accuracy or circular error probability (CEP) is 1.0 m. 2.5.7 INCLINOMETER LOOP An Anlalog Devices ADIS16405 gyroscopic inclinometer was installed on the loop (Figure 5) to accurately record the orientation of the loop with a sampling interval of 0.1 seconds. The orientation of the loop is determined by three rotation angles based on the local reference frame of the loop: roll (rotation about the x-axis), pitch (rotation about the y-axis) and yaw (rotation about the z-axis). The loop’s reference frame is a right-handed coordinate system with the positive x-axis pointing in the flight direction, positive y-axis pointing to the left of the flight direction and the positive z-axis points vertically upward. Positive rotation for each angle is counter-clockwise about the axis when looking toward the origin (positive roll is left wing up, positive pitch is nose down, positive yaw to the left of the flight direction).
Project UT160090 VTEM ™ Plus Report on Airborne Geophysical Survey for Geoscience Australia
12
2.5.8 RADAR ALTIMETER A Terra TRA 3000/TRI 40 radar altimeter was used to record terrain clearance. The antenna was mounted beneath the bubble of the helicopter cockpit (Figure 5). 2.5.9 LASER ALTIMETER A Schmitt Industries AR3000 laser altimeter was used which has an altitude range 0.5 to 300m and accuracy ±5cm. The laser altimeter was located at the front of the horizontal magnetic gradient loop with a GPS antenna and inclinometer and the data was sampled at an interval of 0.2 seconds. 2.5.10 DIGITAL ACQUISITION SYSTEM
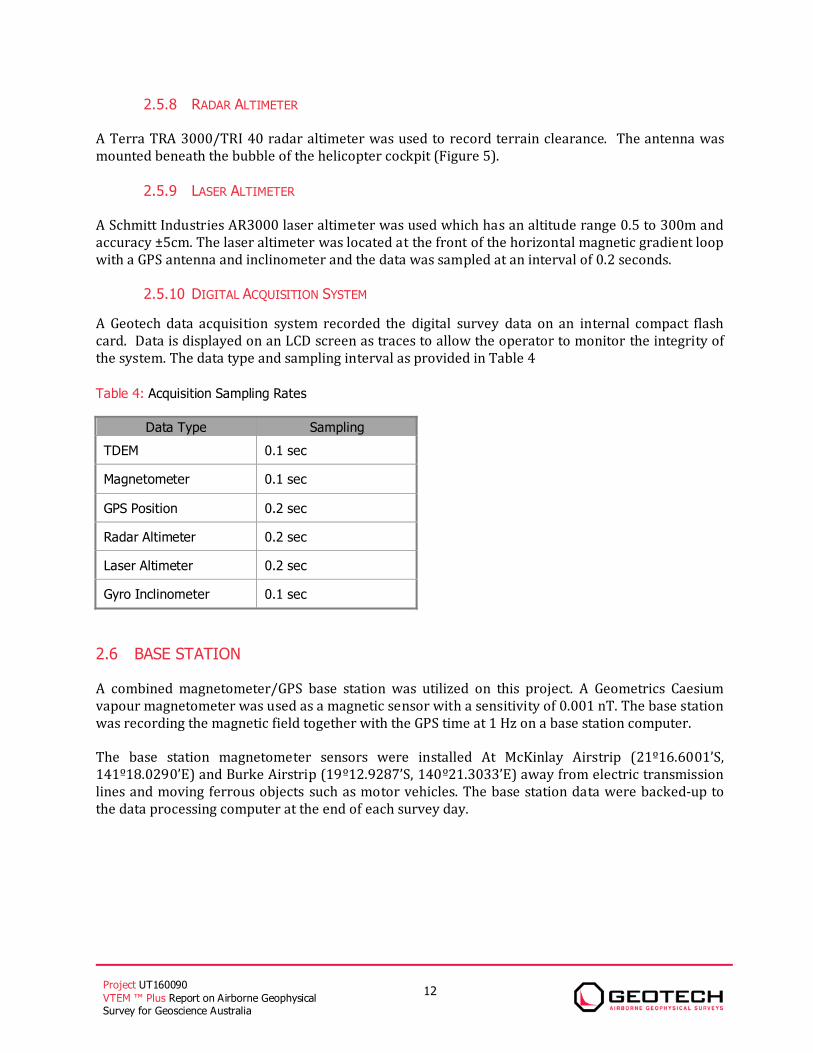
A Geotech data acquisition system recorded the digital survey data on an internal compact flash card. Data is displayed on an LCD screen as traces to allow the operator to monitor the integrity of the system. The data type and sampling interval as provided in Table 4 Table 4: Acquisition Sampling Rates
Data Type Sampling TDEM 0.1 sec
Magnetometer 0.1 sec
GPS Position 0.2 sec
Radar Altimeter 0.2 sec
Laser Altimeter 0.2 sec
Gyro Inclinometer 0.1 sec 2.6 BASE STATION A combined magnetometer/GPS base station was utilized on this project. A Geometrics Caesium vapour magnetometer was used as a magnetic sensor with a sensitivity of 0.001 nT. The base station was recording the magnetic field together with the GPS time at 1 Hz on a base station computer. The base station magnetometer sensors were installed At McKinlay Airstrip (21º16.6001’S, 141º18.0290’E) and Burke Airstrip (19º12.9287’S, 140º21.3033’E) away from electric transmission lines and moving ferrous objects such as motor vehicles. The base station data were backed-up to the data processing computer at the end of each survey day.
Project UT160090 VTEM ™ Plus Report on Airborne Geophysical Survey for Geoscience Australia
13
2.7 TEST LINES AND CALIBRATION PROCEDURES 2.7.1 FULL WAVEFORM VTEM CALIBRATION The calibration is performed with the completely assembled VTEM system connected to the helicopter at the survey site on the ground. Measurements of the half-cycles are collected and used to calculate a sensor calibration consisting of a single stacked half-cycle waveform. The purpose of the stacking is to attenuate natural and man-made magnetic signals, leaving only the response to the calibration signal. The stacked half-cycle allows the transfer functions between the receiver and data acquisition system, HD (ω), and current sensor and data acquisition system, HR (ω), to be determined. These transfer functions are used as a part of the system response correction during processing to correct the half-cycle waveforms and data acquired on a survey flight to a common transfer function: D(ω)=[(H_C (ω))⁄(H_D (ω) )] D_R (ω) A(ω)=[(H_C (ω))⁄(H_R (ω) )] A_R (ω) Where HC(ω) is the common transfer function, and DR(ω) and AR(ω) are the FFT’s of the raw receiver and current sensor responses recorded by the data acquisition system. This process allows for the receiver response, R(ω), to become independent of the sensor characteristics determined by the transfer functions HD(ω) and HR(ω) and acts similar to a deconvolution of the data. R(ω)=D(ω)I(ω)/A(ω) Where, D(ω) is the FFT of the actual receiver data sample D(t), I(ω) is the FFT of a reference or “Ideal waveform” and A(ω) is the FFT of the actual waveform. 2.7.2 HIGH ALTITUDE CALIBRATION High altitude calibrations were conducted at the beginning, during, and end of each flight. The calibration’s objective is to determine the EM “zero level” by climbing to an altitude of 1,000 metres above ground to measure the receiver’s response absent of response due to the ground. When at the required altitude, at least 60 seconds of data were acquired in normal operation mode. The final delivered dataset contains these processed windowed high altitude data for the one-hundred-six (106) survey flights in ASCII column format (Table 5) Reference transmitter current and receiver voltage waveforms, each sampled at 192 kHz, were also recorded at high altitude for all survey flights. The recorded waveforms were transformed into an ideal form, having zero current at the beginning of the off-time, by the Full Waveform calibration (see Section 2.7.1). A graphical representation of a VTEM waveform is shown in Figure 4.
Project UT160090 VTEM ™ Plus Report on Airborne Geophysical Survey for Geoscience Australia
14
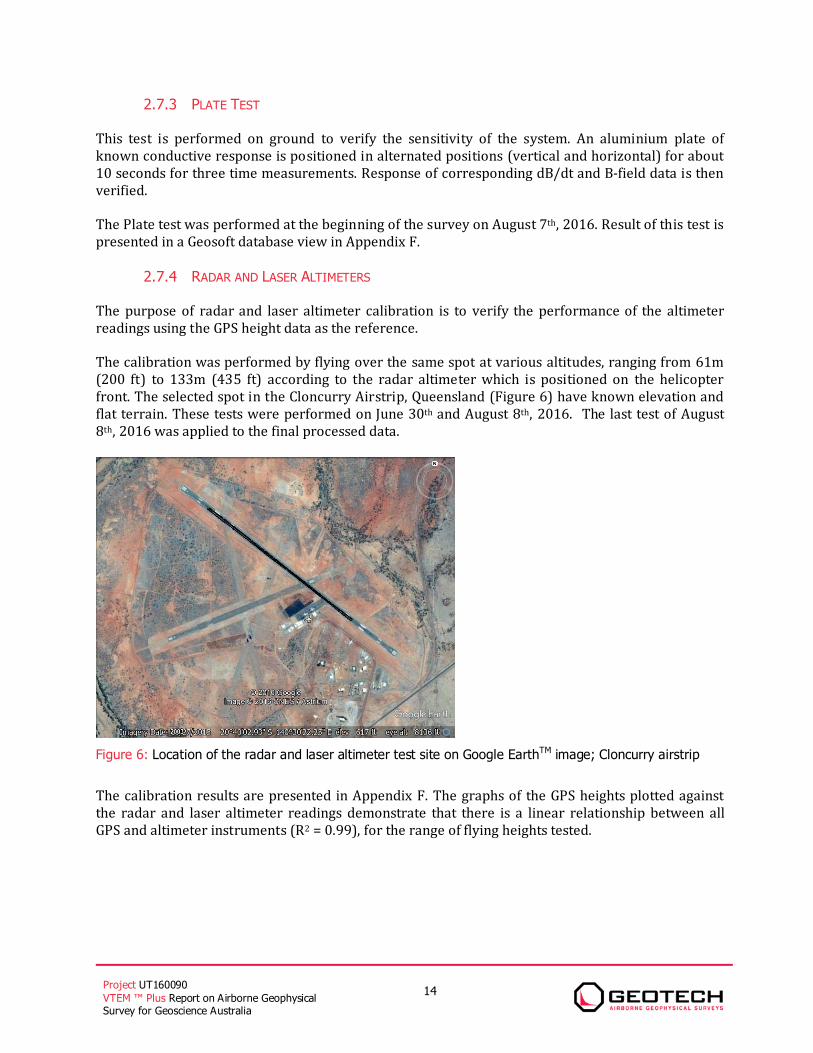
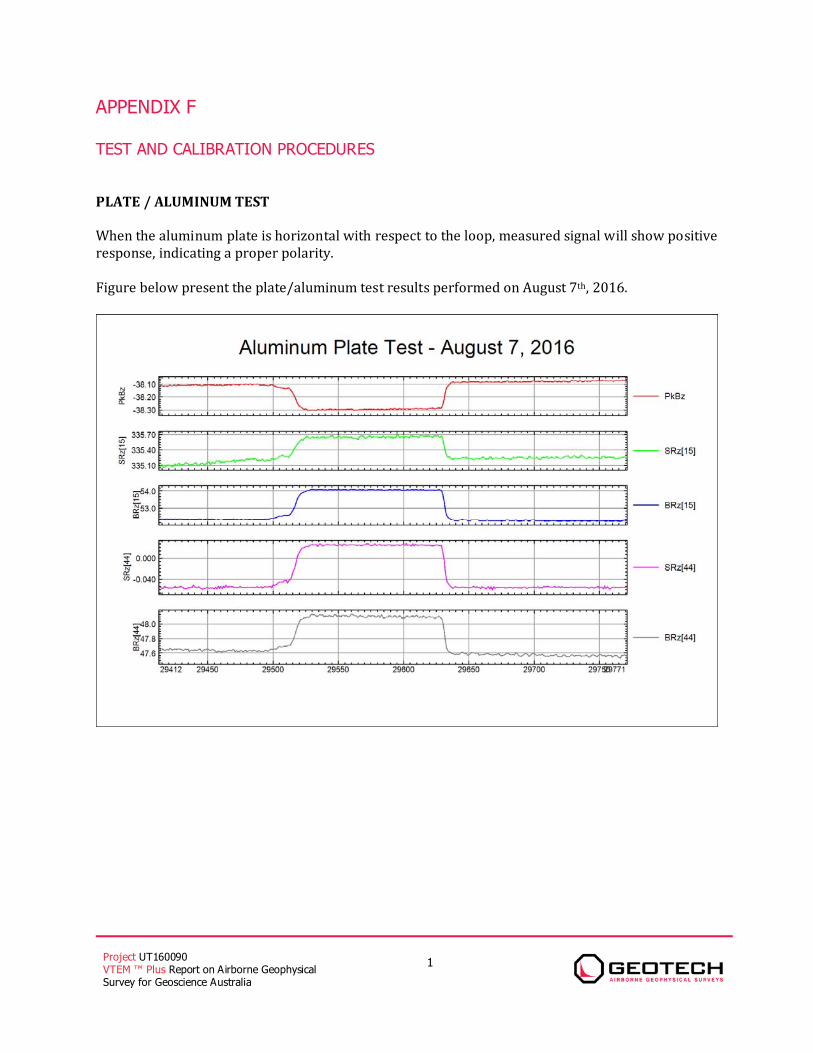
2.7.3 PLATE TEST This test is performed on ground to verify the sensitivity of the system. An aluminium plate of known conductive response is positioned in alternated positions (vertical and horizontal) for about 10 seconds for three time measurements. Response of corresponding dB/dt and B-field data is then verified. The Plate test was performed at the beginning of the survey on August 7th, 2016. Result of this test is presented in a Geosoft database view in Appendix F. 2.7.4 RADAR AND LASER ALTIMETERS The purpose of radar and laser altimeter calibration is to verify the performance of the altimeter readings using the GPS height data as the reference. The calibration was performed by flying over the same spot at various altitudes, ranging from 61m (200 ft) to 133m (435 ft) according to the radar altimeter which is positioned on the helicopter front. The selected spot in the Cloncurry Airstrip, Queensland (Figure 6) have known elevation and flat terrain. These tests were performed on June 30th and August 8th, 2016. The last test of August 8th, 2016 was applied to the final processed data.
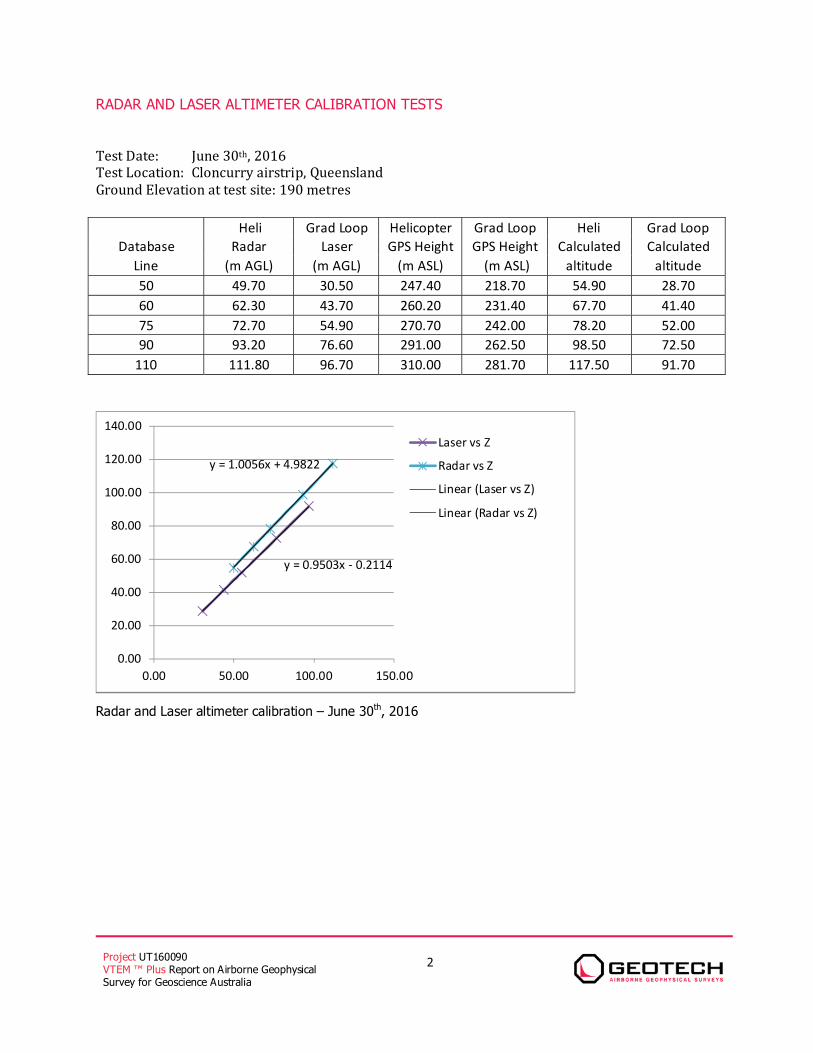
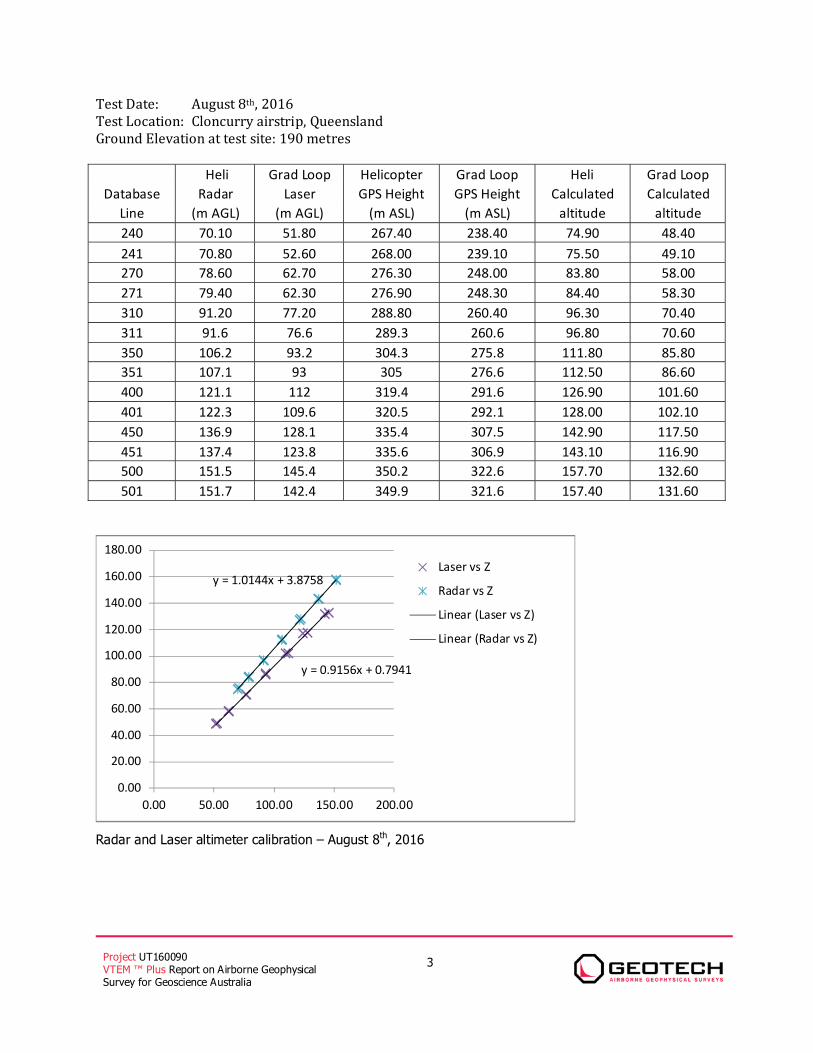
Figure 6: Location of the radar and laser altimeter test site on Google EarthTM image; Cloncurry airstrip The calibration results are presented in Appendix F. The graphs of the GPS heights plotted against the radar and laser altimeter readings demonstrate that there is a linear relationship between all GPS and altimeter instruments (R2 = 0.99), for the range of flying heights tested.

Project UT160090 VTEM ™ Plus Report on Airborne Geophysical Survey for Geoscience Australia
15
3. PERSONNEL The following Geotech Ltd. personnel were involved in the project. FIELD: Project Manager: Leon Lovelock (Office) Data QC: Neil Fiset (Office) Crew chief: Cong Phan Kobus DeBeer Paul White Operator: Jared White Peter Macdonald Chris Botman
The survey pilot and the mechanical engineer were employed directly by the helicopter operator – United Aero Helicopters. Pilot: Charlie Elliot Colby Tyrell Hugh Gifford Dave Warton Mechanical Engineer: n/a OFFICE: Preliminary Data Processing: Neil Fiset Final Data Processing: Marta Orta Nasreddine Bournas Final Data QA/QC: Geoffrey Plastow Shaolin Lu Reporting/Mapping: Wendy Acorn Processing and Interpretation phases were carried out under the supervision of Geoffrey Plastow, P. Geo, and Data Processing Manager. The customer relations were looked after by Rod Fowler.
Project UT160090 VTEM ™ Plus Report on Airborne Geophysical Survey for Geoscience Australia
16
4. DATA PROCESSING AND PRESENTATION Data compilation and processing were carried out by the application of Geosoft OASIS Montaj and programs proprietary to Geotech Ltd. 4.1 FLIGHT PATH, COORDINATES AND PARALLAX CORRECTION The flight path data, recorded by the acquisition program as WGS 84 latitude/longitude, were differentially corrected using the base station GPS and converted into the GDA94 Datum, Map Grid of Australia Zone 54 coordinate system in Oasis Montaj. Both sets of GPS coordinate, from helicopter GPS and gradiometer GPS, were linearly interpolated between each measurement sampled every 0.2 seconds to match the sampling rate of the TDEM and magnetic datasets at every 0.1 seconds. The coordinates labelled “GradLoop_*” in Table 5 & Table 6 refer to the position of the gradiometer GPS antenna located at the front of the gradiometer loop. A further set of coordinates, labelled “EM_Mag_Data_*” were then calculated for the position halfway between the center of the gradiometer loop. This position represents the centre of the gradiomter loop and is the point where the tow cable intersects the plane of the gradiometer loop. This was achieved by projecting backwards along the flight line by 6.25 m, the radius of the gradiometer loop, from the gradiometer loop GPS antenna position. A parallax correction was applied to the EM data to account for the distance by which the EM transmitter-receiver loop lags behind the centre of the gradiometer loop. In this parallax correction the EM data are shifted toward lower fiducial numbers by the nearest integer number of fiducials that it would take to travel the average horizontal distance Δx2 (see Figure 7 and formulae below) which separates the centres of the gradiometer and EM loops based on the average helicopter speed for each line. The magnetic data are shifted in the same manner backward towards the centre of the gradiometer loop. Thus the “EM_Mag_Data_*” coordinates are the set of coordinates that the EM and magnetic data are parallax corrected for, and to which all EM and magnetic data and interpretations should be referred. Due to the presence of man made culture such as buildings, mines and populated areas the resulting flight path contained a number of deviations and gaps from the planned flight path. The main suvrey lines that were affected are as follows:
• L1731 Flight 46: Deviation over and around the village of Ernest Henry. • L1580 & L1590 Flight 52: Deviations due to a mine site and camp. • L1520 Flight 50: Deviation due to a house.
Project UT160090 VTEM ™ Plus Report on Airborne Geophysical Survey for Geoscience Australia
17
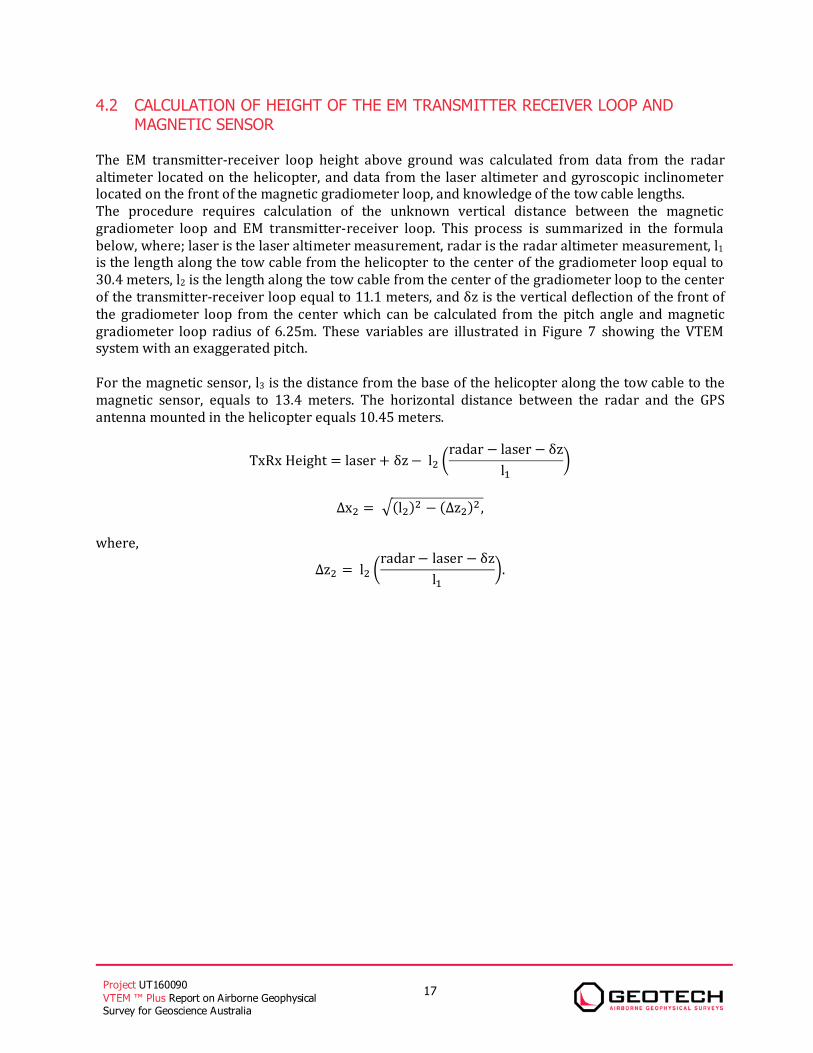
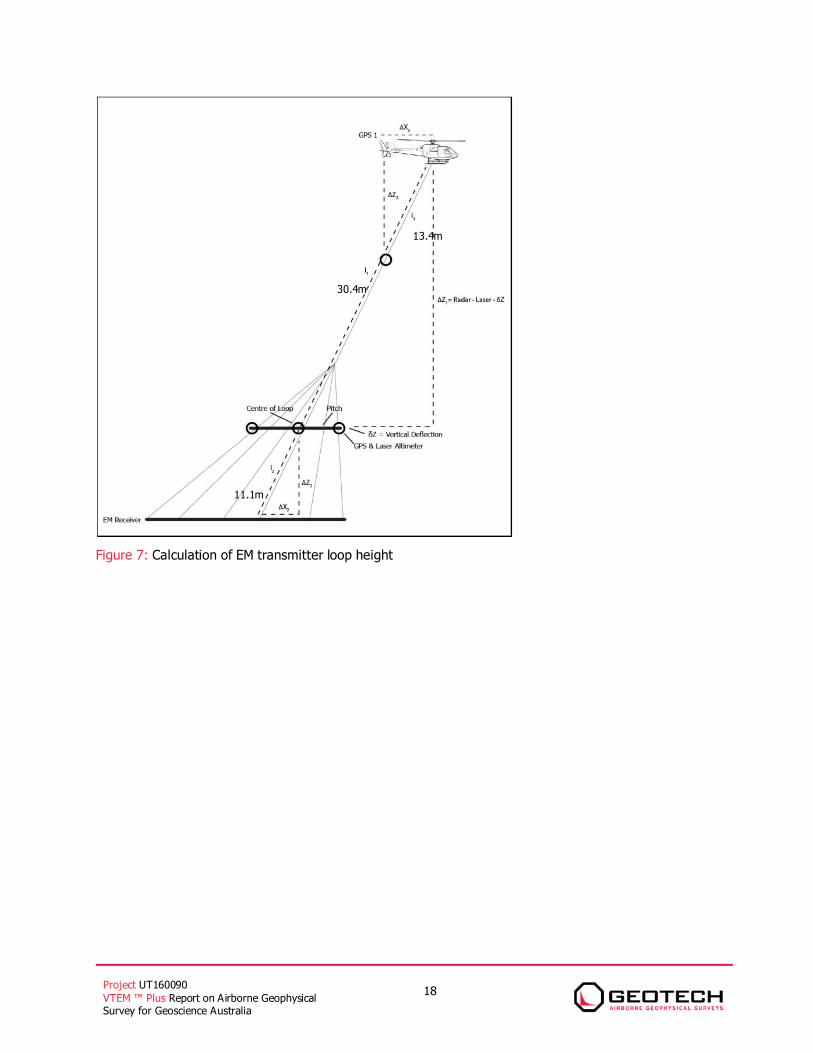
4.2 CALCULATION OF HEIGHT OF THE EM TRANSMITTER RECEIVER LOOP AND MAGNETIC SENSOR The EM transmitter-receiver loop height above ground was calculated from data from the radar altimeter located on the helicopter, and data from the laser altimeter and gyroscopic inclinometer located on the front of the magnetic gradiometer loop, and knowledge of the tow cable lengths. The procedure requires calculation of the unknown vertical distance between the magnetic gradiometer loop and EM transmitter-receiver loop. This process is summarized in the formula below, where; laser is the laser altimeter measurement, radar is the radar altimeter measurement, l1 is the length along the tow cable from the helicopter to the center of the gradiometer loop equal to 30.4 meters, l2 is the length along the tow cable from the center of the gradiometer loop to the center of the transmitter-receiver loop equal to 11.1 meters, and δz is the vertical deflection of the front of the gradiometer loop from the center which can be calculated from the pitch angle and magnetic gradiometer loop radius of 6.25m. These variables are illustrated in Figure 7 showing the VTEM system with an exaggerated pitch. For the magnetic sensor, l3 is the distance from the base of the helicopter along the tow cable to the magnetic sensor, equals to 13.4 meters. The horizontal distance between the radar and the GPS antenna mounted in the helicopter equals 10.45 meters. TxRx Height laser δz l radar laser δzl ∆x l Δz , where, Δz l radar laser δzl .
Project UT160090 VTEM ™ Plus Report on Airborne Geophysical Survey for Geoscience Australia
18
Figure 7: Calculation of EM transmitter loop height
11.1m
13.4m
30.4m
Project UT160090 VTEM ™ Plus Report on Airborne Geophysical Survey for Geoscience Australia
19
4.3 DIGITAL ELEVATION MODEL Two digital elevation models (DEMs) were calculated. They were calculated from the helicopter GPS and radar altimeter, and also from the magnetic gradiometer loop GPS and laser altimeter. The formulas used to calculate the DEMs are shown below. DEM Z N N radar 2.5 DEM Z N N laser The term NEGM96 - NAUSGEOID09, accounts for the difference between the EGM96 geoid, which the GPS heights are referenced to, and the AUSGEOID09, which both DEMs are referenced to. The 2.5 metre offset, for the radar altimeter derived DEM, accounts for the vertical separation between the helicopter GPS antenna located on the tail and the radar altimeter located below the noise of the helicopter. 4.4 ELECTROMAGNETIC DATA As the data are acquired by the data acquisition system on the helicopter, it goes through a digital filter to reject major sferic events and is stacked to further reduce system noise. Afterward, the streamed data is processed by applying a system response correction, B-field integration, time window binning, compensation, filtering, and leveling. Four stages of processing of the EM data have been delivered. They are denoted in the final point-located EM dataset (Table 5) as; 1. Raw (Raw), 2. Compensated (Comp), 3. Filtered (Flt), 4. Final (F). The digital filtering process is a three stage filter used to reject major sferic events and reduce system noise. Local sferic activity can produce sharp, large amplitude events that cannot be removed by conventional filtering procedures. Smoothing or stacking will reduce their amplitude but leave a broader residual response that can be confused with geological phenomena. To avoid this possibility, a computer algorithm searches out and rejects the major sferic events. The data was then stacked using 15 half cycles, 0.3 seconds, to create a stacked half-cycle waveform at 0.1 second intervals. The stacking coefficients are tapered with a shape that approximates a Gaussian function. During post-flight processing, the streamed data have a sensor response correction applied which corrects the receiver channels and current monitor to a common impulse response based on the Full Waveform calibration (see Section 2.7.1). The B-field data are calculated by integrating the dB/dt cycles from the 192 kHz streamed data. Then, the streamed data are converted into a set of time window channels (see Table 3) to reduce noise levels further. The output of this stage is the data denoted as “Raw” in Table 5
Project UT160090 VTEM ™ Plus Report on Airborne Geophysical Survey for Geoscience Australia
20
The data have noise levels reduced further by the use of an EM compensation procedure which removes characteristic noise from each fiducial determined by the difference between the transmitter and bucking loop fields at the receiver during the flight. This is achieved by a statistical correlation between each time window channel and primary field measurement taken during the on-time. The data channels which have been processed to this point are denoted by “Compensated” in Table 5. Next, filtering of the electromagnetic data was performed in two steps. The first is a 4 fiducial wide non-linear filter to eliminate any large spikes remaining in the dataset. The second filter is a low pass symmetric linear digital filter that has zero phase shift which prevents any lag or peak displacement from occurring, and it suppresses only variations with a wavelength less than about 1 second or 25 metres. The output of this stage is the data channels denoted as “Filtered” in Table 5. To remove the remaining system response from the data, a “zero level” estimate was subtracted from the data at each fiducial. First, the “zero level” correction was applied which was calculated by linear interpolation of the high altitude backgrounds (see Section 2.7.2) recorded two or more times during each survey flight. Second, a statistical leveling correction was applied to the EM data which utilizes the high altitude data recorded for each flight and the survey line data to compute the additional leveling correction. This produces the EM data denoted as “Final” in Table 5 VTEM™ has two receiver coil orientations. Z-axis coil is oriented parallel to the transmitter coil axis and both are horizontal to the ground. The X-axis coil is oriented parallel to the ground and along the line-of-flight. This combined two coil configuration provides information on the position, depth, dip and thickness of a conductor. Generalized modeling results of VTEM data, are shown in Appendix D. In general X-component data produce cross-over type anomalies: from “+ to – “in flight direction of flight for “thin” sub vertical targets and from “- to +” in direction of flight for “thick” targets. Z component data produce double peak type anomalies for “thin” sub vertical targets and single peak for “thick” targets. The limits and change-over of “thin-thick” depends on dimensions of a TEM system (Appendix D, Figure D-16).
4.5 CONDUCTIVITY DEPTH IMAGING A set of Conductivity Depth Images (CDI) were generated using EM Flow version 3.3, developed by Encom Technologies Pty Ltd. A total of forty-five (45) dB/dt Z component channels, starting from channel 4 (21 µsec) to channel 48 (10667 µsec), were used for the CDI calculation. An averaged waveform at the receiver was used for the calculation since it was consistent for the majority of the flights with minor deviation from the average. The waveform used is consistent with those supplied and outlined in Table 7. The main steps to calculate the CDI in EM Flow are described in the following points: 1. System definition (units, waveform shape and half period, system geometry and input data format) 2. Conversion from ASCII file format to Binary file format (smoothing option disabled) 3. Basis Function creation. Number of Taus equalled 44 (approximately equal to the number of channels). Tau range was 0.02 ms to 7.5 ms. Number of Eigenvectors was 12. 4. Deconvolution: PLS algorithm. Smoothing set to 0.2 and minimum length to 0.1. Normalization by absolute maximum. Error tolerance at 1.0e-04. No error weighting.
Project UT160090 VTEM ™ Plus Report on Airborne Geophysical Survey for Geoscience Australia
21
5. CDI Matrix Calculation: Tau range at all (1-44). Maximum altitude at 500 metres and maximum depth at 400 metres. Depth resolution of 1 metre. Depth of investigation cut-off factor equal to 1. Both exponential and layered models were generated. 6. Data export: Geosoft Line Database. The final delivered CDI dataset (Table 6) contains estimated conductivities as an array with 70 elements with a depth resolution of 5 metres, for depths from 5 metres to 350 metres. Conductivity Depth Slices were calculated from the 1 metre depth resolution data output from EM Flow by averaging conductivity values within the specified depth ranges, inclusively. 4.6 MAGNETIC DATA The processing of the magnetic data involved the correction for diurnal variations by using the digitally recorded ground base station magnetic values. The base station magnetometer data was edited and merged into the Geosoft GDB database on a daily basis. The aeromagnetic data was corrected for diurnal variations by subtracting the observed magnetic base station deviations. The removal of the International Geomagnetic Reference Field is then applied based on the IGRF model provided for each flight date over the survey lines. A magnetic field of 50,577 nT is added back to the data.
Project UT160090 VTEM ™ Plus Report on Airborne Geophysical Survey for Geoscience Australia
22
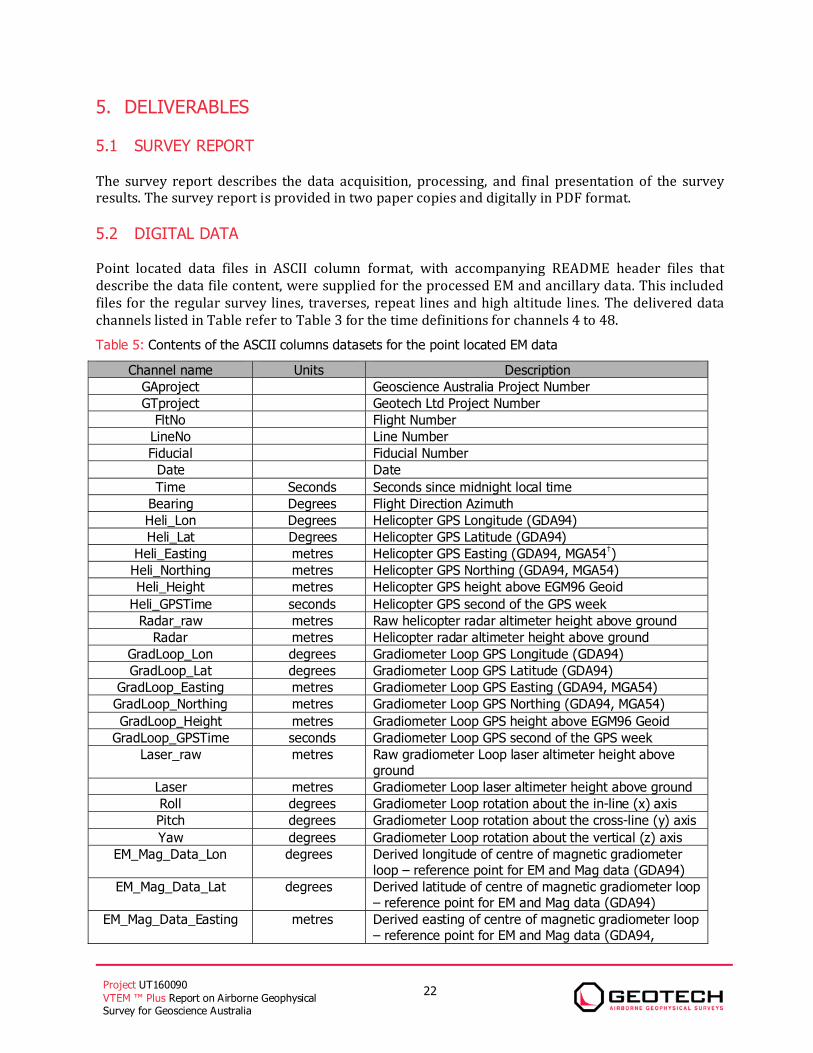
5. DELIVERABLES 5.1 SURVEY REPORT The survey report describes the data acquisition, processing, and final presentation of the survey results. The survey report is provided in two paper copies and digitally in PDF format. 5.2 DIGITAL DATA Point located data files in ASCII column format, with accompanying README header files that describe the data file content, were supplied for the processed EM and ancillary data. This included files for the regular survey lines, traverses, repeat lines and high altitude lines. The delivered data channels listed in Table refer to Table 3 for the time definitions for channels 4 to 48. Table 5: Contents of the ASCII columns datasets for the point located EM data
Channel name Units Description GAproject Geoscience Australia Project Number GTproject Geotech Ltd Project Number
FltNo Flight Number LineNo Line Number Fiducial Fiducial Number
Date Date Time Seconds Seconds since midnight local time
Bearing Degrees Flight Direction Azimuth Heli_Lon Degrees Helicopter GPS Longitude (GDA94) Heli_Lat Degrees Helicopter GPS Latitude (GDA94)
Heli_Easting metres Helicopter GPS Easting (GDA94, MGA54†) Heli_Northing metres Helicopter GPS Northing (GDA94, MGA54) Heli_Height metres Helicopter GPS height above EGM96 Geoid
Heli_GPSTime seconds Helicopter GPS second of the GPS week Radar_raw metres Raw helicopter radar altimeter height above ground
Radar metres Helicopter radar altimeter height above ground GradLoop_Lon degrees Gradiometer Loop GPS Longitude (GDA94) GradLoop_Lat degrees Gradiometer Loop GPS Latitude (GDA94)
GradLoop_Easting metres Gradiometer Loop GPS Easting (GDA94, MGA54) GradLoop_Northing metres Gradiometer Loop GPS Northing (GDA94, MGA54) GradLoop_Height metres Gradiometer Loop GPS height above EGM96 Geoid
GradLoop_GPSTime seconds Gradiometer Loop GPS second of the GPS week Laser_raw metres Raw gradiometer Loop laser altimeter height above
ground Laser metres Gradiometer Loop laser altimeter height above ground Roll degrees Gradiometer Loop rotation about the in-line (x) axis Pitch degrees Gradiometer Loop rotation about the cross-line (y) axis Yaw degrees Gradiometer Loop rotation about the vertical (z) axis
EM_Mag_Data_Lon degrees Derived longitude of centre of magnetic gradiometer loop – reference point for EM and Mag data (GDA94)
EM_Mag_Data_Lat degrees Derived latitude of centre of magnetic gradiometer loop – reference point for EM and Mag data (GDA94)
EM_Mag_Data_Easting metres Derived easting of centre of magnetic gradiometer loop – reference point for EM and Mag data (GDA94,
Project UT160090 VTEM ™ Plus Report on Airborne Geophysical Survey for Geoscience Australia
23
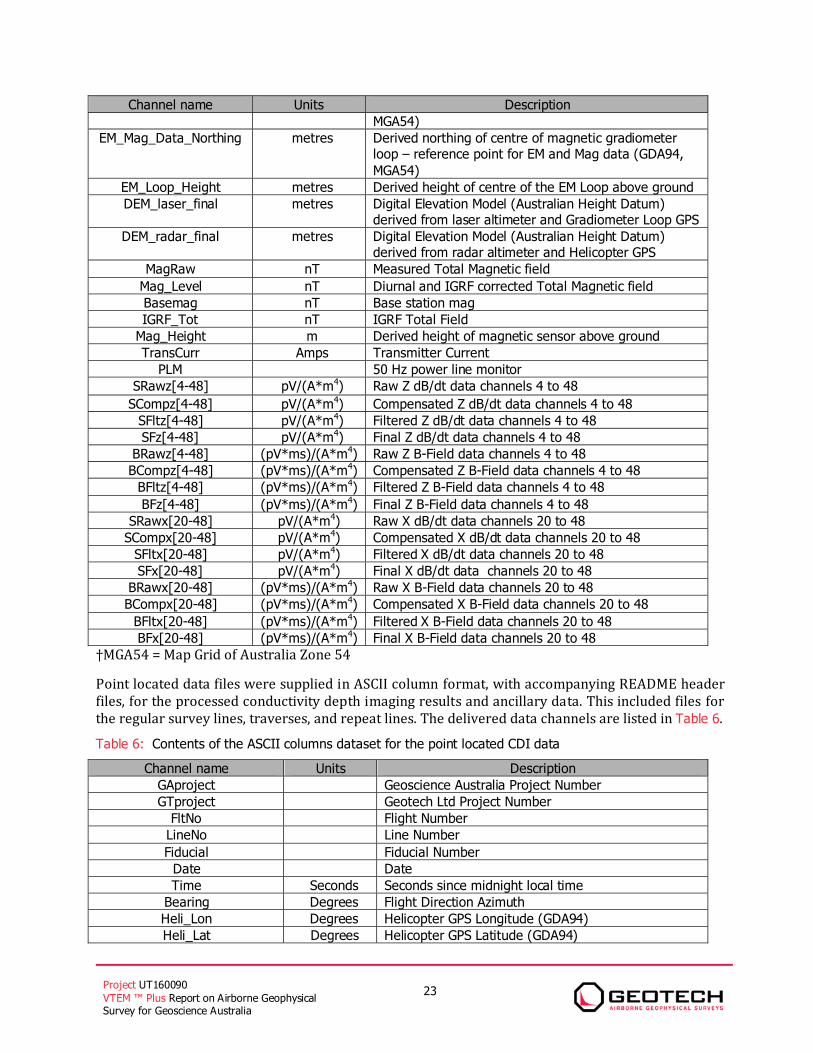
Channel name Units Description MGA54)
EM_Mag_Data_Northing metres Derived northing of centre of magnetic gradiometer loop – reference point for EM and Mag data (GDA94, MGA54)
EM_Loop_Height metres Derived height of centre of the EM Loop above ground DEM_laser_final metres Digital Elevation Model (Australian Height Datum)
derived from laser altimeter and Gradiometer Loop GPS DEM_radar_final metres Digital Elevation Model (Australian Height Datum)
derived from radar altimeter and Helicopter GPS MagRaw nT Measured Total Magnetic field
Mag_Level nT Diurnal and IGRF corrected Total Magnetic field Basemag nT Base station mag IGRF_Tot nT IGRF Total Field
Mag_Height m Derived height of magnetic sensor above ground TransCurr Amps Transmitter Current
PLM 50 Hz power line monitor SRawz[4-48] pV/(A*m4) Raw Z dB/dt data channels 4 to 48
SCompz[4-48] pV/(A*m4) Compensated Z dB/dt data channels 4 to 48 SFltz[4-48] pV/(A*m4) Filtered Z dB/dt data channels 4 to 48 SFz[4-48] pV/(A*m4) Final Z dB/dt data channels 4 to 48
BRawz[4-48] (pV*ms)/(A*m4) Raw Z B-Field data channels 4 to 48 BCompz[4-48] (pV*ms)/(A*m4) Compensated Z B-Field data channels 4 to 48
BFltz[4-48] (pV*ms)/(A*m4) Filtered Z B-Field data channels 4 to 48 BFz[4-48] (pV*ms)/(A*m4) Final Z B-Field data channels 4 to 48
SRawx[20-48] pV/(A*m4) Raw X dB/dt data channels 20 to 48 SCompx[20-48] pV/(A*m4) Compensated X dB/dt data channels 20 to 48
SFltx[20-48] pV/(A*m4) Filtered X dB/dt data channels 20 to 48 SFx[20-48] pV/(A*m4) Final X dB/dt data channels 20 to 48
BRawx[20-48] (pV*ms)/(A*m4) Raw X B-Field data channels 20 to 48 BCompx[20-48] (pV*ms)/(A*m4) Compensated X B-Field data channels 20 to 48
BFltx[20-48] (pV*ms)/(A*m4) Filtered X B-Field data channels 20 to 48 BFx[20-48] (pV*ms)/(A*m4) Final X B-Field data channels 20 to 48 †MGA54 = Map Grid of Australia Zone 54 Point located data files were supplied in ASCII column format, with accompanying README header files, for the processed conductivity depth imaging results and ancillary data. This included files for the regular survey lines, traverses, and repeat lines. The delivered data channels are listed in Table 6.
Table 6: Contents of the ASCII columns dataset for the point located CDI data Channel name Units Description
GAproject Geoscience Australia Project Number GTproject Geotech Ltd Project Number
FltNo Flight Number LineNo Line Number Fiducial Fiducial Number
Date Date Time Seconds Seconds since midnight local time
Bearing Degrees Flight Direction Azimuth Heli_Lon Degrees Helicopter GPS Longitude (GDA94) Heli_Lat Degrees Helicopter GPS Latitude (GDA94)
Project UT160090 VTEM ™ Plus Report on Airborne Geophysical Survey for Geoscience Australia
24
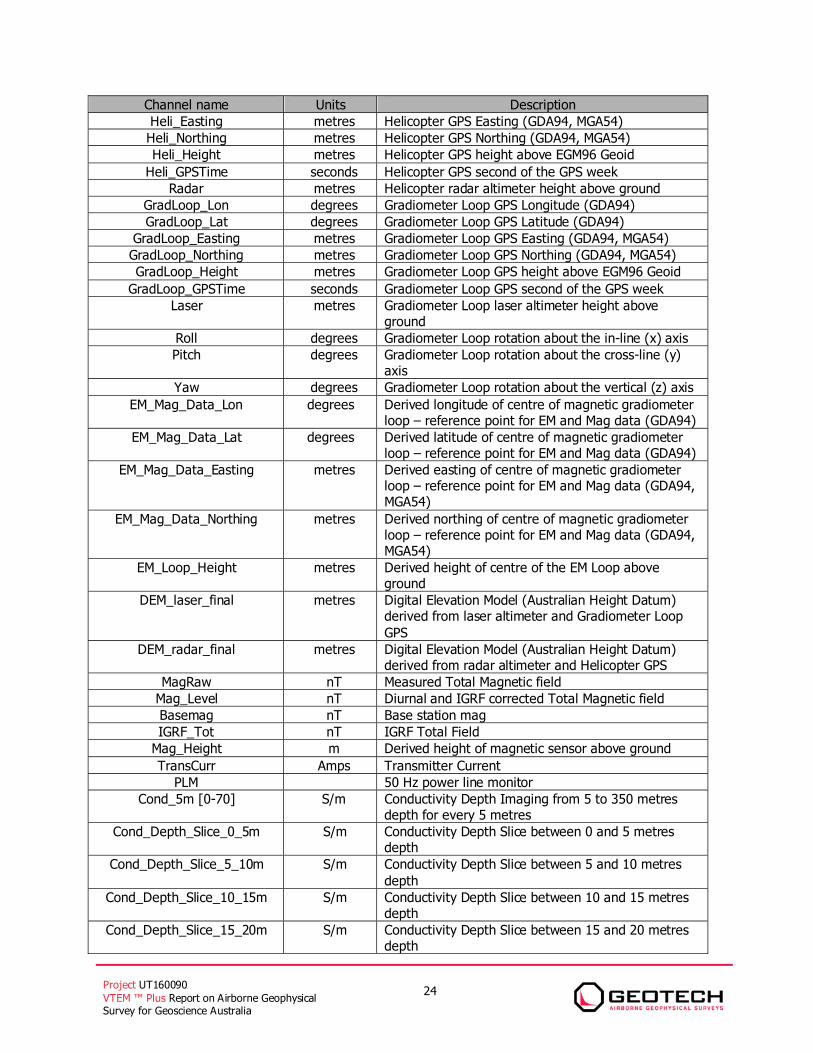
Channel name Units Description Heli_Easting metres Helicopter GPS Easting (GDA94, MGA54) Heli_Northing metres Helicopter GPS Northing (GDA94, MGA54) Heli_Height metres Helicopter GPS height above EGM96 Geoid
Heli_GPSTime seconds Helicopter GPS second of the GPS week Radar metres Helicopter radar altimeter height above ground
GradLoop_Lon degrees Gradiometer Loop GPS Longitude (GDA94) GradLoop_Lat degrees Gradiometer Loop GPS Latitude (GDA94)
GradLoop_Easting metres Gradiometer Loop GPS Easting (GDA94, MGA54) GradLoop_Northing metres Gradiometer Loop GPS Northing (GDA94, MGA54) GradLoop_Height metres Gradiometer Loop GPS height above EGM96 Geoid
GradLoop_GPSTime seconds Gradiometer Loop GPS second of the GPS week Laser metres Gradiometer Loop laser altimeter height above
ground Roll degrees Gradiometer Loop rotation about the in-line (x) axis Pitch degrees Gradiometer Loop rotation about the cross-line (y)
axis Yaw degrees Gradiometer Loop rotation about the vertical (z) axis
EM_Mag_Data_Lon degrees Derived longitude of centre of magnetic gradiometer loop – reference point for EM and Mag data (GDA94)
EM_Mag_Data_Lat degrees Derived latitude of centre of magnetic gradiometer loop – reference point for EM and Mag data (GDA94)
EM_Mag_Data_Easting metres Derived easting of centre of magnetic gradiometer loop – reference point for EM and Mag data (GDA94, MGA54)
EM_Mag_Data_Northing metres Derived northing of centre of magnetic gradiometer loop – reference point for EM and Mag data (GDA94, MGA54)
EM_Loop_Height metres Derived height of centre of the EM Loop above ground
DEM_laser_final metres Digital Elevation Model (Australian Height Datum) derived from laser altimeter and Gradiometer Loop GPS
DEM_radar_final metres Digital Elevation Model (Australian Height Datum) derived from radar altimeter and Helicopter GPS
MagRaw nT Measured Total Magnetic field Mag_Level nT Diurnal and IGRF corrected Total Magnetic field Basemag nT Base station mag IGRF_Tot nT IGRF Total Field
Mag_Height m Derived height of magnetic sensor above ground TransCurr Amps Transmitter Current
PLM 50 Hz power line monitor Cond_5m [0-70] S/m Conductivity Depth Imaging from 5 to 350 metres
depth for every 5 metres Cond_Depth_Slice_0_5m S/m Conductivity Depth Slice between 0 and 5 metres
depth Cond_Depth_Slice_5_10m S/m Conductivity Depth Slice between 5 and 10 metres
depth Cond_Depth_Slice_10_15m S/m Conductivity Depth Slice between 10 and 15 metres
depth Cond_Depth_Slice_15_20m S/m Conductivity Depth Slice between 15 and 20 metres
depth
Project UT160090 VTEM ™ Plus Report on Airborne Geophysical Survey for Geoscience Australia
25
Channel name Units Description Cond_Depth_Slice_20_30m S/m Conductivity Depth Slice between 20 and 30 metres
depth Cond_Depth_Slice_30_40m S/m Conductivity Depth Slice between 30 and 40 metres
depth Cond_Depth_Slice_40_60m S/m Conductivity Depth Slice between 40 and 60 metres
depth Cond_Depth_Slice_60_100m S/m Conductivity Depth Slice between 60 and 100 metres
depth Cond_Depth_Slice_100_150m S/m Conductivity Depth Slice between 100 and 150
metres depth Cond_Depth_Slice_150_200m S/m Conductivity Depth Slice between 150 and 200
metres depth Cond_Depth_Slice_200_300m S/m Conductivity Depth Slice between 200 and 300
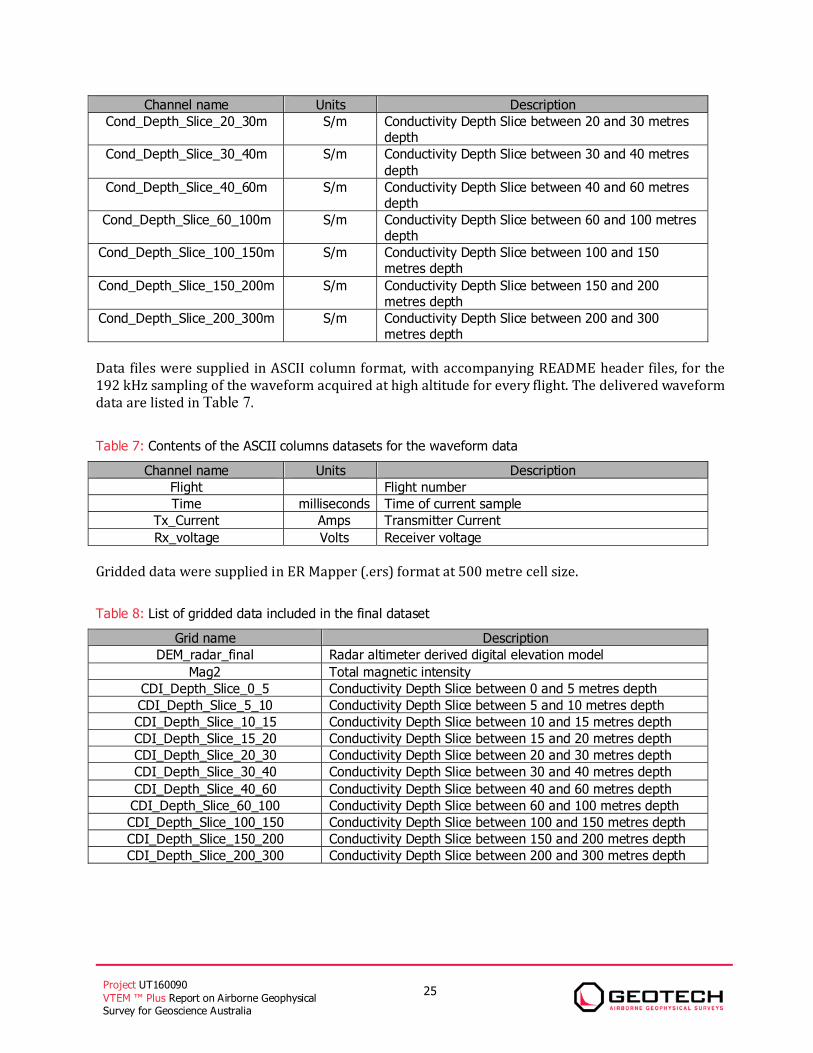
metres depth Data files were supplied in ASCII column format, with accompanying README header files, for the 192 kHz sampling of the waveform acquired at high altitude for every flight. The delivered waveform data are listed in Table 7. Table 7: Contents of the ASCII columns datasets for the waveform data
Channel name Units Description Flight Flight number Time milliseconds Time of current sample
Tx_Current Amps Transmitter Current Rx_voltage Volts Receiver voltage Gridded data were supplied in ER Mapper (.ers) format at 500 metre cell size.
Table 8: List of gridded data included in the final dataset
Grid name Description DEM_radar_final Radar altimeter derived digital elevation model
Mag2 Total magnetic intensity CDI_Depth_Slice_0_5 Conductivity Depth Slice between 0 and 5 metres depth CDI_Depth_Slice_5_10 Conductivity Depth Slice between 5 and 10 metres depth CDI_Depth_Slice_10_15 Conductivity Depth Slice between 10 and 15 metres depth CDI_Depth_Slice_15_20 Conductivity Depth Slice between 15 and 20 metres depth CDI_Depth_Slice_20_30 Conductivity Depth Slice between 20 and 30 metres depth CDI_Depth_Slice_30_40 Conductivity Depth Slice between 30 and 40 metres depth CDI_Depth_Slice_40_60 Conductivity Depth Slice between 40 and 60 metres depth CDI_Depth_Slice_60_100 Conductivity Depth Slice between 60 and 100 metres depth CDI_Depth_Slice_100_150 Conductivity Depth Slice between 100 and 150 metres depth CDI_Depth_Slice_150_200 Conductivity Depth Slice between 150 and 200 metres depth CDI_Depth_Slice_200_300 Conductivity Depth Slice between 200 and 300 metres depth

Project UT160090 VTEM ™ Plus Report on Airborne Geophysical Survey for Geoscience Australia
26
Respectfully submitted2, ___________________________ ___________________________ Neil Fiset Marta Orta Geotech Ltd Geotech Ltd ___________________________ ___________________________ Nasreddine Bournas Geoffrey Plastow, P. Geo. Geotech Ltd Data Processing Manager Geotech Ltd January, 2017
2 Final data processing of the EM and magnetic data were carried out by Neil Fiset, Marta Orta and Nasreddine Bournas from the office of Geotech Ltd. in Aurora, Ontario, under the supervision of Geoffrey Plastow, P.Geo. Data Processing Manager.
Project UT160090 VTEM ™ Plus Report on Airborne Geophysical Survey for Geoscience Australia
1
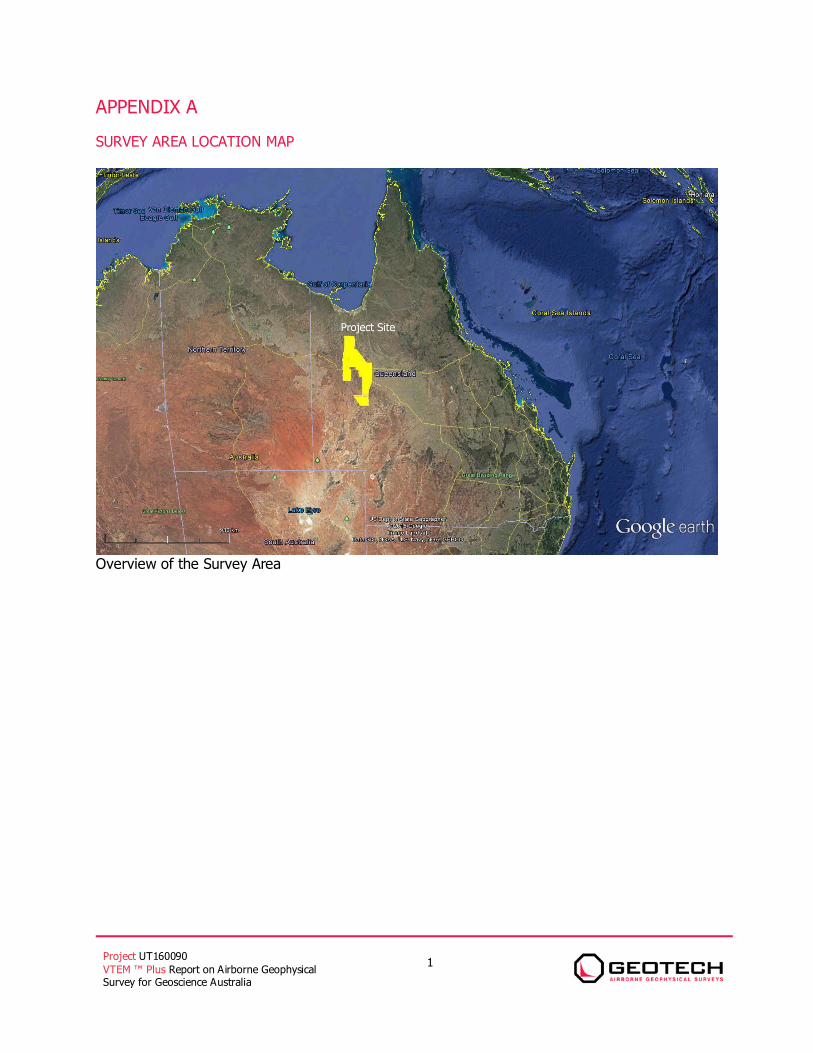
APPENDIX A
SURVEY AREA LOCATION MAP
Overview of the Survey Area
Project UT160090 VTEM ™ Plus Report on Airborne Geophysical Survey for Geoscience Australia
1
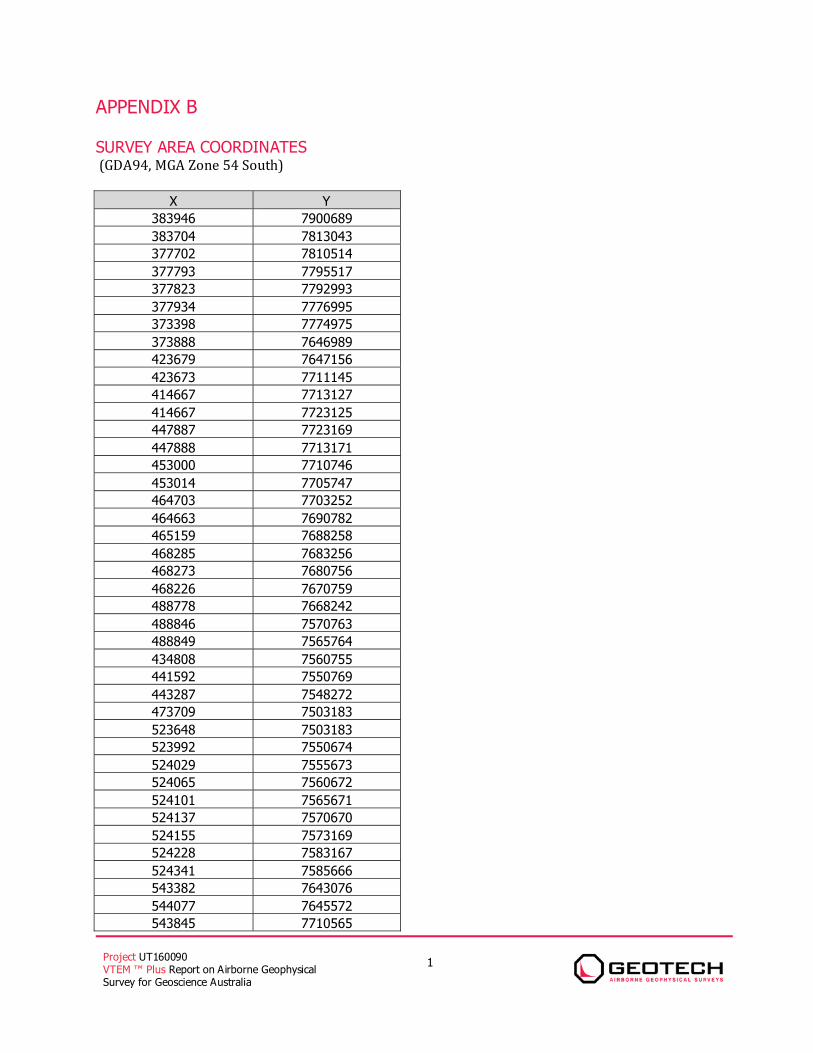
APPENDIX B SURVEY AREA COORDINATES (GDA94, MGA Zone 54 South)
X Y 383946 7900689 383704 7813043 377702 7810514 377793 7795517 377823 7792993 377934 7776995 373398 7774975 373888 7646989 423679 7647156 423673 7711145 414667 7713127 414667 7723125 447887 7723169 447888 7713171 453000 7710746 453014 7705747 464703 7703252 464663 7690782 465159 7688258 468285 7683256 468273 7680756 468226 7670759 488778 7668242 488846 7570763 488849 7565764 434808 7560755 441592 7550769 443287 7548272 473709 7503183 523648 7503183 523992 7550674 524029 7555673 524065 7560672 524101 7565671 524137 7570670 524155 7573169 524228 7583167 524341 7585666 543382 7643076 544077 7645572 543845 7710565
Project UT160090 VTEM ™ Plus Report on Airborne Geophysical Survey for Geoscience Australia
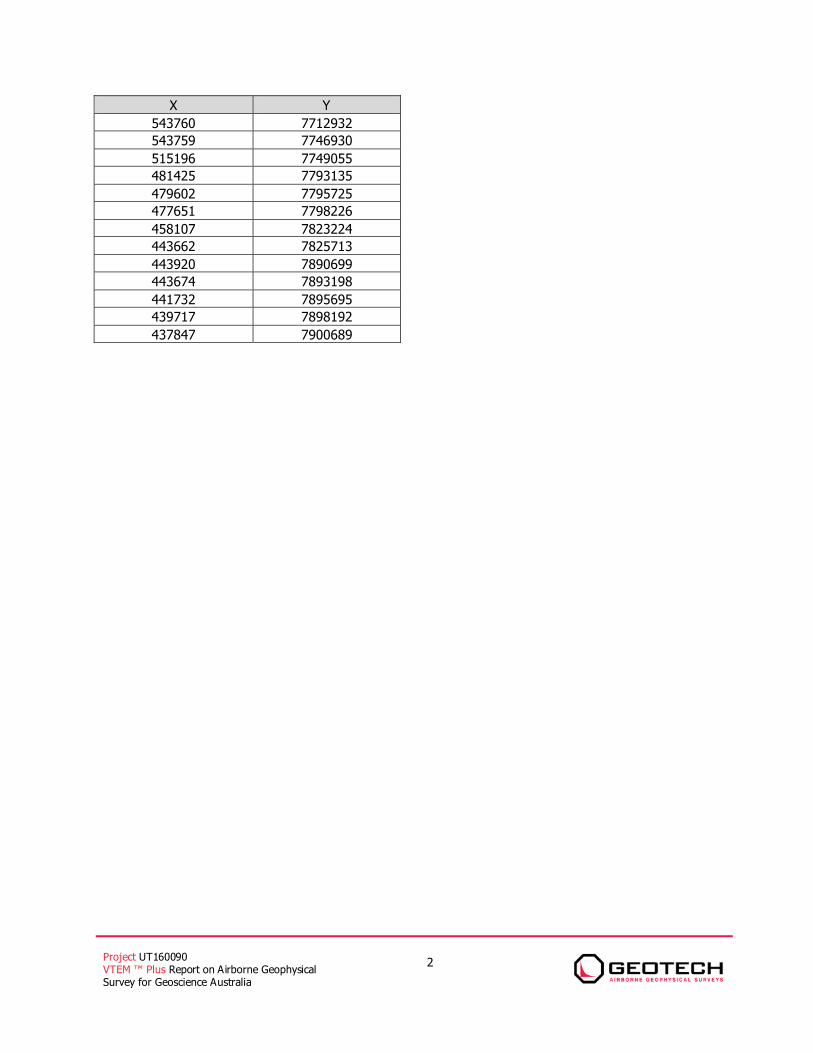
2
X Y 543760 7712932 543759 7746930 515196 7749055 481425 7793135 479602 7795725 477651 7798226 458107 7823224 443662 7825713 443920 7890699 443674 7893198 441732 7895695 439717 7898192 437847 7900689
Project UT160090 VTEM ™ Plus Report on Airborne Geophysical Survey for Geoscience Australia
1
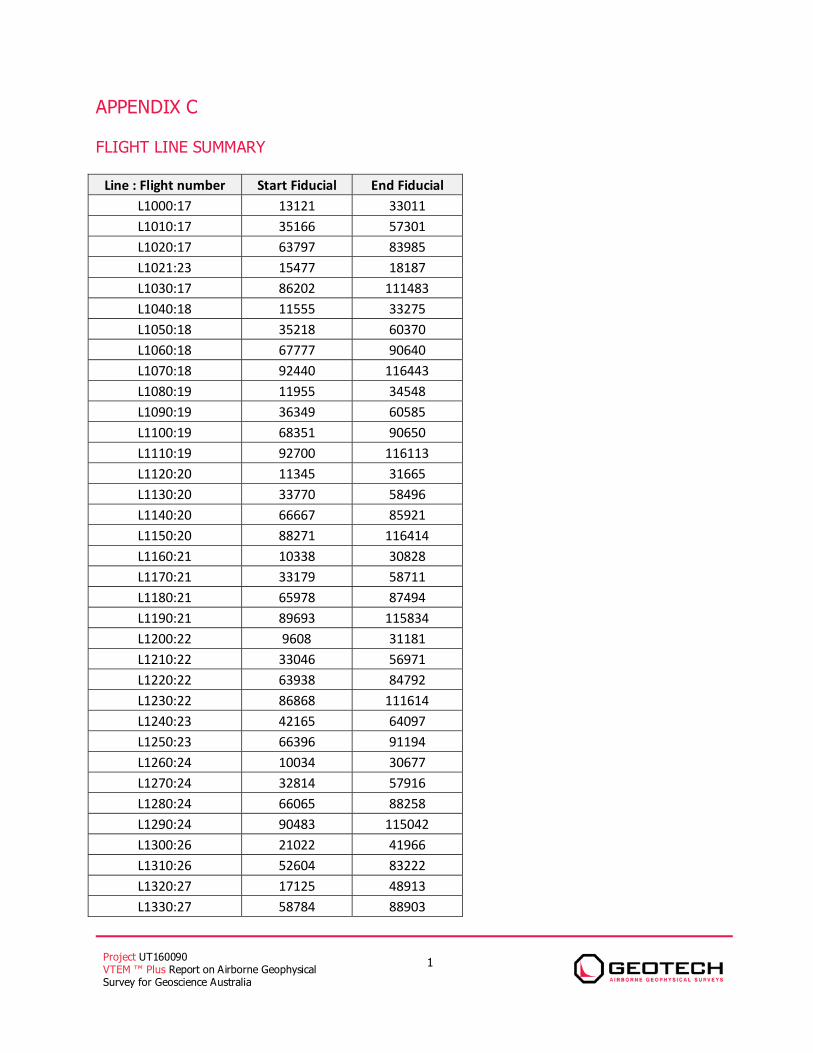
APPENDIX C
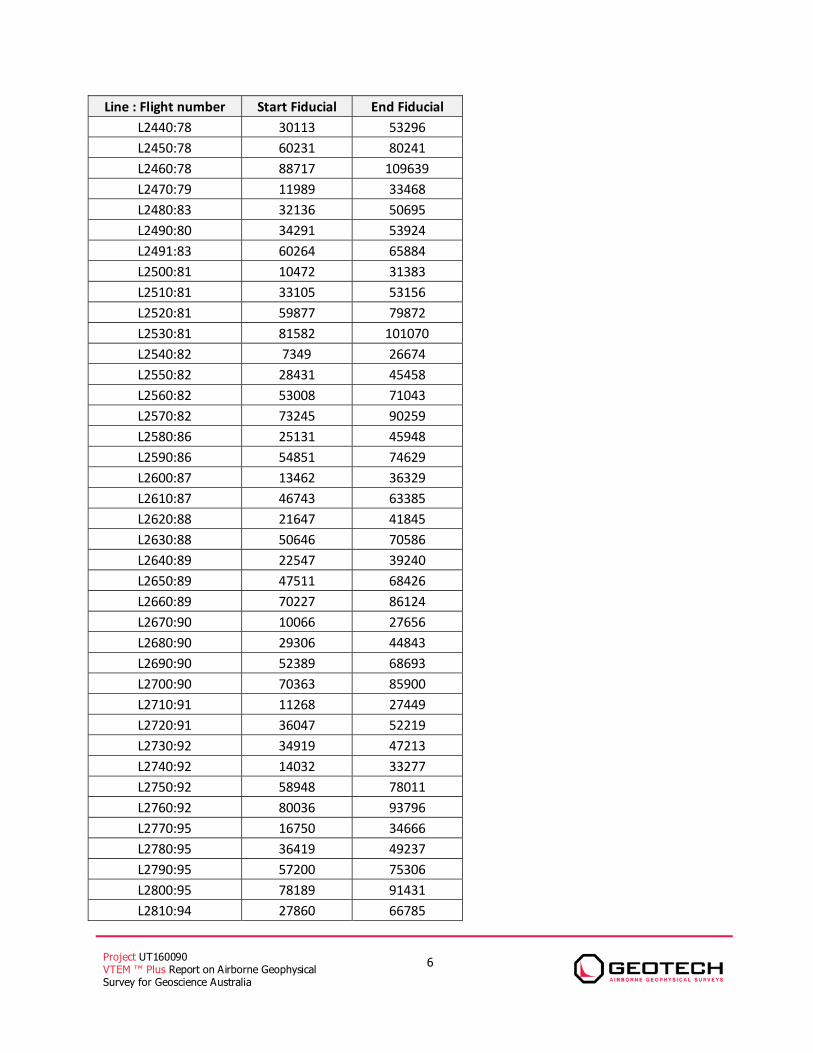
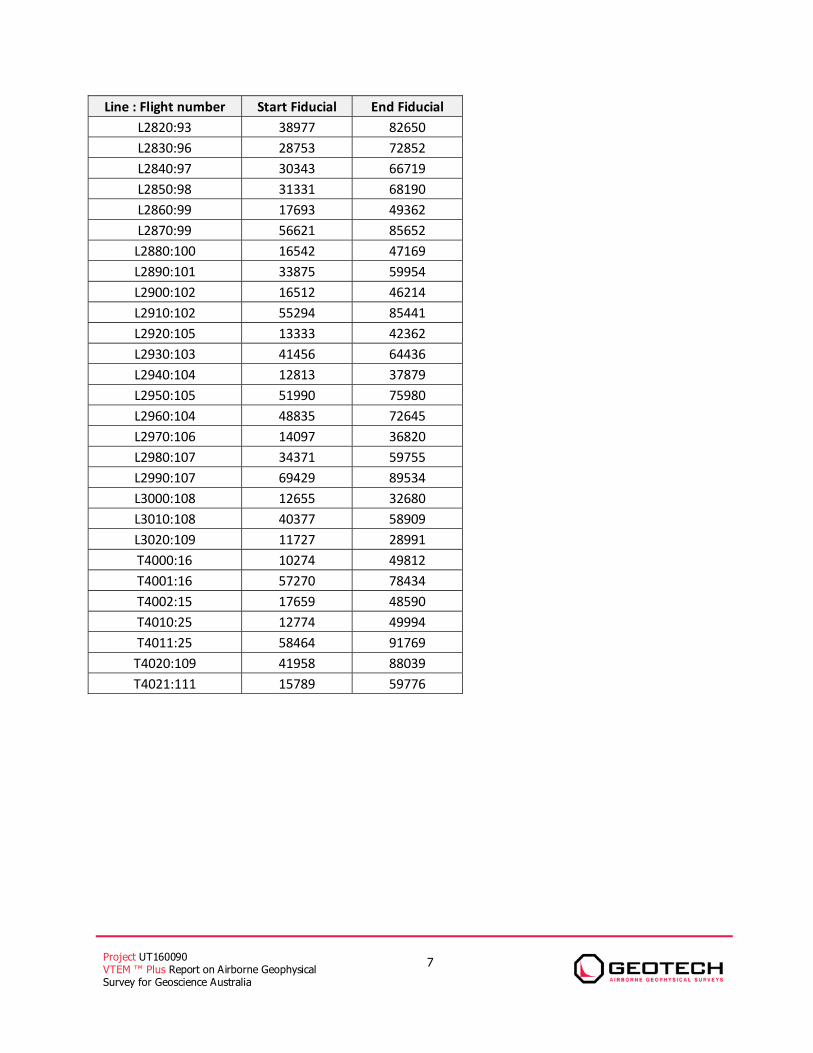
FLIGHT LINE SUMMARY Line : Flight number Start Fiducial End Fiducial
L1000:17 13121 33011 L1010:17 35166 57301 L1020:17 63797 83985 L1021:23 15477 18187 L1030:17 86202 111483 L1040:18 11555 33275 L1050:18 35218 60370 L1060:18 67777 90640 L1070:18 92440 116443 L1080:19 11955 34548 L1090:19 36349 60585 L1100:19 68351 90650 L1110:19 92700 116113 L1120:20 11345 31665 L1130:20 33770 58496 L1140:20 66667 85921 L1150:20 88271 116414 L1160:21 10338 30828 L1170:21 33179 58711 L1180:21 65978 87494 L1190:21 89693 115834 L1200:22 9608 31181 L1210:22 33046 56971 L1220:22 63938 84792 L1230:22 86868 111614 L1240:23 42165 64097 L1250:23 66396 91194 L1260:24 10034 30677 L1270:24 32814 57916 L1280:24 66065 88258 L1290:24 90483 115042 L1300:26 21022 41966 L1310:26 52604 83222 L1320:27 17125 48913 L1330:27 58784 88903
Project UT160090 VTEM ™ Plus Report on Airborne Geophysical Survey for Geoscience Australia
2
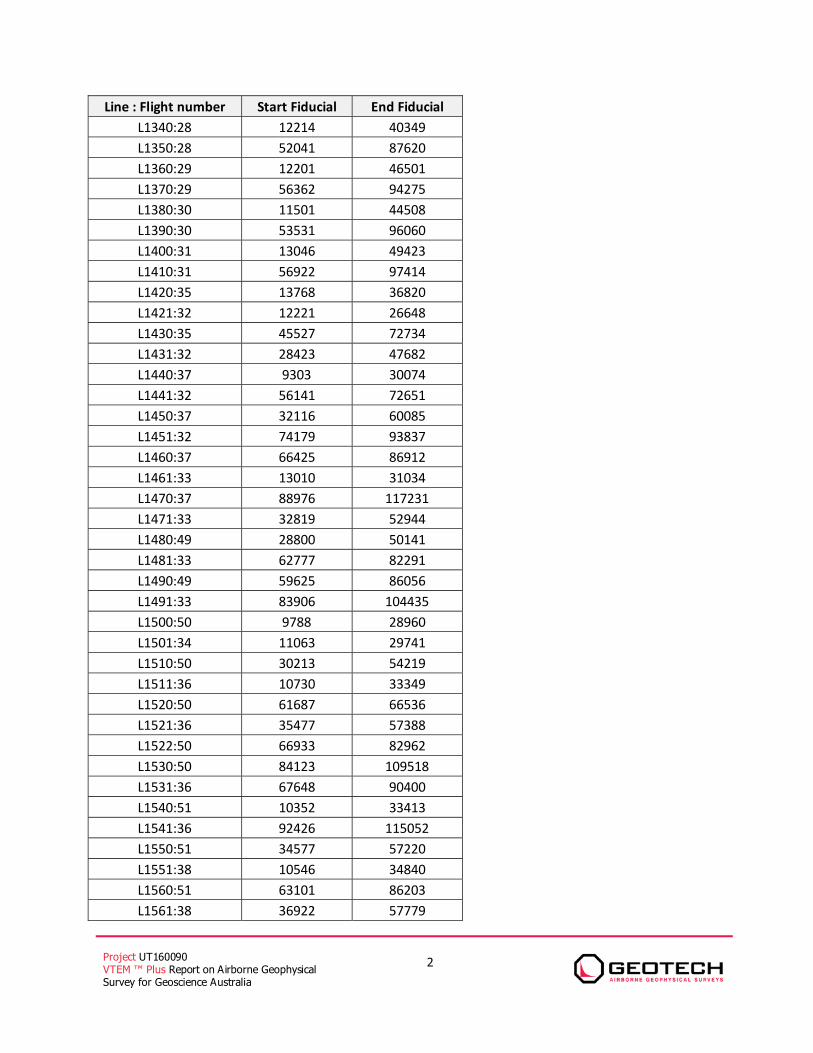
Line : Flight number Start Fiducial End Fiducial L1340:28 12214 40349 L1350:28 52041 87620 L1360:29 12201 46501 L1370:29 56362 94275 L1380:30 11501 44508 L1390:30 53531 96060 L1400:31 13046 49423 L1410:31 56922 97414 L1420:35 13768 36820 L1421:32 12221 26648 L1430:35 45527 72734 L1431:32 28423 47682 L1440:37 9303 30074 L1441:32 56141 72651 L1450:37 32116 60085 L1451:32 74179 93837 L1460:37 66425 86912 L1461:33 13010 31034 L1470:37 88976 117231 L1471:33 32819 52944 L1480:49 28800 50141 L1481:33 62777 82291 L1490:49 59625 86056 L1491:33 83906 104435 L1500:50 9788 28960 L1501:34 11063 29741 L1510:50 30213 54219 L1511:36 10730 33349 L1520:50 61687 66536 L1521:36 35477 57388 L1522:50 66933 82962 L1530:50 84123 109518 L1531:36 67648 90400 L1540:51 10352 33413 L1541:36 92426 115052 L1550:51 34577 57220 L1551:38 10546 34840 L1560:51 63101 86203 L1561:38 36922 57779
Project UT160090 VTEM ™ Plus Report on Airborne Geophysical Survey for Geoscience Australia
3
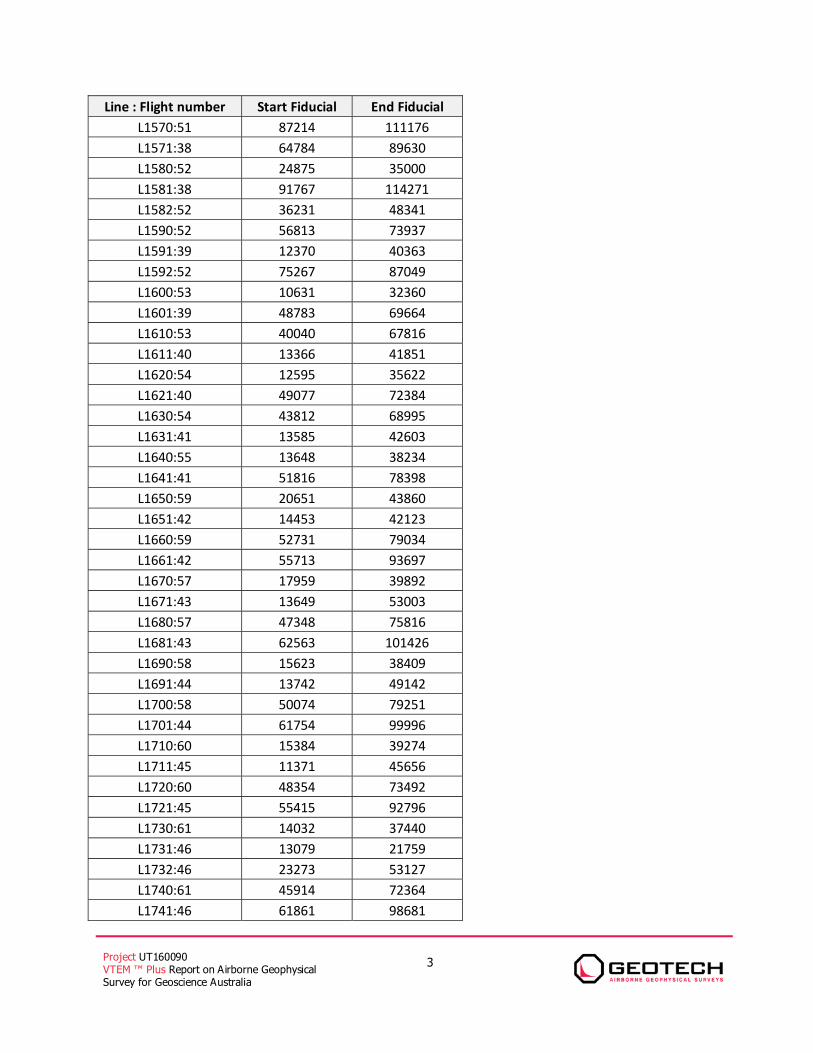
Line : Flight number Start Fiducial End Fiducial L1570:51 87214 111176 L1571:38 64784 89630 L1580:52 24875 35000 L1581:38 91767 114271 L1582:52 36231 48341 L1590:52 56813 73937 L1591:39 12370 40363 L1592:52 75267 87049 L1600:53 10631 32360 L1601:39 48783 69664 L1610:53 40040 67816 L1611:40 13366 41851 L1620:54 12595 35622 L1621:40 49077 72384 L1630:54 43812 68995 L1631:41 13585 42603 L1640:55 13648 38234 L1641:41 51816 78398 L1650:59 20651 43860 L1651:42 14453 42123 L1660:59 52731 79034 L1661:42 55713 93697 L1670:57 17959 39892 L1671:43 13649 53003 L1680:57 47348 75816 L1681:43 62563 101426 L1690:58 15623 38409 L1691:44 13742 49142 L1700:58 50074 79251 L1701:44 61754 99996 L1710:60 15384 39274 L1711:45 11371 45656 L1720:60 48354 73492 L1721:45 55415 92796 L1730:61 14032 37440 L1731:46 13079 21759 L1732:46 23273 53127 L1740:61 45914 72364 L1741:46 61861 98681

Project UT160090 VTEM ™ Plus Report on Airborne Geophysical Survey for Geoscience Australia
4
Line : Flight number Start Fiducial End Fiducial L1750:62 11999 34313 L1751:47 10429 53615 L1760:62 43021 71079 L1761:47 62496 97772 L1770:63 22909 46850 L1771:48 14720 55839 L1780:48 63698 97952 L1790:1 20080 40355 L1800:1 45556 62630
L1810:64 14014 49629 L1820:1 69983 89803
L1830:64 59618 97010 L1840:2 14516 32610
L1850:66 16309 54359 L1860:2 39927 59857
L1870:66 64070 96763 L1880:2 66490 85125 L1890:3 11941 15787 L1891:3 17457 33325 L1900:3 40190 51807 L1901:3 53593 62084 L1902:3 63445 64852 L1910:6 13105 32034 L1920:4 32909 49351 L1921:4 50688 59106 L1930:4 60846 77549 L1940:5 8222 32067 L1950:5 38009 43292 L1951:5 45058 52468 L1952:6 37784 56367 L1960:6 57713 77610 L1970:7 8820 26971 L1980:7 28249 47523 L1990:7 52367 71133 L2000:8 15534 33199 L2010:8 34355 53395 L2020:8 59257 76757 L2030:8 78009 97524 L2040:9 9487 27192
Project UT160090 VTEM ™ Plus Report on Airborne Geophysical Survey for Geoscience Australia
5
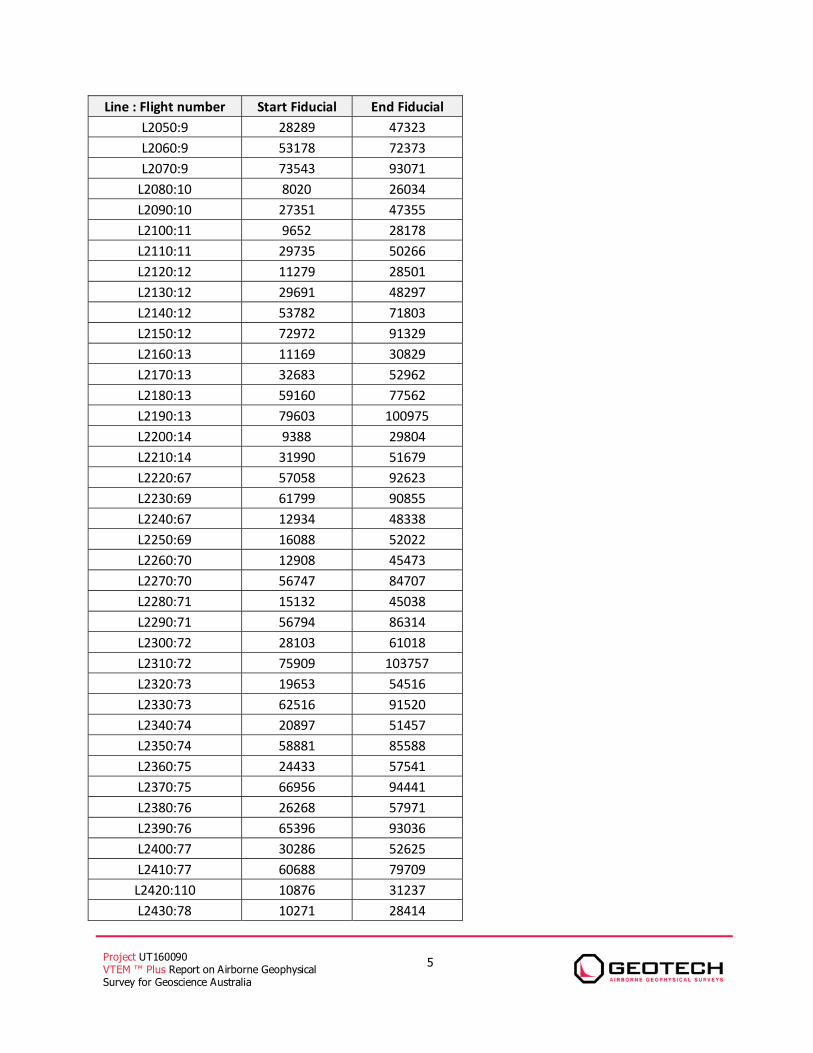
Line : Flight number Start Fiducial End Fiducial L2050:9 28289 47323 L2060:9 53178 72373 L2070:9 73543 93071
L2080:10 8020 26034 L2090:10 27351 47355 L2100:11 9652 28178 L2110:11 29735 50266 L2120:12 11279 28501 L2130:12 29691 48297 L2140:12 53782 71803 L2150:12 72972 91329 L2160:13 11169 30829 L2170:13 32683 52962 L2180:13 59160 77562 L2190:13 79603 100975 L2200:14 9388 29804 L2210:14 31990 51679 L2220:67 57058 92623 L2230:69 61799 90855 L2240:67 12934 48338 L2250:69 16088 52022 L2260:70 12908 45473 L2270:70 56747 84707 L2280:71 15132 45038 L2290:71 56794 86314 L2300:72 28103 61018 L2310:72 75909 103757 L2320:73 19653 54516 L2330:73 62516 91520 L2340:74 20897 51457 L2350:74 58881 85588 L2360:75 24433 57541 L2370:75 66956 94441 L2380:76 26268 57971 L2390:76 65396 93036 L2400:77 30286 52625 L2410:77 60688 79709
L2420:110 10876 31237 L2430:78 10271 28414
Project UT160090 VTEM ™ Plus Report on Airborne Geophysical Survey for Geoscience Australia
6
Line : Flight number Start Fiducial End Fiducial L2440:78 30113 53296 L2450:78 60231 80241 L2460:78 88717 109639 L2470:79 11989 33468 L2480:83 32136 50695 L2490:80 34291 53924 L2491:83 60264 65884 L2500:81 10472 31383 L2510:81 33105 53156 L2520:81 59877 79872 L2530:81 81582 101070 L2540:82 7349 26674 L2550:82 28431 45458 L2560:82 53008 71043 L2570:82 73245 90259 L2580:86 25131 45948 L2590:86 54851 74629 L2600:87 13462 36329 L2610:87 46743 63385 L2620:88 21647 41845 L2630:88 50646 70586 L2640:89 22547 39240 L2650:89 47511 68426 L2660:89 70227 86124 L2670:90 10066 27656 L2680:90 29306 44843 L2690:90 52389 68693 L2700:90 70363 85900 L2710:91 11268 27449 L2720:91 36047 52219 L2730:92 34919 47213 L2740:92 14032 33277 L2750:92 58948 78011 L2760:92 80036 93796 L2770:95 16750 34666 L2780:95 36419 49237 L2790:95 57200 75306 L2800:95 78189 91431 L2810:94 27860 66785
Project UT160090 VTEM ™ Plus Report on Airborne Geophysical Survey for Geoscience Australia
7
Line : Flight number Start Fiducial End Fiducial L2820:93 38977 82650 L2830:96 28753 72852 L2840:97 30343 66719 L2850:98 31331 68190 L2860:99 17693 49362 L2870:99 56621 85652
L2880:100 16542 47169 L2890:101 33875 59954 L2900:102 16512 46214 L2910:102 55294 85441 L2920:105 13333 42362 L2930:103 41456 64436 L2940:104 12813 37879 L2950:105 51990 75980 L2960:104 48835 72645 L2970:106 14097 36820 L2980:107 34371 59755 L2990:107 69429 89534 L3000:108 12655 32680 L3010:108 40377 58909 L3020:109 11727 28991 T4000:16 10274 49812 T4001:16 57270 78434 T4002:15 17659 48590 T4010:25 12774 49994 T4011:25 58464 91769
T4020:109 41958 88039 T4021:111 15789 59776
Project UT160090 VTEM ™ Plus Report on Airborne Geophysical Survey for Geoscience Australia
1
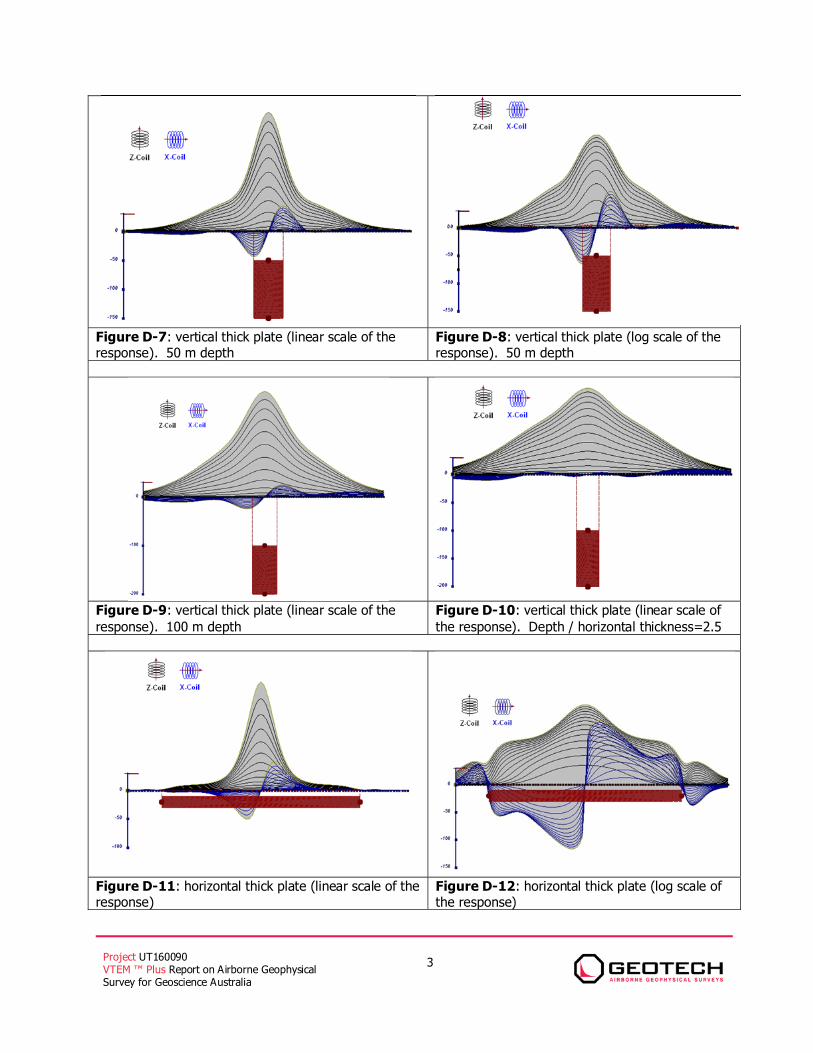
APPENDIX D GENERALIZED MODELING RESULTS OF THE VTEM SYSTEM INTRODUCTION The VTEM system is based on a concentric or central loop design, whereby, the receiver is positioned at the centre of a transmitter loop that produces a primary field. The wave form is a bi-polar, modified square wave with a turn-on and turn-off at each end. During turn-on and turn-off, a time varying field is produced (dB/dt) and an electro-motive force (emf) is created as a finite impulse response. A current ring around the transmitter loop moves outward and downward as time progresses. When conductive rocks and mineralization are encountered, a secondary field is created by mutual induction and measured by the receiver at the centre of the transmitter loop. Efficient modeling of the results can be carried out on regularly shaped geometries, thus yielding close approximations to the parameters of the measured targets. The following is a description of a series of common models made for the purpose of promoting a general understanding of the measured results. A set of models has been produced for the Geotech VTEM® system dB/dT Z and X components (see models D1 to D15). The Maxwell TM modeling program (EMIT Technology Pty. Ltd. Midland, WA, AU) used to generate the following responses assumes a resistive half-space. The reader is encouraged to review these models, so as to get a general understanding of the responses as they apply to survey results. While these models do not begin to cover all possibilities, they give a general perspective on the simple and most commonly encountered anomalies. As the plate dips and departs from the vertical position, the peaks become asymmetrical. As the dip increases, the aspect ratio (Min/Max) decreases and this aspect ratio can be used as an empirical guide to dip angles from near 90º to about 30º. The method is not sensitive enough where dips are less than about 30º.
Project UT160090 VTEM ™ Plus Report on Airborne Geophysical Survey for Geoscience Australia
2
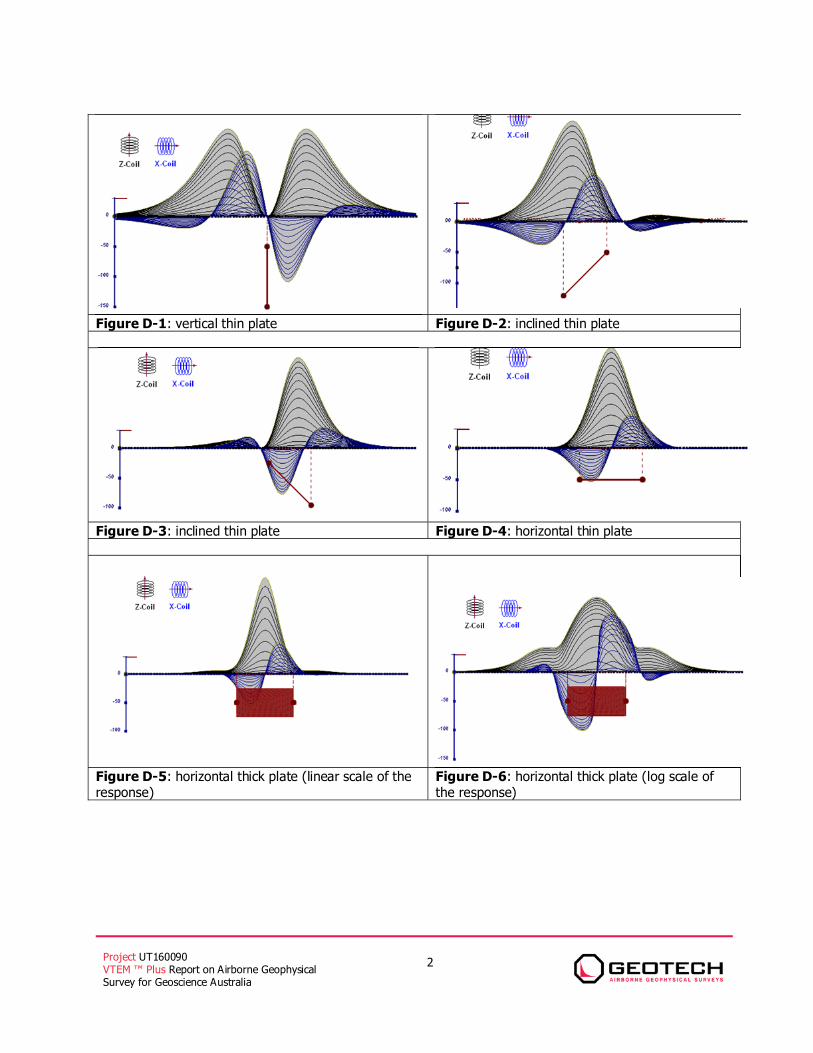
Figure D-1: vertical thin plate Figure D-2: inclined thin plate
Figure D-3: inclined thin plate Figure D-4: horizontal thin plate
Figure D-5: horizontal thick plate (linear scale of the response)
Figure D-6: horizontal thick plate (log scale of the response)
Project UT160090 VTEM ™ Plus Report on Airborne Geophysical Survey for Geoscience Australia
3
Figure D-7: vertical thick plate (linear scale of the response). 50 m depth
Figure D-8: vertical thick plate (log scale of the response). 50 m depth
Figure D-9: vertical thick plate (linear scale of the response). 100 m depth
Figure D-10: vertical thick plate (linear scale of the response). Depth / horizontal thickness=2.5
Figure D-11: horizontal thick plate (linear scale of the response)
Figure D-12: horizontal thick plate (log scale of the response)
Project UT160090 VTEM ™ Plus Report on Airborne Geophysical Survey for Geoscience Australia
4
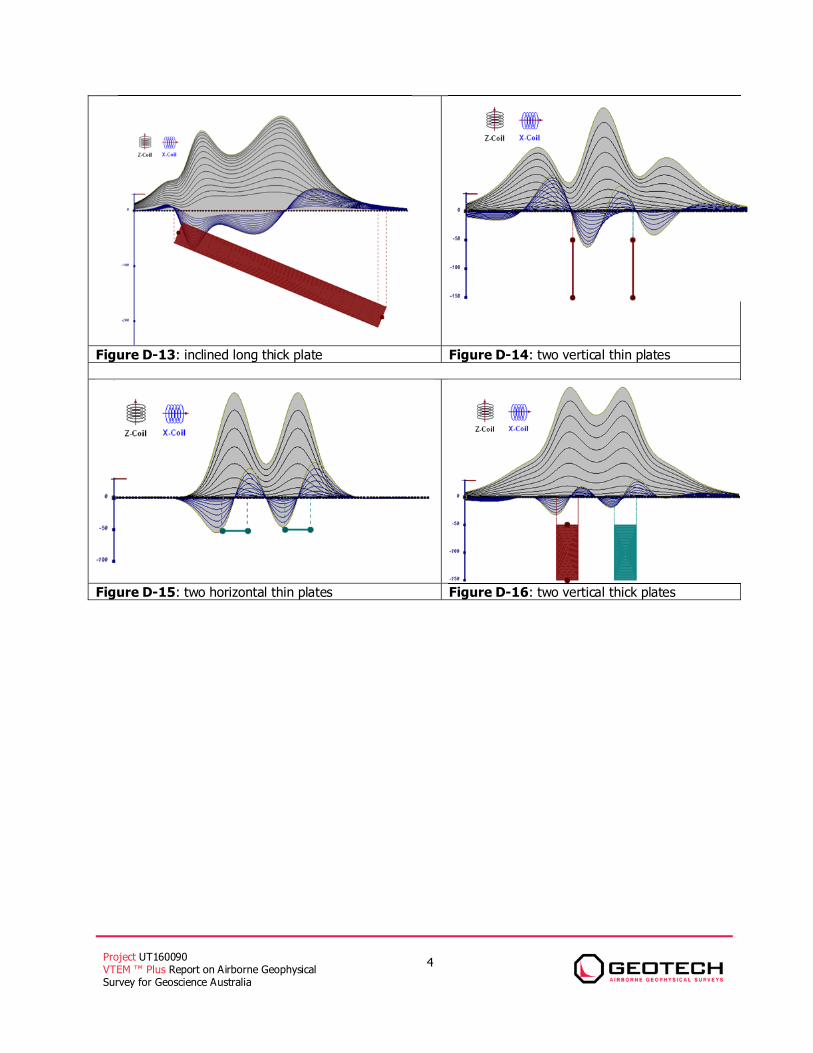
Figure D-13: inclined long thick plate Figure D-14: two vertical thin plates
Figure D-15: two horizontal thin plates Figure D-16: two vertical thick plates
Project UT160090 VTEM ™ Plus Report on Airborne Geophysical Survey for Geoscience Australia
5
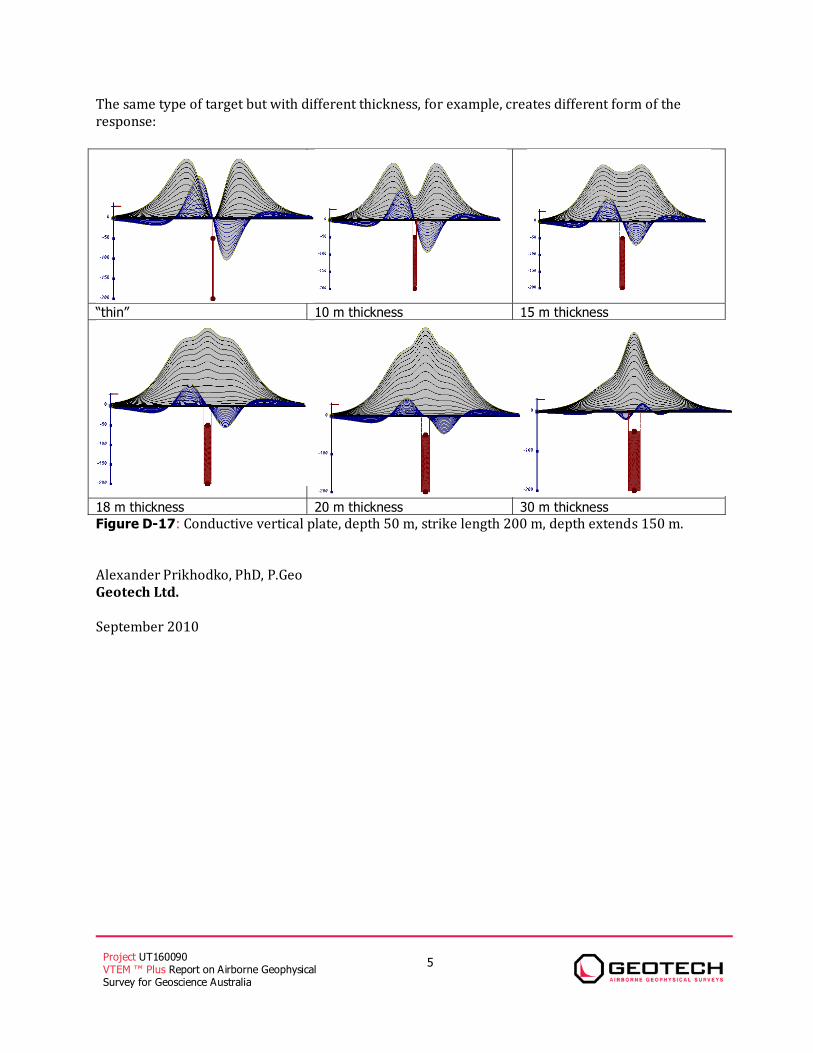
The same type of target but with different thickness, for example, creates different form of the response:
“thin” 10 m thickness 15 m thickness
18 m thickness 20 m thickness 30 m thickness Figure D-17: Conductive vertical plate, depth 50 m, strike length 200 m, depth extends 150 m. Alexander Prikhodko, PhD, P.Geo Geotech Ltd. September 2010

Project UT160090 VTEM ™ Plus Report on Airborne Geophysical Survey for Geoscience Australia
1
APPENDIX E CONDUCTIVITY DEPTH IMAGES MULTI PLOTS Multi-parameter plots are presented for each survey line. These plots include, from top to bottom, (1) pitch and roll of the transmitter-receiver, (2) transmitter-receiver height, (3) power line monitor, 4) magnetics TMI and first vertical derivative, (5) dBz/dt profiles, (6) conductivity-depth image (CDI) in logarithmic colour scale, and (7) CDI in linear colour scale.
Project UT160090 VTEM ™ Plus Report on Airborne Geophysical Survey for Geoscience Australia
1
APPENDIX F TEST AND CALIBRATION PROCEDURES PLATE / ALUMINUM TEST When the aluminum plate is horizontal with respect to the loop, measured signal will show positive response, indicating a proper polarity. Figure below present the plate/aluminum test results performed on August 7th, 2016.
Project UT160090 VTEM ™ Plus Report on Airborne Geophysical Survey for Geoscience Australia
2
RADAR AND LASER ALTIMETER CALIBRATION TESTS Test Date: June 30th, 2016 Test Location: Cloncurry airstrip, Queensland Ground Elevation at test site: 190 metres
Heli Grad Loop Helicopter Grad Loop Heli Grad Loop Database Radar Laser GPS Height GPS Height Calculated Calculated
Line (m AGL) (m AGL) (m ASL) (m ASL) altitude altitude 50 49.70 30.50 247.40 218.70 54.90 28.70 60 62.30 43.70 260.20 231.40 67.70 41.40 75 72.70 54.90 270.70 242.00 78.20 52.00 90 93.20 76.60 291.00 262.50 98.50 72.50
110 111.80 96.70 310.00 281.70 117.50 91.70
Radar and Laser altimeter calibration – June 30th, 2016
y = 0.9503x - 0.2114
y = 1.0056x + 4.9822
0.00
20.00
40.00
60.00
80.00
100.00
120.00
140.00
0.00 50.00 100.00 150.00
Laser vs Z
Radar vs Z
Linear (Laser vs Z)
Linear (Radar vs Z)
Project UT160090 VTEM ™ Plus Report on Airborne Geophysical Survey for Geoscience Australia
3
Test Date: August 8th, 2016 Test Location: Cloncurry airstrip, Queensland Ground Elevation at test site: 190 metres Heli Grad Loop Helicopter Grad Loop Heli Grad Loop
Database Radar Laser GPS Height GPS Height Calculated Calculated Line (m AGL) (m AGL) (m ASL) (m ASL) altitude altitude 240 70.10 51.80 267.40 238.40 74.90 48.40 241 70.80 52.60 268.00 239.10 75.50 49.10 270 78.60 62.70 276.30 248.00 83.80 58.00 271 79.40 62.30 276.90 248.30 84.40 58.30 310 91.20 77.20 288.80 260.40 96.30 70.40 311 91.6 76.6 289.3 260.6 96.80 70.60 350 106.2 93.2 304.3 275.8 111.80 85.80 351 107.1 93 305 276.6 112.50 86.60 400 121.1 112 319.4 291.6 126.90 101.60 401 122.3 109.6 320.5 292.1 128.00 102.10 450 136.9 128.1 335.4 307.5 142.90 117.50 451 137.4 123.8 335.6 306.9 143.10 116.90 500 151.5 145.4 350.2 322.6 157.70 132.60 501 151.7 142.4 349.9 321.6 157.40 131.60
Radar and Laser altimeter calibration – August 8th, 2016
y = 0.9156x + 0.7941
y = 1.0144x + 3.8758
0.00
20.00
40.00
60.00
80.00
100.00
120.00
140.00
160.00
180.00
0.00 50.00 100.00 150.00 200.00
Laser vs Z
Radar vs Z
Linear (Laser vs Z)
Linear (Radar vs Z)