Embed Size (px)
Citation preview
1
UTA Transportation Equity Study and Staff Analysis
Board Workshop
January 6 , 2018
2
• UTA ranks DART 6th out of top 20 Transit Agencies in the country for ridership.
• UTA Study confirms what we all know about our region and parts of our service area --there is low density for jobs and population, especially south of I-30.
• UTA calculates “Transportation Costs” as the sum of automobile ownership costs, automotive use costs, and transit use costs, not just transit costs.
• UTA confirms DART costs (fares including proposed fare increase) are affordable.
• UTA Study shows 97% of a 2,200 square mile area of the Region (including DART’s 700 square mile service area) cannot afford transportation costs, but 100% can afford DART’s transit costs.
Executive Summary
3
• UTA Study emphasizes that “low income” and “no car” households are primarily in Southern Dallas, when in fact there are numerous “low income” and “no car” areas in the DART Service Area and the Region.
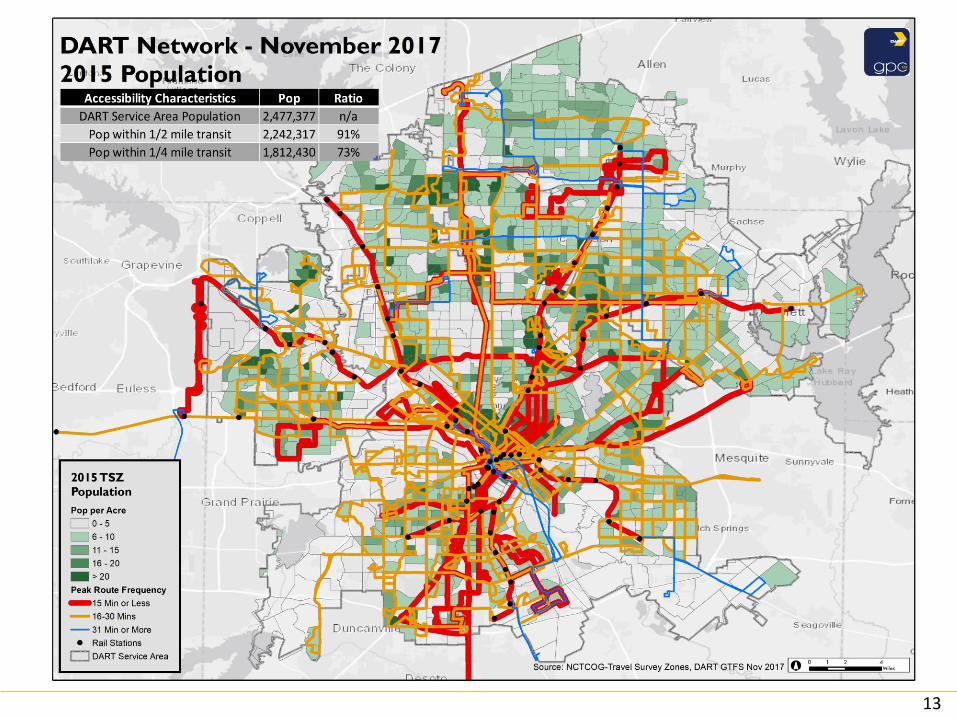
• While the UTA Study isn’t clear about the percentage of population with transit access based upon ¼ mile walk distance (report shows both 63% and 71% in different parts of the study), the access would increase to 73% or 76% if the DART On-Call services were included.
• Using a ½ mile walk distance, which is more traditional in the transit industry, the population served increases to 91%.
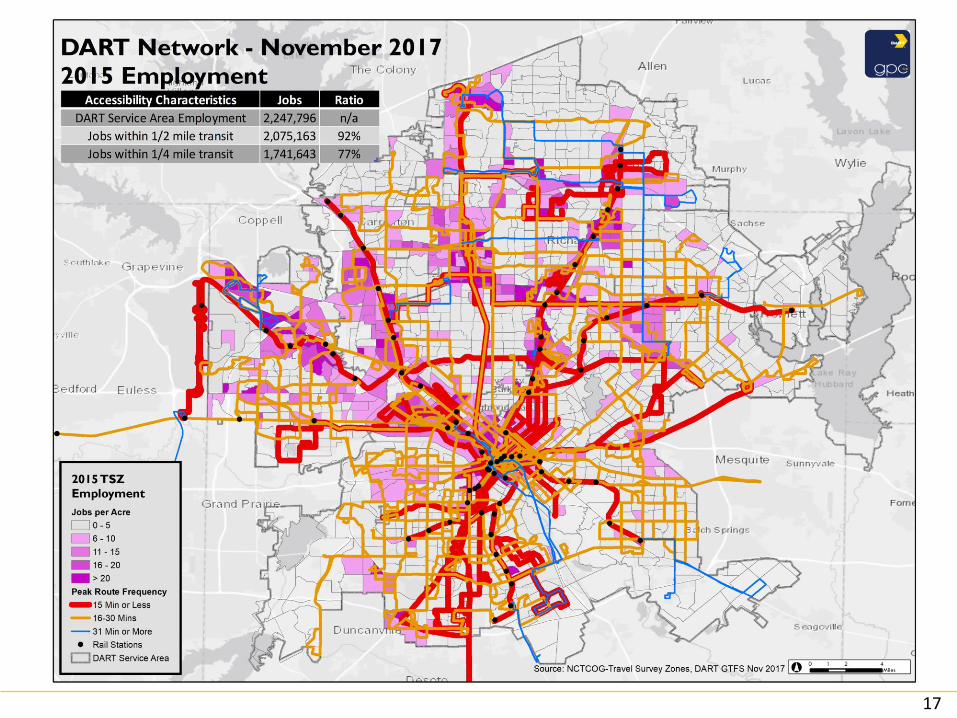
• DART’s analysis shows 77% of jobs with the DART Service Area are accessible by transit (including On-Call) using a 1/4 mile walk distance and 92% of jobs with the DART Service Area are accessible within ½ mile from transit.
• UTA Study validates the very low employment density in South Dallas.
Executive Summary Continued
4
• DART’s service standards (and many US transit systems) define 15-minute bus and rail service as high frequency. UTA’s definitions were based upon an academic study of the highest density US, European and Asian systems which classify 15-minute service as medium frequency.
• UTA’s Study provides little to no discussion on land use responsibilities, transportation planning activities to leverage transit investments, or City infrastructure investments needed to support efficient transit.
• DART provides access to hundreds of thousands of jobs within 60-minute travel time. The average automobile travel time within the City of Dallas is nearly 30-minutes.
• UTA Study does not reference DART’s Innovative Services approaches as solutions to move people to and from jobs including On-Call and Mobility on Demand services.
Executive Summary Continued

5
• 2018 implementation of an account based fare structure designed to allow low income persons to obtain monthly fare discounts when paying daily
• Midday and weekend bus frequency improvements scheduled March 2018
• 2018 Expansion of On-Call (Go Link) service in Southern Sector
• 2018 Pilot Testing of Shared Mobility Services in Plano and Southern Sector without fixed route options
• 2018 Pilot testing of new generation of carpooling APP which will assist in expanding mobility for DART residents to jobs centers beyond the DART Service Area
• 2019 Purchase of 41 buses to expand DART’s high frequency bus network
• Commitment of over $13 million to improve bus service on weekends, midday, evenings and peak periods to increase transit access
Programmed Improvements to DART Service Responsive to the UTA Study Assessment
6
UTA Study Equity Factors
• Transportation and transit affordability
• Location efficiency in Dallas and the DART Service Area
• Definition of transit coverage based upon ¼ mile walk buffer
• Definition of frequent transit service
• Job access by using 45 minute travel time criterion
7
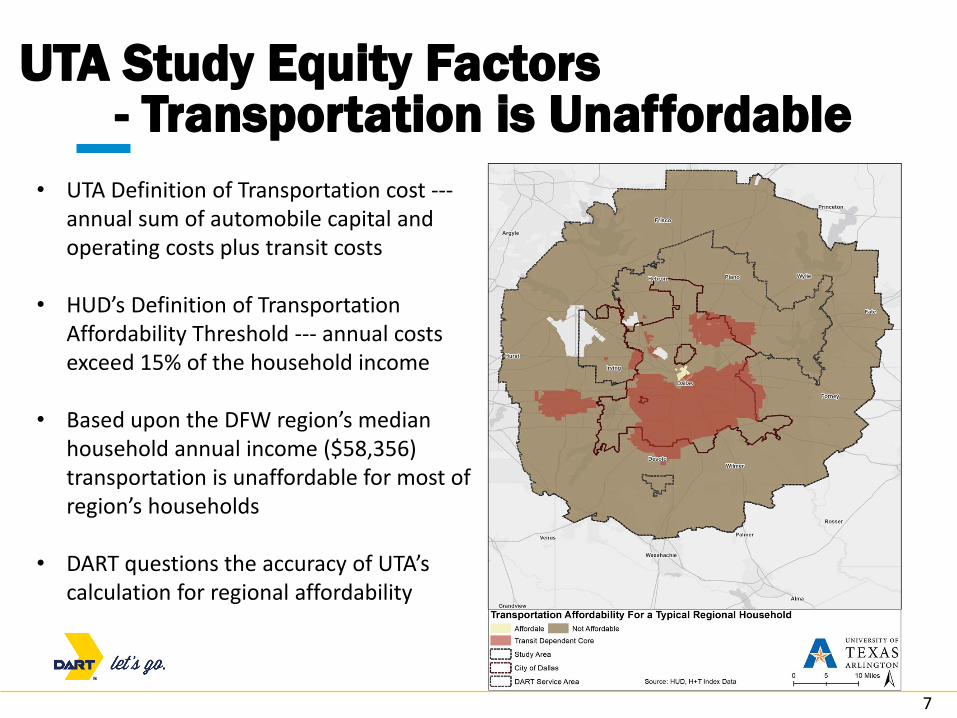
UTA Study Equity Factors- Transportation is Unaffordable
• UTA Definition of Transportation cost ---annual sum of automobile capital and operating costs plus transit costs
• HUD’s Definition of Transportation Affordability Threshold --- annual costs exceed 15% of the household income
• Based upon the DFW region’s median household annual income ($58,356) transportation is unaffordable for most of region’s households
• DART questions the accuracy of UTA’s calculation for regional affordability
8
• UTA’s study stated that DART fare affordability is not the major barrier to transit use in Dallas even for low income persons
– A low-income household will spend on average about 10% or less of its income using the local transit fare day pass only
– A low-income household will spend approximately 6% of its income on transit fare using the monthly pass exclusively
– A low-income household will spend less than 3% of its income if eligible for the reduced fare program
– Low income persons using the regional fare exclusively will still spend less that the transportation affordability threshold
• UTA researchers determined that DART’s fare structure and proposed fare structure do not exceed the HUD transportation affordability threshold
UTA Study Equity Factors- Transit is affordable in Dallas
9
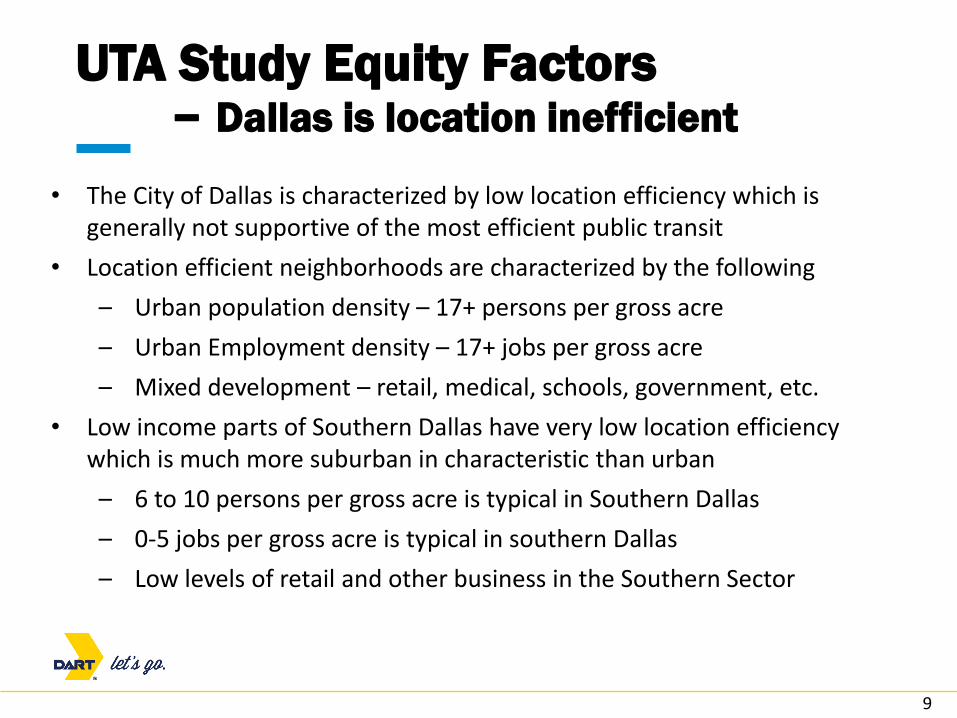
• The City of Dallas is characterized by low location efficiency which is generally not supportive of the most efficient public transit
• Location efficient neighborhoods are characterized by the following
– Urban population density – 17+ persons per gross acre
– Urban Employment density – 17+ jobs per gross acre
– Mixed development – retail, medical, schools, government, etc.
• Low income parts of Southern Dallas have very low location efficiency which is much more suburban in characteristic than urban
– 6 to 10 persons per gross acre is typical in Southern Dallas
– 0-5 jobs per gross acre is typical in southern Dallas
– Low levels of retail and other business in the Southern Sector
UTA Study Equity Factors– Dallas is location inefficient
10
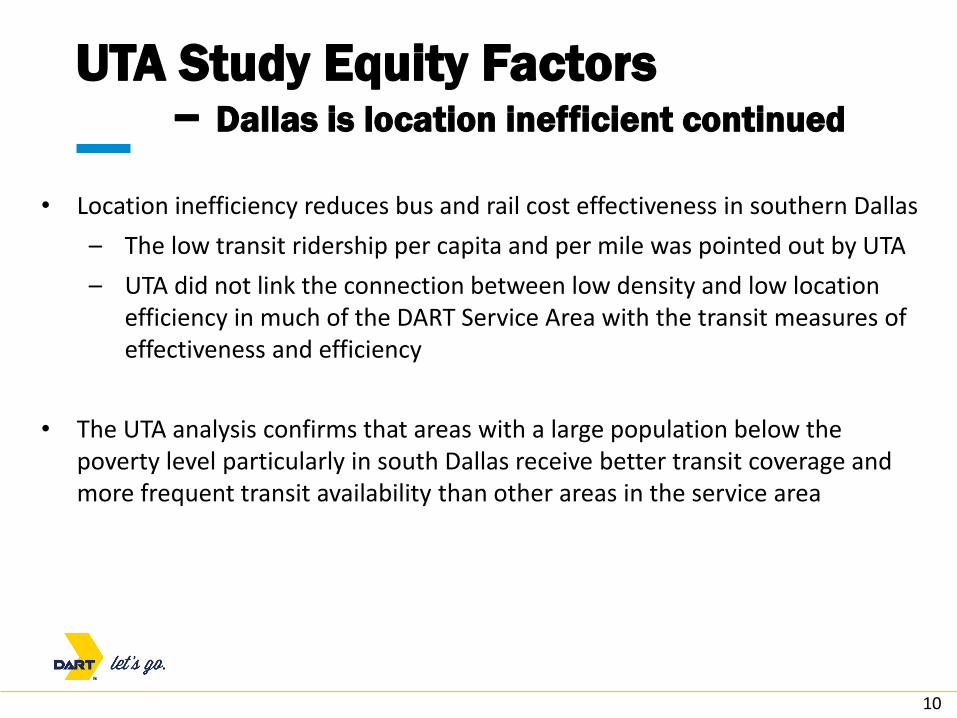
• Location inefficiency reduces bus and rail cost effectiveness in southern Dallas
– The low transit ridership per capita and per mile was pointed out by UTA
– UTA did not link the connection between low density and low location efficiency in much of the DART Service Area with the transit measures of effectiveness and efficiency
• The UTA analysis confirms that areas with a large population below the poverty level particularly in south Dallas receive better transit coverage and more frequent transit availability than other areas in the service area
UTA Study Equity Factors– Dallas is location inefficient continued
11
12
13

14
15
• UTA Study states that 63% of the population of the City of Dallas is covered by transit if they are within ¼ mile from a bus stop
• DART uses a ½ mile transit walk distance because it is a more accurate reflection of transit usage by DART riders
– DART origin destination surveys verify that many transit riders frequently walk up to ½ mile to a bus stop
– UTA did not reflect transit access provided by DART On-Call services
– 91% of population is within ½ mile of a transit stop
– 92% of jobs are within ½ mile of a transit stop
UTA Study Equity Factors- Transit Coverage

16
17
18
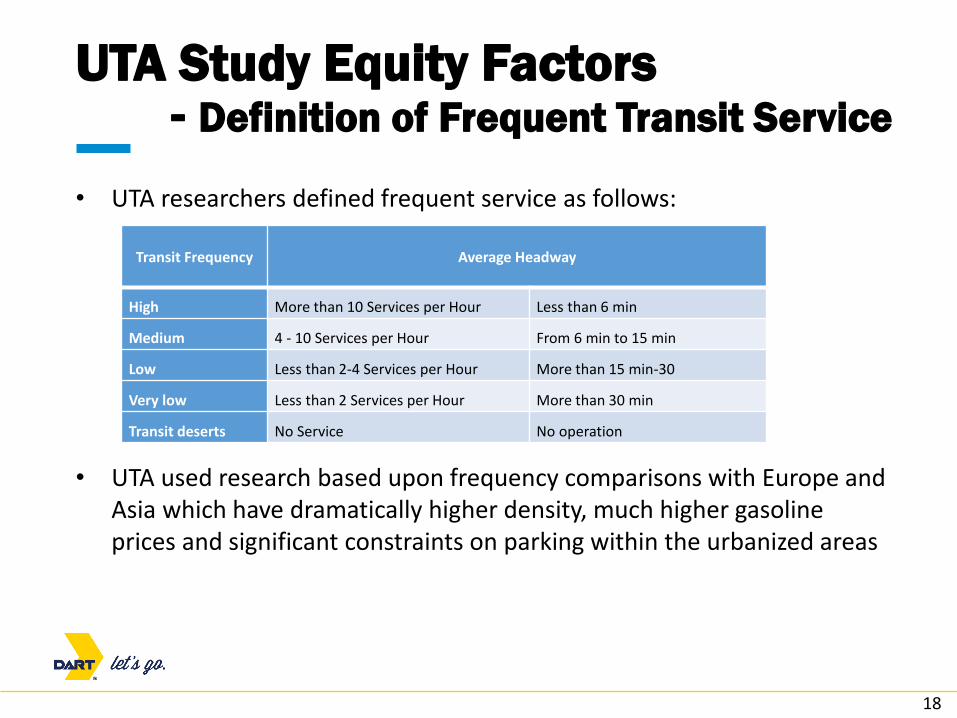
• UTA researchers defined frequent service as follows:
• UTA used research based upon frequency comparisons with Europe and Asia which have dramatically higher density, much higher gasoline prices and significant constraints on parking within the urbanized areas
UTA Study Equity Factors- Definition of Frequent Transit Service
Transit Frequency Average Headway
High More than 10 Services per Hour Less than 6 min
Medium 4 - 10 Services per Hour From 6 min to 15 min
Low Less than 2-4 Services per Hour More than 15 min-30
Very low Less than 2 Services per Hour More than 30 min
Transit deserts No Service No operation
19
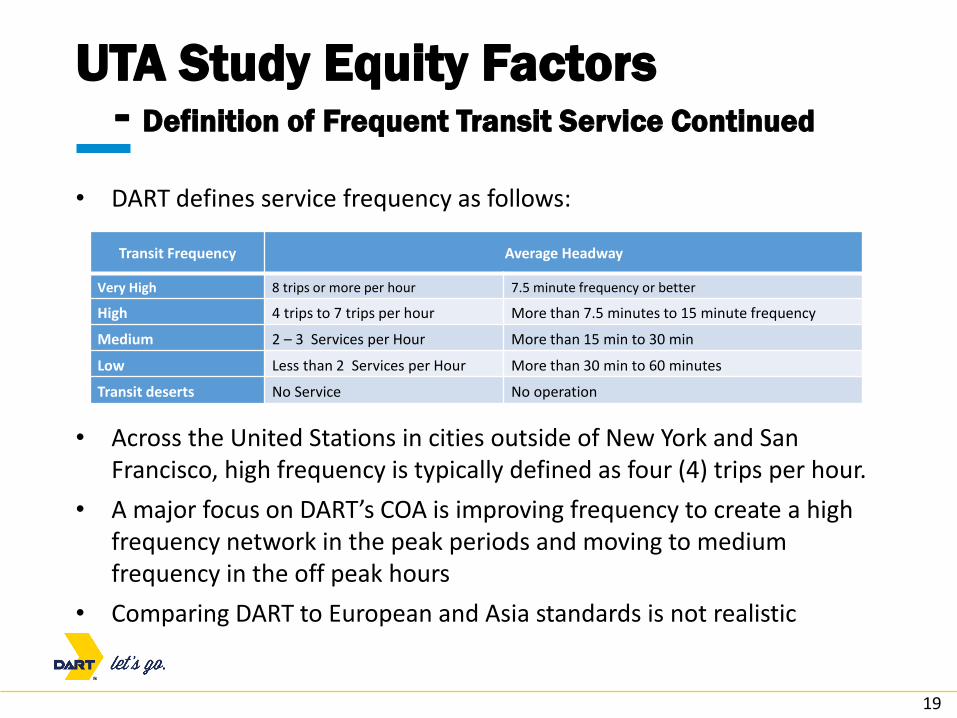
• DART defines service frequency as follows:
• Across the United Stations in cities outside of New York and San Francisco, high frequency is typically defined as four (4) trips per hour.
• A major focus on DART’s COA is improving frequency to create a high frequency network in the peak periods and moving to medium frequency in the off peak hours
• Comparing DART to European and Asia standards is not realistic
UTA Study Equity Factors- Definition of Frequent Transit Service Continued
Transit Frequency Average Headway
Very High 8 trips or more per hour 7.5 minute frequency or better
High 4 trips to 7 trips per hour More than 7.5 minutes to 15 minute frequency
Medium 2 – 3 Services per Hour More than 15 min to 30 min
Low Less than 2 Services per Hour More than 30 min to 60 minutes
Transit deserts No Service No operation
20
• UTA researchers state that on average about 30% of the population in Dallas and 41% of the population in the transit dependent core have access to less than 1% of regional jobs in a 45 minute transit commute time.
• Compared to other aspects of DART, the lack of adequate access to jobs by transit appears to be the greatest barrier for considering transit as the major mode of transportation for all and particularly for the low income, transit dependent population.
UTA Study Equity Factors- Job Access by Transit by Travel Time
21
• DART believes that measuring transit access to regional jobs where over ½ of the population in the region measured has no public transit is an inappropriate measure of DART performance
• DART believes that the 45 minute transit commute time used as the UTA standard of reasonable travel time access by transit is unrealistic considering the 700 square mile transit district where the average car driver’s commute is 28 minutes
• DART measures its transit network effectiveness in 15 minute increments ranging from 30 minutes, 45 minutes, 60 minutes, 75 minutes and 90 minutes
UTA Study Equity Factors- Job Access by Transit by Travel Time
22
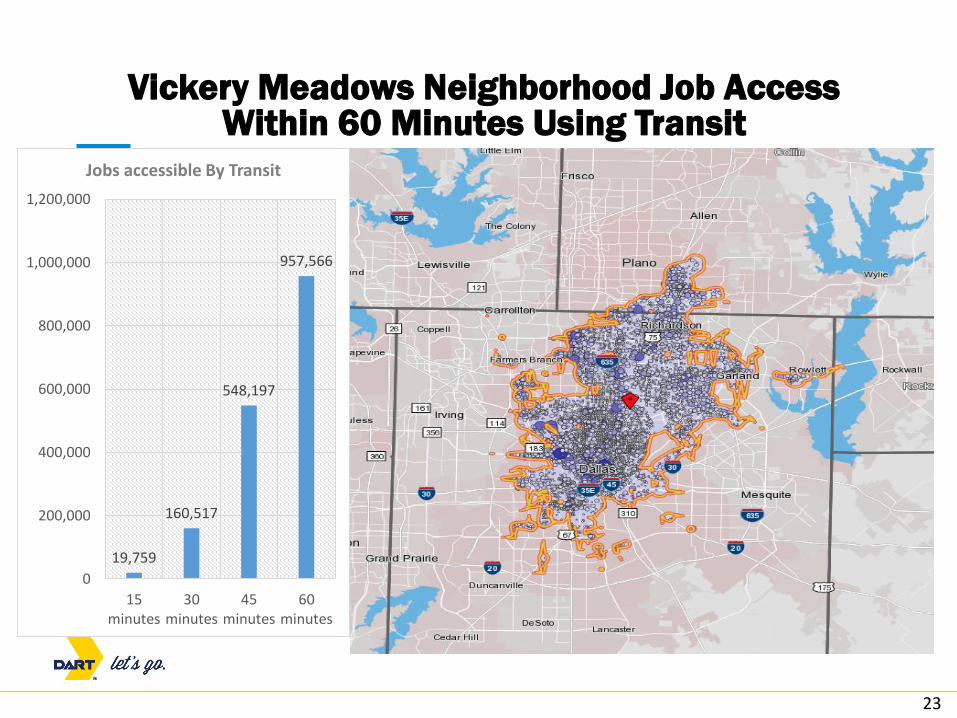
• Vickery Meadows Area -- Immigrant area east of Park Lane Station
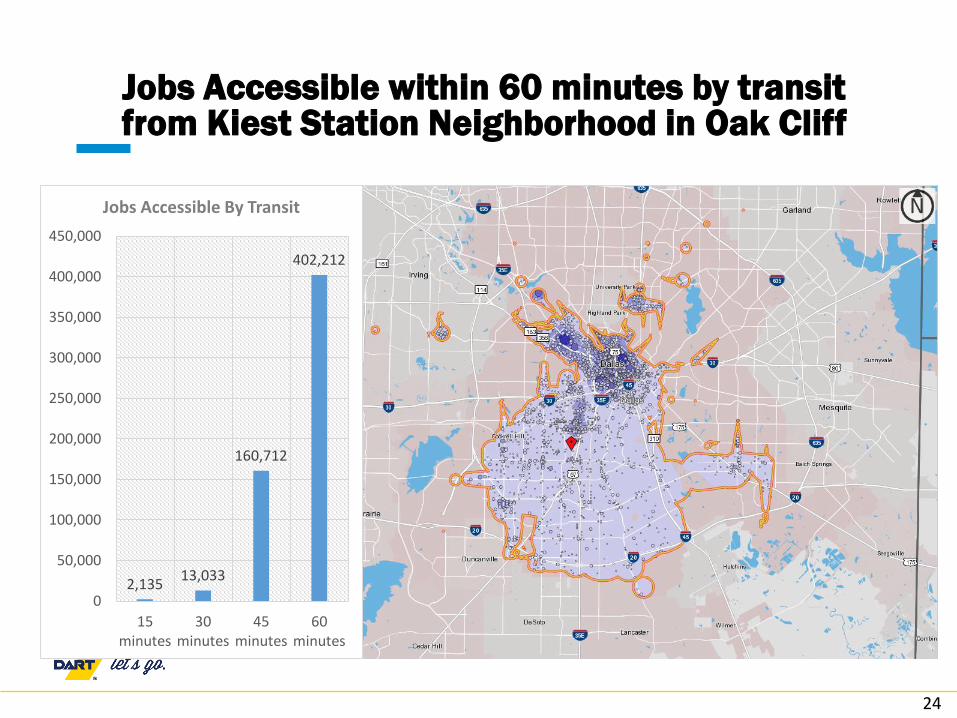
• Kiest Station Area --- In South Oak Cliff off the Blue Line
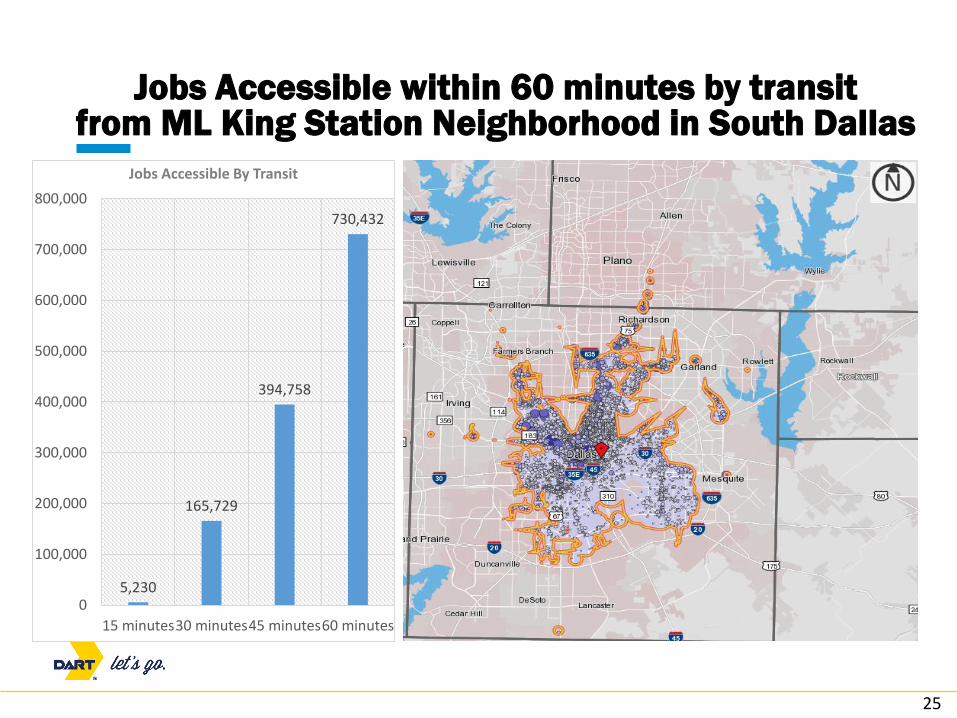
• ML King Station Area --- In South Dallas near Fair Park
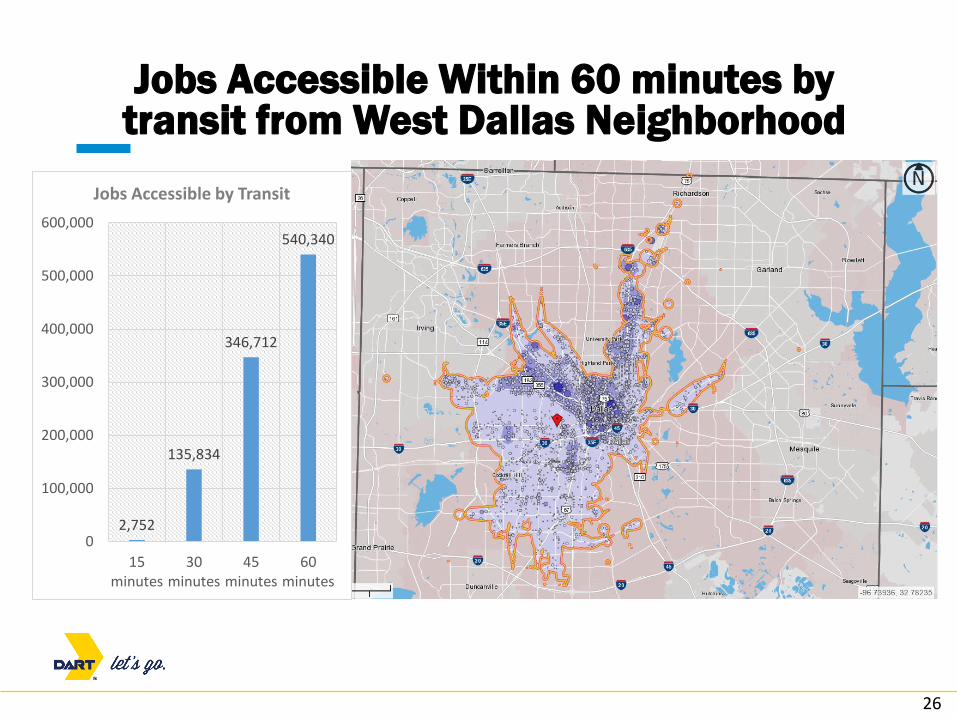
• West Dallas Area --- West of Downtown around Singleton and Hampton
• LBJ Skillman Station Area --- near I-635 and Audelia
• Downtown Dallas --- From Downtown Dallas
Six Dallas Low Income Areas and Downtown Dallas -- Access to Jobs By Transit
23
Vickery Meadows Neighborhood Job Access Within 60 Minutes Using Transit
19,759
160,517
548,197
957,566
0
200,000
400,000
600,000
800,000
1,000,000
1,200,000
15minutes
30minutes
45minutes
60minutes
Jobs accessible By Transit
24
Jobs Accessible within 60 minutes by transitfrom Kiest Station Neighborhood in Oak Cliff
2,13513,033
160,712
402,212
0
50,000
100,000
150,000
200,000
250,000
300,000
350,000
400,000
450,000
15minutes
30minutes
45minutes
60minutes
Jobs Accessible By Transit
25
Jobs Accessible within 60 minutes by transit from ML King Station Neighborhood in South Dallas
5,230
165,729
394,758
730,432
0
100,000
200,000
300,000
400,000
500,000
600,000
700,000
800,000
15 minutes30 minutes45 minutes60 minutes
Jobs Accessible By Transit
26
Jobs Accessible Within 60 minutes by transit from West Dallas Neighborhood
2,752
135,834
346,712
540,340
0
100,000
200,000
300,000
400,000
500,000
600,000
15minutes
30minutes
45minutes
60minutes
Jobs Accessible by Transit

27
Jobs Accessible within 60 minutes by transit from LBJ-Skillman Station
Neighborhood
5,500
70,065
325,561
560,570
0
100,000
200,000
300,000
400,000
500,000
600,000
15Minutes
30Minutes
45Minutes
60Minutes
Jobs Accessible By Transit
28
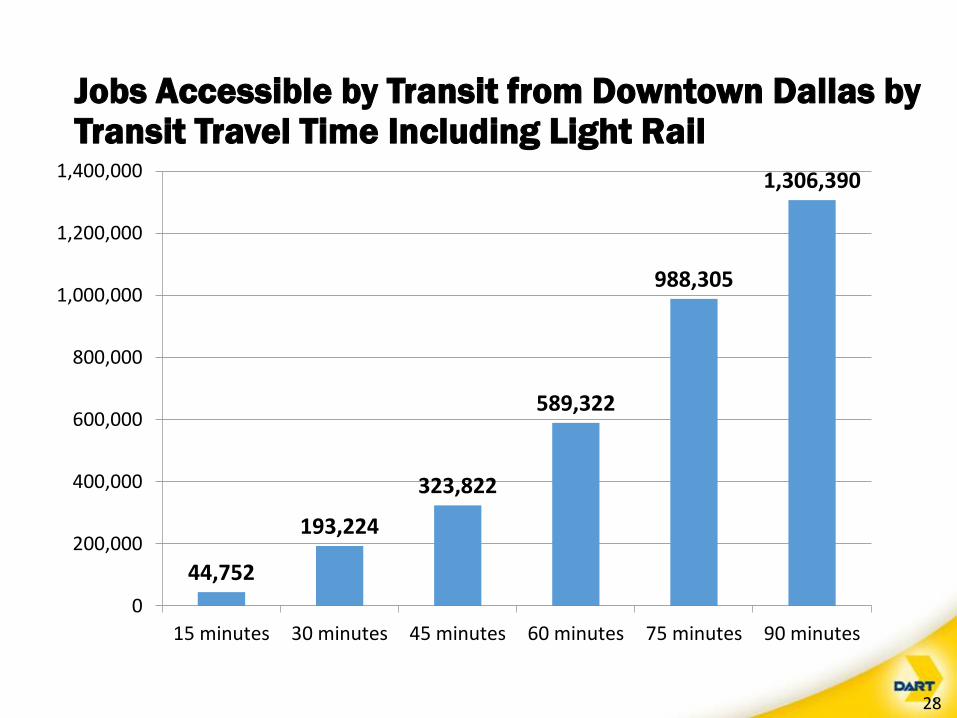
Jobs Accessible by Transit from Downtown Dallas by Transit Travel Time Including Light Rail
44,752
193,224
323,822
589,322
988,305
1,306,390
0
200,000
400,000
600,000
800,000
1,000,000
1,200,000
1,400,000
15 minutes 30 minutes 45 minutes 60 minutes 75 minutes 90 minutes
29
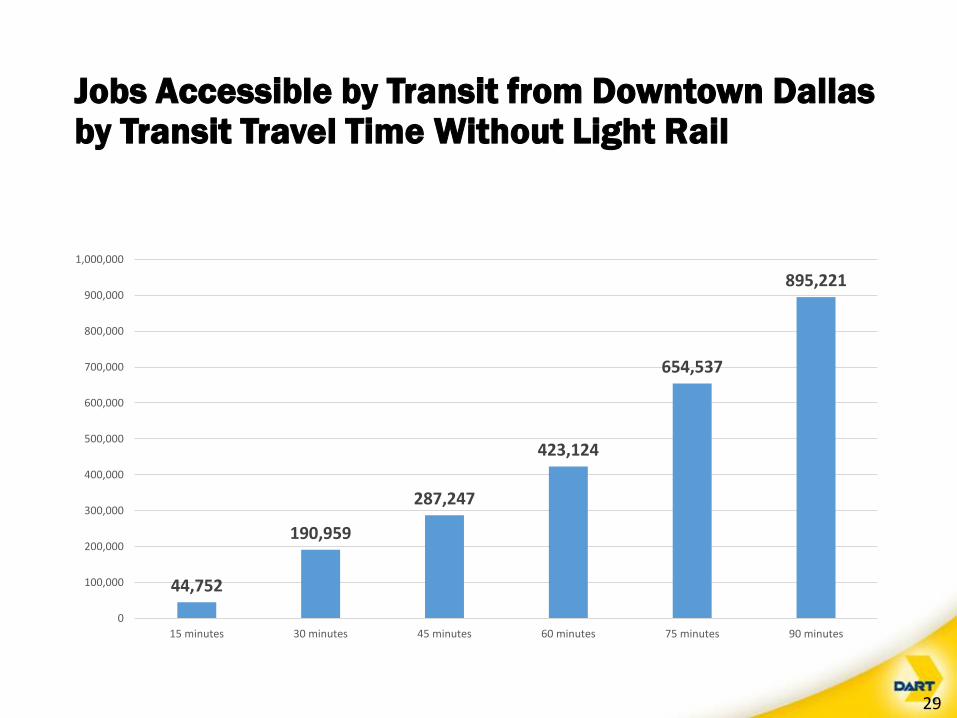
Jobs Accessible by Transit from Downtown Dallas by Transit Travel Time Without Light Rail
44,752
190,959
287,247
423,124
654,537
895,221
0
100,000
200,000
300,000
400,000
500,000
600,000
700,000
800,000
900,000
1,000,000
15 minutes 30 minutes 45 minutes 60 minutes 75 minutes 90 minutes
30
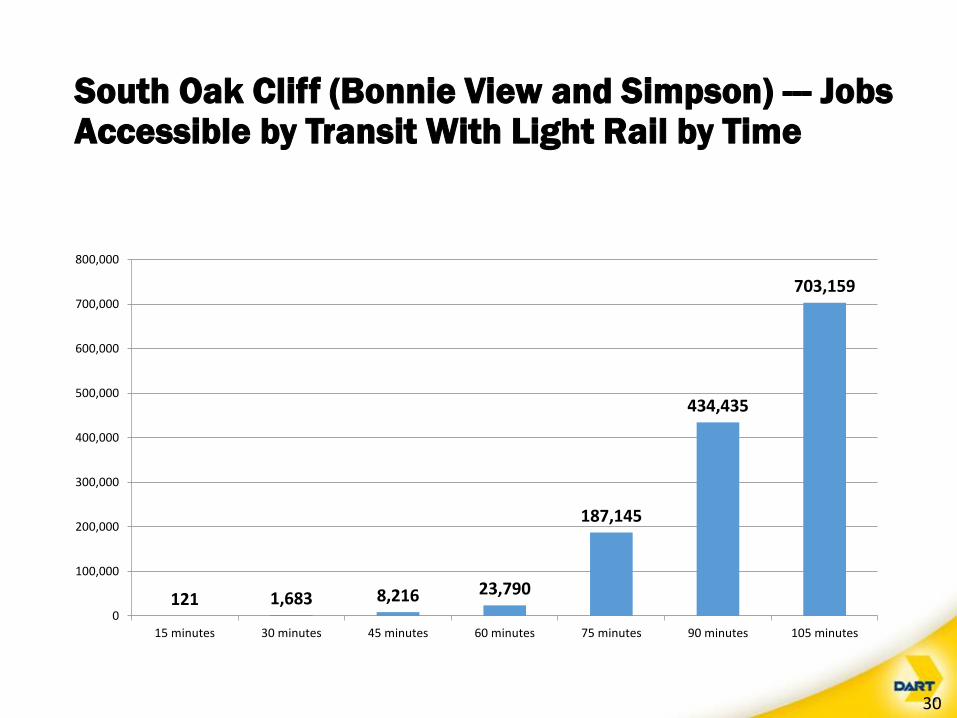
South Oak Cliff (Bonnie View and Simpson) --- Jobs Accessible by Transit With Light Rail by Time
121 1,683 8,216 23,790
187,145
434,435
703,159
0
100,000
200,000
300,000
400,000
500,000
600,000
700,000
800,000
15 minutes 30 minutes 45 minutes 60 minutes 75 minutes 90 minutes 105 minutes
31
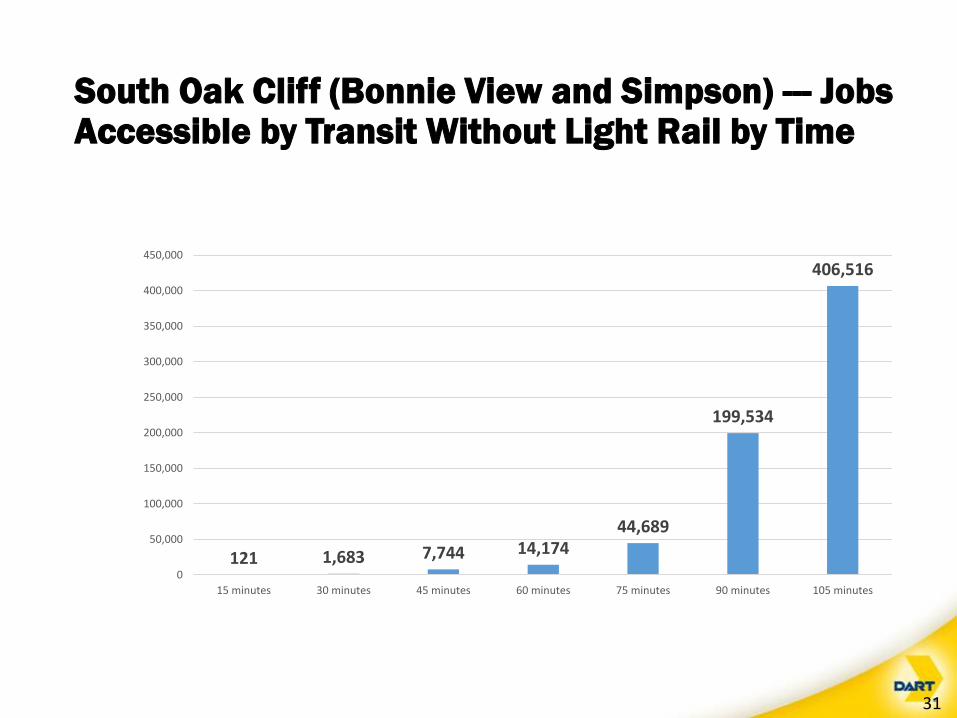
South Oak Cliff (Bonnie View and Simpson) --- Jobs Accessible by Transit Without Light Rail by Time
121 1,683 7,744 14,17444,689
199,534
406,516
0
50,000
100,000
150,000
200,000
250,000
300,000
350,000
400,000
450,000
15 minutes 30 minutes 45 minutes 60 minutes 75 minutes 90 minutes 105 minutes
32
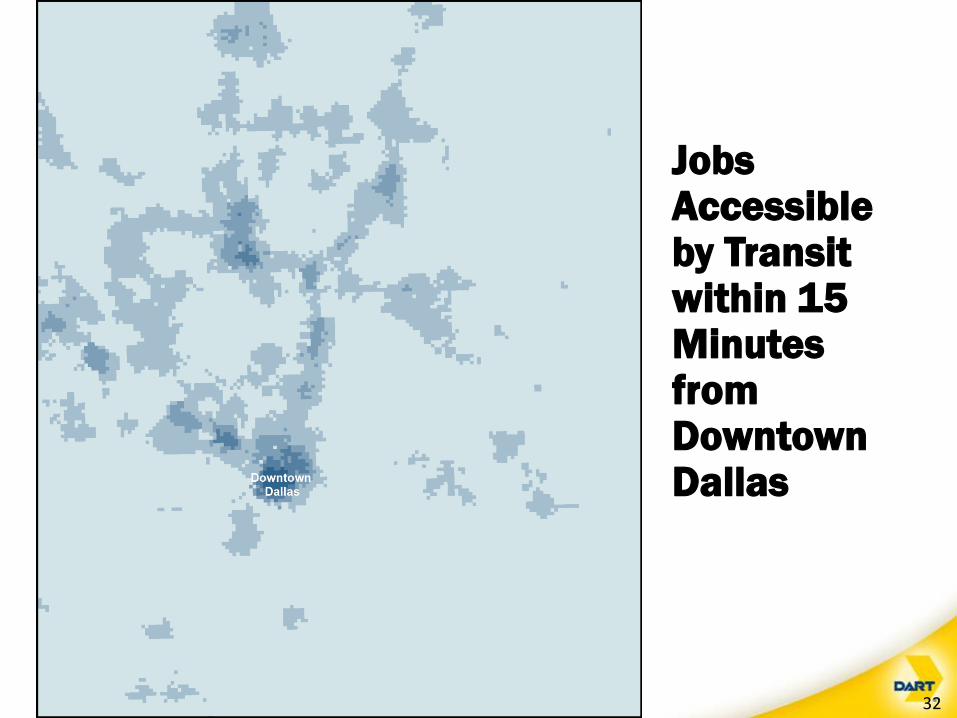
Jobs Accessible by Transit within 15 Minutes from Downtown Dallas
33
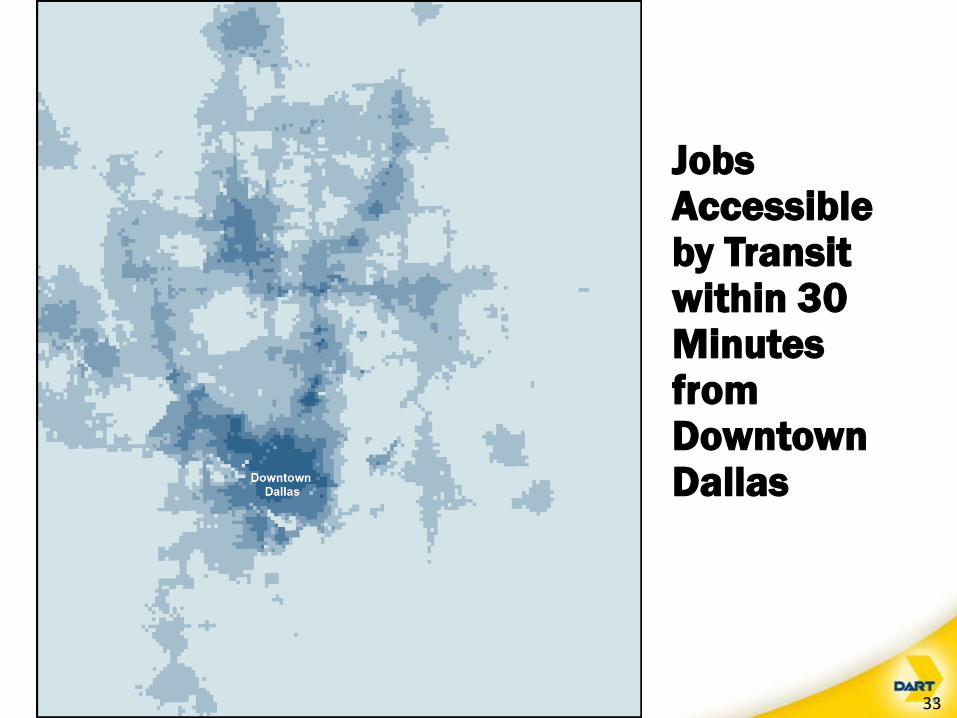
Jobs Accessible by Transit within 30 Minutes from Downtown Dallas
34
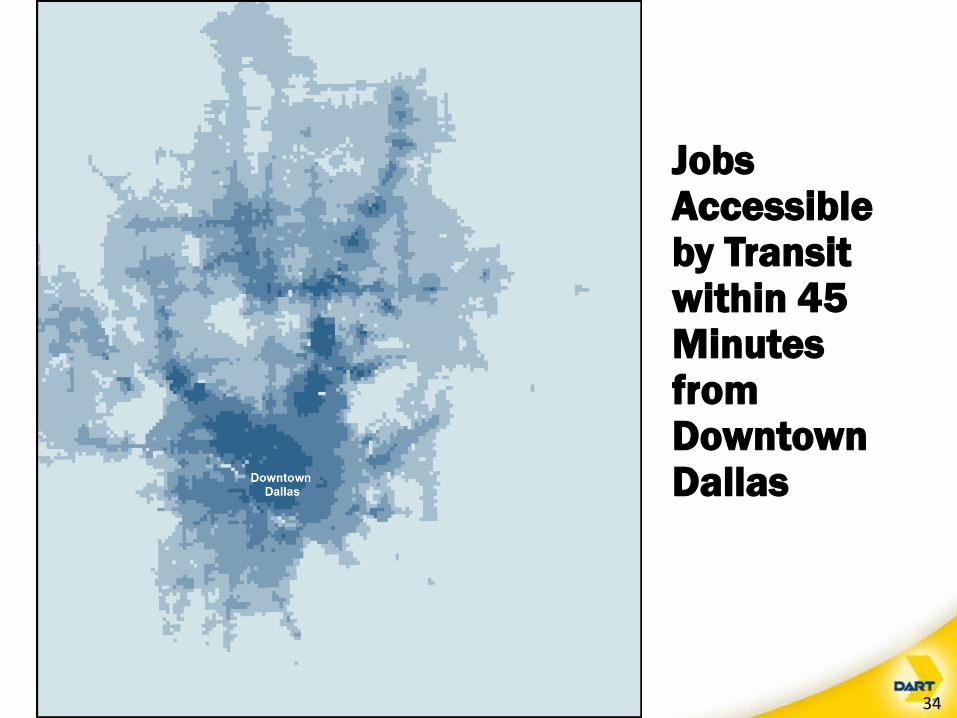
Jobs Accessible by Transit within 45 Minutes from Downtown Dallas
35
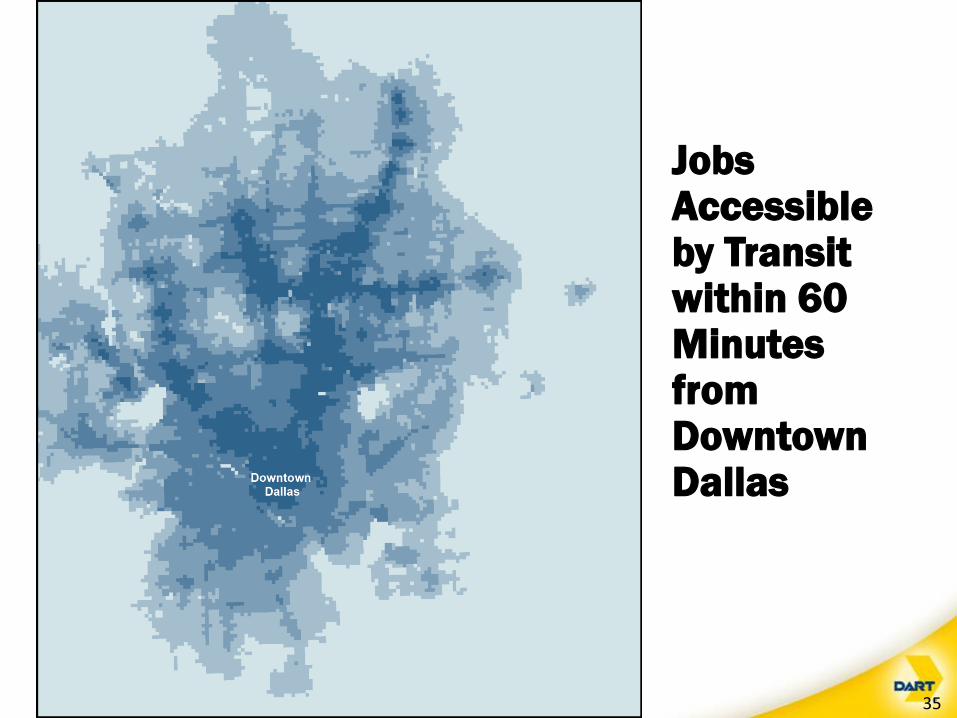
Jobs Accessible by Transit within 60 Minutes from Downtown Dallas
36
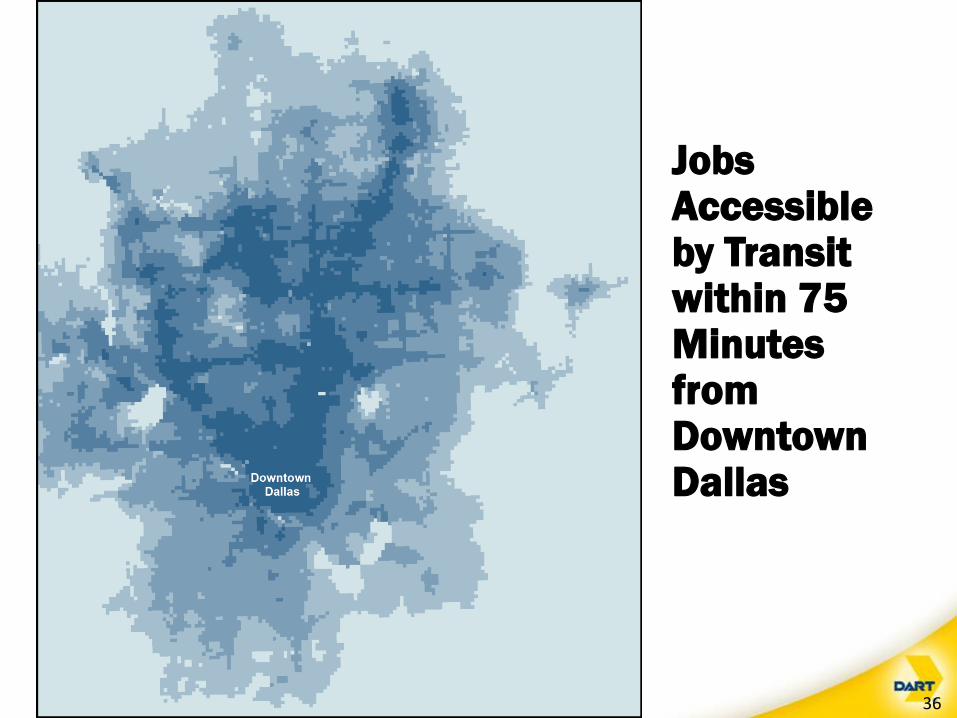
Jobs Accessible by Transit within 75 Minutes from Downtown Dallas
37
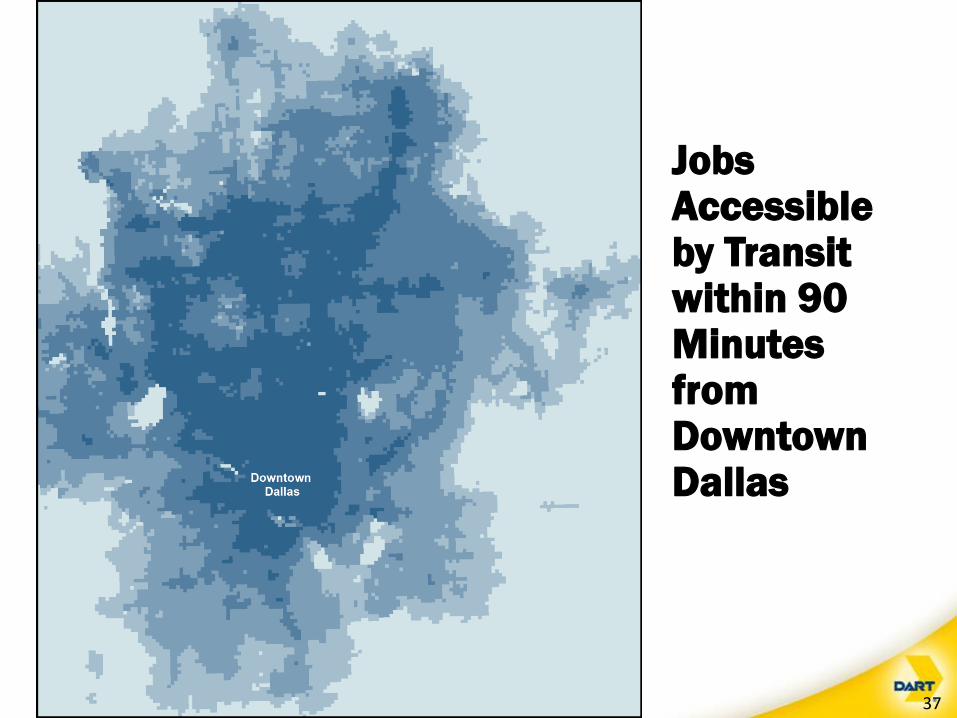
Jobs Accessible by Transit within 90 Minutes from Downtown Dallas
38
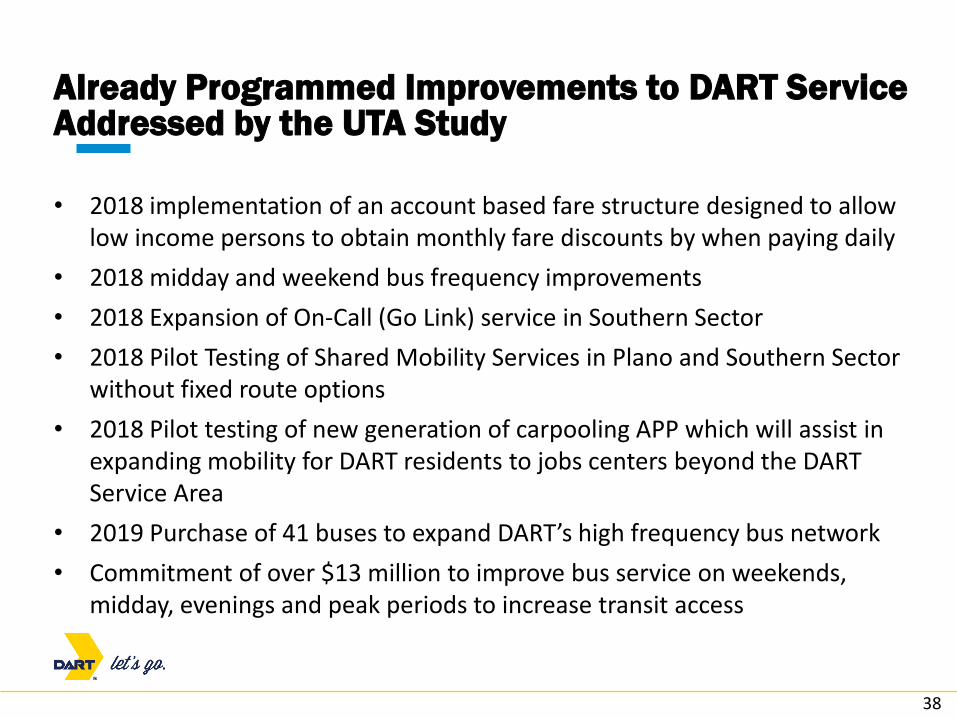
• 2018 implementation of an account based fare structure designed to allow low income persons to obtain monthly fare discounts by when paying daily
• 2018 midday and weekend bus frequency improvements
• 2018 Expansion of On-Call (Go Link) service in Southern Sector
• 2018 Pilot Testing of Shared Mobility Services in Plano and Southern Sector without fixed route options
• 2018 Pilot testing of new generation of carpooling APP which will assist in expanding mobility for DART residents to jobs centers beyond the DART Service Area
• 2019 Purchase of 41 buses to expand DART’s high frequency bus network
• Commitment of over $13 million to improve bus service on weekends, midday, evenings and peak periods to increase transit access
Already Programmed Improvements to DART Service Addressed by the UTA Study
39