Embed Size (px)
Citation preview

V OLU ME 15, N UMBER 4
Comparison of Mosquito Larvae Consumption Between Least Chub and Gambusia
DECEMBER 2004 The Ichthyogram UTAH D IVIS ION OF WILDLIFE RESOURCES F ISHERIES EXPERIMENT STATION 1465 WEST 200 NO RTH LOGAN, UT 84321
Least Chub Iothchthys phlegethontis are native to the Bonneville Basin, Utah where it was once widespread in rivers, streams, creeks, springs, ponds, marshes and swamps (Sigler and Sigler 1996). Least chub are considered to be at risk of becoming extinct, and are currently classified as a ‘sensitive species’. One of the principal threats to their continued existence is the competition with non-native fish, especially the mosquitofish, Gambusia affinis (Wilson and Whiting 2003). The species has been introduced for mosquito control into many waters with little thought given to its impacts on native fauna. Given human health concerns for emerging pathogens such as West Nile virus, the need for mosquito control remains high. The objective of the current research effort was to determine if least chub would readily consume mosquito larvae. If so, least chub could be stocked in lieu of mosquitofish within its historical range for mosquito control. The research proposed was divided into two separate tests, one in which mosquito larvae were the only prey choice and one in which other prey items were included as prey choices. This report summarizes information generated in the first set of trials in which mosquito larvae were the only prey item. Methods Mosquito larvae were distributed to tanks with either 5 Gambusia, 5 least chub, or no fish (control) in each tank for each of six different trials. In the first three trials, fish received 24 h of acclimation, whereas in the second set of trials the fish received a week of acclimation in the tanks. New fish were used for each of the first three trials, but in the second set of trials, all fish from the first set of trials were reused. The fish were fed on a commercial flake feed diet (Tetramin Pro) prior to use in the tests. During the week-long acclimation period, fish were fed 100 mg of a tropical fish flake diet (Tetramin Pro) per tank per day in two different feedings. In addition, every other day about 10 mosquito larvae were also added to each tank to familiarize the fish with the prey. Prior to adding larvae for the trials, the tanks were scrutinized to insure that no larvae were present from feeding during the acclimation phase. Three plastic circular tanks were used for each treatment, for a total of 9 tanks that were held within a larger circular tank. The larger tank was supplied with water to maintain the temperature around the smaller tanks. The individual tanks were filled with hatchery well water, but no inflow was provided to avoid flushing out any larvae. Temperatures ranged from 15 to 18˚C during the first 3 trials and from 14 to 17˚C during the last 3 trials. Supplemental oxygenation was provided via airstones in each tank. Mean length of the fish within a tank ranged from 43.0 to 48.6 mm for least chub and from 34.4 to 43.4 mm for mosquitofish. Mean weight ranged from 0.9 to 1.3 g/fish for least chub and from 0.5 to 1.3 g/fish for mosquitofish.
Bug Zappers for Aquaculture
4
Centrocestus formosanus 6-9
Farewell to Patrick 9
Coldwater to Stimulate June sucker Egg
10
INS IDE THIS ISSUE :

PAGE 2 VOLUME 15 , NUMBER 4
In the first three trials, mosquito larvae were obtained commercially via Aquatic Ecosystem Inc. (Apopka, FL). Mosquito larvae were already changing to pupae during the study, and since insufficient larvae were shipped for the tests, we used both larvae and pupae. The pupae and larvae were distributed equally to each tank to avoid any bias due to the form of the prey. Densities of larvae and pupae varied with each trial (Table 1). In the second series of trials, mosquito eggs were obtained from Carolina Biological Supply (Burlington, NC) and hatched on station. The larvae were at least in the 3rd instar stage of development before use in the trials. Larval densities were 30, 42, and 70 per tank for the three trials. In all six trials, surviving larvae were counted after 24 h in the tanks.
Statistical Analysis One-way ANOVA was used to compare the percentage of mosquito larvae consumed among the two species and controls separately for each trial. The least-significant difference test was used for post-hoc mean comparisons. The same tests were used to compare differences among trials within a treatment and acclimation time. Percentages were arc-sine transformed prior to use in the analyses. Least squares linear regression analysis was used to compare the percentage consumed with the number of mosquito larvae fed. A significance level of 0.05 was used for each test. SPSS version 7.0 (SPSS Inc. 1996) was used for all analyses. Results and Discussion Mosquitofish consumed significantly more mosquito larvae than least chub in two trials within each of the tests (Table 1). There was no significant difference between the two species in pupae consumption
(Continued on page 3)
Acclimation Species
Number of larvae per tank
Number of pupae per tank
24 h consumption (%)
Range in consumption (%)
Pupae recovered (%)
24 h control
8 11 18
6 11 5
2.4 0.0 5.8
0.0- 7.1 0.0- 0.0 0.0-13.0
88.9 80.0 90.9
Least chub 8 11 18
6 11 5
59.5* 95.4 36.2*
21.4-85.7 86.4-95.4 17.4-47.8
38.9 60.0 9.1
Gambusia 8 11 18
6 11 5
92.8 100.0 84.1
85.7-100.0 100.0-100.0 56.5-100.0
16.7 6.7 0.0
1 week control
30 42 70
1.1 0.0 2.8
0.0-3.3 0.0-0.0 0.0-4.3
Least chub 30 42 70
63.3* 67.5 72.4*
40.0- 76.7 2.4-100.0 58.6- 92.9
Gambusia 30 42 70
100.0 100.0 99.5
100.0-100.0 100.0-100.0 98.6-100.0
Table 1. Mosquito larvae and pupae consumption (mean and range, n = 3) by least chub or Gambusia during a 24 h period after fish were acclimated to the tanks for either 24 h or 1 week. Data for controls in which no fish were added is also shown. Statistical differences between the two species in consumption rates for a given trial are indicated by an asterisk.

rates when trials were analyzed separately (P > 0.080). However, if data for the three trials with pupae were combined, mosquitofish consumed significantly more pupae (P = 0.041). The fish consumed pupae as readily as the larvae, despite the mosquito larvae being more animated. There was a concern in the first test that perhaps the least chub were not consuming what they would naturally, due to the residual stress from transfer and handling. The least chub were typically congregated at the bottom of the tank, whereas Gambusia were more commonly found higher in the water column. Although not tested directly, longer acclimation time did not appear to alter this behavior. Observation of least chub in aquaria in other studies indicate that the habit of the species is to group near the bottom. This observation, as well as the data in this study, indicated that acclimation time did not influence the relative consumption rates of each species. A small percentage of larvae were not recovered in the control tanks, but all the fish tanks consumed significantly more larvae than were lost by the control tanks. Differences between trials for a given species and acclimation period were not significant except for least chub in the 24 h acclimation trials (P = 0.019). In that case, high consumption rates of the intermediate density (22 larvae) led to a significant difference that appeared to be unrelated to density. Overall then, larval density in the range tested did not significantly alter the percentage consumed. Pupae in the first test were as likely to be consumed as larvae, so there was no bias due to larval stage of development. With all trials combined, least squares linear regression analysis of each species between the percentage of larvae consumed and the number provided was not significant for least chub (P = 0.674, r = 0.11) or mosquitofish (P = 0.307, r = 0.26). This result was not surprising since most of the larvae fed were consumed and mosquito larvae densities never approached a level high enough to feed the fish to satiation. Mosquitofish have been reported to consume up to 0.25 to 1.06 g·g-1·d-1 (Chipps and Wahl 2004). In this study, mean dry weight of mosquito larvae was 114 to 117 ug/larvae and total dry weight fed was a maximum of 8.1 mg/tank or 1.6 mg/fish. This experiment indicated that least chub will consume mosquito larvae, though not to the extent that mosquitofish can. Further tests are needed to determine how readily least chub will consume mosquito larvae if other prey choices are present.
By Eric J. Wagner and Eric Billman Literature Cited Chipps, S.R., and D.H. Wahl. 2004. Development and evaluation of a western mosquitofish bioenergetics model.
Transactions of the American Fisheries Society 133:1150-1162. Sigler, W.F., and J.W. Sigler. 1996. Fishes of Utah: a natural history. University of Utah Press. SPSS Inc. (Statistical Package for Social Scientists) 1996. SPSS Base 7.0 for Windows user’s guide. SPSS Inc., Chicago,
IL. Wilson, K.W., and J.C. Whiting. 2002. Least chub Iotichthys phlegethontis monitoring summary, Central Region, 2002.
Utah Division of Wildlife Resources Pub. No. 03-08.
THE ICHTHYOGRAM PAGE 3

Bug zappers are commonly found in aquaculture equipment catalogues where they are advertised as a means of controlling insects and at the same, offering fish additional, “natural” feed. The bug zapper combines a fluorescent light, which attracts insects, with a rotating, wire string, similar to a weed-eater, which kills or wounds the insects. The dead or injured insect then falls into the water, where fish eat it. As far as we know, no controlled studies have been conducted to evaluate the ability of a bug zapper to contribute nutritionally to trout, and what subsequent effects this may have on fish performance and health. For this trial, eyed eggs of the Sand Creek strain were obtained from the J. Perry Egan State Fish Hatchery (Bicknell, Utah) hatched at the Fisheries Experiment Station. The test was conducted using outside raceways with three raceways having bug zappers positioned over them, and three control raceways without zappers. Approximately 6,300 fish were stocked into each test raceway when they were 11.2 g/fish (38.8 fish/lb). All raceways were started out being fed at the same ration level, and the ration was adjusted by raceway to match monthly growth. Fish weights were estimated by a monthly raceway inventory. Weight gain and feeding rate data were used to calculate feed conversion ratios, FCR = total grams fed/total grams weight gain, and specific growth rate, SGR = [(loge weightend study - loge weightbeginning) /(number of days)] ·100. Length and weight data recorded for individual fish were used for condition factor calculation; KTL = (weight in g/total length3 in mm)·105. Density indices were calculated as DI = weight/(volume · fish length). They ranged from 0.21 – 0.34, but were decreased whenever they neared 0.4 by adjusting the lower crowding screen in the raceway. Fish were fed a commercial trout formulation throughout the study (Silver Cup, Nelson and Sons, Inc., Murray, Utah). Theoretically, if the fish were obtaining sufficient quantities of insects, we would have anticipate higher growth rates, lower feed conversions, and better condition factors. At the conclusion of the study, ten fish per replicate raceway (30 fish per treatment), were euthanized and necropsies performed according to the Health Condition Profile (HCP) system. From the same fish, fin measurements were made on the dorsal, caudal, anal, pelvic, and pectoral fins. These measurements, along with fish length, were used to calculate relative fin index values (Kindschi 1987). This system was used to determine if fin erosion was similar or different between treatment and control fish. Goede’s fin erosion classification system (Goede 1991) was used to quantify the degree of past or actiove fin erosion. This system classifies fins by a numerical scale of 0-2, where 0 = no active erosion, 1 = mild active erosion, and 2 = severe active erosion. The condition of the fins was of interest, because hatchery-reared fish generally have fins, which are eroded to some degree. Previous research by Lellis and Barrows (1997; 2000) suggested that steelhead fed experimental diets, some of which were supplemented with chitin, exhibited better dorsal fin length compared to fish fed a commercial diet formulation. To determine the quantity of bugs a raceway might receive during any given night, a sampling protocol was carried out four times during the summer months of June-August. For the sampling, a 1.9 m x 1.4 m mesh net was suspended above the raceway, but below the zapper so that any injured or dead insects would be caught in the mesh netting. The nets were placed in the late afternoon, and the contents were removed the following morning. The contents were then dried in an oven at 103ْ C until a constant weight was obtained. The total dry-weight biomass was then determined. Subsequent to that, individual insects were keyed out to the family level. The growth rates for control and treatment fish were good throughout the trial. The control fish grew slightly better and their monthly inventory weight was higher than the controls (Table 1). This can be partially explained by discrepancy in the number of fish from one control raceway. When the fish were initially distributed to the test raceways, before the experiment began, they were counted out from one raceway to the others. The original estimate of the number of fish within that raceway was slightly low, so five of six raceways received similar numbers of fish, but the raceway from which the fish were counted ended up short-handed, and that raceway was
VOLUME 15 , NUMBER 4 PAGE 4
Bug-zappers for Aquaculture

THE ICHTHYOGRAM PAGE 5
a control. However, because that short-handed raceway of fish was thought to contain a complete complement of fish, it received a full ration of feed and subsequently grew better. When the final weights are compared, the zapper treatments averaged 84 g/fish, and the controls averaged 95 g/fish. When the one “heavy” control raceway (117 g/fish) is removed from the average, the remaining two averaged 89 g/fish. However the numbers are analyzed, there was no significant difference between the control and treatment fish, suggesting the bug zappers did not contribute to fish growth. Feed conversions were also not different and averaged 1.08 for the zapper group, and 0.96 for the controls. Total mortalities were also similar between the two groups with the control experiencing 73 total mortalities, and 82 for the zapper group. Table 1. Performance of fish reared in raceways containing bug zappers or raceways without (controls).
The fin index values were similar between both groups with no clear trend evident. The fin erosion scores ranked according to Goede’s HCP methodology were 1.4 for the controls, and 1.2 for the zapper fish. These differences were not significant. All other indices from the HCP were similar for the two groups, and within the ranges of normality. These results indicate that whatever supplemental nutrition the fish received from the zappers was of little consequence and did not affect hatchery performance, fin condition, and overall fish health. The lack of any discernable trend might be explained by the lack of the bug zappers to supply insects in a large enough quantity to actually influence fish growth. The largest quantity of insects collected, on a dry weight basis, was 2.96 g collected from the “a” replicate of the July sampling (Table 2). Considering that at the same time these sampling results were obtained, a given test raceway was being fed about 1,500 g/day, it becomes clear that the bug zappers were not supplementing the feed ration to an extent that could possibly increase growth. Although The Fisheries Experiment Station is located in proximity to wetlands, and this study was conducted during the height of “bug season”, evidently there simply weren’t enough insects around. So, while they may be appropriate for aquacultural use in portions of the world where insects abound, the bug zappers simply didn’t “fly” in Logan. Table 2. Total dry weight biomass collected from each duplicate net on given sampling date.
Literature Cited Kindschi, G.A. 1987. Method for quantifying degree of fin erosion. Progressive Fish-Culturist 49:314-315. Goede, R.W. 1991. Fish health/condition assessment procedures. Utah Division of Wildlife Resources, Fisheries
Experiment Station, Logan. Lellis, W.A., and F.T. Barrows. 1997. The effect of diet on dorsal fin erosion in steelhead trout Oncoryhnchus mykiss
(Walbaum). Aquaculture and Fisheries Management 22:343-350. Lellis, W.A., and F.T. Barrows. 2000. Effect of dietary ingredient substitution on dorsal fin erosion in steelhead. North
American Journal of Aquaculture 62:135-138. Ronney Arndt
April May June July August Fish weight Zapper 11.2 18.0 33.4 52.1 84.4
(g/fish) Control 11.2 18.3 33.7 54.9 95.1 FCR Zapper 0.66 1.13 0.79 1.74 1.06
Control 0.66 1.08 0.80 1.32 0.93
June 18th July 16 Aug 16
a b a b a b a b
Biomass 0.28 0.49 2.96 1.53 0.54 0.67 0.06 0.34
Aug 28
VOLUME 15 , NUMBER 4 PAGE 6
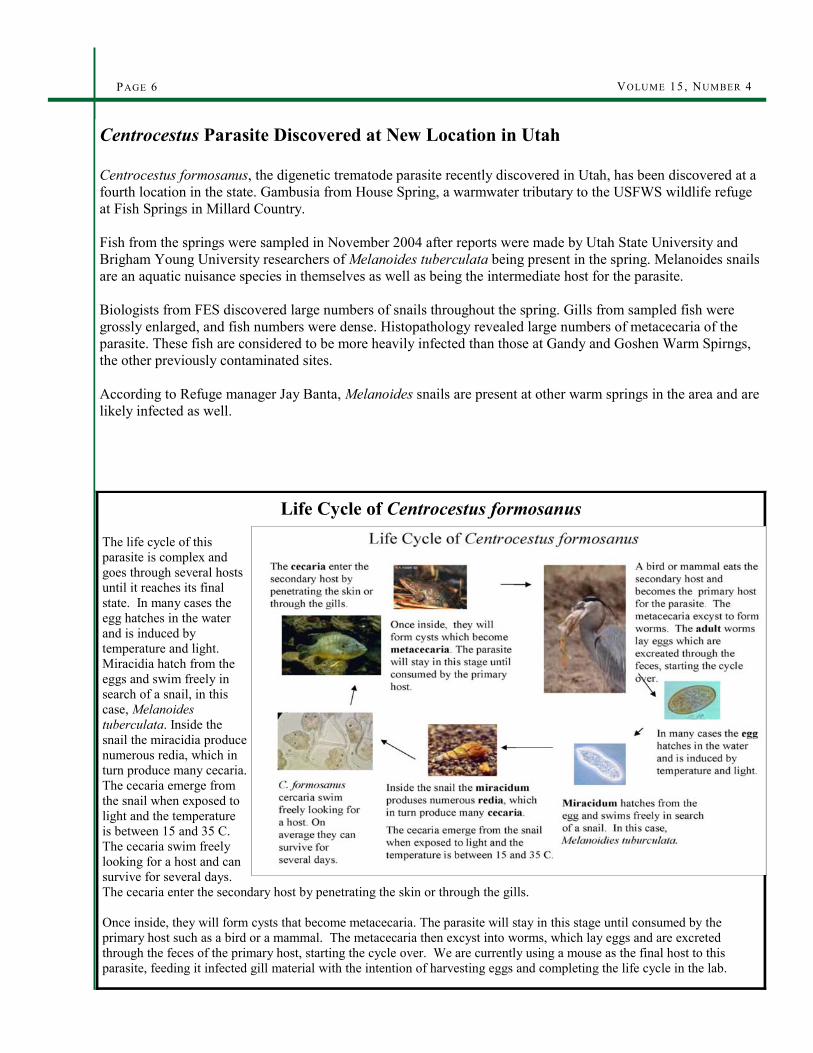
Life Cycle of Centrocestus formosanus The life cycle of this parasite is complex and goes through several hosts until it reaches its final state. In many cases the egg hatches in the water and is induced by temperature and light. Miracidia hatch from the eggs and swim freely in search of a snail, in this case, Melanoides tuberculata. Inside the snail the miracidia produce numerous redia, which in turn produce many cecaria. The cecaria emerge from the snail when exposed to light and the temperature is between 15 and 35 C. The cecaria swim freely looking for a host and can survive for several days. The cecaria enter the secondary host by penetrating the skin or through the gills. Once inside, they will form cysts that become metacecaria. The parasite will stay in this stage until consumed by the primary host such as a bird or a mammal. The metacecaria then excyst into worms, which lay eggs and are excreted through the feces of the primary host, starting the cycle over. We are currently using a mouse as the final host to this parasite, feeding it infected gill material with the intention of harvesting eggs and completing the life cycle in the lab.
Centrocestus Parasite Discovered at New Location in Utah Centrocestus formosanus, the digenetic trematode parasite recently discovered in Utah, has been discovered at a fourth location in the state. Gambusia from House Spring, a warmwater tributary to the USFWS wildlife refuge at Fish Springs in Millard Country. Fish from the springs were sampled in November 2004 after reports were made by Utah State University and Brigham Young University researchers of Melanoides tuberculata being present in the spring. Melanoides snails are an aquatic nuisance species in themselves as well as being the intermediate host for the parasite. Biologists from FES discovered large numbers of snails throughout the spring. Gills from sampled fish were grossly enlarged, and fish numbers were dense. Histopathology revealed large numbers of metacecaria of the parasite. These fish are considered to be more heavily infected than those at Gandy and Goshen Warm Spirngs, the other previously contaminated sites. According to Refuge manager Jay Banta, Melanoides snails are present at other warm springs in the area and are likely infected as well.

UV Treatment of Cercaria of Centrocestus formosanus An experiment evaluated UV light as a means of eradicating cercaria living in the water. To test this, we exposed approximately 21,000 freshly harvested cercaria directly to UV light using 4 different treatments 10, 100, 1,000, and 10,000 seconds. The mean UV irradiation per second was 28.34 mW/cm2 at 257 nm. The change in time increased the irradiation exposure on the cercaria to 283.4, 2,834, 28,340, and 283,400 mW/cm2, respectively. After the allotted amount of time, three 50 ml samples were taken from each treatment and stained with flourescein diacetate (FDA) and propidium iodide (PI) and then filtered using an 8 um Nuclepore membrane and screened. On average, 99% of the cercaria were alive in all the treatments except for the 10,000 second trial, where 0% of the cercaria were found alive (Figure 1). The parasite may have died due to a 14 °C rise in temperature during the 10,000 second duration. To test the temperature change we conducted one more trial using only a rise in temperature similar to the rise found in the UV light tube over a period of 10,000 (Figure 2). The cercaria were sampled and tested using the same method as above which showed 91% of them alive at the end of the treatment (Figure 1). Although cercaria die at an irradiation between 28,340 and 283,400 mW/cm2, even the lowest rate of 28,340 is orders of magnitude higher than some research has suggested reliable to kill several species of parasites. Trichomonas vaginalis has 99% mortality at a dose of 401.7 mW/cm2, while Schistosoma mansoni cercaria attenuates with a dose of 18mW/cm2. Using the small 25-wattage lamp we conducted the experiment with and assuming a dose of 283,400 would be necessary to kill C. formosanus, it would take 7,857 years or 2,872,320 lamps to treat one days worth of water at 4 cfs in a hatchery system. Obviously, this is unreasonable. Larger lamps with higher wattage are available and may cut the number of lamps and/or time down dramatically, possibly making UV a feasible treatment to eradicate C. formosanus. Recent studies using FDA as a vital stain on M cerebralis have indicated it may be a conservative indicator of survival. The green stain is taken up by TAMs that have been dead for only a short period of time. Thus, UV treatments may actually be successful at killing cercaria at a lower dose than mentioned above. Recent studies using FDA as a vital stain on M cerebralis have indicated it may be a conservative indicator of survival. The green stain is taken up by TAMs that have been dead for only a short period of time. Thus, UV treatments may actually be successful at killing cercaria at a lower dose than mentioned above. Mellisa Harvey
VOLUME 15 , NUMBER 4 PAGE 7
Figure 1. Three aliquots, 50 mls each, from all treatments were scanned and the number of alive and dead cercaria counted. With the exception of the water bath only treat-ment, each treatment was exposed UV light for the indi-cated amount of time in seconds.
0
5
10
15
20
25
30
35
0 20 40 60 80 100
120
140
160
Time in Minutes
Tem
p C
Water bath UV light
Figure 2. Temperatures were taken every 10 minutes for UV and water bath treatments, to ensure the water rise in temperature was as close as possible in both treatments.

Phototaxis Behavior of Cercaria of Centrocestus formosanus Many trematodes demonstrate a phototaxis behavior that aids them to encounter their host. In order to test this hypothesis on C. formosanus we created a tube test. Three tubes were colored all black, three tubes were completely clear, and three tubes were ½ clear and ½ black. The tubes were filled with 3.5 ml well water and 1 ml of infected water. Tubes were exposed to 950 lux of light for 3 hours. The tubes were then cut in half dumping each half into a separate vial. Three replicates of each treatment were sampled and dyed with flourescein diacetate (FDA) and propidium iodide (PI), then cercaria were enumerated under the microscope. Unfortunately, the majority of the cercaria in the all- dark treatment were dead, perhaps due to a rise in temperature from the heat of the lamp. The phototaxis experiment was repeated again, this time using a T tube. The T design allowed the cercaria to make a decision to migrate through the T or not. The stem was filled with the cercaria contaminated water while the T had clean water. Each stem was designed to give the Centrocestus a choice (Figure 1).
Figure 1. The phototaxis experiment T tube design. Each tube was placed into a dish pan filled with water to regulate the temperature for 3 hours under 950 lux artificial light. The stem and the two sides were emptied into separate vials, dyed and filtered using the same method as before. The filter was then analyzed under the microscope and live cercaria were counted (Table 1). The results were analyzed using the chi square test. The difference was not significant, possibly due to technical problems dividing the tube without mixing the water. Due to this logistical problem, the test was redesigned. Table 1. Phototaxis T tube experiment. The number and proportion of cercaria in each section of the T, where C = clear and T = tape.
The box design relieved the transfer error, providing more accurate results. Nine boxes were created for the experiment. Three were ½ dark, ½ light, three were all dark and three were all clear. Within each box, a string at the midpoint was covered with a piece of clear plastic sheeting that lined the box.
(Continued on page 9)
VOLUME 15 , NUMBER 4 PAGE 8
Treatment # Cercaria Proportion Treatment # Cercaria Proportion Treatment # Cercaria Proportion T 1/2 2 0.00 T 1/2 14 0.02 T 1/2 0 0.00 C 1/2 11 0.02 C 1/2 283 0.49 C 1/2 372 0.75 Cstem 443 0.97 Cstem 275 0.48 Tstem 125 0.25 Total 456 1.00 572 1.00 497 1.00 C 10 0.03 C 3 0.01 C 122 0.86 C 166 0.58 C 19 0.09 C 7 0.05 Cstem 110 0.38 Cstem 189 0.90 Tstem 13 0.09 Total 286 1.00 211 1.00 142 1.00 T 10 0.03 T 0 0.00 T 40 0.43 T 26 0.08 T 5 0.01 T 47 0.51 Cstem 288 0.89 Cstem 629 0.99 Tstem 6 0.06 Total 324 1.00 634 1.00 93 1.00

(Continued from page 8)
The string was used to carefully pull the plastic up, allowing the water to separate into two sides. Boxes were filled with approximately 10,000 cercaria and 90 ml of water. The water was pipetted out and examined using the same technique as described above. There was a significant difference (P < 0.05) between the light and dark sides and no significant difference between the dark-dark and light-light (Figure 2). The results of this study suggest a strong positive phototaxis behavior in the cercaria of C. formosanus. Efforts to eradicate this parasite may be enhanced by concentrating the cercaria into a small area before applying a removal or chemical treatment. Mellisa Harvey
VOLUME 15 , NUMBER 4 PAGE 9
00.10.20.30.40.50.60.70.80.9
1
1/2 1/2 1/2 C C C T T
Treatment
Perc
enta
ge o
f Liv
e C
ecar
ia
side aside b
Figure 2. The proportion of cercaria of Centrocestus formosanus within each half of boxes that were either light (C), dark (T), or half of each. The letters a and b represent the side of the box, where, in the ½ treatment, a is clear and side b is dark.
Parting Shots We’re saddened to report the departure of a valuable friend and co-worker. Dr. Patrick Goddard, fish health specialist at the Fisheries Experiment Station has taken another position with the Division of Wildlife Resources, where he will oversee the Recovery Program of Colorado River fishes at the Moab office. We will miss Patrick’s many talents and outrageous sense of decorum, but wish him the best in his new position. Current Technical Services biologists (Anna Miller, Chris Heck and David Thompson) are filling in the gap while a nationwide search for a replacement takes place.

Introduction This study is a continuation of previous research to improve spawning success of captive June sucker (Chasmistes liorus). A prior study determined that a higher ovulation frequency occurred for females held in 56° Fahrenheit (F) than the culturing temperature 65° F. The goal of this study was to determine the amount of time required in cold water prior to the spawning season to promote egg development. Two hormones were used to facilitate ovulation during the June spawning season. Methods Ten temperature regimes were used for evaluation in the first trial (Table 1). Several fish from the ten treatments were used in two follow up trials. Females in treatments 1-3 were fish that did not ovulate in previous studies, and were still being held in 56 F water. The previous studies used external characteristics: vent and anal fin size to determine gender and a swollen vent with a soft rounded abdomen to select females with a greater spawning potential. Treatments 4-10 were selected by lot to obtain equal ratios in treatments and by external characteristics to determine gender, but not spawning potential. Table 1. Temperature regimes for culturing female June sucker by treatment.
The two hormones utilized were Ovaprim, an analogue of salmon gonadotropin releasing hormone (sGnRHa) with a dopamine blocker, and Chorulon, a human chorionic gonadotropin (HCG). All injections were intraperitoneal (IP) and each hormone was administered separately but during the same handling sequence. The Ovaprim dosage was 1.0 ml hormone per kg of fish body weight (BW). The Chorulon dosage was 1000 international units (IU) hormone per kg BW. Females were checked daily for up to ten days post injection for ovulation. Females that partially ovulated were monitored with the remaining fish. Trial 2 consisted of females that did not completely ovulate in the first trial, but exhibited the external characteristics: a swollen vent with a soft rounded abdomen. These fish were injected again with 1000 IU Chorulon per kg fish BW. Trial 3 consisted of females from Trial 2 that had partially ovulated in either of the two previous rounds and were injected again with 1000 IU Chorulon per kg fish BW. Males were selected if a small amount of milt was expressed when massaged. Injections were IP and 500 IU Chorulon per kg fish BW. Two consecutive injections were given twenty-four hours apart, and if the amount of milt did not increase by the second injection, a third injection was administered after twenty-four additional
(Continued on page 11)
VOLUME 15 , NUMBER 4 PAGE 10
Utilization of Cold Water to Promote Egg Development in Captive June Sucker
Treatment Name # Fish Temperature Regime 1 16-months 2 56° F 16 months prior to injections 2 12-months 4 56°F 12 months prior to injections 3 8.5-months 8 56°F 8.5 months prior to injections 4 6-months 10 56°F 6 months prior to injections 5 5-months 9 56°F 5 months prior to injections 6 4-months 10 56°F 4 months prior to injections
7 6-months/ 1-week 5 56°F 6 months followed by 62° F 1 week prior to injections
8 5-months/ 1-week 5 56°F 5 months followed by 62° F 1 week prior to injections
9 4-months/ 1-week 4 56°F 4 months followed by 62° F 1 week prior to injections
10 Warm-water 17 65°F > 1 year prior to injections

(Continued from page 10) hours. Males were divided into two groups to correspond with females in the follow up trials. A swollen protruding vent along with a soft rounded abdomen has been used to select fish for spawning potential, although these methods can be very subjective. To determine if vent characteristics are related to spawning potential in captive female June sucker measurements of the vent length and width were taken. Measurements of the vent were taken prior to injections and post injection prior to stripping the female of eggs. Post injection measurements were not taken on females that did not expel eggs. The data was analyzed using SPSS. Chi-square tests using maximum likelihood ratios were used in comparing the presence/absence of ovulation. Variables with a significant difference were subsequently analyzed in paired treatments (partial tables) with chi-square maximum-likelihood ratio statistics. An independent sample T-test was used to compare the pre-injection vent measurements between fish that ovulated and did not ovulate. A T-test for paired (dependent) samples was used to compare vent measurements of females that ovulated pre and post injection. The level of significance 0.05 was used for all tests. Results A total of 74 females were injected and monitored, 14 fish partially ovulated and 19 fish completely ovulated for a total of 45% ovulation. Fifty-seven fish were on temperature regimes involving cold-water in which 13 fish partially ovulated and 19 fish completely ovulated for a total of 56% ovulation. A significant difference for ovulation levels between treatments was only found in Trial 1 where 47.3% of females either partially or completely ovulated, whereas in Trial 2, 12.5% ovulated and Trial 3, 20.0% ovulated. In Trial 1 the percentage of the combination of complete and partial ovulation ranged from 100.0% in the 16-months treatment to 5.9% in the warm-water treatment . Ovulation for the warm water treatment was significantly lower than all of the treatments except the 4-months/1-week treatment. (Table 2). Table 2. Comparison of complete and partial ovulation levels by treatment. Matching subscripts within columns depict no significant difference.
In Group 1 all the males had an increase in the amount of milt expelled. Seven of the nineteen the fish required and received a third injection. In Group 2 seventeen of eighteen males had an increase in the amount of milt expelled. Only one male required a third injection; milt was being expressed but not at the expected increased level. This male was not administered the third injection though, because a sufficient number of males were available.
(Continued on page 12)
VOLUME 15 , NUMBER 4 PAGE 11
Treatment Ovulation Percent (partial/ complete) 16-months 100.0%z
12-months 50.0%z
8.5-months 75.0%z
6-months 80.0%z
5-months 44.4%z
4-months 40.0%z
6-months/1-week 60.0%z
5-months/1-week 80.0%z
4-months/1-week 25.0%zy
Warm-water 5.9%y

(Continued from page 11) In the comparison of vent lengths and widths between fish that ovulated and fish that did not ovulate there was no significant difference for either variable. There was a significant difference in both vent length and widths for pre versus post injections for fish that ovulated. Conclusions The results of the study confirm that exposure to colder water is necessary to promote egg development in order to stimulate ovulation with hormones. The data also shows that there was no significant difference in the amount of ovulation for fish held in colder water four months and longer. Though fish in the 4-months treatment were not significantly different complete ovulation did not occur in the treatment. Fish that have been on colder water for a sufficient time prior to being moved to warm-water did not result in a significant difference in the occurrence of ovulation. A period of six months in 56° F water is likely the preferred option; it allows sufficient stimuli for egg development and allows a warmer temperature the remainder of the year to improve overall fish condition. Nineteen percent of the fish only partially ovulated; the reason for this is unknown. A possible remedy is to use multiple doses or an initial dose and a resolving dose. Vent measurements prior to injections are not an effective method to determine the spawning potential for June sucker. Post injection measurements were not taken on fish that did not ovulate for comparison to measurements of those that did ovulate; this might be useful information to obtain in future studies to determine spawning potential or candidates for re-injection. Eriek Hansen Contact author for full version of article.
VOLUME 15 , NUMBER 4 PAGE 12

The Ichthyogram is a quarterly publication of the Fisheries Experiment Station, Utah Division of Wildlife Resources, Logan Utah 84321. Editor: Chris Wilson ([email protected]) Contributors: Ronney Arndt ([email protected]) Mellisa Harvey ([email protected]) Eric Wagner ([email protected]) This newsletter is distributed electronically at http://wildlife.utah.gov/fes/ichthyogram.html Send comments or change of address to: EDITOR, The Ichthyogram 1465 West 200 North, Logan, UT 84321
Utah Division of Wildlife Resources Fisheries Experiment Station
1465 West 200 North Logan, UT 84321
We’re on the web! www.wildlife.utah.
gov/fes
Phone:435-752-1066 Fax: 435-752-6977
Email: [email protected]