Embed Size (px)
Citation preview
UTAHLIVESTOCK WATER AND PIPELINE
HANDBOOK
Supplement to theNational Engineering Field Handbook
Part 650 Chapter 3 Hydraulics
June 2015

USDA Natural Resources Conservation Service

UTAH LIVESTOCK WATER AND PIPELINE HANDBOOKTABLE OF CONTENTS
CHAPTER 1-- INTRODUCTION...........................................................................................................................2
1.1 PURPOSE AND OBJECTIVES.................................................................................................................2
1.2 GENERAL..................................................................................................................................................2
CHAPTER 2 - PLANNING CONSIDERATIONS................................................................................................4
2.1 GENERAL.......................................................................................................................................................4
2.2 PLANNING PROCEDURE............................................................................................................................6
2.3 WATER QUANTITY REQUIREMENTS......................................................................................................7
2.4 DESIGN FLOW RATE...................................................................................................................................9
2.5 WATER STORAGE REQUIREMENTS......................................................................................................12
CHAPTER 3 -- PIPELINE SYSTEM TYPES......................................................................................................22
3.1 GENERAL.....................................................................................................................................................22
3.2 GRAVITY SYSTEM.....................................................................................................................................22
3.3 AUTOMATIC PRESSURE SYSTEMS........................................................................................................24
3.4 TIMED OR MANUAL PRESSURE SYSTEMS..........................................................................................24
3.5 FLOAT SWITCH OPERATED PRESSURE SYSTEM...............................................................................24
3.6 YEAR ROUND VERSUS SUMMER PIPELINES......................................................................................29
CHAPTER 4 -- PIPELINE ROUTE SELECTION AND SURVEYS.................................................................32
4.1 ROUTE CONSIDERATIONS.......................................................................................................................32
4.2 ROUTE SURVEYS--GENERAL..................................................................................................................32
4.3 ENGINEERING INSTRUMENT SURVEY.................................................................................................32
4.4 GLOBAL POSITIONING SYSTEM SURVEY...........................................................................................33
CHAPTER 5 -- PIPE MATERIALS SELECTION..............................................................................................36
5.1 GENERAL.....................................................................................................................................................36
Utah LWPH June 2015
i
5.2 PLASTIC PIPE CHARACTERISTICS.........................................................................................................36
5.3 POLYVINYL CHLORIDE (PVC) PLASTIC PIPE.....................................................................................37
5.4 POLYETHYLENE (PE) PLASTIC PIPE.....................................................................................................38
5.5 ACRYLONITRILE-BUTADIENE-STYRENE (ABS) PLASTIC PIPE......................................................38
5.6 POLYBUTYLENE (PB) PLASTIC PIPE.....................................................................................................39
5.7 STEEL PIPE..................................................................................................................................................39
5.8 FRICTION LOSS IN PIPING SYSTEM AT THE PUMP...........................................................................39
5.10 PVC PIPE FITTINGS..................................................................................................................................56
CHAPTER 6 -- PRESSURE AND SURGE CONTROL....................................................................................59
6.1 PIPELINE PRESSURE CONTROL..............................................................................................................59
6.2 SURGE CONTROL.......................................................................................................................................64
6.3 Calculating Surge Pressure.......................................................................................................................70
CHAPTER 7 - AIR CONTROL.............................................................................................................................74
7.1 GENERAL.....................................................................................................................................................74
7.2 AIR/GAS PROBLEMS.................................................................................................................................74
7.3 AIR IN LOW HEAD GRAVITY PIPELINES (20 psi or less).....................................................................76
7.4 AIR CONTROL IN HIGH HEAD, LONG PIPELINES (greater than 20 psi).............................................76
7.5 AIR VALVES AND HOW THEY WORK...................................................................................................79
7.6 TYPES OF VALVES....................................................................................................................................83
7.7 AIR VALVE INSTALLATION....................................................................................................................87
8.2 STORAGE TANKS......................................................................................................................................108
8.3 PIPELINE DRAINS....................................................................................................................................113
CHAPTER 9 -- SPRINGS AND WELLS..........................................................................................................116
9.1 SPRING FED PIPELINE ENTRANCE......................................................................................................116
9.2 WELLS AND SUMPS................................................................................................................................120
CHAPTER 10 - WELL ACCESSORIES...........................................................................................................123
10.1 PUMPS......................................................................................................................................................123
Utah LWPH June 2015
ii
10.2 PRESSURE TANKS.................................................................................................................................144
10.3 PRESSURE SWITCHES...........................................................................................................................156
10.4 ELECTRICAL PUMP CONTROL EQUIPMENT...................................................................................158
CHAPTER 11 -- HYDRAULIC DESIGN PROCEDURES.............................................................................163
11.1 GENERAL.................................................................................................................................................163
11.2 DESIGN PROCEDURES..........................................................................................................................163
11.3 EXAMPLE 1: GRAVITY SYSTEM........................................................................................................166
11.5 Example 3: Pumped Automatic Pressure Pipeline.................................................................................175
11.6 Example 4: Pipeline connected to Rural Water System...........................................................................184
CHAPTER 12 -- STOCKWATER PIPELINE INSTALLATION.....................................................................191
12.1 TRENCHING............................................................................................................................................191
12.2 PIPE JOINTS.............................................................................................................................................194
12.3 INSPECTION DURING CONSTRUCTION............................................................................................194
12.4 MEASUREMENT FOR PAYMENT........................................................................................................194
CHAPTER 13 -- OPERATION AND MAINTENANCE..................................................................................196
13.1 GENERAL.................................................................................................................................................196
13.2 WINTERIZING..........................................................................................................................................196
13.3 OPERATION AND MAINTENANCE PLAN.........................................................................................196
APPENDIX A -- Worksheets................................................................................................................................198
APPENDIX B -- COMPUTER PROGRAMS....................................................................................................200
APPENDIX C -- MATERIALS SOURCES........................................................................................................201
Utah LWPH June 2015
iii

CHAPTER 1
INTRODUCTION
TABLE OF CONTENTS
PART 1.1 PURPOSE AND OBJECTIVES 1-1PART 1.2 GENERAL 1-1
Utah LWPH June 2015
1
CHAPTER 1-- INTRODUCTION
1.1 PURPOSE AND OBJECTIVESThe purpose of the Utah Stockwater Pipeline Handbook is to provide Natural Resources Conservation Service (NRCS) personnel and others, where appropriate, with detailed technical information and procedures which may be used for planning, design and management of stockwater pipelines in Utah.
Stockwater pipelines are installed to (1) improve the beneficial use of rangeland by providing better distribution of livestock, (2) prevent loss of water by evaporation and seepage, (3) maintain and improve the plant community, (4) prevent erosion resulting from overgrazing near water sources, and (5) to help improve animal performance
This handbook is only a guide; it does not set NRCS policy or standards. Policy and standards are set by NRCS documents such as the National Planning Manual, the National Engineering Manual, and the practice standards as contained in Section 4 of the Field Office Technical Guide (FOTG).
FOTG standards and specifications must be used in conjunction with conservation practices and procedures covered by this handbook. Best available procedures and data should always be used, whether or not they are in this handbook.
1.2 GENERALStockwater pipelines come in many configurations and sizes in Utah. They may consist of anything from a short piece of pipe between a spring and stock tank, to many miles of pipelines, with pressures as high as 500 psi. Design may be as critical for a short pipeline as for a long one.
Consider what can happen if a pipeline fails. If there is little or no backup water available in a field, and the problem is not discovered promptly, livestock may die. During hot, dry weather, a cow can only last three or four days without water.
A stockwater pipeline can be a great improvement over existing watering systems. Stockwater ponds tend to dry up at the worst times; windmills often don't work when they are needed, and hauling water is unpopular and time consuming and often not financially feasible. On the other hand, a stockwater pipeline can be a very dependable water distribution system. Not only can it be dependable, but good quality water can be delivered to optimum locations to promote good grazing distribution and healthy animals.
Planning and design of a stockwater pipeline may be complex, and pipelines can be a significant investment. It is very important that they be properly planned and designed, and be as economical as possible. This handbook is dedicated to providing some of the information and tools needed to implement this practice.
Utah LWPH June 2015
2
CHAPTER 2
PLANNING CONSIDERATIONS
TABLE OF CONTENTS
PART 2.1 GENERAL 2-1PART 2.2 PLANNING PROCEDURE 2-3
2.2.1 Objectives 2-32.2.2 Resource Inventory 2-32.2.3 System Alternatives 2-42.2.4 Land user decisions 2-42.2.5 Implementation 2-42.2.6 Follow-up 2-4
PART 2.3 WATER QUANTITY REQUIREMENTS 2-4PART 2.4 DESIGN FLOW RATE 2-6PART 2.5 WATER STORAGE REQUIREMENTS 2-9PART 2.6 SOURCE OF WATER 2-13
2.6.1 Springs 2-132.6.2 Surface Source 2-132.6.3 Well 2-132.6.4 Water Quality 2-13
FIGURES
Figure 2.1 Stockwater Pipeline Planning Procedure 2-2Figure 2.2 Flow Rate for Daily Needs (Supplied in 4 hrs) 2-6Figure 2.3 Flow Rate for Daily Needs (Supplied in 6 hrs) 2-7Figure 2.4 Flow Rate for Daily Needs (Supplied in 12 hrs) 2-8
TABLES
Table 2.1 Minimum Daily Stockwater Requirements 2-5Table 2.2 Maximum Water Facility Spacing 2-5Table 2.3 Total Daily Stockwater Requirements 2-9Table 2.4 Round Stock Tank Storage Capacity and Tank Perimeter 2-10Table 2.5 Storage Requirement 2-10Table 2.6 Stockwater Pipeline Resource Inventory Worksheet 2-12Table 2.7 Use of Saline Water for Livestock 2-15Table 2.8 Effects of Nitrates on Livestock 2-16
Utah LWPH June 2015
3
CHAPTER 2 - PLANNING CONSIDERATIONS
2.1 GENERALWhen planning a stockwater pipeline, it is always important to follow good resource planning procedures. Figure 2.1 illustrates the NRCS planning process as it relates to stockwater pipelines. The planning processes must be followed, even when we are involved with a system where the landowner knows exactly what he/she wants, and we are in a rush to get the job done.
To do otherwise frequently leads to such problems as:
System that does not meet resource conservation needs
System that does not meet the needs of the cooperator
System that cannot later be expanded
An overly expensive system
Utah LWPH June 2015
4
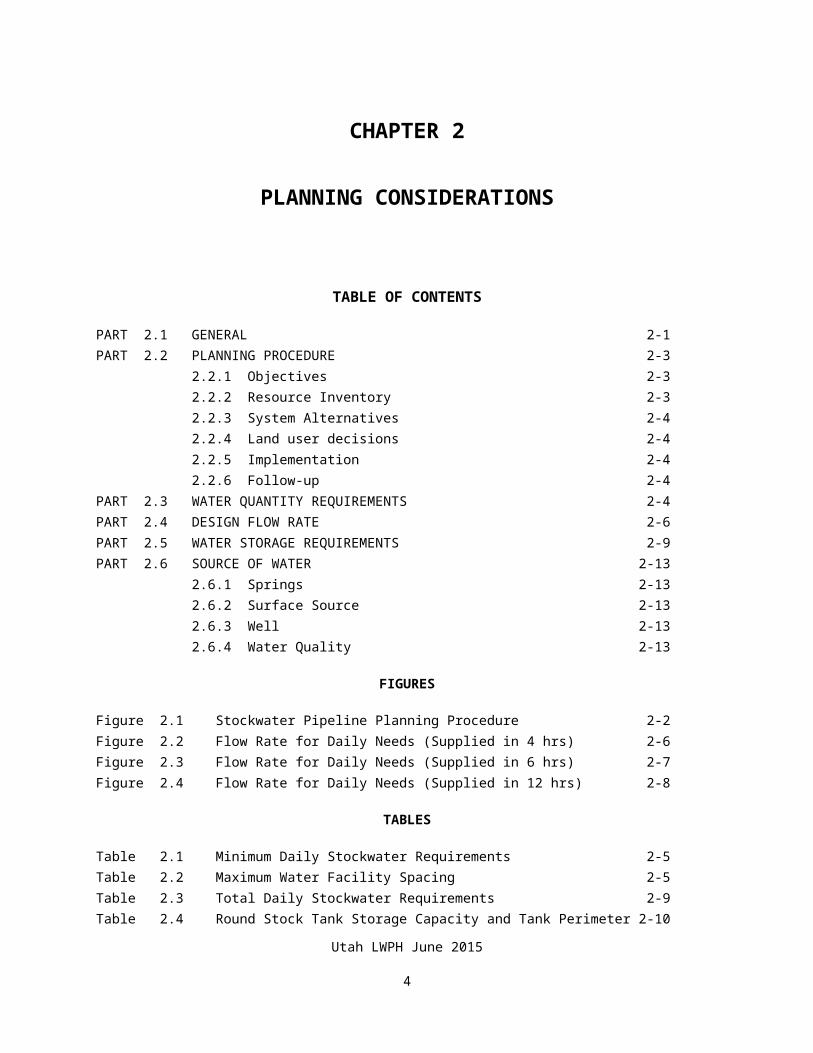
Figure 2.1STOCKWATER PIPELINE PLANNING PROCEDURE
Utah LWPH June 2015
5
2.2 PLANNING PROCEDURE
2.2.1 ObjectivesFind out about the landowner's objectives. Does he/she want a more dependable supply of water, better grazing distribution, better water, or better livestock performance? We also need to remember why we are involved and our objectives. Our objectives are to maintain and enhance the resource base. We accomplish this by aiding the land user in the development of a Resource Management System (RMS). These objectives should be clearly identified and understood before we start the next step.
2.2.2 Resource InventoryInformation which must be obtained when planning a stockwater pipeline system includes:
The annual grazing period, including whether or not the pipeline will need to operate in freezing weather.
The types and maximum number of livestock and wildlife which will use water at any given time.
Future expansion and management considerations.
The type of grazing system to be used.
The area to be serviced by the pipeline.
Location and details of existing water sources in the area to be serviced by the pipeline.
Location and details of existing water sources in the area not to be serviced by the pipeline (i.e. existing ponds).
Reliability and quality of existing water sources in the area to be serviced by the pipeline.
Location, reliability and quality of water source or sources which may be used as a supply for the pipeline.
Desirable watering locations based on an analysis of range use patterns, range conditions, geology, and topography.
Geologic considerations including location of shallow bedrock, unstable soils, coarse gravel subsoils, old slide areas, wetland areas, sharp breaks in slope, etc.
If wetland areas are to be traversed, a determination as to requirements or limitations involved in crossing the wetland.
Property line and ownership considerations.
Topographic information, including any necessary engineering surveys or study of topographic maps.
Utah LWPH June 2015
6
The worksheet illustrated in Appendix A, Planning Worksheet may be used as an aid in obtaining necessary resource information.
Utah LWPH June 2015
7
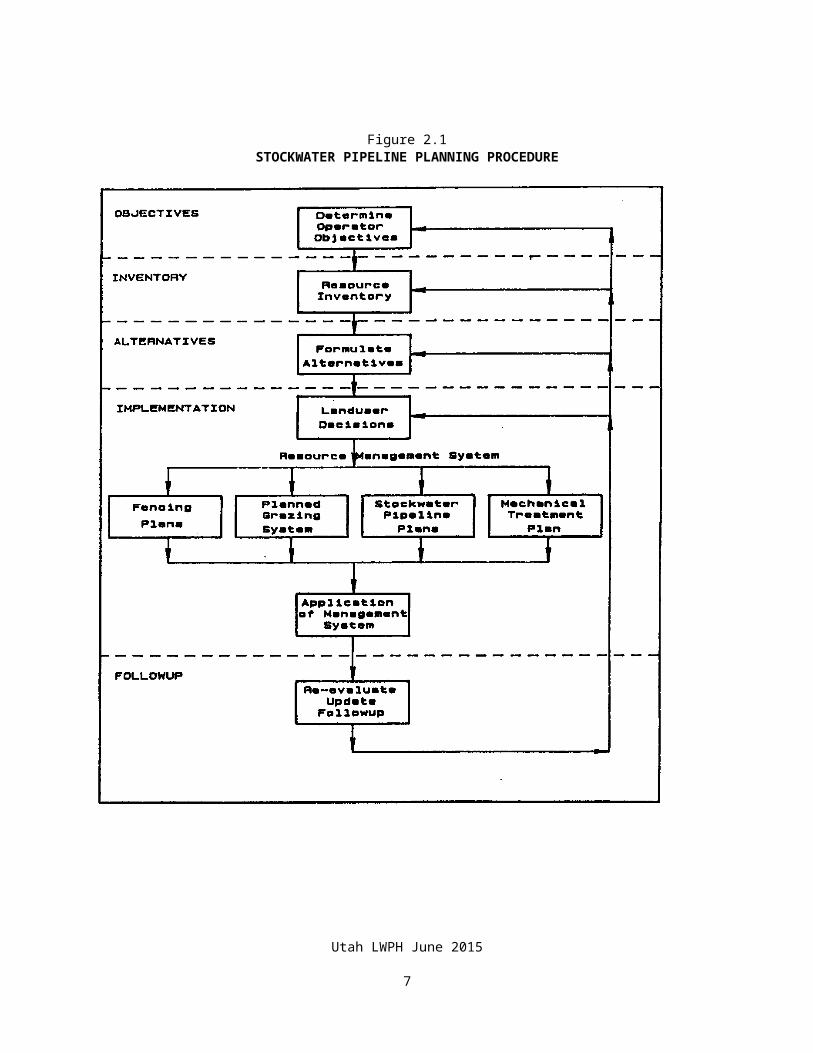
2.2.3 System AlternativesEven though the landowner may have a very specific system in mind, all reasonable alternatives should be considered to assure that the appropriate alternative is selected.
Economic considerations are usually a major factor in determining stockwater system alternatives. It is important to consider upgrading existing water sources; such as ponds, spring developments, and windmills, as alternatives to an extensive stockwater pipeline system, or as a backup to the pipeline system in the event of failure.
The use of average cost data, computer spreadsheets, and specialized computer programs can aid in analyzing various pipeline alternatives. These aids should be used whenever possible to save time and effort.
2.2.4 Landuser DecisionsWe sometimes forget to determine user’s final decisions before proceeding with detailed pipeline design. Good, appropriately timed communication with the land user is always critical to success of the project. To do otherwise will usually waste everyone's time and money.
2.2.5 ImplementationImplementation of the Resource Management System includes preparation of detailed plans for such practices as fencing, range reseeding, and planned grazing system; as well as design and preparation of pipeline and tank drawings, specifications, quantities, cost estimates, and operation and maintenance plans for the pipeline. It also includes required inspection during application and construction.
2.2.6 Follow-upPipelines can be complex and may sometimes experience problems. We must be constantly alert for problems such as waterhammer, air locks, freezing pipes, erosion, low flows, and improperly functioning valves so that they can be corrected, and avoided in future jobs. This means that we must maintain contact with the landowner and re-visit some of the pipelines after they have operated for a period of time.
2.3 WATER QUANTITY REQUIREMENTSThe quantity of supplemental stockwater required during any given period depends on the type and number of stock, wildlife, climatic conditions and amount of natural water available. It has also been found that water usage is higher for stock in an intensive grazing system.
Table 2.1 provides guidelines pertinent to water requirements of water facilities.
Table 2.2 provides guidelines pertinent to spacing of facilities
In general, the recommended daily water requirements of livestock in Utah are as follows:
Utah LWPH June 2015
8
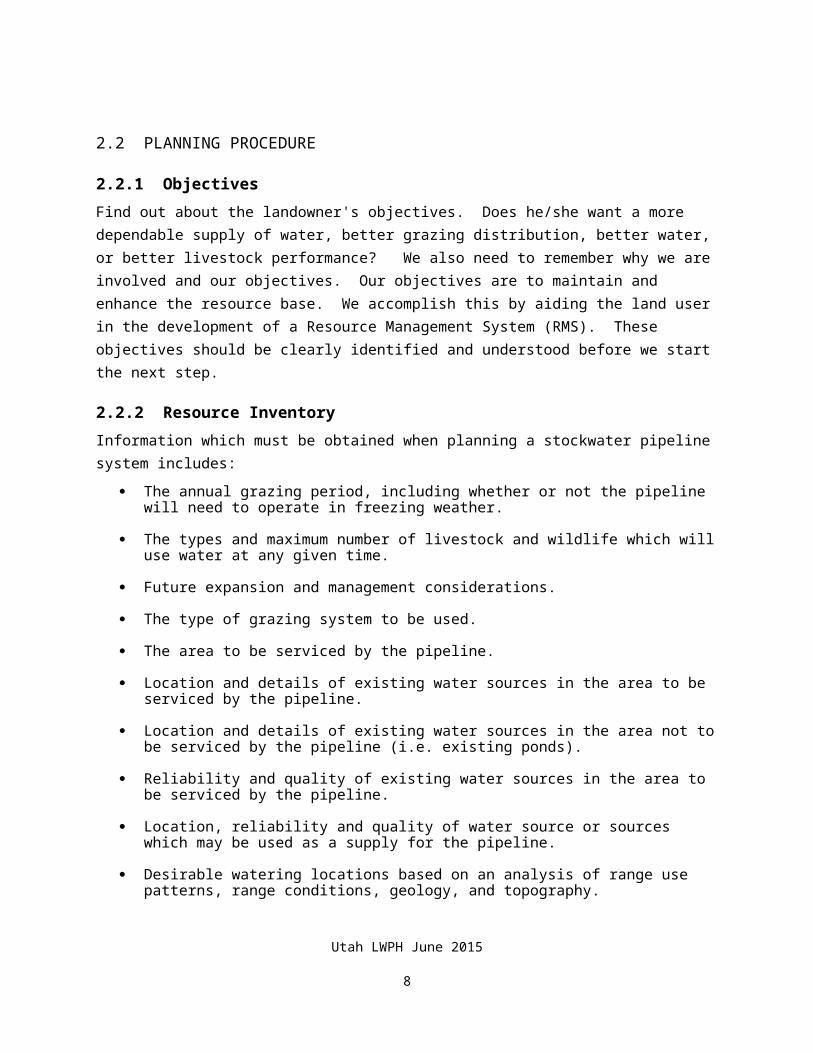
Table 2.1Minimum Daily Stockwater Requirements
Livestock TypeConventional Water Facility
Application (gal/day)Intensive Water Facility
Application (gal/day)
Cow 12 17
Cow & Calf 15 20
Dairy Cow (lactating) 25 30
Horse 15 20
Buffalo 20 25
Sheep 1.5 3
Goats 1.5 3
Hogs 1.5 3
Deer 1.5 -
Antelope 1.5 -
Elk 6 -
These are minimum volumes. If livestock are larger than average or there are other planning issues, the volume of storage should be increased accordingly.
Table 2.2Recommended Water Facility Spacing
Type of TerrainConventional Water Facility Maximum Travel Distance
Intensive Water Facility maximum Travel Distance1
Very Steep
Rough
¼ mile
½ mile
1/8 mile (660 feet)
1/8 mile (660 feet)
Rolling ¾ mile 1/6 mile (880 feet)
Utah LWPH June 2015
9
Level and easily accessed 1 mile ¼ mile 2
1 Livestock must be checked daily
2 Assumes there are no visual obstructions in any direction between the livestock and the watering facility. If there are visual obstructions for an intensive water facility application, then use maximum travel distance for rolling terrain.
There will usually be water lost to evaporation and spillage at drinking tanks and troughs. Evaporation from a water surface can amount to as much as 0.25 inches per day or 7.5 inches per month in northeastern Utah, 0.26 inches per day or 8 inches per month in southern Utah during the summer months of the year.
In intensive water facility applications, the livestock will water more often and more spillage will occur. It is critical that the water supply meets the water demand. To account for these losses and demand, the minimum daily water requirements shown in Table 2.1 were increased for intensive water facility applications.
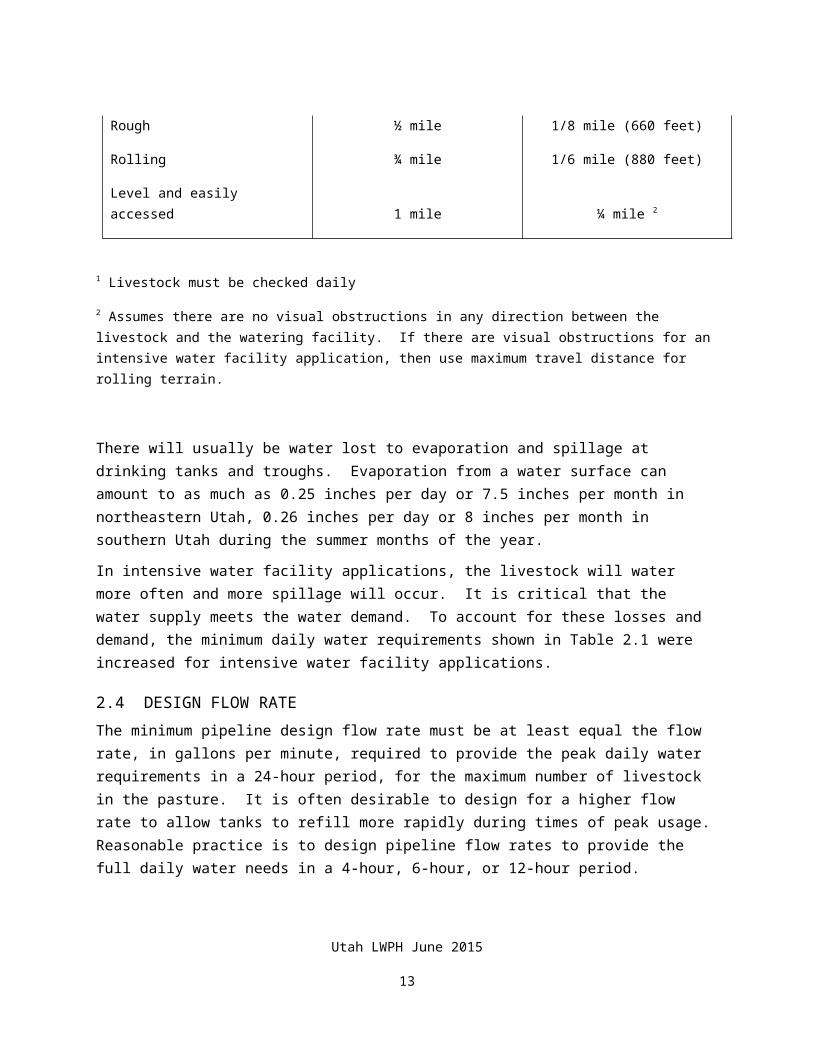
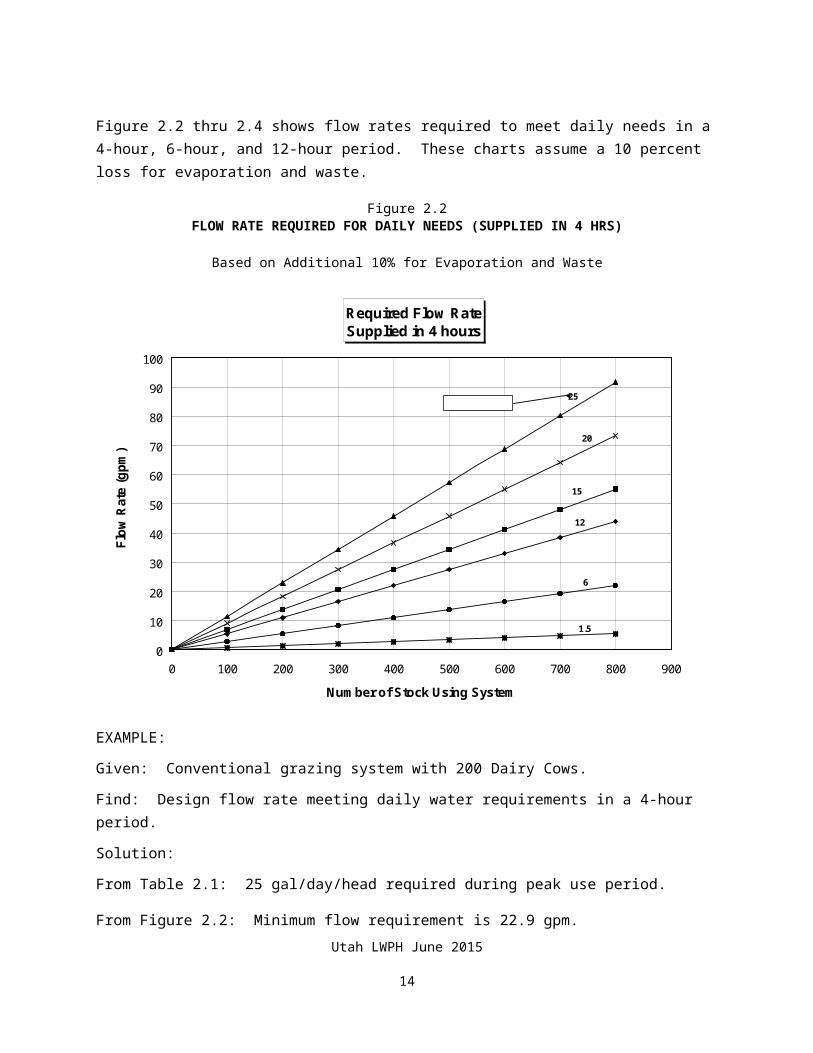
2.4 DESIGN FLOW RATEThe minimum pipeline design flow rate must be at least equal the flow rate, in gallons per minute, required to provide the peak daily water requirements in a 24-hour period, for the maximum number of livestock in the pasture. It is often desirable to design for a higher flow rate to allow tanks to refill more rapidly during times of peak usage. Reasonable practice is to design pipeline flow rates to provide the full daily water needs in a 4-hour, 6-hour, or 12-hour period.
Figure 2.2 thru 2.4 shows flow rates required to meet daily needs in a 4-hour, 6-hour, and 12-hour period. These charts assume a 10 percent loss for evaporation and waste.
Figure 2.2FLOW RATE REQUIRED FOR DAILY NEEDS (SUPPLIED IN 4 HRS)
Based on Additional 10% for Evaporation and Waste
Utah LWPH June 2015
10
Required Flow Rate Supplied in 4 hours
12
15
20
1.5
6
25
0
10
20
30
40
50
60
70
80
90
100
0 100 200 300 400 500 600 700 800 900
Number of Stock Using System
Flow
Rat
e (g
pm)
gal/day/head
EXAMPLE:
Given: Conventional grazing system with 200 Dairy Cows.
Find: Design flow rate meeting daily water requirements in a 4-hour period.
Solution:
From Table 2.1: 25 gal/day/head required during peak use period.
From Figure 2.2: Minimum flow requirement is 22.9 gpm.
Figure 2.3FLOW RATE REQUIRED FOR DAILY NEEDS (SUPPLIED IN 6 HRS)
Based on Additional 10% for Evaporation and Waste
Utah LWPH June 2015
11
Required Flow Rate Supplied in 6 hours
12
15
25
20
6
1.5
0
10
20
30
40
50
60
70
0 100 200 300 400 500 600 700 800 900
Number of Stock Using System
Flow
Rat
e (g
pm)
gal/day/head
EXAMPLE:
Given: Conventional grazing system with 300 Cows.
Find: Design flow rate meeting daily water requirements in a 6-hour period.
Solution:
From Table 2.1: 12 gal/day/head required during peak use period.
From Figure 2.3: Minimum flow requirement is 11.0 gpm.
Utah LWPH June 2015
12
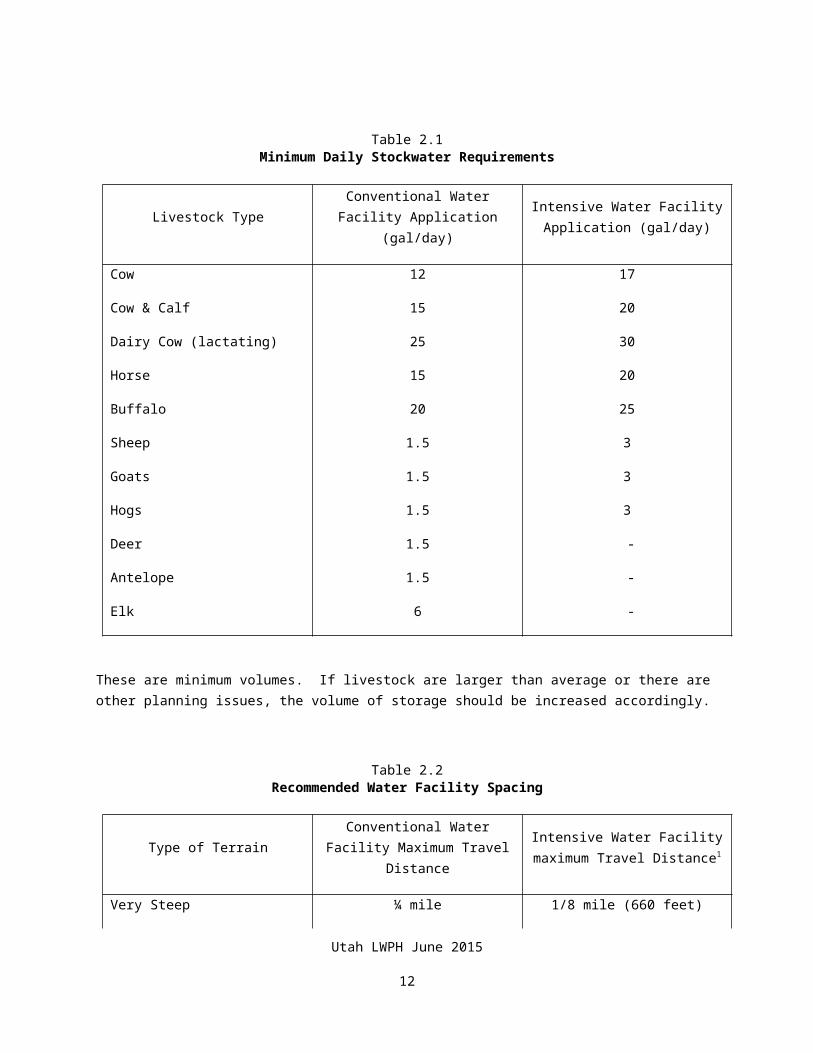
Figure 2.4FLOW RATE REQUIRED FOR DAILY NEEDS (SUPPLIED IN 12 HRS)
Based on Additional 10% for Evaporation and Waste
Required Flow Rate Supplied in 12 hours
1.5
6
12
15
20
25
0
5
10
15
20
25
30
35
0 100 200 300 400 500 600 700 800 900
Number of Stock Using System
Flow
Rat
e (g
pm)
gal/day/head
EXAMPLE:
Given: Conventional grazing system with 150 Cow/calf pairs.
Find: Design flow rate meeting daily water requirements in a 12-hour period.
Solution:
From Table 2.1: 15 gal/day/head required during peak use period.
From Figure 2.4: Minimum flow requirement is 3.4 gpm.
Utah LWPH June 2015
13
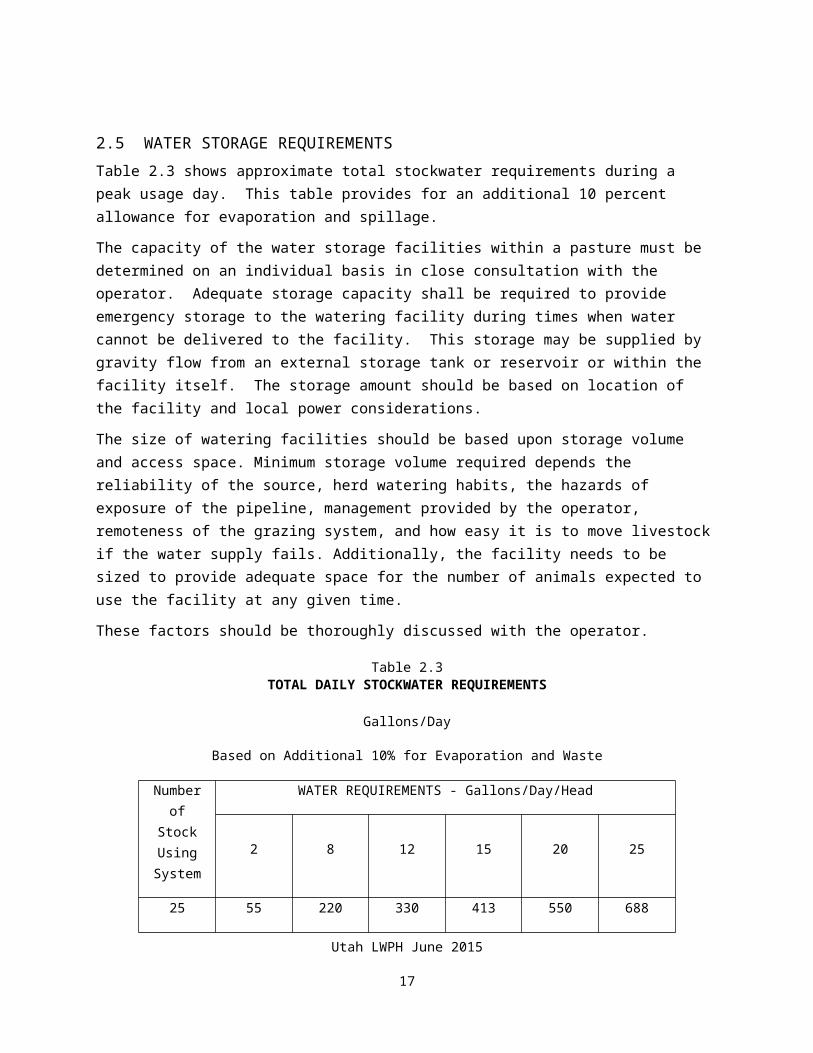
2.5 WATER STORAGE REQUIREMENTSTable 2.3 shows approximate total stockwater requirements during a peak usage day. This table provides for an additional 10 percent allowance for evaporation and spillage.
The capacity of the water storage facilities within a pasture must be determined on an individual basis in close consultation with the operator. Adequate storage capacity shall be required to provide emergency storage to the watering facility during times when water cannot be delivered to the facility. This storage may be supplied by gravity flow from an external storage tank or reservoir or within the facility itself. The storage amount should be based on location of the facility and local power considerations.
The size of watering facilities should be based upon storage volume and access space. Minimum storage volume required depends the reliability of the source, herd watering habits, the hazards of exposure of the pipeline, management provided by the operator, remoteness of the grazing system, and how easy it is to move livestock if the water supply fails. Additionally, the facility needs to be sized to provide adequate space for the number of animals expected to use the facility at any given time.
These factors should be thoroughly discussed with the operator.
Table 2.3TOTAL DAILY STOCKWATER REQUIREMENTS
Gallons/Day
Based on Additional 10% for Evaporation and Waste
Number of Stock Using
System
WATER REQUIREMENTS - Gallons/Day/Head
2 8 12 15 20 25
25 55 220 330 413 550 688
50 110 440 660 825 1,100 1,375
75 165 660 990 1,238 1,650 2,063
100 220 880 1,320 1,650 2,200 2,750
125 275 1,100 1,650 2,063 2,750 3,438
150 330 1,320 1,980 2,475 3,300 4,125
175 385 1,540 2,310 2,888 3,850 4,813
200 440 1,760 2,640 3,300 4,400 5,500
Utah LWPH June 2015
14
250 550 2,200 3,300 4,125 5,500 6,875
300 660 2,640 3,960 4,950 6,600 8,250
350 770 3,080 4,620 5,775 7,700 9,625
400 880 3,520 5,280 6,600 8,800 11,000
450 990 3,960 5,940 7,425 9,900 12,375
500 1,100 4,400 6,600 8,250 11,000 13,750
600 1,320 5,280 7,920 9,900 13,200 16,500
700 1,540 6,160 9,240 11,550 15,400 19,250
800 1,760 7,040 10,560 13,200 17,600 22,000
900 1,980 7,920 11,880 14,850 19,800 24,750
1000 2,200 8,800 13,200 16,500 22,000 27,500
Utah LWPH June 2015
15
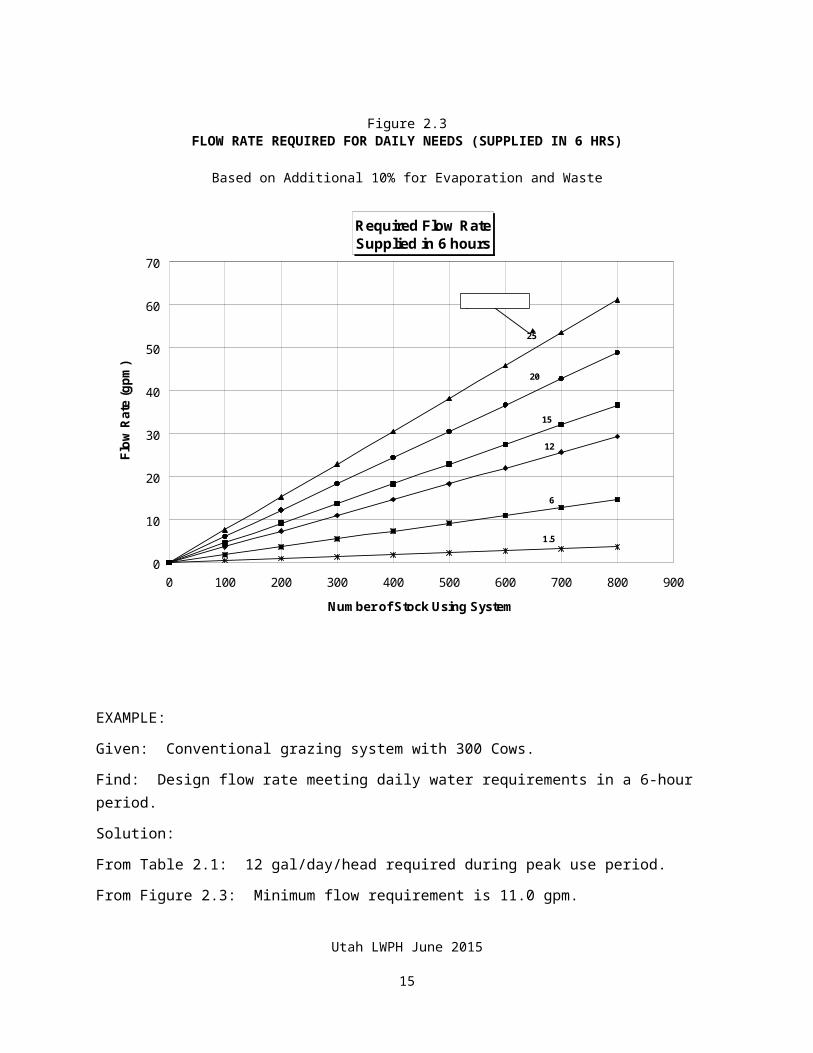
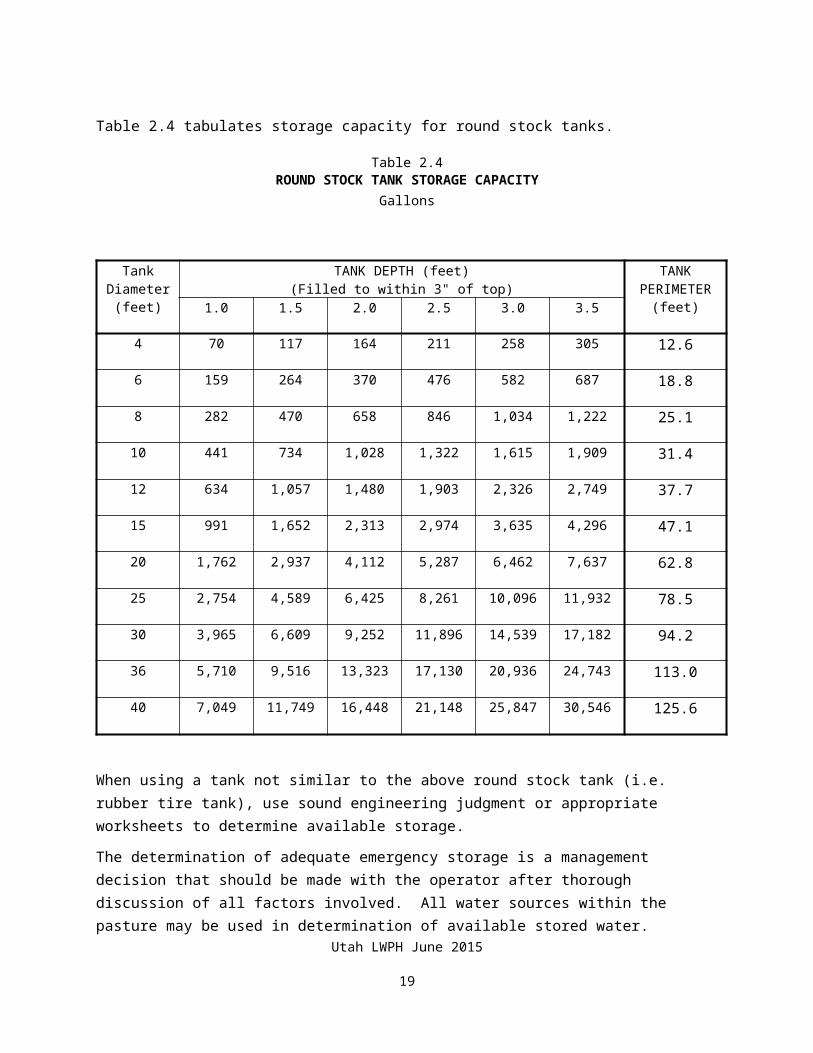
Table 2.4 tabulates storage capacity for round stock tanks.
Table 2.4ROUND STOCK TANK STORAGE CAPACITY
Gallons
Tank Diameter
(feet)
TANK DEPTH (feet)(Filled to within 3" of top)
TANK PERIMETER
(feet)1.0 1.5 2.0 2.5 3.0 3.5
4 70 117 164 211 258 305 12.6
6 159 264 370 476 582 687 18.8
8 282 470 658 846 1,034 1,222 25.1
10 441 734 1,028 1,322 1,615 1,909 31.4
12 634 1,057 1,480 1,903 2,326 2,749 37.7
15 991 1,652 2,313 2,974 3,635 4,296 47.1
20 1,762 2,937 4,112 5,287 6,462 7,637 62.8
25 2,754 4,589 6,425 8,261 10,096 11,932 78.5
30 3,965 6,609 9,252 11,896 14,539 17,182 94.2
36 5,710 9,516 13,323 17,130 20,936 24,743 113.0
40 7,049 11,749 16,448 21,148 25,847 30,546 125.6
When using a tank not similar to the above round stock tank (i.e. rubber tire tank), use sound engineering judgment or appropriate worksheets to determine available storage.
The determination of adequate emergency storage is a management decision that should be made with the operator after thorough discussion of all factors involved. All water sources within the pasture may be used in determination of available stored water.
Utah LWPH June 2015
16
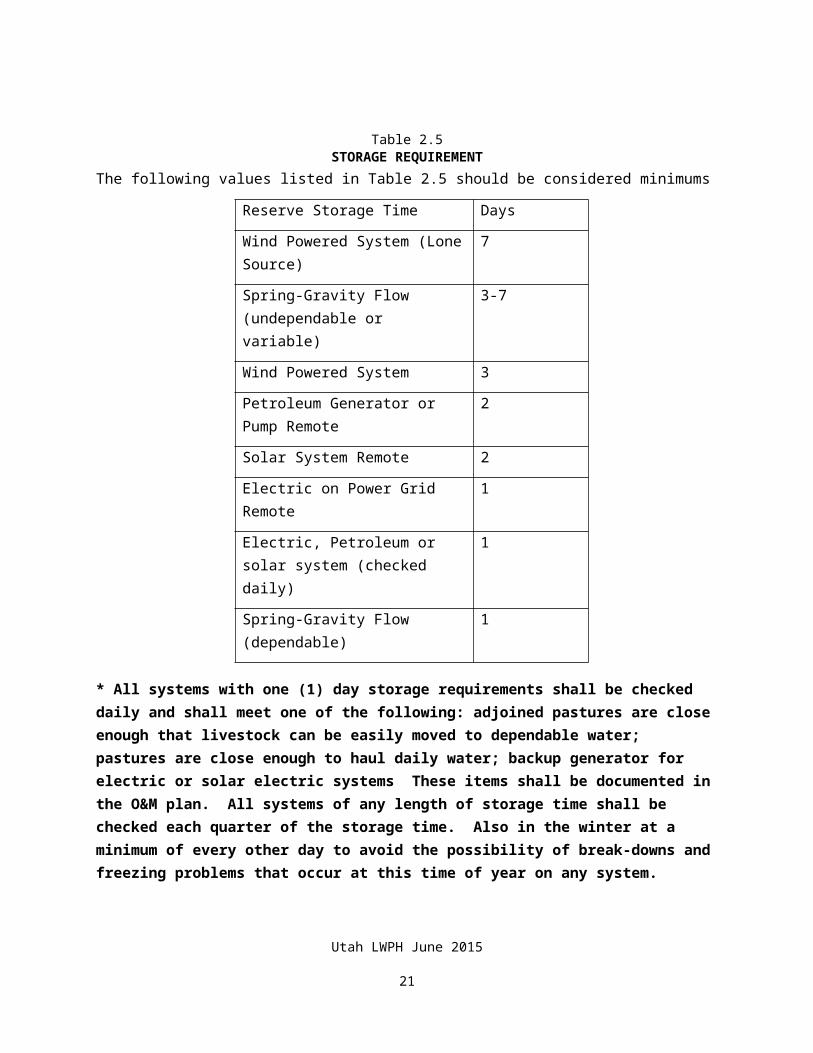
Table 2.5STORAGE REQUIREMENT
The following values listed in Table 2.5 should be considered minimums
Reserve Storage Time Days
Wind Powered System (Lone Source)
7
Spring-Gravity Flow (undependable or variable)
3-7
Wind Powered System 3
Petroleum Generator or Pump Remote
2
Solar System Remote 2
Electric on Power Grid Remote 1
Electric, Petroleum or solar system (checked daily)
1
Spring-Gravity Flow (dependable) 1
* All systems with one (1) day storage requirements shall be checked daily and shall meet one of the following: adjoined pastures are close enough that livestock can be easily moved to dependable water; pastures are close enough to haul daily water; backup generator for electric or solar electric systems These items shall be documented in the O&M plan. All systems of any length of storage time shall be checked each quarter of the storage time. Also in the winter at a minimum of every other day to avoid the possibility of break-downs and freezing problems that occur at this time of year on any system.
Utah LWPH June 2015
17
The water access perimeter needs to be sized to provide adequate space for the number of animals expected. The following values shall be considered adequate for meeting access requirements:
• Provide one space for every 20 animals (5 percent of herd) when water is available in
each pasture/field and livestock generally drink 1 at a time or in small groups. Generally, travel distances should be less than 1,320 feet from the tank to the edge of the pasture/field.
• Provide one space for every 10 animals (10 percent of herd) to drink at one time at a tank where travel distances are greater than 1,320 feet, at a centralized water supply, or in areas where animals will congregate and fight for access to tank.
• Allow 18 inches of perimeter for circular tanks and 30 inches for straight side tanks per animal.
Tank perimeter lengths for various circular tanks is listed in Table 2.4.
The Utah worksheet UT-20 summarizes the design procedures for calculation of the design flow rate computation and storage requirements for livestock water. An example is shown in Table 2.6 and a blank spreadsheet can be found in Appendix A.
Utah LWPH June 2015
18
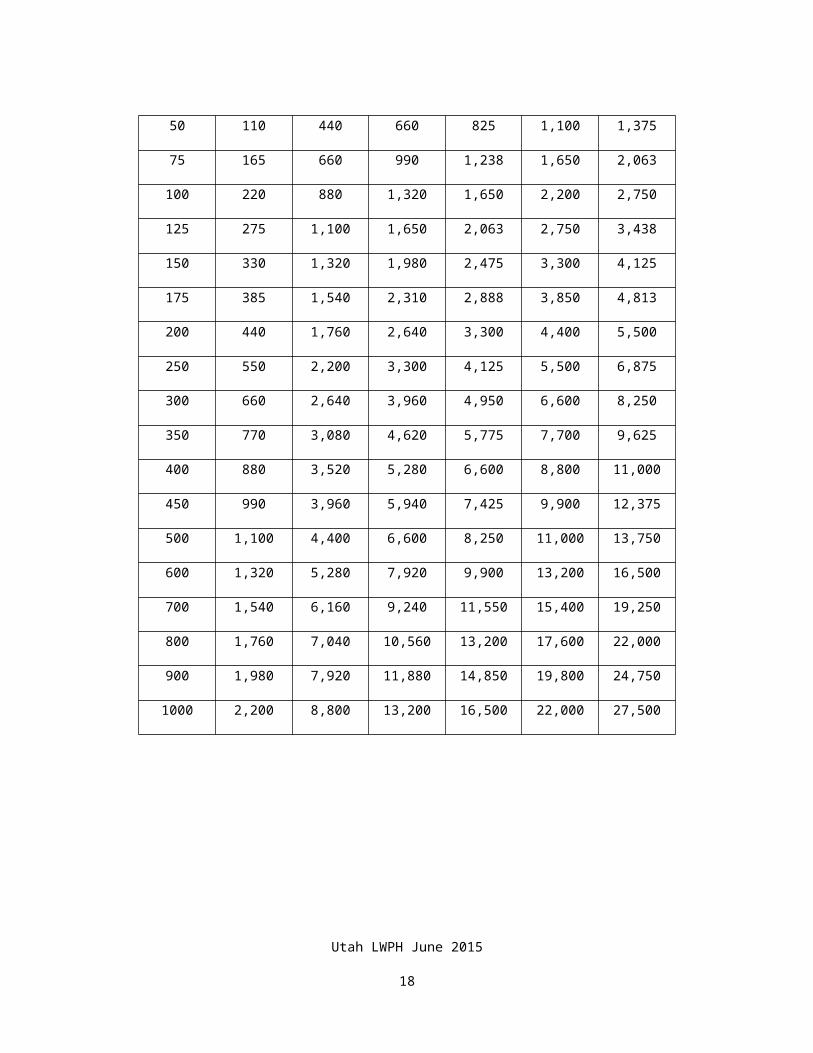
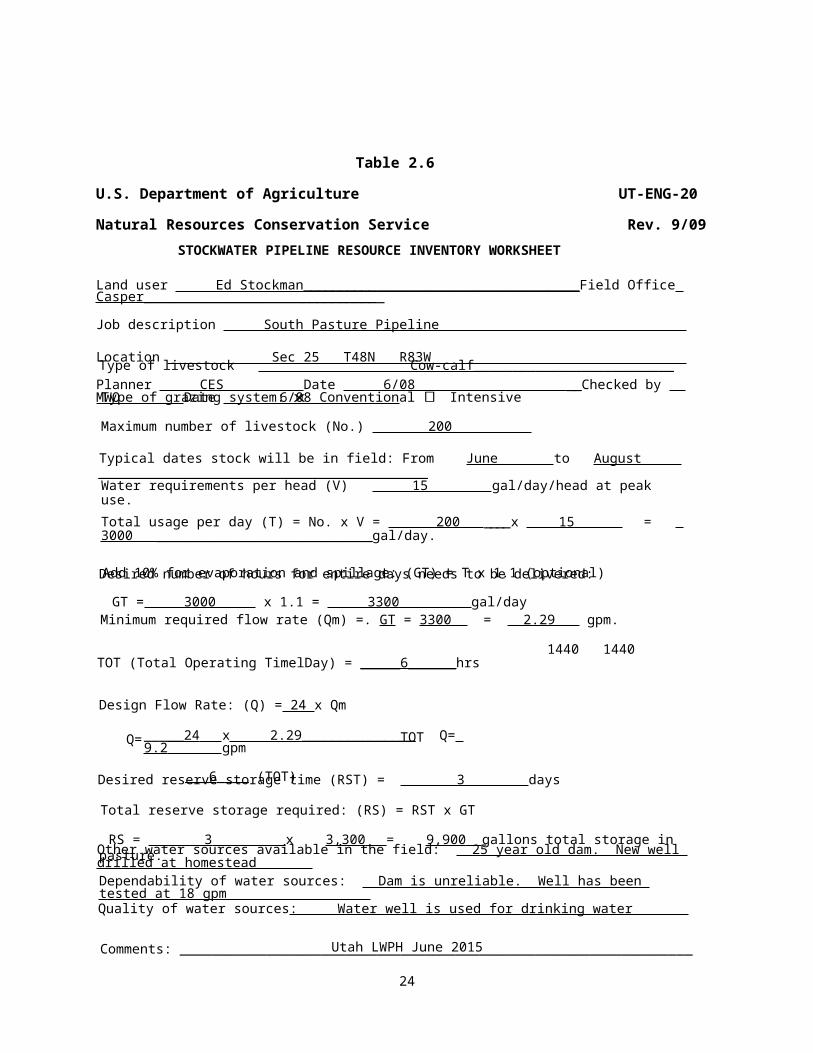
Table 2.6U.S. Department of Agriculture UT-ENG-20 Natural Resources Conservation Service Rev. 9/09
Utah LWPH June 2015
19
TOT (Total Operating TimelDay) = _____6______hrs
Design Flow Rate: (Q) = 24 x Qm
TOT
Add 10% for evaporation and spillage: (GT) = T x 1.1 (optional)
GT = 3000 x 1.1 = 3300 gal/day Minimum required flow rate (Qm) =. GT = 3300 = 2.29 gpm.
1440 1440
Desired number of hours for entire days needs to be delivered:
Type of livestock Cow-calf_______________________________________________
Quality of water sources: Water well is used for drinking water
Total reserve storage required: (RS) = RST x GT
RS = 3 x 3,300 = 9,900 gallons total storage in pasture.
Total usage per day (T) = No. x V = 200 _x 15 _= 3000 _ gal/day.
Type of grazing system: x Conventional Intensive
Land user Ed Stockman ______ ____________ Field Office Casper __________ ______________ _
Job description South Pasture Pipeline
Location Sec 25 T48N R83W
Planner CES Date 6/08 _ Checked by MWO Date 6/08
STOCKWATER PIPELINE RESOURCE INVENTORY WORKSHEET
Comments: _______________________________________________________________________
Dependability of water sources: Dam is unreliable. Well has been tested at 18 gpm
Other water sources available in the field: 25 year old dam. New well drilled at homestead
Desired reserve storage time (RST) = 3 days
Q= _____24 x 2.29 ____ Q= 9.2 ______ gpm
___6____ (TOT)
Water requirements per head (V) 15 gal/day/head at peak use.
Typical dates stock will be in field: From June to August _
Maximum number of livestock (No.) 200
2.6 SOURCE OF WATER
Water for stocklines usually is obtained from wells or springs. Occasionally a surface source is used.
2.6.1 Springs
Springs often have varying degrees of dependability. If it is proposed that an extensive pipeline be run from a spring, the spring should be developed and used for a couple of years to prove its yield and dependability before installing an extensive pipeline.
A minimum two (2) inch pipe diameter should be required in Limestone areas (excessively hard water) to avoid plugging the pipe as a result of hard water deposits after a short time period. Sediment, moss, scum, fish, frogs, mice, and other solids must be excluded from spring pipelines to the extent possible. Where the spring collection system allows entry of this type of material, a spring box with screened pipe inlet must be employed. If a gravel/pipe type of collection system is used, a spring box is usually not necessary, but may be needed to collect significant amounts of water to prevent air from getting into the pipe
2.6.2 Surface Source
Special care must be used to exclude scum and sediment from pipelines using surface water as a source. A screening or filtering device should always be used at the entrance to the pipeline. If sediment is a problem, consider constructing a settling pond at the entrance to the pipeline.
2.6.3 Well
Some wells produce considerable amounts of sand. A sand separator should be installed at the beginning of the pipeline in such a case. Sand separators are available through trickle irrigation supply sources.
2.6.4 Water Quality
The following is taking from “Water Requirements for Pastured Livestock”- Prairie Farm Rehabilitation Administration - Canada
Water quality can affect both total water consumption and the general health of the livestock. Elevated water temperatures and objectionable taste and odor will discourage consumption, and reduced water consumption will, in turn, result in a reduction of feed intake, with the net result being decreased weight gain.
The most common water quality considerations that make water unsuitable for livestock consumption are salinity (the concentration of various kinds of dissolved salts), nitrates, algae, and on rare occasions, other factors such as alkalinity or pesticides.
SalinityDissolved salts can consist of any combination of calcium, magnesium, and sodium chlorides, sulfates and bicarbonates. While all have slightly different effects on animal metabolism, none are particularly worse than any other. Also, the effects of various salts seem to be additive, meaning that a mixture seems to cause the same degree of harm as an equivalent concentration of a single salt. Animals seem
Utah LWPH June 2015
20

to have an ability to adapt to saline water to some extent, but abrupt changes may cause harm. Animals may avoid drinking highly saline water for a number of days, followed by a period of high consumption which causes illness or even death.
NitratesWater analyses generally report nitrates and nitrites together. Nitrate toxicity resulting exclusively from water is rare, but is primarily of concern when combined with forages having high nitrate levels. Nitrates themselves are not very toxic, but bacteria in ruminant animals (dairy and beef cattle) will convert the nitrates to nitrite which reduces the blood’s ability to metabolize oxygen and effectively causes shortness of breath and eventual suffocation.
SulfatesAlthough sulfates can have a laxative effect, there is limited data available regarding their overall effect on livestock health and productivity. It is generally felt that the presence of sulfates should seldom be a problem in livestock water. However, in some rare cases involving very saline water, producers have lost cattle due to a sulfate-related problem.
AlkalinityExcessive alkalinity can cause physiological and digestive upset in livestock, but the level at which it becomes troublesome and its precise effects have not been thoroughly studied. Most waters are alkaline in nature, but fortunately, in only a few instances has it been found that a water source has been too alkaline for livestock. Alkalinity is usually expressed as a concentration of Calcium Carbonate (CaCo3), in parts per million (ppm) or milligrams per liter (mg/L).
Bacterial ContaminationMost water has varying levels of bacterial contamination, but such contamination does not generally cause problems for livestock. Calves can sometimes suffer from Coccidiosis, which can lead to bloody diarrhea, dehydration, weight loss, depression, and sometimes death. Elevated water sources and a reasonable effort at maintaining cleanliness of watering facilities can reduce the potential for problem-causing bacterial contamination.
AlgaeCertain species of algae (blue-green algae) can, under some circumstances, be toxic. At present, there is no test available for these toxins. Other than possible toxicity, the presence of algae in livestock water supplies will affect livestock indirectly by discouraging consumption due to reduced palatability (taste and odor). Algae blooms can be prevented from occurring in a water supply by aerating the water and by preventing excess nutrients (phosphorus, nitrogen) from entering the water. The primary sources of nutrients that contribute to aquatic plant growth are animal excrement, fertilizers and organic matter like grass, hay, leaves and topsoil.
Other FactorsGenerally speaking, any surface water that can support a population of fish should not have dangerous levels of pesticides or naturally-occurring toxic elements like heavy metals. However, there is growing evidence that toxic compounds are present in many surface waters across the prairies. If there is any reason to believe that a water source may have elevated levels of toxic compounds, they can be tested for.
Utah LWPH June 2015
21
It is recommended that water samples from the intended source be analyzed to ensure that any problems relating to water quality can be avoided.
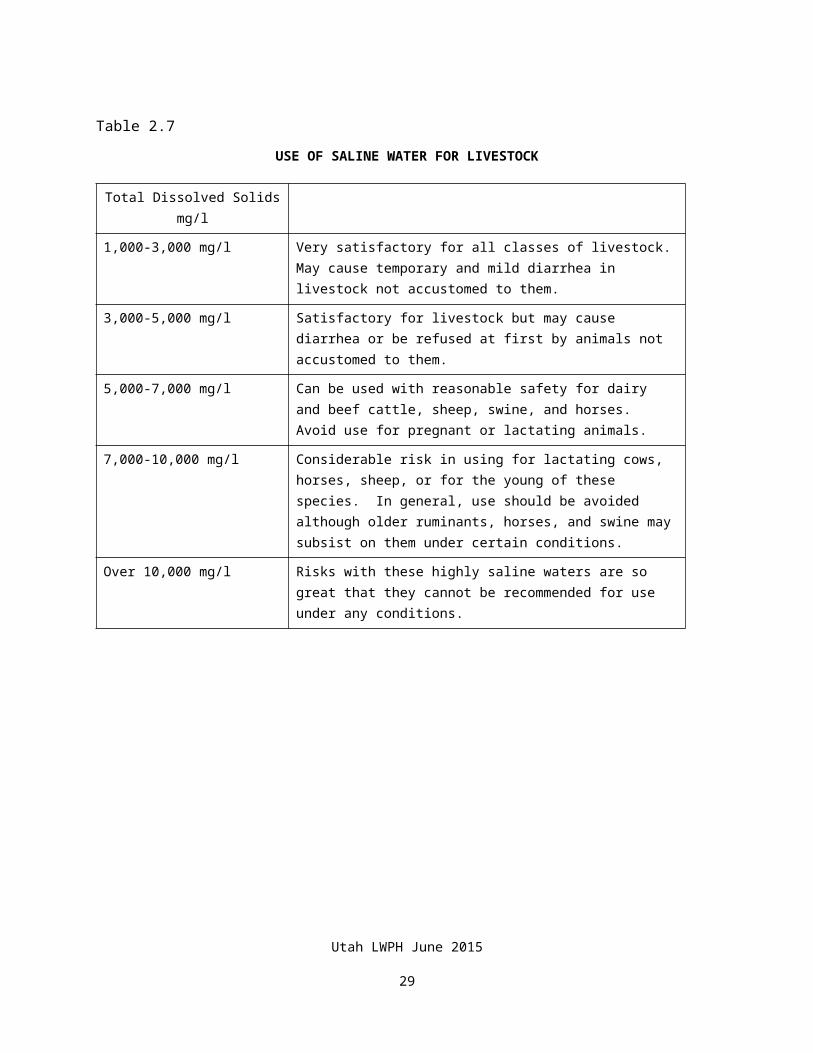
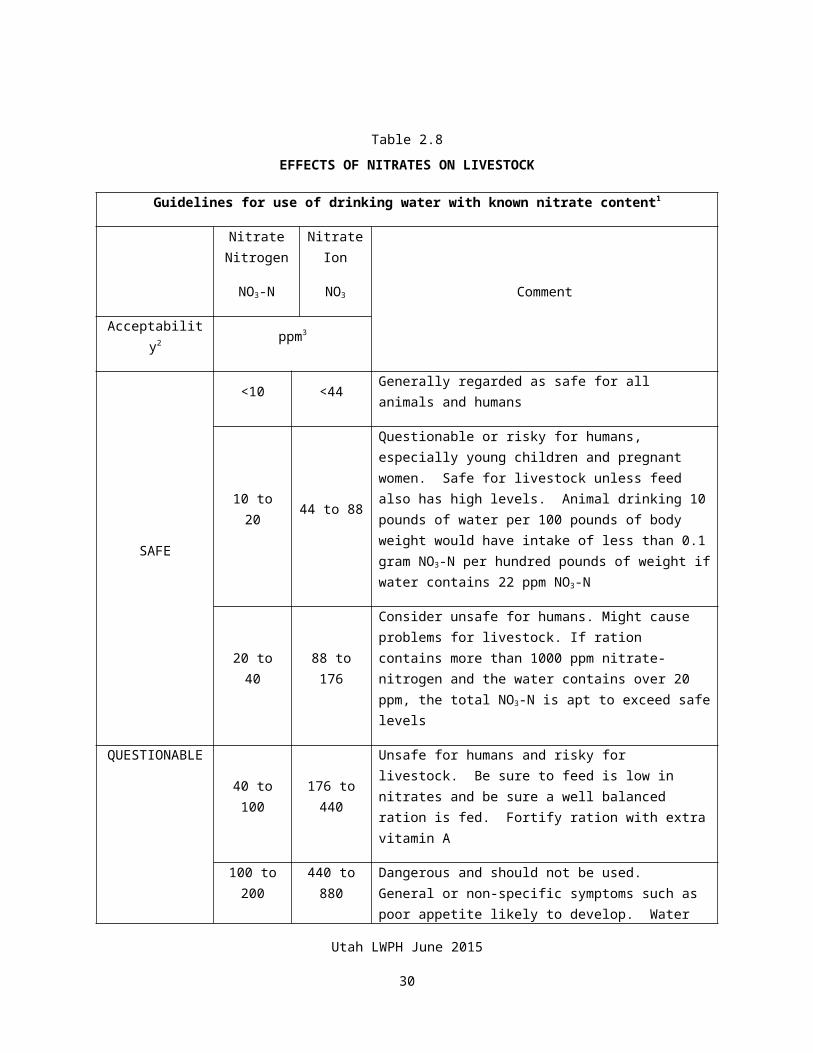
The most common factors to consider are salinity and nitrates. Tables 2.7 and 2.8 describe tolerable levels of these elements.
Utah LWPH June 2015
22

Table 2.7
USE OF SALINE WATER FOR LIVESTOCK
Total Dissolved Solids mg/l
1,000-3,000 mg/l Very satisfactory for all classes of livestock. May cause temporary and mild diarrhea in livestock not accustomed to them.
3,000-5,000 mg/l Satisfactory for livestock but may cause diarrhea or be refused at first by animals not accustomed to them.
5,000-7,000 mg/l Can be used with reasonable safety for dairy and beef cattle, sheep, swine, and horses. Avoid use for pregnant or lactating animals.
7,000-10,000 mg/l Considerable risk in using for lactating cows, horses, sheep, or for the young of these species. In general, use should be avoided although older ruminants, horses, and swine may subsist on them under certain conditions.
Over 10,000 mg/l Risks with these highly saline waters are so great that they cannot be recommended for use under any conditions.
Utah LWPH June 2015
23
Table 2.8
EFFECTS OF NITRATES ON LIVESTOCK
Guidelines for use of drinking water with known nitrate content1
Nitrate Nitrogen
NO3-N
Nitrate Ion
NO3Comment
Acceptability2 ppm3
SAFE
<10 <44 Generally regarded as safe for all animals and humans
10 to 20 44 to 88
Questionable or risky for humans, especially young children and pregnant women. Safe for livestock unless feed also has high levels. Animal drinking 10 pounds of water per 100 pounds of body weight would have intake of less than 0.1 gram NO3-N per hundred pounds of weight if water contains 22 ppm NO3-N
20 to 40 88 to 176
Consider unsafe for humans. Might cause problems for livestock. If ration contains more than 1000 ppm nitrate-nitrogen and the water contains over 20 ppm, the total NO3-N is apt to exceed safe levels
QUESTIONABLE
40 to 100 176 to 440Unsafe for humans and risky for livestock. Be sure to feed is low in nitrates and be sure a well balanced ration is fed. Fortify ration with extra vitamin A
100 to 200 440 to 880
Dangerous and should not be used. General or non-specific symptoms such as poor appetite likely to develop. Water apt to be contaminated with other foreign substances. When allowed free choice to cows on a good ration, acute toxicity not likely
UNSAFE4 Over 200 Over 880
Don’t Use. Acute toxicity and some death losses might occur in swine. Probably to much total intake for ruminants on usual feed. In research trials, water containing up to 300 ppm NO3-N has been fed to swine and water containing over 1000 ppm of NO3-N has been fed to lambs without causing any measurable growth or reproductive problems. However, for farm recommendation the suggestions given above are purposely conservative.
1 Undersander, Combs, Shave and Thomas, Nitrate Poisoning in Cattle, Sheep and Goats, University of Wisconsin Extension Paper
Utah LWPH June 2015
24
2 Guide to the Use of Waters Containing Nitrate for Cattle (National Academy of Sciences, 1974)
3 Milligrams per liter (mg/l) is equivalent to parts per million (ppm)
4 Cattle should not have access to these waters
For additional information related to water quality see the MU Guide G 381 from the University of Missouri-Columbia “Water Quality for Livestock Drinking” located at the following web address: http://extension.missouri.edu/explorepdf/envqual/eq0381.pdf
Utah LWPH June 2015
25
CHAPTER 3
PIPELINE SYSTEM TYPES
TABLE OF CONTENTS
PART 3.1 GENERAL 3-1PART 3.2 GRAVITY SYSTEM 3-1
3.2.1 Low Head Gravity System 3-13.2.2 High Head Gravity System 3-3
PART 3.3 AUTOMATIC PRESSURE SYSTEMS 3-3PART 3.4 TIMED OR MANUAL PRESSURE SYSTEMS 3-3PART 3.5 FLOAT SWITCH OPERATED PRESSURE SYSTEM 3-3PART 3.6 ALL YEAR VERSUS SUMMER PIPELINES 3-8
3.6.1 Summer Pipeline 3-83.6.2 All year Pipeline 3-8
FIGURES
Figure 3.1 Typical Low Head Gravity Systems 3-2Figure 3.2 Typical High Head Gravity System 3-4Figure 3.3 Typical Automatic Pressure System 3-5Figure 3.4 Typical Manual or Timer Operated System 3-6Figure 3.5 Typical Float Switch Operated System 3-7
Utah LWPH June 2015
26
CHAPTER 3 -- PIPELINE SYSTEM TYPES
3.1 GENERALThere are several types of stockwater pipeline systems that we need to know how to design. More than one of these system types may be incorporated in a single system.
3.2 GRAVITY SYSTEMA gravity pipeline system is one in which the water supply surface is higher than all points in the pipeline and no pump is required. This type of system can generally be subdivided into two subtypes: (1) The low head gravity system and (2) the high head gravity system.
3.2.1 Low Head Gravity SystemLow head is loosely defined as below 20 psi at all points in the line. An example of a typical low head gravity pipeline is shown in Figure 3.1. In this type of system the flow rate is usually whatever the spring or other water supply will provide.
It is important to make sure there can be no air locks in the system; and since the pipe is usually shallow, design the pipeline so that it freely drains when not in use. A low head gravity system is usually characterized by being installed on a positive grade in the direction of flow for its entire length. There is not enough pressure in the system to properly operate air valves, although stand pipes may be used.
Utah LWPH June 2015
27
Figure 3.1TYPICAL LOW HEAD GRAVITY SYSTEMS
System with Downhill Grade in Direction of Flow
Utah LWPH June 2015
28

System with Undulating Grade
Utah LWPH June 2015
29
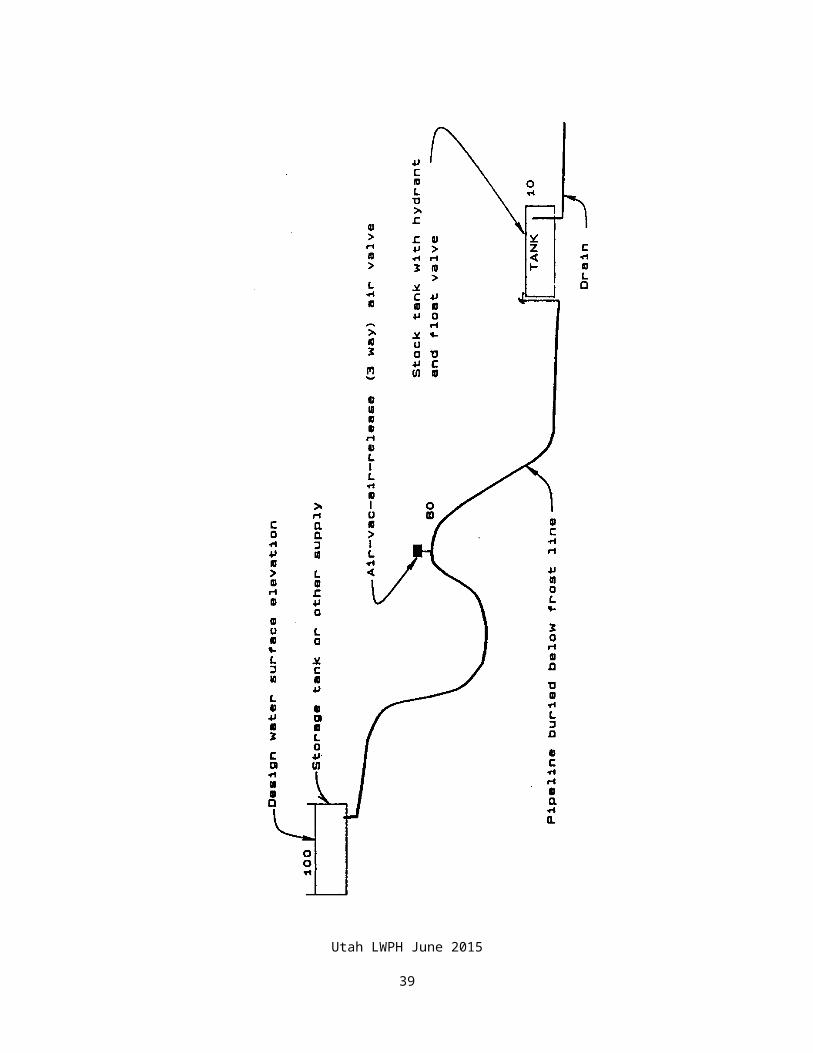
3.2.2 High Head Gravity SystemFigure 3.2 illustrates a typical high head gravity system. This type of system is often located at the end of a pumped pipeline and begins at a storage tank located at the top of a hill. Float valves are used on all tanks to control flow. Air locks at significant high points in the pipeline are prevented by installing air valves or vents.
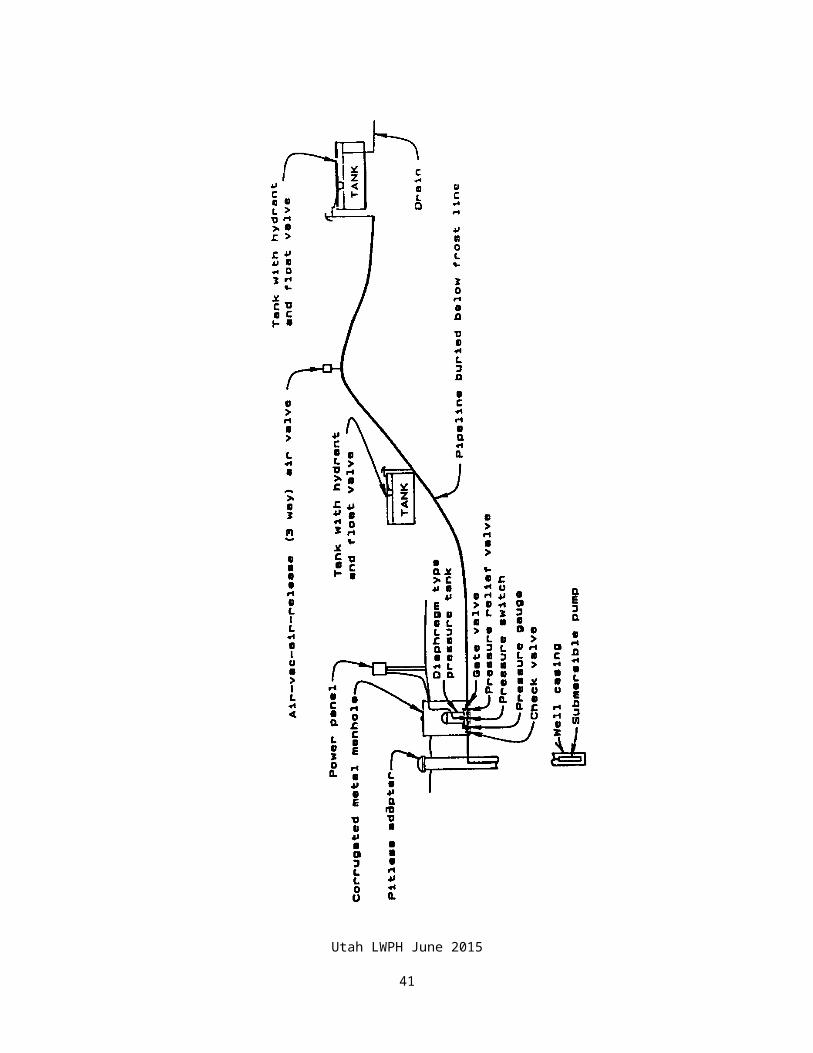
3.3 AUTOMATIC PRESSURE SYSTEMSPumped flow in an automatic pressure system is controlled by a pressure switch. A pressurized tank stores water between cut-in and cut-out cycles. Figure 3.3 illustrates a common configuration for this type of system. The advantages of an automatic pressure type system are 1) it does not take constant attention and 2) a minimum amount of power and water are used.
3.4 TIMED OR MANUAL PRESSURE SYSTEMSA timed pressure pipeline system is one which uses a pump to pressurize the system and a timer to turn the pump on or off. A manual system is one in which a manually operated switch is used to turn the pump on or off.
Both of these systems operate in the same way and are illustrated in Figure 3.4. There is an overflow at the high point in the system which wastes excess water. At all other tanks float valves or manually operated hydrants are used to keep the tanks full.
Timer or manually operated systems are usually used where high pressures make it impractical to use an automatic pressure system. Water waste is minimized by observation of stockwater usage and adjusting the pump operating times during the season. As a safety measure, it is usually advisable to provide additional water storage at various points in the system.
A large storage tank is usually located at the high point in the pipeline. Water flows from the storage tank back toward the pump during the periods when the pump is off.
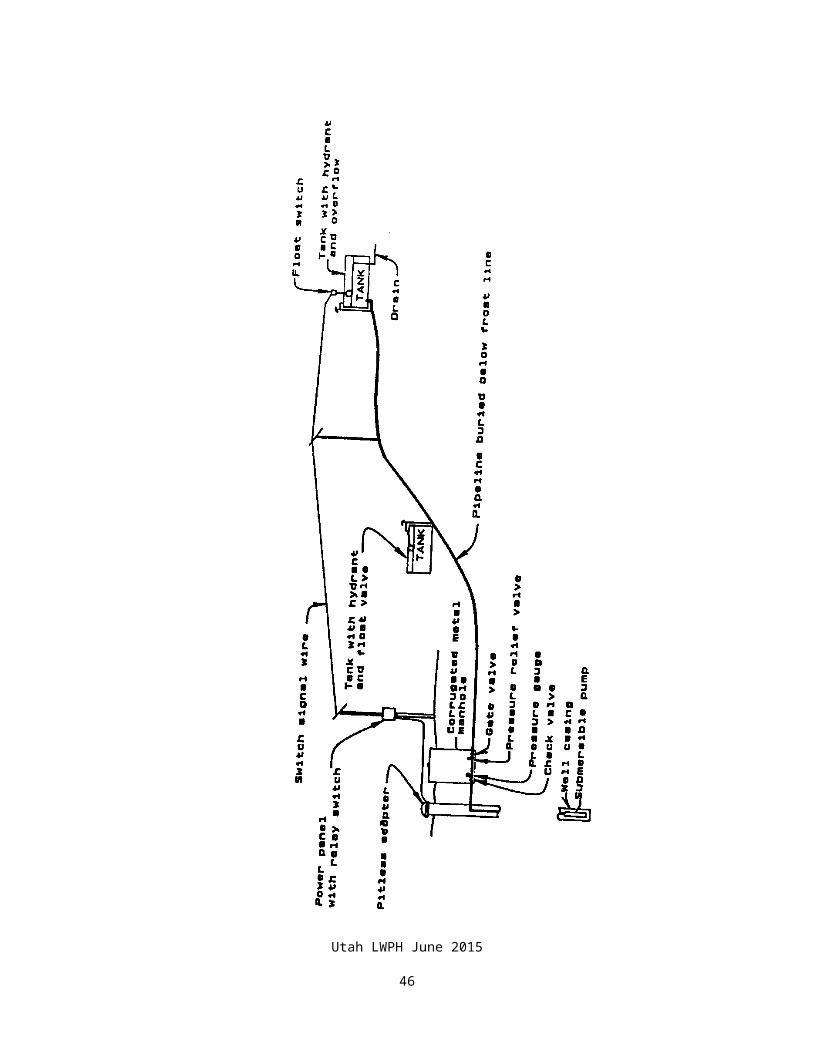
3.5 FLOAT SWITCH OPERATED PRESSURE SYSTEMA float switch operated pressure system is a pumped pipeline system in which the pump is turned on or off with a float switch located at the highest tank in the pipeline.
This type of system requires that an electric control wire run between the pump and storage tank. The wire can either be an overhead or buried line. The control wire is sometimes buried in the same trench as the pipeline.
The switch operated system is used instead of an automatic pressure system where pressures are too high for pressure tanks. The advantage of this system is that it does not waste water and power. The disadvantage is that an electric connecting wire and switching equipment can be costly.
Figure 3.5 shows a typical switch operated system. Switches are low voltage and telephone wire can be used as connecting wire. Used overhead telephone wire and poles could also be used.
Utah LWPH June 2015
30
Utah LWPH June 2015
31
Figure 3.2TYPICAL HIGH HEAD GRAVITY SYSTEM
Utah LWPH June 2015
32
Utah LWPH June 2015
33
Figure 3.3TYPICAL AUTOMATIC PRESSURE SYSTEM
Utah LWPH June 2015
34
Utah LWPH June 2015
35
Figure 3.4
Utah LWPH June 2015
36
TYPICAL MANUAL OR TIMER OPERATED SYSTEM
Utah LWPH June 2015
37
Figure 3.5
Utah LWPH June 2015
38

TYPICAL FLOAT SWITCH OPERATED SYSTEM
Utah LWPH June 2015
39
3.6 YEAR ROUND VERSUS SUMMER PIPELINESA pipeline that is only used in the summer can be buried at a shallow depth and drained during freezing weather. Such pipelines are usually buried 18 to 30 inches deep. By contrast, year round pipelines are buried below frost depth, usually 4.5 to 5.5 feet or more in Utah.
3.6.1 Summer PipelineThe decision as to whether or not to use a shallow buried pipeline is most often dictated by the depth of soils in a given area. Shallow soil over bedrock and cobbly soil makes it difficult or impossible to bury a pipeline below frost depth.
It is usually advantageous to bury a pipeline below frost depth in terrain that will allow this, even if the line is only going to be used in the summer. A deep line will not require draining every winter and is not as critical with respect to installation grades.
Shallow lines must be laid to a grade which will allow draining at low spots. Gravity, pumpout, or seepage pit-type drains must be installed at all low points.
Because of the necessity of draining shallow pipelines, more care must be taken during their installation. The pipe must be graded to a tolerance such that low points in the pipe are not more than about ¾ of a pipe diameter below grade.
Shallow lines are often buried by the "Pull-in" method. This is done with a large tractor and ripper with flexible pipe on a reel attached to the ripper and fed out behind. Flexible polyethylene pipe is usually used in this type of installation.
Where shallow pipelines cross watercourses, they are often suspended in air rather than buried. Suspended lines are usually made of steel pipe.
3.6.2 Year Round PipelineFor a pipeline to be operational during both summer and winter, the pipe must be buried below the frost line. The actual anticipated frost line and depth that the pipe should be buried depends upon several factors which include:
Maximum low temperature and number of freezing days in a year
Soil type and cover
Sun exposure
Moisture content of overlying soil
Whether there is continuous flow in the pipeline
Temperature of water source.
It is difficult to quantify and determine the actual effect of some of these factors. For situations where there is not continuous flow in the pipeline during the winter months, refer to Extreme Frost Depth Map. North slope exposure, high altitudes, and moist soils are factors indicating
Utah LWPH June 2015
40

the need for burying the pipe deeper. Even though the pipe is buried to these depths, it could still freeze in some portions of the line.
Utah LWPH June 2015
41
Because of equipment limitations it is difficult to bury a pipeline deeper than six feet. Therefore, the choices are to bury the pipeline a minimum of five feet in most normal conditions and six feet or deeper where exposure, elevation, long periods of stagnant water and/or moist conditions exist.
Appurtenances for all year pipelines must be designed in a way that will reduce the chance of frozen pipelines during cold weather. Valves of all kinds must be protected from freezing. This is usually done by installing them in a covered manhole or access hole. Frost free hydrants must be used. Float valves can be installed under a protective cover or in an insulated well.
Utah LWPH June 2015
42

CHAPTER 4
PIPELINE ROUTE SELECTIONAND SURVEYS
CHAPTER 4 - PIPELINE ROUTE SELECTION AND SURVEYS
TABLE OF CONTENTS
PART 4.1 ROUTE CONSIDERATIONS 4-1
PART 4.2ROUTE SURVEYS-GENERAL 4-1
PART 4.3ENGINEERING INSTRUMENT SURVEY 4-1
PART 4.4GLOBAL POSITIONING SURVEY 4-2
Utah LWPH June 2015
43

CHAPTER 4 -- PIPELINE ROUTE SELECTION AND SURVEYS
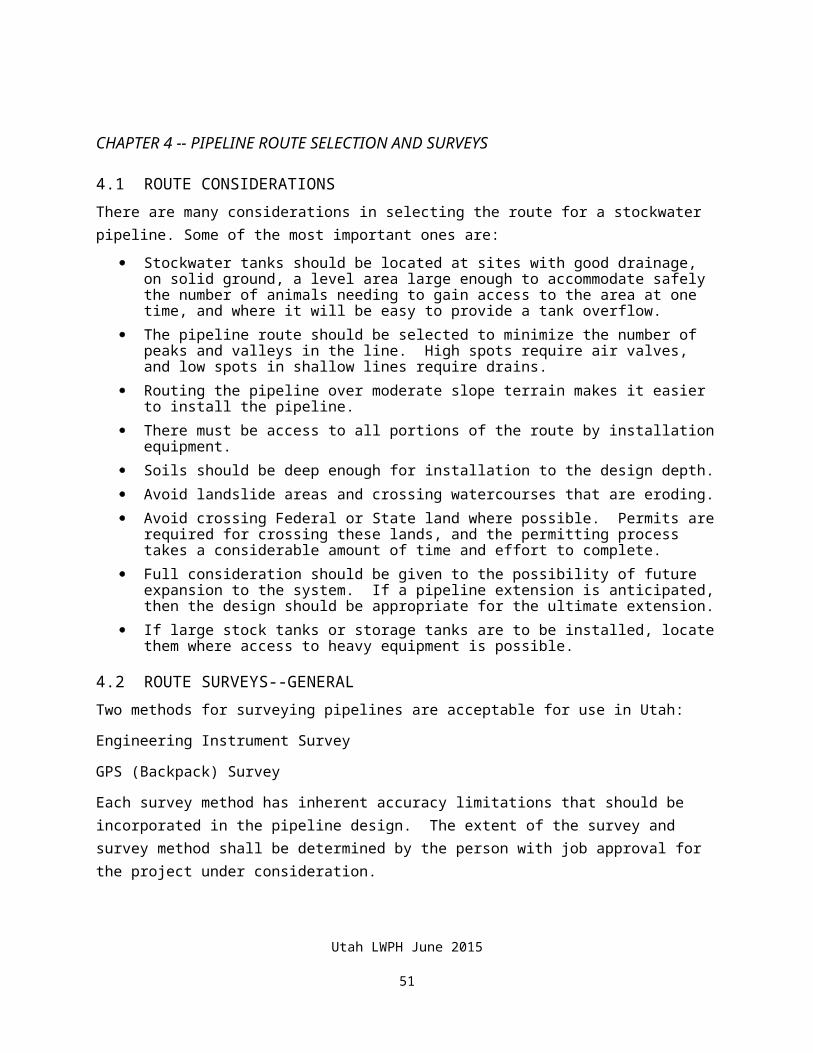
4.1 ROUTE CONSIDERATIONSThere are many considerations in selecting the route for a stockwater pipeline. Some of the most important ones are:
Stockwater tanks should be located at sites with good drainage, on solid ground, a level area large enough to accommodate safely the number of animals needing to gain access to the area at one time, and where it will be easy to provide a tank overflow.
The pipeline route should be selected to minimize the number of peaks and valleys in the line. High spots require air valves, and low spots in shallow lines require drains.
Routing the pipeline over moderate slope terrain makes it easier to install the pipeline.
There must be access to all portions of the route by installation equipment.
Soils should be deep enough for installation to the design depth.
Avoid landslide areas and crossing watercourses that are eroding.
Avoid crossing Federal or State land where possible. Permits are required for crossing these lands, and the permitting process takes a considerable amount of time and effort to complete.
Full consideration should be given to the possibility of future expansion to the system. If a pipeline extension is anticipated, then the design should be appropriate for the ultimate extension.
If large stock tanks or storage tanks are to be installed, locate them where access to heavy equipment is possible.
4.2 ROUTE SURVEYS--GENERALTwo methods for surveying pipelines are acceptable for use in Utah:
Engineering Instrument Survey
GPS (Backpack) Survey
Each survey method has inherent accuracy limitations that should be incorporated in the pipeline design. The extent of the survey and survey method shall be determined by the person with job approval for the project under consideration.
4.3 ENGINEERING INSTRUMENT SURVEYAn engineering instrument survey can be used for all livestock pipeline designs. It should be used on all designs where available pressure head is small or where many small undulations in the terrain make it difficult to determine where the design “critical points” are located.
The following are the most common engineering instruments used to survey for livestock pipelines:
Automatic Level
Utah LWPH June 2015
44

Theodolite
Total station
GPS (Survey Grade)
While all of these methods are relatively accurate, surveys with automatic levels or theodolites require more time because of sight distance limitations and required processing of the survey data. Total station and survey grade GPS surveys will generally be the most accurate and time efficient, especially on long pipelines.
The type of survey which should be used will depend on which one will give the degree of accuracy necessary and which will be the most time and cost effective. For additional guidance on survey accuracy, refer to Chapter 1 of Part 650, Engineering Field Handbook.
4.4 GLOBAL POSITIONING SYSTEM SURVEYGPS is a widely acceptable method of surveying livestock pipelines where terrain is suitable to its limitations. Surveys are normally conducted using a GPS receiver mounted to a survey rod carried by the surveyor, to a backpack worn by the surveyor, or fixed in an approved manner to an ATV.
GPS surveys are defined as (1.) Survey Grade using an L1/L2 GPS receiver with differential correction, and (2.) Non-Survey Grade where no differential correction is used in the receiver.
Non-Survey Grade GPS systems are an acceptable method of performing 4th order planning reconnaissance surveys of livestock pipelines.
Survey Grade systems will be used to conduct design, construction layout, and certification surveys.
Utah LWPH June 2015
45

CHAPTER 5
PIPE MATERIALS SELECTION
CHAPTER 5 - PIPE MATERIALS SELECTION
TABLE OF CONTENTS
PART 5.1 GENERAL 5-1PART 5.2 PLASTIC PIPE CHARACTERISTICS 5-1
5.2.1 Pressure Rating of Pipe 5-15.2.2 How Temperature Affects Pressure Rating 5-15.2.3 Freezing Water in Pipe 5-2
PART 5.3 POLYVINYL CHLORIDE (PVC) PLASTIC PIPE 5-2PART 5.4 POLYETHYLENE (PE) PLASTIC PIPE 5-3PART 5.5 ACRYLONITRILE-BUTADINE-STYRENE (ABS) PLASTIC PIPE 5-3PART 5.6 POLYBUTYLENE (PB) PLASTIC PIPE 5-4PART 5.7 STEEL PIPE 5-4PART 5.8 FRICTION LOSS IN PIPING SYSTEM AT THE PUMP 5-4PART 5.9 PIPE FRICTION LOSS TABLES 5-6PART 5.10 PVC PIPE FITTINGS 5-21
FIGURES
Figure 5.1 Estimate Friction Loss at Well 5-5
TABLES
Table 5.1 PVC Plastic Pipe Reduction Due to Temperature 5-2Table 5.2 Friction Loss PVC-SDR Pipe 160 psi 5-7Table 5.3 Friction Loss PVC-SDR Pipe 200 psi 5-8Table 5.4 Friction Loss PVC-SDR Pipe 250 psi 5-9Table 5.5 Friction Loss PVC-SDR Pipe 315 psi 5-10Table 5.6 Friction Loss PVC-IPS Pipe Schedule 40 5-11Table 5.7 Friction Loss PVC-IPS Pipe Schedule 80 5-12Table 5.8 Friction Loss PVC-IPS Pipe Schedule 120 5-13Table 5.9 Friction Loss Polyethylene (PE) Pipe 5-14Table 5.10 Friction Loss High Density Polyethylene (HDPE) 5-15Table 5.11 Friction Loss IPS-ID Polybutylene Water Service 5-16
Utah LWPH June 2015
46
Pipe, 160 psiTable 5.12 Friction Loss CPS Polybutylene Water Service 5-17
Pipe 160 psiTable 5.l3 Friction Loss CPS Polybutylene Water Service 5-18
Pipe 250 psiTable 5.14 Friction Loss Black or Galvanized Steel Pipe 5-19
Schedule 40Table 5.15 Friction Loss Black or Galvanized Steel Pipe 5-20
Schedule 80Table 5.16 Estimated Upper Limit Working Pressures for 5-21
Schedule 40 and Schedule 80 PVC Fittings
Utah LWPH June 2015
47
CHAPTER 5 -- PIPE MATERIALS SELECTION
5.1 GENERALThere are several types of pipe that may be used in stockwater systems. The most commonly used types are discussed below. Usually, pipe cost dictates the type of pipe that is used.
When designing a pipeline, it is important to know the type of pipe to be used. Internal pipe diameters vary depending on material type and pressure rating for a given pipe size. Due to differing internal cross sectional area and friction loss factors, friction loss in long pipelines can differ considerably from one type and rating of pipe to another.
5.2 PLASTIC PIPE CHARACTERISTICS
5.2.1 Pressure Rating of PipePlastic pipe is rated at approximately half its tested rupture strength. This means that under normal temperature conditions, it can withstand occasional surge pressures up to twice its rated pressure.
Plastic pipe will weaken under repeated cycles of pressures in excess of those for which it is rated. The higher the surge pressure, the faster the pipe will weaken. For this reason, it is important to design the pipe system so that normal operating pressures are less than rated pressure of the pipe. The system should be designed and operated to limit the number and severity of pressure surges. Other sections of this handbook describe ways to limit surge pressures.
For pressure design criteria, see Conservation Practice Standard Pipeline (516) of the FOTG, Section IV. For plastic pipe, the maximum working pressure shall not exceed 72% of the pressure rating of the pipe. .5.2.2 How Temperature Affects Pressure Rating
The pressure rating of plastic pipe is determined at 73.4 degrees Fahrenheit (F). Strength of plastic pipe decreases as water temperatures increase. In cases where warm well water is used, or where the pipe is exposed to sunlight, water temperatures may exceed 73.4 degrees F. In these cases, the effective pressure rating of the pipe must be reduced.
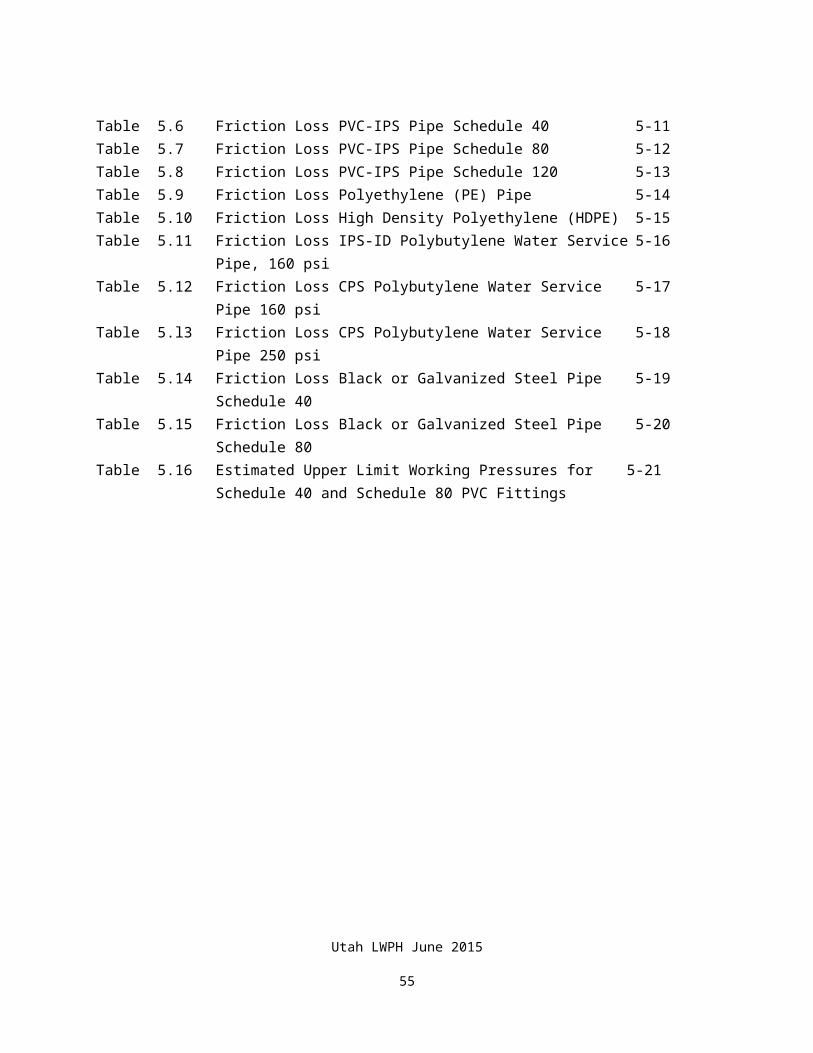
Table 5.1 lists the temperature reduction factors for PVC pipe.
Utah LWPH June 2015
48
Table 5.1PVC PLASTIC PIPE RATING REDUCTION DUE TO TEMPERATURE
Temperature
Degrees F
Multiply Pressure
Rating by:
73.4 1.00
80 .93
90 .77
100 .67
110 .51
120 .43
130 .33
140 .23
5.2.3 Freezing of Water in PipePlastic pipe containing static water should be drained when temperatures below 32 degrees F are expected. If the water is moving, freezing is unlikely above 0 degrees Fahrenheit.
If freezing does occur in the line, the pipe material will influence the severity of damage. In changing phase from liquid to ice, water expands approximately 10% by volume. Some plastic pipe cannot withstand the required 3.2% linear elongation, but most will.
Pipes most likely to be damaged by freezing water are those made of rigid materials, which include PVC and CPVC.
Pipe most unlikely to be damaged by freezing water include the cellulose-aceto-butyrate, acrylonritrile-butadine-styrene, styrene rubber, and polyethylene materials. All of these pipes have elongation and recovery properties which, in most cases, enable it to expand and recover without permanent damage.
Although some pipe material can usually withstand freezing without damage, no pipeline should be designed to freeze while full of water. Resistant pipes can be used in areas of severe exposure as an extra safety factor against damage by freezing. An excellent example of this is a shallow pipeline leading from a spring.
Utah LWPH June 2015
49
5.3 POLYVINYL CHLORIDE (PVC) PLASTIC PIPEPolyvinyl Chloride (PVC) is a commonly used type of pipe used for stockwater pipelines. This is a rigid plastic pipe that, in the configuration used for stockwater pipelines, usually comes in 20-foot lengths. Connections are usually made with glued fittings, although rubber gasketed joints are sometimes used. Follow manufacturers’ recommendation for solvent selection and proper procedure for solvent welding of the PVC.
When subject to long-term exposure to ultraviolet radiation (sunlight), PVC pipe will suffer slow deterioration. PVC pipe should be buried or installed in an enclosure. If PVC must be exposed, it should be coated or wrapped. The coating may be exterior latex paint. Make sure the pipe is thoroughly cleaned before painting.
Exposed pipe should be protected from mechanical damage by livestock or other hazards. Plastic pipe is particularly vulnerable when cold, as it will easily shatter.
There are two types of PVC pipe. Standard Dimension Ratio-Pressure Rated pipe (SDR-PR) is manufactured under specification ASTM D2241. PVC Iron Pipe Size (PVC-IPS) pipe is manufactured under specification ASTM D1785.
SDR-PR rated pipe is rated using standard dimension ratio and pressure as factors. This is the most common pipe type used in stockwater pipelines in Utah. Tables 5.2 through 5.5 list available sizes, pressure ratings and friction loss factors.
PVC-IPS pipe has various pressure ratings depending on nominal diameter and schedule designations. Schedule 40, 80, and 120 pipe are available. Tables 5.6 through 5.8 list available sizes, pressure ratings, and friction loss factors.
For both of these types of pipe, the outside diameter is constant and the inside diameter varies.
5.4 POLYETHYLENE (PE) PLASTIC PIPEPolyethylene (PE) pipe is the second most common pipe used in stockwater pipelines. It is flexible, comes in coils and is used for most "pull-in" type systems. Where pipe is installed in trenches, it is harder to lay flat in the trench than PVC pipe. Since it comes in coils, PE pipe requires fewer fittings. Connecting this type of pipe is usually done with "stab" type fittings held together with stainless steel band clamps. Frost heave in shallow pipelines tends to pull these joints apart. Double clamping is usually necessary to combat this problem.
There are several types of PE pipe. The one most commonly used in stockwater pipelines is a controlled inside diameter version rated by standard thermoplastic dimension ratio and pressure rating (SIDR-PR) and is manufactured under specification ASTM D2239. SIDR 15. 100 psi pipe is usually the most available polyethylene pipe.
Table 5.9 shows available sizes, pressure ratings, and friction loss factors.
A high density polyethylene pipe (HDPE) is available which can be used for above or below ground installations. This is the same type of pipe as used in hose reel type irrigation sprinkler systems. The material is tough, will withstand long term exposure to sunlight, and may be used above ground where below ground installations are not feasible. In some cases above ground
Utah LWPH June 2015
50
installation may be preferable (i.e. archeology, environmental concerns, or extremely rocky soils). When used above ground, it must be tied down so it will not pull apart; and it must be protected or placed in a manner which will prevent mechanical damage, damage due to vandalism, and damage from wild fire. Provisions should be made during installation to allow for expansion and contraction of the pipe. Above ground installation should be the exception and not the norm and where possible soil should be mounded over the pipe to provide the needed protection. Appropriate approvals should be obtained for such installations.
This material is tough, flexible, and resistant to freeze damage. Although sometimes proposed for shallow non-drained pipelines, it should not be used in this way. This pipe will usually withstand freezing without damage, but the system should not be knowingly designed to freeze while water is in the line.
Table 5.10 tabulates available sizes, pressure ratings, and friction loss factors.
5.5 ACRYLONITRILE-BUTADIENE-STYRENE (ABS) PLASTIC PIPEAlthough listed in the standards as an acceptable pipe material, ABS pipe is used little in the transmission pipeline portions of stockwater pipelines. ABS pipe is frequently used in stockwater systems as drain, vent, and waste system components. This black pipe has the advantages of being tough with good strength and stiffness. It is not tolerant to ultraviolet light, so it should be painted or wrapped if exposed to sunlight. It ranges in size from 1/8-inch to 12 inches in diameter.
Utah LWPH June 2015
51
5.6 POLYBUTYLENE (PB) PLASTIC PIPEPolybutylene pipe, which is an alternative now sometimes used in household plumbing and underground water service, is occasionally used in stockwater pipeline applications.
This material is tough, flexible, and resistant to freeze damage. Although sometimes proposed for shallow non-drained pipelines which freeze in the winter, it should not be used in this way. This pipe will usually withstand freezing without damage, but the system should not be designed to freeze with water in the line.
Tables 5.11 through 5.13 tabulate available sizes, pressure ratings, and friction loss factors.
5.7 STEEL PIPESteel pipe is often used in system plumbing next to the pump. It is rarely used in main parts of the pipeline in buried installations.
Steel pipe is used in buried applications only as a last resort due to its high cost, high friction loss, and because it easily corrodes.
Galvanized pipe should be used for exposed installations such as at cable supported aerial stream crossings, and as plumbing in manholes. When buried, steel pipe should always be coated and wrapped. This is due to the corrosive nature of most soils in Utah.
Some water in Utah is highly corrosive. When long sections of steel pipe are used which cannot be easily replaced, then a sample of the water supply should be taken and a Lanelier Index run on the sample. If the test shows the water to be highly corrosive, unlined steel pipe should not be used. Analysis by the Lanelier Index is beyond the scope of this handbook and should be referred to State or Field Engineer with knowledge of its use.
Occasionally, steel pipe must be used for very high pressure pipelines where plastic pipe is not available with adequate pressure ratings. Operating pressures in steel pipe should not exceed 50 percent of the rated bursting pressure. Tables 5.14 through 5.15 tabulate pressure ratings corrected to 50 percent of rated bursting pressure. These tables also show available sizes and friction loss factors.
5.8 FRICTION LOSS IN PIPING SYSTEM AT THE PUMPFriction losses in the plumbing at the pump are significant enough that it should be considered when determining total dynamic pumping head. The typical pipe material used between a submersible pump and pressure tank is polyethylene pipe with some steel pipe at the pressure tank. High pressure systems sometimes use steel pipe between pump and pressure tank.
The plumbing elements for an automatic pressure system and a manual or timed system are about the same. Figure 5.1 is a graph which shows estimated friction loss values that can be used for most pumped flow installations.
Utah LWPH June 2015
52
Figure 5.1 assumes the following conditions:
100 feet pump depth in wellPE pipe between pump and pressure tank
(100 ft + 25 ft to manhole/tank = 125 ft length of PE pipe) 15 feet of galvanized steel pipe at manhole 4 90 degree elbows in steel pipe 1 "T" in steel pipe 1 open gate valve in steel pipe 1 check valve in steel pipe.
The friction loss in PE pipe is so low that well depths different than the assumed 100 feet will make little difference in total friction loss. If the total plumbing system is significantly different than assumed above, special calculations should be performed. If steel pipe is used to drop the pump in the well, special computations must be made.
Figure 5. 1ESTIMATED FRICTION LOSS AT WELL
Utah LWPH June 2015
53

Curve Type
(1) 1" PE connector pipe, ¾” steel plumbing at tank
(2) 1-¼” PE connector pipe, ¾" steel plumbing at tank
(3) 1-¼" PE connector pipe, 1" steel plumbing at tank
(4) 1-½" PE connector pipe, 1" steel plumbing at tank
(5) 2" PE connector pipe, 1" steel plumbing at tank
(6) 2-½" PE connector pipe, 1-¼" steel plumbing at tank
5.9 PIPE FRICTION LOSS TABLESThe following tables are based on friction loss by the Hazen Williams formula. The form of the equation used is:
H f =L ( gpmC )
1 .85185 10. 4057d i
4 . 87037
C = Hazen-Williams friction loss factor
gpm = Flow rate in gallons per minute
di = Pipe inside diameter
L = Length of pipe segment (100-feet used in calcs).
Utah LWPH June 2015
54
Table 5.2PVC-SDR PIPE
FRICTION LOSS ft/100 ftSDR 26, Pressure Rating = 160 psi @ 73.4 F
Hazen Williams C = 150
Q
gallons
per min.
1 inch 0.0078 A 1.195 ID
1-1/4 inch
0.0128 A
1.532 ID
1-1/2 inch
0.0168 A
1.754 ID
2 inch
0.0262 A
2.193 ID
2-1/2 inch
0.0384 A
2.655 ID
3 inch
0.0569 A
3.230 ID
3-1/2 inch
0.0743 A
3.692 ID
4 inch
0.0941 A
4.154 ID
1 0.0408 0.0122 0.0063 0.0021 0.0008 0.0003 0.0002 0.0001
2 0.1473 0.0439 0.0227 0.0077 0.0030 0.0012 0.0006 0.0003
3 0.3120 0.0931 0.0481 0.0162 0.0064 0.0025 0.0013 0.0007
4 0.5316 0.1585 0.0820 0.0276 0.0109 0.0042 0.0022 0.0012
5 0.8036 0.2397 0.1240 0.0418 0.0165 0.0063 0.0033 0.0019
6 1.1264 0.3359 0.1738 0.0585 0.0231 0.0089 0.0046 0.0026
7 1.4985 0.4469 0.2312 0.0779 0.0307 0.0118 0.0062 0.0035
8 1.9189 0.5722 0.2960 0.0997 0.0393 0.0151 0.0079 0.0044
9 2.3866 0.7117 0.3682 0.1241 0.0489 0.0188 0.0098 0.0055
10 2.9008 0.8651 0.4475 0.1508 0.0594 0.0229 0.0119 0.0067
11 3.4607 1.0321 0.5339 0.1799 0.0709 0.0273 0.0142 0.0080
12 4.0658 1.2125 0.6273 0.2113 0.0833 0.0321 0.0167 0.0094
13 4.7154 1.4062 0.7275 0.2451 0.0966 0.0372 0.0194 0.0109
14 5.4091 1.6131 0.8345 0.2812 0.1108 0.0427 0.0222 0.0125
15 6.1463 1.8329 0.9482 0.3195 0.1259 0.0485 0.0253 0.0142
16 6.9265 2.0656 1.0686 0.3600 0.1419 0.0546 0.0285 0.0160
17 7.7495 2.3110 1.1956 0.4028 0.1588 0.0611 0.0319 0.0179
18 (1) 2.5691 1.3290 0.4478 0.1765 0.0679 0.0354 0.0199
19 (1) 2.8396 1.4690 0.4949 0.1951 0.0751 0.0392 0.0220
20 (1) 3.1226 1.6154 0.5443 0.2145 0.0826 0.0431 0.0242
21 (1) 3.4178 1.7681 0.5957 0.2348 0.0904 0.0471 0.0265
Utah LWPH June 2015
55
22 (1) 3.7253 1.9272 0.6493 0.2559 0.0985 0.0514 0.0289
23 (1) 4.0450 2.0926 0.7050 0.2779 0.1070 0.0558 0.0314
24 (1) 4.3767 2.2642 0.7628 0.3007 0.1157 0.0603 0.0340
25 (1) 4.7203 2.4420 0.8227 0.3243 0.1248 0.0651 0.0367
(1) Exceeds 5.0 feet per second velocity
(2) A = Flow area, square feet
(3) For ASTM D2241, materials 1120, 1120 or 2120. These are the most commonly used materials. Other materials have different ratings, see ASTM D2241.
Utah LWPH June 2015
56
Table 5.3PVC-SDR PIPE
FRICTION LOSS ft/100 ftSDR 21, Pressure Rating = 200 psi @ 73.40 F
Hazen Williams C = 150
Q
Gallons
per min.
1 inch
0.0077 A
1.198 ID
1-1/4 inch
0.0123 A
1.502 ID
1-1/2 inch
0.0161 A
1.720 ID
2 inch
0.0252 A
2.149 ID
2-1/2 inch
0.0369 A
2.601 ID
3 inch
0.0547 A
3.166 ID
3-1/2 inch
0.0715 A
3.620 ID
4 inch
0.0904 A
4.072 ID
1 0.0403 0.0134 0.0069 0.0023 0.0009 0.0004 0.0002 0.0001
2 0.1455 0.0484 0.0250 0.0084 0.0033 0.0013 0.0007 0.0004
3 0.3083 0.1025 0.0530 0.0179 0.0071 0.0027 0.0014 0.0008
4 0.5252 0.1746 0.0902 0.0305 0.0120 0.0046 0.0024 0.0014
5 0.7939 0.2639 0.1364 0.0461 0.0182 0.0070 0.0036 0.0021
6 1.1127 0.3699 0.1912 0.0646 0.0255 0.0098 0.0051 0.0029
7 1.4803 0.4921 0.2543 0.0860 0.0339 0.0130 0.0068 0.0038
8 1.8956 0.6301 0.3257 0.1101 0.0434 0.0167 0.0087 0.0049
9 2.3576 0.7837 0.4050 0.1369 0.0540 0.0207 0.0108 0.0061
10 2.8656 0.9525 0.4923 0.1664 0.0657 0.0252 0.0131 0.0074
11 3.4187 1.1364 0.5873 0.1985 0.0784 0.0301 0.0157 0.0088
12 4.0165 1.3351 0.6900 0.2333 0.0921 0.0353 0.0184 0.0104
13 4.6582 1.5484 0.8002 0.2705 0.1068 0.0410 0.0213 0.0120
14 5.3434 1.7762 0.9180 0.3103 0.1225 0.0470 0.0245 0.0138
15 6.0717 2.0182 1.0431 0.3526 0.1392 0.0534 0.0278 0.0157
16 6.8425 2.2745 1.1755 0.3974 0.1568 0.0602 0.0313 0.0177
17 7.6554 2.5447 1.3151 0.4446 0.1755 0.0674 0.0351 0.0198
18 (1) 2.8288 1.4620 0.4942 0.1951 0.0749 0.0390 0.0220
19 (1) 3.1267 1.6159 0.5463 0.2156 0.0828 0.0431 0.0243
20 (1) 3.4383 1.7770 0.6007 0.2371 0.0910 0.0474 0.0267
21 (1) 3.7634 1.9450 0.6575 0.2595 0.0996 0.0519 0.0292
Utah LWPH June 2015
57
22 (1) 4.1020 2.1200 0.7167 0.2828 0.1086 0.0565 0.0319
23 (1) 4.4539 2.3019 0.7782 0.3071 0.1179 0.0614 0.0346
24 (1) 4.8192 2.4906 0.8420 0.3323 0.1276 0.0664 0.0374
25 (1) 5.1976 2.6862 0.9081 0.3584 0.1376 0.0716 0.0404
(1) Exceeds 5.0 feet per second velocity
(2) A = Flow area, square feet
(3) For ASTM D2241, materials 1120, 1120 or 2120. These are the most commonly used materials. Other materials have different ratings, see ASTM D2241.
Utah LWPH June 2015
58
Table 5.4PVC-SDR PIPE
FRICTION LOSS ft/100 ftSDR 17, Pressure Rating = 250 psi @ 73.4 F
Hazen Williams C = 150
Q
Gallons
per min.
1 inch
0.0074 A
1.162 ID
1-1/4 inch
0.0117 A
1.464 ID
1-1/2 inch
0.0153 A
1.676 ID
2 inch
0.0239 A
2.095 10
2-1/2 inch
0.0351 A
2.537 ID
3 inch
0.0520 A
3.088 ID
3-1/2 inch
0.0680 A
3.530 ID
4 inch
0.0860 A
3.970 ID
1 0.0470 0.0152 0.0079 0.0026 0.0010 0.0004 0.0002 0.0001
2 0.1695 0.0548 0.0284 0.0096 0.0038 0.0014 0.0008 0.0004
3 0.3592 0.1161 0.0601 0.0203 0.0080 0.0031 0.0016 0.0009
4 0.611 8 0.1978 0.1024 0.0345 0.0136 0.0052 0.0027 0.0015
5 0.9249 0.2990 0.1547 0.0522 0.0205 0.0079 0.0041 0.0023
6 1.2964 0.4190 0.2169 0.0731 0.0288 0.0111 0.0058 0.0033
7 1.7247 0.5575 0.2885 0.0973 0.0383 0.0147 0.0077 0.0043
8 2.2085 0.7139 0.3695 0.1246 0.0491 0.0188 0.0098 0.0055
9 2.7468 0.8879 0.4595 0.1550 0.0610 0.0234 0.0122 0.0069
10 3.3386 1.0791 0.5585 0.1884 0.0742 0.0285 0.0148 0.0084
11 3.9831 1.2875 0.6663 0.2247 0.0885 0.0340 0.0177 0.0100
12 4.6795 1.5126 0.7828 0.2640 0.1039 0.0399 0.0208 0.0117
13 5.4272 1.7542 0.9079 0.3062 0.1205 0.0463 0.0241 0.0136
14 6.2255 2.0123 1.0414 0.3513 0.1383 0.0531 0.0277 0.0156
15 7.0740 2.2865 1.1834 0.3992 0.1571 0.0603 0.0314 0.0177
16 7.9720 2.5768 1.3336 0.4498 0.1771 0.0680 0.0354 0.0200
17 (1) 2.8830 1.4921 0.5033 0.1981 0.0761 0.0396 0.0224
18 (1) 3.2048 1.6587 0.5595 0.2202 0.0846 0.0441 0.0249
19 (1) 3.5423 1.8333 0.6184 0.2434 0.0935 0.0487 0.0275
20 (1) 3.8953 2.0160 0.6800 0.2677 0.1028 0.0536 0.0302
21 (1) 4.2637 2.2066 0.7443 0.2930 0.1125 0.0586 0.0331
Utah LWPH June 2015
59
22 (1) 4.6472 2.4052 0.8113 0.3193 0.1226 0.0639 0.0361
23 (1) 5.0460 2.6115 0.8809 0.3467 0.1331 0.0694 0.0392
24 (1) 5.4598 2.8257 0.9531 0.3752 0.1440 0.0751 0.0424
25 (1) 5.8885 3.0476 1.0279 0.4046 0.1554 0.0810 0.0457
(1) Exceeds 5.0 feet per second velocity
(2) A = Flow area, square feet
(3) For ASTM D2241, materials 1120, 1120 or 2120. These are the most commonly used materials. Other materials have different ratings, see ASTM D2241.
Utah LWPH June 2015
60
Table 5.5PVC-SDR PIPE
FRICTION LOSS ft/100 ftSDR 13.5, Pressure Rating = 315 psi @ 73.4 F
Hazen Williams C = 150
Q
Gallons
per min.
1 inch
0.0069 A
1.121 ID
1-1/4 inch
0.0109 A
1.414 ID
1-1/2 inch
0.0143 A
1.618 ID
2 inch
0.0223 A
2.023 ID
2-1/2 inch
0.0327 A
2.449 ID
3 inch
0.0485 A
2.982 ID
3-1/2 inch
0.0633 A
3.408 ID
4 inch
0.0802 A
3.834 ID
1 0.0557 0.0180 0.0093 0.0031 0.0012 0.0005 0.0002 0.0001
2 0.2011 0.0649 0.0337 0.0113 0.0045 0.0017 0.0009 0.0005
3 0.4260 0.1375 0.0713 0.0240 0.0095 0.0036 0.0019 0.0011
4 0.7258 0.2342 0.1215 0.0409 0.0161 0.0062 0.0032 0.0018
5 1.0972 0.3541 0.1837 0.0619 0.0244 0.0094 0.0049 0.0027
6 1.5378 0.4963 0.2575 0.0867 0.0342 0.0131 0.0068 0.0039
7 2.0459 0.6603 0.3425 0.1154 0.0455 0.0174 0.0091 0.0051
8 2.6198 0.8455 0.4386 0.1478 0.0583 0.0223 0.0117 0.0066
9 3.2583 1.0516 0.5455 0.1838 0.0725 0.0278 0.0145 0.0082
10 3.9603 1.2782 0.6630 0.2234 0.0881 0.0338 0.0176 0.0099
11 4.7248 1.5249 0.7910 0.2665 0.1051 0.0403 0.0210 0.0118
12 5.5509 1.7915 0.9293 0.3131 0.1234 0.0473 0.0247 0.0139
13 6.4378 2.0777 1.0778 0.3631 0.1432 0.0549 0.0286 0.0161
14 7.3848 2.3834 1.2363 0.4165 0.1642 0.0629 0.0328 0.0185
15 8.3912 2.7082 1.4048 0.4733 0.1866 0.0715 0.0373 0.0210
16 (1) 3.0520 1.5832 0.5334 0.2103 0.0806 0.0421 0.0237
17 (1) 3.4146 1.7713 0.5967 0.2353 0.0902 0.0471 0.0265
18 (1) 3.7958 1.9690 0.6633 0.2615 0.1002 0.0523 0.0295
19 (1) 4.1956 2.1764 0.7332 0.2891 0.1108 0.0578 0.0326
20 (1) 4.6137 2.3932 0.8063 0.3179 0.1218 0.0636 0.0358
21 (1) 5.0499 2.6195 0.8825 0.3479 0.1334 0.0696 0.0392
Utah LWPH June 2015
61
22 (1) 5.5042 2.8552 0.9619 0.3792 0.1453 0.0759 0.0427
23 (1) 5.9765 3.1002 1.0444 0.4118 0.1578 0.0824 0.0464
24 (1) 6.4666 3.3544 1.1301 0.4456 0.1708 0.0891 0.0502
25 (1) (1) 3.6178 1.2188 0.4805 0.1842 0.0961 0.0542
(1) Exceeds 5.0 feet per second velocity
(2) A = Flow area, square feet
(3) For ASTM D2241, materials 1120, 1120 or 2120. These are the most commonly used materials. Other materials have different ratings, see ASTM D2241.
Utah LWPH June 2015
62
Table 5.6PVC-IPS SCHEDULE RATED PIPE
FRICTION LOSS ft/100 ftSchedule 40 (3)
Hazen Williams C = 150
Q
Gallons
per min.
1 inch
450 psi
0.0060 A
1.049 ID
1-1/4 inch
370 psi
0.0104 A
1.380 ID
1-1/2 inch
330 psi
0.0141 A
1.610 ID
2 inch
280 psi
0.0233 A
2.067 ID
2-1/2 inch
300 psi
0.0332 A
2.469 ID
3 inch
260 psi
0.0513 A
3.068 ID
3-1/2 inch
240 psi
0.0687 A
3.548 ID
4 inch
220 psi
0.0884 A
4.026 ID
1 O.O770 0.0202 0.0096 0.0028 0.0012 0.0004 0.0002 0.0001
2 0.2778 0.0731 0.0345 0.0102 0.0043 0.0015 0.0007 0.0004
3 0.5886 0.1548 0.0731 0.0216 0.0091 0.0032 0.0016 0.0008
4 1.0028 0.2637 0.1245 0.0369 0.0155 0.0054 0.0027 0.0014
5 1.5159 0.3987 0.1882 0.0557 0.0234 0.0081 0.0040 0.0022
6 2.1248 0.5588 0.2637 0.0781 0.0329 0.0114 0.0056 0.0030
7 2.8267 0.7434 0.3509 0.1039 0.0437 0.0152 0.0075 0.0040
8 3.6198 0.9519 0.4493 0.1331 0.0560 0.0194 0.0096 0.0052
9 4.5020 1.1839 0.5588 0.1655 0.0696 0.0242 0.0119 0.0064
10 5.4720 1.4390 0.6792 0.2011 0.0846 0.0294 0.0145 0.0078
11 6.5282 1.7168 0.8103 0.2400 0.1010 0.0351 0.0173 0.0093
12 7.6696 2.0170 0.9520 0.2819 0.1186 0.0412 0.0203 0.0110
13 8.8950 2.3392 1.1041 0.3270 0.1376 0.0478 0.0235 0.0127
14 (1) 2.6833 1.2665 0.3751 0.1578 0.0548 0.0270 0.0146
15 (1) 3.0490 1.4391 0.4262 0.1793 0.0623 0.0307 0.0166
16 (1) 3.4361 1.6218 0.4803 0.2021 0.0702 0.0346 0.0187
17 (1) 3.8443 1.8145 0.5374 0.2261 0.0785 0.0387 0.0209
18 (1) 4.2736 2.0171 0.5973 0.2514 0.0873 0.0430 0.0232
19 (1) 4.7236 2.2296 0.6603 0.2779 0.0965 0.0475 0.0257
20 (1) 5.1943 2.4517 0.7260 0.3055 0.1061 0.0523 0.0282
Utah LWPH June 2015
63
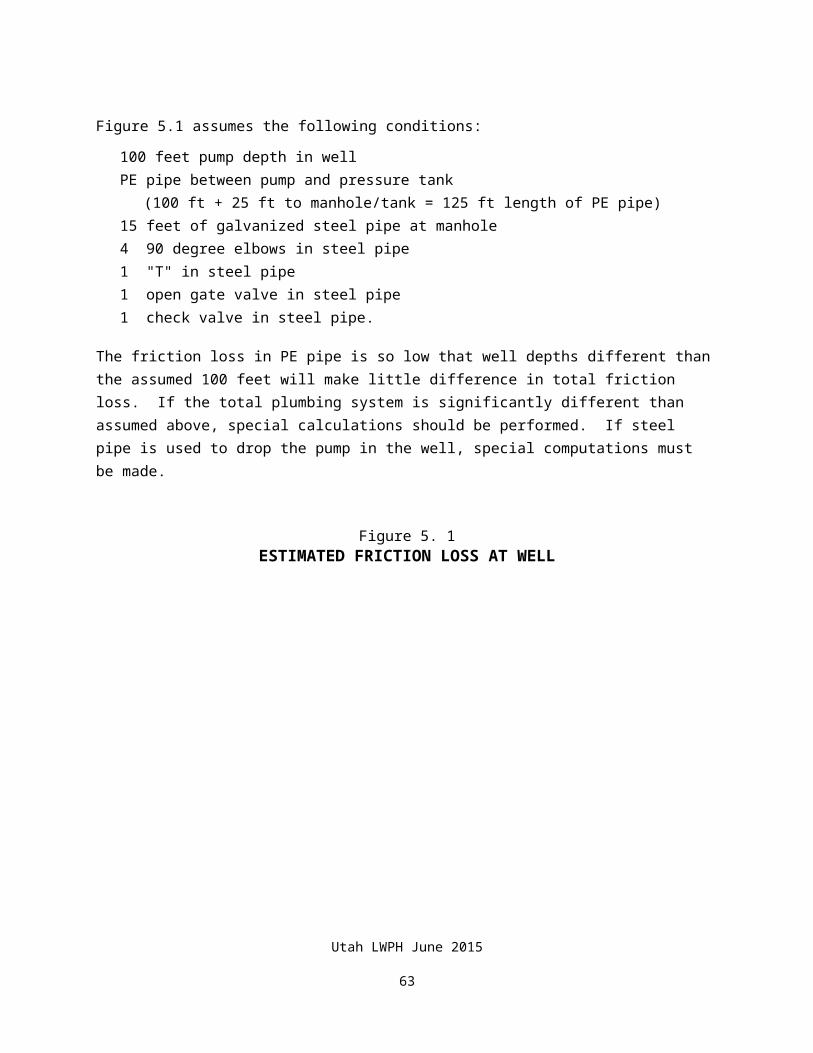
21 (1) 5.6855 2.6836 0.7947 0.3344 0.1161 0.0572 0.0309
22 (1) 6.1970 2.9250 0.8662 0.3645 0.1266 0.0623 0.0337
23 (1) 6.7287 3.1760 0.9405 0.3958 0.1374 0.0677 0.0366
24 (1) (1) 3.4364 1.0176 0.4283 0.1487 0.0732 0.0396
25 (1) (1) 3.7062 1.0976 0.4619 0.1604 0.0790 0.0427
(1) Exceeds 5.0 feet per second velocity
(2) A = Flow area, square feet
(3) For ASTM D2241, materials 1120, 1120 or 2120. These are the most commonly used materials. Other materials have different ratings, see ASTM D2241. Pressure rating is at 73.4 F.
Utah LWPH June 2015
64
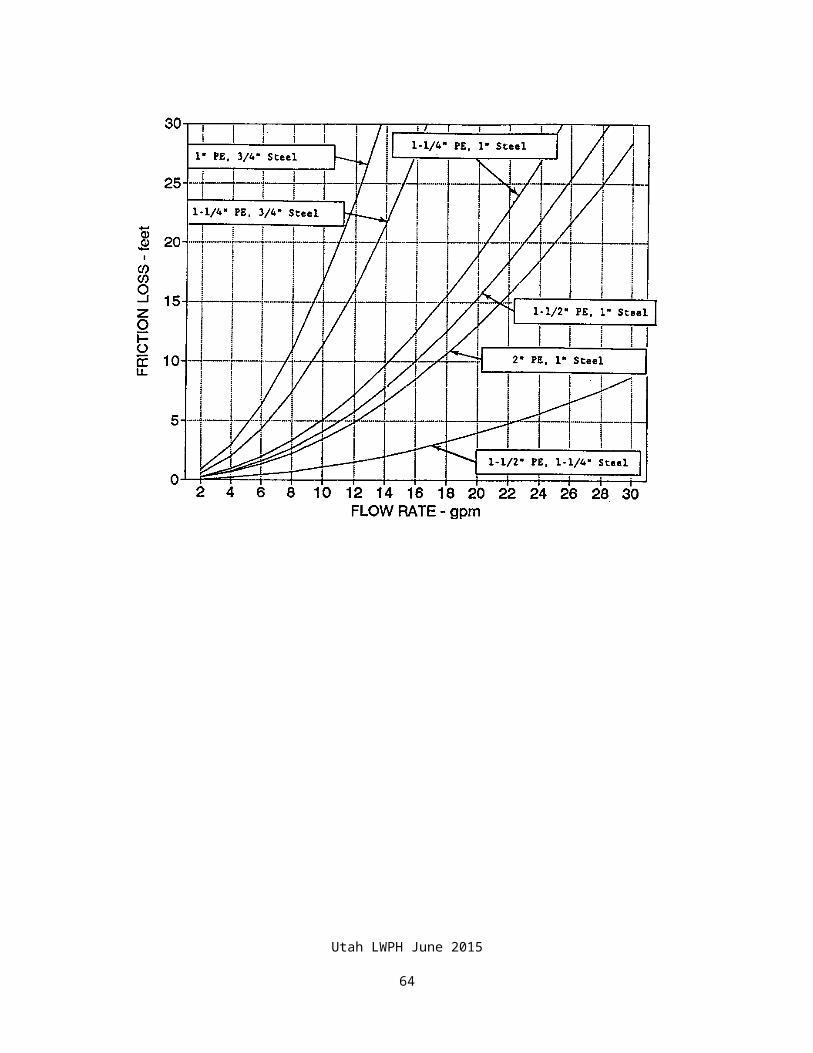
Table 5.7PVC-IPS SCHEDULE RATED PIPE
FRICTION LOSS ft/100 ftSchedule 80 (3)
Hazen Williams C = 150
Q
Gallons
per min.
1 inch
630 psi
0.0050 A
0.957 ID
1-1/4 inch
520 psi
0.0089 A
1.278 ID
1-1/2 inch
470 psi
0.0123 A
1.500 ID
2 inch
400 psi
0.0205 A
1.939 ID
2-1/2 inch
420 psi
0.0294 A
2.323 ID
3 inch
370 psi
0.0459 A
2.900 ID
3-1/2 inch
350 psi
0.0617 A
3.364 ID
4 inch
320 psi
0.0798 A
3.826 ID
1 0.1203 0.0294 0.0135 0.0039 0.0016 0.0005 0.0003 0.0001
2 0.4344 0.1062 0.0487 0.0139 0.0058 0.0020 0.0010 0.0005
3 0.9204 0.2250 0.1031 0.0295 0.0123 0.0042 0.6020 0.0011
4 1.5681 0.3833 0.1757 0.0503 0.0209 0.0071 0.0034 0.0018
5 2.3704 0.5795 0.2656 0.0761 0.0316 0.0107 0.0052 0.0028
6 3.3225 0.8122 0.3723 0.1066 0.0442 0.0150 0.0073 0.0039
7 4.4202 1.0805 0.4953 0.1419 0.0588 0.0200 0.0097 0.0052
8 5.6602 1.3836 0.6342 0.1817 0.0753 0.0256 0.0124 0.0066
9 7.0397 1.7209 0.7888 0.2259 0.0937 0.0318 0.0154 0.0082
10 8.5564 2.0916 0.9587 0.2746 0.1139 0.0387 0.0188 0.0100
11 10.2081 2.4954 1.1438 0.3276 0.1359 0.0461 0.0224 0.0120
12 (1) 2.9317 1.3438 0.3849 0.1596 0.0542 0.0263 0.0141
13 (1) 3.4001 1.5585 0.4464 0.1852 0.0628 0.0305 0.0163
14 (1) 3.9002 1.7877 0.5121 0.2124 0.0721 0.0350 0.0187
15 (1) 4.4318 2.0314 0.5818 0.2413 0.0819 0.0398 0.0212
16 (1) 4.9944 2.2893 0.6557 0.2720 0.0923 0.0448 0.0239
17 (1) 5.5878 2.5613 0.7336 0.3043 0.1033 0.0501 0.0268
18 (1) 6.2117 2.8472 0.8155 0.3383 0.1148 0.0557 0.0298
19 (1) 6.8658 3.1471 0.9014 0.3739 0.1269 0.0616 0.0329
20 (1) (1) 3.4607 0.9912 0.4111 0.1396 0.0677 0.0362
Utah LWPH June 2015
65
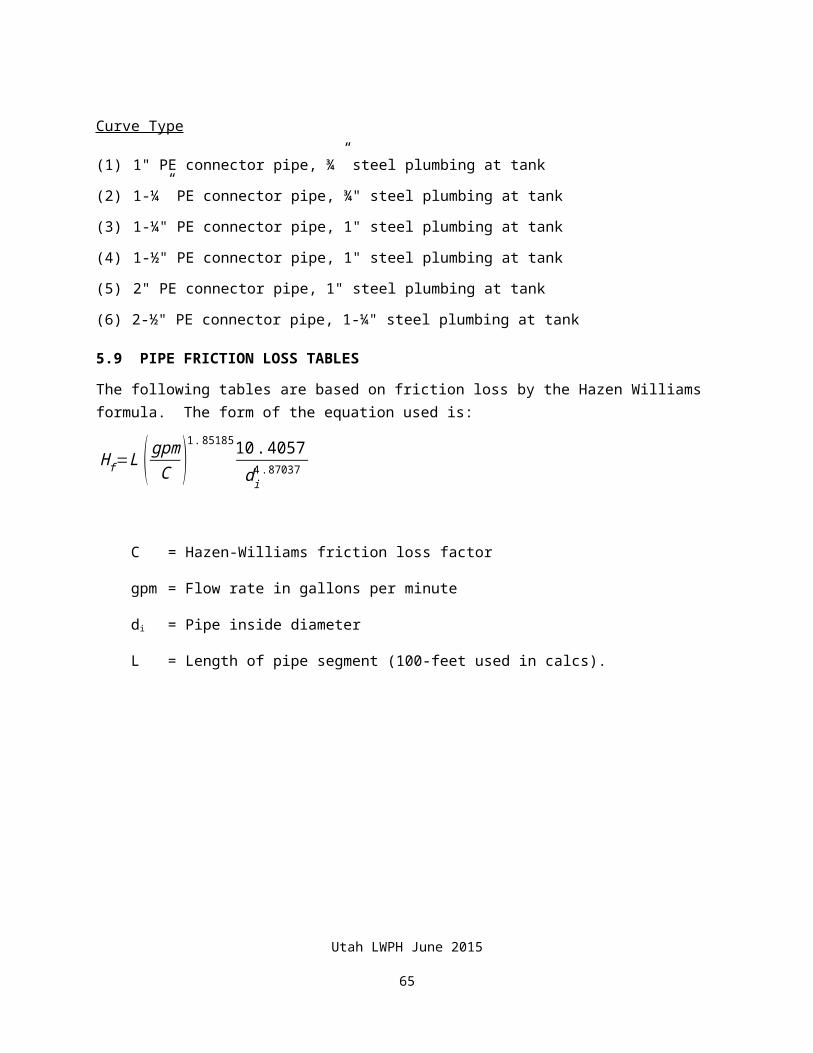
21 (1) (1) 3.7879 1.0850 0.4500 0.1527 0.0741 0.0396
22 (1) (1) 4.1287 1.1826 0.4905 0.1665 0.0808 0.0432
23 (1) (1) 4.4829 1.2841 0.5326 0.1808 0.0877 0.0469
24 (1) (1) 4.8506 1.3893 0.5763 0.1956 0.0949 0.0507
25 (1) (1) 5.2315 1.4984 0.6215 0.2110 0.1024 0.0547
(1) Exceeds 5.0 feet per second velocity
(2) A = Flow area, square feet
(3) For ASTM D2241, materials 1120, 1120 or 2120. These are the most commonly used materials. Other materials have different ratings, see ASTM D2241. Pressure rating is at 73.4 F.
Utah LWPH June 2015
66
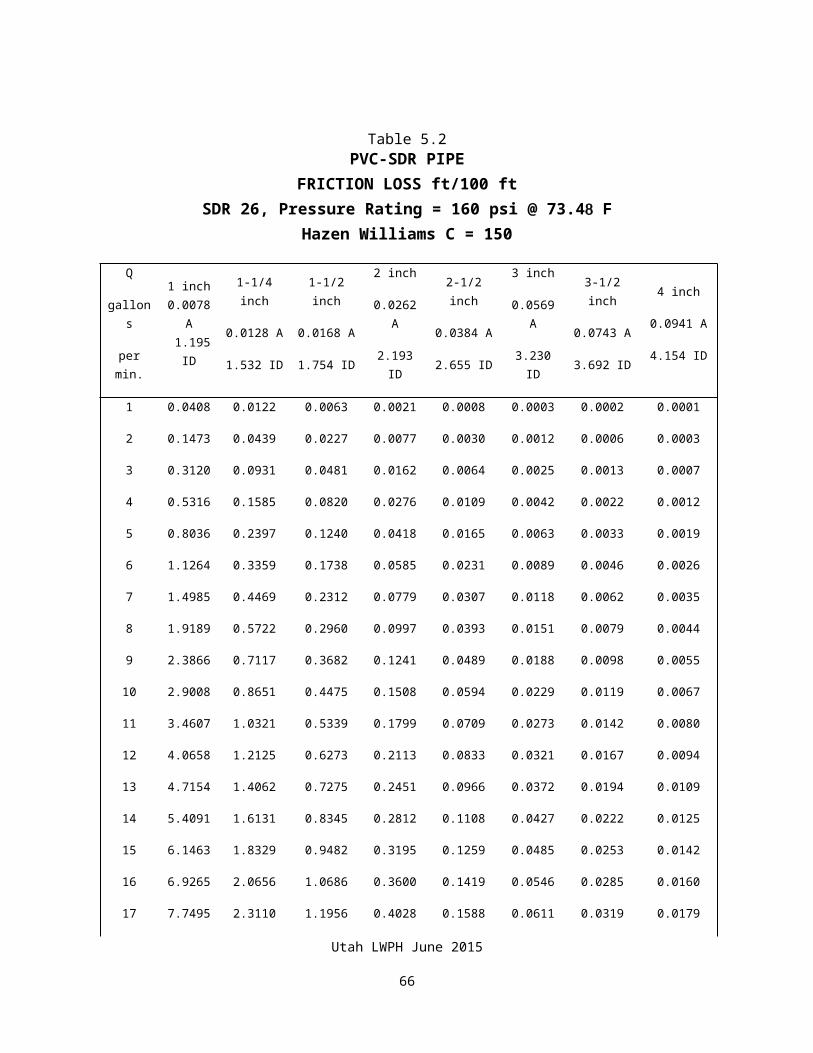
Table 5.8PVC-IPS SCHEDULE RATED PIPE
FRICTION LOSS ft/100 ftSchedule 120 (3)
Hazen Williams C = 150
Q
Gallons
per min.
1 inch
720 psi
0.0060 A
0.915 ID
1-1/4 inch
600 psi
0.0104 A
1.230 ID
1-1/2 inch
540 psi
0.0141 A
1.450 ID
2 inch
470 psi
0.0233 A
1.875 ID
2-1/2 inch
470 psi
0.0332 A
2.275 ID
3 inch
440 psi
0.0513 A
2.800 ID
3-1/2 inch
380 psi
0.0687 A
3.300 ID
4 inch
430 psi
0.0884 A
3.626 ID
1 0.1498 0.0354 0.0159 0.0045 0.0018 0.0006 0.0003 0.0002
2 0.5405 0.1280 0.0574 0.0164 0.0064 0.0023 0.0010 0.0007
3 1.1453 0.2711 0.1216 0.0348 0.0136 0.0049 0.0022 0.0014
4 1.9512 0.4619 0.2072 0.0593 0.0231 0.0084 0.0038 0.0024
5 2.9496 0.6982 0.3133 0.0896 0.0349 0.0127 0.0057 0.0036
6 4.1342 0.9786 0.4391 0.1256 0.0490 0.0178 0.0080 0.0051
7 5.5000 1.3020 0.5842 0.1671 0.0651 0.0237 0.0106 0.0067
8 7.0430 1.6672 0.7481 0.2139 0.0834 0.0303 0.0136 0.0086
9 8.7596 2.0736 0.9304 0.2661 0.1037 0.0377 0.0170 0.0107
10 10.6468 2.5203 1.1308 0.3234 0.1261 0.0459 0.0206 0.0130
11 (1) 3.0068 1.3491 0.3858 0.1504 0.0547 0.0246 0.0155
12 (1) 3.5325 1.5850 0.4533 0.1767 0.0643 0.0289 0.0183
13 (1) 4.0970 1.8383 0.5257 0.2050 0.0746 0.0335 0.0212
14 (1) 4.6996 2.1087 0.6030 0.2351 0.0855 0.0384 0.0243
15 (1) 5.3401 2.3961 0.6852 0.2672 0.0972 0.0437 0.0276
16 (1) 6.0180 2.7003 0.7722 0.3011 0.1095 0.0492 0.0311
17 (1) 6.7331 3.0211 0.8639 0.3369 0.1225 0.0550 0.0348
18 (1) 7.4848 3.3584 0.9604 0.3745 0.1362 0.0612 0.0387
19 (1) (1) 3.7121 1.0615 0.4139 0.1506 0.0676 0.0427
20 (1) (1) 4.0819 1.1673 0.4552 0.1656 0.0744 0.0470
Utah LWPH June 2015
67

21 (1) (1) 4.4679 1.2776 0.4982 0.1812 0.0814 0.0515
22 (1) (1) 4.8699 1.3926 0.5430 0.1975 0.0887 0.0561
23 (1) (1) 5.2877 1.5121 0.5896 0.2145 0.0963 0.0609
24 (1) (1) 5.7214 1.6361 0.6380 0.2321 0.1042 0.0659
25 (1) (1) 6.1706 1.7646 0.6881 0.2503 0.1124 0.0711
(1) Exceeds 5.0 feet per second velocity
(2) A = Flow area, square feet
(3) For ASTM D2241, materials 1120, 1120 or 2120. These are the most commonly used materials. Other materials have different ratings, see ASTM D2241. Pressure rating is at 73.4 F.
Utah LWPH June 2015
68
Table 5.9POLYETHYLENE (PE) SIDR-PR RATED PIPE
FRICTION LOSS ft/100 ftASTM D2239 (3)
Hazen Williams C = 145
Q
Gallons
per min.
1 inch
0.0060 A
1.049 ID
1-1/4 inch
0.0104 A
1.380 ID
1-1/2 inch
0.0141 A
1.610 ID
2 inch
0.0233 A
2.069 ID
2-1/2 inch
0.0333 A
2.469 ID
3 inch
0.0513 A
3.068 ID
4 inch
0.0884 A
4.026 ID
1 0.0820 0.0216 0.0102 0.0030 0.0013 0.0004 0.0001
2 0.2958 0.0778 0.0367 0.0109 0.0046 0.0016 0.0004
3 0.6268 0.1648 0.0778 0.0230 0.0097 0.0034 0.0009
4 1.0678 0.2808 0.1325 0.0393 0.0165 0.0057 0.0015
5 1.6142 0.4245 0.2004 0.0593 0.0250 0.0087 0.0023
6 2.2624 0.5950 0.2808 0.0832 0.0350 0.0122 0.0032
7 3.0099 0.7915 0.3736 0.1106 0.0466 0.0162 0.0043
8 3.8543 1.0136 0.4784 0.1417 0.0596 0.0207 0.0055
9 4.7937 1.2606 0.5950 0.1762 0.0742 0.0257 0.0069
10 5.8265 1.5322 0.7232 0.2142 0.0901 0.0313 0.0083
11 6.9512 1.8280 0.8628 0.2555 0.1075 0.0373 0.0099
12 8.1666 2.1476 1.0137 0.3002 0.1263 0.0439 0.0117
13 9.4714 2.4908 1.1757 0.3482 0.1465 0.0509 0.0135
14 (1) 2.8572 1.3486 0.3994 0.1681 0.0583 0.0155
15 (1) 3.2466 1.5324 0.4538 0.1910 0.0663 0.0176
16 (1) 3.6587 1.7269 0.5114 0.2152 0.0747 0.0199
17 (1) 4.0934 1.9321 0.5722 0.2408 0.0836 0.0223
18 (1) 4.5505 2.1478 0.6361 0.2677 0.0929 0.0247
19 (1) 5.0297 2.3740 0.7030 0.2959 0.1027 0.0273
20 (1) 5.5308 2.6106 0.7731 0.3253 0.1130 0.0301
21 (1) 6.0538 2.8574 0.8462 0.3561 0.1236 0.0329
Utah LWPH June 2015
69
22 (1) 6.5985 3.1145 0.9223 0.3881 0.1348 0.0359
23 (1) 7.1646 3.3817 1.0015 0.4214 0.1463 0.0389
24 (1) (1) 3.6590 1.0836 0.4560 0.1583 0.0421
25 (1) (1) 3.9464 1.1687 0.4918 0.1707 0.0455
AVAILABLE PE PIPE SIZES AND RATINGS
Available Sizes SIDR Pressure Rating @ 73.4 F
1, 1-1/4, 1-1/2, 2 15 100
1, 1-1/2, 2 11.5 125
1, 1-1/2, 2 9 160
1, 1-1/2, 2, 2-1/2. 3, 4 7 200
1, 1-1/2, 2, 2-1/2. 3, 4 5.3 250
(1) Exceeds 5.0 feet per second velocity
(2) A = Flow area, square feet
(3) For ASTM D2239, material PE3408. This is the most commonly used material. Other materials have different ratings, see ASTM D2239.
Utah LWPH June 2015
70
Table 5.10HIGH DENSITY POLYETHYLENE (HDPE)
FRICTION LOSS ft/100 ftASTM D1248, Type III
Hazen Williams C = 150
Q
Gallons
per min.
1-1/2 inch
130 psi
SDR 13.5
0.0143 A
1.62 ID
2 inch
130 psi
SDR 13.5
0.0220 A
2.01 ID
1-1/2 inch
160 psi
SDR 11
0.0131 A
1.55 ID
2 inch
160 psi
SDR 11
0.0203 A
1.93 ID
1-1/2 inch
200 psi
SDR 9
0.0119 A
1.48 ID
2 inch
200 psi
SDR 9
0.0183 A
1.83 ID
1-1/2 inch
255 psi
SDR 7.3
0.0104 A
1.38 ID
2 inch
255 psi
SDR 7.3
0.0159 A
1.71 ID
1 0.0093 0.0032 0.0115 0.0040 0.0144 0.0051 0.0202 0.0071
2 0.0335 0.0117 0.0415 0.0143 0.0520 0.0185 0.0731 0.0257
3 0.0709 0.0248 0.0879 0.0302 0.1101 0.0392 0.1548 0.0545
4 0.1208 0.0422 0.1498 0.0515 0.1876 0.0667 0.2637 0.0928
5 0.1826 0.0639 0.2264 0.0778 0.2835 0.1008 0.3987 0.1403
6 0.2559 0.0895 0.3173 0.1091 0.3974 0.1413 0.5588 0.1967
7 0.3405 0.1191 0.4222 0.1451 0.5287 0.1880 0.7434 0.2616
8 0.4360 0.1525 0.5406 0.1858 0.6771 0.2408 0.9519 0.3350
9 0.5422 0.1896 0.6724 0.2311 0.8421 0.2995 1.1839 0.4167
10 0.6590 0.2305 0.8172 0.2809 1.0235 0.3640 1.4390 0.5065
11 0.7863 0.2750 0.9750 0.3351 1.2211 0.4343 1.7168 0.6042
12 0.9237 0.3231 1.1454 0.3937 1.4346 0.5102 2.0170 0.7099
13 1.0713 0.3747 1.3285 0.4566 1.6638 0.5917 2.3392 0.8233
14 1.2289 0.4298 1.5239 0.5238 1.9085 0.6787 2.6833 0.9444
15 1.3964 0.4884 1.7316 0.5952 2.1686 0.7712 3.0490 1.0731
16 1.5737 0.5504 1.9514 0.6707 2.4439 0.8691 3.4361 1.2093
17 1.7606 0.6158 2.1832 0.7504 2.7343 0.9724 3.8443 1.3530
18 1.9572 0.6845 2.4270 0.8342 3.0396 1.0810 4.2736 1.5041
19 2.1633 0.7566 2.6826 0.9221 3.3597 1.1948 4.7236 1.6625
Utah LWPH June 2015
71
20 2.3789 0.8320 2.9499 1.0140 3.6945 1.3139 5.1943 1.8282
21 2.6038 0.9107 3.2288 1.1098 4.0438 1.4381 5.6855 2.0010
22 2.8381 0.9926 3.5193 1.2097 4.4076 1.5675 6.1970 2.1810
23 3.0816 1.0777 3.8213 1.3135 4.7858 1.7020 6.7287 2.3682
24 3.3343 1.1661 4.1346 1.4212 5.1783 1.8416 (1) 2.5624
25 3.5961 1.2577 4.4593 1.5328 5.5849 1.9862 (1) 2.7636
(1) Exceeds 5.0 feet per second velocity
(2) Flow area, square feet
Utah LWPH June 2015
72
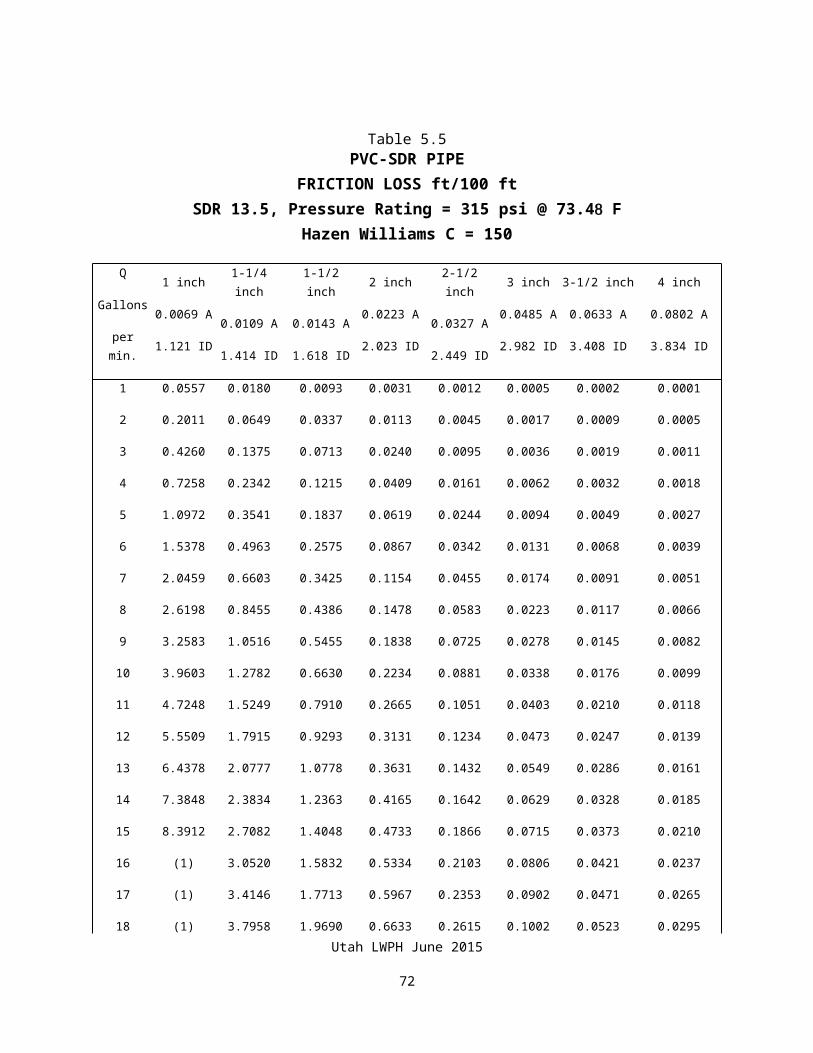
Table 5.11IPS-ID POLYBUTYLENE WATER SERVICE PIPE
FRICTION LOSS ft/100 ftASTM D2662, SDR 11.5, 160 psi 0 73.4 F
Hazen Williams C = 150
Q
Gallons
per min.
3/4 inch
0.00370 A
0.824 ID
1 inch
0.00600 A
1.049 ID
1-1/4 inch
0.01039 A
1.380 ID
1-1/2 inch
0.01414 A
1.610 ID
2 inch
0.02330 A
2.067 ID
1 0.2494 0.0770 0.0202 0.0096 0.0028
2 0.9003 0.2778 0.0731 0.0345 0.0102
3 1.9077 0.5886 0.1548 0.0731 0.0216
4 3.2499 1.0028 0.2637 0.1245 0.0369
5 4.9128 1.5159 0.3987 0.1882 0.0557
6 6.8859 2.1248 0.5588 0.2637 0.0781
7 9.1609 2.8267 0.7434 0.3509 0.1039
8 11.7308 3.6198 0.9519 0.4493 0.1331
9 (1) 4.5020 1.1839 0.5588 0.1655
10 (1) 5.4720 1.4390 0.6792 0.2011
11 (1) 6.5282 1.7168 0.8103 0.2400
12 (1) 7.6696 2.0170 0.9520 0.2819
13 (1) 8.8950 2.3392 1.1041 0.3270
14 (1) (1) 2.6833 1.2665 0.3751
15 (1) (1) 3.0490 1.4391 0.4262
16 (1) (1) 3.4361 1.6218 0.4803
17 (1) (1) 3.8443 1.8145 0.5374
18 (1) (1) 4.2736 2.0171 0.5973
19 (1) (1) 4.7236 2.2296 0.6603
20 (1) (1) 5.1943 2.4517 0.7260Utah LWPH June 2015
73
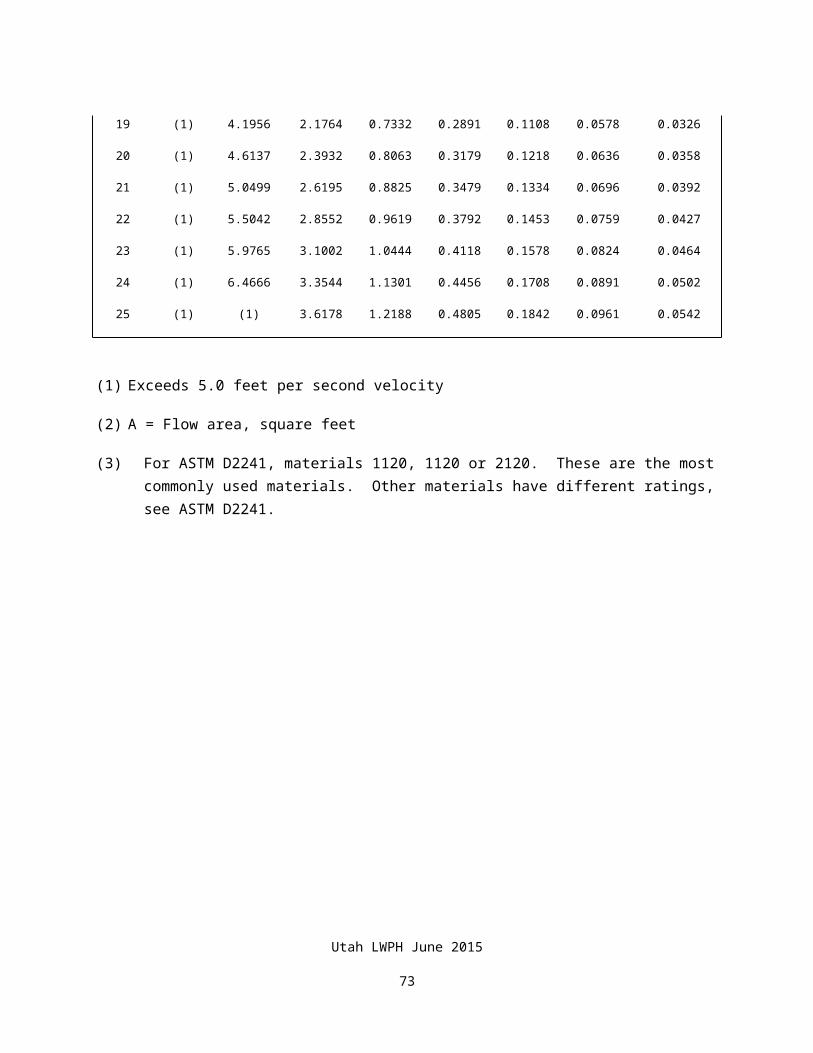
21 (1) (1) 5.6855 2.6836 0.7947
22 (1) (1) 6.1970 2.9250 0.8662
23 (1) (1) 6.7287 3.1760 0.9405
24 (1) (1) (1) 3.4364 1.0176
25 (1) (1) (1) 3.7062 1.0976
(1) Exceeds 5.0 feet per second velocity
(2) A = Flow area, square feet
Utah LWPH June 2015
74
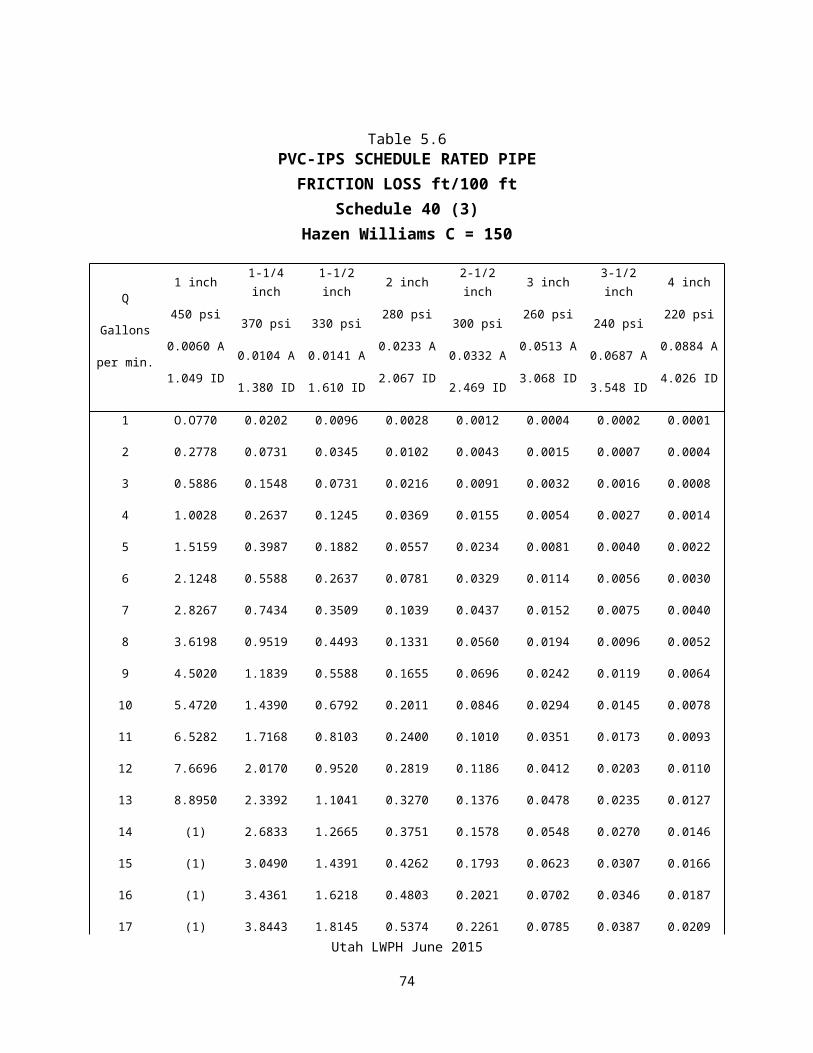
Table 5.12CPS (Copper Pipe Size) POLYBUTYLENE WATER SERVICE PIPE
FRICTION LOSS ft/100 ftASTM D2666, SDR 13.5, 160 psi @ 73.40 F
Hazen Williams C = 150
Q
Gallons
per min.
3/4 inch
0.00303 A
0.745 ID
1 inch
0.00499 A
0.957 ID
1-1/4 inch
0.00748 A
1.171 ID
1-1/2 inch
0.01050 A
1.385 ID
2 inch
0.01789 A
1.811 ID
1 0.4075 0.1203 0.0450 0.0199 0.0054
2 1.4709 0.4344 0.1626 0.0718 0.0194
3 3.1166 0.9204 0.3445 0.1521 0.0412
4 5.3094 1.5681 0.5868 0.2591 0.0702
5 8.0262 2.3704 0.8871 0.3917 0.1061
6 11.2497 3.3225 1.2434 0.5490 0.1487
7 (1) 4.4202 1.6541 0.7304 0.1978
8 (1) 5.6602 2.1182 0.9353 0.2533
9 (1) 7.0397 2.6345 1.1633 0.3151
10 (1) 8.5564 3.2021 1.4139 0.3830
11 (1) 10.2081 3.8202 1.6868 0.4569
12 (1) (1) 4.4881 1.9817 0.5368
13 (1) (1) 5.2052 2.2984 0.6226
14 (1) (1) 5.9709 2.6365 0.7141
15 (1) (1) 6.7846 2.9958 0.8115
16 (1) (1) 7.6459 3.3761 0.9145
17 (1) (1) (1) 3.7772 1.0231
18 (1) (1) (1) 4.1989 1.1374
19 (1) (1) (1) 4.6411 1.2571
20 (1) (1) (1) 5.1036 1.3824Utah LWPH June 2015
75
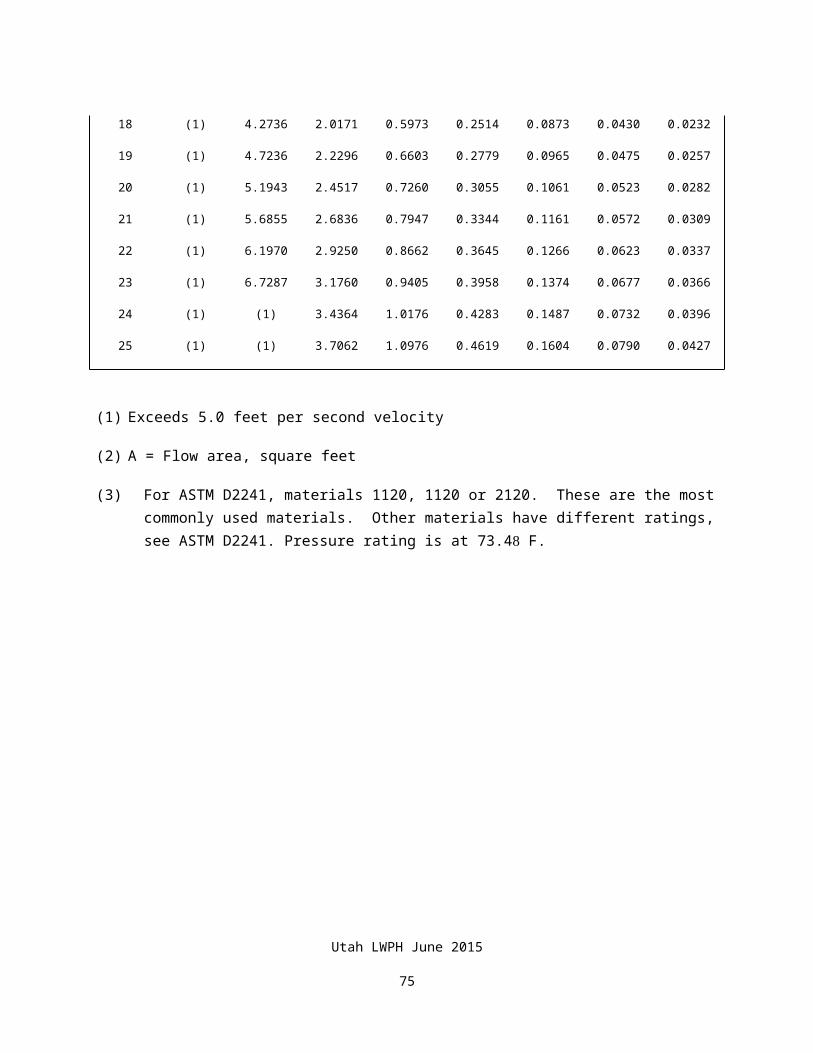
21 (1) (1) (1) 5.5862 1.5131
22 (1) (1) (1) 6.0888 1.6492
23 (1) (1) (1) 6.6112 1.7907
24 (1) (1) (1) (1) 1.9376
25 (1) (1) (1) (1) 2.0897
(1) Exceeds 5.0 feet per second velocity
(2) A = Flow area, square feet
Utah LWPH June 2015
76
Table 5.13CPS (Copper Pipe Size) POLYBUTYLENE WATER SERVICE PIPE
FRICTION LOSS ft/100 ftASTM D2666, SDR 9, 250 psi 0 73.40 F
Hazen Williams C = 150
Q
Gallons
per min.
3/4 inch
0.00248 A
0.675 ID
1 inch
0.00408 A
0.865 ID
1-1/4 inch
0.00617 A
1.064 ID
1-1/2 inch
0.00865 A
1.259 ID
2 inch
0.01480 A
1.649 ID
1 0.6589 0.1969 0.0718 0.0316 0.0085
2 2.3784 0.7107 0.2593 0.1142 0.0307
3 5.0395 1.5059 0.5493 0.2420 0.0650
4 8.5853 2.5654 0.9358 0.4123 0.1108
5 12.9783 3.8781 1.4146 0.6233 0.1675
6 (1) 5.4356 1.9828 0.8736 0.2347
7 (1) 7.2315 2.6379 1.1623 0.3123
8 (1) 9.2602 3.3779 1.4883 0.3999
9 (1) 11.5172 4.2012 1.8511 0.4973
10 (1) (1) 5.1064 2.2499 0.6045
11 (1) (1) 6.0921 2.6842 0.7212
12 (1) (1) 7.1572 3.1535 0.8473
13 (1) (1) 8.3007 3.6574 0.9826
14 (1) (1) (1) 4.1954 1.1272
15 (1) (1) (1) 4.7672 1.2808
16 (1) (1) (1) 5.3723 1.4434
17 (1) (1) (1) 6.0106 1.6149
18 (1) (1) (1) 6.6818 1.7952
19 (1) (1) (1) 7.3854 1.9842
20 (1) (1) (1) (1) 2.1819
Utah LWPH June 2015
77
21 (1) (1) (1) (1) 2.3883
22 (1) (1) (1) (1) 2.6031
23 (1) (1) (1) (1) 2.8265
24 (1) (1) (1) (1) 3.0583
25 (1) (1) (1) (1) 3.2984
(1) Exceeds 5.0 feet per second velocity
(2) A = Flow area, square feet
Utah LWPH June 2015
78
Table 5.14BLACK OR GALVANIZED STEEL PIPE
FRICTION LOSS ft/100 ftSchedule 40 (Standard)
Seamless & Electric Welded ASTM A120Hazen Williams C = 100
Q
Gallons
per min.
1/2 inch
350 psi
0.0021 A
0.622 ID
3/4 inch
350 psi
0.0037 A
0.824 ID
1 inch
350 psi
0.0060 A
1.049 ID
1-1/4 inch
500 psi
0.0104 A
1.380 ID
1-1/2 inch
500 psi
0.0141 A
1.610 ID
2 inch
500 psi
0.0233 A
2.067 ID
2-1/2 inch
500 psi
0.0332 A
2.469 ID
3 inch
500 psi
0.0513 A
3.068 ID
1 2.0792 0.5285 0.1631 0.0429 0.0202 0.0060 0.0025 0.0009
2 7.5050 1.9077 0.5886 0.1548 0.0731 0.0216 0.0091 0.0032
3 15.9018 4.0420 1.2472 0.3280 0.1548 0.0458 0.0193 0.0067
4 27.0903 6.8859 2.1248 0.5588 0.2637 0.0781 0.0329 0.0114
5 40.9521 10.4094 3.2120 0.8447 0.3987 0.1181 0.0497 0.0173
6 57.3995 14.5900 4.5020 1.1839 0.5588 0.1655 0.0696 0.0242
7 76.3630 19.4103 5.9894 1.5751 0.7434 0.2202 0.0926 0.0322
8 97.7858 24.8556 7.6696 2.0170 0.9520 0.2819 0.1186 0.0412
9 121.6193 30.9137 9.5390 2.5085 1.1840 0.3506 0.1476 0.0512
10 (1) 37.5740 11.5941 3.0490 1.4391 0.4262 0.1793 0.0623
11 (1) 44.8270 13.8322 3.6376 1.7169 0.5085 0.2140 0.0743
12 (1) 52.6646 16.2506 4.2736 2.0171 0.5973 0.2514 0.0873
13 (1) 61.0791 18.8470 4.9564 2.3394 0.6928 0.2915 0.1012
14 (1) 70.0639 21.6194 5.6855 2.6836 0.7947 0.3344 0.1161
15 (1) 79.6125 24.5658 6.4603 3.0493 0.9030 0.3800 0.1319
16 (1) 89.7194 27.6845 7.2804 3.4364 1.0176 0.4283 0.1487
17 (1) (1) 30.9738 8.1455 3.8447 1.1386 0.4791 0.1663
18 (1) (1) 34.4321 9.0549 4.2739 1.2657 0.5326 0.1849
Utah LWPH June 2015
79
19 (1) (1) 38.0581 10.0085 4.7240 1.3990 0.5887 0.2044
20 (1) (1) 41.8504 11.0058 5.1948 1.5384 0.6474 0.2248
21 (1) (1) 45.8077 12.0465 5.6860 1.6838 0.7086 0.2460
22 (1) (1) 49.9289 13.1303 6.1975 1.8353 0.7723 0.2681
23 (1) (1) 54.2129 14.2569 6.7293 1.9928 0.8386 0.2912
24 (1) (1) 58.6585 15.4260 7.2811 2.1562 0.9074 0.3150
25 (1) (1) 63.2648 16.6373 7.8529 2.3255 0.9786 0.3398
(1) Exceeds 10.0 feet per second velocity
(2) A = Flow area, square feet
(3) It is good design practice to design steel pipe operating pressure for not more that 50% of test pressure. The pressures shown are 50% of ASTM A120 test pressures.
Utah LWPH June 2015
80
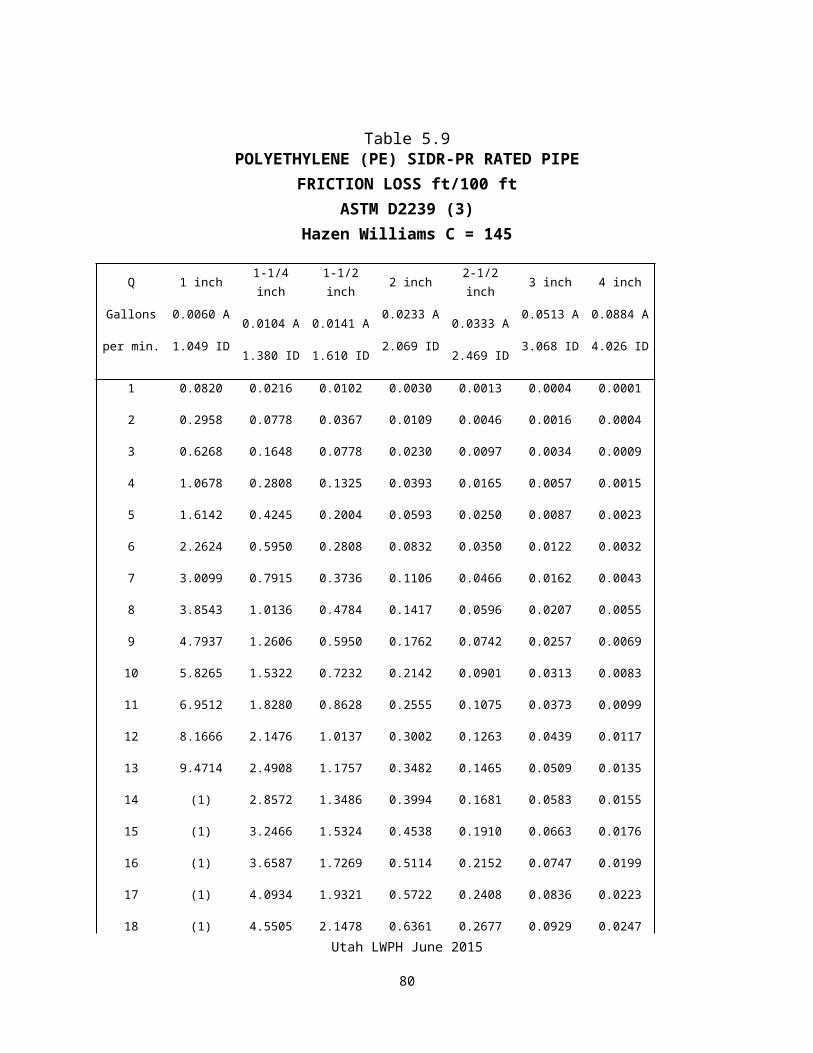
Table 5.15BLACK OR GALVANIZED STEEL PIPE
FRICTION LOSS ft/100 ftSchedule 80 (Standard)
Seamless & Electric Welded ASTM A120Hazen Williams C = 100
Q
Gallons
per min.
1/2 inch
424 psi
0.0016 A
0.546 ID
3/4 inch
425 psi
0.0030 A
0.742 ID
1 inch
425 psi
0.0050 A
0.957 ID
1-1/4 inch
750 psi
0.0089 A
1.278 ID
1-112 inch
750 psi
0.0123 A
1.500 ID
2 inch
750 psi
0.0205 A
1.939 ID
2-1/2 inch
750 psi
0.0294 A
2.323 ID
3 inch
750 psi
0.0459 A
2.900 ID
1 3.9223 0.8805 0.2550 0.0623 0.0286 0.0082 0.0034 0.0012
2 14.1580 3.1784 0.9204 0.2250 0.1031 0.0295 0.0123 0.0042
3 29.9983 6.7346 1.9503 0.4767 0.2185 0.0626 0.0260 0.0088
4 51.1052 11.4730 3.3225 0.8122 0.3723 0.1066 0.0442 0.0150
5 77.2552 17.3436 5.0226 1.2278 0.5628 0.1612 0.0669 0.0227
6 108.2829 24.3093 7.0397 1.7209 0.7888 0.2259 0.0937 0.0318
7 144.0573 32.3405 9.3655 2.2894 1.0494 0.3006 0.1247 0.0423
8 (1) 41.4133 11.9929 2.9317 1.3438 0.3849 0.1596 0.0542
9 (1) 51.5070 14.9160 3.6462 1.6713 0.4787 0.1986 0.0674
10 (1) 62.6040 18.1296 4.4318 2.0314 0.5818 0.2413 0.0819
11 (1) 74.6888 21.6292 5.2872 2.4235 0.6942 0.2879 0.0977
12 (1) 87.7474 25.4108 6.2117 2.8472 0.8155 0.3383 0.1148
13 (1) 101.7673 29.4709 7.2041 3.3022 0.9458 0.3923 0.1332
14 (1) (1) 33.8060 8.2639 3.7879 1.0850 0.4500 0.1527
15 (1) (1) 38.4133 9.3901 4.3041 1.2328 0.5114 0.1736
16 (1) (1) 43.2899 10.5822 4.8506 1.3893 0.5763 0.1956
17 (1) (1) 48.4333 11.8395 5.4269 1.5544 0.6447 0.2188
18 (1) (1) 53.8411 13.1614 6.0328 1.7280 0.7167 0.2433
Utah LWPH June 2015
81
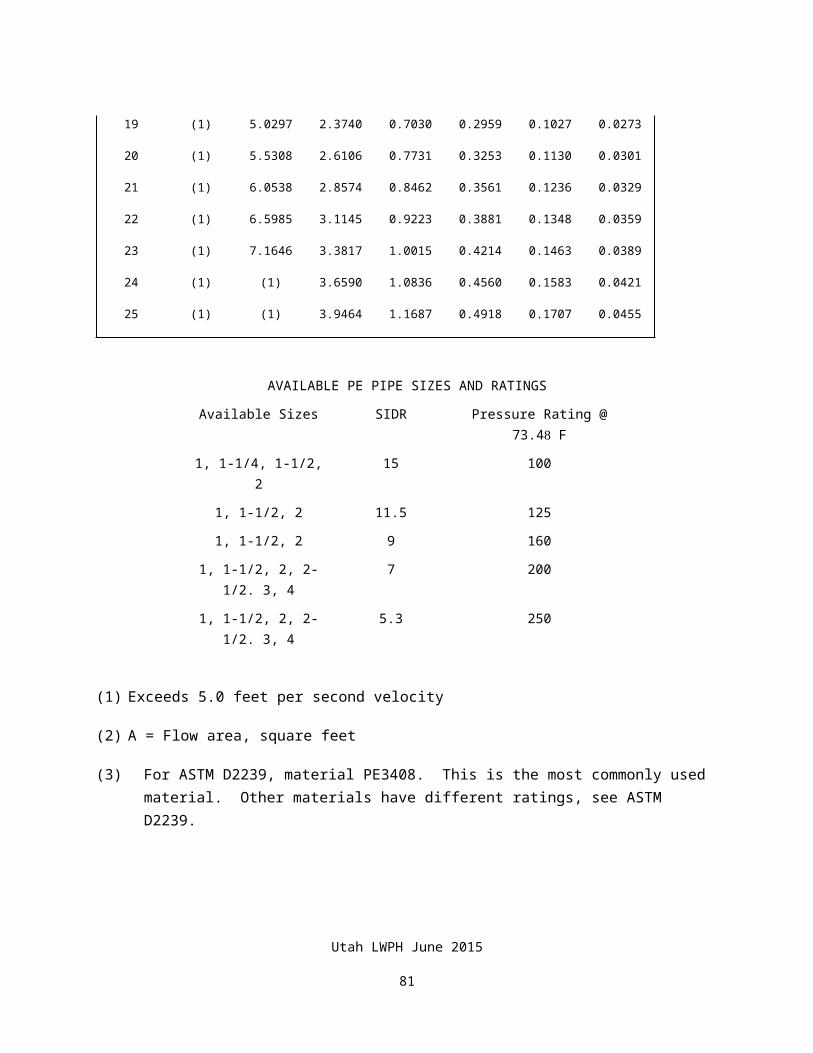
19 (1) (1) 59.5110 14.5474 6.6681 1.9099 0.7922 0.2689
20 (1) (1) 65.4410 15.9970 7.3325 2.1003 0.8711 0.2957
21 (1) (1) 71.6290 17.5097 8.0259 2.2989 0.9535 0.3236
22 (1) (1) 78.0733 19.0850 8.7480 2.5057 1.0393 0.3528
23 (1) (1) (1) 20.7225 9.4986 2.7207 1.1285 0.3830
24 (1) (1) (1) 22.4218 10.2775 2.9438 1.2210 0.4144
25 (1) (1) (1) 24.1825 11.0845 3.1749 1.3169. 0.4470
(1) Exceeds 10.0 feet per second velocity
(2) A = Flow area, square feet
(3) It is good design practice to design steel pipe operating pressure for not more that 50% of test pressure. The pressures shown are 50% of ASTM A120 test pressures.
Utah LWPH June 2015
82
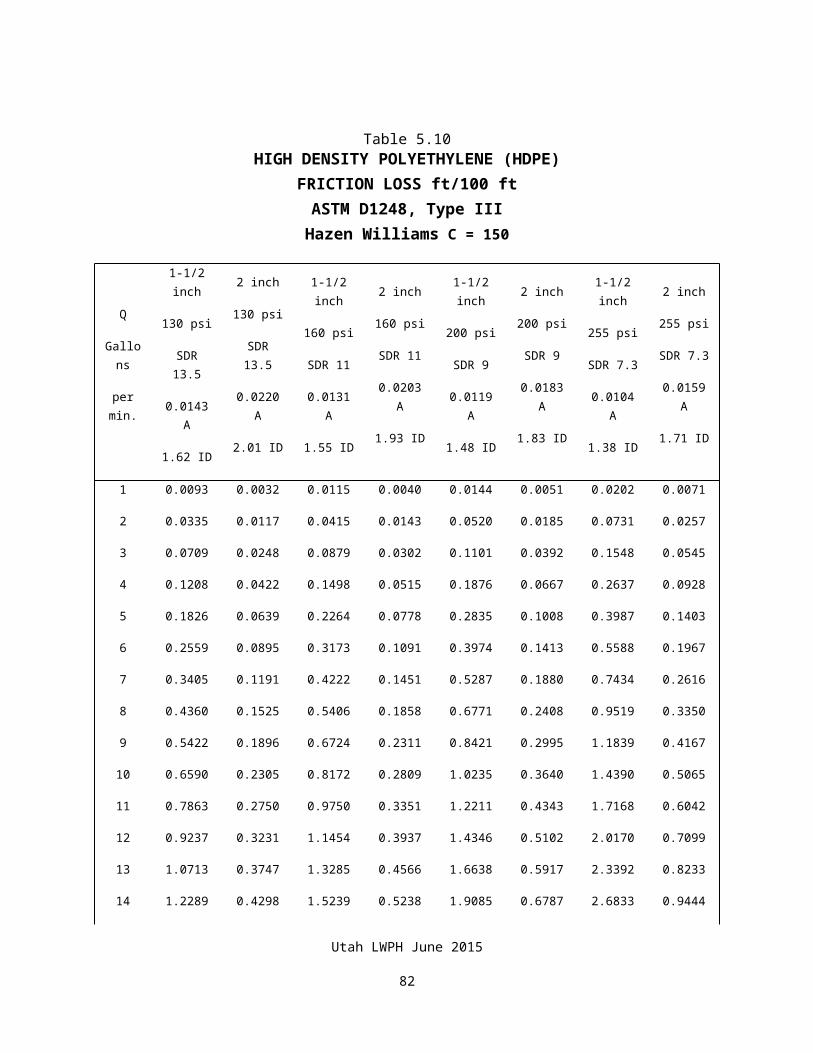
5.10 PVC PIPE FITTINGSSchedule 40 and 80 solvent weld and threaded fittings are covered by the following ASTM standards:
D2624 - Threaded Polyvinyl Chloride (PVC) Plastic Pipe Fittings, Schedule 80
D2466 - Polyvinyl Chloride (PVC) Plastic Pipe Fittings, Schedule 40
D2467 - Socket-Type Polyvinyl Chloride (PVC) Plastic Pipe Fittings, Schedule 80
These standards deal mainly with workmanship, materials, dimensions, tolerances, and testing. There are no pressure rating standards for PVC fittings in the ASTM specifications. The only pressure standards specified are for burst pressure.
One analysis, based very limited real data, proposes the upper limit working pressures for Schedule 40 and 80 PVC fittings as tabulated in Table 5.16. Use this as a general guide only. Actual allowable working pressures may vary widely with field conditions, particularly the frequency and degree of surge pressures anticipated. On high pressure pipelines, metal or other alternative type fittings may be needed.
Table 5.16Estimated Upper Limit Working Pressures for
Schedule 40 and Schedule 80 PVC Fittings
Nominal Diameter
(in)
Outside Diameter
(in)
Schedule 40 Schedule 80
Pressure Rating Pressure Rating
Burst(psi)
Working(psi)
Burst(psi)
Working(psi)
1/2 0.840 1910 358 2720 509
3/4 1.050 1540 289 2200 413
1 1.315 1440 270 2020 378
1-1/4 1.660 1180 221 1660 312
1-1/2 1.900 1060 198 1510 282
2 2.375 890 166 1290 243
2-1/2 2.875 970 182 1360 255
3 3.500 840 158 1200 225
Utah LWPH June 2015
83
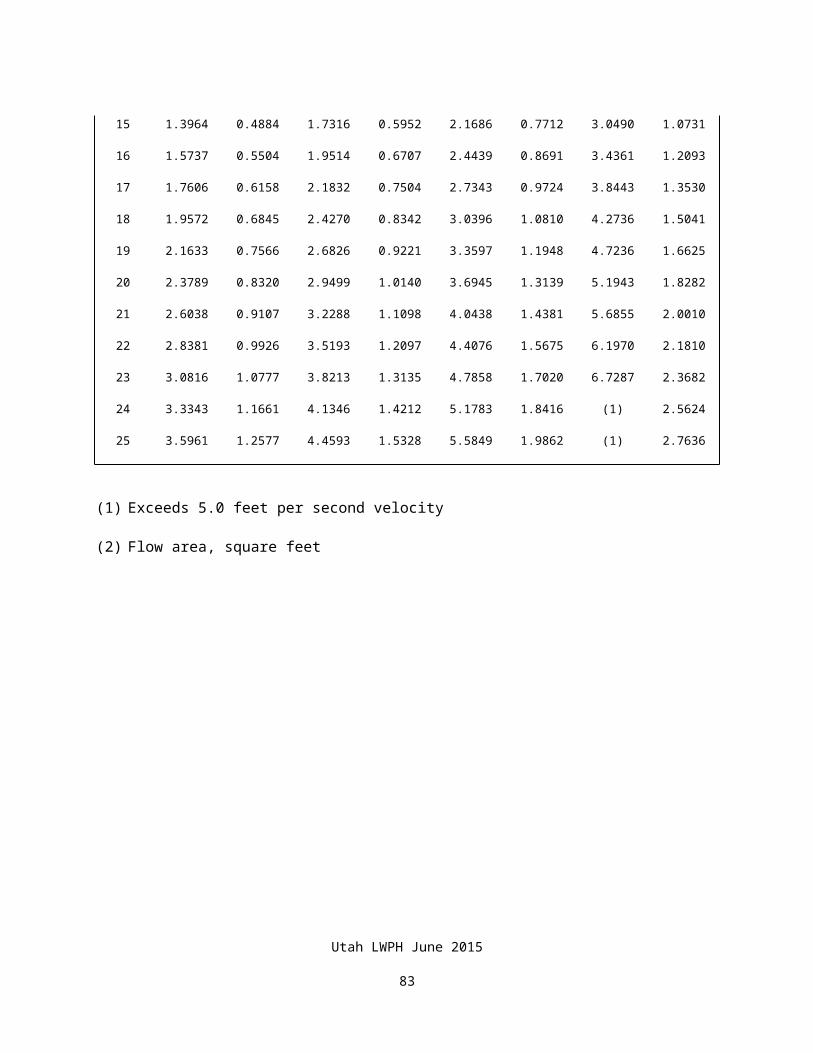
Utah LWPH June 2015
84
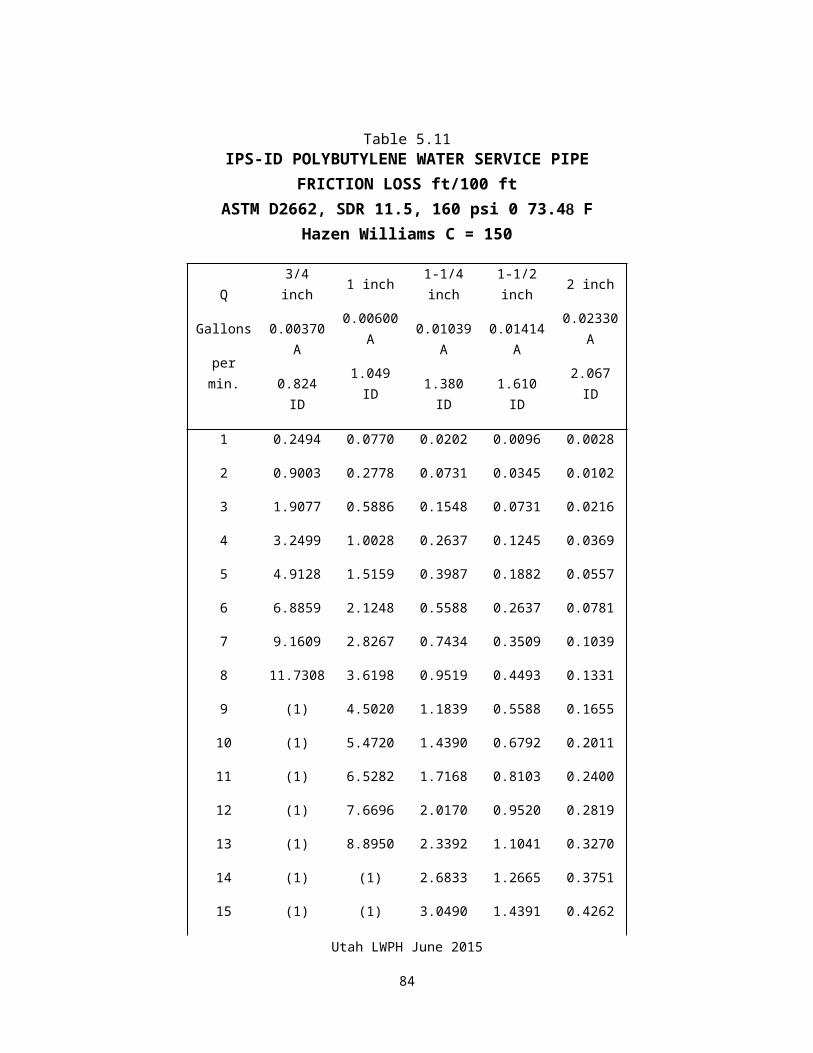
CHAPTER 6
PRESSURE AND SURGE CONTROL
CHAPTER 6 - PRESSURE AND SURGE CONTROL
TABLE OF CONTENTS
PART 6.1 PIPELINE PRESSURE CONTROL 6-16.1.1 Need for Pressure Control 6-16.1.2 Pressure Reducing Valves 6-26.1.3 Grade Break at Tank 6-4
PART 6.2 SURGE CONTROL 6-66.2.1 Pressure Tank as Surge Chamber 6-66.2.2 Minimize Frequency of Pump Cycle 6-7 Flow Control Valve 6-9 Flow Controlled Pressure Switch 6-9 Pump Cycle Timer 6-96.2.3 Install Air Valves 6-116.2.4 Use Slow Closing Valves 6-116.2.5 Control Flow Rate at Float Valve 6-116.2.6 Operation Plan 6-11
PART 6.3 CALCULATING SURGE PRESSURE 6-126.3.1 Pressure Wave Velocity 6-126.3.2 Surge Pressure 6-126.3.3 Unit Surge Pressure 6-126.3.4 Pressure Surge Examples 6-13
FIGURES
Figure 6.1 Typical Pressure Reducing Valve Installation 6-2Figure 6.2 Pressure Valve Parts and Design Charts 6-3Figure 6.3 Float Valve Box 6-5Figure 6.4 Operation of a Surge Chamber 6-7Figure 6.5 Remote Multi Tank Installation 6-8
Utah LWPH June 2015
85
Figure 6.6 Flow Rate Controller Valves 6-10Figure 6.7 Flow Controlled Pressure Switch 6-11Figure 6.8 Pressure Surges 6-13
TABLE
Figure 6.1 Typical Pressure Reducing Valve Installation 6-13
Utah LWPH June 2015
86
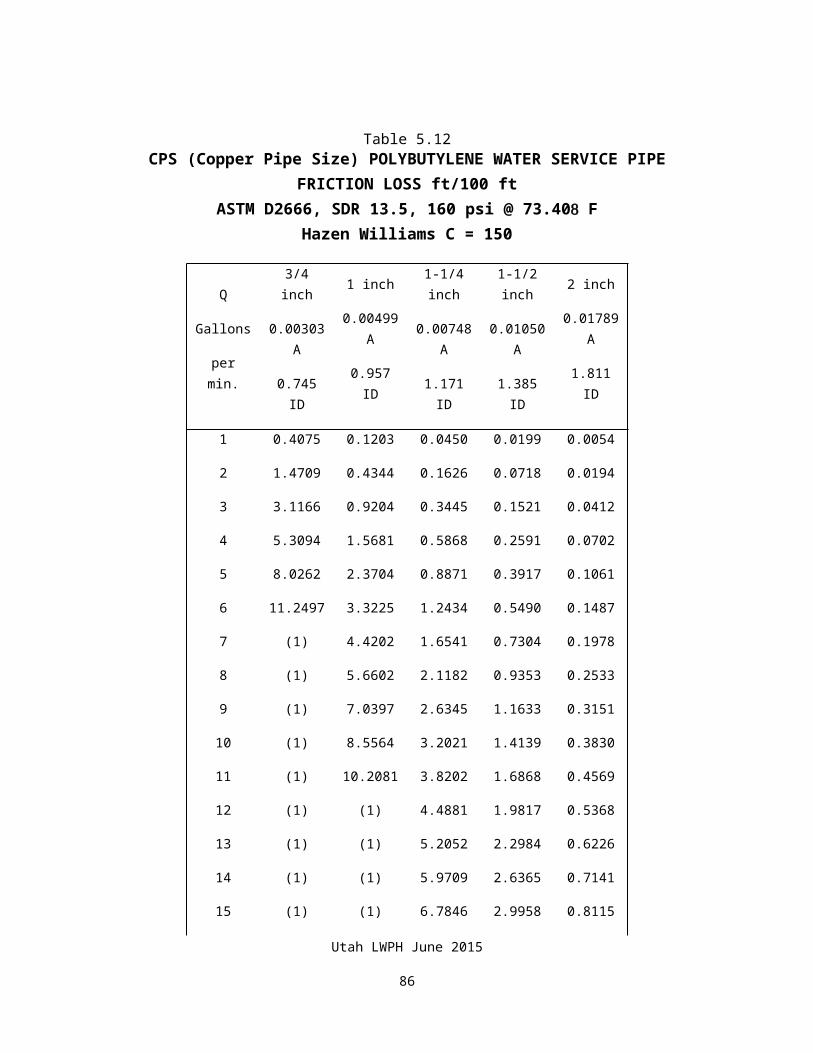
CHAPTER 6 -- PRESSURE AND SURGE CONTROL
6.1 PIPELINE PRESSURE CONTROL
6.1.1 Need for Pressure ControlThere are frequent circumstances in long pipelines where the operating pressure at a hydrant is too high. Due to the limitations of hydrant and float valve mechanisms, maximum pressure at a hydrant and/or float valve should be limited to not more than 80 psi. In such a case, pressure should be reduced before flow is turned into the valve.
The cost of high pressure pipe can sometimes be reduced by installing a pressure reducing station in the pipeline. This allows use of a pipe with lower pressure rating. The cost savings must always be weighed against potential operation and maintenance problems which are frequently a result of installing a pressure reducing valve.
There are two ways to reduce pressure in a segment of pipeline. The first is to install a pressure reducing valve, and the second is to install a tank with a float valve and a gravity pipeline extension.
Pressure reducing valves or tank/float valves with gravity pipeline extensions, should be used as a last resort. They are mechanical devices that can, and do, sometimes fail to operate. In many cases there is no other way to maintain pressures below 80 psi, so a pressure reducing device must be installed. Tank/float valves refer to an in-line float valve box as shown in Figure 6.3.
Examples in Chapter 11 show how to perform hydraulic calculations where pressure reduction is required.
Utah LWPH June 2015
87
6.1.2 Pressure Reducing ValvesFigure 6.1 illustrates a typical pressure reducing valve installation.
Figure 6.1TYPICAL PRESSURE REDUCING VALVE INSTALLATION
The pressure reducing valve size should be selected based on manufacturer's recommendations. Use of too small a valve can create very high velocities in the valve and result in premature valve failure while too large a valve can cause poor pressure regulation.
Utah LWPH June 2015
88
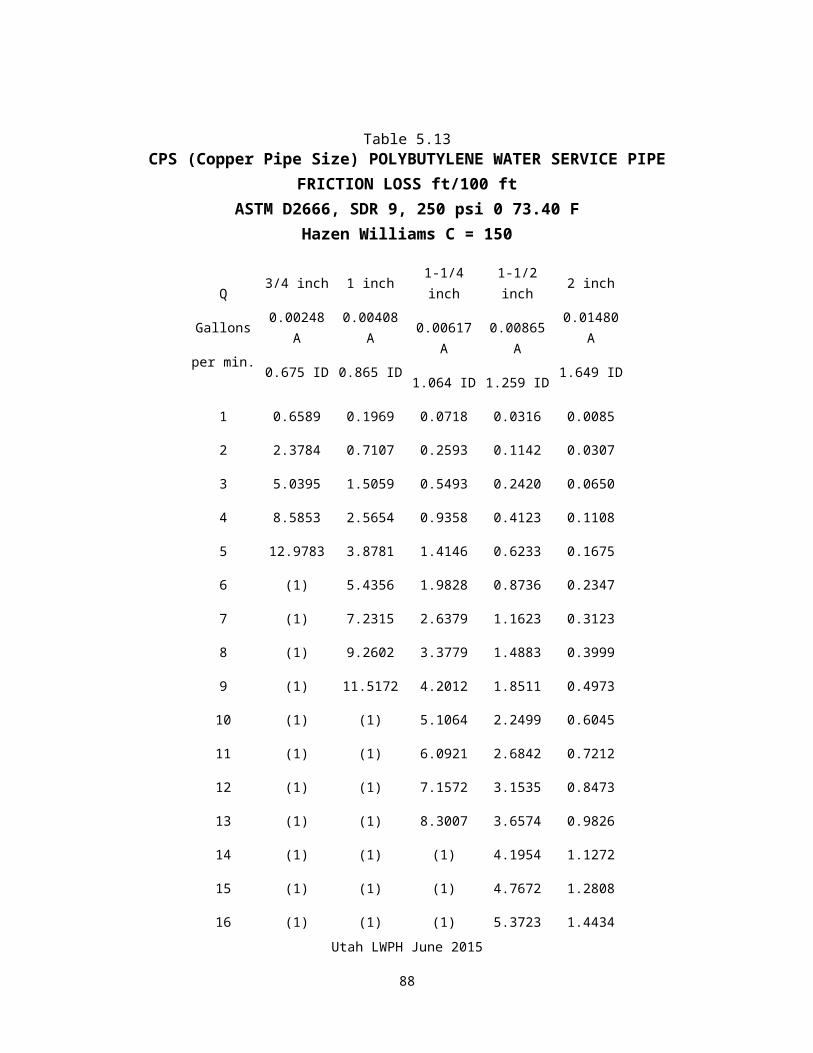
Figure 6.2 illustrates construction of a typical pressure reducing valve and a manufacturer design chart.
Figure 6.2PRESSURE VALVE PARTS AND DESIGN CHARTS
Utah LWPH June 2015
89
The valve illustrated in Figure 6.2 has a built-in strainer. Pressure reducing valves will not operate properly if debris gets into the mechanism. If sediment and debris are a problem in the pipeline, a more elaborate filter system may be required.
In designing a pressure reducing valve, the general rule is that velocity through the valve should not exceed ten feet per second. Manufacturer's charts show the maximum capacity for each size of valve based on design velocity.
There is a pressure reducing valve pressure loss called "Fall-off" that must be considered in the design. When no flow is passing through the valve, there is zero fall-off. When maximum rated flow is passing through the valve, there is up to 20 psi pressure fall-off. So if the pressure reducer is set at 75 psi at no flow, the static hydraulic grade line would be at (75 x 2.31) = 173 feet above valve elevation. If the valve were to operate at design flow, hydraulic grade line would start at the valve at [(75 - 20) x 2.31] = 127 feet above valve elevation.
When a pressure-reducing valve is used in a design, the plans should indicate, as a minimum, the pressure differential and the allowable “fall-off” pressure for the design flow rate. This information will be sufficient to allow the installer to obtain the appropriate valve from the supplier.
Use of more than one pressure-reducing valve in a pipeline may result in oscillating pressures if misused or improperly installed. When more than one pressure-reducing valve is used, the design shall be approved by an engineer with appropriate job approval authority.
Figure 6.2 illustrates typical manufacturer information concerning valve fall-off values.
6.1.3 Grade Break at Tank
Starting a gravity pipeline at a tank is one positive way of controlling pressure in a segment of pipeline. If the float valve hangs up, the tank simply overflows. Both static and dynamic
Utah LWPH June 2015
90
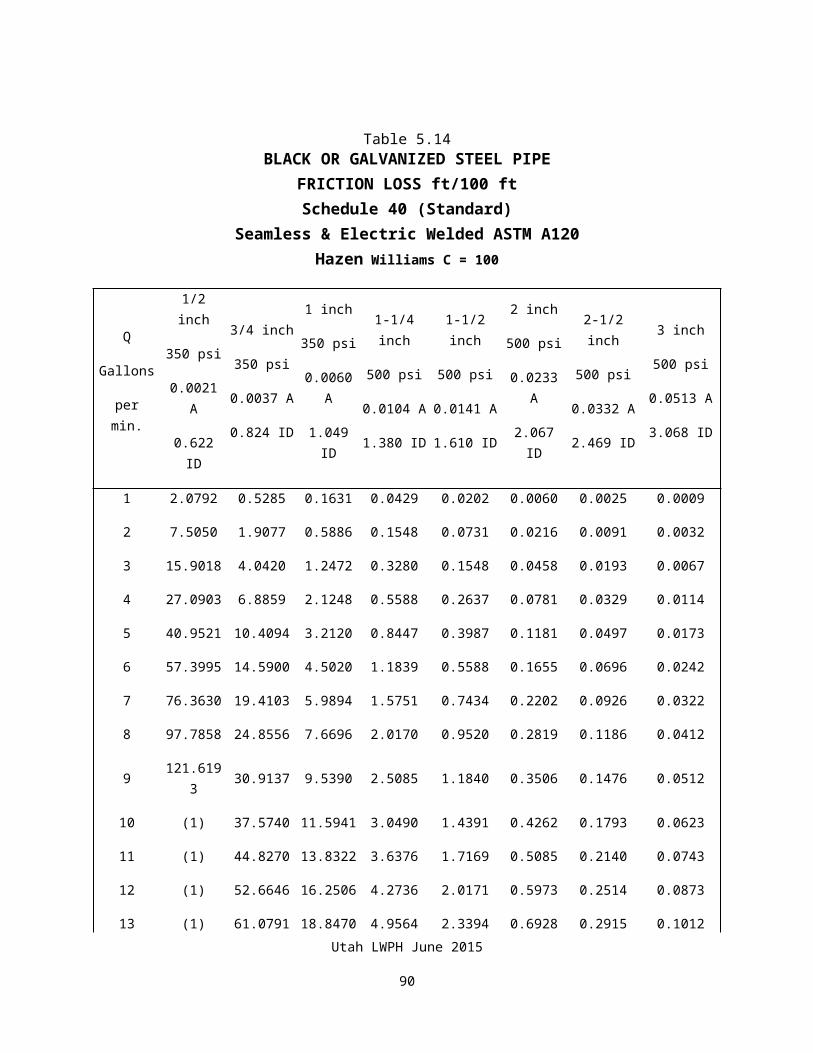
hydraulic grade line starts at the water surface in the tank. Only a usually insignificant pipeline entrance loss is experienced under design flow.
Figure 6.3 illustrates one type of tank/float valve installation. This is a small tank with a float valve used strictly for pressure regulation. A stock tank can be used in the same way.
Utah LWPH June 2015
91
Figure 6.3FLOAT VALVE BOX
Utah LWPH June 2015
92
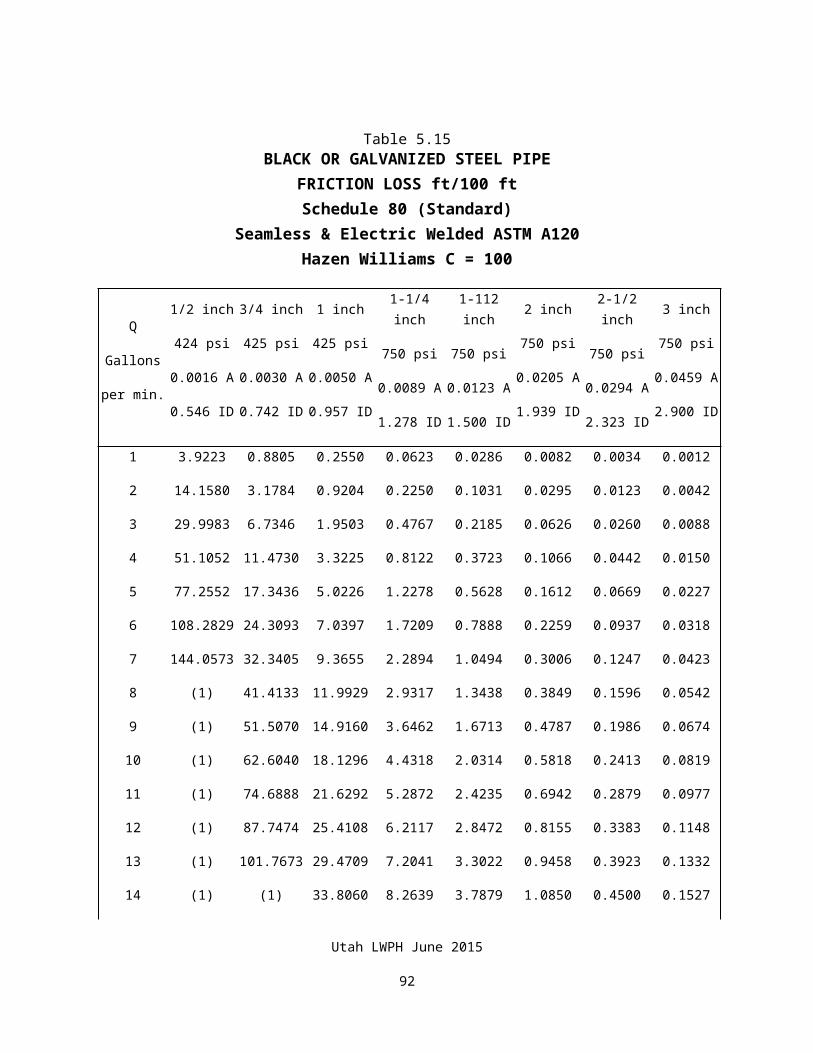
6.2 SURGE CONTROLSurge (water hammer) can be a serious problem in long stockwater pipelines. Consider what happens when a two-mile-long pipeline is suddenly shut off. The entire mass of water in the pipe is moving in the direction of flow. When the water is suddenly shut off, considerable force is required to stop the momentum of the large water mass.
Actual pressure build up depends on the total volume of water in the pipe--velocity at which the water is moving and how fast the water is stopped. Pressures can be much greater than operating pressure and can even be greater than static pressure in the pipeline.
In low head, low pressure pipelines, surge is usually not a significant consideration. The pipe and appurtenances have high enough safety factors to withstand minor surges. Surge is almost always a factor that must be addressed in long, high pressure pipelines where flow can be suddenly stopped for any reason.
A frequent surge problem is encountered on pumped systems. When the pump shuts off, the water starts to reverse in the line. A check valve closes, setting up a pressure wave and cyclic pressure surges. If the pump system contains an automatic pressure switch, the pump can rapidly cycle on and off causing damage to the pump, pipeline, and valves.
Another frequent cause of surges is rapidly turning off a hydrant. Frost free hydrants can be shut off very rapidly by slamming down the handle. This is sure to cause surges in the pipeline. Float valves will also be turned rapidly on or off if something causes the water in the tank to slosh around.
Ways in which surge can be controlled include:
6.2.1 Pressure Tank as Surge Chamber
For automatic pressure systems, a properly maintained pressure tank will act as a surge chamber. The air bubble in the pressure tank acts as a cushion for water reversing in the pipeline. Figure 6.4 illustrates how a surge chamber works.
Utah LWPH June 2015
93
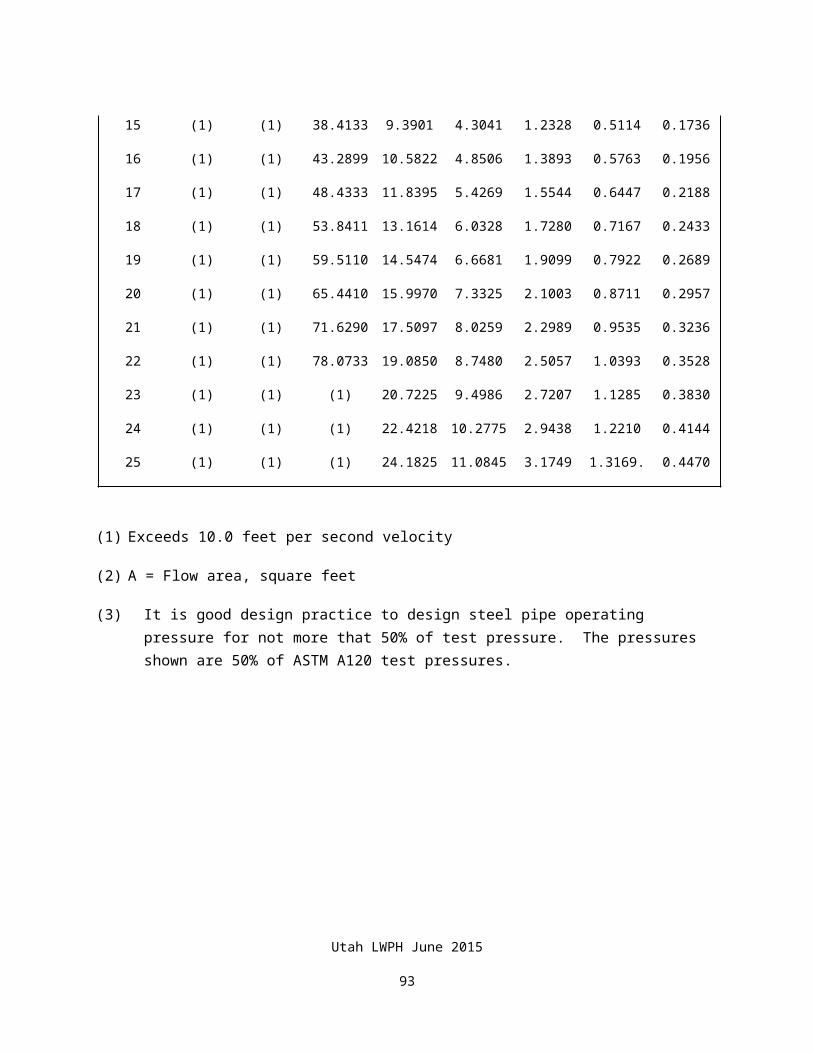
Figure 6.4OPERATION OF A SURGE CHAMBER
Sometimes when pressure at the pump is very high, a normal pressure tank cannot be used. In that case, it may be necessary to install a high pressure rated diaphragm-type pressure tank or specially designed surge chamber. These are expensive but may be needed in high pressure automatic systems.
It is sometimes proposed that a homemade surge chamber be installed. This is a piece of pipe capped at one end and an air valve installed in the outer end. The chamber is filled with compressed air after the system is pressurized with water.
Homemade surge chambers are not recommended. Experience and studies have shown that this type of chamber soon waterlogs and becomes completely ineffective.
6.2.2 Minimize Frequency of Pump Cycles
Minimize the frequency of turning the pump on or off. This will reduce the number of surges that pipeline and system will have to endure. This can be accomplished by increasing pressure tank storage. Figure 6.5 illustrates a remote multiple tank setup for increased storage.
Utah LWPH June 2015
94
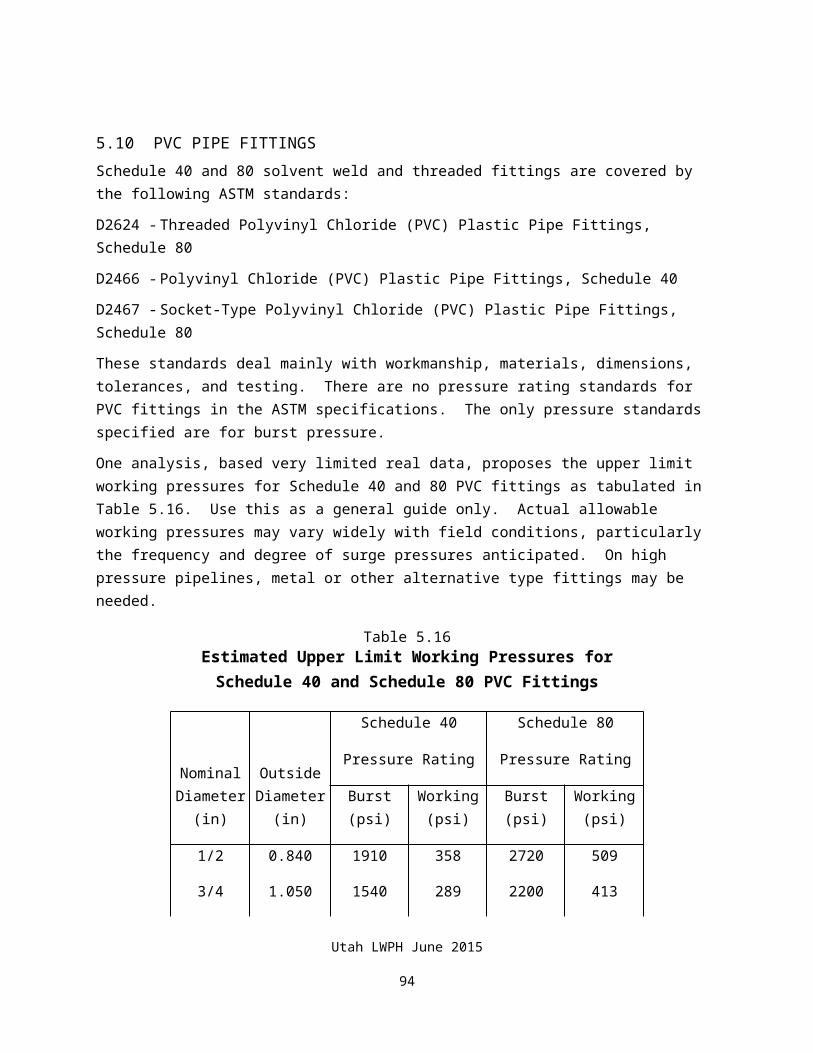
Figure 6.5REMOTE MULTI-TANK INSTALLATION
Remote tanks can generate problems of their own. When the remote tank is far out on the pipeline, hydraulic conditions can be such that during initial pump flow, friction loss in the pipe will cause pressure to buildup to cut out pressure and turn the pump off before the remote tanks have filled to design pressure. As pressure in the system equalizes, the pump will again start. A rapid cycling can be set up which can be very destructive to pump and pipeline.
Utah LWPH June 2015
95
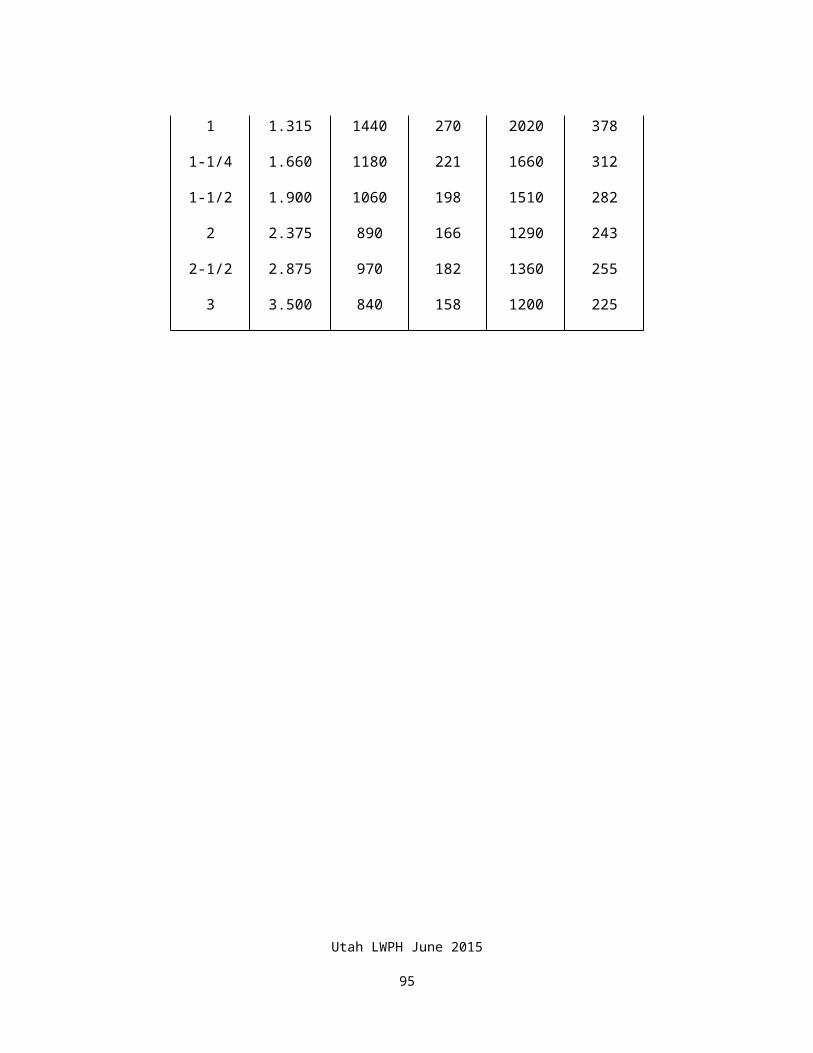
Three possible solutions to this problem are:
(1) Flow Control Valve
If this problem is encountered, one solution is to install an adjustable flow rate control valve in the pipeline near the pump. With this valve, flow rate is adjusted downward until rapid cycling is stopped. Figure 6.6 illustrates this type of installation and two types of flow rate control valves. The valves shown are expensive.
Sometimes rubber orifice flow control valves of the type used to control flow to sprinkler heads or trickle system laterals in irrigation systems can be used to control flow in moderate pressure systems. These non-adjustable flow control valves are inexpensive.
(2) Flow Controlled Pressure Switch
There is a pressure regulator/pressure switch combination valve which works so that once the pump comes on, it will not shut off until all flow in the system has stopped. This guarantees that the pump will not cycle except between flow events. Figure 6.7 illustrates this type of valve. There are two models with different flow rate ratings. At least two pump manufacturers supply this type of valve as an accessory.
If either of the above two valves are used, make sure that the pressure rating of the pipe between the pump and the valve is high enough to withstand the maximum pressure the pump is capable of generating. This will require a review of the pump curve. With these types of valves, the pressure between pump and valve will reach the maximum that the pump is able to generate.
(3) Pump Cycle Timer
Another possible solution is to install short period timers in conjunction with the pressure switch. The timer is set in a manner that will force minimum pump on or off cycle times. It will be especially important to have adequate pressure tank storage; tank, pipe and accessories rated for maximum pump pressure and pressure relief valves installed if this alternative is selected.
Utah LWPH June 2015
96
Figure 6.6FLOW RATE CONTROLLER VALVES
Utah LWPH June 2015
97
Figure 6.7
FLOW CONTROLLED PRESSURE SWITCH
6.2.3 Install Air ValvesRemnants of air in the pipeline can set up conditions that promote surges. Air valves or vents should be installed in the pipeline to remove air under pressure. See Chapter 7 for more details on air removal.
6.2.4 Use Slow Closing ValvesInstall throttling type globe valves instead of frost free hydrants. Globe valves must be installed in access risers so that they are below frost line.
6.2.5 Control Flow Rate at Float ValveControl the maximum flow rate through a float valve by installing an orifice or a flow control valve. Low cost rubber orifice type flow control valves of the type used in sprinkler systems can be installed just ahead of the float valve.
Utah LWPH June 2015
98
6.2.6 Operation PlanProvide an operation plan to the operator cautioning him or her to close valves slowly and otherwise operate the system in a manner which will minimize surges in the system.
6.3 Calculating Surge PressureThe methods for calculating the surge response from an instantaneous change in velocity in livestock pipelines are shown below.
6.3.1 Pressure Wave Velocity
The first step in calculating surge pressure is to determine the velocity of the pressure wave, equation 6.1. The pressure wave velocity is dependent upon both the pipe properties and the fluid properties. Pipe properties include modulus of elasticity of the pipe material, pipe diameter and wall thickness. Fluid properties include the bulk modulus of elasticity and density.
Equation 6.1: Pressure wave velocity.
a=4660
√1+k ( DR−2 )
E
Where: a = wave velocity, fps
k = fluid bulk modulus, 300,000 psi for water
DR = dimension ratio for the pipe (OD/t)
E = modulus of elasticity of the pipe, psi
E = 400,000 psi for PVC 12454
E = 115,000 psi for PE 3406
E = 150,000 psi for HDPE 3408, 3608, 4710
6.3.2 Surge Pressure
Utah LWPH June 2015
99
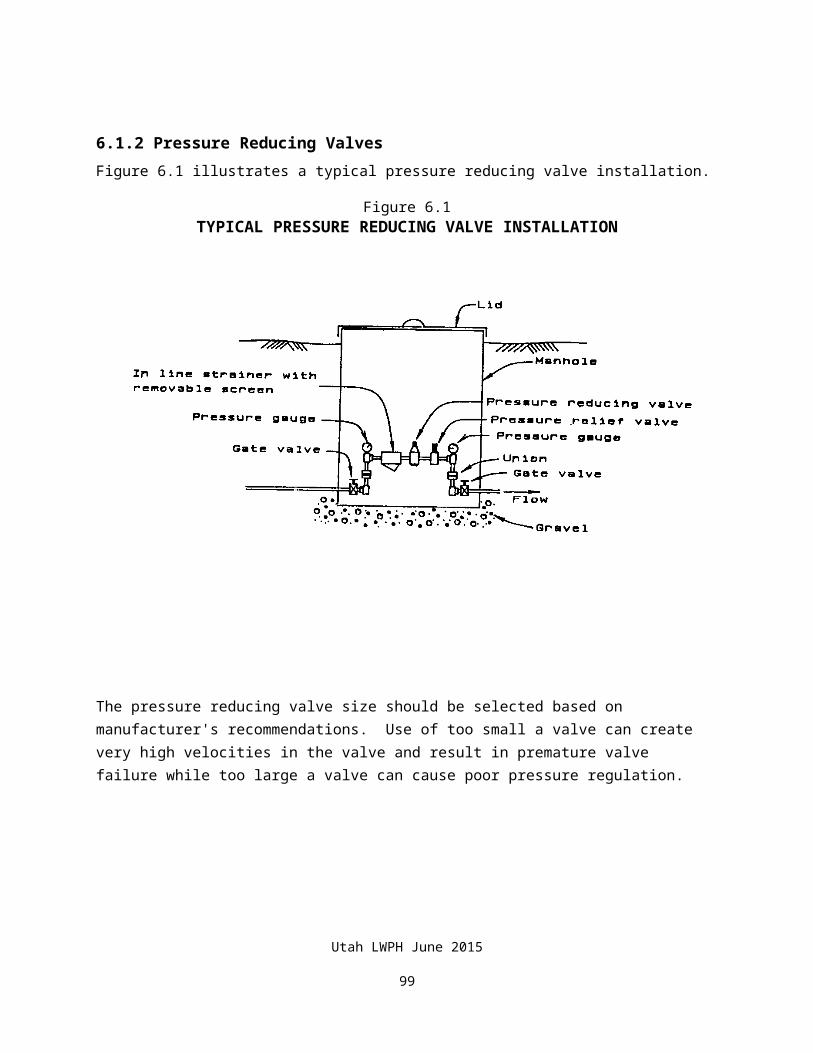
The surge pressure due to the instantaneous change in velocity is then calculated as shown in equation 6.2.
Equation 6.2: Surge pressure.
Ps=aΔV
2. 31 g
Where: Ps = pressure surge, psi
a = wave velocity, fps
∆V = change in velocity, fps
g = acceleration due to gravity, 32.2 ft/sec2
6.3.3 Unit Surge Pressure
The pressure surge calculations shown above can be simplified using equation 6.3 along with the unit (1 fps) change in velocity as shown in table 6.1.
Utah LWPH June 2015
100
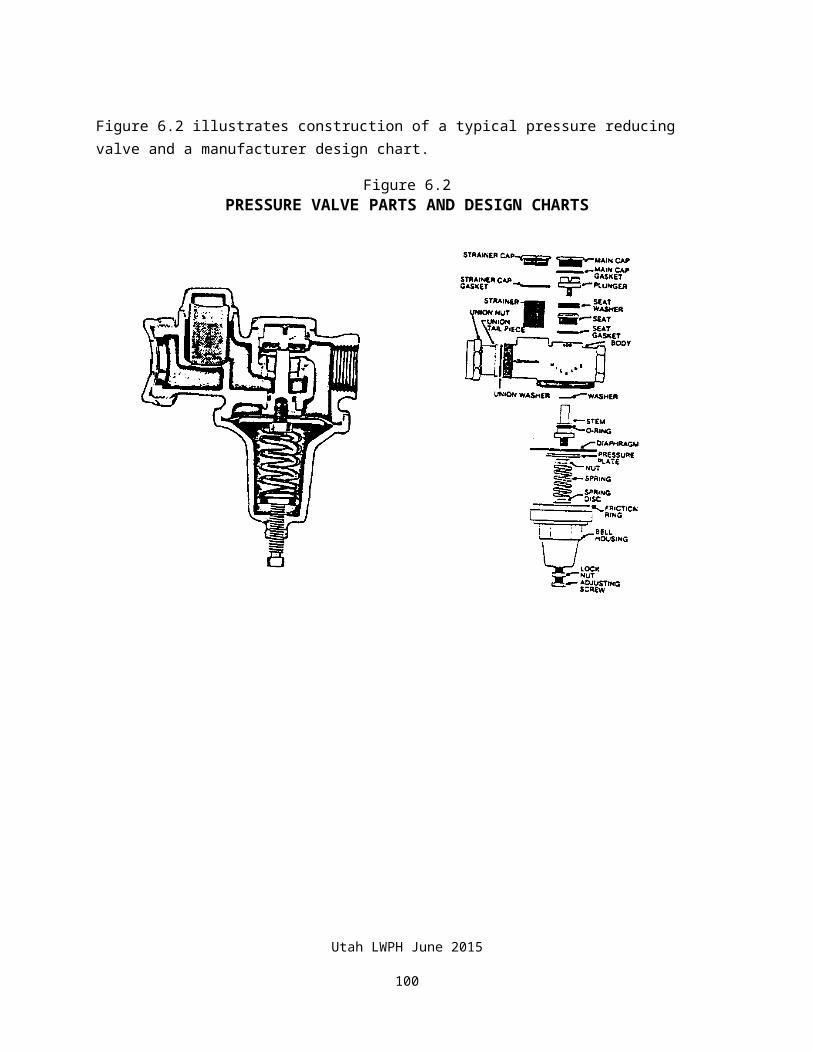
Equation 6.3: Surge Pressure.
Ps=ΔV⋅P sΔV=1 fps
Where: Ps = pressure surge, psi
∆V = change in velocity, fps
Ps∆V=1 fps = Pressure surge for 1 fps change in velocity, psi/fps
Table 6.1: Unit surge pressures for PVC and PE pipe.
PVC Pipe Pressure Surge
PE 3408 Pressure Surge
HDPE Pressure Surge
Dimension Ratio
Pressure Surge, psi/fps
(ΔV = 1 fps)
Dimension Ratio
Pressure Surge, psi/fps
(ΔV = 1
fps)
Dimension Ratio
Pressure Surge, psi/fps
(ΔV = 1
fps)
13.5 20.2 7.3 16.3 7.3 18.9
14 19.8 9 14.3 9 16.5
17 17.9 9.3 14.0 11 14.6
18 17.4 11 12.7 13.5 13.0
21 16.0 13.5 11.3 15.5 12.0
25 14.7 17 9.9 17 11.4
26 14.4 21 8.8 21 10.2
32.5 12.8 26 7.9 26 9.1
41 11.4 32.5 7.0 32.5 8.1
Pressure Surge Example
Example 1: Use equation 6.1 and 6.2 to calculate the surge pressure in a 1 ½ inch, SDR 26, PVC livestock pipeline with a maximum flow rate of 10 gpm.
Step 1: Calculate wave velocity
Utah LWPH June 2015
101
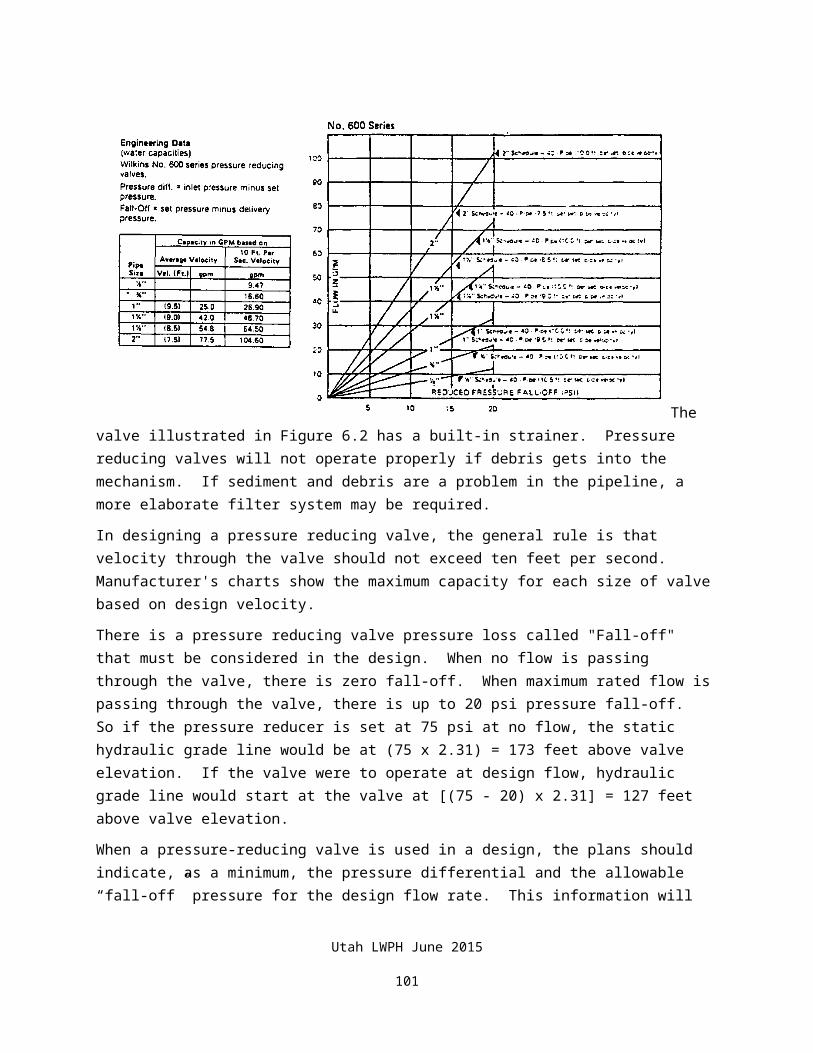
a=4660
√1+300 , 000 (26−2 )400 ,000
=1069. 1 fps
Equation 6.1
Step 2: Calculate ∆V
Convert maximum Q from gpm to cfs.
Maximum Q (cfs)=10. 0 gpm
448 . 8 cfsgpm
=0 . 0223 cfs
Determine cross-section area of pipe (ft2)
A=0.0168 ft2 Table 5.3, page 5-8.
ΔV =QA
= 0 .0223 cfs0.0168 ft2
=1. 33 fps
Step 3: Calculate Surge Pressure
Ps=1069 .1×1. 33
2 .31×32. 2=19.1 psi
Equation 6.2
Example 2: Use equation 6.3 to determine the pressure surge in a pipeline flowing a 1.3 fps due to a sudden valve closure. The pipe material is SDR 26, PVC.
Ps∆V=1 fps = 14.4 psi/fps Table 6.1
Ps = 1.3 fps x 14.4 psi/fps = 19.1 psi Equation 6.3
Utah LWPH June 2015
102
CHAPTER 7
AIR CONTROL
CHAPTER 7 - AIR CONTROL
TABLE OF CONTENTS
PART 7.1 GENERAL 7-1PART 7.2 AIR/GAS PROBLEMS 7-1PART 7.3 AIR IN LOW HEAD GRAVITY PIPELINES 7-3PART 7.4 AIR CONTROL IN HIGH HEAD, LONG PIPELINES 7-3PART 7.5 AIR VALVES AND HOW THEY WORK 7-6PART 7.6 TYPES OF VALVES 7-10PART 7.7 AIR VALVE INSTALLATION 7-14
FIGURES
Figure 7.1 Releasing Air from Pipeline 7-2Figure 7.2 Typical System with Air Valves 7-5Figure 7.3 Vacuum Relief 7-7Figure 7.4 Release of Large Volumes of Air During Filling 7-8Figure 7.5 Water and Pressure Keep Float Valve Closed 7-8Figure 7.6 Air Release Valve for Releasing Air While Pipe
is Under Pressure 7-9Figure 7.7 Typical Air Release Valves 7-11Figure 7.8 Typical Air Relief/Vacuum Valves (two way) 7-12Figure 7.9 Typical Air/Vac/Air Release Valves (three way) 7-13Figure 7.10 Air Valve Installation 7-14
Utah LWPH June 2015
103
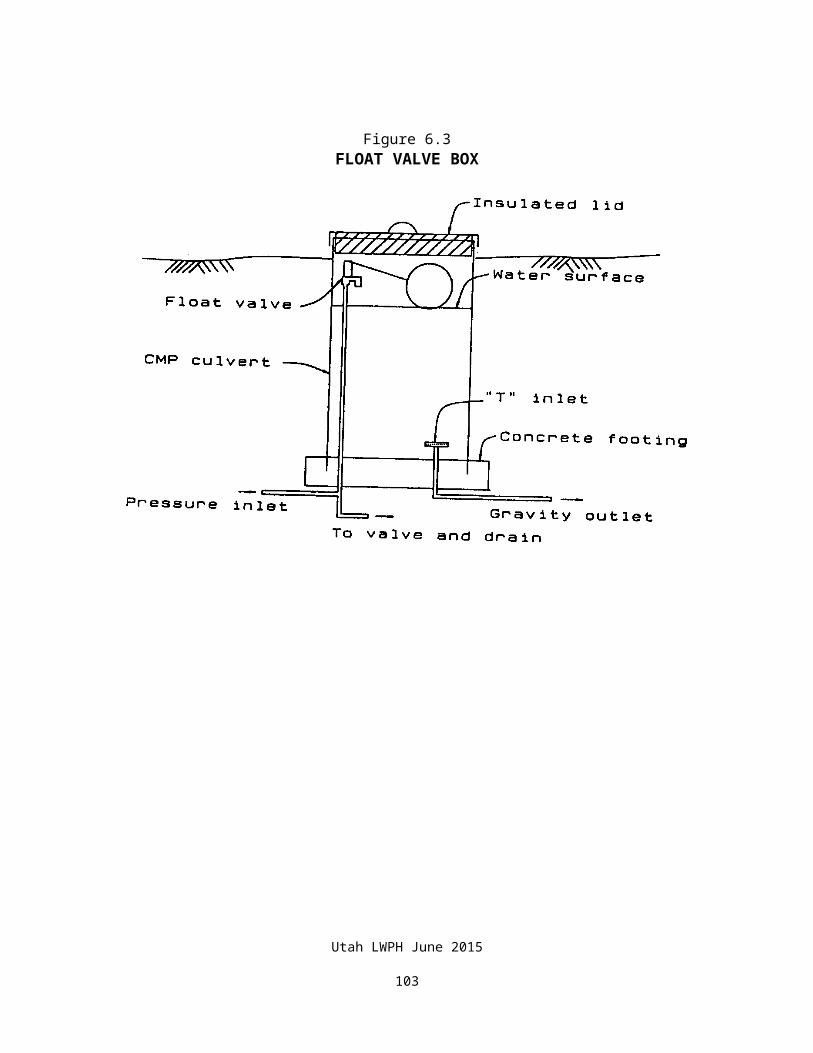
CHAPTER 7 - AIR CONTROL
7.1 GENERALAir trapped in stockwater pipelines can reduce or even completely stop the flow of water in the line. This is particularly a critical problem in long pipelines and those that operate under very low pressure.
7.2 AIR/GAS PROBLEMSAir or gas gets into a pipeline in several ways. These include:
When a pipeline is drained, air enters the line. If a means for air escape is not provided, air will be trapped at high points in the pipeline.
There are various forms of gasses in well waters. These gases can come out of solution during pipeline operation. Some wells have more serious gas problems than others.
If the water level in a well or other source falls below the pump intake, air is drawn into the pipeline by the pump.
In gravity systems, air can be drawn into the pipeline when water surface falls below the pipeline entrance.
Utah LWPH June 2015
104
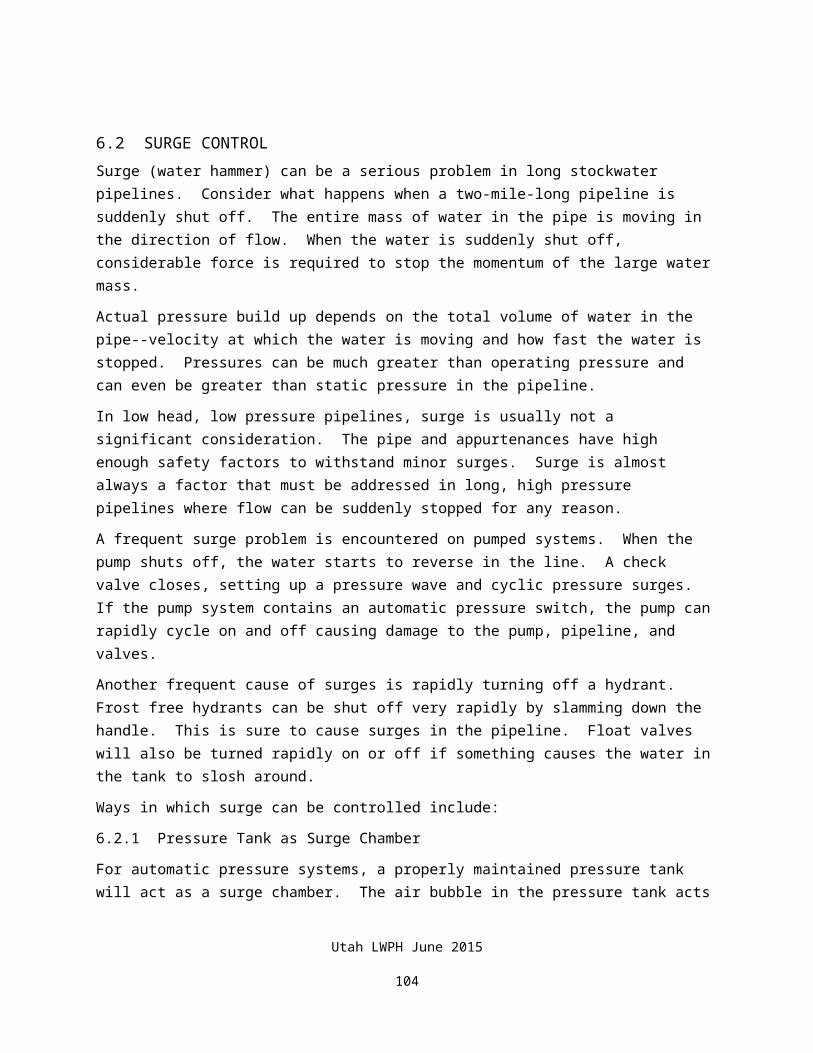
Figure 7.1RELEASING AIR FROM PIPELINE
Figure 7.1 illustrates what happens when air is trapped at a high point in a pipeline. A bubble is formed at the high point. The effect is to reduce the cross-sectional area of the pipeline and thus restrict flow. This has the same effect as inserting a short length of smaller diameter pipe in the pipeline. Velocity accelerates through the smaller section of pipe and friction loss is increased. Since friction loss is a function of the square of velocity, friction loss can increase significantly when a large bubble is present. If the bubble is large enough or there are many of them, flow can be shut off completely.
As velocity increases, the air pocket tends to be pushed down the pipe in some sort of elongated bubble. There may be several separate bubbles formed. If velocities are high enough and elevation difference to the next low point is not too great, the bubble may be pushed through to the next high point or outlet.
Utah LWPH June 2015
105
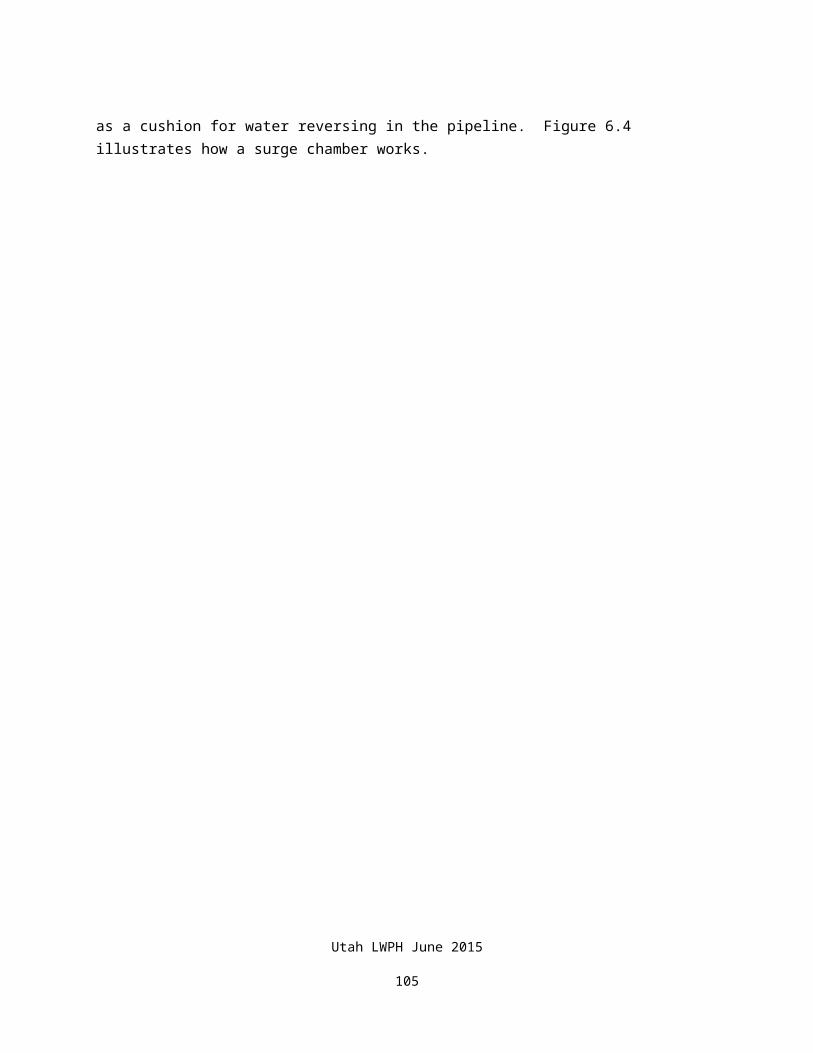
7.3 AIR IN LOW HEAD GRAVITY PIPELINES (20 psi or less)Air locks are a frequent problem in very low flow, low pressure pipelines. An example of this type of system is a spring fed installation. In this case, the velocity of water is very low. Air bubbles do not get pushed out, even if the summit in the line is only one pipe diameter above the rest of the line.
The solution for air lock problems can be either of the following:
Install an air vent at all summits in the line and at the beginning/inlet of the line. Figure 3.1 in Chapter 3, illustrates an example of this type of pipeline system. Vent may be open vents or air valves as described below in 7.4.
Install the pipe so there are no summits in the line. Carefully lay out the pipe so it is on either a constantly increasing or decreasing grade.
For very low pressure pipelines, experience indicates that minimum pipe diameter should be:
1-1/4 inch nominal diameter for grades over 1.0 percent.1-1/2 inch nominal diameter for grades from 0.5 to 1.0 percent.2 inch nominal diameter for grades from 0.2 to 0.5 percent.
For grades less than 0.2 percent, gravity flow systems are not recommended. Where pipe of minimum size will not deliver the required flow, the size should be increased.
Cleaning may be made easier by placing "T's" or "Y's" with plugs at strategic points in the pipeline.
Outlet pipes from a spring box should be placed at least 6 inches above the box floor to allow for sediment storage. A tee and vent pipe or a screen should be installed on the pipe within the spring box to reduce plugging by leaves and trash.
Pipes starting at storage tanks or ponds should be screened and placed far enough above the tank bottom to prevent sediment from entering the system. Screens should be made of copper, plastic, or stainless steel. A swivel-elbow arrangement connected to a float will alleviate both bottom sediment and surface trash problems associated with ponds and large open storage tanks.
7.4 AIR CONTROL IN HIGH HEAD, LONG PIPELINES (greater than 20 psi)There are two ways to resolve air problems in high pressure pipelines:
Minimize the number of summits in the line by meandering the pipeline along the contour to avoid high points. There is a point where the cost of additional pipeline length makes this cost prohibitive.
Install air valves at summits to control the entry and exhausting of air. Figure 7.2 shows this type of installation.
Utah LWPH June 2015
106
In the past, there have been long high pressure stockwater lines installed with little or no provision for air venting. Many of these systems work. A line that has worked for years will sometimes slow down or stop. The usual culprit is air in the line.
Long stockwater pipelines are expensive. The cost of installing adequate air handling equipment during initial installation is a relatively small part of total installation cost. The cost of installing air valves is much less in the initial installation than going back later to add needed valves. Adequate air handling equipment should always be designed into a system at the time of initial installation.
In high pressure, moderate flow systems, there are frequently many small undulations in the ground surface and a few large peaks, causing air bubbles to be trapped in the summits. For pipelines larger than 1-1/4 inch diameter, consideration should be given to installing air release valves at the smaller summits. Because the velocity in larger diameter pipelines is slower, less air bubbles will be carried from higher peaks. By installing additional hydrants or air release valves, the potential for air entrapment problems is reduced.
The recommended location of air release valves and vents is as follows:
A continuous air release valve or COMB valve shall be located on the first summit from the water source.
If the pipeline goes downhill from the well, it is advisable to locate a COMB valve right after the pressure tank (within 10 feet).
Additional venting is normally required for artesian systems which contain gas, all summits with extremely low operating heads (less than 20 psi), and summits collecting air from multiple laterals or long reaches.
Unless a detailed analysis showing water velocity is adequate to re-entrain air into solution then additional air release valves shall be installed at all summits in the line where an accumulation of air could cause a reduction in flow.
Ignoring summits may occasionally lead to system operational problems. In that case, the owner will have to go back and install air valves or vents at all summits. Remember that it is not acceptable to ignore summits in the line in low head, low velocity pipelines.
The preferred locations for air venting are at high points in the line. Hydrants, open vents, or vacuum relief valves can be used. Where the hydraulic grade line is close to pipe elevation, open air vents are the best choice. Hydrants can be used if they are always opened at the time of draining and filling of the pipeline. The risk of using hydrants is that there may be additional damage to the line if a sudden pipeline break should unexpectedly drain the line.
For long pipelines, pipelines installed in undulating terrain, or pipelines with long intervals between valves or tanks, additional valves may be needed. For these situations, contact the Field Engineer or Civil Engineering Technician for assistance.
Utah LWPH June 2015
107
Figure 7.2
TYPICAL SYSTEM WITH AIR VALVES
Utah LWPH June 2015
108
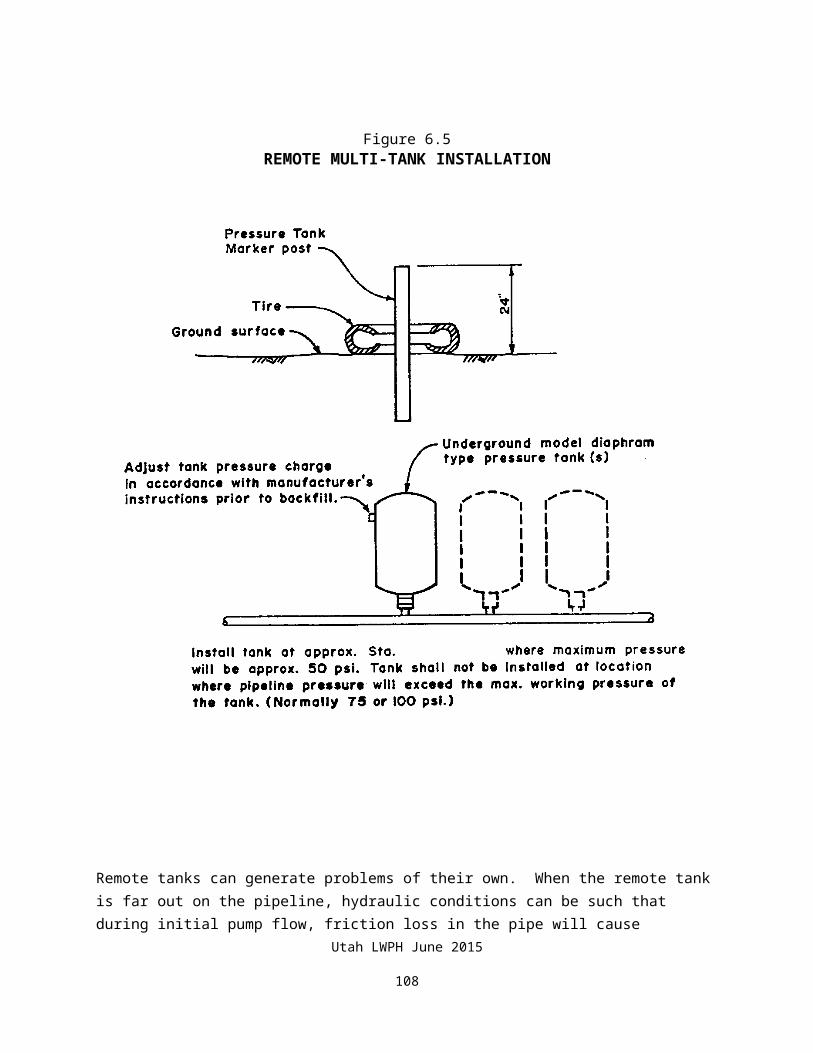
7.5 AIR VALVES AND HOW THEY WORKThere are three types of functions that air valves perform:
1. When a pipeline is emptied, air must be allowed to enter the line. If provisions are not made for entry of air, a vacuum can be created in the pipeline. This can lead to collapse of the pipe or at least a break in the water column, which creates gas or water vapor pockets in the pipeline. Although it is unlikely that the small diameter pipe in stockwater lines will collapse due to vacuum, it is a bad design practice to allow significant vacuum to develop in the pipeline. It is therefore important to have a vacuum relief mechanism at significant high points in the line.
Figure 7.3 illustrates how a typical air valve operates. Since there is no water in the valve chamber, the float drops on to a cage and allows air to enter the large orifice.
Utah LWPH June 2015
109

Figure 7.3VACUUM RELIEF
2. When an empty pipe is filled with water, air in the line must be released in large volumes. This can be done by leaving the hydrants open. But what if the hydrants are closed? Air pressure will build up in the pipeline. When a hydrant or float valve is opened, high pressure air will escape and then, when water hits the end of the line, water hammer will probably occur.
For adequate system protection, there must be a mechanism to automatically release large volumes of air from the pipeline during filling. For best results, the mechanism should be located at all significant summits in the line.
Figure 7.4 illustrates how a typical air valve functions. Since water has not yet entered the valve chamber, the float stays down on a cage. Large volumes of air escape through the large orifice.
Utah LWPH June 2015
110
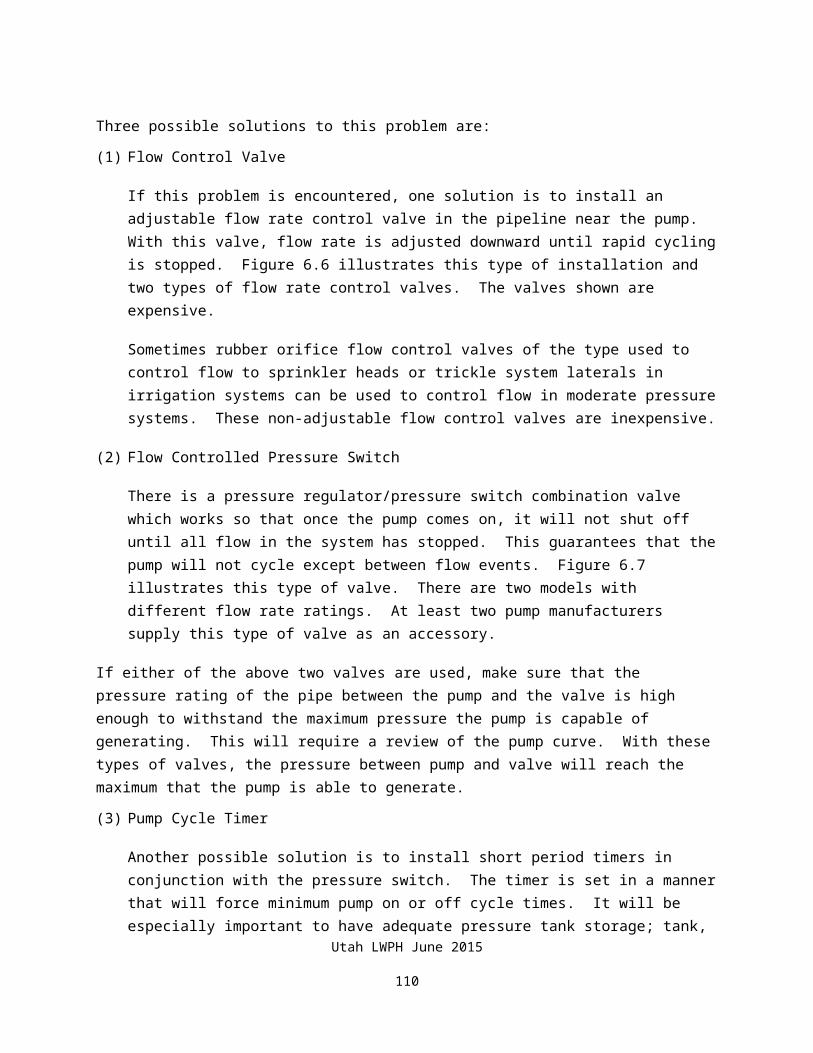
When the pipe fills, the float floats to the top of the valve and closes the large orifice. The valve then remains closed until the pipeline is again empty. The float will not drop unless pressure drops to zero, since pressure keeps it seated against the orifice. This is the case even if an air pocket builds up in the valve chamber during operation.
Figure 7.5 illustrates the closed valve.
Utah LWPH June 2015
111

Figure 7.4RELEASE OF LARGE VOLUMES OF AIR DURING FILLING
Figure 7.5WATER AND PRESSURE KEEP FLOAT VALVE CLOSED
Utah LWPH June 2015
112
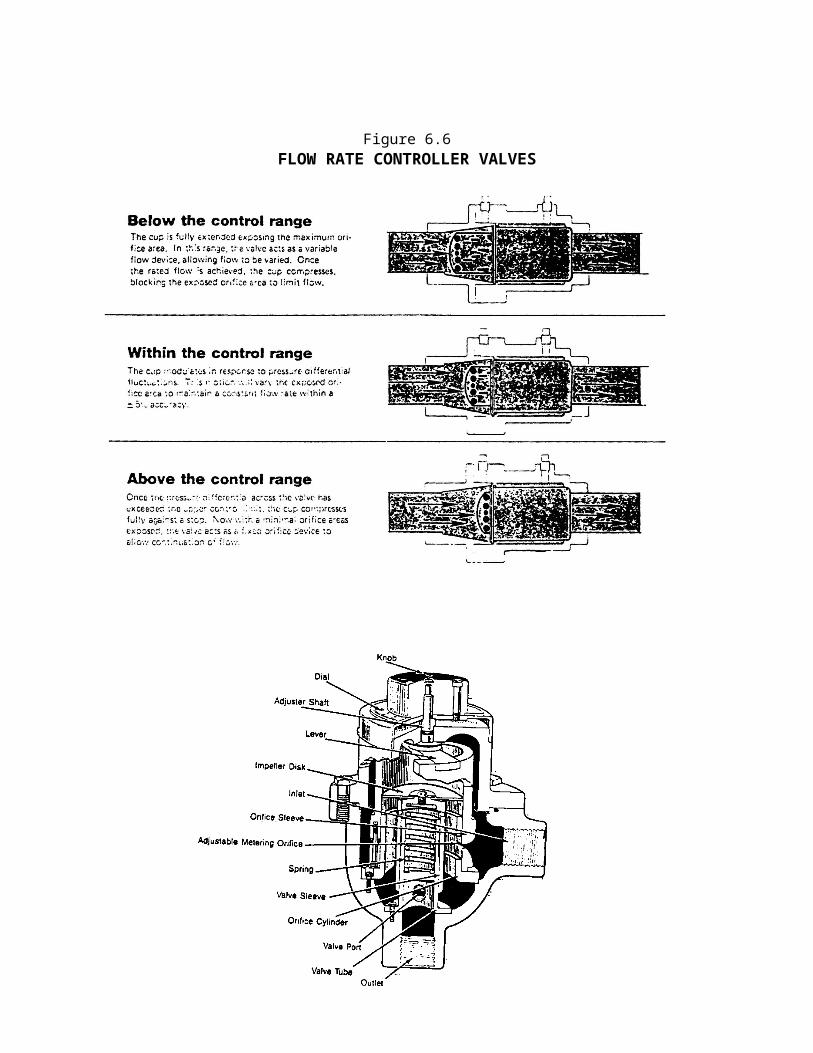
Utah LWPH June 2015
113
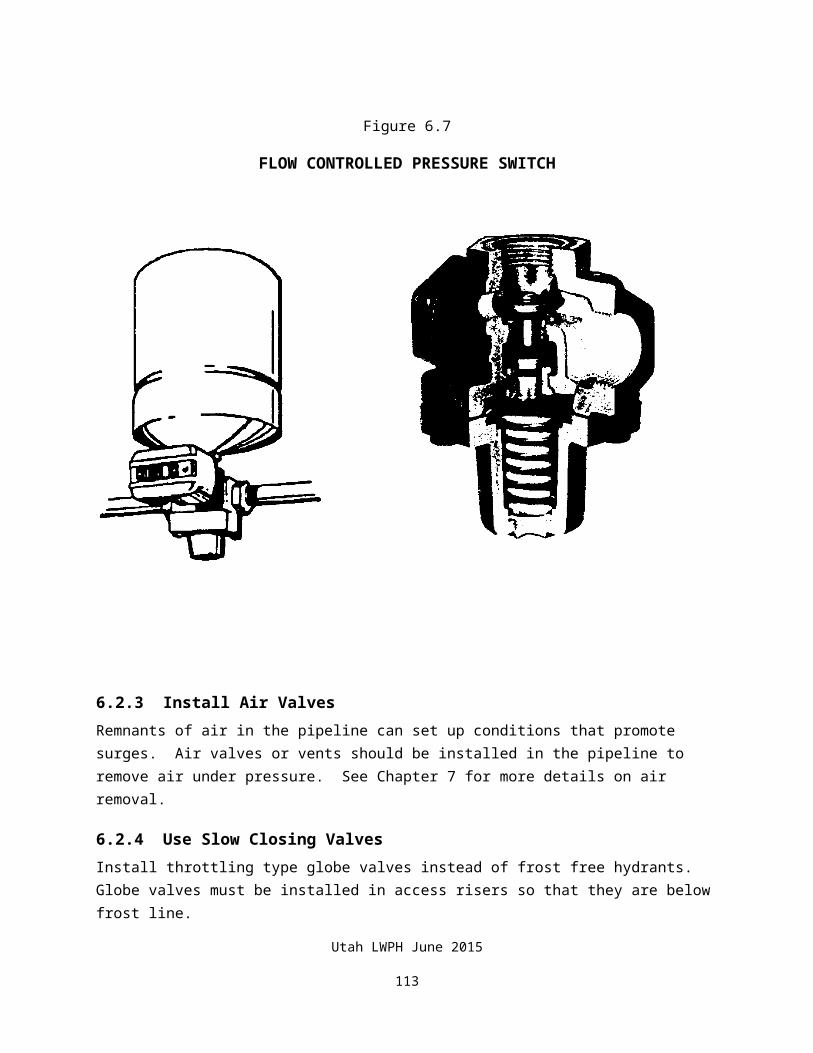
3. During operation of the pipeline, air bubbles and other gasses come out of solution and buildup as gas bubbles at summits in the line. There are usually also remnants of the large volumes of air present immediately after filling. If the summit is high enough, this air will never push on through the line. Gases may eventually buildup to the point where the flow rate is seriously reduced or flow may even stop. It is not possible to predict how serious a problem this may be when designing a pipeline.
Figure 7.6 illustrates how a typical air release valve works. A heavy float and a small orifice allow the float to drop and open the orifice even when the system is under pressure. So when air bubbles gravitate to the air chamber, and the float drops, high pressure air is expelled from the valve.
Figure 7.6AIR RELEASE VALVE
FOR RELEASING AIR WHILE PIPE IS UNDER PRESSURE
Utah LWPH June 2015
114
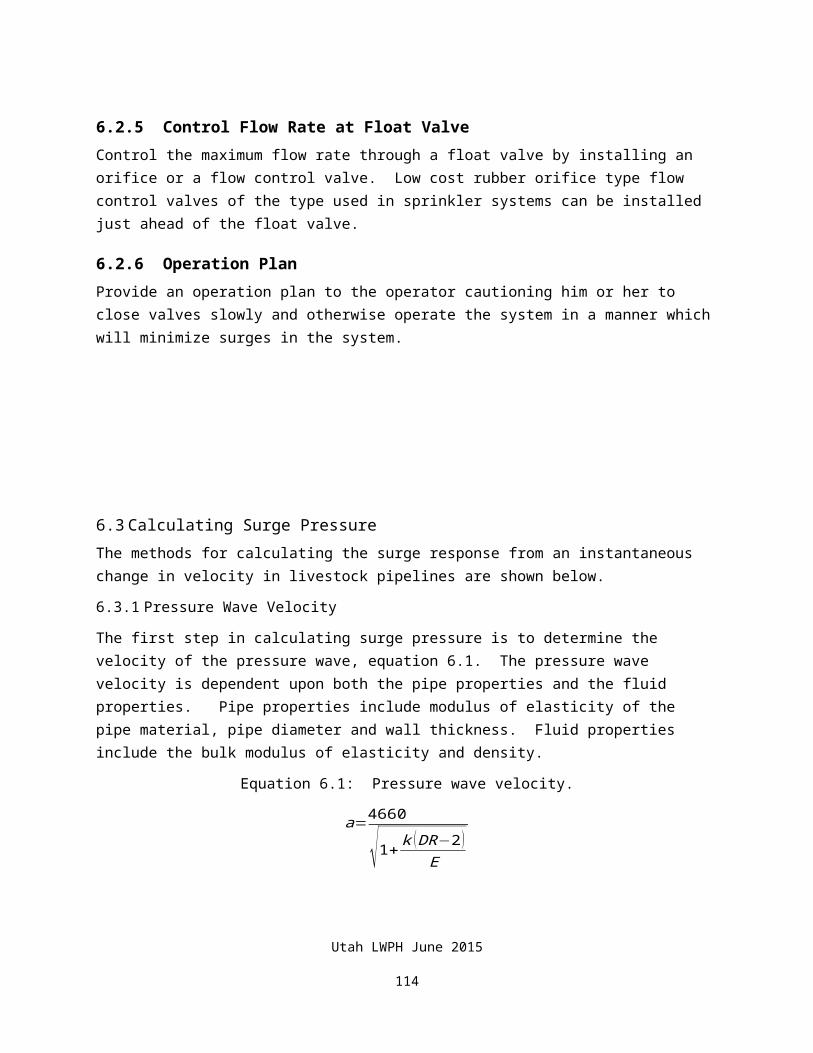
Utah LWPH June 2015
115
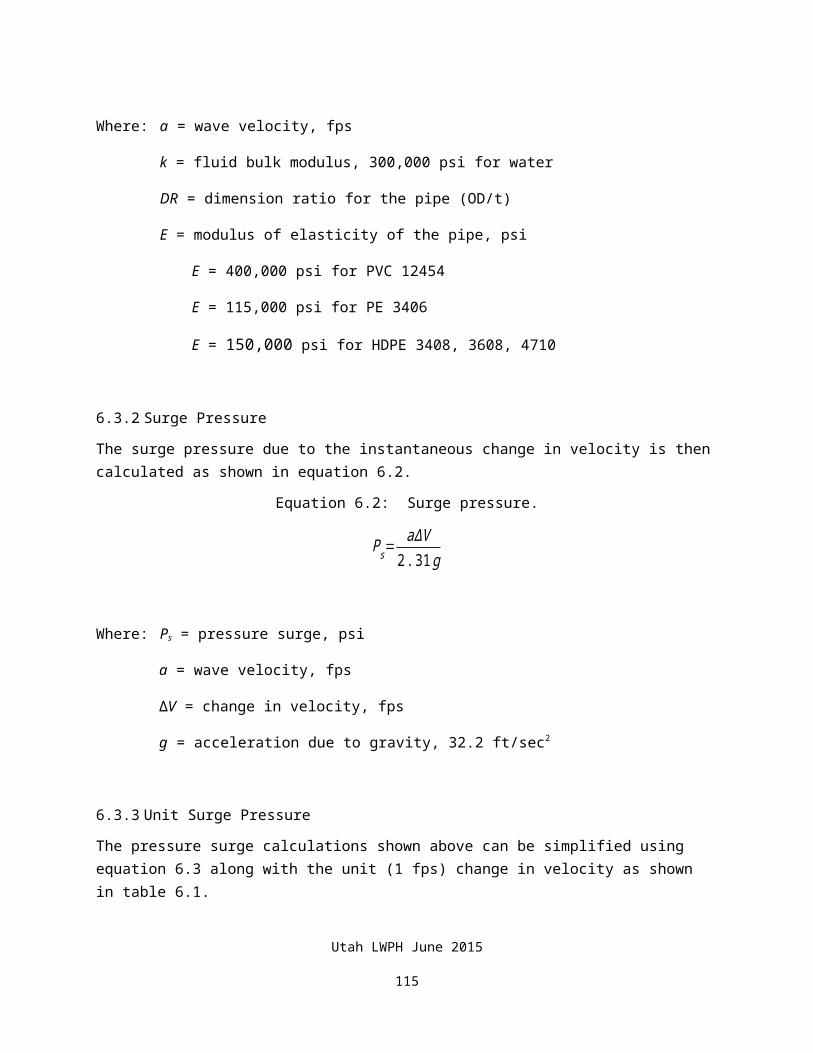
7.6 TYPES OF VALVESThere are four general types of air valves. They are:
1. Vacuum relief valve (relieve vacuum only)
2. Air relief/vacuum relief valve (ARV or 2-way valves): These valves relieve vacuum during emptying and expel large volumes of air during filling.
3. Continuous acting air release valve (release small volumes of air under pressure)
4. Combination air/vacuum relief, air release (COMB or 3-way valves). These valves combine all 3 of the above mentioned valve functions into one valve.
The latter three types of valves are usually used in stockwater pipelines. The smallest valves available are usually adequate. Valves are rated according to maximum pressure that they can operate under as well as by orifice size. Only appropriate pressure rated valves should be used.
Figures 7.5 through 7.9 illustrate cutaway views of typical air valves used in stockwater pipelines. Different manufacturers have different ways of doing the same job. Some valves are made of plastic. These generally are adequate for low pressure operation. The cast iron models are for high pressure operation.
It is sometimes claimed that the air release (small orifice) valve will also serve the purpose as vacuum relief valve. The small orifice is not adequate to prevent high vacuum from occurring if there is a sudden break or during emptying of the pipeline. The proper kind of valves should be used where needed.
In most cases, the combination (three-way) valve should be installed at all significant summits. An air release valve will suffice at small summits. At the end of the line an air release/vacuum (two-way) valve should be installed.
Utah LWPH June 2015
116
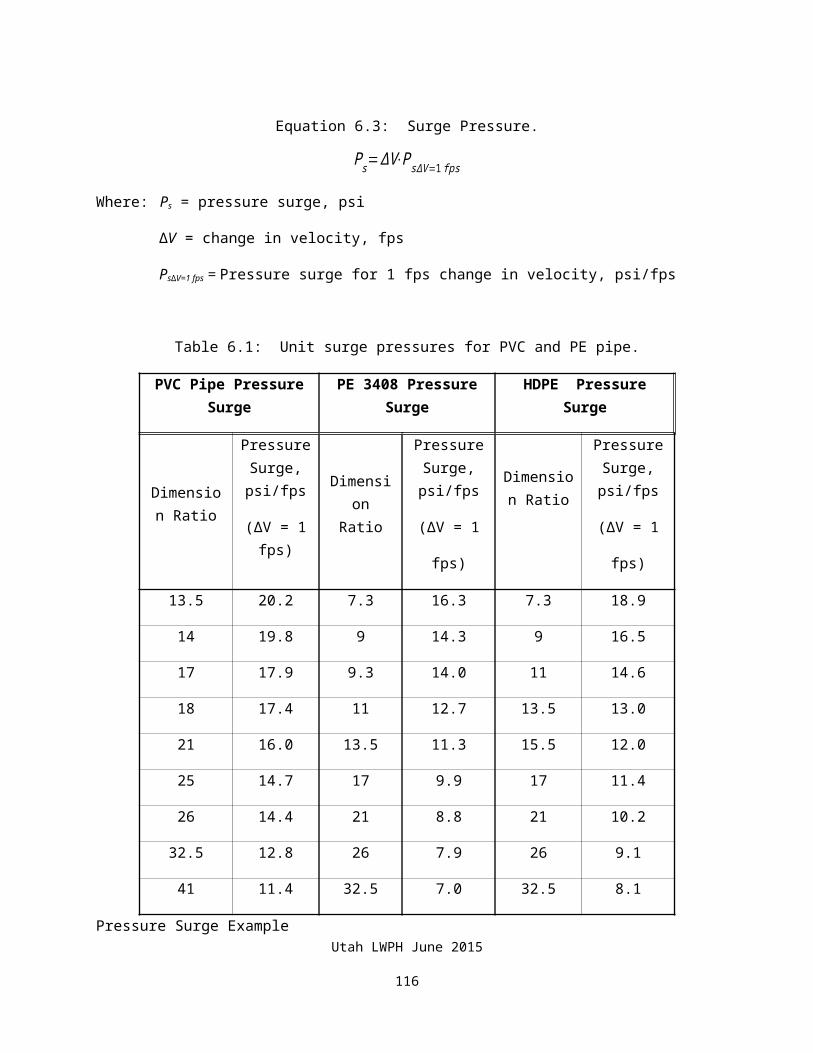
Figure 7.7TYPICAL AIR RELEASE VALVES
Utah LWPH June 2015
117
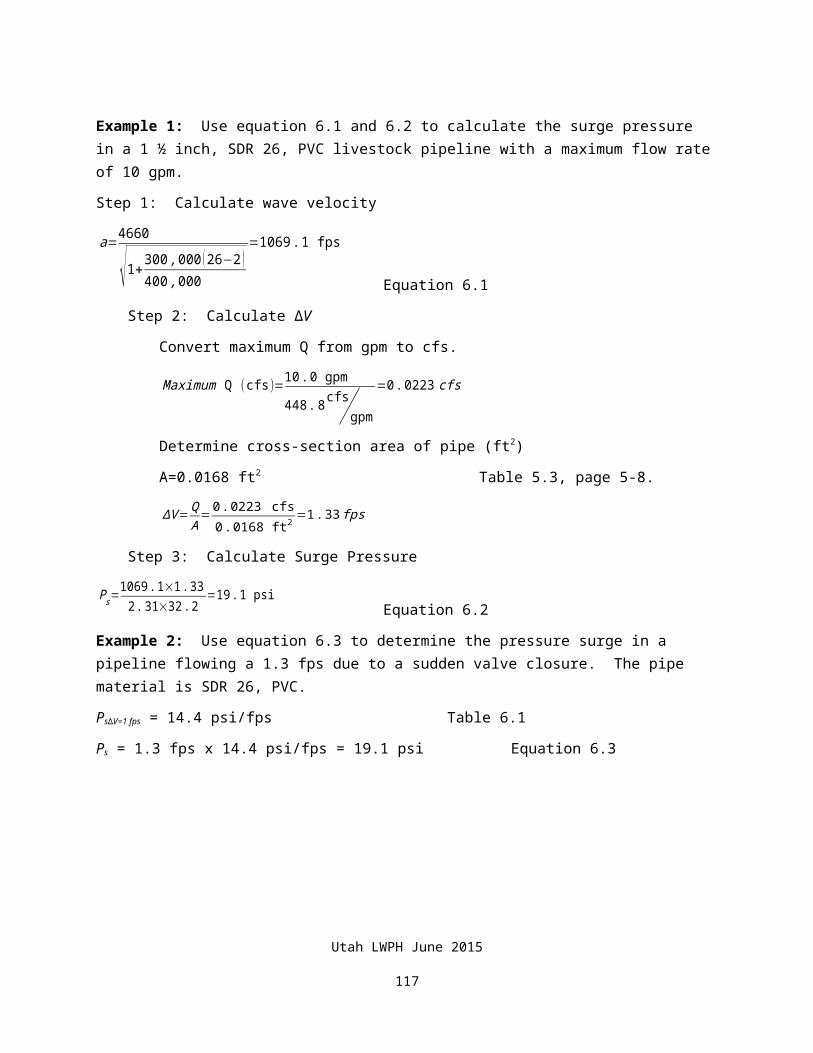
Figure 7.8TYPICAL AIR RELIEF/VACUUM VALVES (TWO WAY)
Utah LWPH June 2015
118
Utah LWPH June 2015
119
Figure 7.9TYPICAL AIR/VAC/AIR RELEASE VALVES (THREE WAY)
Utah LWPH June 2015
120
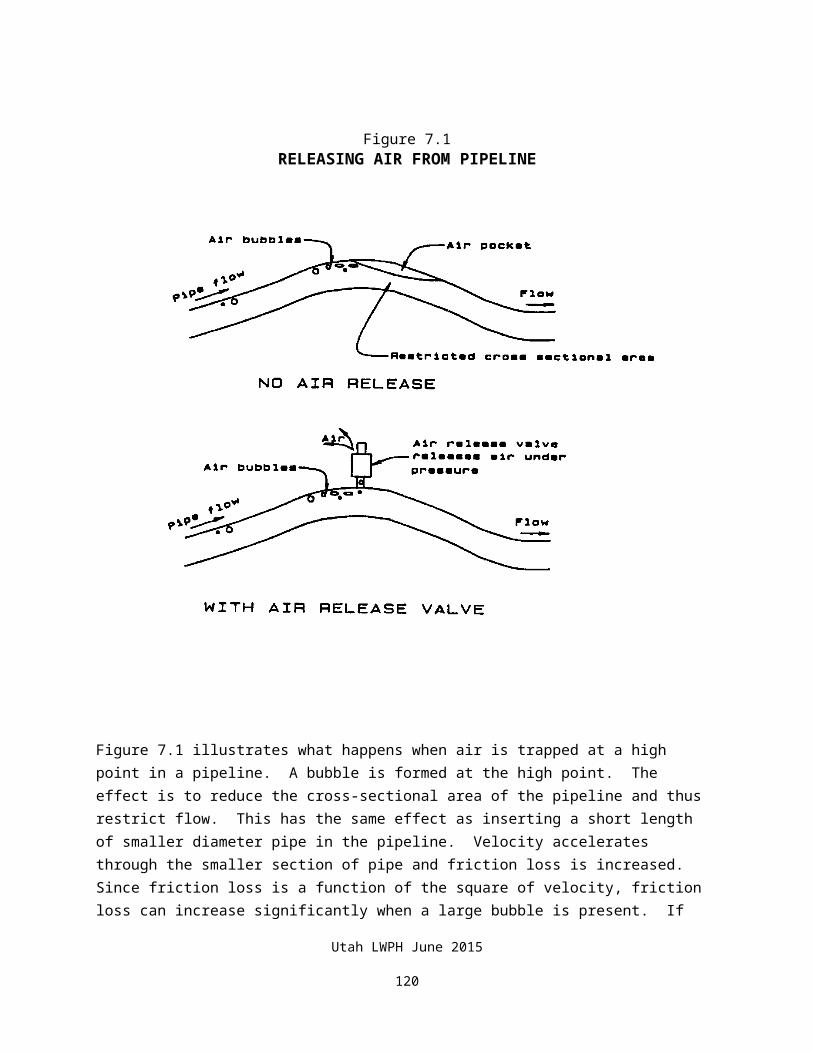
7.7 AIR VALVE INSTALLATIONFigure 7.10 illustrates a typical before frost good air valve installation. Since air valves can leak some water, provisions must be made to dissipate this water.
Figure 7.10AIR VALVE INSTALLATION
Utah LWPH June 2015
121
Utah LWPH June 2015
122
CHAPTER 8
PIPELINE SYSTEM ACCESSORIES
TABLE OF CONTENTS
PART 8.1 STOCKWATER TANKS 8-18.1.1 Tank Materials 8-1 Concrete Tanks 8-1 Fiberglass Tanks 8-7 Plastic Tanks 8-7 Galvanized Steel Tanks 8-9 Rubber Tire Tank 8-98.1.2 Water Inlet Protection 8-138.1.3 Protection Around Tanks 8-178.1.4 Tank Overflows 8-178.1.5 Inlet to Pipeline From Tank 8-19
PART 8.2 STORAGE TANKS 8-20PART 8.3 PIPELINE DRAINS 8-26
FIGURES
Figure 8.1 Concrete Tank 8-3Figure 8.2 Concrete Trough 8-4Figure 8.3 Tank Made from Concrete Pipe 8-5Figure 8.4 Frost Proof Concrete Tank 8-6Figure 8.5 Frost Free Fiberglass Tank 8-8Figure 8.6 Tank Made from Corrugated Steel Segments 8-10Figure 8.7 Manufactured Steel Tank 8-11Figure 8.8 Rubber Tire Tank Installation Methods 8-12Figure 8.9 Typical Tank Layout Plans 8-14Figure 8.10 Tank Details 8-15Figure 8.11 Layout Using Submerged Float Valve 8-16Figure 8.12 Overflows 8-18Figure 8.13 Pipeline Tank Inlet 8-19Figure 8.14 Commercial Steel Water Storage Tank 8-21Figure 8.15 Fabricated Steel Storage Tank 8-22Figure 8.16 Constructed Corrugated Steel Storage Tank 8-23
Utah LWPH June 2015
123
Figure 8.17 Fiberglass Storage Tank 8-24Figure 8.18 Water Harvesting System Using Rubberized
Fabric Storage Bag 8-25Figure 8.19 Pipeline Drains 8-27
Utah LWPH June 2015
124
CHAPTER 8 - SYSTEM ACCESSORIES
8.1 STOCKWATER TANKS
Stockwater tanks come in an almost infinite number of shapes and sizes and are made from many different materials. Almost anything which is accessible by and animal and will hold water has been used.
It takes careful consideration to design a stock tank that will serve its function, be cost effective, and last for a reasonable length of time. A stock tank must withstand a very hostile environment. Water used by livestock is often corrosive; ice and frost heave tend to damage tanks and foundations; animals enter tanks and rub up against them; people shoot at them; and animals tromp away the soil around a tank. All of these factors working together can make a tank short lived if proper precautions are not taken.
8.1.1 Tank MaterialsMaterials should be chosen not only for economic reasons, but to resist attack by the particular environmental hazards predominating at the site.
Concrete Tanks
Concrete is one of the most durable materials that can be used to build stock tanks. To be durable though, concrete must be made and placed properly. The two environmental factors that will rapidly deteriorate concrete are freeze thaw action and sulfates in the water.
High sulfate concentrations are present in many waters used for stock-watering in the west. It is important to become aware of this if you are working in an area where sulfate is a problem.
Since stock tanks are often used during freezing weather, they are in an ideal environment for damage due to freezing and thawing. Pores in the concrete fill with water, freeze, and as a result the concrete will spall.
There are practical things that should be done to make quality concrete that will resist these elements:
1. Use a low water cement ratio. Use the minimum amount of water in the concrete that is possible consistent with being able to place the concrete. Use a minimum of 6 bags of cement per cubic yard of concrete.
2. Place the concrete within 1-1/2 hours after adding water to the cement. This is sometimes a challenge when using readymix concrete at remote sites. If travel time between batch plant and the site is a problem, add the cement and water at the site. Adding water to
Utah LWPH June 2015
125
make concrete placeable after it has been in the truck too long is a leading cause of poor concrete.
3. Use air entrained concrete with air content within NRCS specification range. Air entrainment can be obtained by using cement with built-in air entrainment additives or by adding admixtures at the concrete batch plant. Cement with air additives built-in is cement type IIA.
Utah LWPH June 2015
126
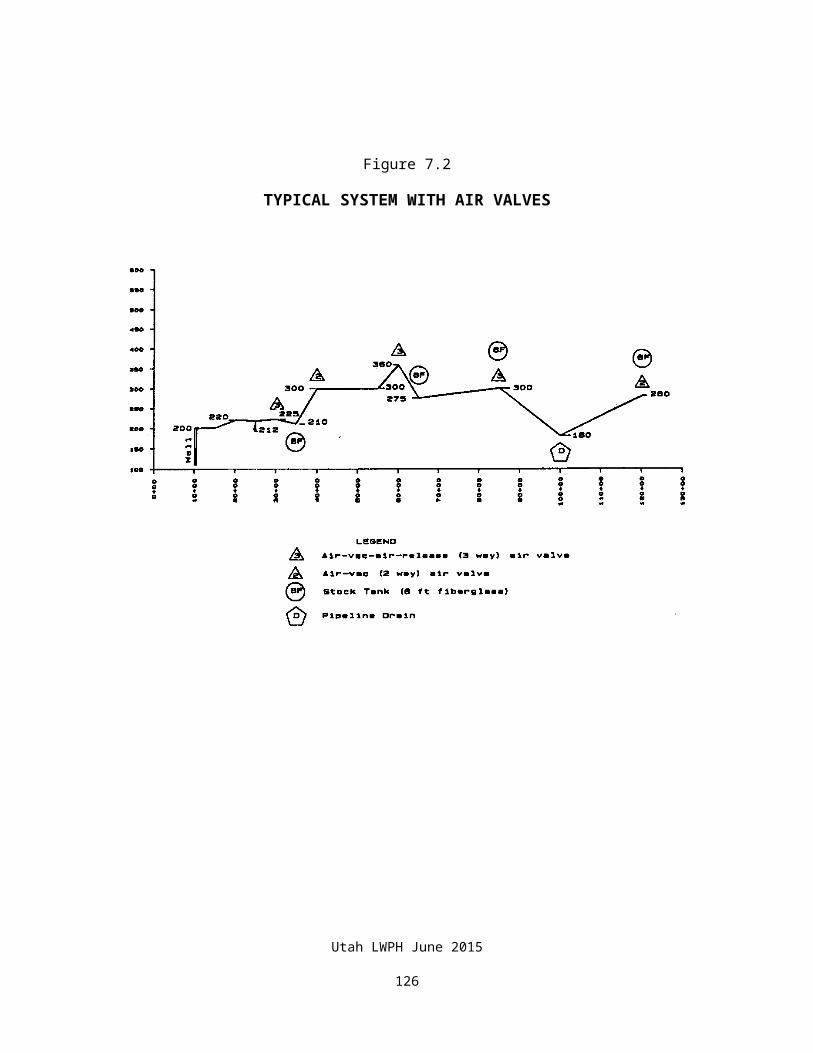
Foundation frost heave can also be a problem, particularly if the foundation is wet when the ground freezes. The solution is to build the tank so there will be good drainage away from the tank, provide proper overflow drains for the tanks, and provide a well drained base material under the tank.
Figure 8.1 illustrates a typical concrete tank. Figure 8.2 details a concrete trough. Figure 8.3 illustrates a tank made out of a section of large diameter concrete pipe. Figure 8.4 shows plans for a concrete frost free tank.
These tanks all require some skill to construct. If multiple copies of the same tank are to be constructed, costs can be reduced and quality increased by constructing reusable concrete forms.
Utah LWPH June 2015
127
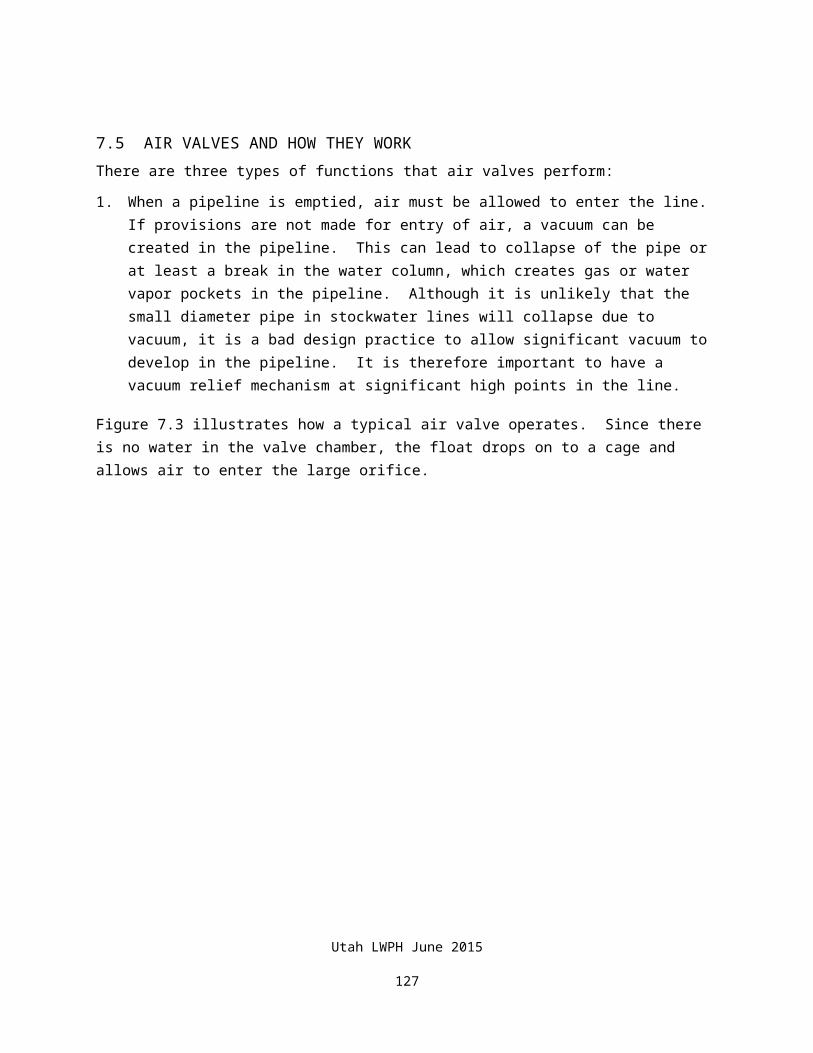
Figure 8.1CONCRETE TANK
Utah LWPH June 2015
128
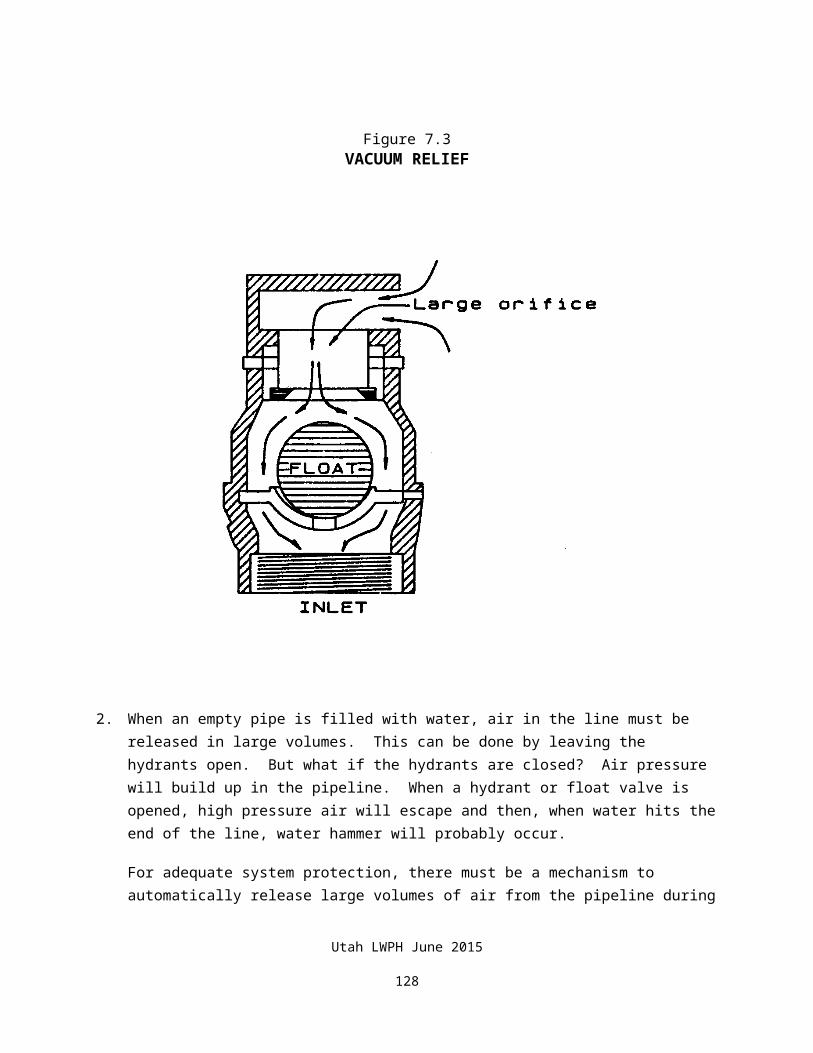
Utah LWPH June 2015
129
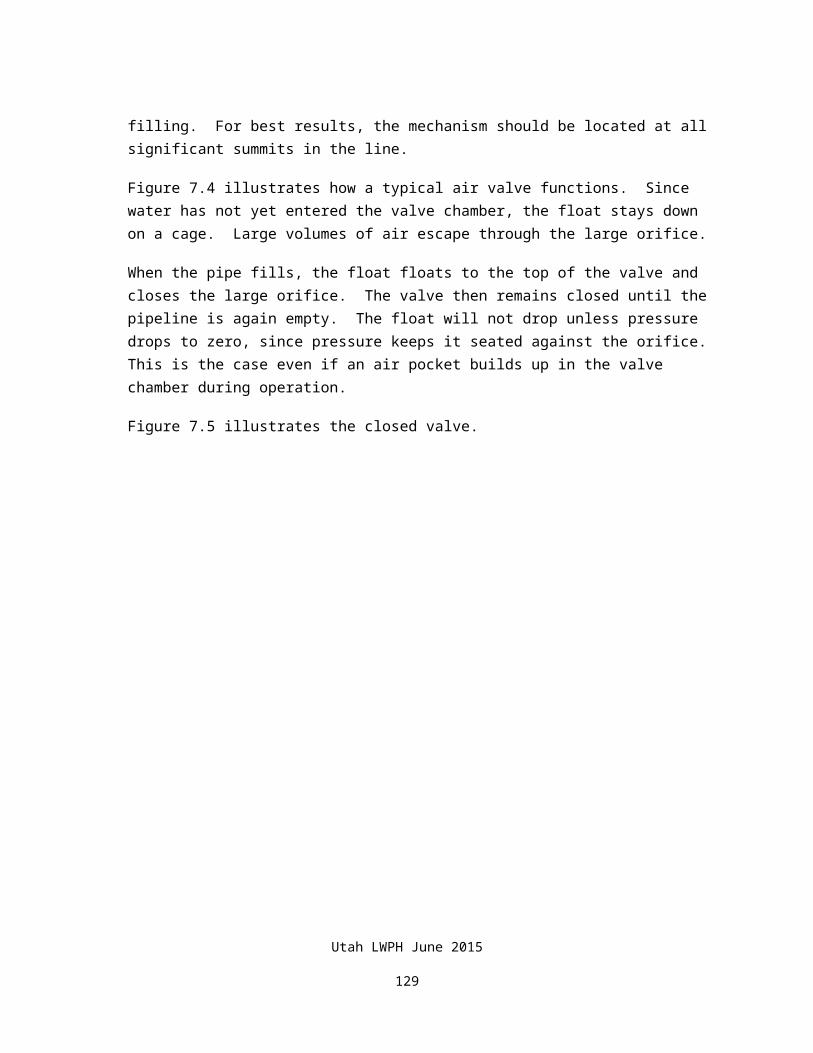
Figure 8.2CONCRETE TROUGH
Utah LWPH June 2015
130
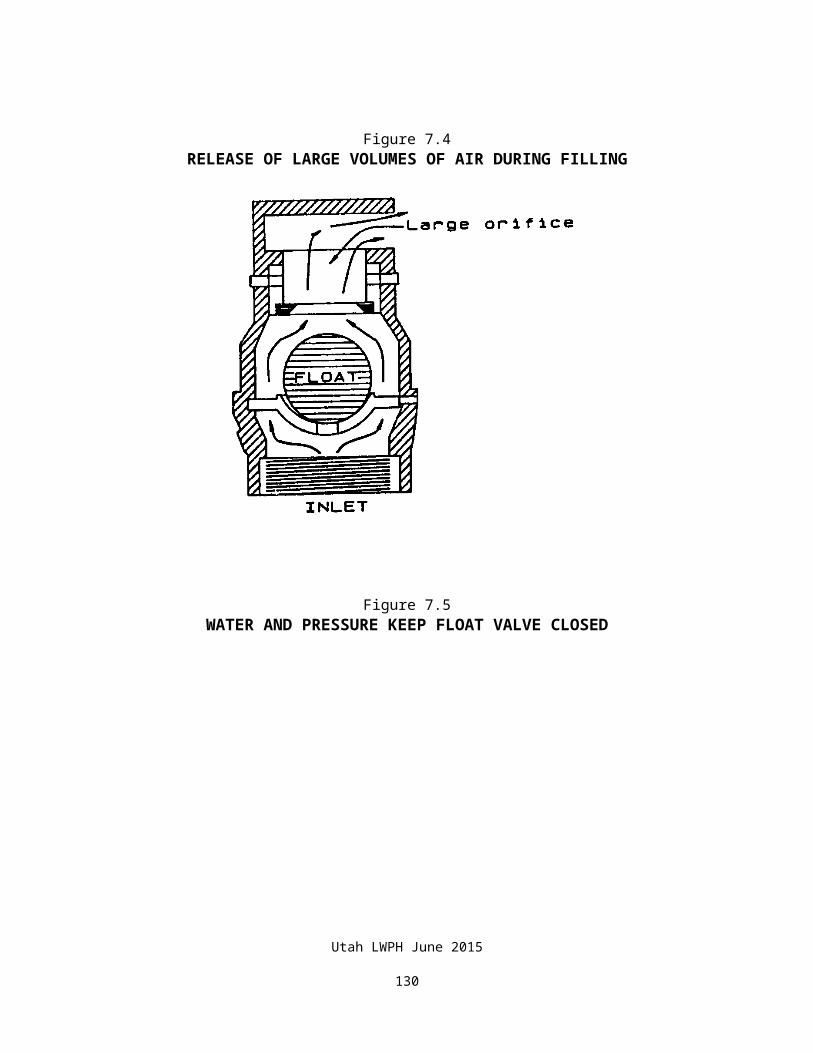
Utah LWPH June 2015
131

Figure 8.3TANK MADE FROM CONCRETE PIPE
Utah LWPH June 2015
132
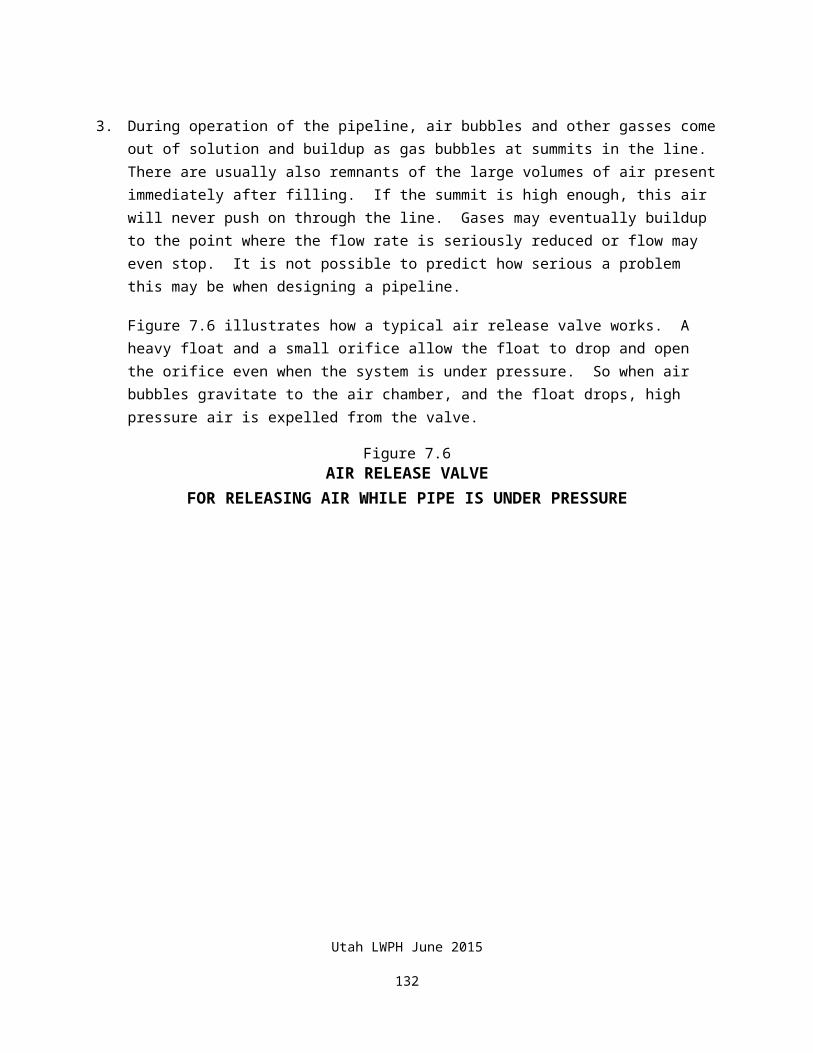
Figure 8.4FROST PROOF CONCRETE TANK
Utah LWPH June 2015
133
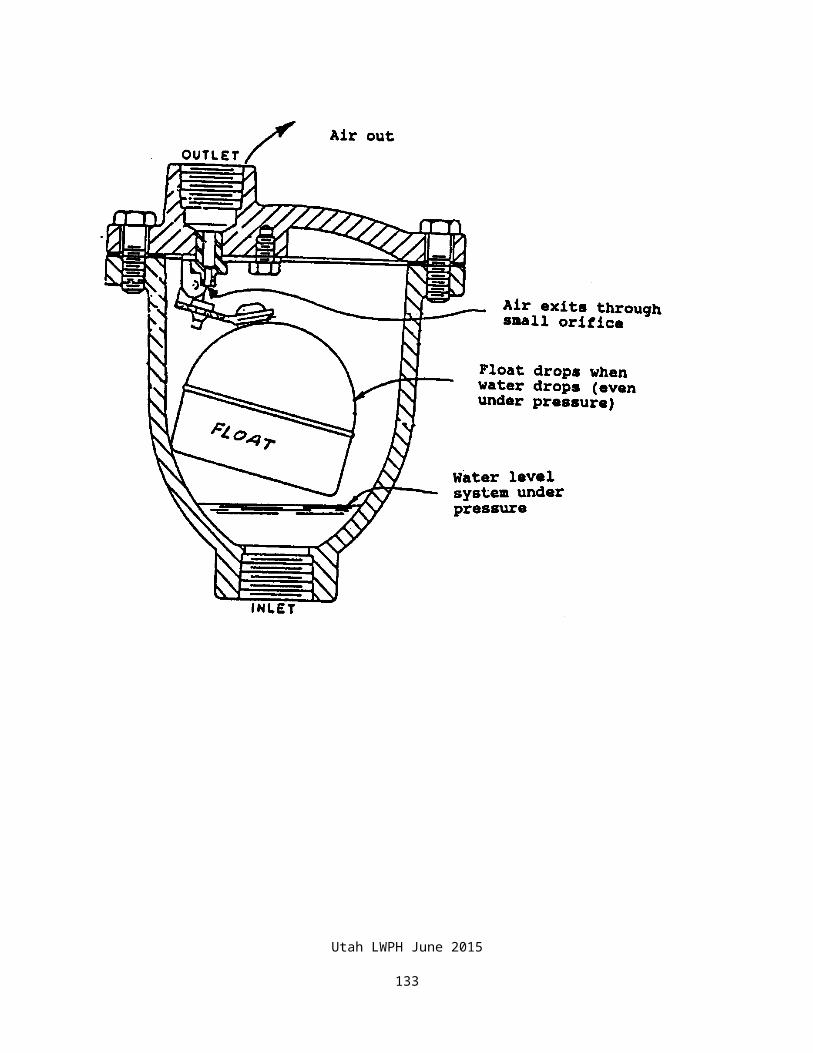
Utah LWPH June 2015
134
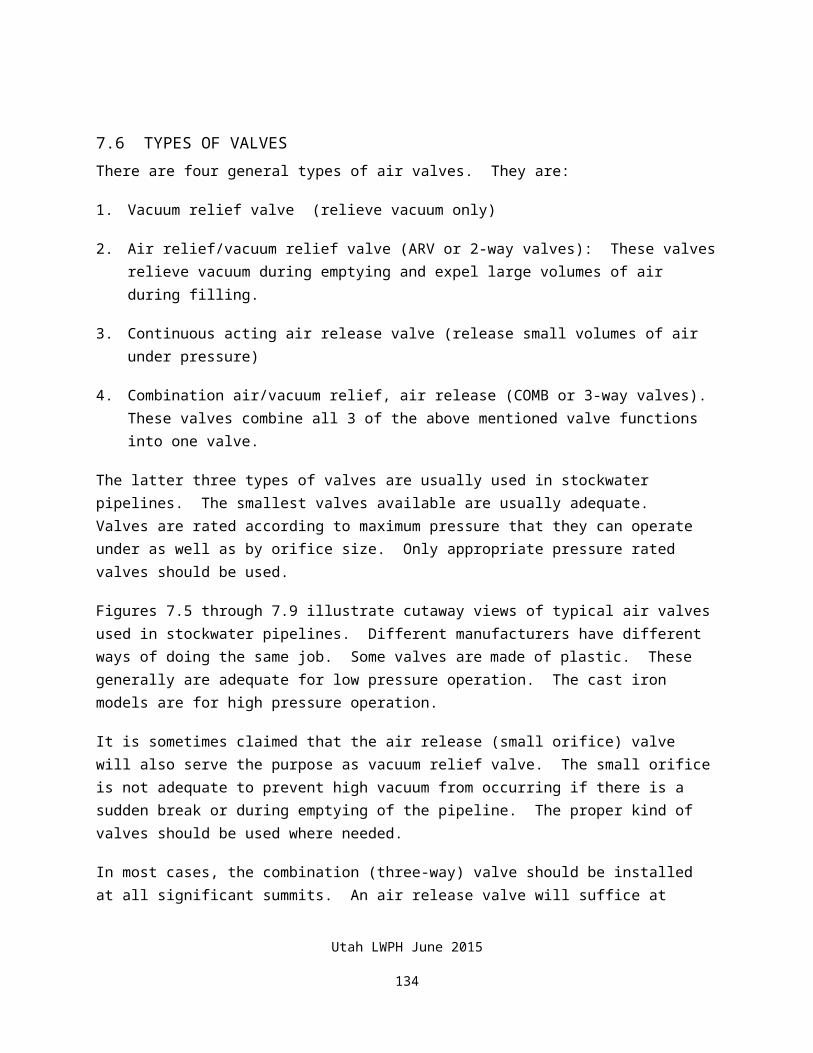
Fiberglass Tanks
Many stock tanks are now made out of fiberglass. Fiberglass is very resistant to deterioration by chemical attack. It is also light and easy to install. It is however, subject to mechanical damage.
Since fiberglass is so light, wind and animals can easily move it out of place. If a large animal gets into a fiberglass tank, the tank bottom can be damaged and it might be difficult for the animal to escape.
For these reasons, it is important to provide anchors and protective rails when installing a fiberglass tank.
Thickness of fiberglass will determine how resistant the tank is to mechanical damage. Thickness should be at least the minimum specified in NRCS specifications. It is possible to repair damaged fiberglass, which is one advantage of using this material.
Tanks size is limited to what can be transported to the site. Sometimes this limitation is overcome by combining tanks built-up from two or more component parts. Several tanks can also be placed together in series to provide the required storage.
Plastic Tanks
Some tanks and troughs are now being made out of high strength plastics without fiberglass reinforcement. The science of plastics is very complex, and it is difficult to know what the life will be of any given plastic formulation and tank configuration. Only brands and configurations which have received NRCS State Conservation Engineer approval should be considered.
Utah LWPH June 2015
135

Figure 8.5FROST FREE FIBERGLASS TANK
Utah LWPH June 2015
136
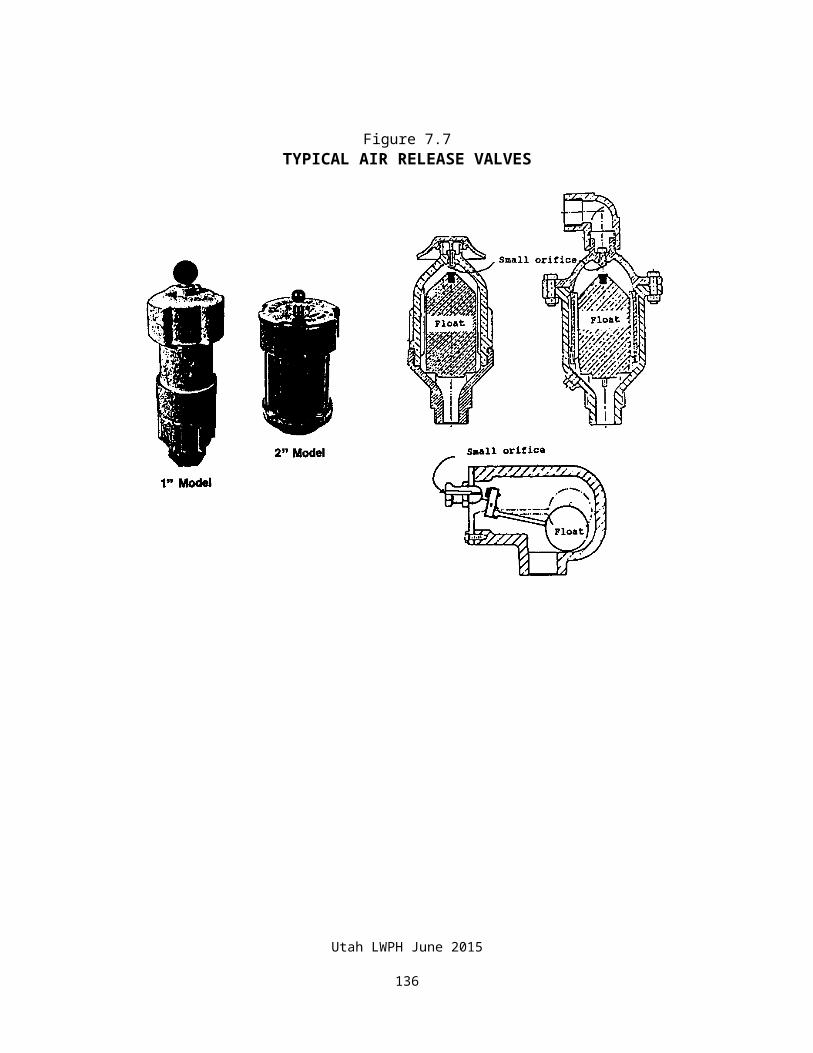
Utah LWPH June 2015
137
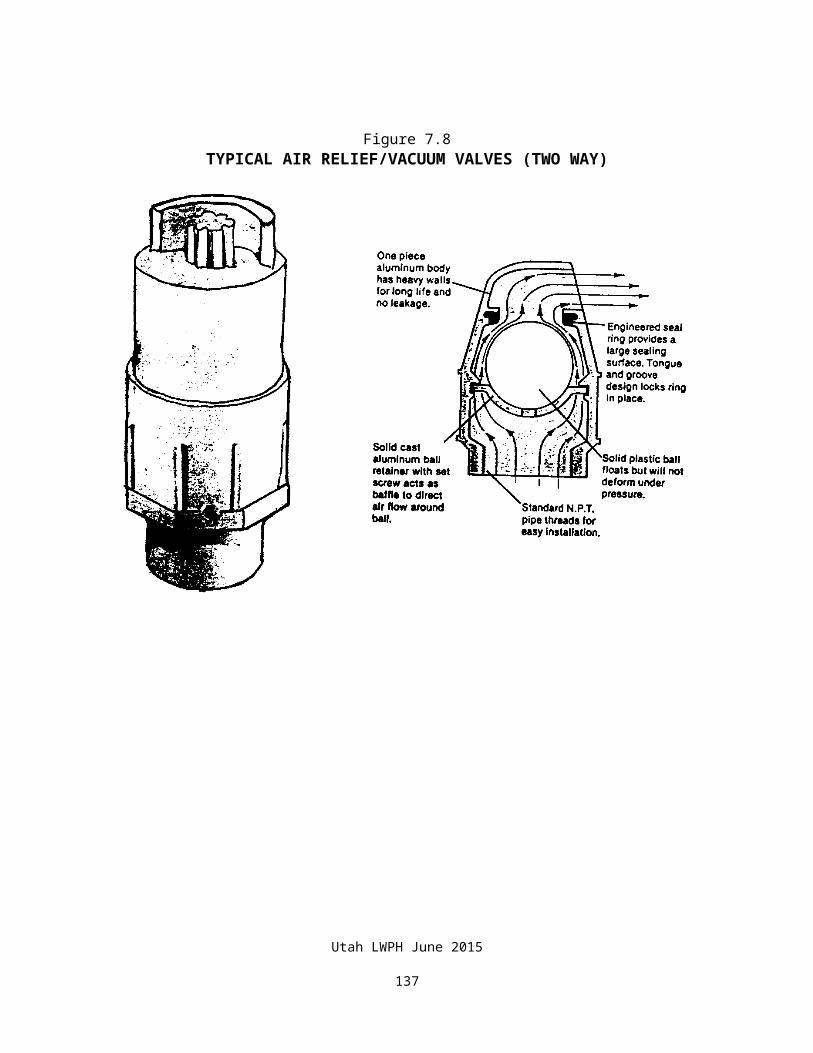
Galvanized Steel Tanks
There are generally two kinds of galvanized steel tanks: (1) Those assembled at the site from standard corrugated or formed steel segments and (2) Completely self contained manufactured tanks.
1) Stock tanks made from corrugated steel segments
Large diameter stock tanks are made up of curved corrugated galvanized steel sheets, which are bolted together. Mastic is used in the joints to provide water tightness. The steel and galvanizing are usually heavy. The bottom of the tank can be made of reinforced concrete, bentonite, heavy plastic liner, or rubber sheeting material. This type of tank will usually last a long time if properly installed and cared for.
2) Manufactured steel stock tanks
The thickness of steel and galvanizing vary widely in manufactured steel tanks. The tanks are frequently small and made of light gauge steel with minimum galvanizing. As with fiberglass tanks, these must be properly anchored and protected from livestock. Do not use these tanks in locations where water or soil is corrosive to steel.
Figure 8.6 details a tank made from corrugated steel plate segments. Figure 8.11 illustrates typical manufactured steel tanks.
Rubber Tire Tanks
Rubber tire tanks are manufactured from used heavy earth-moving or construction equipment tires. The sidewall of the tire is cut away on the topside to allow drinking access. The opening on the lower side of the tire is sealed with concrete, plastic or steel plate.
Rubber tire tanks have proven to be durable, relatively inexpensive, and capable of being used with a variety of water sources. They are relatively easy to install, generally inexpensive, and very durable. They are however heavy and difficult to handle during installation. Their size may limit water storage for larger herds.
Figure 8.8 illustrates rubber tire tank installation.
Utah LWPH June 2015
138
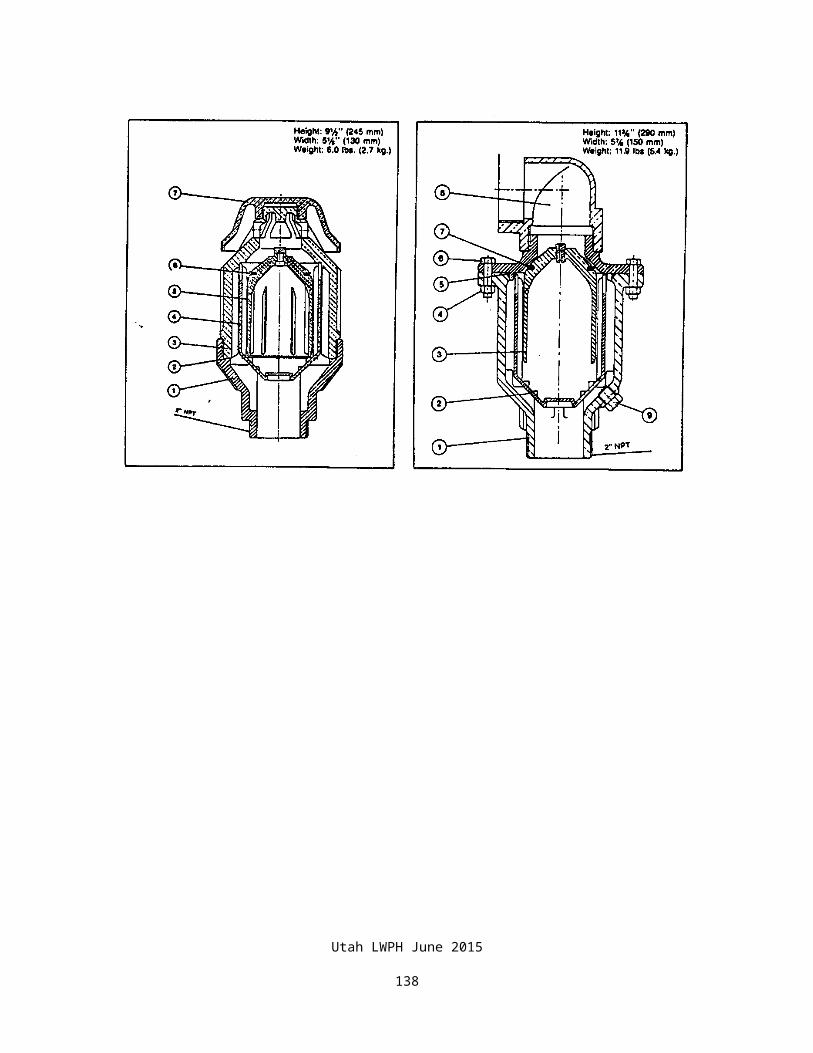
Figure 8.6TANK MADE FROM CORRUGATED STEEL SEGMENTS
Utah LWPH June 2015
139
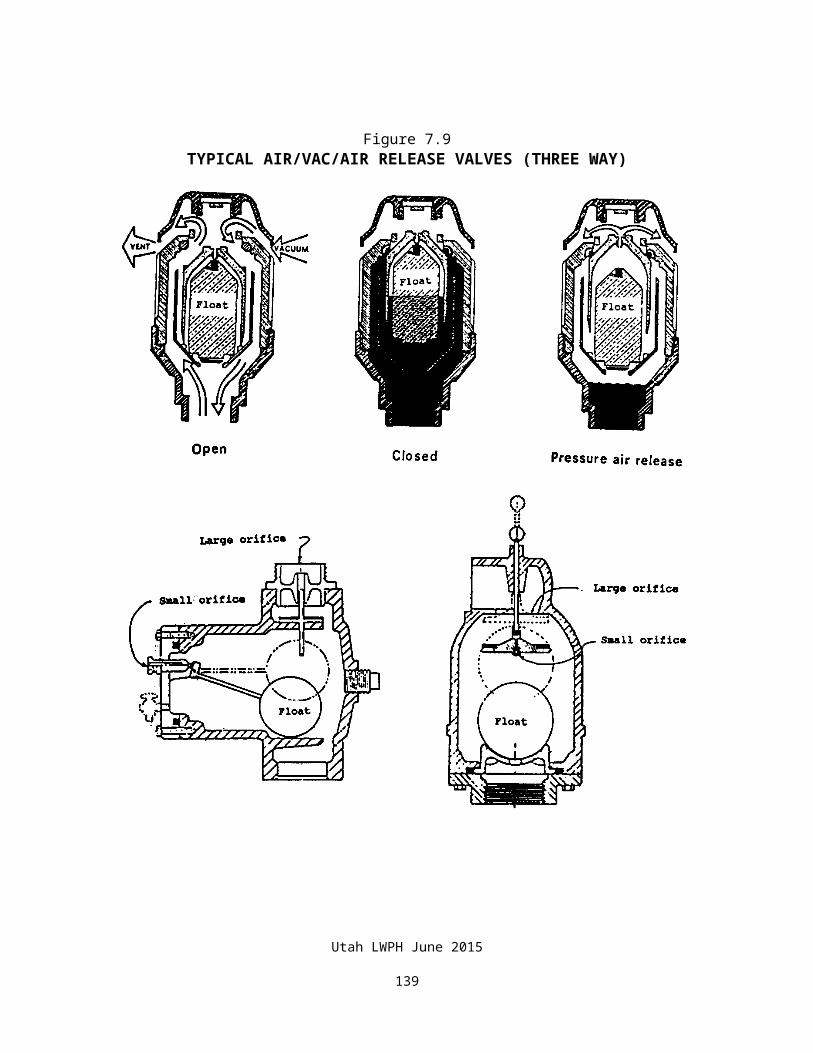
Figure 8.7
Utah LWPH June 2015
140
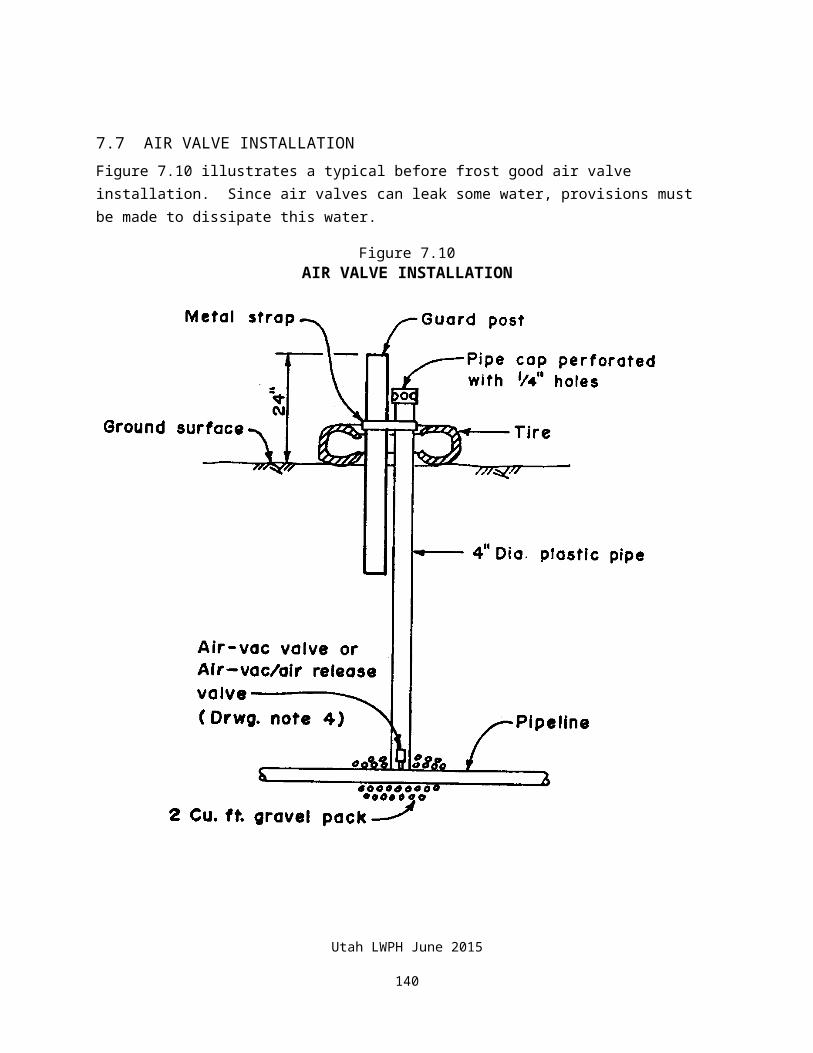
MANUFACTURED STEEL TANK
Utah LWPH June 2015
141

Figure 8.8RUBBER TIRE TANK INSTALLATION METHODS
Utah LWPH June 2015
142
Utah LWPH June 2015
143
8.1.2 Water Inlet ProtectionWater inlets must be protected from mechanical damage by animals and from freezing. One way to do this is to install the inlet under the water at the bottom of the tank. Float valves can be installed below water level with the float floating at the water surface on a chain. Water level valves are also available which are controlled by water depth induced pressure.
Combination float valves and thermostatically controlled valves are available which will open in the event that temperature of the water gets down to just above freezing. These are installed at the bottom of the tank. The valve opens to provide a constant flow during periods of freezing weather. It is very important to have an adequate overflow system when this type of valve is installed.
Figures 8.9 through 8.11 illustrate commonly used systems of tank and inlet protection.
Utah LWPH June 2015
144
Figure 8.9TYPICAL TANK LAYOUT PLANS
Utah LWPH June 2015
145
Utah LWPH June 2015
146
Figure 8.10TANK DETAILS
Utah LWPH June 2015
147

Utah LWPH June 2015
148
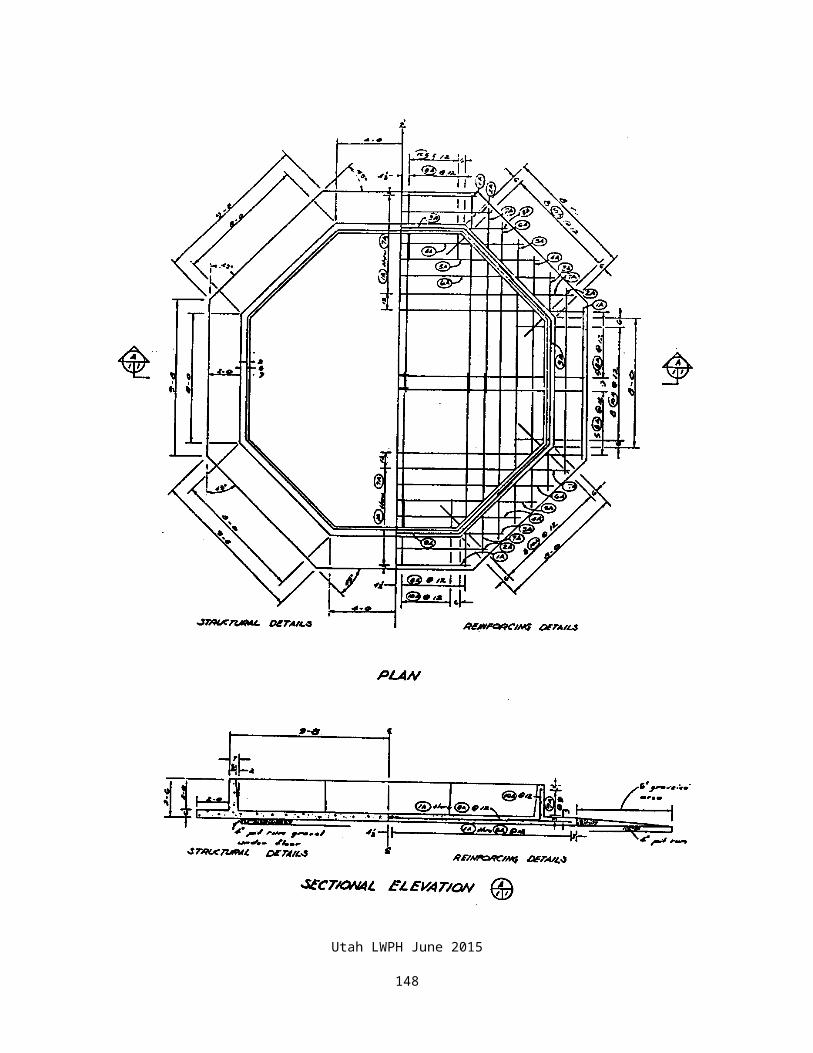
Figure 8.11LAYOUT USING SUBMERGED FLOAT VALVE
Utah LWPH June 2015
149

8.1.3 Protection Around TanksLivestock can wear the ground down around a tank very rapidly, particularly under wet conditions. If the ground is not naturally gravelly, a gravel or concrete base should be installed around the base of the tank. Figures 8.9 through 8.11 show examples of good tank bases.
8.1.4 Tank OverflowsTank overflows are required when there is no control on the amount of water coming into the tank. They are also highly recommended even when a float valve is used to control flow into the tank. Float valves occasionally do not close properly and an overflow is insurance against damage caused by overflow.
The purpose of an overflow is to carry excess water away to prevent excessively wet conditions around the tank. The overflow should be extended to a location where it will not cause a problem. Typically it should be at least 50-100 feet from the trough. If wetland conditions will be created as a result of the overflow, they should be located where the water would naturally collect. Consider protecting the overflow area to retain or enhance any wetland values that may be created.
The inlet to the overflow should be constructed at the elevation of desired water level in the tank. The entrance should be designed to prevent clogging by floating debris, scum and ice.
Figure 8.12 illustrates some commonly used overflow inlet systems.
The outlet end of the drain pipe should be protected from being damaged by livestock or vehicular traffic.
Utah LWPH June 2015
150
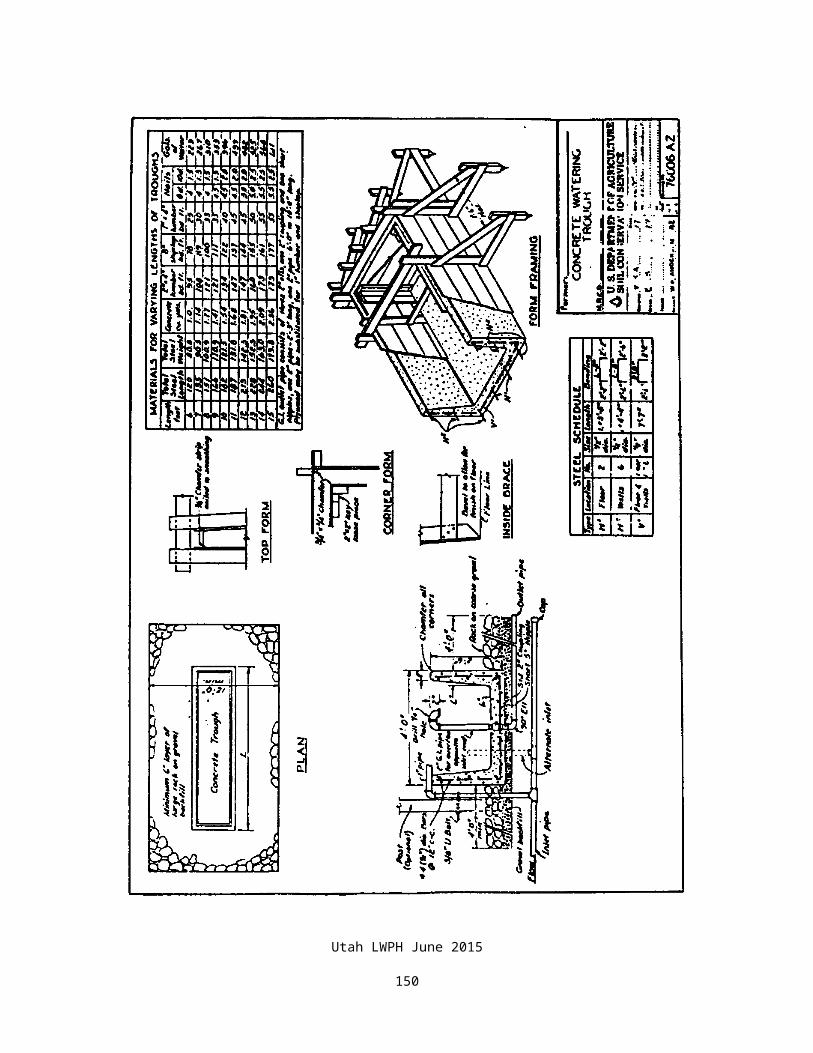
Figure 8.12OVERFLOWS
Utah LWPH June 2015
151
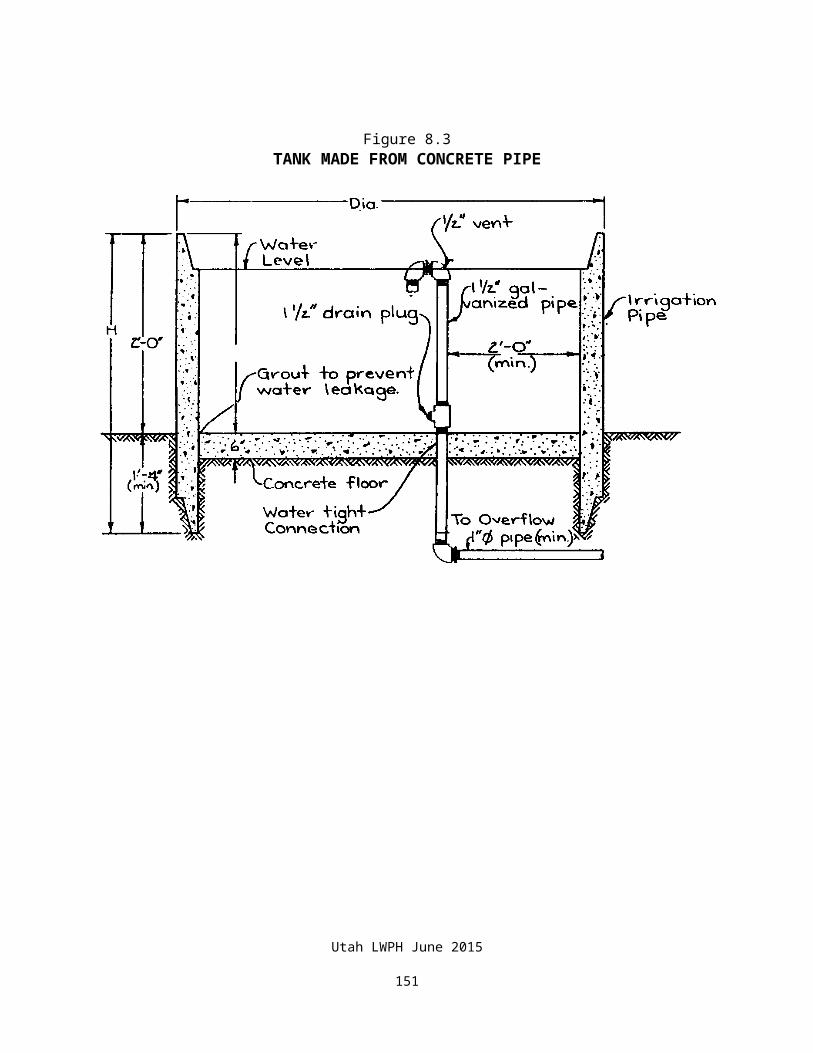
Utah LWPH June 2015
152
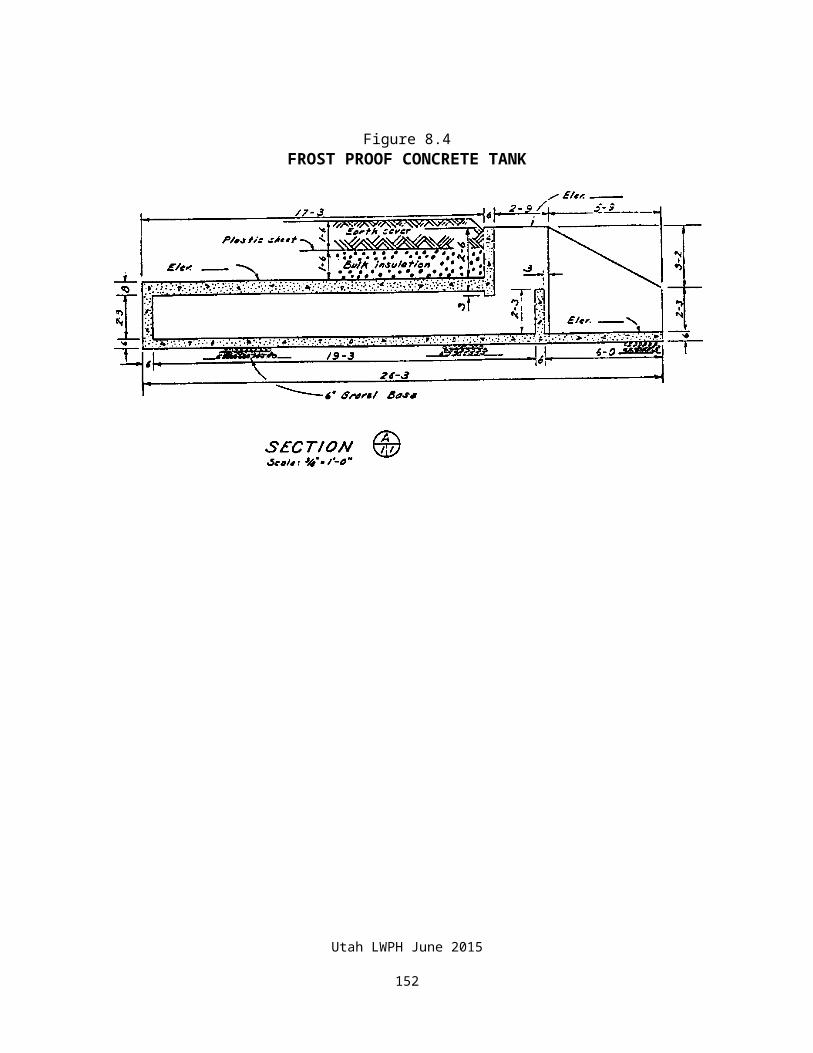
8.1.5 Inlet to Pipeline from TankWhen an inlet to a continuing pipeline is located in a tank, some form of inlet screen should be installed. Figure 8.13 illustrates two types of inlet designs.
Figure 8.13PIPELINE TANK INLET
Utah LWPH June 2015
153
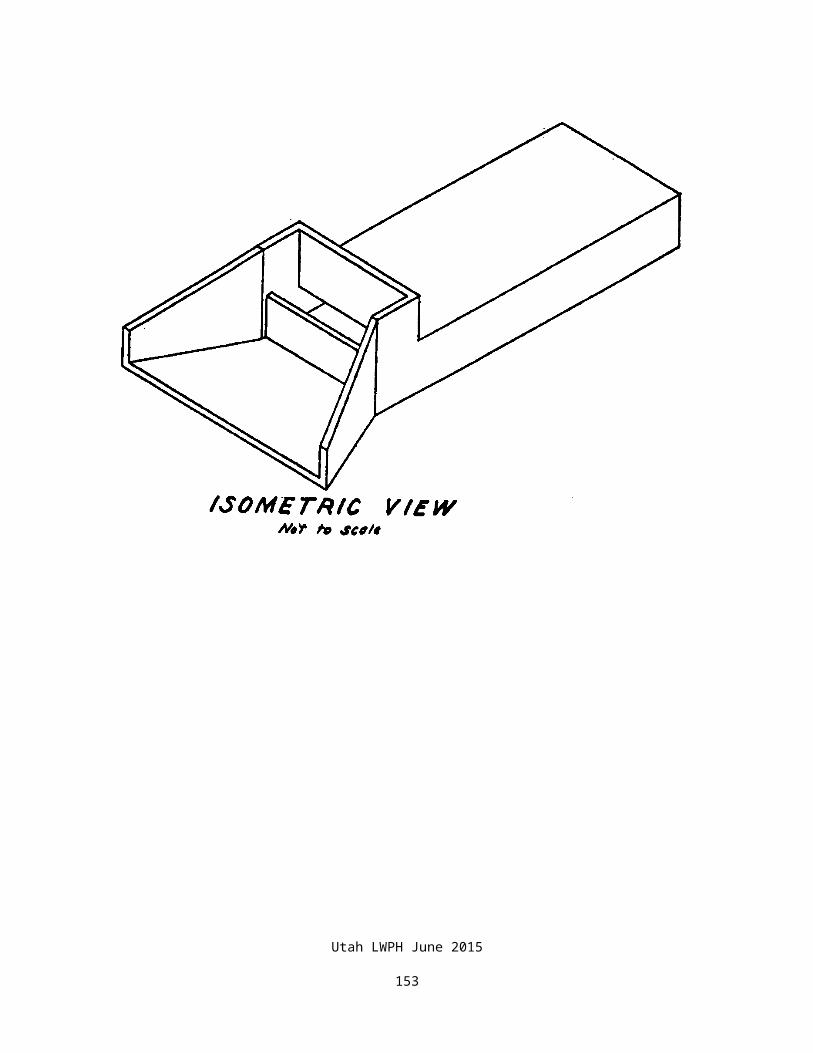
Utah LWPH June 2015
154
8.2 STORAGE TANKSA large storage tank is sometimes used at the highest point in the pipeline as a reservoir to store water for distribution in a gravity pipeline. Another frequent use is for large volume storage for output from springs, windmills, solar pumps, and engine powered pumps.
Used railroad tanker cars, used underground fuel storage tanks, and other used tanks are sometimes used as storage tanks. These can be a bargain, but they must be thoroughly cleaned and properly treated before they can be used. Leaded gasoline and various chemicals may not be adequately cleaned out by steam cleaning. State health regulations must be followed when using such tanks.
If a used tank is not coated on the inside, it will have a limited life depending on the tanks condition and corrosiveness of the water.
The site must be accessible to be able to transport a large tank to the site.
Large diameter steel stock tanks are sometimes used. They have the advantage as being usable as stock tanks as well as for storage. The disadvantage is that they are open at the top and can collect debris, and there may be considerable water loss due to evaporation.
Evaporation from large open tanks can be controlled by covering the tank with a floating cover. Floating covers constructed from low-density, closed cell (EPDM) synthetic rubber have proved to work well. The strips of foam are ¼ inch thick and are glued together with contact cement. Half-inch in diameter bail holes are drilled in the foam to allow rainfall to drain from the surface.
Pits lined with commercial plastic lining material can be used. These must be fenced out to prevent animals from damaging the pit. Floating plastic covers held up by floats under the plastic can be used to seal them.
Figure 8.14 depicts a commercial corrugated steel tank. This tank is similar to a grain bin except it is designed to hold water. It has the advantage of being transportable to remote sites in pieces.
Figure 8.15 illustrates typical plans for a tank fabricated from sheet steel. The inside should be epoxy coated. The outside would be coated with coal tar material or epoxy. Cathodic protection may be needed depending on the corrosivity of the soil.
Figure 8.16 illustrates a large steel tank constructed out of corrugated structural plates.
Figure 8.17 depicts one type of fiberglass storage tank.
Figure 8.18 illustrates a storage bag-type installation. A large rubberized fabric or plastic water storage bag is used for long-term storage. Figure 8.18 depicts such a bag used in conjunction with a water harvesting catchment system. This type of system can be used in remote areas where no other source of water is available and where it would be cost prohibitive to construct a pipeline from another area.
Utah LWPH June 2015
155
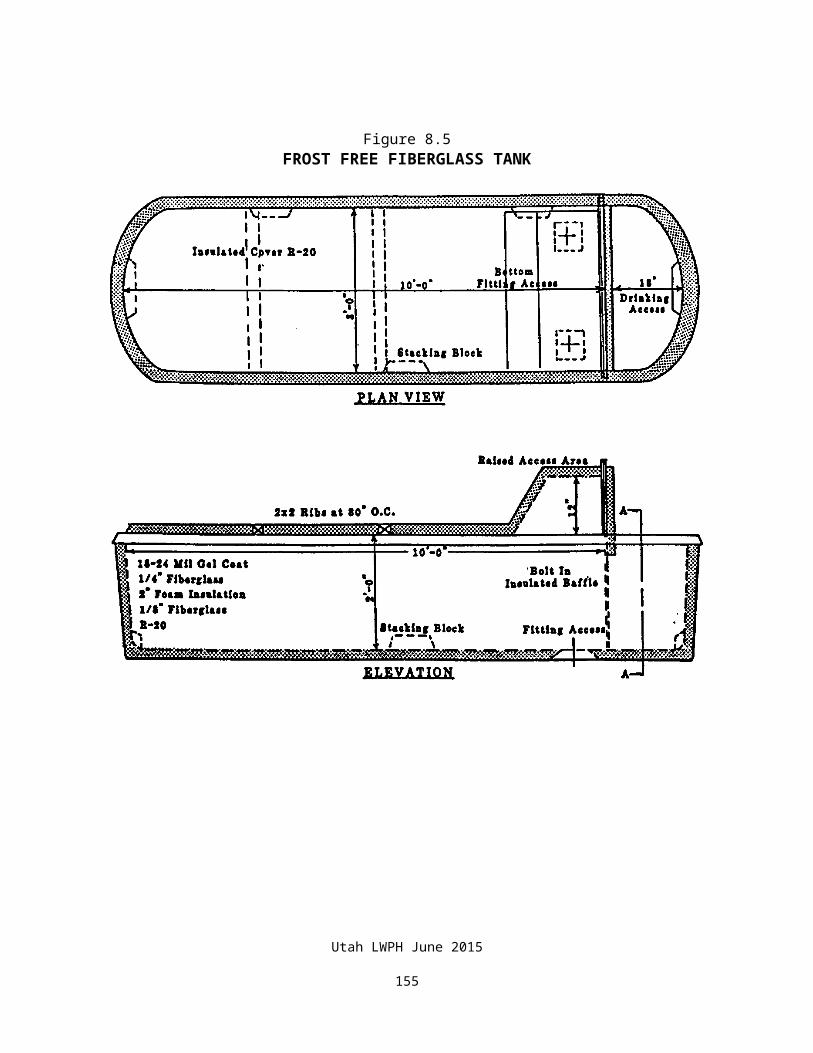
Figure 8.14COMMERCIAL STEEL WATER STORAGE TANK
Utah LWPH June 2015
156
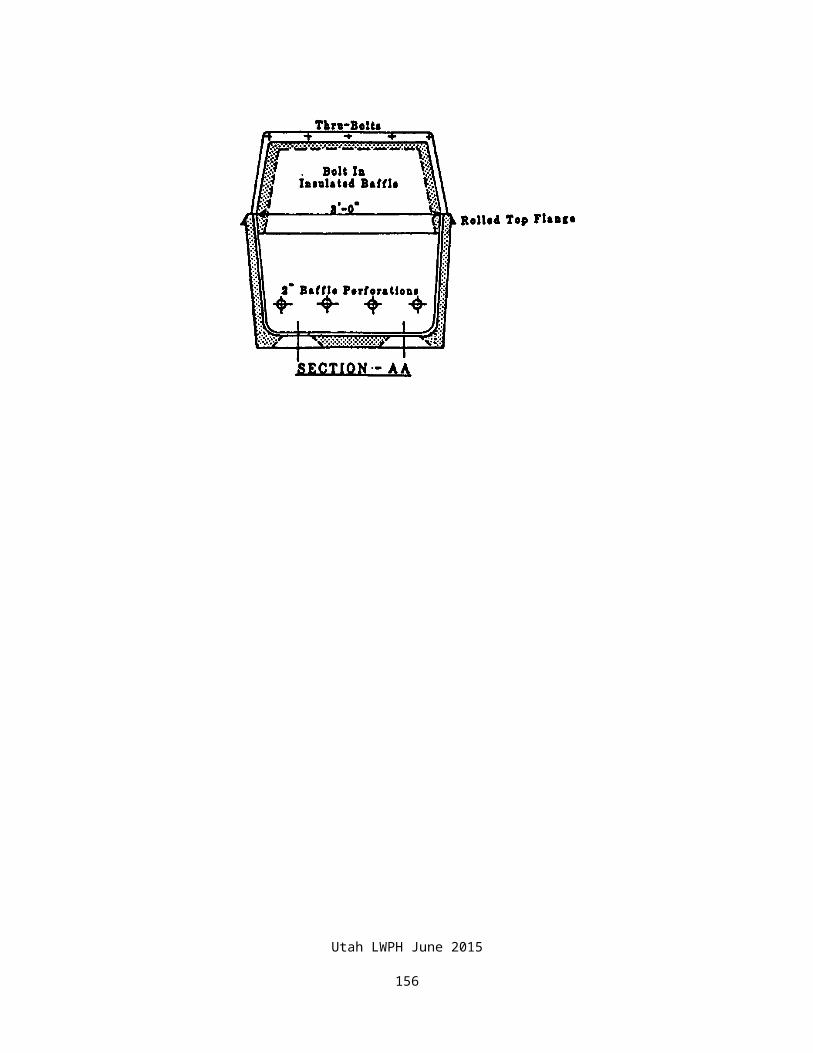
Utah LWPH June 2015
157
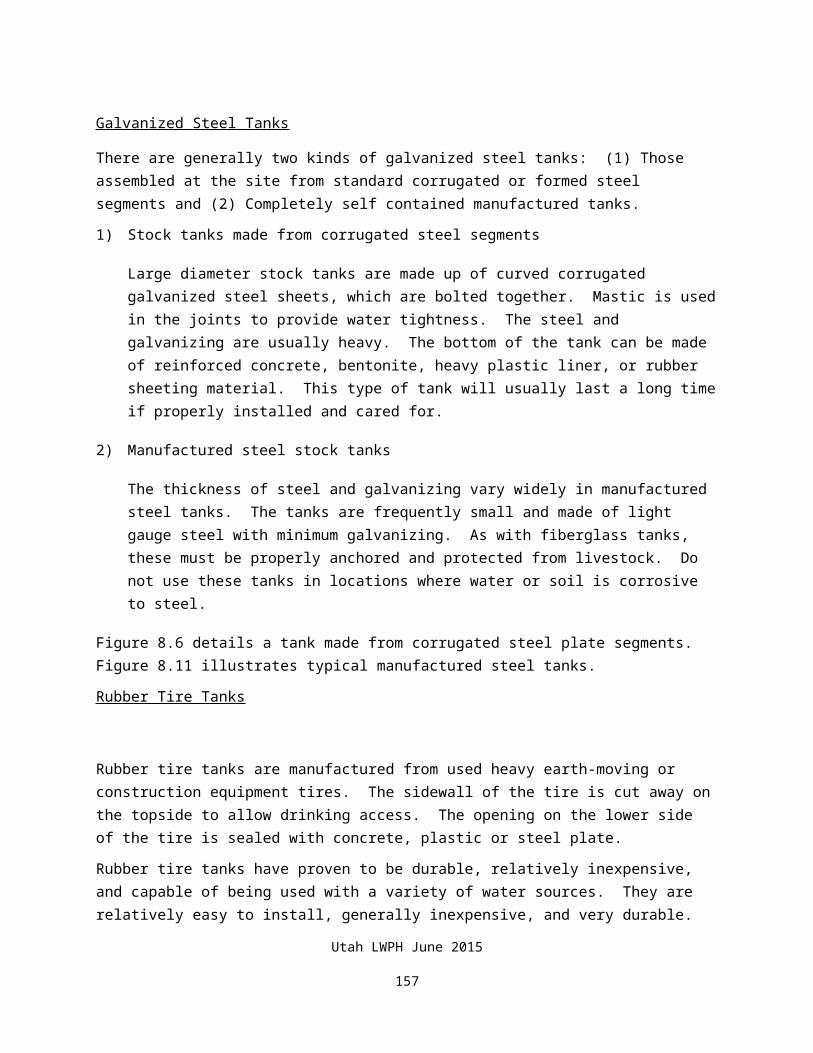
Figure 8.15FABRICATED STEEL STORAGE TANK
Utah LWPH June 2015
158

Figure 8.16CONSTRUCTED CORRUGATED STEEL STORAGE TANK
Utah LWPH June 2015
159

Utah LWPH June 2015
160
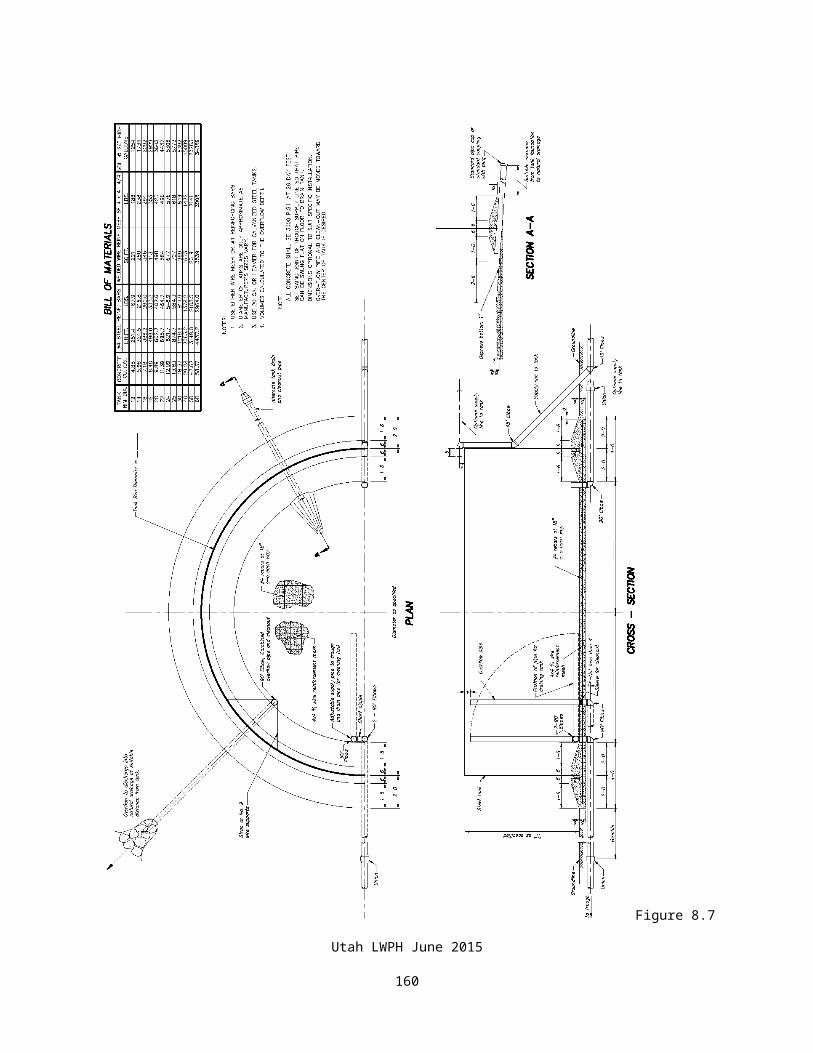
Figure 8.17FIBERGLASS STORAGE TANK
Utah LWPH June 2015
161
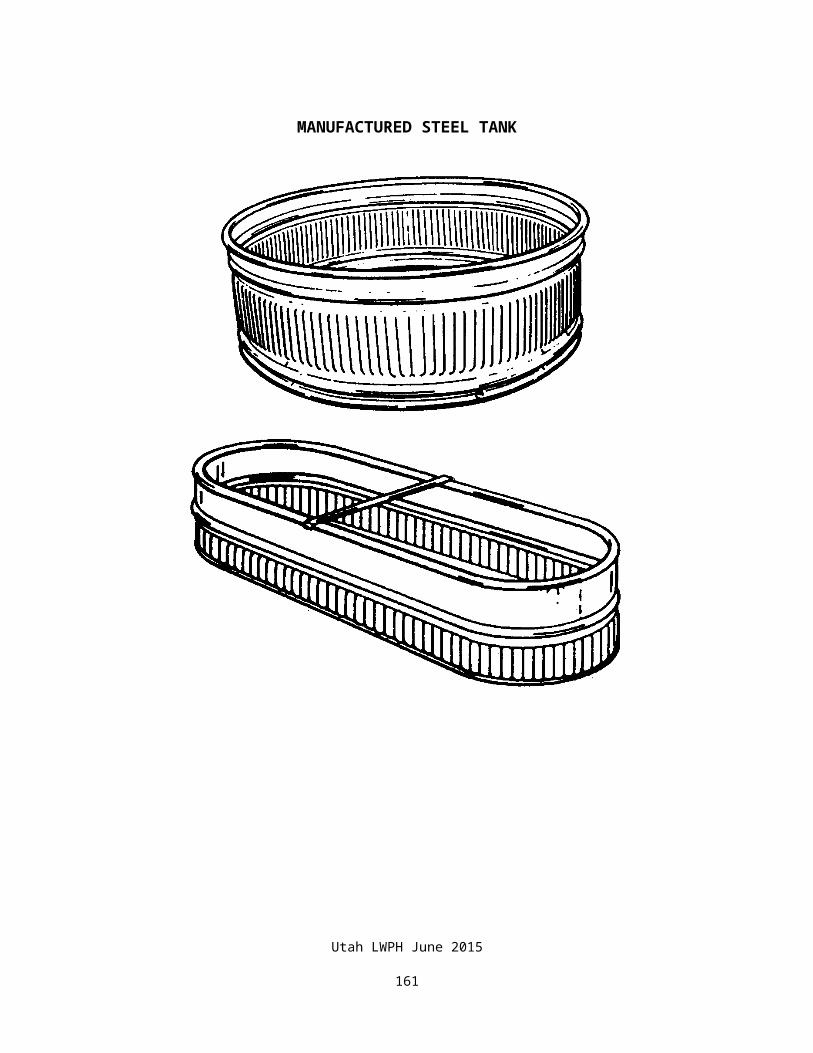
Utah LWPH June 2015
162
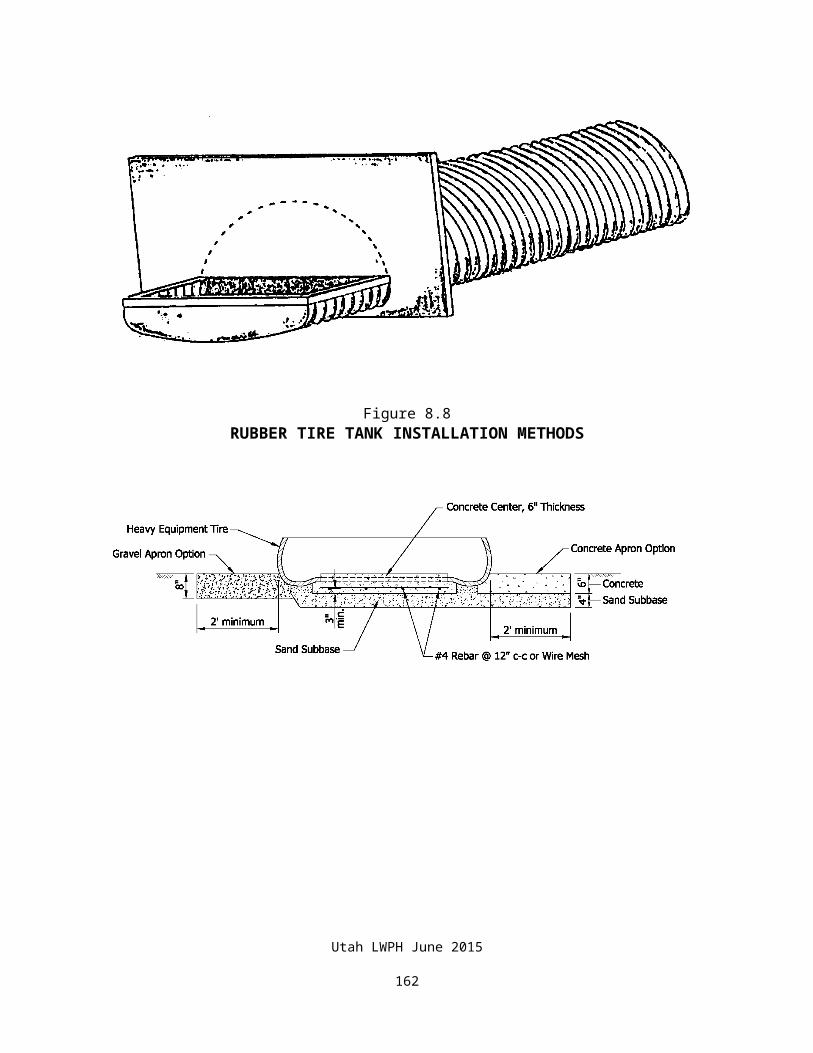
Figure 8.18WATER HARVESTING SYSTEM USINGRUBBERIZED FABRIC STORAGE BAG
8.3 PIPELINE DRAINSPipeline drains are required at all low spots in pipelines that are subject to freezing. They are also sometimes installed in frost free pipelines where it is desired to have the ability to drain a pipeline for maintenance. When it is not possible to drain a pipeline by gravity, a blind drain or pumpout drain is required. Figure 8.19 illustrates typical drain details.
Utah LWPH June 2015
163
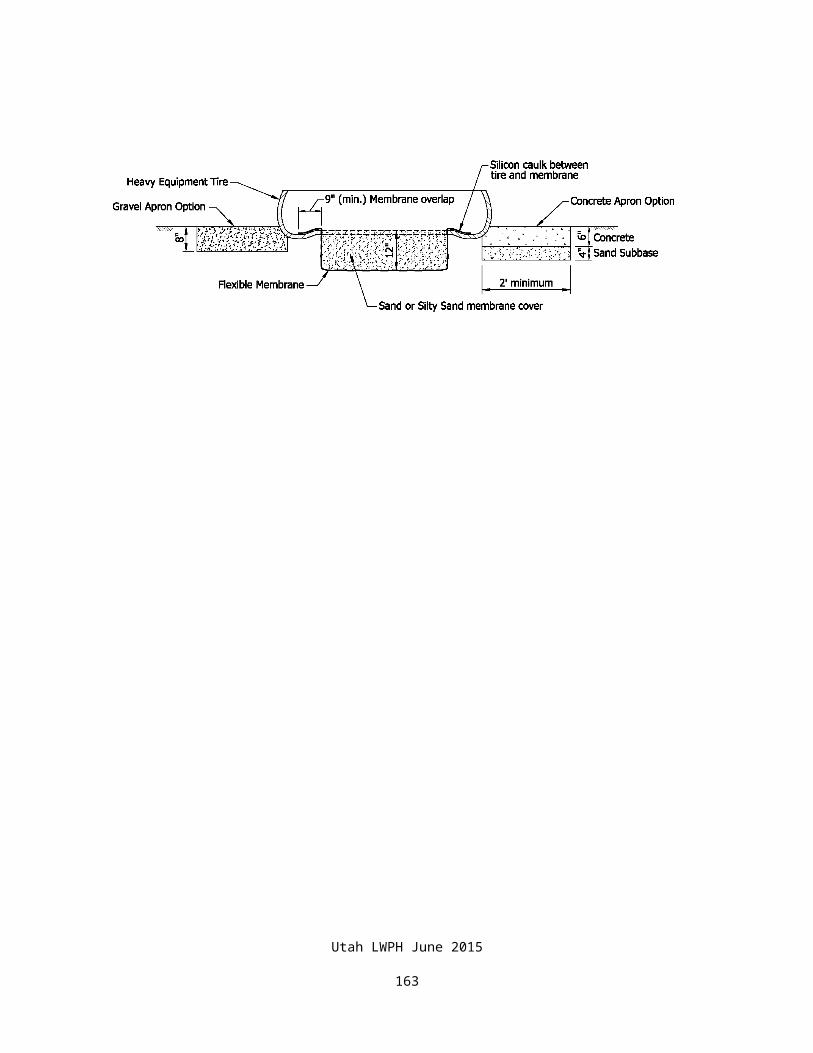
Figure 8.19PIPELINE DRAINS
GRAVITY DRAIN
BLIND DRAIN
Utah LWPH June 2015
164
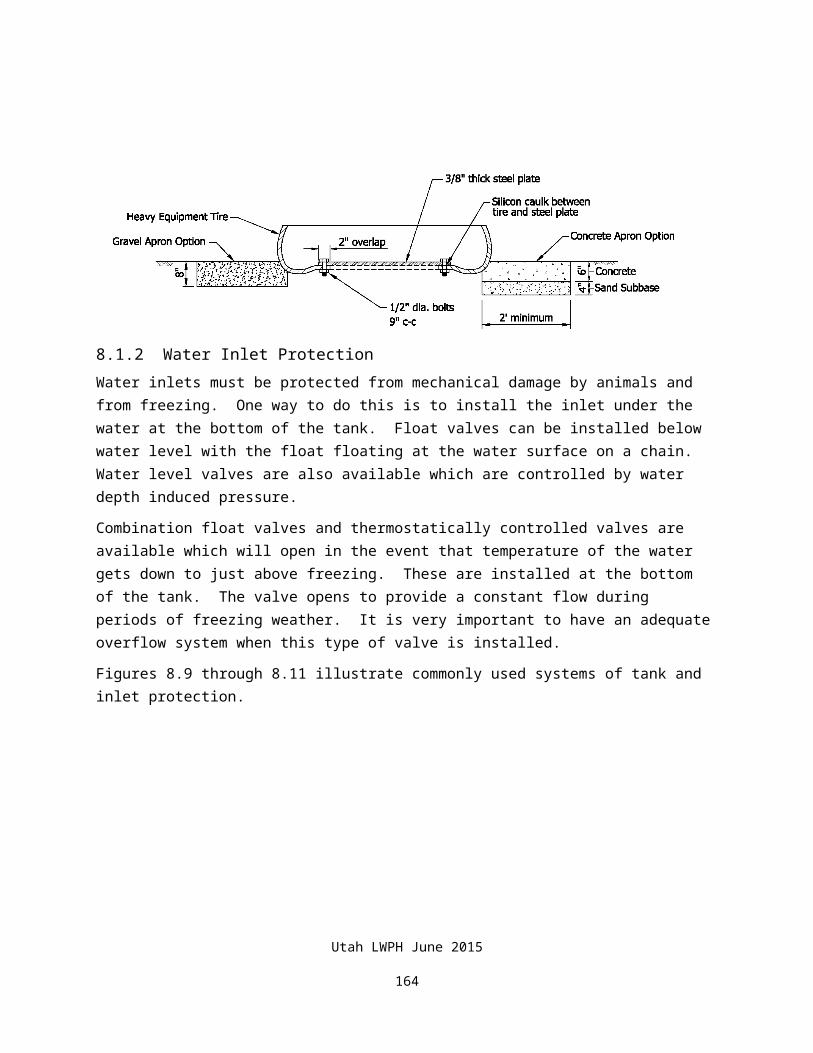
PUMPOUT
CHAPTER 9
SPRINGS AND WELLS
TABLE OF CONTENTS
PART 9.1 SPRING FED PIPELINE ENTRANCE 9-1PART 9.2 WELLS AND SUMPS 9-5
FIGURES
Figure 9.1 Typical Spring Box and Pipe Collection 9-1Figure 9.2 Typical Spring Box Direct Collection 9-2Figure 9.3 Water Collection Without Spring Box 9-3Figure 9.4 Typical Spring Fed Pipeline 9-4
Utah LWPH June 2015
165
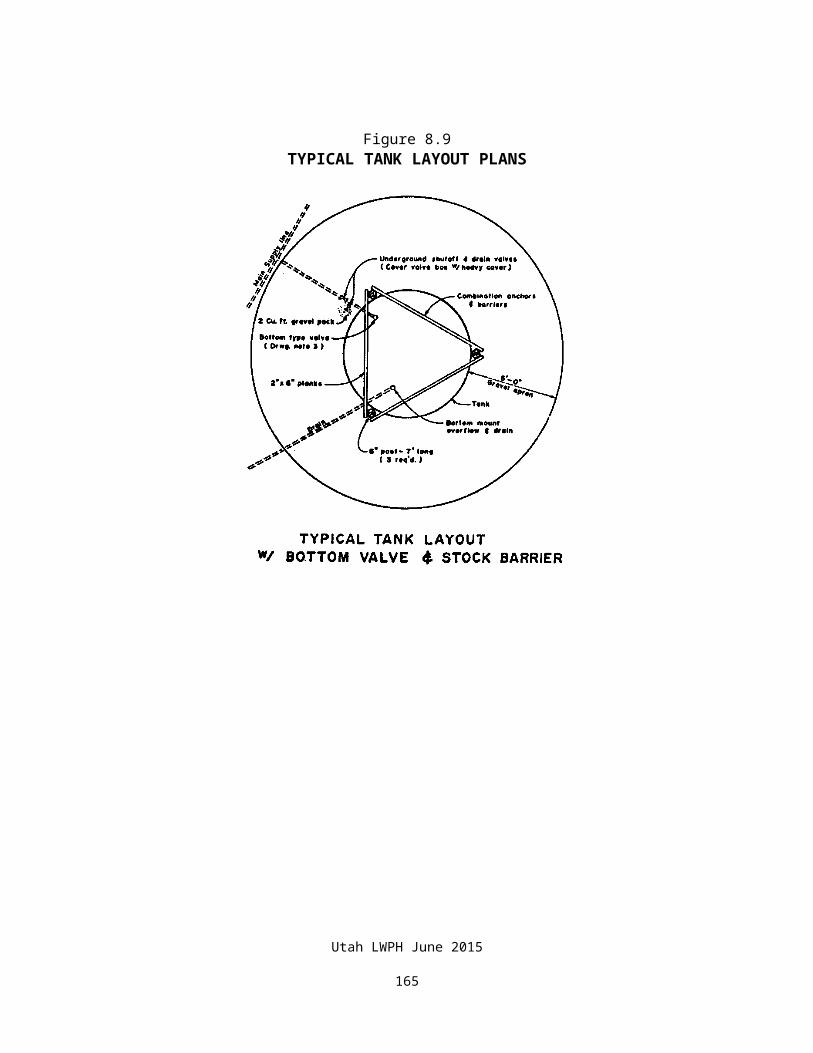
CHAPTER 9 -- SPRINGS AND WELLS
9.1 SPRING FED PIPELINE ENTRANCEThere are many ways that water can be collected at a spring and led into a pipeline. Figures 9.1 through 9.4 illustrate some typical installations.
If the spring yields any kind of sediment along with the water, a spring box should be installed. A spring box is also useful for monitoring and maintaining the spring water collection system.
Chapter 12 of the Natural Resources Conservation Service Engineering Field Manual provides information on developing springs and spring water collection systems.
Figure 9.1TYPICAL SPRING BOX AND PIPE COLLECTION
W = 1.5’ min
Utah LWPH June 2015
166
1.5’ min
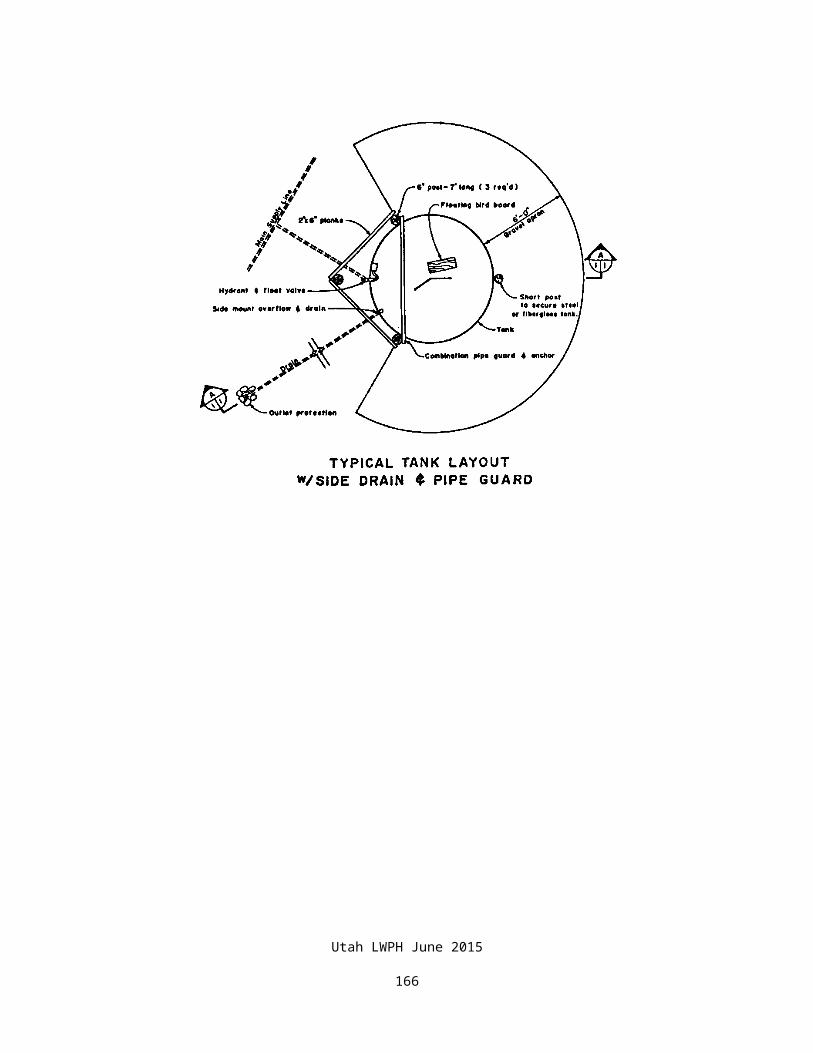
Figure 9.2TYPICAL SPRING BOX DIRECT COLLECTION
Utah LWPH June 2015
167
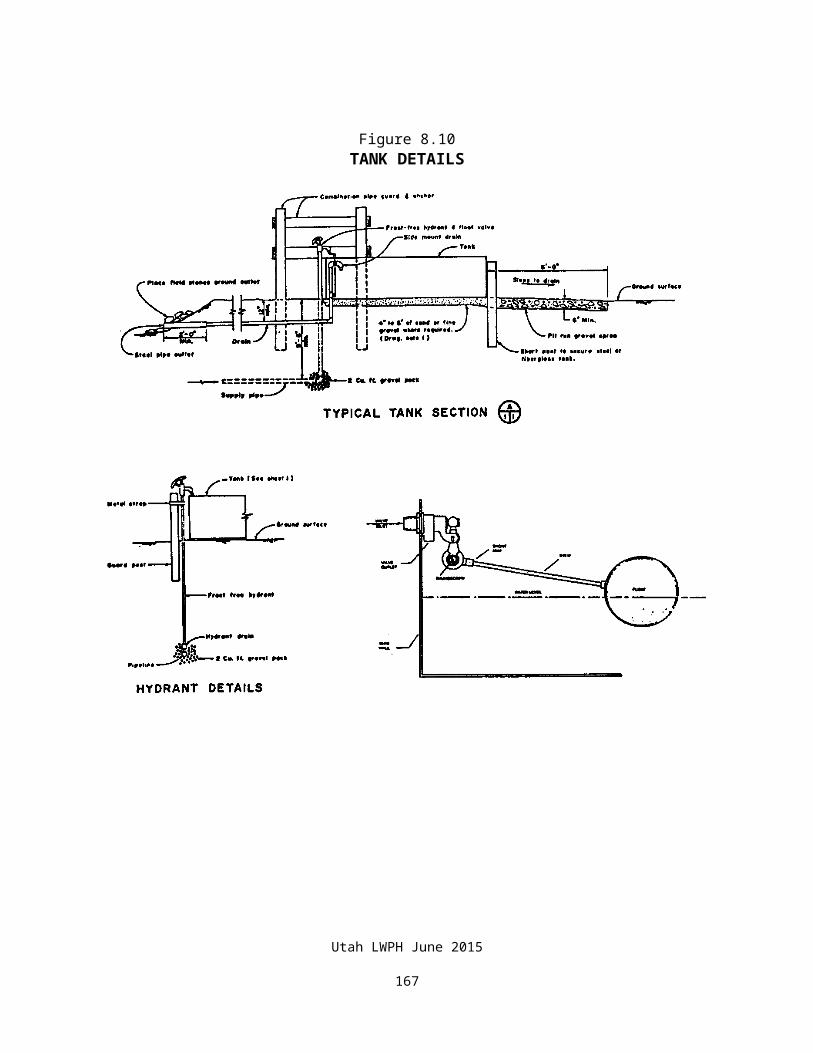
Utah LWPH June 2015
168
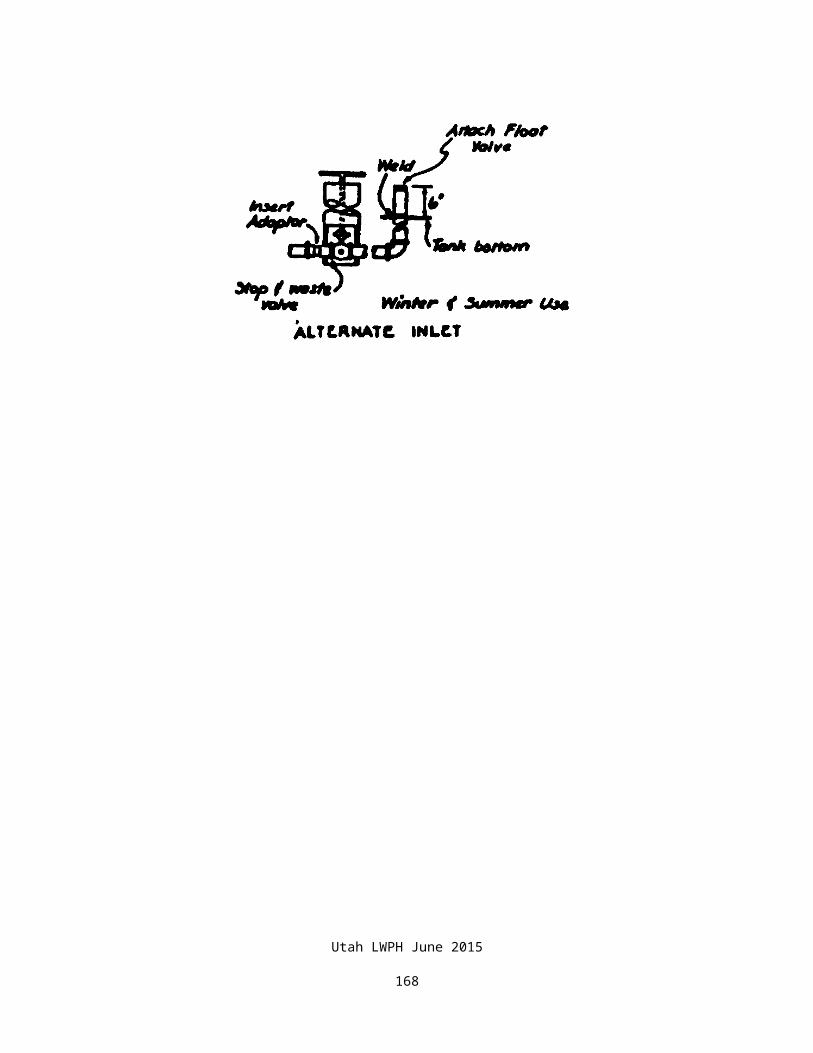
Figure 9.3WATER COLLECTION WITHOUT SPRING BOX
PLAN
Utah LWPH June 2015
169
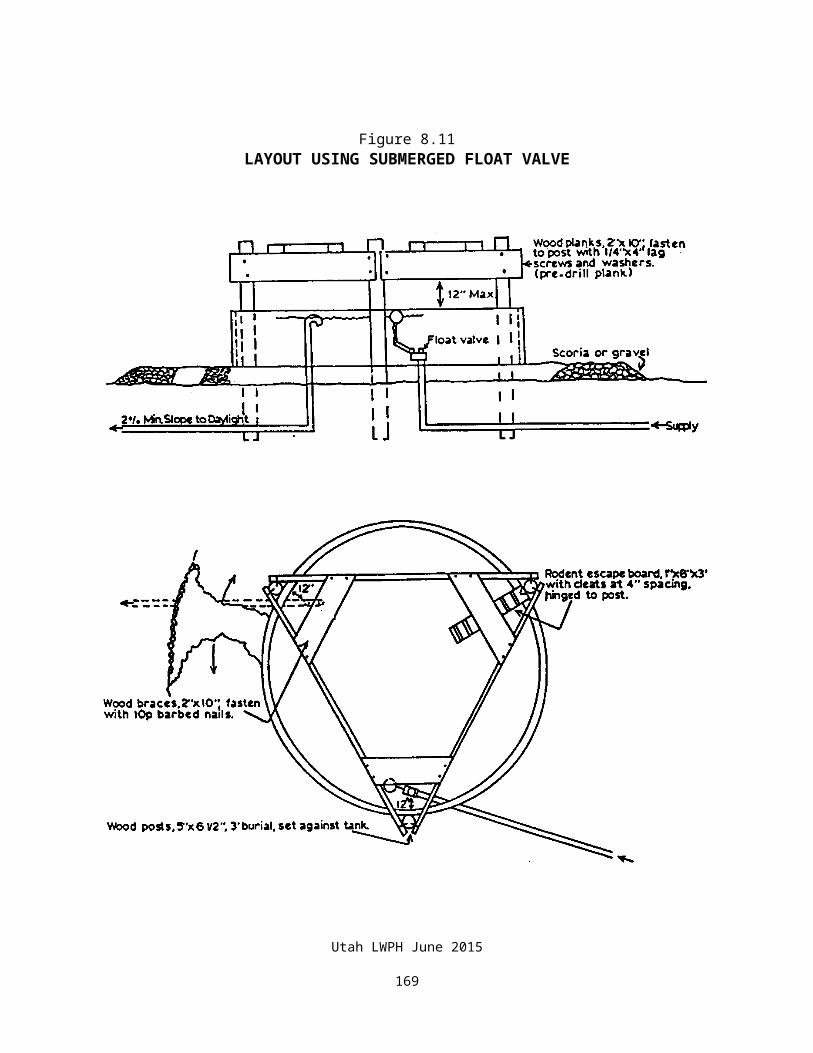
Note: Instead of a "T", a "Y" may be installed with the riser at a 45 degree angle with the ground. This will allow using a snake to clean out the perforated drain pipe.
PROFILE
Utah LWPH June 2015
170
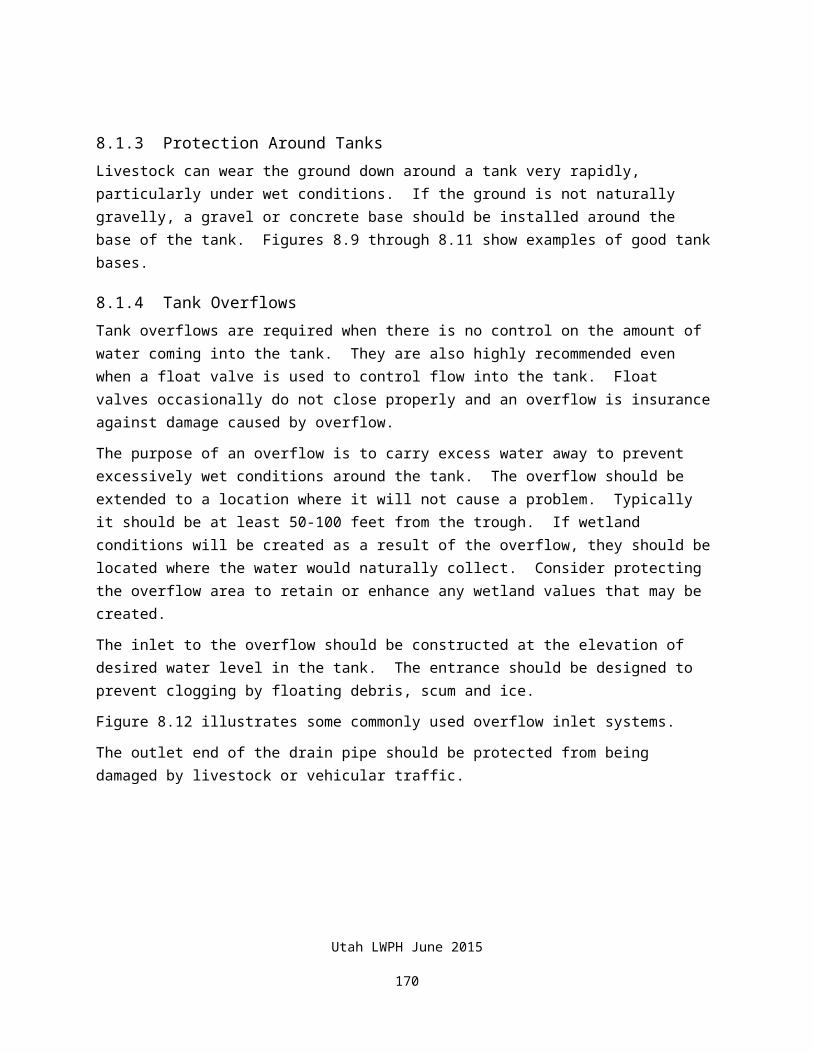
Figure 9.4TYPICAL SPRING FED PIPELINE
Utah LWPH June 2015
171
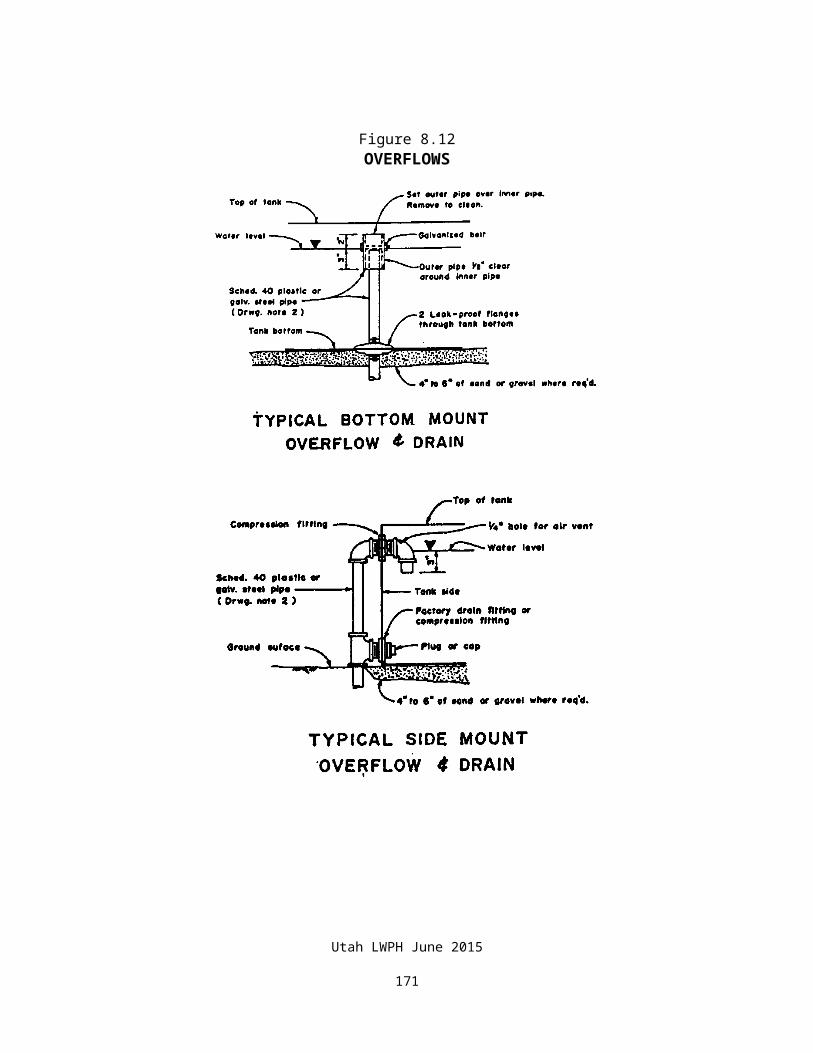
9.2 WELLS AND SUMPSThis section will be added at a later date.
Utah LWPH June 2015
172
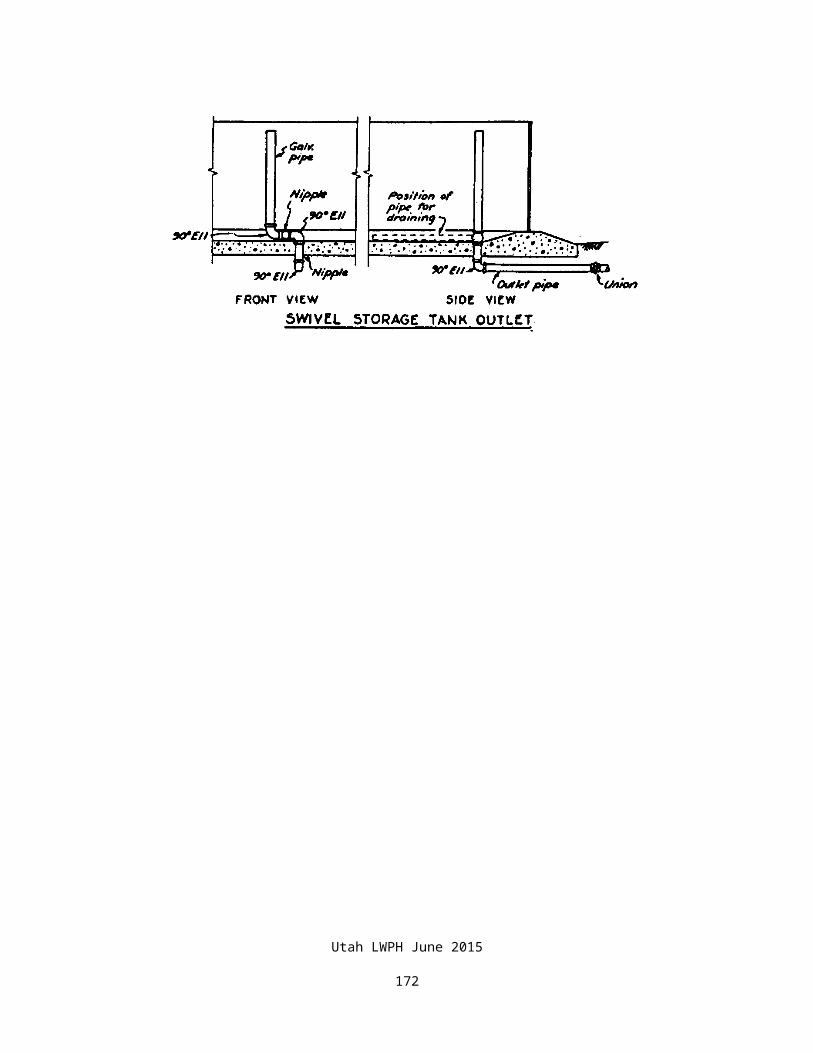
CHAPTER 10
WELL ACCESSORIES
TABLE OF CONTENTS
PART 10.1 PUMPS 10-110.1.1 Submersible Electric Pump 10-210.1.2 Jet Pump 10-610.1.3 Turbine Booster Pump 10-810.1.4 Piston Pumps 10-910.1.5 Windmill 10-910.1.6 Wind Generator Powered Pump 10-1410.1.7 Solar Powered Pump System 10-1510.1.8 Internal Combustion Engine Powered Pumps 10-1810.1.9 Hydraulic Rams 10-1910.1.10 Constant Pressure Submersible Pumps 10-22
PART 10.2 PRESSURE TANKS 10-2310.2.1 Plain Pressure Tank 10-2410.2.2 Diaphragm Type Tank 10.2510.2.3 Tank Pressure Rating 10.25
PART 10.3 PRESSURE SWITCHES 10-3410.3.1 Switch Characteristics 10-3410.3.2 Pressure Gauges 10-35
PART 10.4 ELECTRICAL PUMP CONTROL EQUIPMENT 10-3610.4.1 Automatic Water Level Control 10-3610.4.2 Remote Control Pump Float Switch 10-38
FIGURES
Figure 10.1 Submersible Pump 10-3Figure 10.2 Typical Well with Pitless Adapter and
Submersible Pump 10-4Figure 10.3 Typical Submersible Pump Curve 10.5Figure 10.4 How a Jet Pump Works 10-6Figure 10.5 Typical Jet Pump Installation and Capacity Table 10-7Figure 10.6 Typical Turbine Booster Pump 10-8Figure 10.7 Three Piston Pump 10-9Figure 10.8 Windmill as Supply to Tank 10-10
Utah LWPH June 2015
173
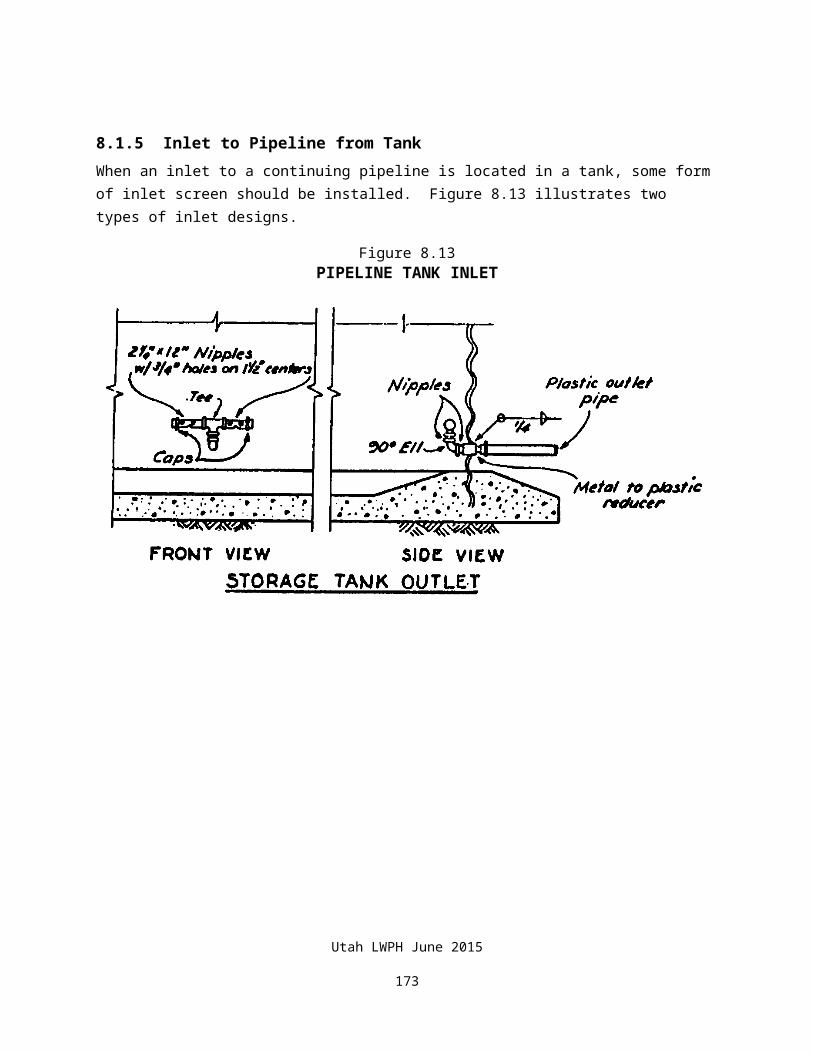
Figure 10.9 Windmill Connected to Pipeline 10-11Figure 10.10 Wind Generator Powered Pump 10-14Figure 10.11 Typical Solar Submersible Pump Gravity System 10-16Figure 10.12 Shallow Water Table Solar Pump Installation 10-17Figure 10.13 Propane Powered, Automatic Generator for Pump 10-18Figure 10.14 Typical Hydraulic Ram Installation 10.20Figure 10.15 Small Plastic Hydraulic Ram 10-20Figure 10.16 Large Steel Hydraulic Rams 10.21Figure 10.17 How a Pressure Tank Works 10.23Figure 10.18 Multiple Pressure Tank Installation 10.24Figure 10.19 Plain Pressure Tank Capacity 10.25Figure 10.20 Float Switch Pump Control 10-36Figure 10.21 Switch Control of Water Level 10-37Figure 10.22 Remote Tank Float Operated Switching Equipment 10-38Figure 10.23 Water Control Switches 10-39
TABLES
Table 10.1 Approximate Windmill Capacity 10-12Table 10.2 Windmill Pumping Head 10-13Table 10.3 Diaphragm Pressure Tank Size Selection, 10-27 to 10.7 Minimum Recommended Total Storage Tank Size to 10-29Table 10.8 Plain Pressure Tank Size Selection, 10-30 to 10.12 Minimum Recommended Total Storage Tank Size to 10-34
Utah LWPH June 2015
174
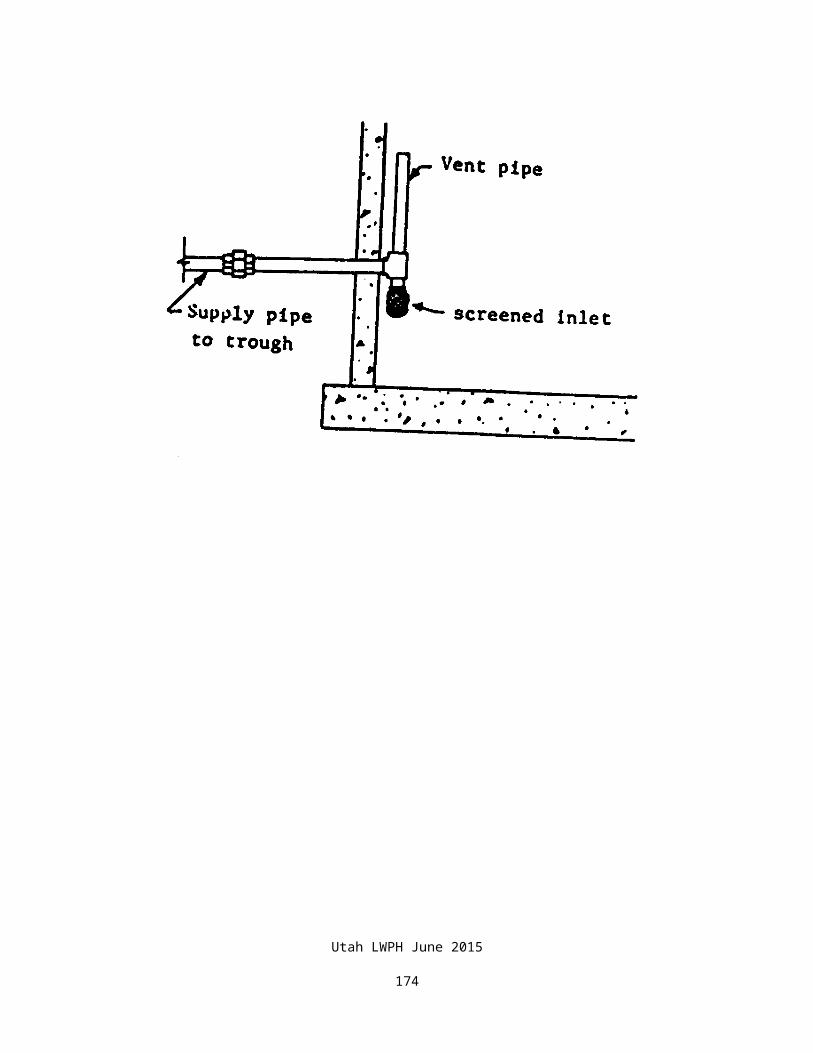
CHAPTER 10 - WELL ACCESSORIES
10.1 PUMPSThere are many kinds of pumps used in stockwater pipelines. The best alternative depends on available sources of power, flow rate and head requirements, and water source.
Availability of electric power is frequently a major factor in determining whether or not an electric pump can be used. If power is not already available at the water source, it can be very expensive to provide. Two major considerations when planning a stockwater system requiring pumping are electric power availability and cost of providing electric power.
It is good practice to the review the pump selected by the operator to assure that the system will function as designed.
The selection of the proper pump is based on the following information:
Required discharge
Pipeline operating pressure requirements
Total dynamic head
The total dynamic head is obtained by adding the maximum required pressure at the well (in feet) to the depth to the ground water drawdown.
Pump Curves
The pump should be able to supply the design flow rate at the maximum operating pressure. A pump curve is used to assure this requirement is met. The example pump curve shown on page 10-5 is valid only for the specific pump models for which it was developed (in this case, 18 GPM SUBMERSIBLE SERIES “CC”). Therefore, to evaluate if a pump meets the design requirements, the pump curve for the installed pump should be obtained from the pump installer or manufacturer.
Utah LWPH June 2015
175
Example:
Given: Required discharge 10 gpm
Operating pressure required 60-80 psi
Depth to water table 120 feet
Drawdown 10 feet
Total head = 80 psi x 2.31 ft/psi + 120 ft +10 ft = 315 ft
From Figure 10.3, for 10 gpm and 315 feet of head, a 1 1/2 HP, model 11CC will meet these design requirements.
The objective of a properly sized pump for a livestock pipeline system is to supply the required flow rate at the required pressure while minimizing pump cycling, or stopping and starting. Installing a pump with horsepower rating which is too large or too small may cause significant problems with the system.
A pump with a horsepower rating too large may pump water to the open hydrant or tank faster than the pipeline design velocity. The resulting surge of water will cause a temporary rise in the friction loss and pressure. This elevated pressure can cause the pump to cycle off prematurely (by reaching the "pump off" pressure) even though the tank float is still open. Once the surge of water dissipates, the friction loss decreases until the pressure drops to the "pump on" pressure and the well cycles on again, resulting in another surge of water. Cycling the pump on and off too frequently can dramatically shorten the life of the pump, sometimes causing the pump to burn out.
If a 3 HP-19CC pump was selected for the previous example, the pump would supply approximately 21 gpm at 315 feet of head. The friction loss would increase and the pressure would rise. At 10 gpm, the pump would supply 550 feet of operating head. Thus the pump would cycle off by reaching the "pump off" pressure. This also illustrates the importance of using a pressure switch. If the system did not have a pressure switch or if the switch malfunctioned, the 3 HP pump could supply enough pressure head to rupture the pipe.
A pump with a horsepower rating too small may either supply less than the designed flow rate or may not supply water to all pipeline locations.
A properly designed pipeline system will provide water at the design flow rate. It should never be necessary to increase the pressure switch settings. If the installed pipe material or pipe size is different than the design, the proper switch settings can be calculated. Arbitrarily increasing
Utah LWPH June 2015
176
pressure settings to increase flow rate can cause problems with the system including pipe failure, decreased pipe life, or inadequate flow rate delivery.
10.1.1 Submersible Electric Pump
Figure 10.1 illustrates a typical submersible pump. This is the best type of pump for deep wells.
Some submersible pumps have a built-in check valve in the pump. It is a good idea though, particularly on high-pressure systems, to install another separate check valve on the pump side of the pressure tank.
Figure 10.2 illustrates a typical submersible pump system using a pitless adapter. Figure 10.3 illustrates a typical submersible pump curve.
Utah LWPH June 2015
177
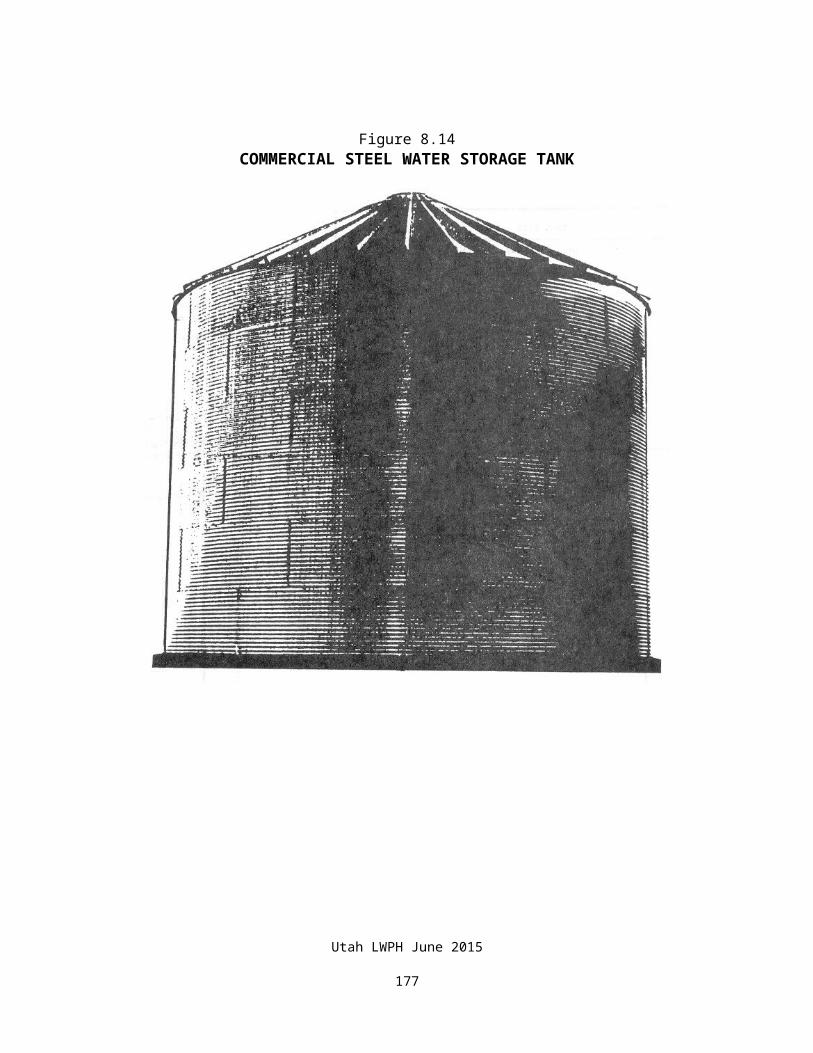
Figure 10-1SUBMERSIBLE PUMP
Utah LWPH June 2015
178
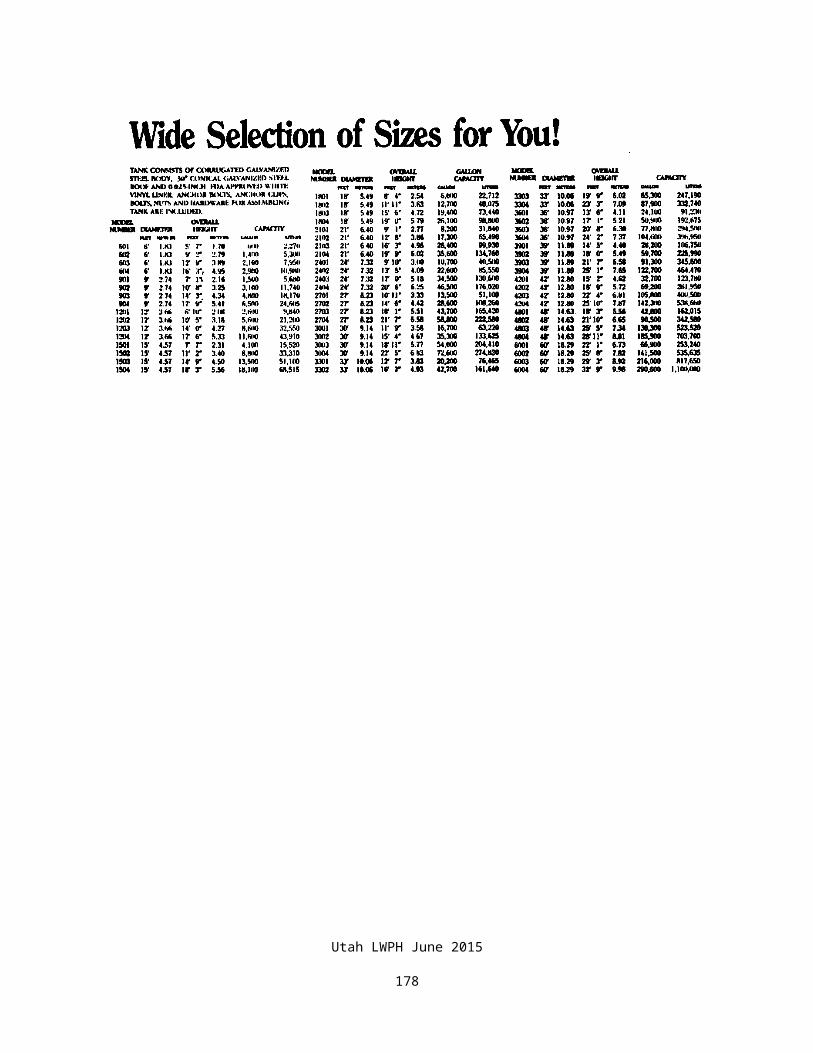
Figure 10.2TYPICAL WELL WITH PITLESS ADAPTER AND SUBMERSIBLE PUMP
Utah LWPH June 2015
179
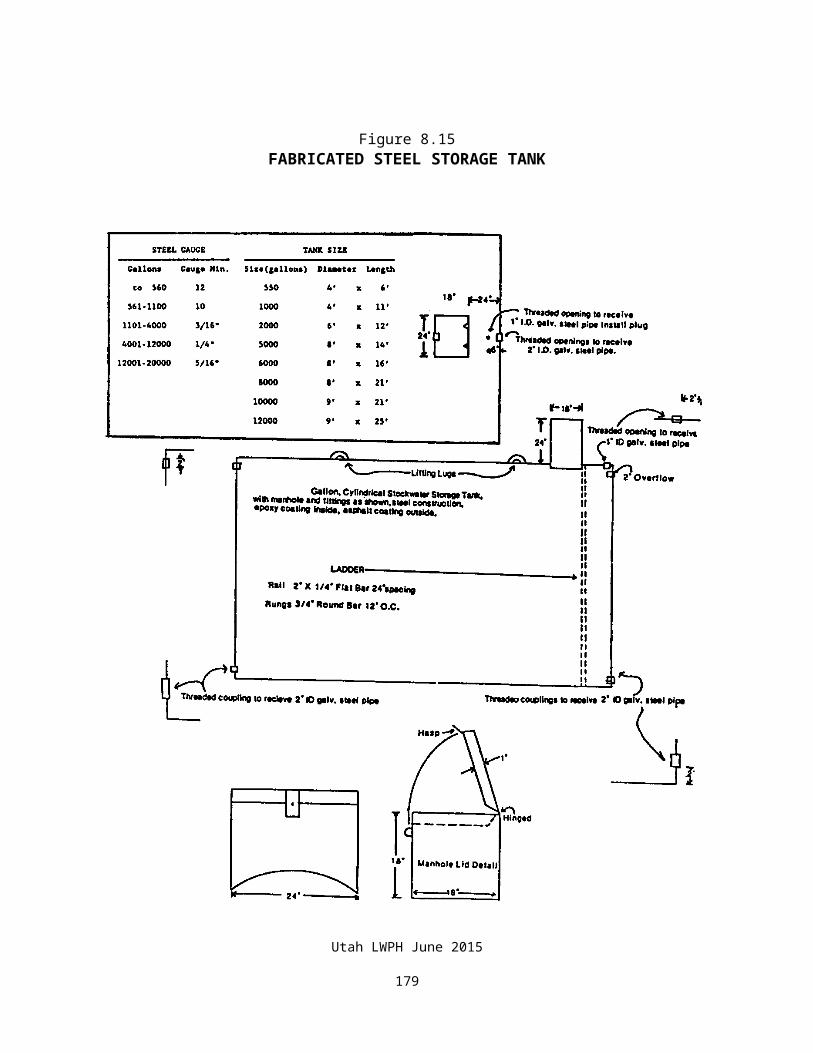
Figure 10.3TYPICAL SUBMERSIBLE PUMP CURVE
Utah LWPH June 2015
180
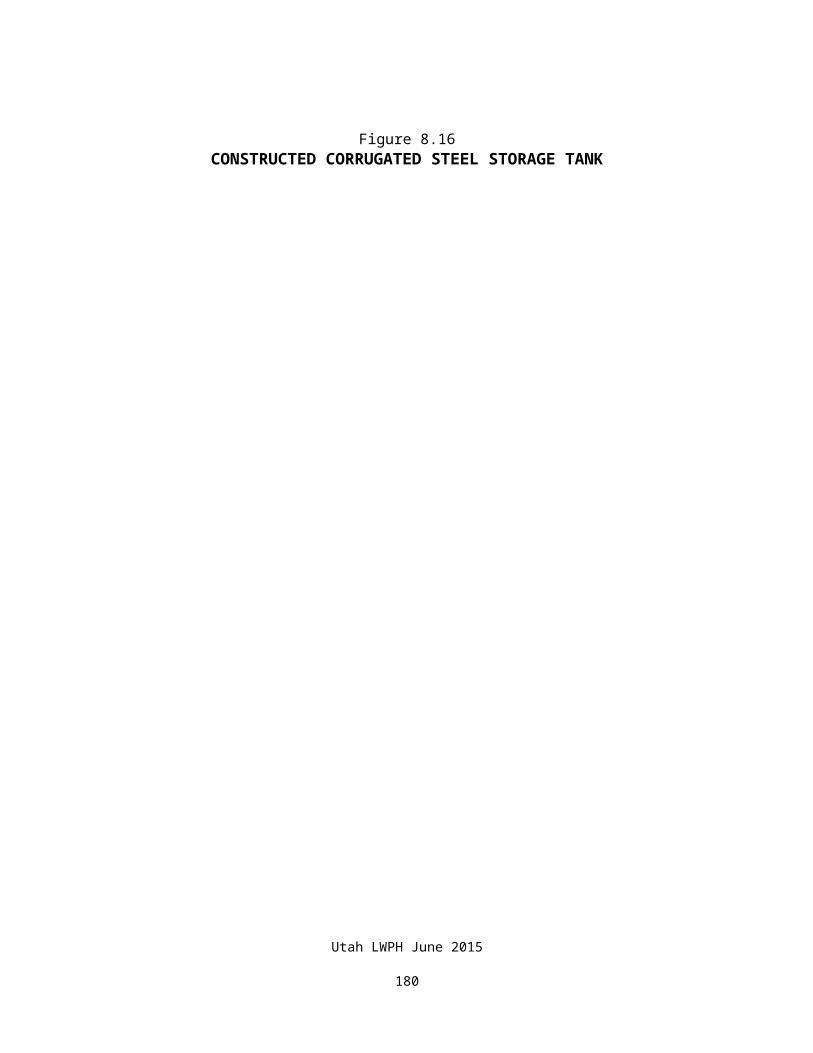
Utah LWPH June 2015
181
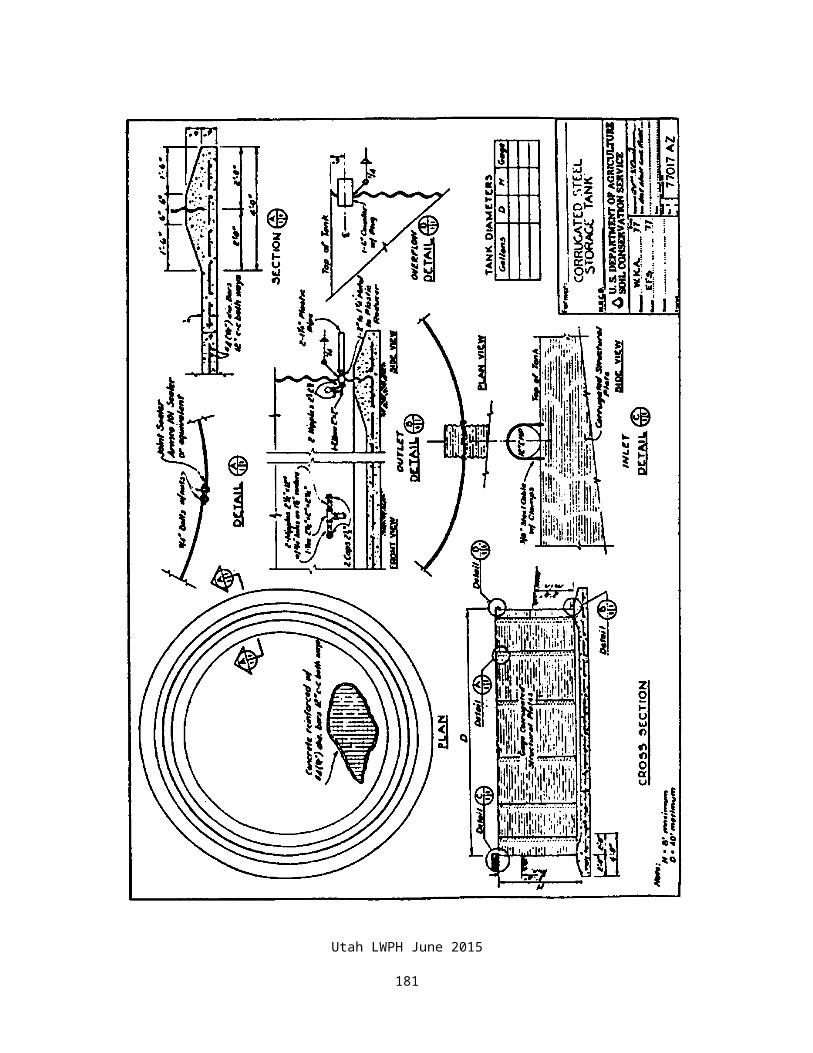
10.1.2 Jet PumpFigure 10.4 illustrates how a jet pump works. Jet pumps are used for shallow and medium depth wells. Jet pumps must usually be installed in an insulated aboveground enclosure. This allows the top of the well casing to extend above the ground.
Figure 10.4HOW A JET PUMP WORKS
Utah LWPH June 2015
182
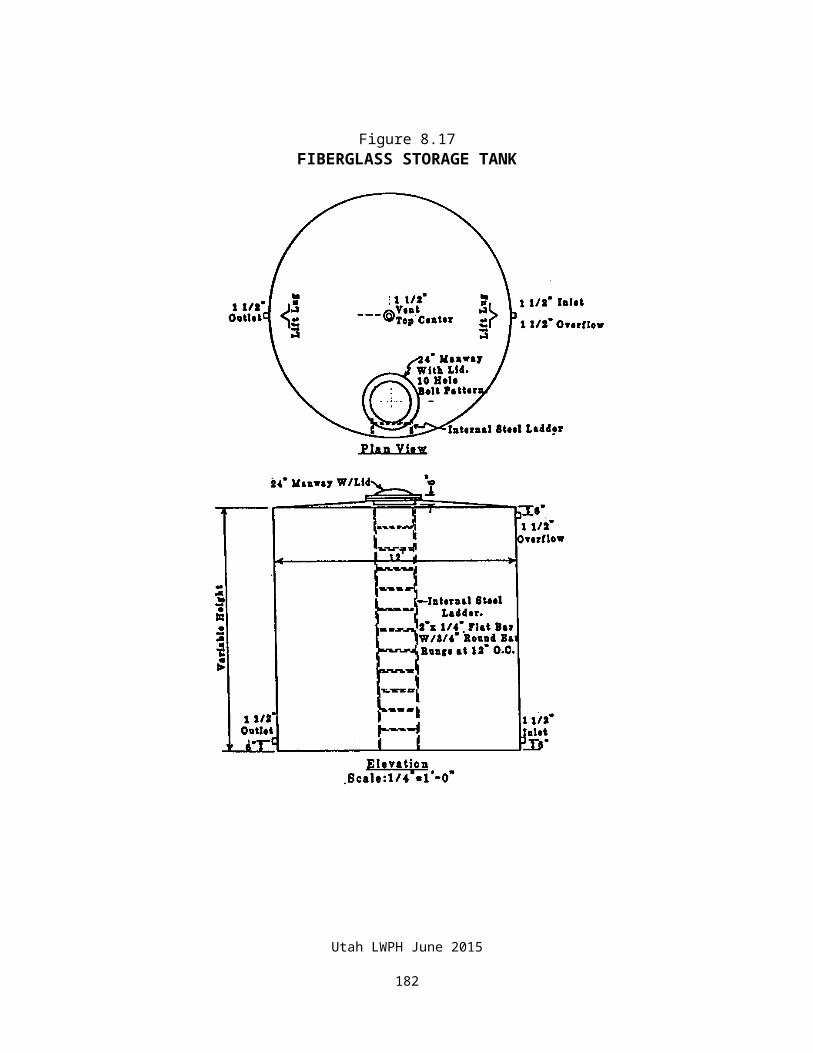
Utah LWPH June 2015
183
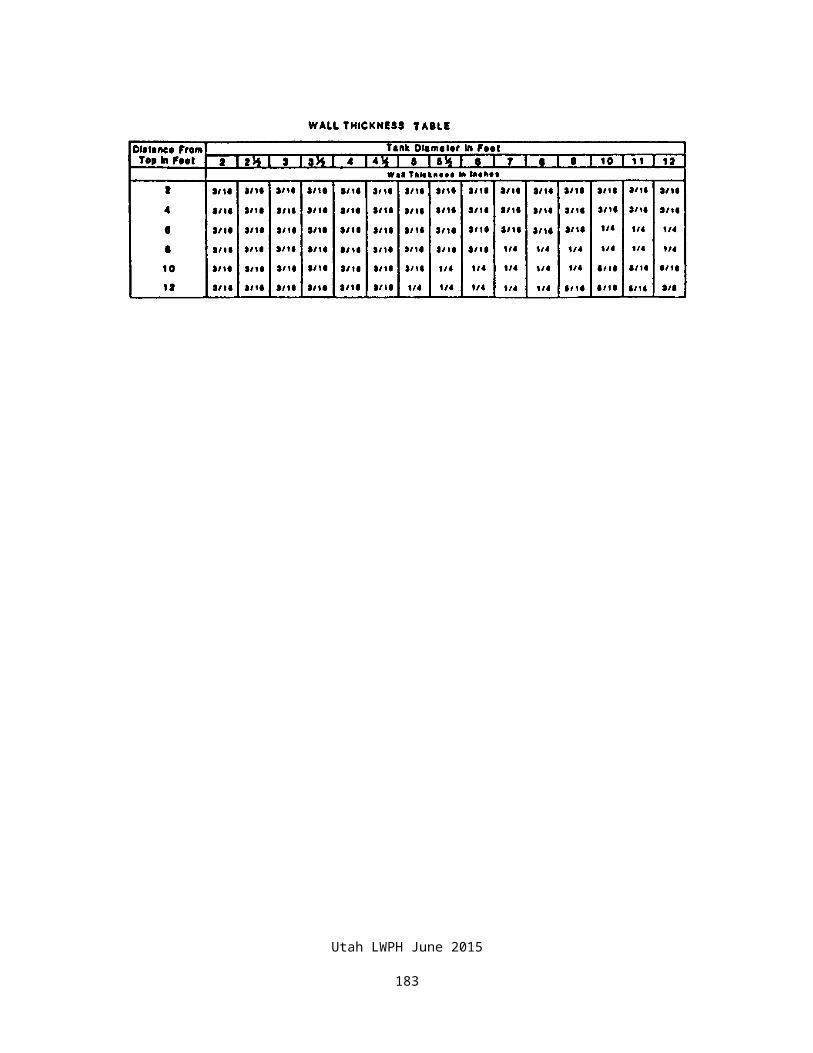
Figure 10.5TYPICAL JET PUMP INSTALLATION AND CAPACITY TABLE
Utah LWPH June 2015
184
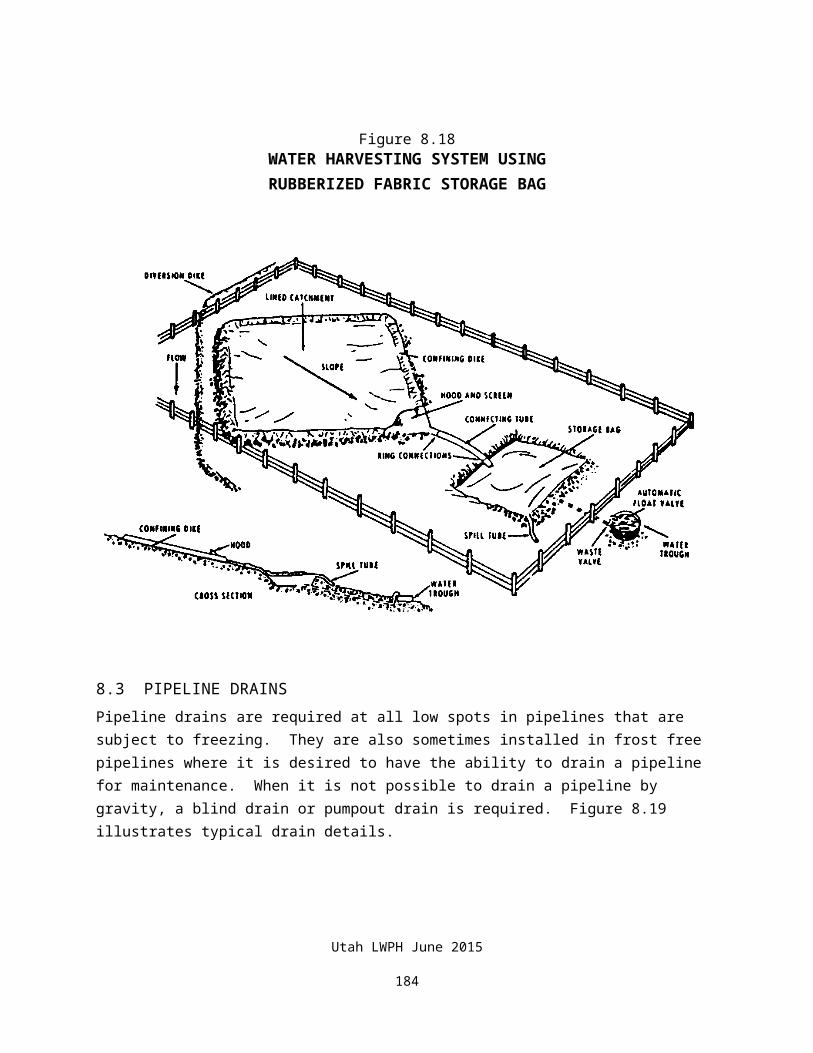
10.1.3 Turbine Booster PumpTurbine pumps in various configurations are occasionally used in stockwater installations. Figure 10.6 illustrates one type that can be used. The inner workings of this pump are the same as a submersible pump. This type of pump can be used to boost pressure from sources such as domestic water supplies and storage tanks. These pumps should include a pressure switch (Murphy switch) insuring water is available to the pump intake.
Figure 10.6TYPICAL TURBINE BOOSTER PUMP
Utah LWPH June 2015
185
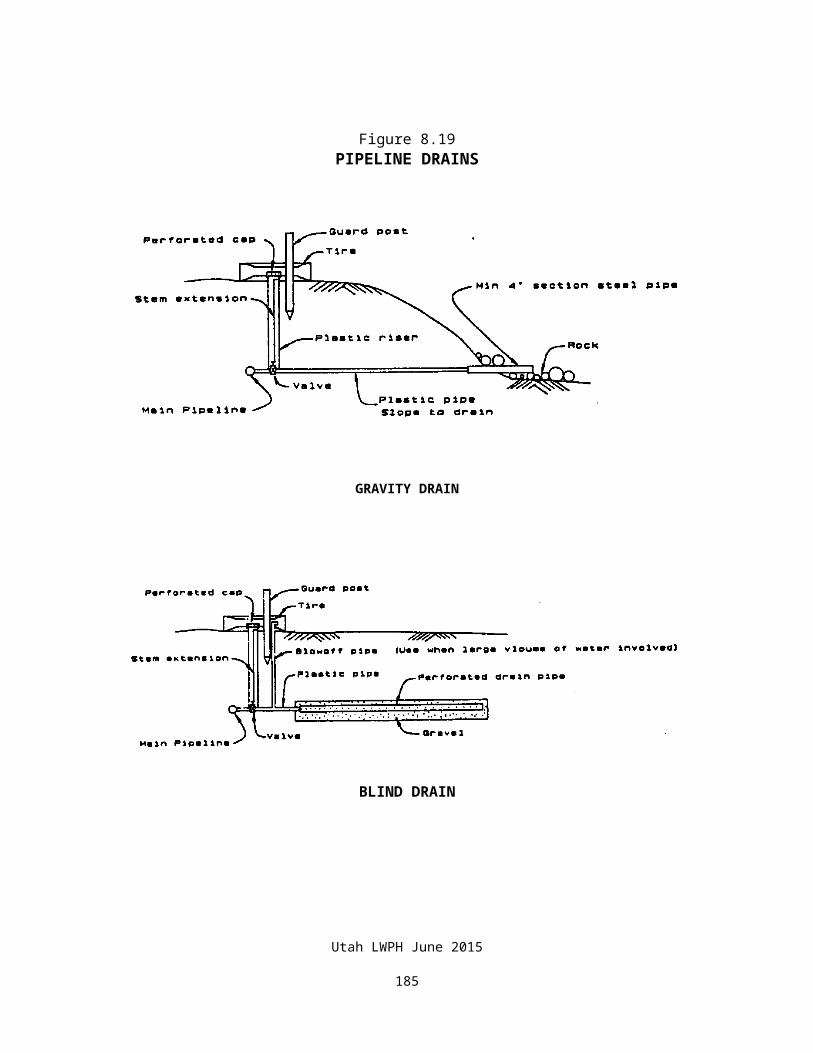
Utah LWPH June 2015
186
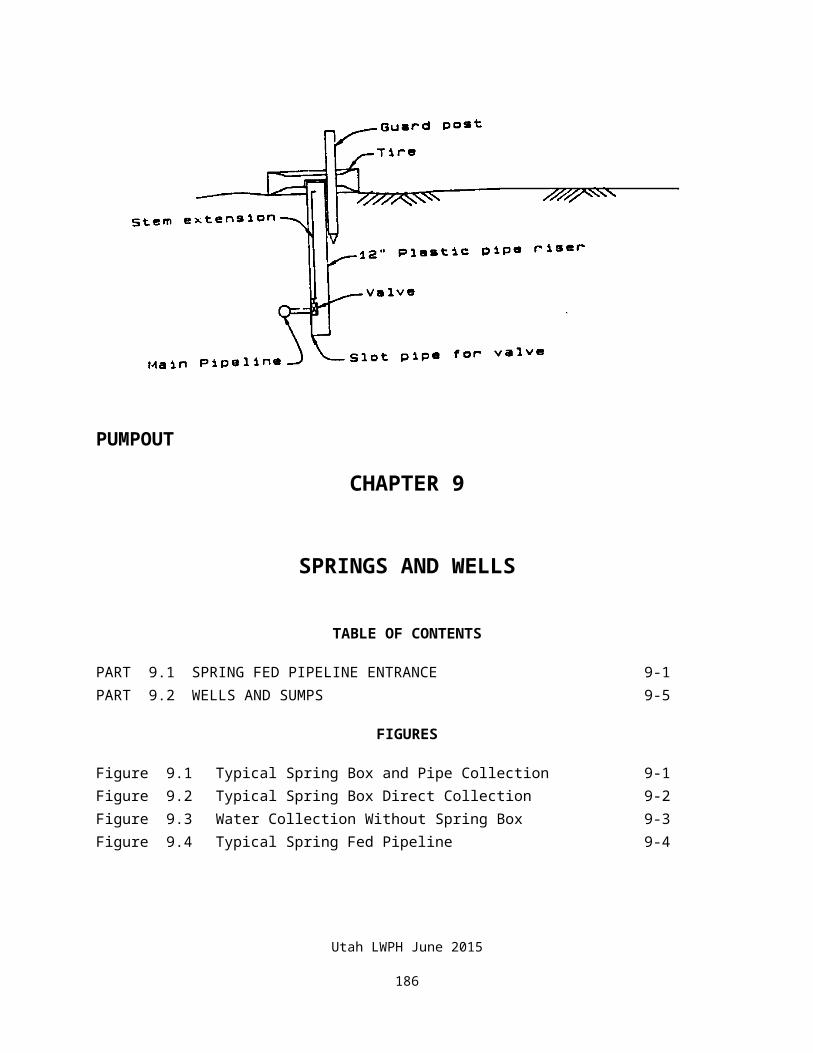
10.1.4 Piston PumpsElectric or waterwheel driven piston pumps are sometimes used for very high pressure systems. Although piston pumps are able to supply high pressures, they have the disadvantage of having a pulsating delivery. These pressure surges must be counteracted by the use of surge chambers and adequate pressure rated pipe. Figure 10.7 illustrates the inner workings of one type of three piston pump.
10.1.5 WindmillWindmills can still be used to great advantage when power is not available at a site. The most important factor is to provide adequate storage to carry over during periods of little or no wind. Windmills also require frequent checking and maintenance.
Figure 10.7THREE PISTON PUMP
Utah LWPH June 2015
187
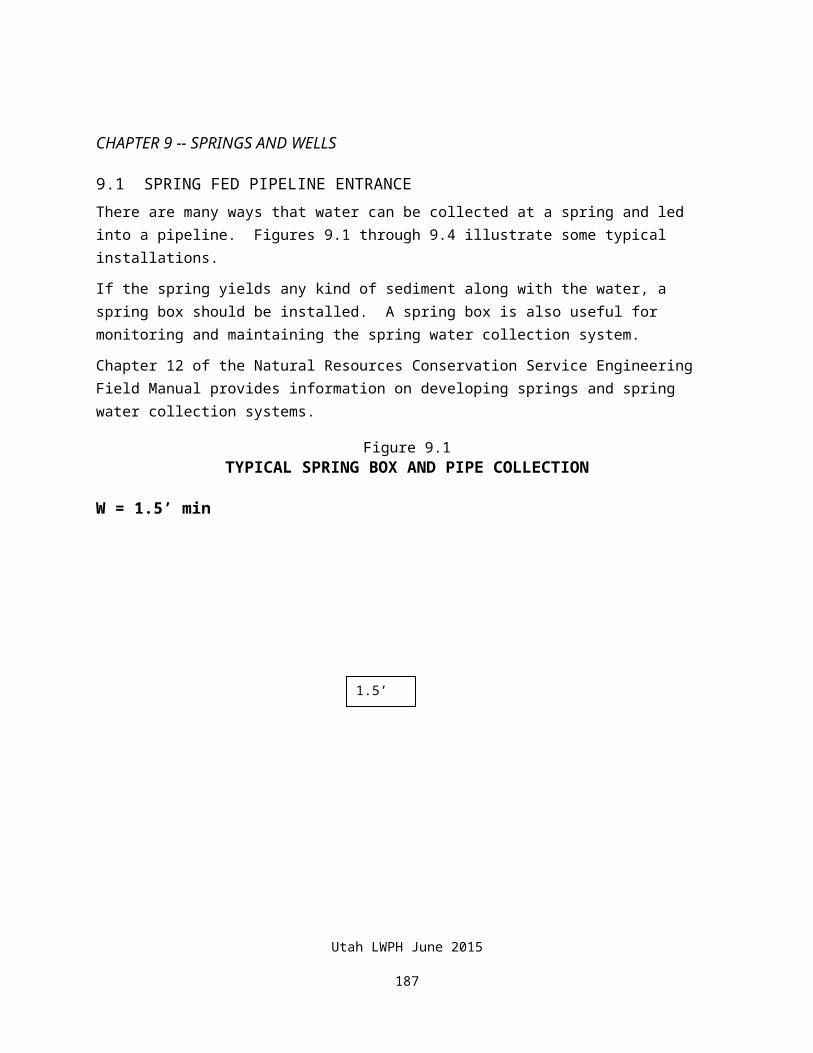
Figure 10.8WINDMILL AS SUPPLY TO TANK
Utah LWPH June 2015
188
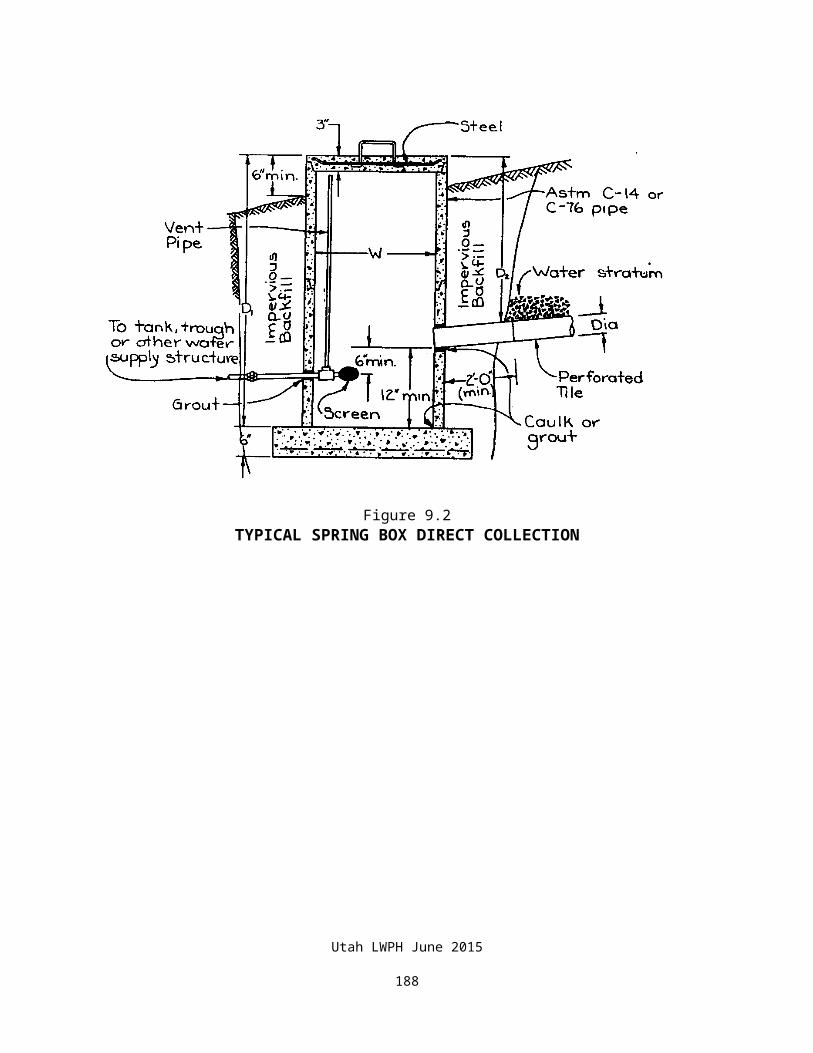
Utah LWPH June 2015
189
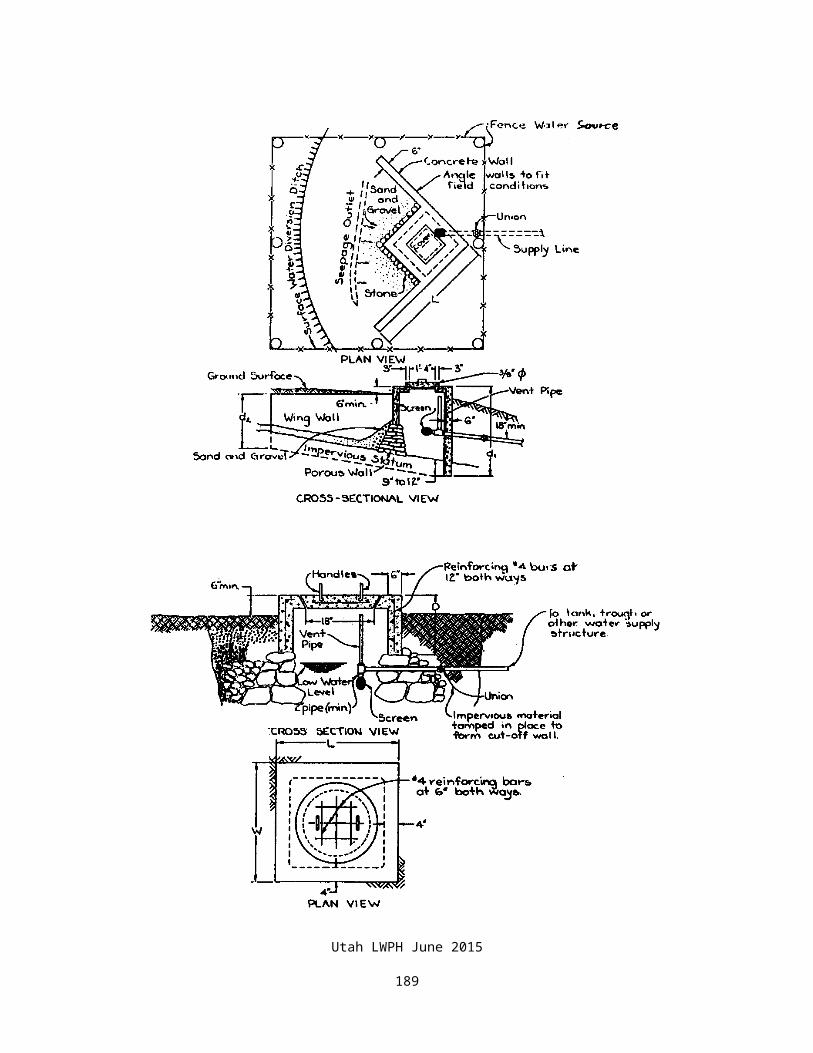
Figure 10.9 shows how to connect a windmill to a pipeline. When designing a windmill supplied pipeline the total dynamic head equals static head plus losses in the drop pipe plus pipeline losses.
Figure 10.9WINDMILL CONNECTED TO PIPELINE
Utah LWPH June 2015
190
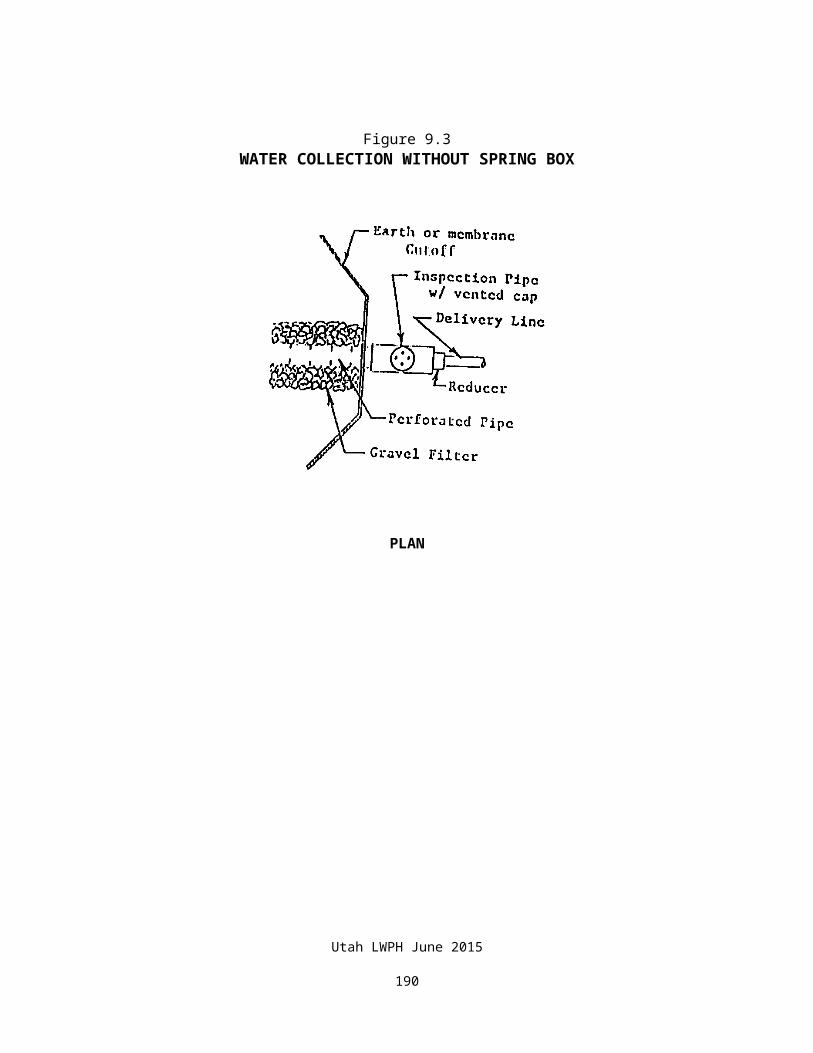
Table 10.1 tabulates approximate windmill capacities, and Table 10.2 tabulates approximate pumping heads. These are based on winds exceeding 12 mph. Short stroke systems increase pumping head by 1/3 and reduce pumping capacity by 1/4.
For 12 mph winds, capacity is reduced about 20% and for 10 mph winds, about 38%. If prevailing winds are low, use of a cylinder smaller than shown will permit the mill to operate in lower wind velocity.
The drop pipe should never be smaller than the pump cylinder. For deep wells, use a ball valve and lightweight rod.
Table 10.1APPROXIMATE WINDMILL CAPACITY
(gallons per hour)
Cylinder Diameter (inches)
Wheel Diameter (feet)
6 feet 8-16 feet
1-3/4 105 1501-7/8 125 180
2 130 1902-1/4 180 2602-1/2 225 3252-3/4 265 385
3 320 4703-1/4 370 5503-1/2 440 6403-3/4 500 730
4 570 8304-1/4 - 9404-1/2 725 10504-3/4 - 1170
5 900 13005-3/4 - 1700
6 - 18757 - 25508 - 3300
Utah LWPH June 2015
191
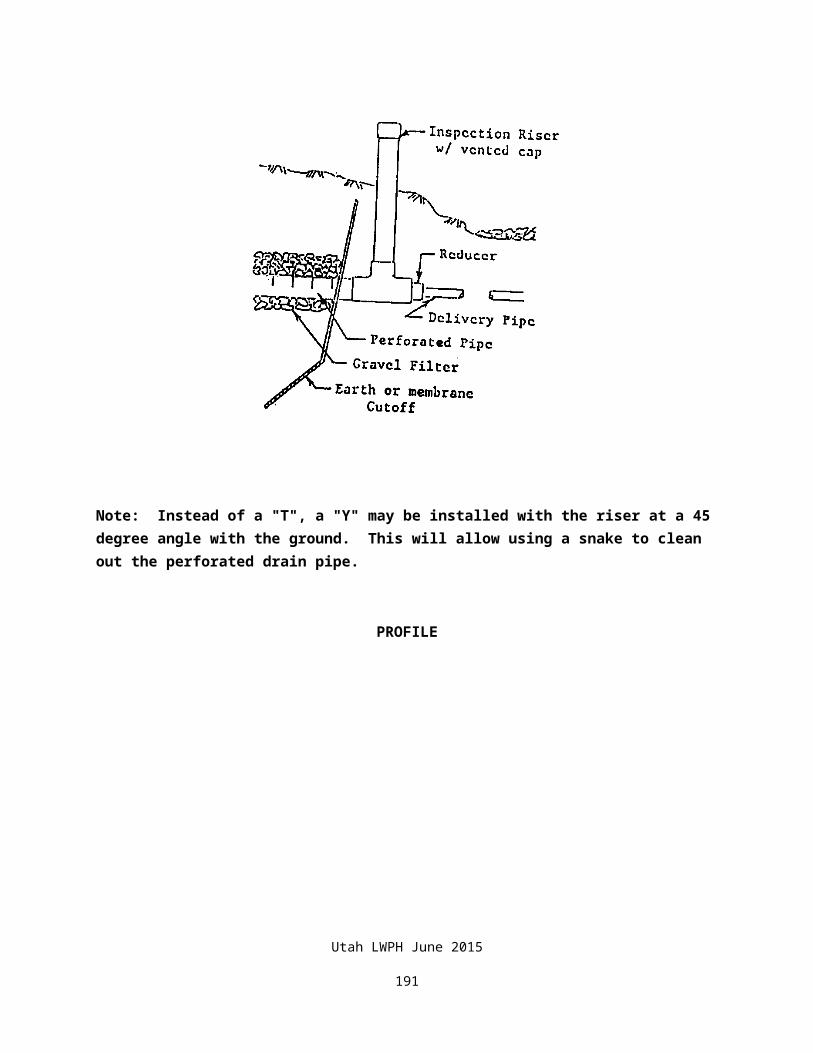
Utah LWPH June 2015
192
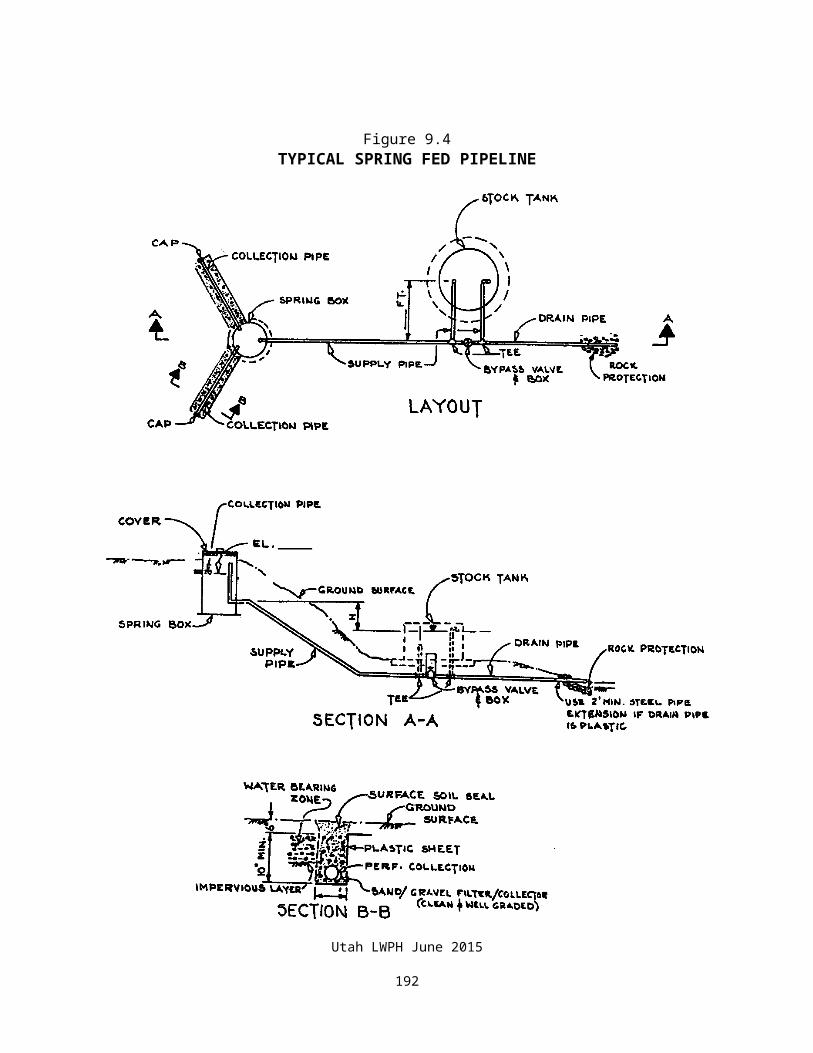
Table 10.2WINDMILL PUMPING HEAD
(feet)
Cylinder Diameter(
inches)
Wheel Diameter (feet)
6 8 10 12 14 16
3/4 130 185 280 420 600 10001-7/8 120 175 260 390 560 920
2 95 140 215 320 460 7502-1/4 77 112 170 250 360 5902-1/2 65 94 140 210 300 4902-3/4 56 80 120 180 260 425
3 47 68 100 155 220 3603-1/4 41 58 88 130 185 3053-1/2 35 50 76 115 160 2653-3/4 30 44 65 98 143 230
4 27 39 58 86 125 2004-1/4 - 34 51 76 110 1804-1/2 21 30 46 68 98 1604-3/4 - - 41 61 88 140
5 17 25 37 55 80 1305-3/4 - - - 40 60 100
6 - 17 25 38 55 857 - - 19 28 41 658 - - 14 22 31 50
Utah LWPH June 2015
193

10.1.6 Wind Generator Powered PumpWind generators can be used to power low volume pumps. These systems are expensive and have the same disadvantage as windmills in that they depend on wind being available to pump water. They may be more reliable than windmills because there are less mechanical components to go wrong. It may also be possible to pump water from deeper depths.
Figure 10.10 illustrates a wind generator. This small generator delivers 12 or 24 volt power and might be used with the same type of pumps as solar powered pumps, or might be used in conjunction with solar power.
Figure 10.10WIND GENERATOR POWERED PUMP
Utah LWPH June 2015
194
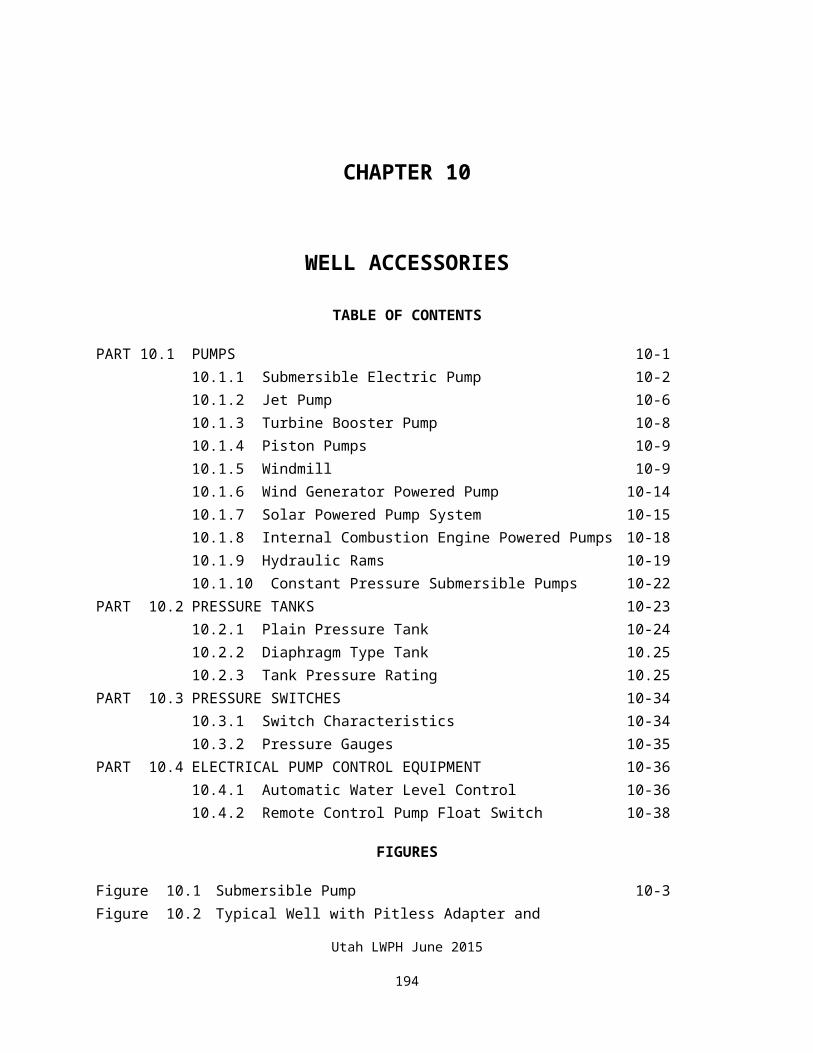
10.1.7 Solar Powered Pump SystemSolar powered pumps have the advantage of operating as long as there is adequate sunlight.
The main disadvantage of this type of installation is that it is expensive. This can be more than compensated for though by not having to install power to the site.
As with wind powered systems, it is important to have adequate tank storage to carry through periods of low sunlight levels and heavy water use.
Figure 10.11 illustrates low voltage DC solar powered pump systems using a submersible pump in a well and a rotary vane type pump from a spring box. A tracking type solar panel allows greater power gain throughout the day. These are simple systems without batteries or converters.
Figure 10.12 illustrates a pump jack system. This works in deeper wells and is ideal for replacing windmill systems. The pump will pump water even under low light conditions, although pumping will be slower.
There are several different types of pump systems on the market. Each has particular advantages. Design must be done in close coordination with pump and solar panel suppliers.
Utah LWPH June 2015
195
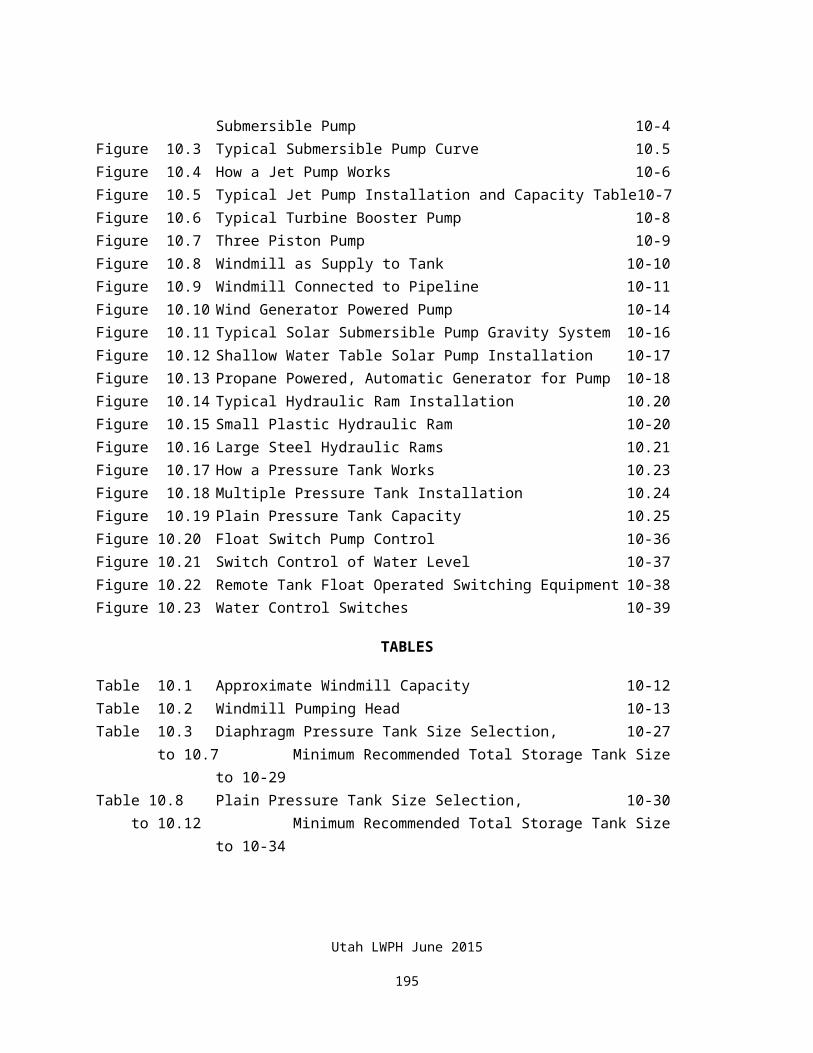
Figure 10.11TYPICAL SOLAR SUBMERSIBLE PUMP GRAVITY SYSTEM
Utah LWPH June 2015
196
Figure 10.12Solar Powered Pump Jack
Utah LWPH June 2015
197
10.1.8 Internal Combustion Engine Powered PumpsInternal combustion engines can be used to operate stockwater pumps. These engines are sometimes started with a float operated automatic starter and shutoff switches. They frequently use propane as a fuel.
Engine operated systems require frequent monitoring. A large water storage tank should be part of the system to supplement times when the system fails or is not started on time.
There are various ways that such a system can be set up. They include:
1. An engine operated pump jack operated by gas or propane motor. Water is pumped into a large storage tank. The motor is started by hand. It can be shut off with simple grounding type float switch or when it simply runs out of gas. Sometimes an automatic starting system is used.
2. An engine operated generator which in turn operates any type of electrically driven pump system. This type of system either be automatically started and stopped with a float switch or manually started and shut off by a float actuated switch in the storage tank.
This system has the advantage of being able to operate any size or pressure rated pump, depending on the size of the generating system.
Figure 10.13PROPANE POWERED, AUTOMATIC GENERATOR FOR PUMP
Utah LWPH June 2015
198
10.1.9 Hydraulic RamsA hydraulic ram works on the principal of using large flow volume at low head to pump smaller volumes of flow to a higher elevation.
Figure 10.14 illustrates this type of system. A poppet valve in the ram opens allowing water to flow. As the water gains velocity in the supply pipe, it causes the popet to slam shut. This sudden closure causes a surge pressure which forces the water through the pump check valve. The surge pressure runs into the back pressure in the output line. Part of the water flow is forced into the air chamber, compressing the air and causing the flow to lose most of its energy.
As peak pressure subsides, the compressed air in the air chamber pushes downward on the column of water, closes the check valve and pushes some water up the delivery pipe. This process repeats itself about once a second.
A shock wave (water hammer) moves back up the supply pipe. The pipe pressure rating should be adequate to withstand this repeated shock. A stand pipe is frequently installed at a location in the supply line that "tunes" the system shock wave. This stand pipe should be about 4 to 5 times the supply pipe fall away from the ram.
Ram manufacturer recommendations should be used to size the ram and design the system.
Utah LWPH June 2015
199
Figure 10.14TYPICAL HYDRAULIC RAM INSTALLATION
Figure 10.15SMALL PLASTIC HYDRAULIC RAM
Utah LWPH June 2015
200
Utah LWPH June 2015
201

Figure 10.16LARGE STEEL HYDRAULIC RAMS
Utah LWPH June 2015
202
Utah LWPH June 2015
203
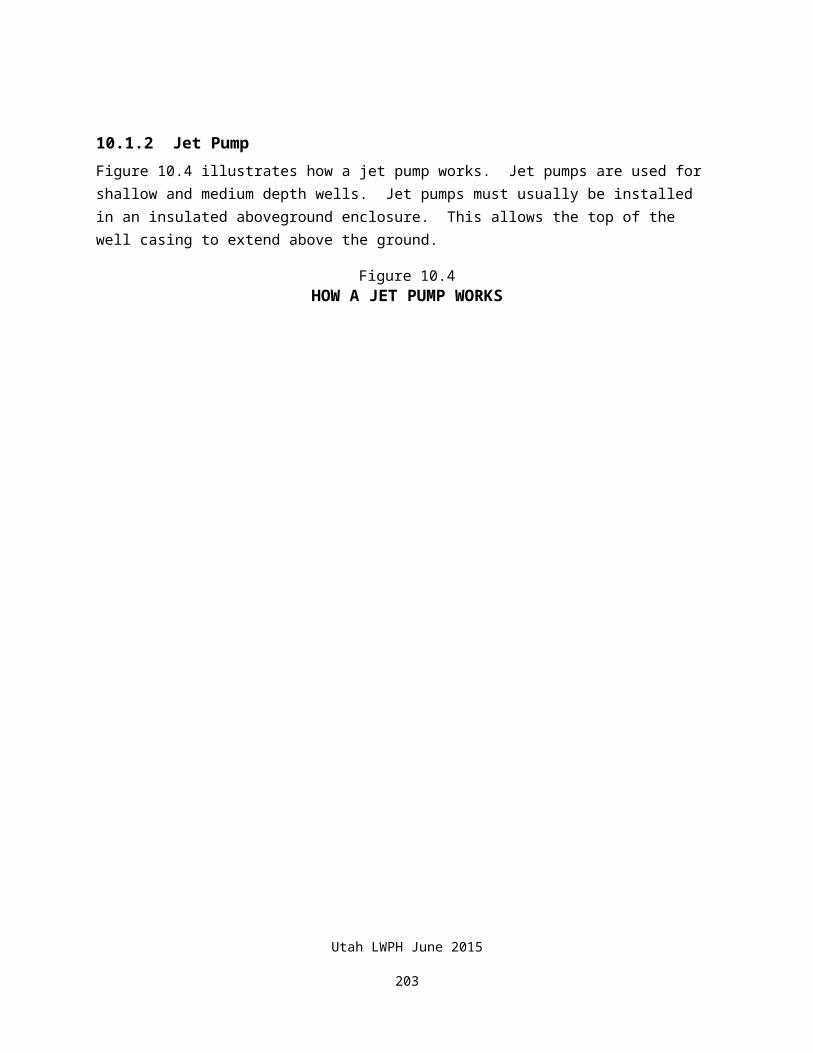
10.1.10 Constant Pressure Submersible PumpsConstant pressure submersible pumps utilize a variable speed motor, pressure transducer and programmable controller to maintain a desired pressure within the pipeline. This pumping system varies significantly from a constant speed pump (conventional submersible pump).
A constant speed pump is controlled by either a manual or automatic switch. The automatic switches are usually timed or pressure switches. When the switch is turned on, the constant speed pump starts turning at full speed until the pump is turned off. Typical operating speeds are usually 1800 rpm or 3600 rpm. This rapid startup can be damaging to the constant speed pumps. Because of this, the switch system is typically designed to minimize the frequency of startups.
With a constant pressure pump, the pressure transducer senses the pipeline pressure. The programmable controller determines if the measured pressure matches the design pressure for the pipeline and sends appropriate control signals to the variable speed motor. The variable speed motor then increases or decreases its speed resulting in an increase or decrease in pipeline pressure. Constant pressure pumps operate similar to the cruise control on a car.
An example of how this is applied can be easily demonstrated in an example: A constant pressure pump for a livestock pipeline was designed to operate at 40 psi. In static condition, the tanks are full, the pump is off and the pipeline is maintained at 40 psi. When livestock demand lowers the water level in the tank, the float valve opens and allows the pipeline to fill the tank. Shortly after that, the programmable controller senses that the pipeline pressure drops below 40 psi and starts the pump motor at a low speed, typically 200 rpm. The speed of the motor is then gradually increased, up to 10,000 rpm, until the controller determines that the pipeline pressure rises above 40 psi. The controller then decreases motor speed until the pipeline pressure returns to 40 psi.
Constant pressure pumps may utilize a small pressure tank to act as a pressure buffer. These tanks do not utilize a bladder or switch to maintain pressure; they simply provide a reservoir to help buffer small pressure changes within the pipeline. These tanks should be sized according to manufacturer’s recommendations.
The benefits of constant pressure pumps include not only constant pressure, but also soft start-up (cycling is not damaging to the pump motor) and a smaller pressure tank requirement.
The controllers on most constant pressure pumps are typically user adjustable. As a safety precaution, the designer should calculate required pipeline strength at maximum controller pressure should the user inadvertently increase the pressure above design pressure.
Utah LWPH June 2015
204
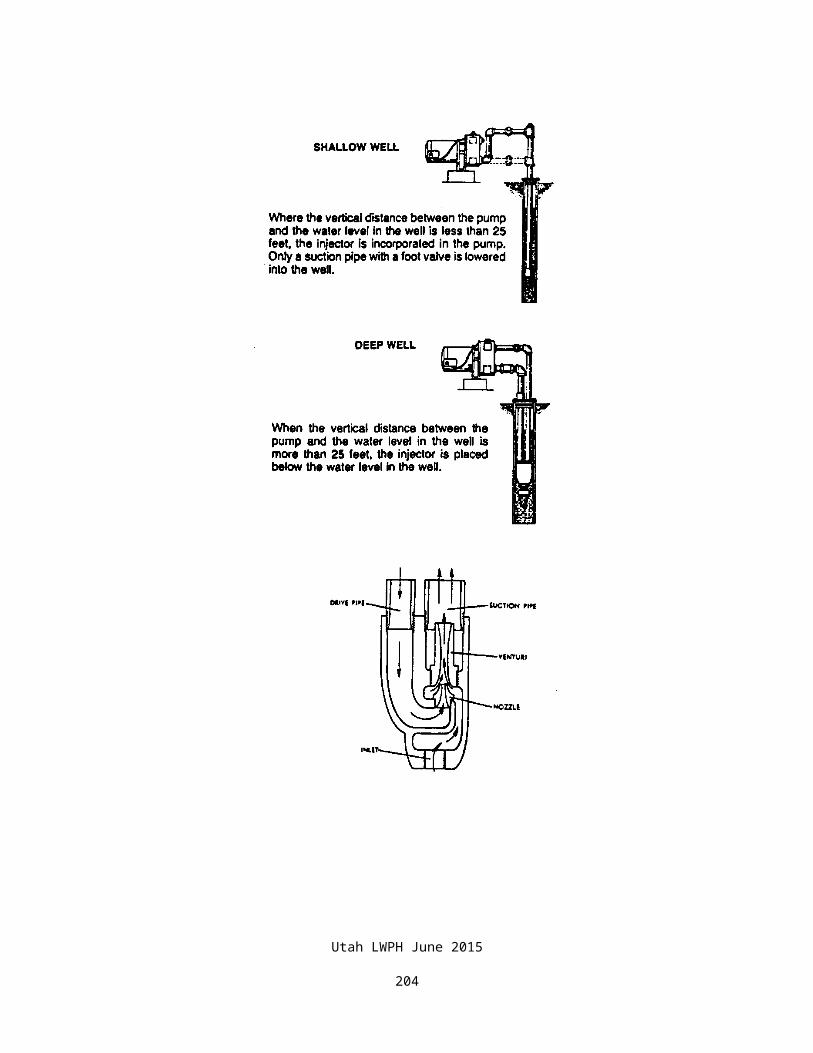
10.2 PRESSURE TANKSPneumatic pressure tank operation is based on the fact that air can be compressed but water cannot. The pressure required to force water from the tank through the pipeline to stock tanks is obtained by incorporating air in the tank and by the pump forcing water against the air pocket. The air is forced to occupy less and less space and so exerts more and more pressure on incoming water.
This air cushion acts like a large spring maintaining a constant pressure on the water in the tank which is conducted throughout the entire system. When a hydrant or float valve is opened, air expands to replace the water which is forced through the pipes by air pressure. When the pump starts and forces additional water into the tank, air is compressed at a higher pressure and occupies less space.
There are two types of pressure tanks, the plain tank and the diaphragm-type tank. Operation of both tanks is the same. The difference is that water and air are separated by a diaphragm in a diaphragm-type tank. The diaphragm prevents loss of air during operation. Figure 10.17 illustrates how a pressure tank works. Net effective storage of the tank is equal to the water volume that is stored between cut-in pressure and cut-out pressure.
Figure 10.17HOW A PRESSURE TANK WORKS
Utah LWPH June 2015
205
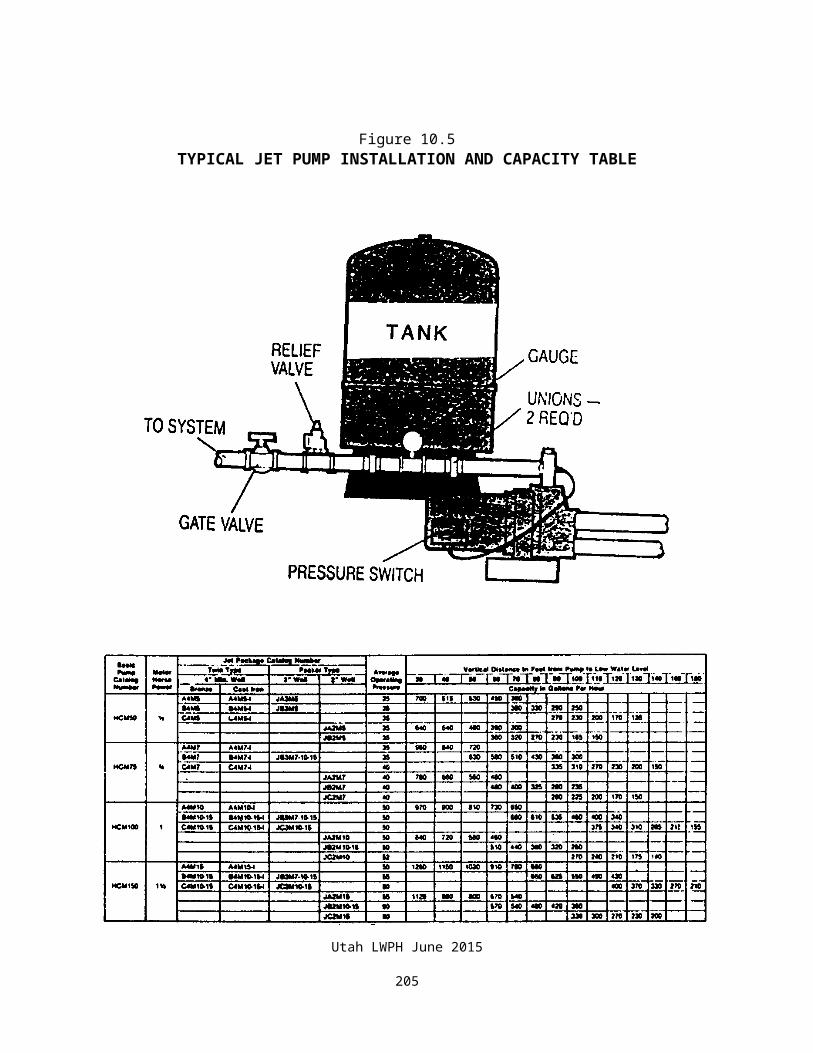
Cut-in pressure is that pressure at which the pump is automatically turned on. Cut-out is the pressure at which the pump is turned off.
Tanks operating with a cut-out pressure of less than 80 psi usually have a 20 psi pressure spread between cut-in and cut-out. Tanks operating at pressures higher than that usually operate with a pressure spread of 30 psi. At pressures above 120 psi, it sometimes may be advantageous to operate with a pressure spread greater than 30 psi. See Tables 10.3 through 10.12 for tank sizes based on flow rate and pressure spread between cut-in and cut-out.
More than one tank may be installed in a system to meet pressure tank capacity requirements. Figure 10.18 illustrates how this is done.
Figure 10.18MULTIPLE PRESSURE TANK INSTALLATION
10.2.1 Plain Pressure TankIn a plain pressure tank, air can be lost over time. This loss is due to absorption into the water or, if pressure in the system falls below a certain point, air can escape into the pipeline.
Figure 10.19 illustrates the water level in a standard vertical tank at various pressures, percent of height, and gallons of drawdown per cycle. To determine the drawdown per cycle at a given pressure switch setting, refer to the left side of Figure 10.19. With a pressure setting of 20/40 psi and using an 82 gallon tank without pre-charge, the amount of water available is 12.8 gallons. If the tank is pre-charged, as shown in the right side of Figure 10.19, the amount of available water will be 25.6 gallons.
There is a valve on the plain tank where compressed air can periodically be used to recharge the air space. This is usually done with a hand pump or portable compressor. In some
Utah LWPH June 2015
206
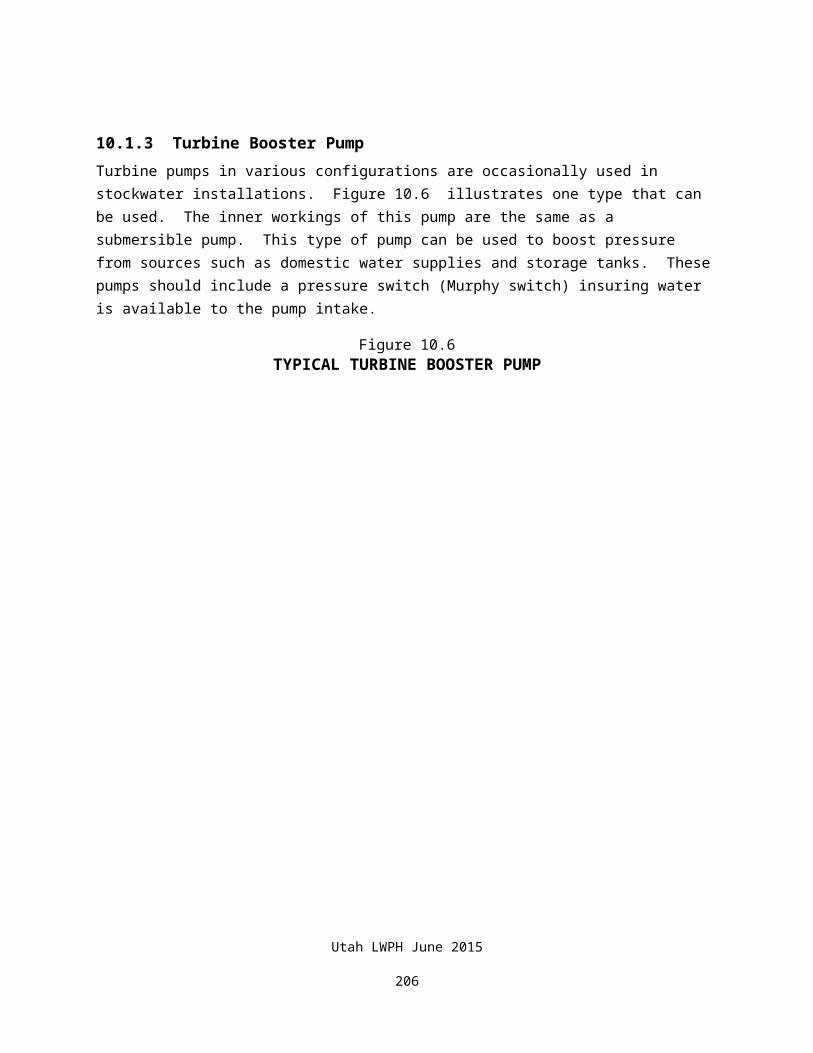
systems, this must be done several times during a season. In larger installations, an automatic air compressor can be used to keep the tank properly charged.
There is a simple automatic charging valve available which can be used to automatically recharge the air tank. This valve only works in a jet-type pump installation. It will not work with a submersible pump. This valve can only be used on low-to-moderate pressure systems.
Figure 10.19
PLAIN PRESSURE TANK CAPACITY
Utah LWPH June 2015
207
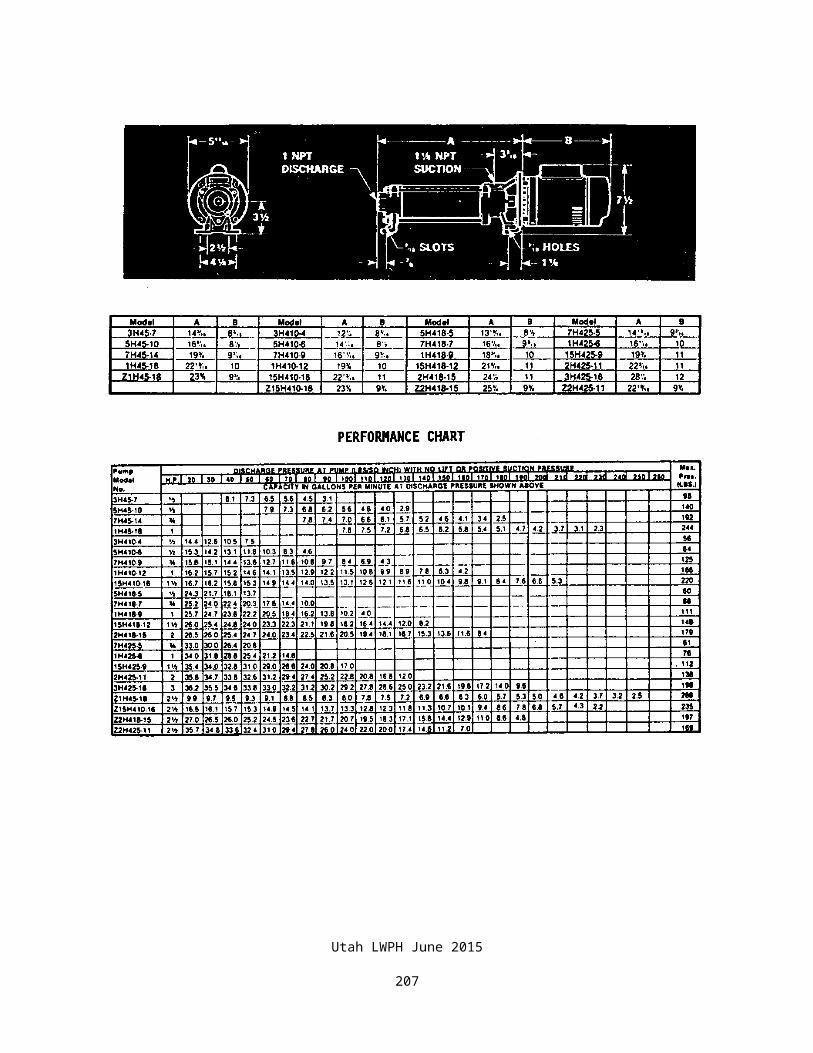
10.2.2 Diaphragm-Type TankA diaphragm tank abolishes the need for tank air maintenance. In fact, properly protected diaphragm tanks can be buried after they are initially charged with air.
In the diaphragm-type tank, a flexible diaphragm separates air and water. An example of this type of tank is shown in Figure 10.17. Air cannot be absorbed by water, and air cannot escape. After an initial charge of compressed air, periodic recharging is not required. This type of tank is almost universally used on new systems today, and its use is highly recommended.
10.2.3 Tank Pressure RatingCommon pressure tanks are rated for maximum pressures between 72 psi and 110 psi. For this reason, there are increasing problems with using an automatic pressure system when operating pressures exceed 110 psi. Larger and higher pressure rated tanks are required at these higher pressures.
For practical reasons, the design upper limit for cut-out pressure is about 150 psi. For systems with pressures above this, timer operated, manually operated, or float switch operated systems should be used.
Utah LWPH June 2015
208
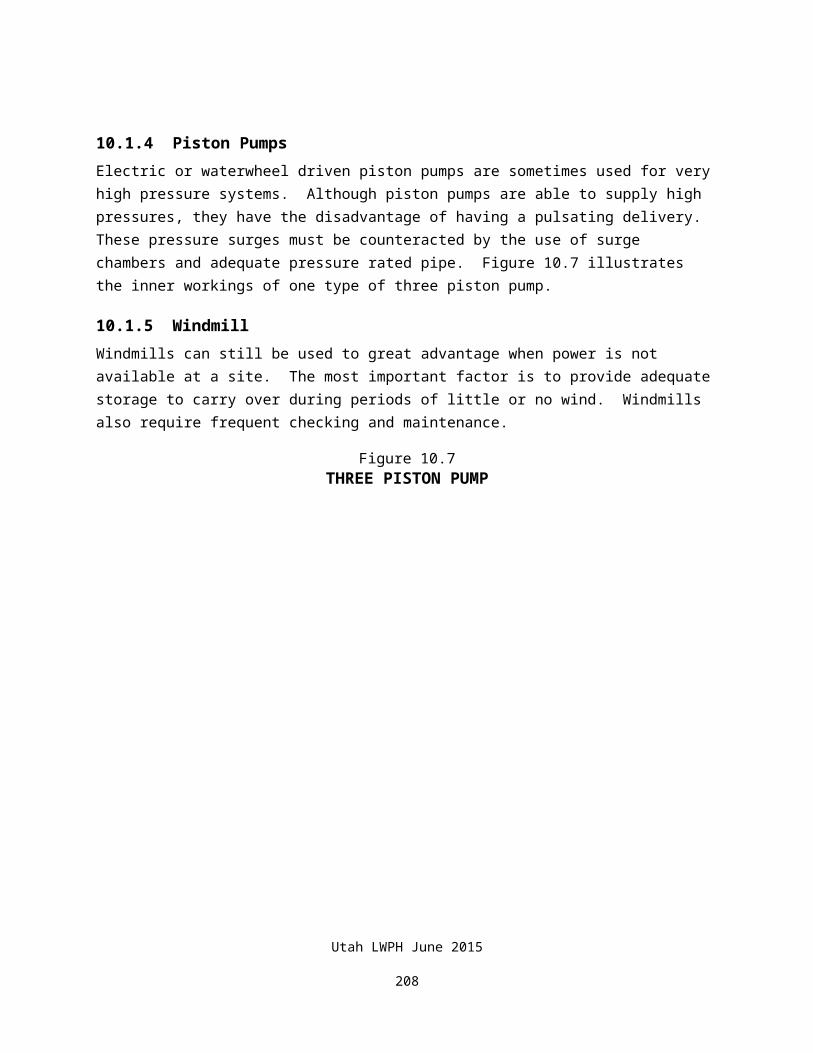
It is very dangerous to use a tank at higher than its rated pressure. A tank used beyond its rating could explode and cause death or serious injury to anyone working near the tank. For that reason a pressure tank should never be used beyond its rated pressure.
Sometimes owners want to use "used" tanks such as old propane tanks as water pressure tanks. These tanks are not designed for water use since they will soon corrode and weaken. Pressure tanks not manufactured for water containment should not be used.
Special pressure tanks are available with ratings beyond 110 psi. These are expensive and must be properly sized.
In any automatic high pressure system, additional efficient storage can be added by installing multiple diaphragm-type pressure tanks out on the pipeline where pressures are relatively low. These tanks are usually the buried-type. In such a system, it is desirable to have a primary high pressure tank located at the well. This tank takes the initial surge of flow and allows flow and pressures to equalize in the pipeline.
It also may be effective to install a flow regulating valve just up stream of the pressure switch to control initial flow rate. Without control of surge flow at the pump, frequent pump cycling can occur due to pressure surges actuating the pressure switch. This can quickly destroy the pump and/or pipeline.
Table 10.3DIAPHRAGM PRESSURE TANK SIZE SELECTION
MINIMUM RECOMMENDED TOTAL STORAGE TANK SIZE (gallons)
Flow = 5 gpm, Minimum Pump Running Time = 1.5 minutesPump CUT-OUT
Pressure (PSIG)
Pump CUT-IN Pressure (PSIG)
20 30 40 50 60 70 80 90 100 110 120 130 140
30 33
40 20 41
50 16 24 48
60 14 19 28 56
70 13 16 21 32 64
80 12 14 18 24 36 71
90 11 13 16 20 26 39 78
Utah LWPH June 2015
209
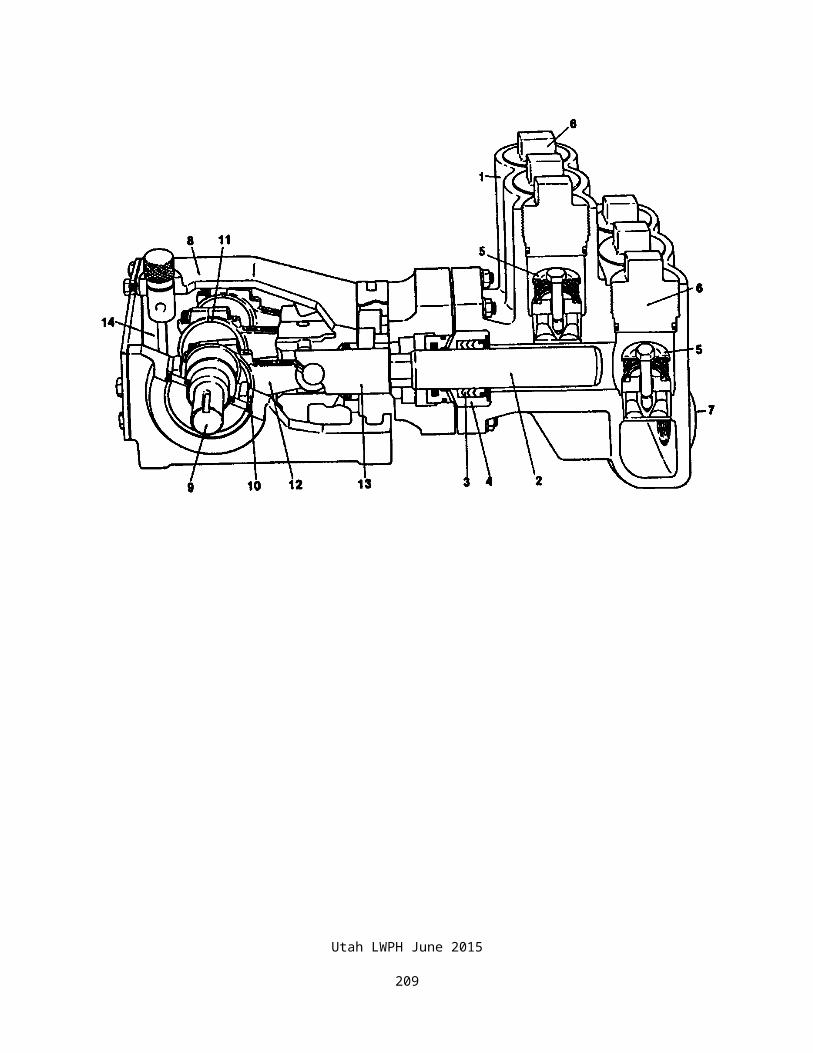
100 11 12 14 17 22 29 43 86
110 10 12 13 16 19 23 31 47 94
120 10 11 13 14 17 20 25 34 50 107
130 10 11 12 14 15 18 22 27 36 54 109
140 10 11 12 13 15 17 19 23 29 39 58 117
150 10 10 11 12 14 15 18 21 25 31 41 62 125
Utah LWPH June 2015
210

Table 10.4DIAPHRAGM PRESSURE TANK SIZE SELECTION
MINIMUM RECOMMENDED TOTAL STORAGE TANK SIZE (gallons)
Flow = 10 gpm, Minimum Pump Running Time = 1.5 minutesPump CUT-OUT
Pressure (PSIG)
Pump CUT-IN Pressure (PSIG)
20 30 40 50 60 70 80 90 100 110 120 130 140
30 67
40 41 82
50 32 49 97
60 28 37 56 112
70 25 32 42 64 127
80 24 28 36 47 71 142
90 22 26 31 39 52 79 156
100 21 25 29 34 43 57 86 172
110 21 23 27 31 37 47 62 94 188
120 20 22 25 29 34 40 51 67 101 214
130 20 22 24 27 31 36 43 54 72 109 217
140 19 21 23 26 29 33 39 46 58 77 116 234
150 19 21 22 25 27 31 35 41 49 62 82 124 250
Utah LWPH June 2015
211
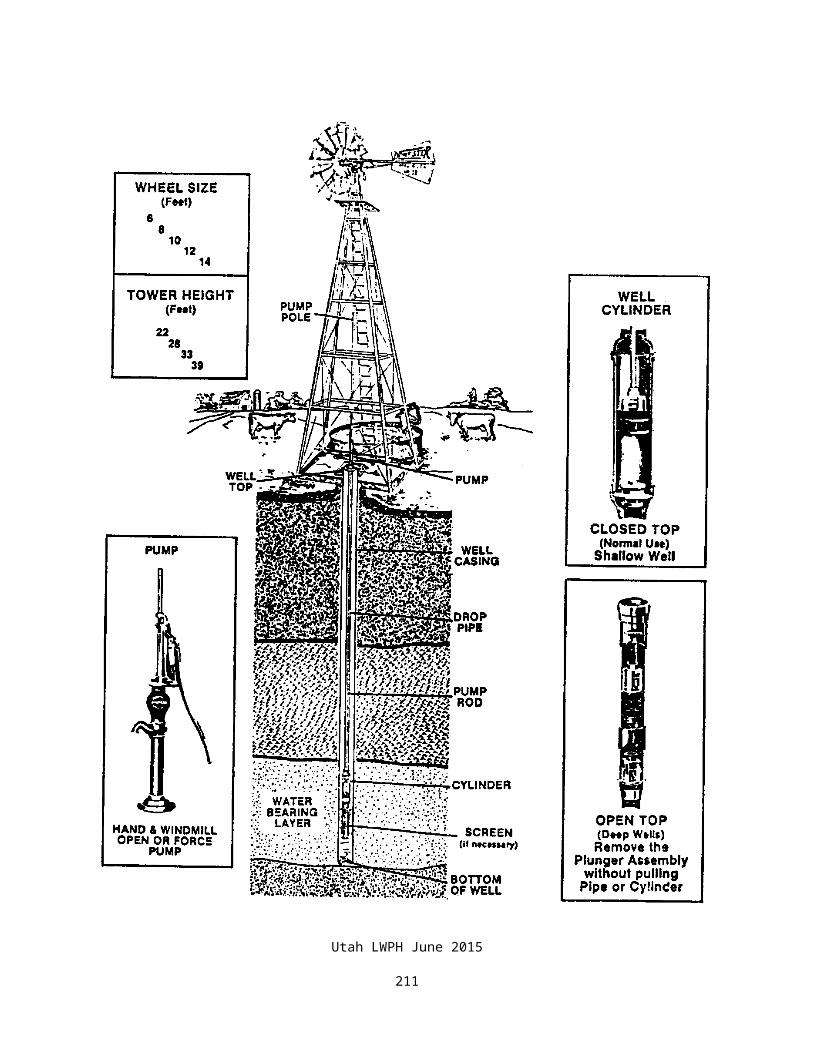
Table 10.5DIAPHRAGM PRESSURE TANK SIZE SELECTION
MINIMUM RECOMMENDED TOTAL STORAGE TANK SIZE (gallons)
Flow = 15 gpm, Minimum Pump Running Time = 1.5 minutesPump CUT-OUT
Pressure (PSIG)
Pump CUT-IN Pressure (PSIG)
20 30 40 50 60 70 80 90 100 110 120 130 140
30 100
40 61 123
50 48 73 145
60 42 56 84 168
70 38 48 64 95 191
80 35 43 53 71 107 212
90 34 39 47 59 78 118 234
100 32 37 43 52 65 86 129 259
110 31 35 40 47 56 70 93 141 281
120 30 34 38 43 50 61 76 101 151 321
130 30 33 36 41 46 54 65 81 108 163 326
140 29 32 35 39 44 50 58 69 87 116 174 352
150 29 31 34 37 41 46 53 62 74 93 124 186 375
Table 10.6DIAPHRAGM PRESSURE TANK SIZE SELECTION
MINIMUM RECOMMENDED TOTAL STORAGE TANK SIZE (gallons)
Flow = 20 gpm, Minimum Pump Running Time = 1.5 minutesPump Pump CUT-IN Pressure (PSIG)
Utah LWPH June 2015
212
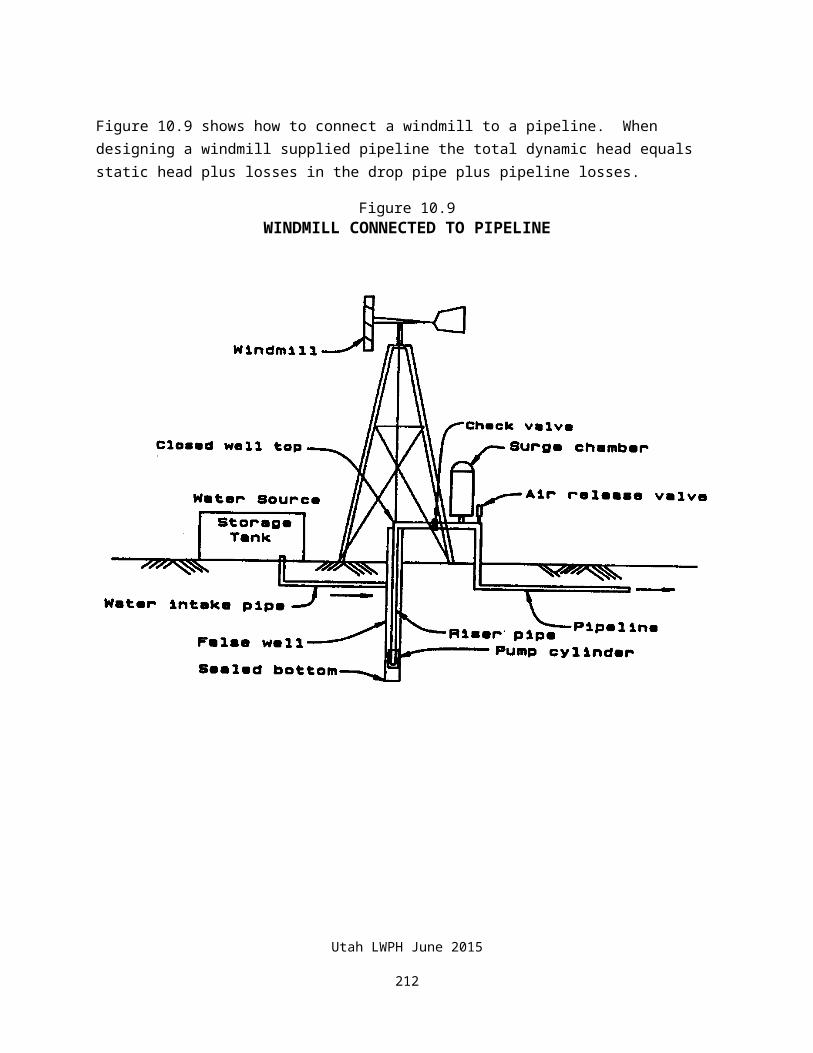
CUT-OUT
Pressure (PSIG)
20 30 40 50 60 70 80 90 100 110 120 130 140
30 134
40 82 164
50 65 97 194
60 56 75 112 224
70 51 64 85 127 254
80 47 57 71 95 142 283
90 45 52 63 79 105 157 313
100 43 49 57 69 86 115 172 345
110 41 47 53 62 75 93 124 188 375
120 40 45 51 58 67 81 101 135 201 429
130 39 43 48 54 62 72 87 108 144 217 435
140 39 42 46 52 58 66 77 93 116 155 233 469
150 38 41 45 49 55 62 70 82 98 123 165 248 500
Utah LWPH June 2015
213
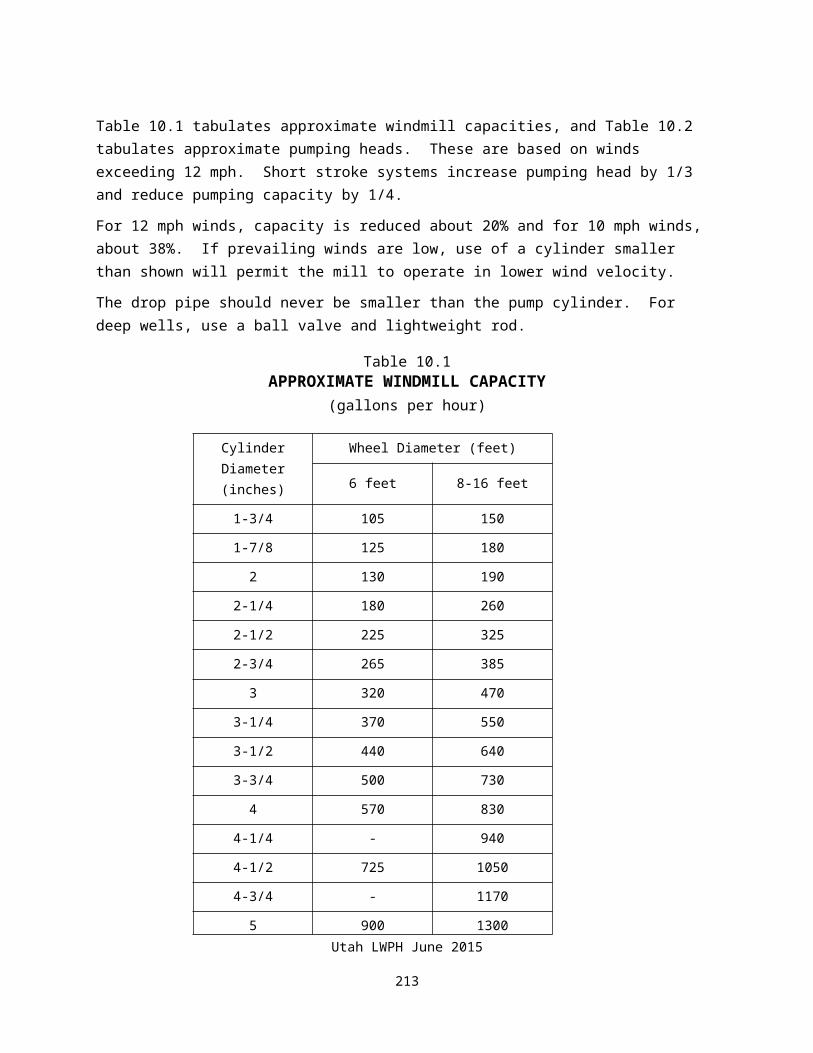
Table 10.7DIAPHRAGM PRESSURE TANK SIZE SELECTION
MINIMUM RECOMMENDED TOTAL STORAGE TANK SIZE (gallons)
Flow = 25 gpm, Minimum Pump Running Time = 1.5 minutesPump CUT-OUT
Pressure (PSIG)
Pump CUT-IN Pressure (PSIG)
20 30 40 50 60 70 80 90 100 110 120 130 140
30 167
40 102 205
50 81 121 242
60 70 93 140 280
70 64 79 106 159 318
80 59 71 89 118 178 354
90 56 65 78 98 131 196 391
100 54 61 72 86 108 144 216 431
110 52 58 67 78 94 117 156 234 469
120 51 56 63 72 84 101 126 168 252 536
130 49 54 60 68 77 90 108 135 180 272 543
140 48 53 58 64 73 83 97 116 145 193 291 586
150 48 51 56 62 69 77 88 103 123 154 206 310 625
Utah LWPH June 2015
214

Table 10.8PLAIN PRESSURE TANK SIZE SELECTION
MINIMUM RECOMMENDED TOTAL STORAGE TANK SIZE (gallons)
(Based on 3,000 ft. elevation above sea level)
WITHOUT AIR VALVE
Flow = 5 gpm, Minimum Pump Running Time = 1.5 minutesPump
CUT-OUT Pressure (PSIG)
Pump CUT-IN Pressure (PSIG)
20 30 40 50 60 70 80 90 100
30 136
40 83 216
50 66 127 308
60 57 97 177 417
70 51 82 133 235 539
80 48 74 113 177 308 719
90 45 68 100 147 227 392 862
100 43 64 90 128 185 281 462 995
110 42 61 85 117 162 231 340 562 1294
120 40 58 78 105 141 190 259 370 588
130 39 56 75 99 129 170 223 301 431
140 39 54 73 95 123 160 205 270 370
NOTES:
(1) If an automatic air charge valve is used, tank size may be reduced by 50%.
(2) Increase tank size by 5% for each 1,000 feet elevation above 3,000 feet elevation.
Utah LWPH June 2015
215
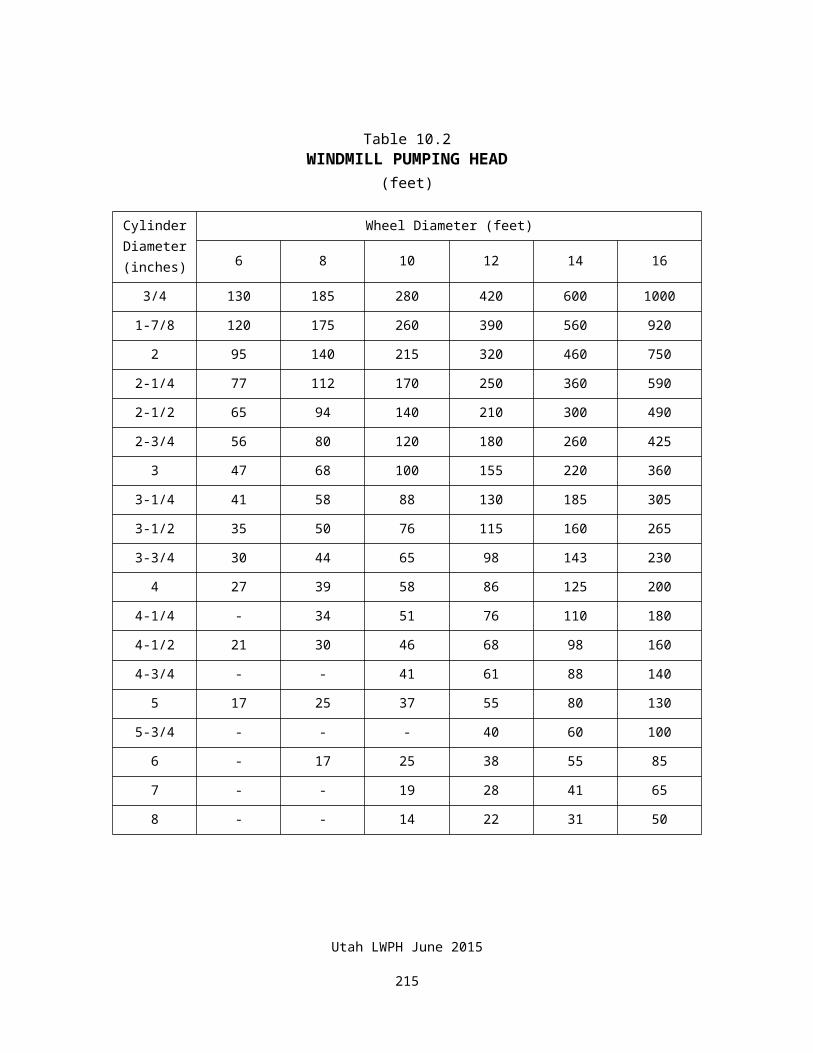
Table 10.9PLAIN PRESSURE TANK SIZE SELECTION
MINIMUM RECOMMENDED TOTAL STORAGE TANK SIZE (gallons)
(Based on 3,000 ft. elevation above sea level)
WITHOUT AIR VALVE
Flow = 10 gpm, Minimum Pump Running Time = 1.5 minutesPump
CUT-OUT Pressure (PSIG)
Pump CUT-IN Pressure (PSIG)
20 30 40 50 60 70 80 90 100
30 272
40 167 431
50 131 254 616
60 113 195 354 835
70 103 165 267 470 1078
80 96 148 225 354 616 1437
90 91 136 199 294 454 784 1725
100 87 127 181 256 370 562 924 1990
110 84 121 169 233 323 462 681 1125 2587
120 81 115 157 210 281 381 517 739 1176
130 79 111 150 198 259 340 446 602 862
140 78 109 145 190 246 319 411 539 739
NOTES:
(1) If an automatic air charge valve is used, tank size may be reduced by 50%.
(2) Increase tank size by 5% for each 1,000 feet elevation above 3,000 feet elevation.
Utah LWPH June 2015
216
Table 10.10PLAIN PRESSURE TANK SIZE SELECTION
MINIMUM RECOMMENDED TOTAL STORAGE TANK SIZE (gallons)
(Based on 3,000 ft. elevation above sea level)
WITHOUT AIR VALVE
Flow = 15 gpm, Minimum Pump Running Time = 1.5 minutesPump
CUT-OUT Pressure (PSIG)
Pump CUT-IN Pressure (PSIG)
20 30 40 50 60 70 80 90 100
30 409
40 250 647
50 197 381 924
60 170 292 532 1252
70 154 247 400 706 1617
80 144 222 338 532 924 2156
90 136 204 299 441 681 1176 2587
100 130 191 271 384 554 844 1386 2986
110 126 182 254 350 485 693 1021 1687 3881
120 121 173 235 316 422 571 776 1109 1764
130 118 167 224 296 388 511 669 903 1294
140 117 163 218 285 370 479 616 809 1109
NOTES:
(1) If an automatic air charge valve is used, tank size may be reduced by 50%.
(2) Increase tank size by 5% for each 1,000 feet elevation above 3,000 feet elevation.
Utah LWPH June 2015
217
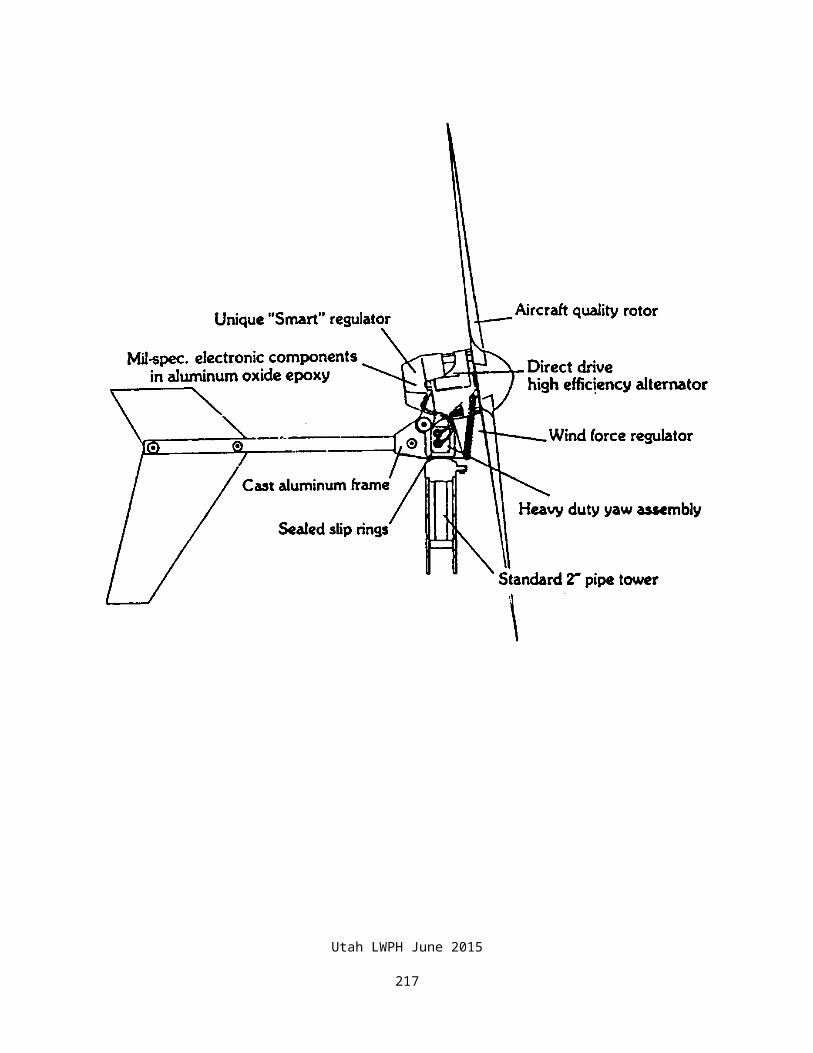
Table 10.11PLAIN PRESSURE TANK SIZE SELECTION
MINIMUM RECOMMENDED TOTAL STORAGE TANK SIZE (gallons)
(Based on 3,000 ft. elevation above sea level)
WITHOUT AIR VALVE
Flow = 20 gpm, Minimum Pump Running Time = 1.5 minutesPump
CUT-OUT Pressure (PSIG)
Pump CUT-IN Pressure (PSIG)
20 30 40 50 60 70 80 90 100
30 545
40 334 863
50 263 507 1232
60 227 389 709 1669
70 205 330 534 941 2156
80 192 296 450 709 1232 2875
90 182 272 398 588 908 1568 3450
100 174 255 362 512 739 1125 1848 3981
110 168 243 338 466 647 924 1362 2250 5175
120 162 230 314 421 563 761 1035 1479 2352
130 158 222 299 395 518 681 892 1203 1725
140 155 217 291 381 493 639 821 1078 1479
NOTES:
(1) If an automatic air charge valve is used, tank size may be reduced by 50%.
(2) Increase tank size by 5% for each 1,000 feet elevation above 3,000 feet elevation.
Utah LWPH June 2015
218
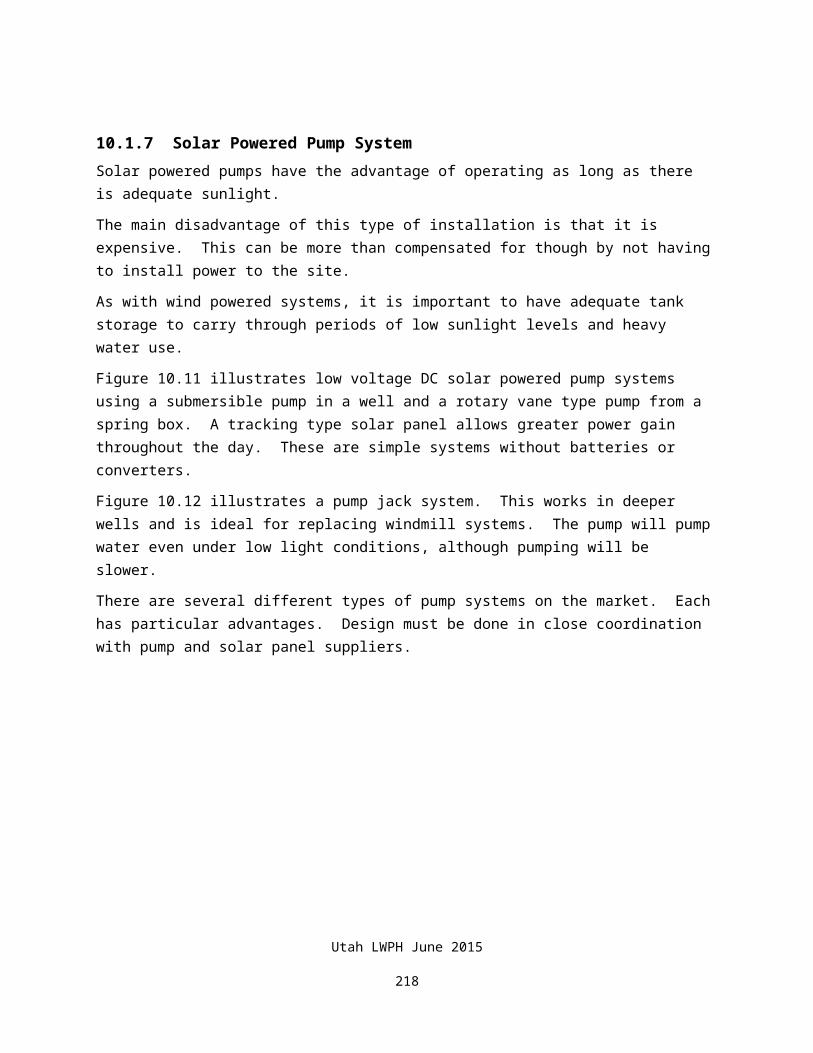
Table 10.12PLAIN PRESSURE TANK SIZE SELECTION
MINIMUM RECOMMENDED TOTAL STORAGE TANK SIZE (gallons)
(Based on 3,000 ft. elevation above sea level)
WITHOUT AIR VALVE
Flow = 25 gpm, Minimum Pump Running Time = 1.5 minutesPump
CUT-OUT Pressure (PSIG)
Pump CUT-IN Pressure (PSIG)
20 30 40 50 60 70 80 90 100
30 681
40 417 1078
50 328 634 1540
60 284 486 886 2087
70 257 412 667 1176 2695
80 240 370 563 886 1540 3594
90 227 340 498 735 1135 1960 4312
100 217 319 452 640 924 1406 2310 4976
110 210 304 423 583 809 1155 1702 2812 6469
120 202 288 392 526 703 951 1294 1848 2940
130 197 278 374 494 647 851 1115 1504 2156
140 194 272 363 476 616 799 1027 1348 1848
NOTES:
(1) If an automatic air charge valve is used, tank size may be reduced by 50%.
(2) Increase tank size by 5% for each 1,000 feet elevation above 3,000 feet elevation.
Utah LWPH June 2015
219
10.3 PRESSURE SWITCHES
10.3.1 Switch CharacteristicsPressure switches are designed for certain pressure ranges and electric voltage and amperage services. For most low pressure systems, the switch pressure settings are pre-set at the factory. For higher pressure switches, the threshold cut-in and cut-out pressures can usually be adjusted.
The pressure range which should be used to set cut-in and cut-out pressure depends on the operating pressure of the system. Since air is compressed into a very small volume at high pressures, a greater pressure difference is required to store a given volume of water.
Tables 10.3 through 10.12 provide recommended cut-in and cut-out pressures for various pump flow rates and tank capacities. The time that a pump should stay on depends on motor characteristics. Too short a cycling time can over heat the motor and shorten the life of the motor and pump. The increased number of pressure surges caused by rapid cycling also accelerates deterioration of pipe, valves and fittings.
Tables 10.3 through 10.12 are based on time between pump cycles of 1-1/2 minutes. This is typically a conservative minimum time as recommended by pump motor manufacturers. The tank volumes can be corrected to other run times by using the following equation:
Corrected tank volume =Run time (minutes ) x Table volume
1. 5
10.3.2 Pressure GaugesAn accurate pressure gauge is a very important accessory for a pressure pipeline. With a good pressure gauge, problems such as leaks, pump wear and pressure surges can be identified.
Frequently, low cost pressure gauges are used. They last a very short time in the damp atmosphere of most pump enclosures. For a nominal fee, a good liquid filled gauge with a stainless steel case can be obtained and is highly recommended.
Utah LWPH June 2015
220

10.4 ELECTRICAL PUMP CONTROL EQUIPMENT
10.4.1 Automatic Water Level ControlA float switch which directly controls a pump is illustrated in Figure 10.20.
In addition to controlling the filling of a single tank, these types of switches can be used to fill a tank from which a gravity pipeline system is fed.
Figure 10.20FLOAT SWITCH PUMP CONTROL
Utah LWPH June 2015
221
A mechanism to control a pump based on water levels in both the well and tank is shown in Figure 10.21. This should be used where water level in the well must control the pump.
Figure 10.21SWITCH CONTROL OF
WATER LEVEL IN STORAGE TANK AND IN WELL
Utah LWPH June 2015
222
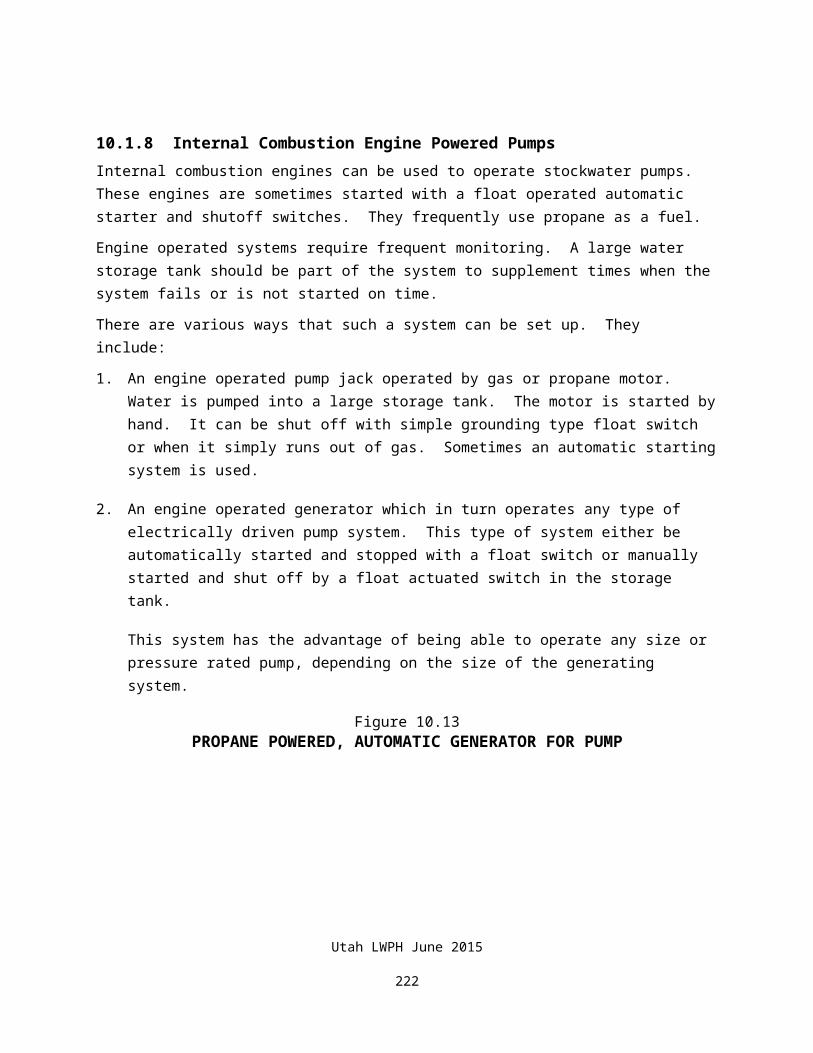
10.4.2 Remote Control Pump Float SwitchA float switch at a remote storage tank is connected to a pump relay switch via low voltage telephone line or signal wires. The wires may be underground or aboveground. Used telephone wires might be used aboveground. Figure 3.5 illustrates this type of system. This is the most preferred type of system for very high pressure pipelines. The storage tank is located at the highest point in the system.
Figure 10.22 illustrates typical switching equipment for a remote tank. Figure 10.23 shows various kinds of float switches that might be used in the storage tank.
A mercury float level control on a cable is a simple and reliable mechanism. The pumping differential is controlled by the length of free cable.
Figure 10.22REMOTE TANK FLOAT OPERATED SWITCHING EQUIPMENT
Utah LWPH June 2015
223
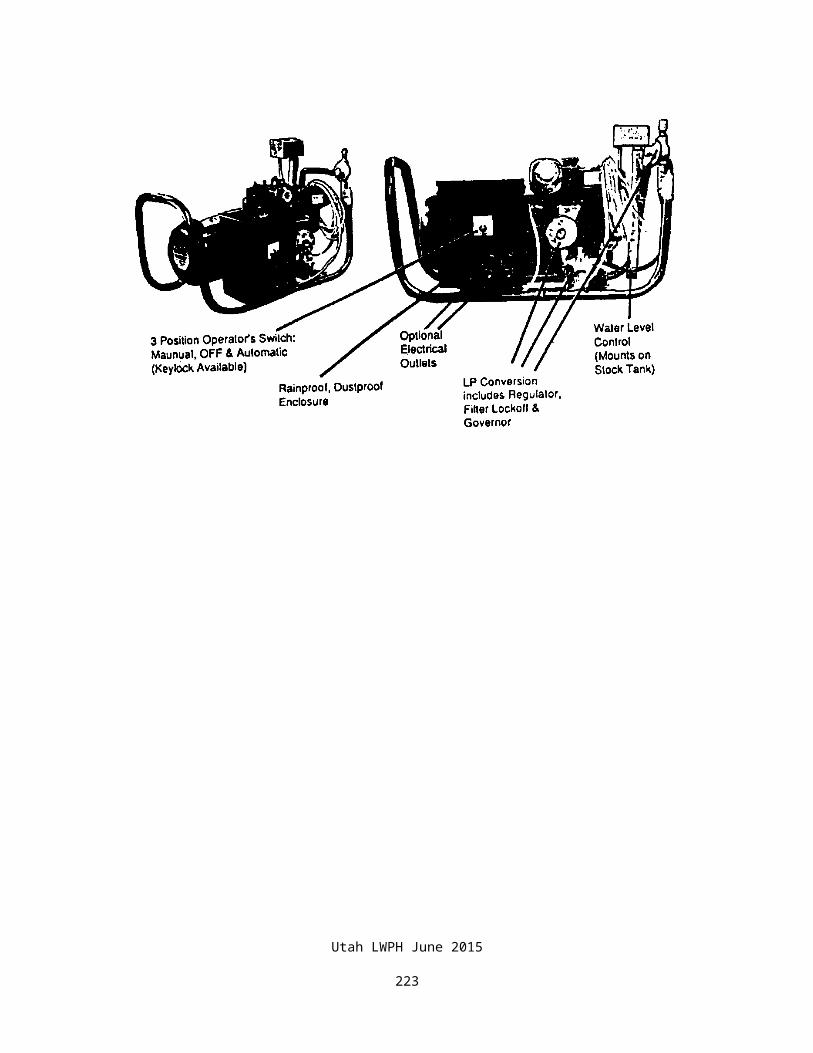
Figure 10.23WATER LEVEL CONTROL SWITCHES
MERCURY FLOAT LEVEL CONTROL
Utah LWPH June 2015
224
MECHANICAL FLOAT SWITCH
CHAPTER 11
HYDRAULIC DESIGN PROCEDURES
TABLE OF CONTENTS
PART 11.1 GENERAL 11-1PART 11.2 DESIGN PROCEDURES 11-1PART 11.3 EXAMPLE 1--GRAVITY SYSTEM 11-4PART 11.4 EXAMPLE 2--TIMER OR MANUALLY OPERATED
PRESSURE SYSTEM 11-8PART 11.5 EXAMPLE 3--PUMPED AUTOMATIC PRESSURE PIPELINE 11-12PART 11.6 EXAMPLE 4--RURAL WATER SUPPLIED (Constant Pressure) 11-19
FIGURES
Figure 11.1 Gravity System HGL Profile 11-5Figure 11.2 Gravity Pipeline Profile 11-7Figure 11.3 Timer or Manually Operated System HGL Profile 11-10Figure 11.4 Storage Tank Plumbing 11-11Figure 11.5 Pumped Automatic Pressure System HGL Profile 11-18Figure 11.6 Rural Water System HGL Profile 11-24
Utah LWPH June 2015
225
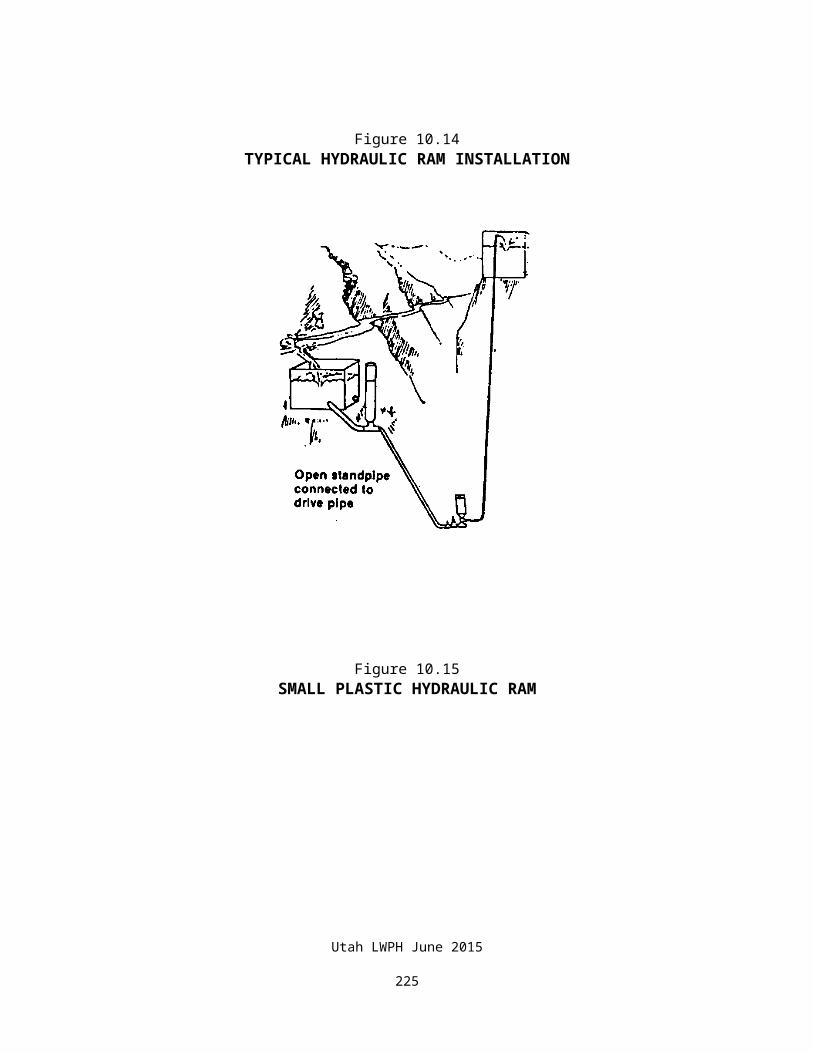
CHAPTER 11 -- HYDRAULIC DESIGN PROCEDURES
11.1 GENERALA properly designed livestock pipeline system should balance the energy produced by the system (pressure & elevation) vs. the energy used in the system (friction, elevation, hydrants, etc.)
There are two major categories of hydraulic designs associated with stockwater pipelines. They are:
Gravity flow pipeline
Pressure pipeline
Sometimes the system types are combined on one job. For instance, water may be pumped to a large storage tank at a higher elevation and a gravity pipeline installed to other tanks.
Example No. 1--hydraulic design for a very simple, low head gravity pipeline leading from a spring.
Example No. 2--an automatic pumped system with pressure tank.
Example No. 3--a timer/manually operated pumped system.
Example No. 4--a rural water supplied system (constant pressure)
Appendix A contains master copies of the worksheets used in these examples. These worksheets are for your convenience. Use them only if they will aid in the computations.
Computer programs can be used to aid in computations. Appendix B illustrates the use of currently available programs.
11.2 DESIGN PROCEDURES1. Determine required water storage volume in pasture(s), which is dependent on livestock numbers in each pasture. Refer to Utah Livestock Water and Pipeline Handbook, WLWPH, Table 2.1, for minimum daily stockwater requirements. Information, such as planned herd type and size, from the producer is vital to meeting the herds’ needs. Evaporation and spillage should be accounted for as well, which is commonly considered to be a minimum of 10% of the total required storage. Consult with the planner, landowner and wildlife agency to determine the appropriate amount of wildlife use.
2. Determine tank size(s) needed for the required volume of water. Use UT-ENG-20 found in Appendix A of this manual or from Utah NRCS website. Any dependable supplemental water (i.e., pond, windmills) can be subtracted from the required volume.
3. Determine minimum system flow rate required to fill tanks for one day volume. This rate is dependent on the type of grazing system and producers management goals. Use Utah LWPH Fig. 2.3A or
Utah LWPH June 2015
226
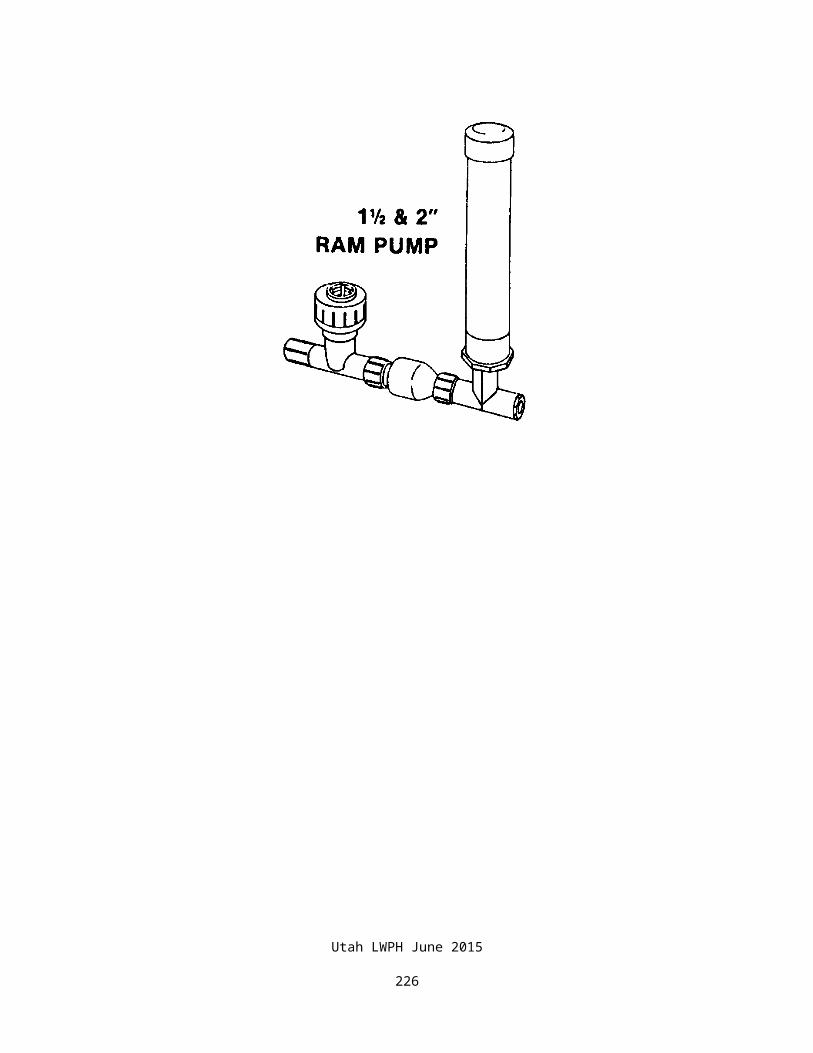
Min Discharge Required =( gallons /day /head )×(¿head )(Recharge Time in Min .)
×1. 110 % spillage¿
Conventional systems should be replenished in 12 hours or less with 6 hours being recommended. Intensive grazing systems should be replenished in 4 hours or less. The entire system should meet this minimum requirement.
4. Survey pipeline with an acceptable method as discussed in Chapter 4. Each method has inherent accuracy concerns, which must be understood and addressed, typically by applying a factor of safety. Note: Gravity pipelines are to be surveyed with an engineering instrument. If possible, the survey should be done with producer present to determine well and tank locations, as well as optimum pipe route. The survey must be detailed enough to adequately depict the terrain of the selected route. The route should be clearly flagged or marked for contractor to follow. If significant changes are made to the alignment of the pipeline during construction, a post construction survey should be completed after the installation and saved in file folder in the event of land ownership change or future expansion.
5. Draw the ground profile of pipeline route. The profile should be scaled, both vertically and horizontally, in units that are easily understood and legible. Hand drawings, the use of a computer aided drafting program, or other methods are acceptable.
6. Determine energy required for the low (pump on) pressure setting for the most critical tank. Typically, the farthest tank from the water source is the most critical. However, in some instances, a higher elevation along the pipeline route may be the critical point; a check should be performed to determine this.
To determine the energy available, one must know the available water pressure head, type of planned pipe(s), type of planned hydrant/float, and planned tank locations. Due to the varying factors, many design considerations may be required to meet the minimum required flow rate.
Compute friction loss or use tables (Utah LWPH Tables 5.2-5.15) with gallons required, pipe size and strength to determine pipe friction loss. Use hydrant flow versus pressure table, Table 1 or Figure 2 in Appendix A to determine hydrant flow due to pressure available from the pipeline. A properly designed pipeline will balance flow and pressure for pipeline and hydrants.
Minor losses in livestock pipelines are usually negligible in comparison to pipe friction loss and are not considered in this chapter. Refer to National Engineering Handbook, Part 650, Chapter 3, Hydraulics, for computing minor losses.
7. Draw the Hydraulic Grade Line (HGL) for the low pressure setting. If the low pressure HGL intersects the ground profile (with an applied factor of safety) line prior to the critical tank, the water delivered will be less than the amount of water required. In this case, the pressure setting on the well can be increased; a larger pipe size can be used to reduce friction loss; or both.
8. Determine energy available for high (pump off) setting for the most critical tank. The high setting is for pipeline systems that use a pressure tank. The pressure tank is designed to maintain a range of pressure on the system. When the low pressure (turn on) setting is met at the pressure tank, the pump is turned on to pressurize the tank and add water to the system.
Utah LWPH June 2015
227
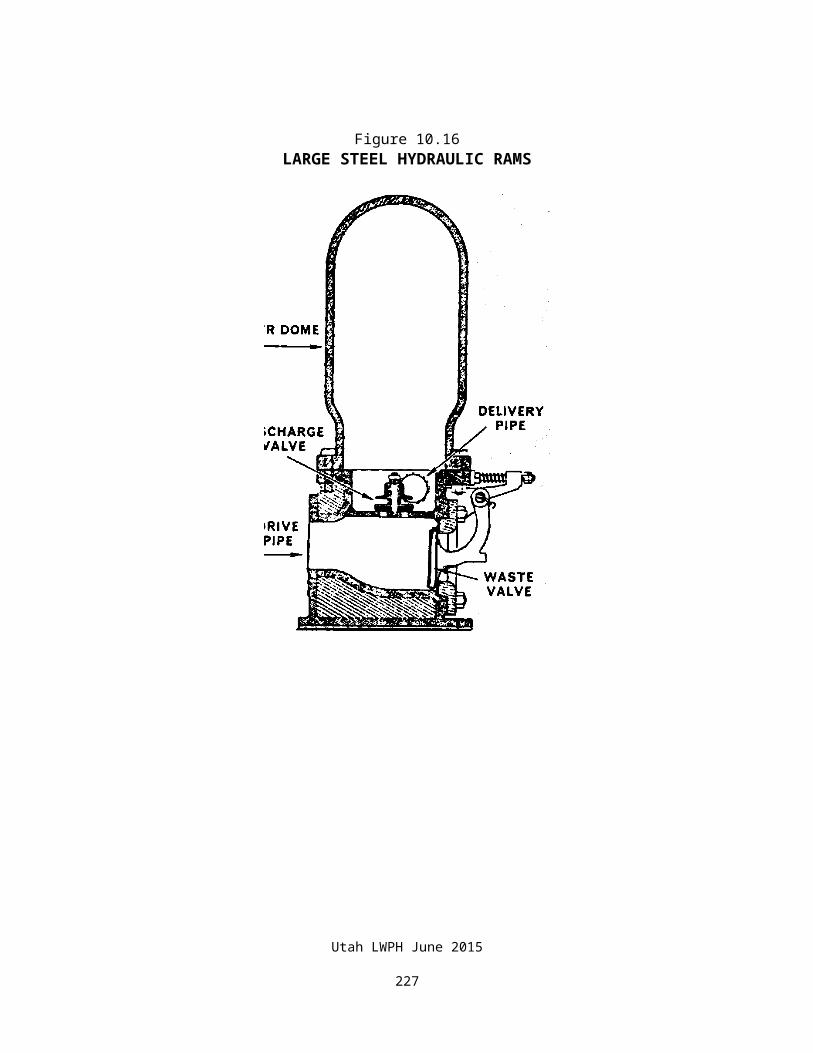
When the high pressure (turn off) setting is reached, the pump shuts off. In a gravity system, constant pressure or timer system, this high/low switch is not present and should be analyzed as only having one pressure at the water source.
The process for determining the energy available follows the same process as step 6, with a high pressure head at the water source. Typically a 20-psi differential increase over the low pressure setting is used for the high switch setting.
9. Draw HGL for high pressure setting. When plotted, the high pressure HGL will be steeper in slope than the low pressure HGL. This is due to the fact that under higher pressure, the hydrant and pipeline can flow more water with higher friction loss.
10. Draw a horizontal line from the beginning station of high pressure setting to the station of the last tank. This is known as the static water head. When a system is fully pressurized & the pipeline is not flowing, the pressure of the system is equal to the head developed by the static water head relative to any particular point on the pipeline.
11. Determine the pipe strength required from water hammer/surge effects on the pipeline. The most conservative determination of water hammer/surge is found by adding the maximum static pressure head on the system and the maximum surge at any point on the system. The maximum pressure surge is usually greatest at the first hydrant due to this location resulting in the steepest HGL.
Determine the high pressure setting flow rate at the first hydrant by balancing the hydrant and pipeline flow. By finding this rate, the water velocity can be determined by V=Q/A with A being the cross sectional area of the pipe and Q being the flow rate. Table 2 Appendix A, provides a surge factor multiplier for various pipe types and sizes. Refer to Ch. 6 for explanation in determining surge factor. By multiplying the surge factor by the velocity, the surge pressure can be determined.
Determine the maximum static pressure at the lowest elevation on the pipeline. This is found by subtracting the lowest point on the pipe profile from the static water head.
The minimum pipe strength required is found by adding the maximum static pressure and the maximum surge pressure.
12. Minimum pressure tank size recommended. A well pump should never run for less than 1 ½ minutes at a time. Constant short duration cycling of the pump will greatly reduce the life of the pump. For this reason, a pressure tank or storage tank should be adequately sized for the pump’s flow rate and pressure.
As the pressure tank releases water to the pipeline, the water level in the tank decreases. This decrease in the water level causes the pressure to decrease until the pump turns. The well then recharges the tank with water until the high pressure setting is reached and turns the pump off.
Refer to Utah LWPH Tables 10.3-10.12, for the minimum recommended diaphragm pressure tank size based on the pipeline flow rate or use:
Utah LWPH June 2015
228
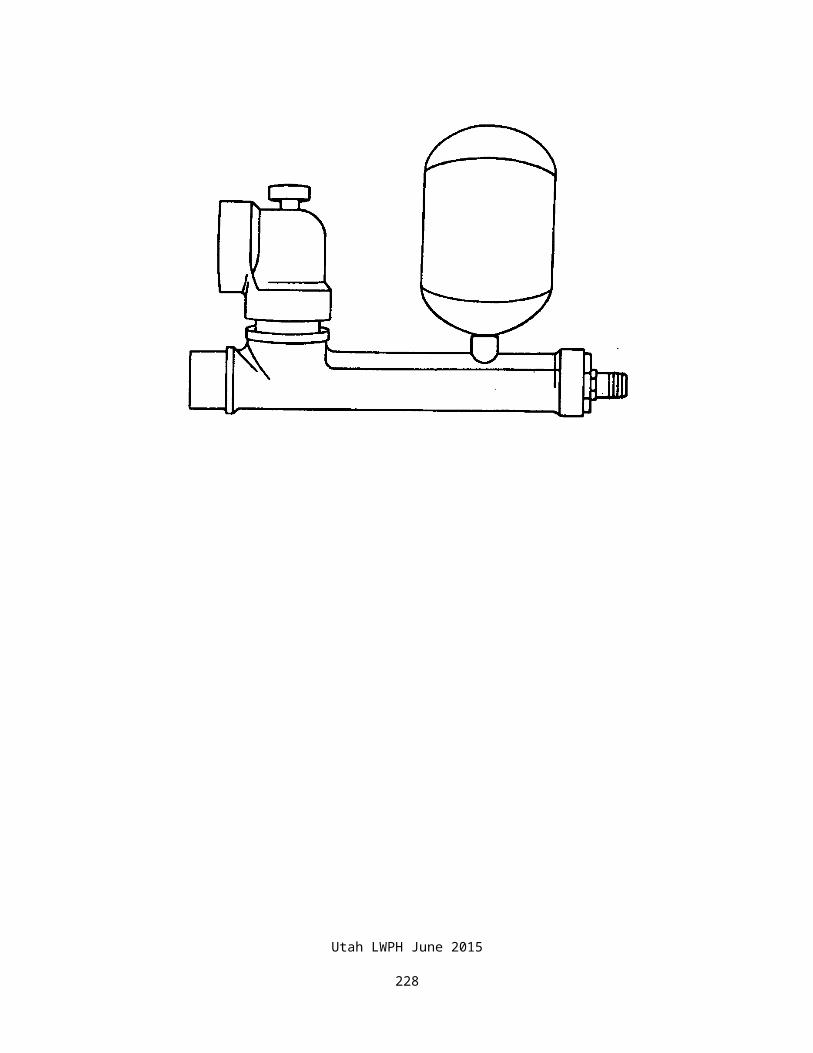
V tank=Qavg⋅t
1−(Plow+14 .7PHi+14 .7 )
V tank−min . volume of tank required (gallons)Qavg−average pump flow rate at P low and Phigh( gpm )Plow , PHi−Hi and Low Pressure tank settings (psi )t−minutes (1 .5 recommended )
13. Determine where air release/relief valves are required. A combination valve (COMB) or three-way air vent should be installed at the first summit in the pipeline after the pump. If the pipeline goes downhill from the well, it would be advisable to locate the COMB valve right after the pressure tank (within 10’). See Chapter 7 for additional air relief valve guidance.
14. Pressure Reducing Valves may need to be installed on pipelines to protect pipe and appurtenances. These valves reduce the downstream pressure with minimal flow loss.
Computations for pipelines with pressure reducing valves are handled as if the pipeline beyond the pressure reducer were a lateral. The hydraulic grade line must clear any critical point.
Refer to Ch. 6 for explanation for determining pressure reducing valve application and design.
15. Flow Reducing Valves reduce flow in the downstream pipeline. A flow reducing valve can be installed to reduce pipeline flow.
11.3 EXAMPLE 1: GRAVITY SYSTEM Figure 11.1 illustrates the profile for a very low head system. The pipeline originates at a spring box and terminates at a stock tank. An overflow is built into the stock tank. There is not a float valve at the tank and the entire spring flow goes to the tank. A gate-type valve could be installed at the spring box to control the flow or shut it off when water is not wanted. A valve at the tank allows drainage of the pipeline during non-use. The pipeline is buried below the frost line.
Figure 11.1 is the calculations and profile that were made.
It is important in this installation to install the vent and air valve at the locations shown. If they were not installed, this system would almost certainly air lock.
Utah LWPH June 2015
229
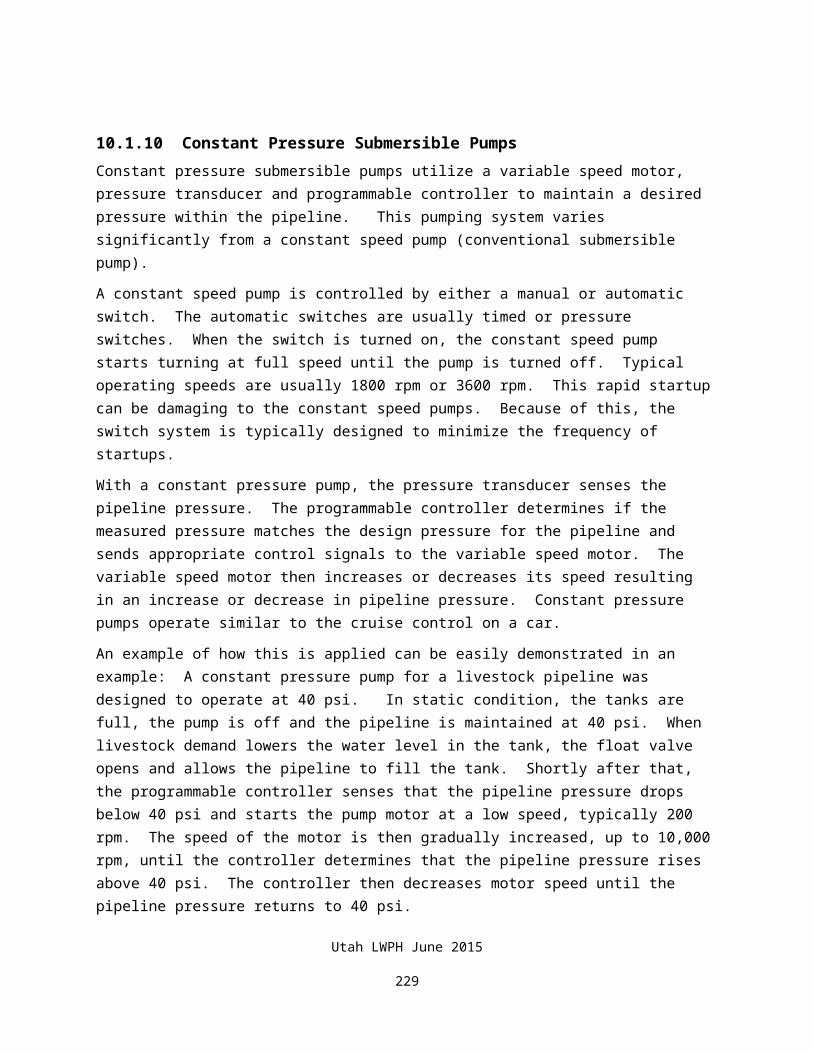
Figure 11.1GRAVITY SYSTEM HGL PROFILE
Utah LWPH June 2015
230
Utah LWPH June 2015
231
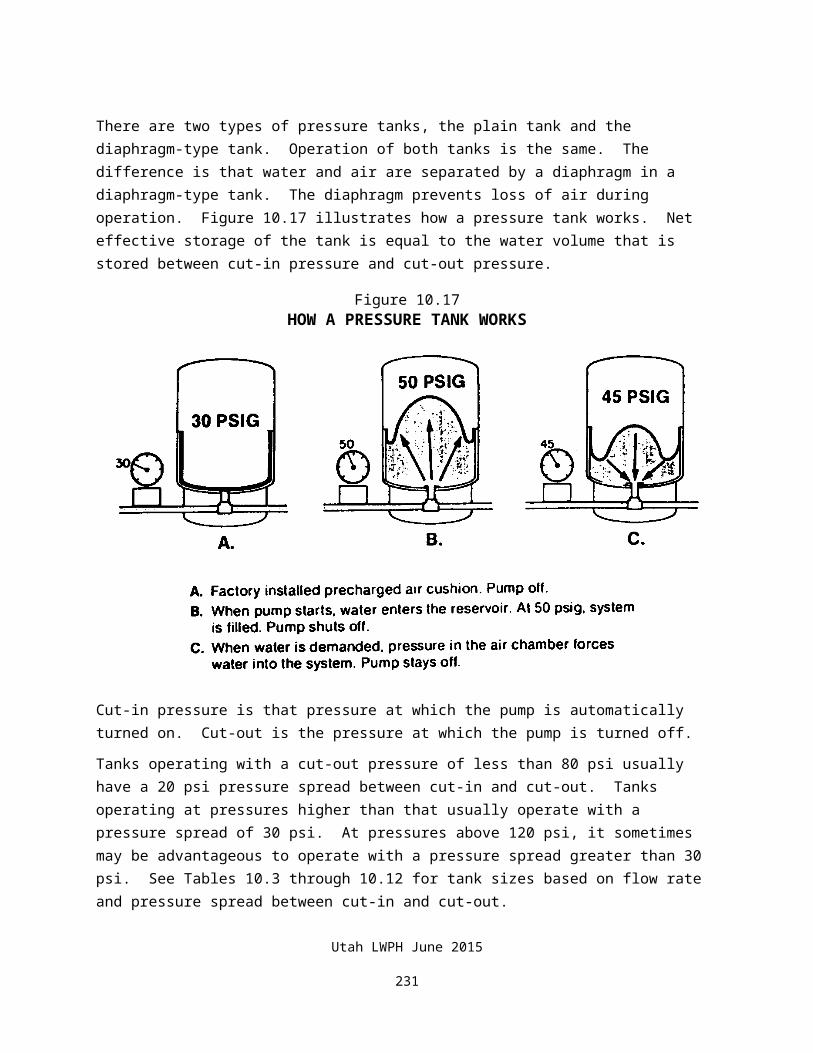
Figure Utah LWPH June 2015
232
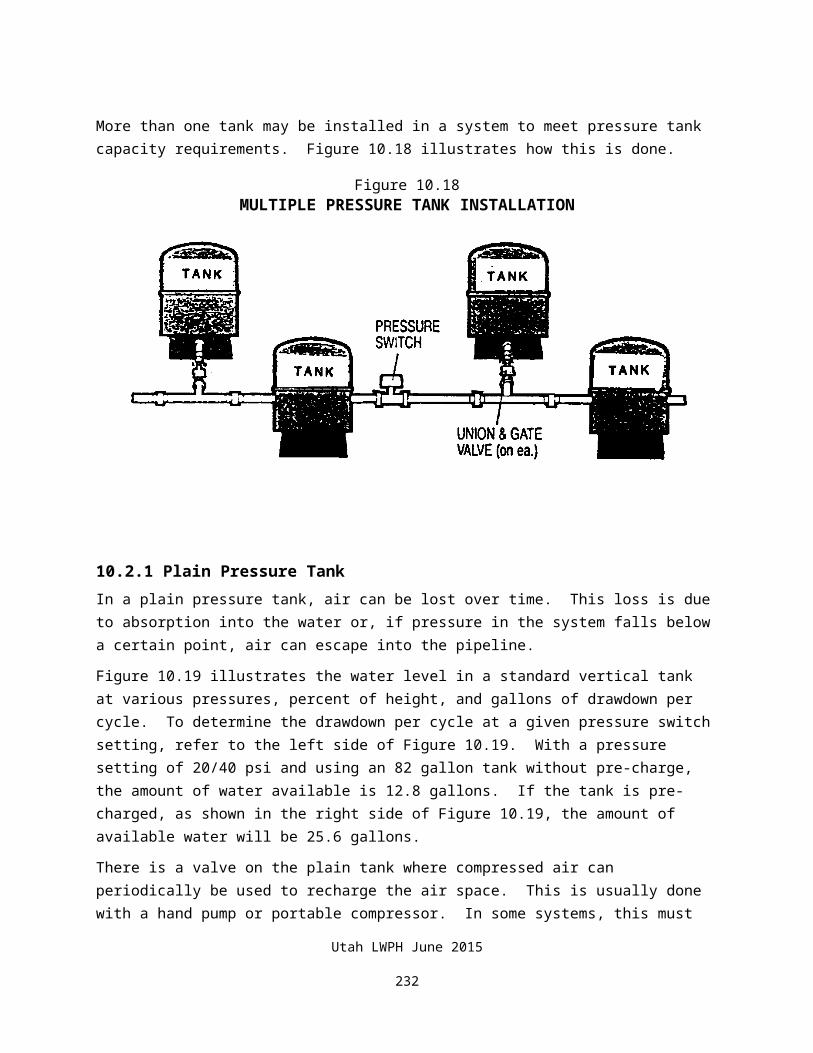
11.2Example 1 Gravity Pipeline
Profile
Utah LWPH June 2015
233
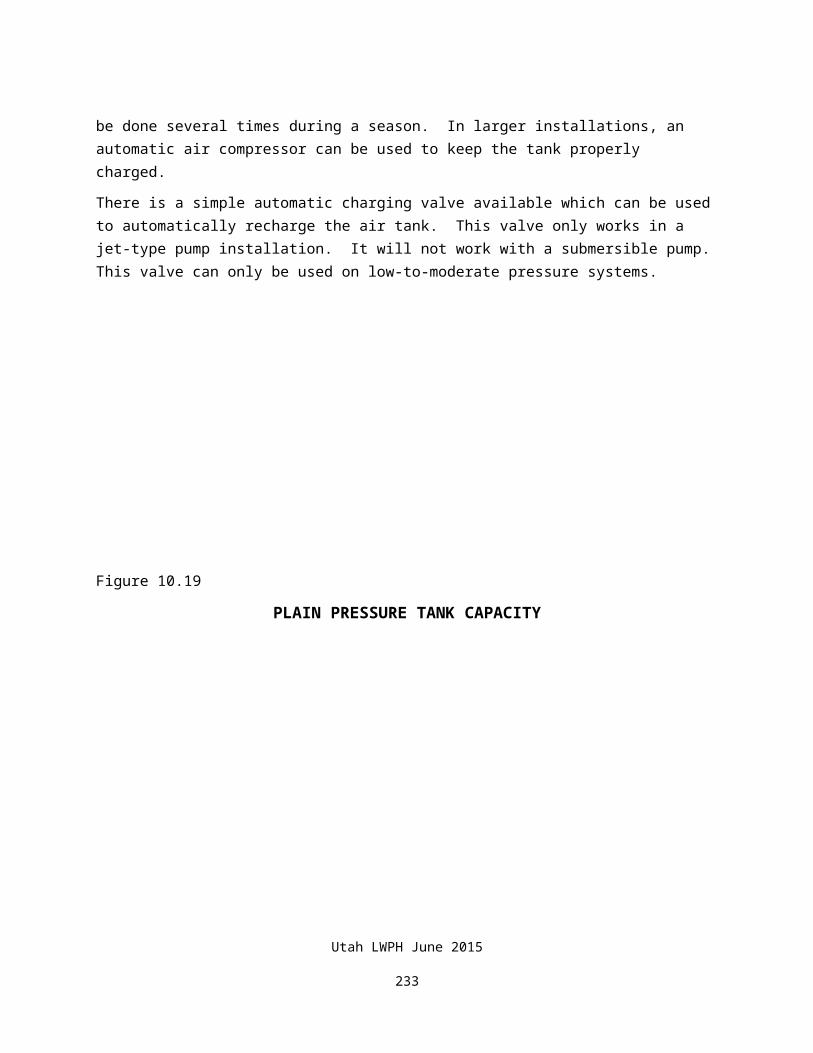
11.4 EXAMPLE 2: TIMER OR MANUALLY OPERATED PRESSURE SYSYTEM
Utah LWPH June 2015
234
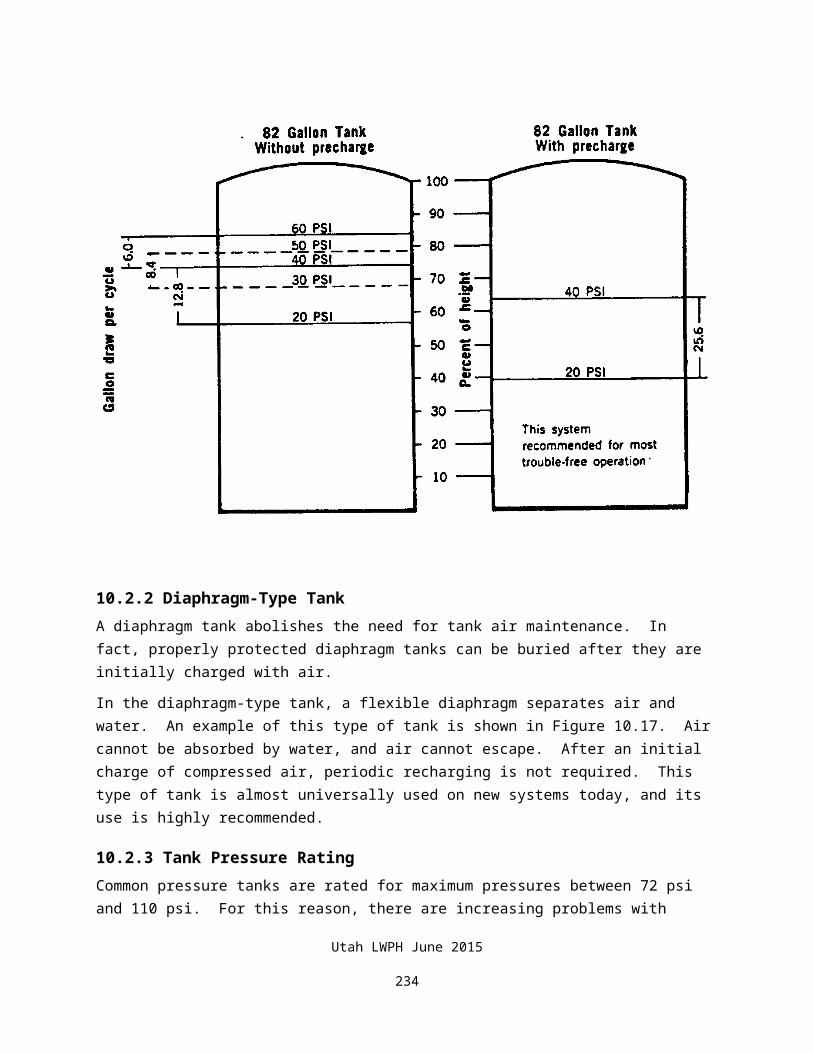
With more complex livestock pipeline designs and with elevation differences exceeding 240 feet along pipeline routes, a timer or manually operated livestock pipeline system should be considered. When the pressure needed to operate the system exceeds safe levels (+100 psi) in the pressure tank, a timer or manually operated system should be considered because most pressure tanks are designed and manufactured to an upper limit of only 100-110 psi. In other situations, a pressure tank can be located along the pipeline at a higher elevation to reduce the amount of pressure needed to operate the system. For this type of system, see your CET or Field Engineer. Pressure tanks can be specifically manufactured for high pressure, but are a significantly higher cost due to special manufacturing processes and testing procedures. Therefore, this design example is WITHOUT a pressure tank. The plumbing at the storage tank is set up so water will flow back into the supply line when the pump is off. Due to gravity section of pipeline, this route needs to be accurately surveyed with a level or total station.
1. Start with required water needs for livestock. Determine water needs for the maximum amount of animals to be watered at critical time of the year.
Ex. 20 gal/ cow /day x 150 cows = 3000 gal/day.
2. Add 10% extra for spillage and evaporation.
Ex. 3000 gal/day + (0.10 x 3000 gal/day) = 3300 gal/day
3. Determine minimum storage requirements. (2 days Recommend).
Ex. 3300 gal/day x 2 day = 6600 gallon tank
A 24-foot diameter tank with 2 feet of depth has 6768 gallons. Therefore, use a 24 foot storage tank.
4. Determine the volume needed to refill a one day water supply in timed refills. (1 to 4 refills per day recommended).
Ex. 3300 gal/3 refills = 1100 gallons/refill
5. Determine pump run-time with a pre-determined pump capacity. Pressure requirements will be determined later. (Recommend 5-15 gpm pumps.)
Ex. 1100 (gal/refill)/10 (gal/min) = 110 min/refill
6. The pressure head at the well can be calculated by adding the ground elevation at the well to the pressure needed to overcome the critical point. i.e., well elev. = 100.0
Ex. 100.0 + (120 psi x 2.31 ft/1 psi) = 100.0 + 277.2 = 377.2 ft
Utah LWPH June 2015
235
7. A single Hydraulic Grade Line (HGL) can be calculated based on the flow required and pipe size chosen. See Friction. Loss tables NLPH (pages 5-8 thru 5-21).
Ex. Try 1.5” 160 psi PVC & 11 gpm => fric. loss = 0.5339 ft/100ft.
8. Determine the location of the highpoint on the pipeline. This is the location of the water storage tank. Plot the HGL above this tank. Make sure the HGL is above the storage tank with some clearance to assure flow. Gravity flow the remainder of the pipeline.
Ex. 1800 ft x 0.5339 ft/100ft = 9.6 ft
377.2 ft – 9.6 ft = 367.6 ft > 350 ft (Elev at high tank)
367.6 ft – 350 ft = 17.6 ft
17.6 ft x 1 psi/2.31 psi = 7.6 psi
9. Assure that the pressure at the top storage tank can supply the required flow through the chosen hydrant. See hydrant flow table, Table 1 Appendix A.
Ex. Using a Merrill “Any Flow”, the flow at 8.3 psi = 11.0gpm OK
10. Well/Pump installer will need to match the flow required & pressure needed at the well location. This information will be supplied by NRCS technicians. A pressure relief valve will be installed near the well, which will activate if pump continues running and high pressure builds up above the pressure required to protect the pipeline.
Ex. Set pressure relief valve at 130-140 psi. The pump will need to pump 120 psi @ 11 gpm at well location.
11. The pipeline near the well should have a housed area where a check valve is installed after the pump, then a pressure gauge followed by a pressure relief valve and a gate valve. The timer mechanism or manually operated switch can be located at this location. All tanks along the pipeline should have float valve, while the highest tank has a hydrant with an overflow drain. The overflow drain will allow the highest tank to be filled after the pump runs for the specified time period. The other tanks can be filled from the highest tank by gravity flow when the pump is not running. (See STORAGE TANK PLUMBING – FIG. 11.3)
12. The remainder of the gravity pipeline can be designed by calculating the friction loss from the slope of a line from the elevation of the highest tank to elevation of the last tank. Be sure air valves are located at high spots along the gravity pipeline.
Ex. (352-202)/7500-1800) = 0.0263 ft/ ft.
Utah LWPH June 2015
236
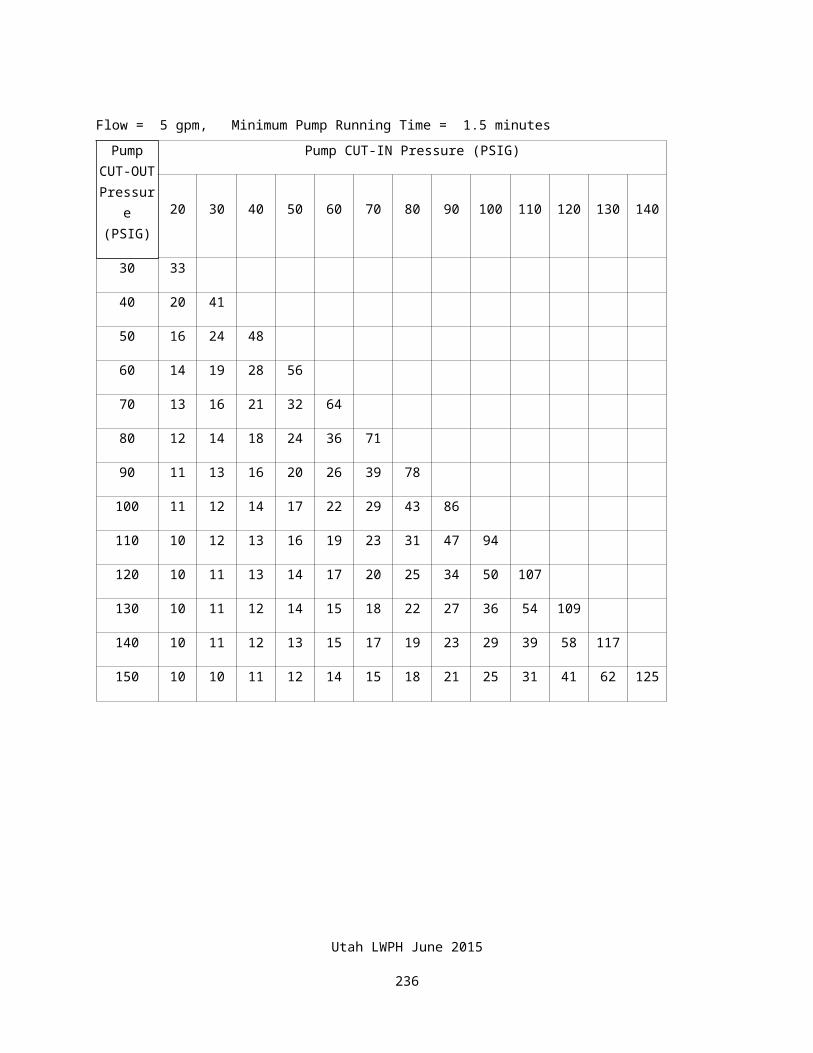
13. Flow of the gravity pipeline can be calculated using the rearranged Hazen-Williams formula. Check with the CET or Field Engineer.
Ex. Q =42.23 di2.63 s0.54,
where Q =flow (gpm),
di = inside diameter (in),
s = slope (ft/ft)
Q= 42.23 x 1.7542.63 x 0.02630.54 = 25.9 gpm
This is the flow to the farthest tank unless the float valve is the limiting control. An HGL can be plotted to each tank from the storage tank, if there are several tanks along the gravity line.
Utah LWPH June 2015
237
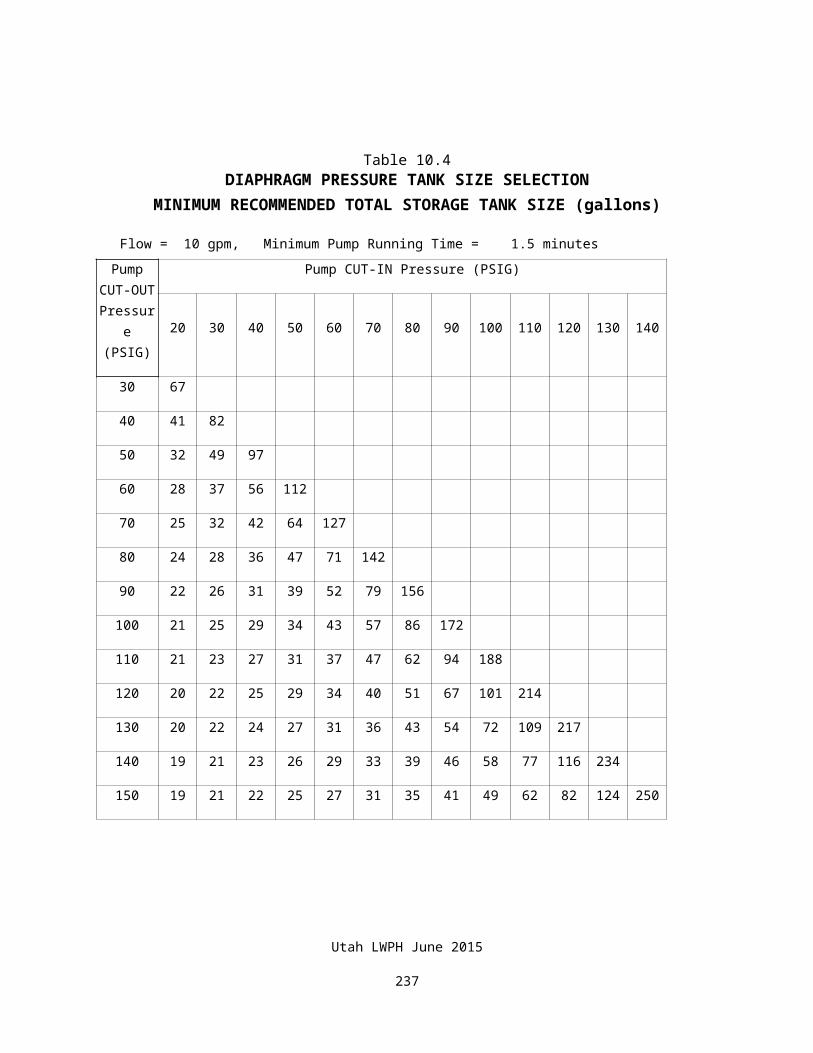
Figure 11.3TIMER OR MANUALLY OPERATED PRESSURE SYSYTEM HGL PROFILE
Utah LWPH June 2015
238
Utah LWPH June 2015
239
Figure 11.4STORAGE TANK PLUMBING
Utah LWPH June 2015
240
11.5Example 3: Pumped Automatic Pressure PipelineIt was determined during the planning process that this pipeline will provide water for a herd of 175 cattle. There will be three watering locations. The producer desires 6-hour pumping time, ¾ inch hydrants and 4 days of storage using bottomless tanks. Refer to Utah LWPH, 2.2
Step 1: Determine required water storage volume in pasture. (Refer to Utah LWPH Chapter 2;UT-ENG-20)
Determine herd requirement:
175 hd x 15 gal/day/hd x 4 day = 10,500 gal.
Determine 10% evaporation and spillage volume:
10,500 gal x 10% = 1,050 gal
Calculate storage requirement:
10,500 gal + 1,050 gal = 11,550 gal
Step 2: Determine tank size (Refer to Utah LWPH Chapter 2)
Required storage per tank:
11,500 gal / 3 tanks = 3,850 gal/tank
Determine minimum tank diameter:
Use trial and error method:
Volume of tank(gal) = Area(ft2) x depth(ft) x 7.48(gal/ft3)
Alternate method, solve above equation for diameter of tank:
Tank Diameter=√ Tank Volume5 .87×Tank depth
Tank Diameter=√ 3 , 8505 .87×1 .75
Tank Diameter =19.9ft ~ 20 ft tank
If using standard drawing, select a diameter with minimum volume required.
Step 3: Determine minimum system flow rate required to fill tanks for one-day volume.(Refer to Utah LWPH Chapter 2; WY-ENG-20)
Utah LWPH June 2015
241
Q( gpm )=Daily requirement (gal /day /hd )×Herd size (hd )
pumping time( min)
Q=15×175360
Q=7 . 3 gpm; use Q=8 gpm
Utah LWPH June 2015
242
Step 4: Survey Pipeline
Survey Method: differentially corrected GPS.
Horizontal accuracy (average): +/- 5 ft.
Vertical accuracy (SF): twice the horizontal accuracy, +/- 10 ft.
Step 5: Draw ground profile of pipeline route (See figure 11.4)
Well: Sta. 0+00, Elev. 3980
Closest Hydrant: Sta. 31+56, Elev. 4017
Critical Point: Sta. 77+53, Elev. 4004
Lowest Point: Sta. 60+83, Elev. 3975
Farthest Hydrant: Sta. 92+00, Elev. 3987
Step 6: Determine energy required for low (pump on) setting for the most critical tank.
Energy or head required at the last hydrant for desired flow is determined by adding the safety factor (SF) to the pressure required at the hydrant to produce desired flow.
Use manufacturer’s data or the following formula to calculate the pressure at the farthest hydrant required to produce desired flow.
Head (ft) for ¾ in. hydrants:Q=5 .728×P0 . 334⇒H3/ 4=( Q
5 .73 )2. 99
×2 .31
H3/4=( 85 .73 )
2. 99×2 .31=6 .3 ft
Energy required at furthest hydrant: H¾ + SF = 6.3 ft + 10 ft = 16.3 ft.
Determine friction loss for desired pipe size and flow rate (Refer to Utah LWPH, or chapter 3 of the Engineering Field Manual) Pipe Size: 1 ½ in. PVC, SDR 26.
Friction loss at 8 gpm =
0 .2960 ft100 ft
Total Friction loss in pipeline =
0 .2960 ft100 ft
×9200 ft=27 .2 ft
Determine required energy at well to produce desired flow:
Sum the elevation of the farthest hydrant, the energy required to produce desired flow, and the total friction loss in the pipeline
3987 ft + 16.3 ft + 27.2 ft = 4030.5 ft
Utah LWPH June 2015
243

Determine Low (pump on) switch setting by subtracting the well elevation from the total energy required and convert to psi:
Low switch setting =
4030 .5 ft−3980 ft2 .31
=21.9 psi
Select a standard low pressure switch (pump on) setting greater than 21.9 psi. Typical ranges for pressure switches are as follows: 20-40, 30-50, 40-60, 50-70, 60-80, and 80-100. For this example, use 30-50 psi pressure switch.
Step 7: Draw Hydraulic Grade Line (HGL) for low-pressure setting.
Calculate elevation of “pump on” setting (30 psi):
Well elevation + pump on setting = 3980 + 30psi x 2.31 = 4049.3
Balance flow in pipeline with hydrant flow:
Calculate the slope of the HGL from “pump on” setting at the well to the energy required at last hydrant calculated in step 6.
Utah LWPH June 2015
244

Trial 1:
Pump on setting: 4049.3
Elevation of farthest hydrant: 3987
Sta. of farthest hydrant: 92+00
Required energy for 8 gpm: 16.3 ft
4049 .3− (3987+16 .3 )9200
×100=0.50 ft100 ft
Refer to Utah LWPH, pages 5-7 thru 5-20 or chapter 3 of the Engineering Field Manual to interpolate flow rate in pipeline for the calculated slope. Flow rate = 10.6 gpm with 0.50 ft per 100 ft of friction loss 10.6 gpm > 8 gpm; Flow does not balance, increase design flow rate at the last hydrant and repeat the previous calculation.
Trial 2:
Required energy for 10 gpm:
For a ¾ in. hydrant, H3/4=(10
5 .73 )2. 99
×2 .31=12. 2 ft
Energy required at furthest hydrant: H¾ + SF = 12.2 ft + 10 ft = 22.2 ft.
Calculate the slope of the HGL:
4049 . 3− (3987+22. 2 )9200
×100=0 .44 ft100 ft
Refer to Utah LWPH, pages 5-7 thru 5-20 or chapter 3 of the Engineering Field Manual to determine flow rate in pipeline for the calculated slope. Flow rate = 9.9 gpm with 0.44 ft/100 ft of friction loss 9.9 gpm ~ 10 gpm
Balanced flow at “pump on” setting:
Flow = 10 gpmEnergy required at hydrant = 22.2 ftSlope of HGL = 0.4475 ft per 100 ftDraw Low HGL on profile (see figure 9.4)
Check minimum head at critical point, if other than end. The pipeline may not pass the desired flow if the Low HGL is closer to the ground surface than allowed by the safety factor. There may be several critical points (intermediate summits) that require checking. To determine minimum head at critical point inspect Low HGL plotted on profile or calculate as follows:
Elevation of Low HGL at well: 4049.3
Utah LWPH June 2015
245
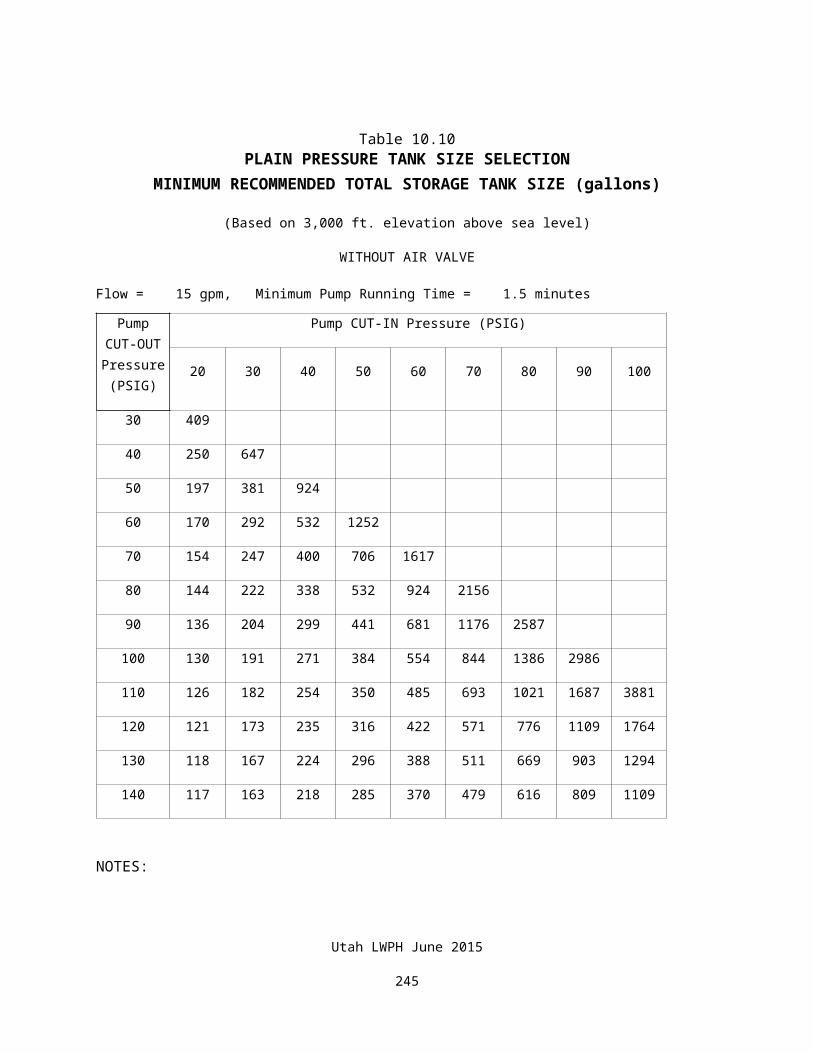
Slope of Low HGL:
0 . 4475 ft100 ft
Station of Critical Point: 77+53
Elevation of Critical Point: 4004
4049 .3−0 .4475 ft100 ft
×7753 ft=4014 .6
Available Safety Factor = 4014.6 – 4004 = 10.6 ft
Step 8: Determine energy available for high (pump off) setting for the most critical tank.
Calculate elevation of “pump off” setting (50 psi):
Well elevation + pump off setting = 3980 + 50 psi x 2.31 = 4095.5
Balance flow in pipeline with hydrant flow:
Trial 1:
Assume flow rate at “pump off” setting is 5 gpm greater than “pump on” setting.
Pump off flow rate = 10 gpm + 5 gpm = 15 gpm
Use manufacturer’s data or the following formula to calculate the energy at the farthest hydrant required to produce desired flow.
Head (ft) for ¾ in. hydrants: H3/4=( Q
5 .73 )2. 99
×2 .31
H3/4=(155 .73 )
2. 99×2 .31=41 .0 ft
Energy required at furthest hydrant: H¾ + SF = 41.0ft + 10ft = 51.0ft.
Calculate the slope of the HGL from “pump off” setting at the well to the energy required at last hydrant.
Pump off setting: 4095.5
Elevation of farthest hydrant: 3987
Sta. of farthest hydrant: 92+00
Required energy for 15 gpm: 51.0 ft
4095 . 5− (3987+51.0 )9200
×100=0 . 63 ft100 ft
Utah LWPH June 2015
246
Refer to Utah LWPH, or chapter 3 of the Engineering Field Manual to interpolate flow rate in pipeline for the calculated slope.
Flow rate = 12.0 gpm with 0.63 ft per 100 ft of friction loss
12.0 gpm < 15 gpm;
Flow does not balance, decrease design flow rate at the last hydrant and repeat the previous calculation.
Utah LWPH June 2015
247

Trial 2:
Required energy for 13 gpm:
For a ¾ in. hydrant, H3/4=(13
5 .73 )2.99
×2 .31=26 .8 ft
Energy required at furthest hydrant: H¾ + SF = 26.8ft + 10ft = 36.8ft.
Calculate the slope of the HGL:
4095 .5− (3987+36 .8 )9200
×100=0 .78 ft100 ft
Refer to Utah LWPH, or chapter 3 of the Engineering Field Manual to interpolate flow rate in pipeline for the calculated slope.
Flow rate = 13.5 gpm with 0.78 ft/100 ft of friction loss
13.5 gpm > 13 gpm; Flow does not balance, increase design flow rate at the last hydrant and repeat previous calculations until desired level of precision is obtained.
Balanced flow at “pump off” setting:
Flow = 13.3 gpmEnergy required at hydrant = 38.6 ftSlope of HGL = 0.7598 ft per 100 ft
Step 9: Draw HGL for high pressure setting
Draw line from Sta. 0+00, Elev. 4095.5 to Sta. 92+00, Elev. 4025.6 (see figure 11.4).
Step 10: Draw Static HGL
Draw horizontal line from Sta. 0+00, Elev. 4095.5 to Sta. 92+00, Elev. 4095.5 (see figure 11.4).
Step 11: Determine the pipe strength required for total operating pressure.
Total operating pressure is equal to the sum of the maximum static pressure and the maximum surge pressure.
Maximum static pressure is the distance from the Static HGL to the lowest point on the pipeline (see figure 9.4).
4095 . 5−39752. 31
=52 .2 psi
Determine maximum surge pressure by balancing hydrant flow at the hydrant closest to the well. Refer to previous steps for balancing process.
Utah LWPH June 2015
248

Maximum Q = 15.6 gpmConvert Maximum Q from gpm to cfs.
Maximum Q (cfs)=15. 6 gpm
448 . 8 cfsgpm
=0 . 0348 cfs
Determine cross-section area of pipe (ft2), refer to Utah LWPH, pages 5-7
thru 5-20 or calculate by: A=π
(d12)
2
4
A=0.0168 ft2
Calculate Maximum velocity
V=QA
=0 . 0348 cfs0 .0168 ft2
=2 .1 fps
Multiply velocity by surge factor multiplier, Table 2 Appendix A or, refer to Utah LWPH,Chapter 6.
Surge Pressure=2.1 fps×14 . 6 psifps=30 .7 psi
Calculate maximum operating pressure:Maximum Operating Pressure = Max Static Pressure + Surge Pressure Maximum Operating Pressure = 52.2 psi + 30.7 psi = 82.9 psi
Utah LWPH June 2015
249
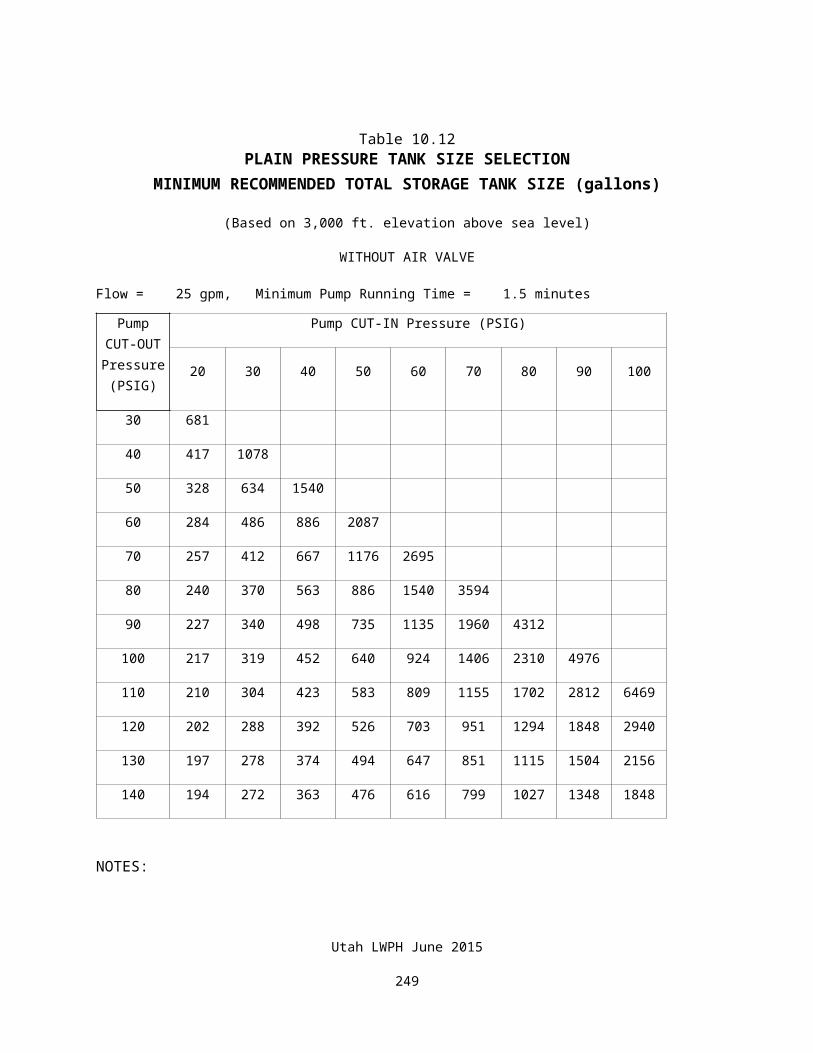
Step 12: Determine pressure tank size recommendation.
Refer to Utah LWPH, or calculate using the following formula:
V tank=Qavg⋅t
1−( Plo+14 . 7PHi+14 .7 )
Qavg=Qlo+Q hi
2=10+13 . 3
2=11. 7 gpm
t = 1.5 minutesPlo = 30 psiPhi = 50 psi
V tank=11. 7×1 .5
1−(30+14 .750+14 .7 )
=57 gal
Step 13: Determine where air relief valves are required (See figure 11.4.).
Use combination valve at the first summit: Sta. 6+21, Elev. 3985
Use Air/Vac valve at the critical point: Sta. 77+53, Elev. 4004
Utah LWPH June 2015
250
Figure 11.5Pumped Automatic Pressure System HGL PROFILE
Utah LWPH June 2015
251
Utah LWPH June 2015
252
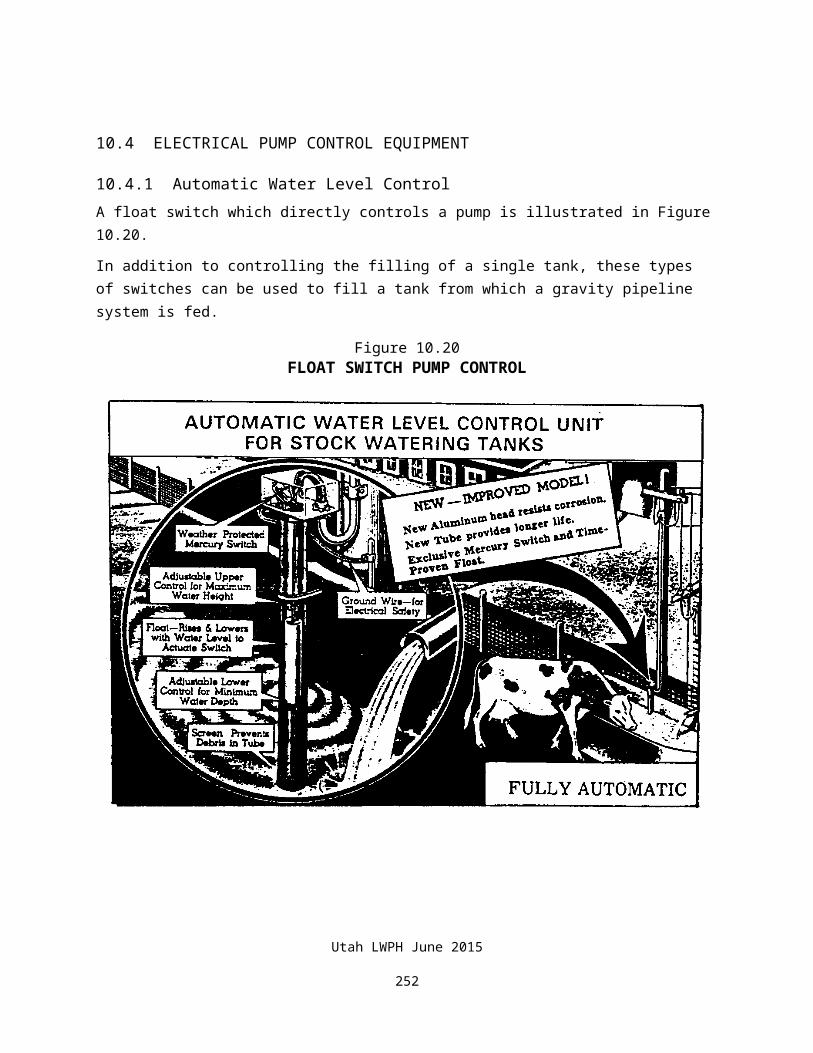
11.6 Example 4: Pipeline connected to Rural Water System.A note on system planning: It is important to involve the Rural Water District when planning connections to their service lines to ensure that all of their requirements are met, such as installation of sanitary check valves. Rural Water District Representatives can also test the location of the connection for pressure and capacity if the meter is already installed or estimate these values from nearby connections if it has not.
Prior to the design, a meeting was held with the producer and a representative of the Rural Water District. The following information was recorded:
Pressure at water meter: 38 psi
Estimated flow rate through meter: 8-10 gpm
Shut-off valve and Meter is installed, check valve is installed. No further requirements need to be met for the Rural Water District.
Planned Herd Size: 80 head of cow/calf pairs
Producer will rotate cattle every 5-8 days
Cattle are checked every 2 days
2 watering facility locations are planned with cross-fenced paddocks. Cattle will only be allowed access to one watering facility at a time.
Producer plans to install ¾” hydrants and galvanized steel tanks
Producer will install a ¾” hydrant at the hook-up for his own use
The pipeline was surveyed following the meeting with a Total Station survey instrument.
Step 1: Determine required water storage in pasture.
Determine the Herd Requirements:
80 head x 15 gal/head/day = 1,200 gal/day
(WLWPH Table 2.1)
Account for evaporation and spillage:
1,200 gal/day x 0.10 = 120 gal/day
(WLWPH Chapter 2 - 10% recommendation)
Utah LWPH June 2015
253
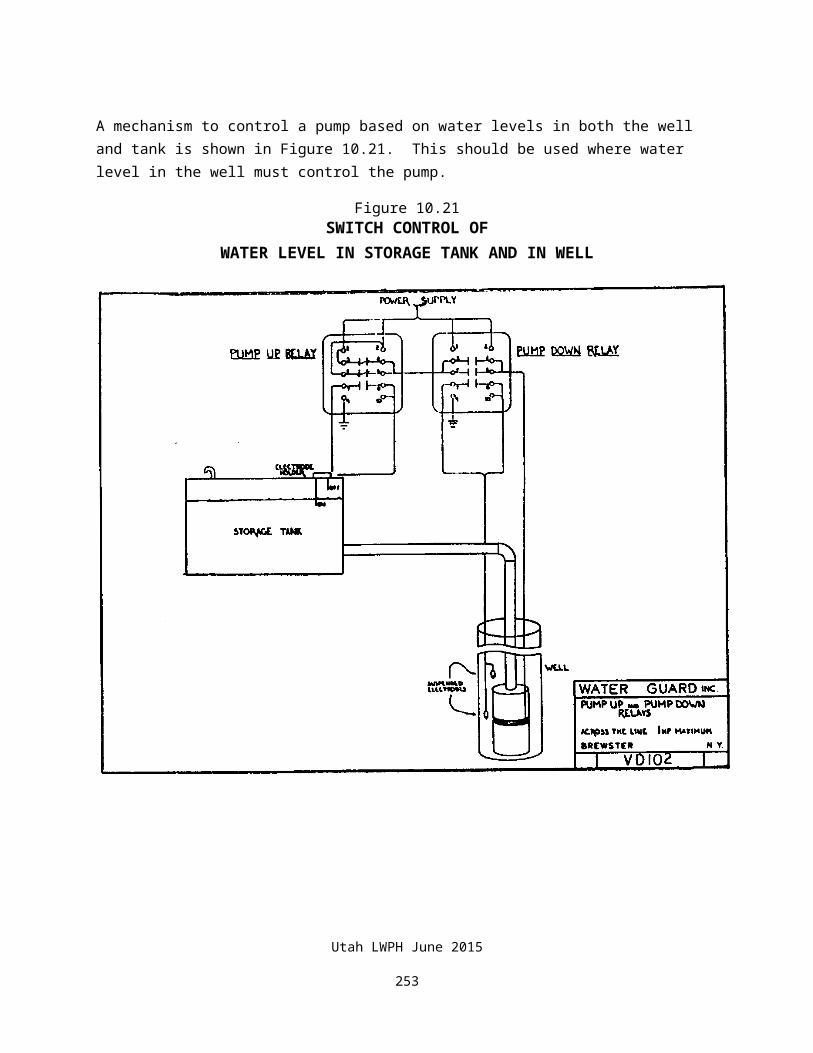
Total Storage Requirement:
1,200 gal/day + 120 gal/day = 1,320 gal/day
1,320 gal/day x 2 days storage =2,640 gallons
(equal to frequency livestock are checked)
Since cattle are only allowed access to one watering facility at a time, the minimum required storage at each watering facility is 2,640 gallons.
Step 2: Determine minimum tank size.
Minimum Tank Diameter can be determined if the required volume is known by using the following equation for cylindrical tanks:
Tank Depth for this example is a 2’ deep tank (standard for galvanized tanks), filled to within 3” of the top of the tank. This assumes that the tank is never “level full”. 2’-(3/12)’=1.75’
Use a 16’ nominal tank.
Note: The above diameter only applies if the producer is installing a cylindrical tank, such as a galvanized steel tank or a fiberglass tank. This diameter does not apply to rubber tire tanks.
Step 3: Determine required system flow rate for one day.
Utah LWPH June 2015
254
Tank Diameter=√Tank Volume5 .87×Tank Depth
Tank Diameter=√ 2,6405 .87×1 .75
=16 . 03 feet
Qreq=
1,320 galday
×1 day
6 hours×(60min1hour )
=3.67 gpm
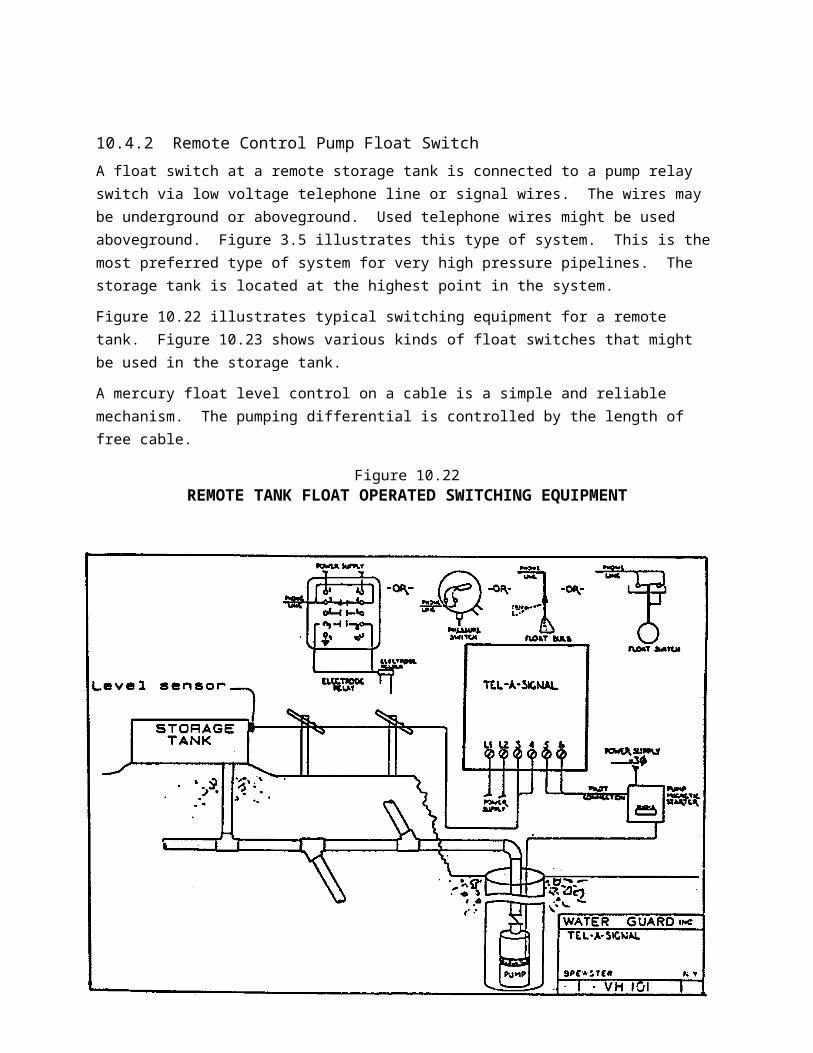
Choose an appropriate fill time by following guidance in Chapter 2, Utah LWPH. In this case, the recommended fill time of 6 hours is used.
Step 4: Pipeline survey and survey accuracy.
This pipeline was surveyed using a Total Station Survey Instrument. The error in the survey is less than 0.1 feet, and therefore no safety factor will be applied to this design.
Step 5: Plot the survey profile (see figure 11.5).
Coordinates needed for design are:
RWD Hook-up:STA 0+00, Elev. 104.4
Lowest point: STA 2+52, Elev. 92.4
Tank 1: STA 6+42, Elev. 99.1
Critical point: STA 19+02, Elev. 151.2
Tank 2: STA 23+17, Elev. 134.4
Step 6: Determine the Energy at the Pipeline Source
When connecting to rural water systems, it is very rare that pressure tanks are used. Most often, the pressure provided by the rural water district is adequate to service the pipeline. In this example, no pressure tank is used.
The energy at the source (hook-up to rural water) is best estimated by testing the static pressure at the connection. The pressure was tested at the water meter and was found to be 38 psi.
Convert the test pressure to feet of available water head:
38 psi×2 .31feetpsi
=87 .78 feet
Utah LWPH June 2015
255
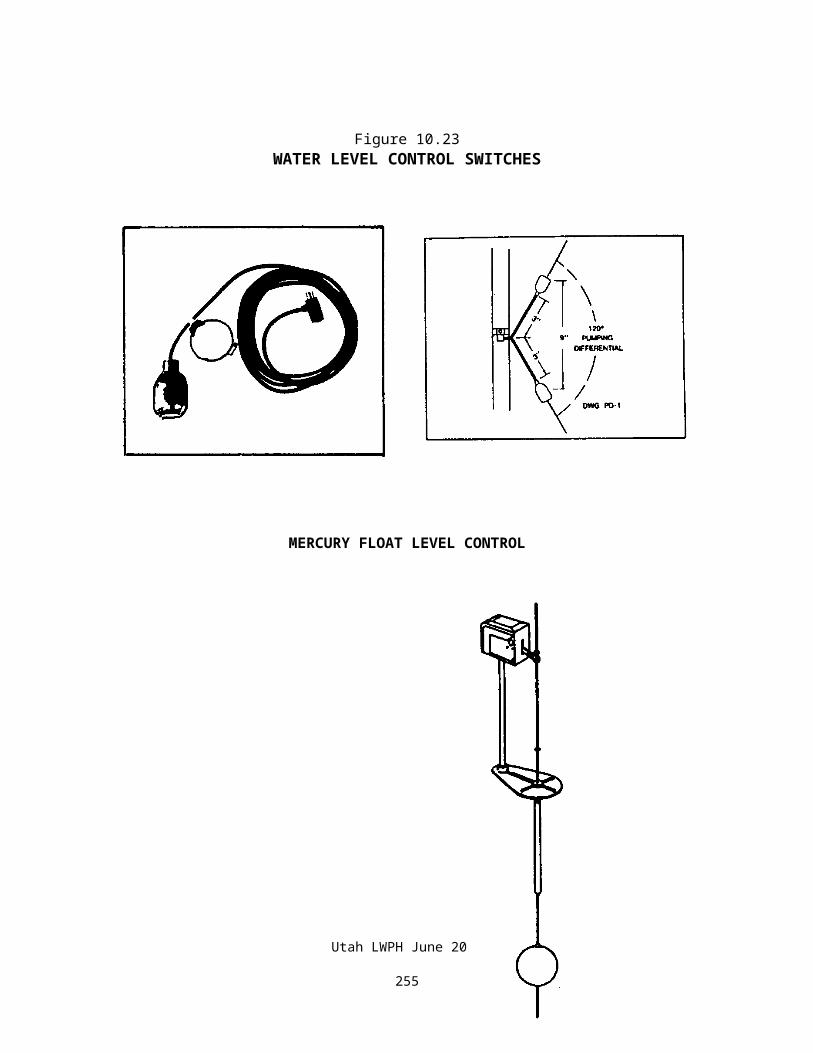
Add this value to the elevation of the hook-up to find the elevation of the Hydraulic Grade Line:
87.78 feet + 104.41 feet = 192.19 feet
Utah LWPH June 2015
256
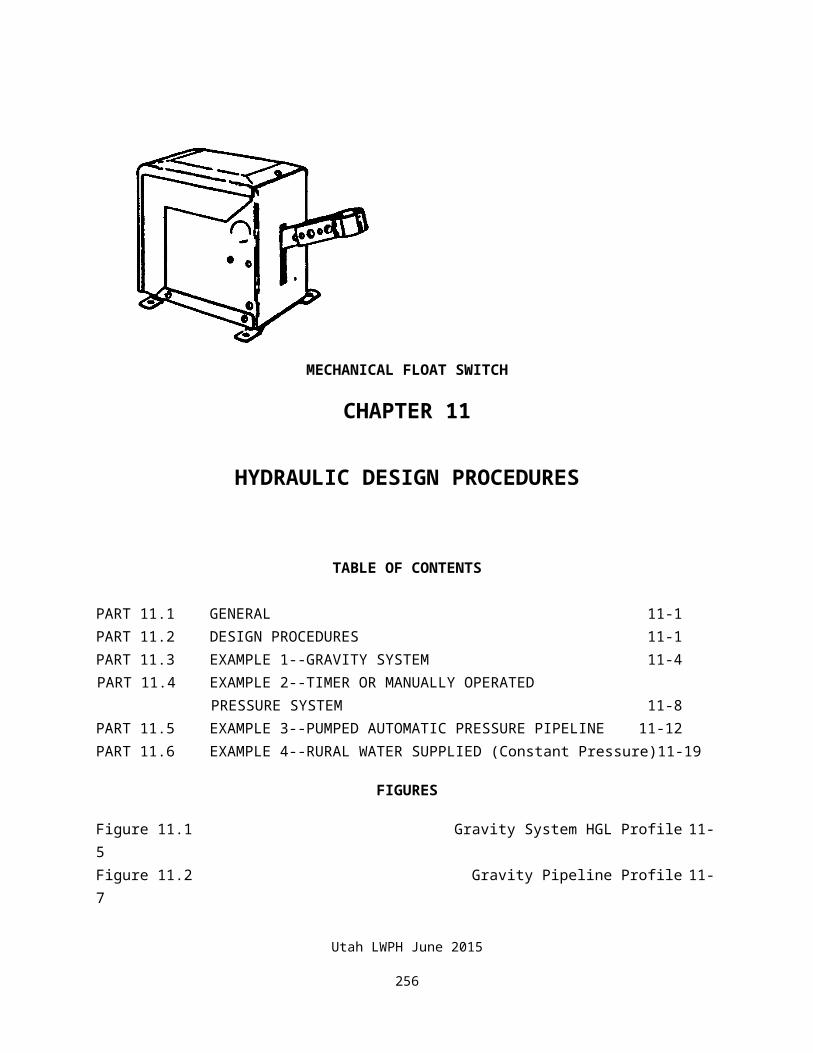
Step 7: Draw Hydraulic Grade Line
In order to draw the hydraulic grade line, the flow must be balanced at the critical tank location, which in this case, is Tank 2. A pipe material must also be assumed for the calculations. The initial assumption for this example is 1 ¼” SDR 26 PVC.
Trial 1:
Begin by guessing a flow rate. Since the required flow rate for this system is so small (4 gpm calculated in Step 3), the initial guess is higher. This is based on past experience.
Initial guess: Qhydrant = 10 gpm.
Determine the energy required at the hydrant to produce 10 gpm from a ¾” hydrant. Refer to Table 1 in Appendix A. From the Table, 10 gpm is achieved at a pressure of 5.3 psi (12.24 feet).
Calculate the slope of the hydraulic grade line for this trial.
Slope of HGL =Available Energy at Well−( Elev . of Hydrant+ Pressure at Hydrant )Distance from Well to Hydrant
Slope of HGL =192 .19 feet−(134 .4 feet + 12 .24 feet )2,317 feet
×100= 1.966 feet100 feet
Use Tables for friction loss in Chapter 5, Utah LWPH to determine the flow rate allowed through the pipeline with 1.966ft/100ft of friction loss.
From Table 5.2, SDR 26 PVC, 1.25”, Qpipe ~ 15.5 gpm
Qpipe > Qhydrant. Flow does not balance. Increase flow at hydrant (Qhydrant) and repeat calculation.
Trial 2:
Increase Qhydrant to 13 gpm.
Energy required at ¾” hydrant to produce 13 gpm is 11.7 psi (27.02 feet) from Table 1 in Appendix A.
Slope of hydraulic grade line:
Utah LWPH June 2015
257
Slope of HGL =192 .19 feet−(134 .4 feet + 27 .02 feet )2,317 feet
×100=1 .328 feet100 feet
From Table 5.2, SDR 26 PVC, 1.25”, Qpipe = 12.6 gpm
Qpipe < Qhydrant. Decrease flow rate at hydrant and repeat calculations.
Trial 3:
Decrease Qhydrant to 12.8 gpm.
Energy required at ¾” hydrant to produce 12.8 gpm is 11 psi (25.41 feet) from Table 1 in Appendix A.
Slope of hydraulic grade line:
Slope of HGL =192 .19 feet−(134 .4 feet + 25 .41 feet )2,317 feet
×100=1 .397 feet100 feet
From Table 5.2, SDR 26 PVC, 1.25”, Qpipe = 13.0 gpm
Qpipe ~ Qhydrant. Flow is balanced.
Check the critical point for adequate pressure, located at STA 19+02, El. 151.2.
Elevation of HGL at STA 19+02 =192. 19 feet - (1,902 feet×1 .397 feet100 feet )=165 . 62 feet
Pressure over critical point = 165.62feet -151.2feet= 14.42feet
14.4 feet (6.2 psi) is adequate pressure at the critical point for the accuracy of this survey. Note that if your survey requires using a safety factor in your design, the pressure at the critical point should be checked against the allowable safety factor for adequacy.
Draw the hydraulic grade line onto the survey profile (see figure 11.5) from STA 0+00, Elev. 192.19 to STA 23+17, Elev. 159.81.
Steps 8 and 9 do not apply.
Utah LWPH June 2015
258
Step 10. Draw the static grade line.
The static grade line is drawn as a horizontal line on the survey profile, starting at the elevation of available energy at the hook-up and ending at the last tank. A line is drawn from STA 0+00, Elev. 192.19 to STA 23+17, Elev. 192.19.
Step 11. Determine required pipe strength.
The maximum velocity in a system will occur at the hydrant closest to the meter. In this case, the producer plans to install a ¾” hydrant at the meter location. The potential pressure at the meter is 38 psi (as tested by the Rural Water District).
From Table 1 in Appendix A, a ¾” hydrant is capable of flowing 19.3 gpm at 38 psi. Since friction loss is negligible in such a short run of pipe, the flow will balance at the hydrant capacity. Therefore, Qmax=19.3 gpm.
To calculate surge pressure, solve for the maximum velocity.
V max=Qmax
Inside Area of Pipe
The area of 1.25” SDR PVC pipe can be found on Table 5.2, WLWPH; 0.0128 square ft.
V max=
19. 3gpm0 .0128 ft2 ×1 ft3
7 . 48 gal×1 min
60 sec=3 . 36 ft/sec
To calculate the surge pressure, multiply maximum velocity by the factor for surge in SDR 26 PVC in Table 2 in Appendix A.
Surge Pressure = Vmax x Surge Factor
Surge Pressure = 3.36 ft/sec x 14.6 psi/ft/sec = 49.1 psi
To determine the pipe strength required, add the surge pressure to the maximum static pressure in the pipeline. Maximum static pressure is found by subtracting the elevation of the lowest point in the pipeline survey from the elevation of the static grade line.
Utah LWPH June 2015
259
Maximum Static Pressure = 192.19 feet – 92.4 feet= 99.79 feet(43.2 psi)
Total Pressure Required = 49.1 psi + 43.2 psi = 92.3 psi
92.3 psi < 160 psi rated pipe strength of SDR 26 PVC, system checks.
Step 12 does not apply.
Step 13: Determine where air relief valves are required.
Use a combination valve just downstream of the meter, since the meter is at the first summit. Air may not be able to flow through the depression at STA 2+52, but will return back to the meter.
Use an Air/Vac valve at the critical point: STA 19+02, Elev. 151.2.
Locate these on the survey profile (see figure 11.5).
Additional Considerations:
Utah LWPH Chapter 6 recommends that pressure be limited to 80 psi at hydrants. Tank 1 is the lowest hydrant/tank in this system and should be checked for static pressure.
Elevation of Tank 1 = 99.1 feet
Elevation of Static Grade Line = 192.19 feet
Static Pressure at Tank 1 = (192.19 feet – 99.1 feet)/2.31=40.3 psi
Utah LWPH June 2015
260
40.3 psi < 80 psi, so hydrant at Tank 1 is okay.
Utah LWPH June 2015
261
Figure 11.6
Rural Water Supplied (Constant Pressure) HGL PROFILE
Utah LWPH June 2015
262
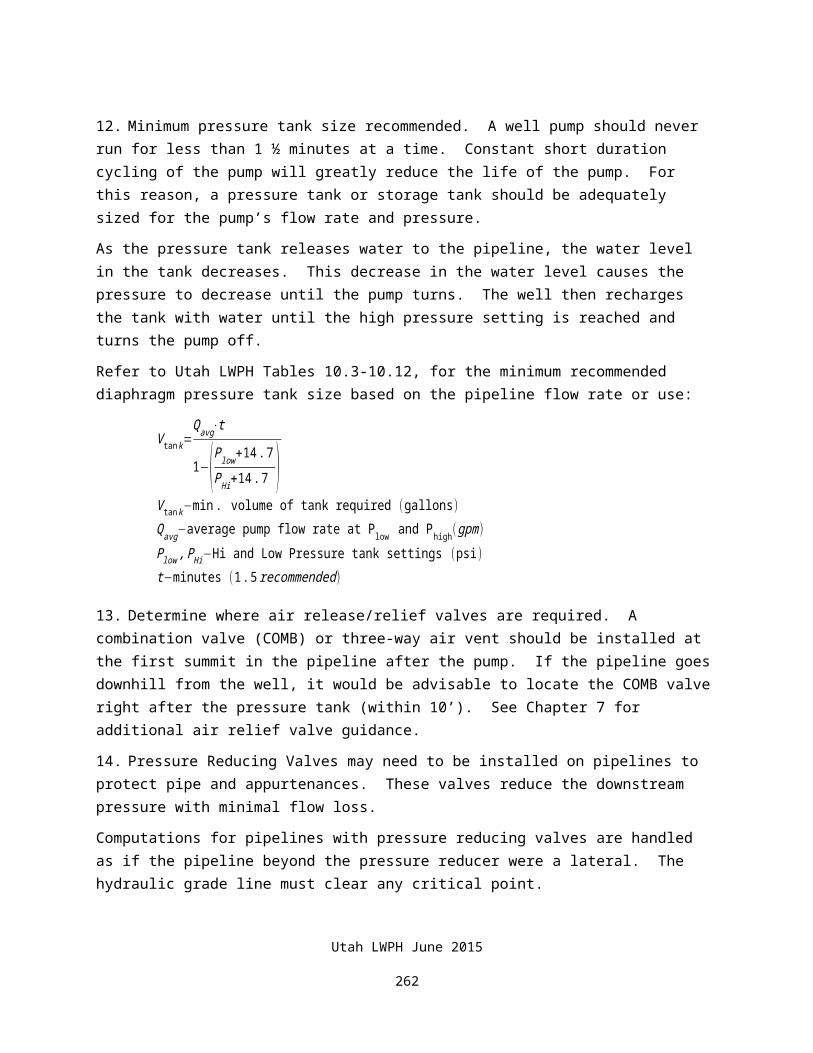
Utah LWPH June 2015
263
CHAPTER 12
STOCKWATER PIPELINE INSTALLATION
TABLE OF CONTENTS
PART 12.1 TRENCHING 12-112.1.1 Trencher Constructed Trench 12-112.1.2 Backhoe Constructed Trench 12-112.1.3 Plowing 12-112.1.4 Road Crossings 12-2
PART 12.2 PIPE JOINTS 12-4PART 12.3 INSPECTION DURING CONSTRUCTION 12-4PART 12.4 MEASUREMENT FOR PAYMENT 12-4
FIGURES
Figure 12.1 Water Bar 12-3
Utah LWPH June 2015
264

CHAPTER 12 -- STOCKWATER PIPELINE INSTALLATION
12.1 TRENCHING
12.1.1 Trencher Constructed TrenchesWhen conditions permit, trenching for pipelines which are buried from 5 to 6 feet are usually done with a narrow 4-to 6-inch wide chain trencher. Where there is little gravel and the ground is not too wet, these trenchers bring up well pulverized soil that makes good backfill material. The material is usually placed back in the trench with a trencher mounted blade. Where rocks are not present, any of this material may be backfilled directly around the pipe.
There is no practical way to compact the fill in these narrow trenches. Within two to five years, the backfill material will usually consolidate to the maximum extent. There will be low spots in the trench backfill when the material consolidates. These can be a hazard to livestock, humans, and equipment and are frequently a starting point for gully erosion.
There are three things that should always be done to minimize these problems:
1. Make it clearly understood by the landowner that maintenance of the backfill may be necessary each year for several years. This maintenance will consist of adding fill to low spots and repairing any erosion that may occur.
2. When backfilling, mound the soil over the trench to the maximum extent possible.
3. Construct "water bars" at right angles to the trench at periodic intervals. These are simply very small diversion dikes across the trench at locations where the trench is traveling up or down the slope. The purpose of these diversions is to prevent concentration of water in the trench and erosion of the backfill. Figure 10.1 illustrates a water bar.
12.1.2 Backhoe Constructed TrenchBackhoe trenches are usually a minimum of 12 inches wide. The material frequently comes out of the trench as clods, large chunks, and rocks.
It is important to backfill immediately over the pipe with 4 to 6 inches of soil that is free of large rocks and clods. This can sometimes be done by carefully selecting from the excavated material.
If adequate excavated material isn't available, then material such as sand or fine gravel should be imported and placed around the pipe to a depth of 4 to 6 inches over the top of the pipe.
12.1.3 PlowingPlowing, or Ripping, is a trenchless method for installing plastic pipe. It is a multi-stage process consisting of positioning a vibrating or static (non-vibrating) plow equipped with a trailing product guide which feeds pipe to the depth setting of the plow as it moves forward. The pipe is inserted into the ground continuously along a predetermined path and depth.
Utah LWPH June 2015
265
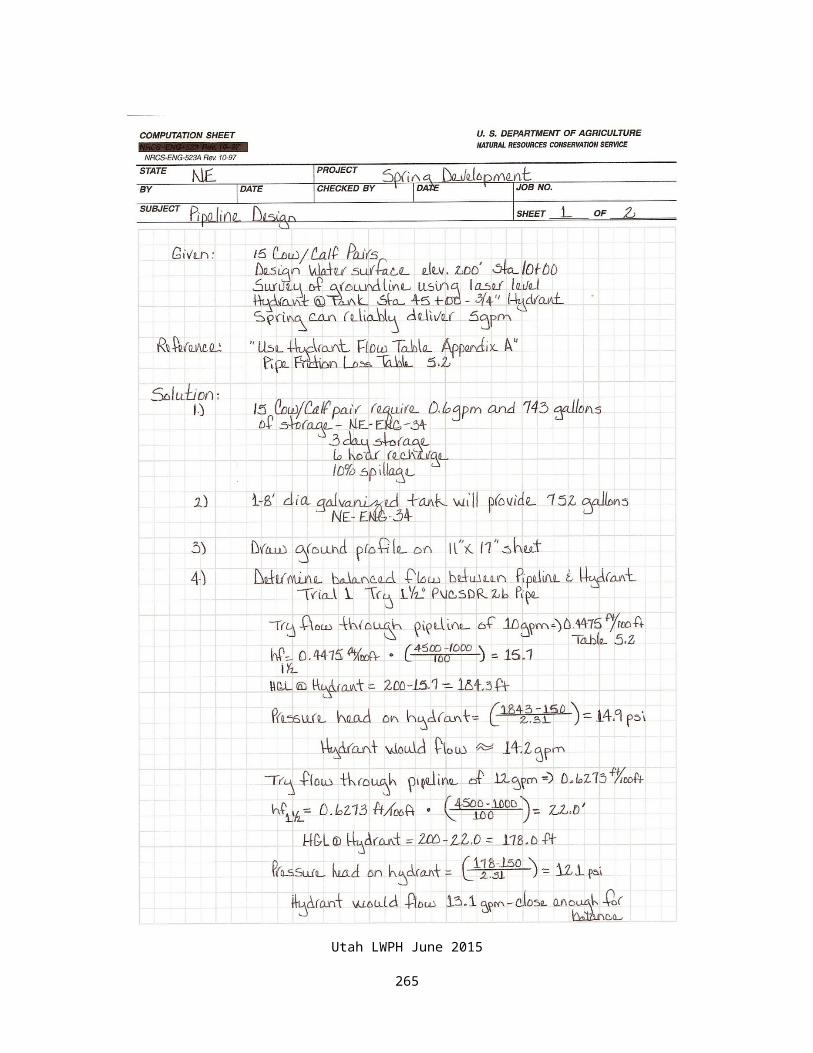
The vertical depth of installation is controlled by two factors, hydraulic adjustment of the plow shear head and the surface contours. The depth of insertion must be continually adjusted to compensate for changes in terrain.
The selection of tracked or wheeled prime movers and their relative size for pipe plows depend on several factors:
- Local site conditions along the planned route
- Desired rate of pipe placement - Burial depth of pipe: while company guidelines should take precedence, the general recommendation for plow prime mover horsepower rating is a minimum of 50 horsepower per foot of buried depth.
- Terrain variance: presence of steep slopes, sand, heavy woods, etc., all of which affect how well a vehicle will move.
General Guidelines:
- A ripping pass to the depth required is desirable and should be made before plowing in the pipe to make sure the route is clear between splice locations. The ripping pass is made in the same direction that the pipe is to be plowed. In some situations, it may be necessary to make more than one ripping pass, or to rip deeper than the required depth.
- Always start the plow tractor’s movement slowly and gradually increase speed after all pipe slack is taken up from the pipe delivery system.
- Plow attitude and depth must be changed gradually. Such changes should be made only while the plow’s prime mover is under way.
- Grade off abrupt changes in terrain along the pipe path ahead of the plow.
- Plowing operations must be observed continuously for obstructions, proper feeding of the pipe, proper depth, following the marked route, and safety of the crew.
- Stationary operation of a vibratory plow for excessive periods of time can damage the pipe through kinking or abrasion. If an obstacle is encountered, shut off the vibratory plow and excavate the pipe to expose and remove the obstacle.
12.1.4 Road CrossingsAll backfill material must be adequately compacted at road crossings. It may be easiest to import sand or fine gravel to fill the trench at road crossings. Rodding and hand tamping can be used to consolidate this granular material. Saturating the material will assist in compaction.
Utah LWPH June 2015
266
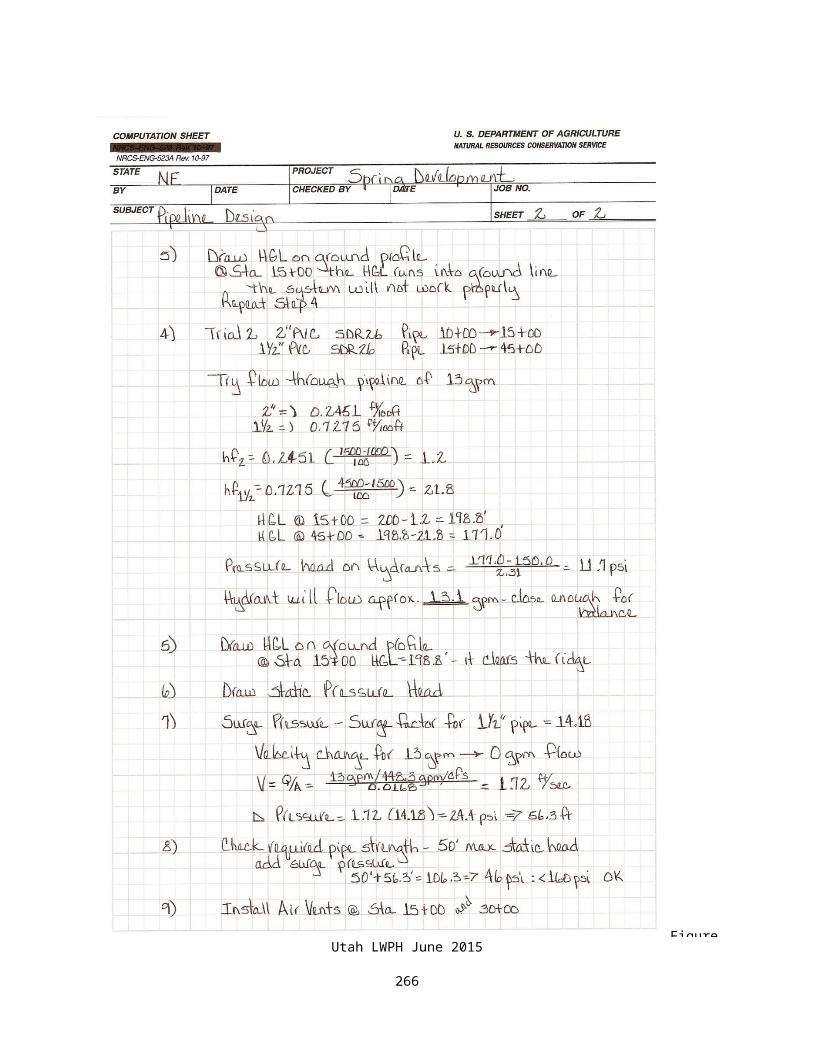
Figure 12.1WATER BAR
Utah LWPH June 2015
267

12.2 PIPE JOINTSExperience has shown that the most common cause of pipeline failure is joint failure. Particular care must be taken to make joints in the manner specified in the specifications and as recommended by the manufacturer. Only materials approved for use with the specific type and rating of pipe must be used.
Polyvinyl chloride (PVC) and other rigid plastic pipes are usually joined using glued joints. Only solvents and glues designed for the specific plastic type must be used. A solvent cleaning and preparation process should always be done if recommended. Connections must be to full depth into fittings.
Polyethylene and other flexible plastic pipe are often connected with "stab" joints. Stab joints must be properly clamped. Two stainless steel band clamps are recommended per joint. Snaking the pipe in the trench helps keep pipe from pulling apart.
Plastic pipe connected together and placed in a trench while warm will contract as it cools off. This can pull joints apart and is the reason that care should be taken to place pipe when it is cool or allow for the contraction by snaking or other means. Backfill should never be placed when the pipe is warm.
Plastic becomes brittle when cold. The amount of brittleness will depend on the material. Pipe should not be handled or backfill placed when the weather is significantly below freezing.
12.3 INSPECTION DURING CONSTRUCTIONFrequent inspection during construction of stockwater pipelines cannot usually be performed by the NRCS. We should make a point though to view each contractor's work while pipe is actively being laid at least once during the construction season. If there are an unusual number of problems occurring from job to job, then more frequent visits must be made. We must provide enough inspection to assure ourselves that pipe is being installed in accordance with the drawings and specifications.
A good way to get more inspection is to enlist the aid of the landuser. The landuser has a vested interest in seeing that a good job is being done. Spending some time with the landuser explaining exactly what to look for during construction can pay big dividends.
12.4 MEASUREMENT FOR PAYMENTContractors usually keep track of the number of pipe lengths that are installed and then base their measurement of the installed length of pipeline on the total pipe lengths counted. The laid length is not the same as the total of nominal pipe lengths. Pipe section lengths are not consistently the same, and there are length differences caused by couplings and fittings. Damaged or broken sections are also sometimes included.
The final payment length should always be measured when the pipe is in place. Frequently this is done with a measuring wheel. Sometimes a tape or chain is used. If a wheel is used, measurements should always be run up the line and then back again. If the two measurements
Utah LWPH June 2015
268
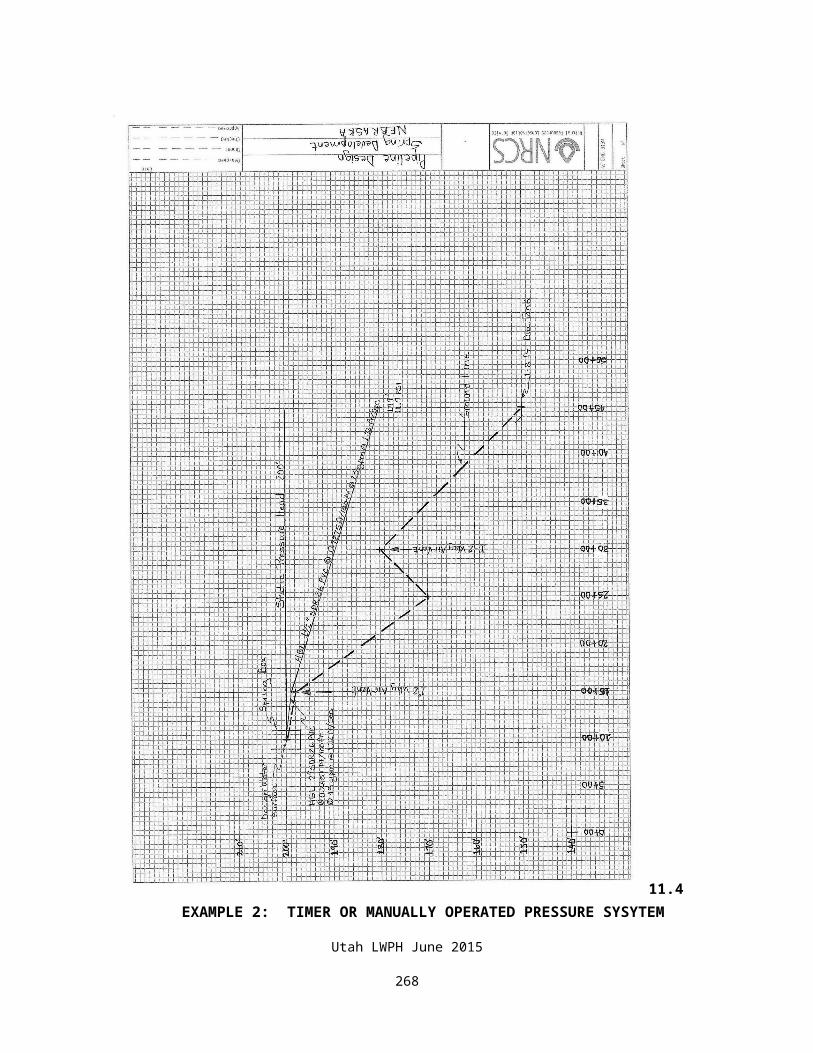
do not agree within two percent, the length should be re-measured. The pipeline total should be the average of at least two measurements. If a contractor's measurements are accepted, it should be on the basis of actual measurement, not a count of pipe sections.
Utah LWPH June 2015
269
CHAPTER 13
OPERATION AND MAINTENANCE
TABLE OF CONTENTS
PART 13.1 GENERAL 13-1PART 13.2 WINTERIZING 13-1PART 13.3 OPERATION AND MAINTENANCE PLAN 13-1
FIGURES
Utah LWPH June 2015
270
CHAPTER 13 -- OPERATION AND MAINTENANCE
13.1 GENERALA stockwater pipeline and the associated tanks and equipment can soon fall into disrepair if not properly operated and maintained. A properly constructed stockwater pipeline should last in excess of 20 years if adequate operation and maintenance are performed.
13.2 WINTERIZINGShallow pipelines must be drained during winter months to prevent freezing. The importance of draining the line in a timely manner must be emphasized to the landuser. Even small pockets of water in low areas can cause damage to the pipeline.
Where a pipeline has many small undulations, it may be possible to minimize the number of drain locations required by blowing the line out with compressed air. Drains will then only be needed at major low areas. Facilities for connecting an air compressor to the line must be installed. The air compressor must have enough volume to properly blow out the line. Pressure on the pipeline must be regulated to not exceed the pressure rating of the pipe. The air should be run through the line long enough to evacuate small remaining amounts of water that will flow back into low areas after the air is removed. All of this should be specified in the operation and maintenance plan.
13.3 OPERATION AND MAINTENANCE PLANAn operation and maintenance plan should be prepared for all stockwater pipelines and discussed with the landuser. The life of this installation can be assured and usually increased by developing and carrying out a good operation and maintenance program. Operation and maintenance (O&M) is necessary for all conservation practices and is required for all practices installed with NRCS assistance. The landuser is responsible for proper O&M throughout the life of the practice.
The O&M Plan should comply with all laws, regulations, ordinances, and easements; in such a manner that will result in the least adverse impact on the environment and assure the practice will serve the purpose for which it was installed. Maintenance includes work to prevent deterioration of the practice, repairing damage, or replacing components, which fail.
An Operation and Maintenance Plan should include:
Utah LWPH June 2015
271
1. Yearly inspection of the entire length of the pipeline for any signs of leaks or pipe damage.
2. Checking for settlement in the trench backfill when the material consolidates. These can be a hazard to livestock, humans, equipment, and are often a starting point for gully erosion in the trench. This settling may occur for many years after construction. The settled areas in the trench should be refilled, and any subsequent erosion repaired.
3. Checking to assure all valves and air vents are set at the proper operating condition so they may provide the needed protection to the pipeline.
4. Maintaining the design depth of cover over the pipeline and backfill around structures.
5. Limiting traffic over shallow buried pipelines to designated sections that were designed for traffic loads. Avoid travel over shallow buried pipelines by tillage equipment when the soil is saturated.
6. Avoiding any subsoiling operation that may disturb the pipeline.
7. Checking exterior coatings on aboveground and on-ground pipeline installations and repairing any damage immediately.
8. Maintaining vigorous growth of vegetative coverings. This includes reseeding, fertilization, and application of herbicides when necessary. Periodic mowing or planned grazing may also be needed to control height.
9. Removal of all foreign debris that hinders system operation.
10. Draining the system and components as needed in areas that are subject to freezing. If parts of the system cannot be drained, an antifreeze solution may be added.
Utah LWPH June 2015
272
11. Repairing any rodent, burrowing animal, vandalism, vehicle, or livestock damage.
12. Where sacrificial anodes are used for cathodic protection, checking their condition on a regular basis and repairing or replacing as necessary.
13. When there are unique or critical factors associated with a system, a supplemental or special operation and maintenance plan should be provided.
Utah LWPH June 2015
273

APPENDIX A -- Worksheets
Utah LWPH June 2015
274
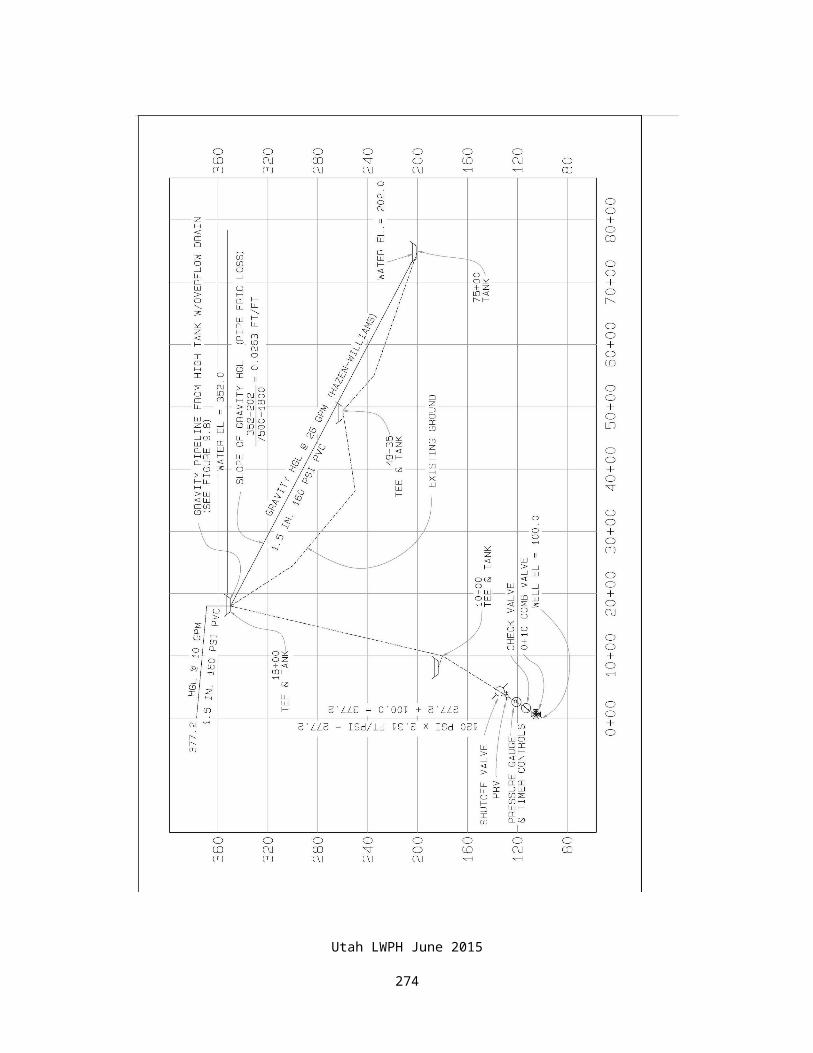
U.S. Department of Agriculture UT-ENG-20
Natural Resources Conservation Service
STOCKWATER PIPELINE RESOURCE INVENTORY WORKSHEET
Land user___________________________ Field Office _______________________________________
Job description________________________________________________________________________
Location_____________________________________________________________________________
Planner ____________Date ____________Checked by________________ Date __________________
Type of livestock ______________________________________________________________________
Type of grazing system: Conventional____ Intensive____
Maximum number of livestock and wildlife (No.) ___________________________________________
Typical dates stock will be in field: From _______ to ______
Water requirements per head (V) _______ gal/day/head at peak use.
Total usage per day (T) = No. x V =_______ x______ = _____ gal/day.
Utah LWPH June 2015
275
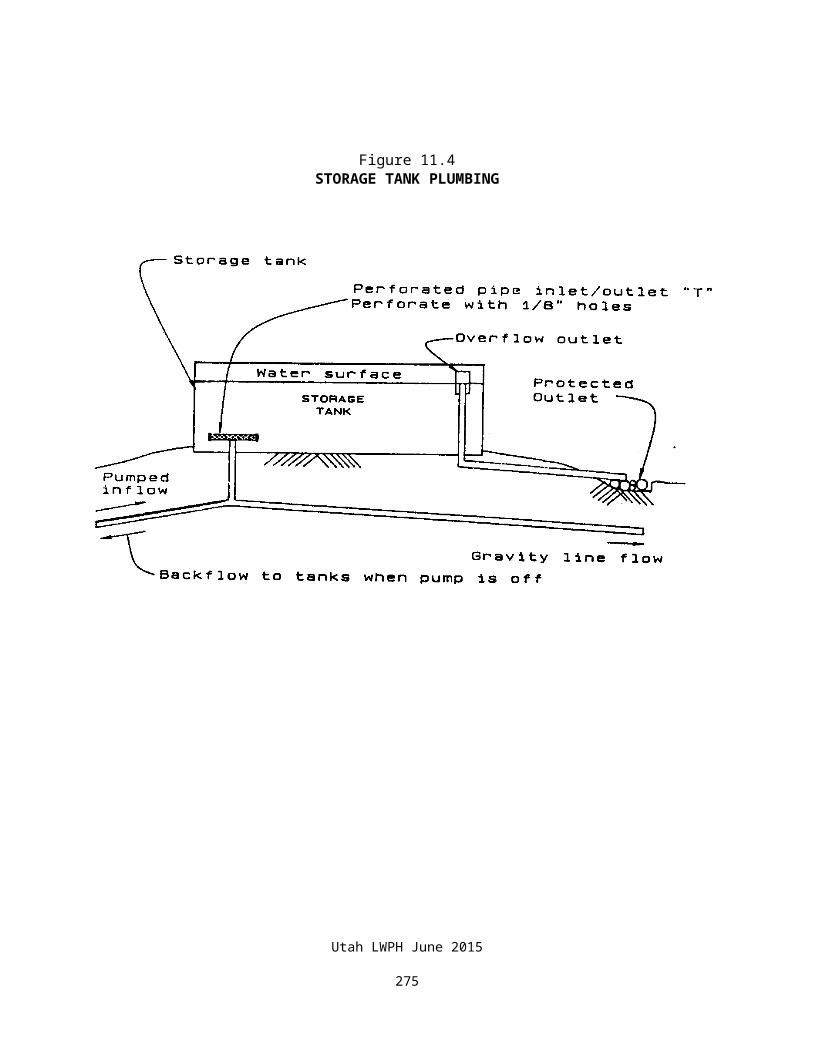
Add 10% for evaporation and spillage: (GT) = T x 1.1 (optional) GT = _______ x 1.1 = _____ gal/day
Minimum required flow rate (Qm) = GT/1440 = _______ gpm
Desired number of hours for entire days needs to be delivered:
TOT (Total Operating Time/Day) =_______________hrs.
Design Flow Rate: (Q) = 24/TOT x Qm
Q= 24/_____ (TOT) x ______(Qm) =__________gpm
Desired reserve storage time (RST) _______ = days
Total reserve storage required: (RS) = RST x GT
RS =_______ x _______= _______ gallons total storage in pasture.
Other water sources available in the field:___________________________________________________
Dependability of water sources ___________________________________________________________
Quality of water sources ________________________________________________________________
Comments: __________________________________________________________________________
Utah LWPH June 2015
276
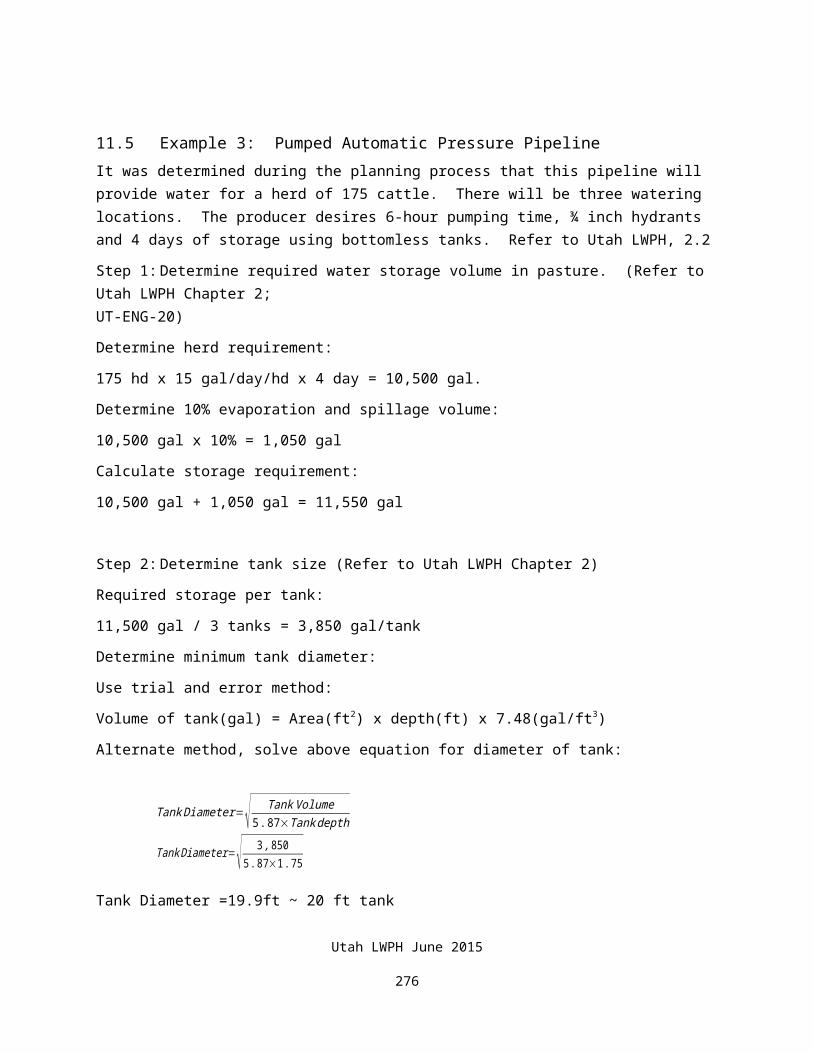
Utah LWPH June 2015
277
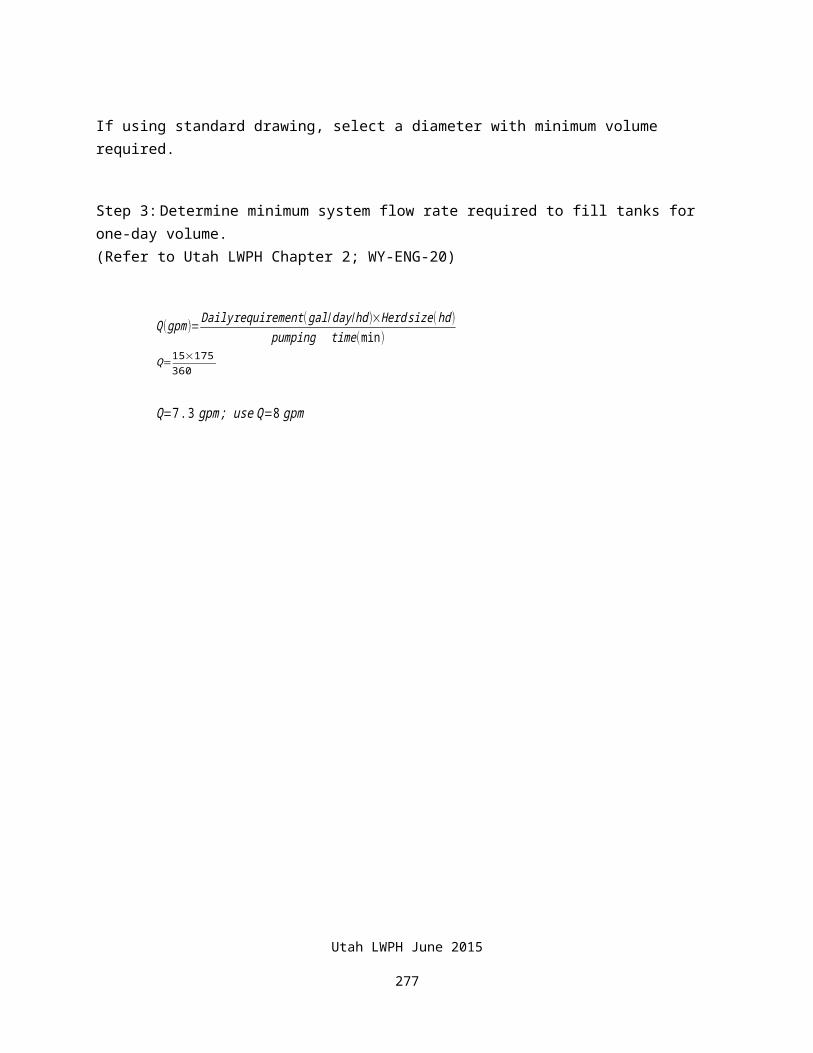
APPENDIX B -- COMPUTER PROGRAMSInstructions and examples for the Utah Livestock Water and Pipeline Handbook will be added at later date.
Utah LWPH June 2015
278
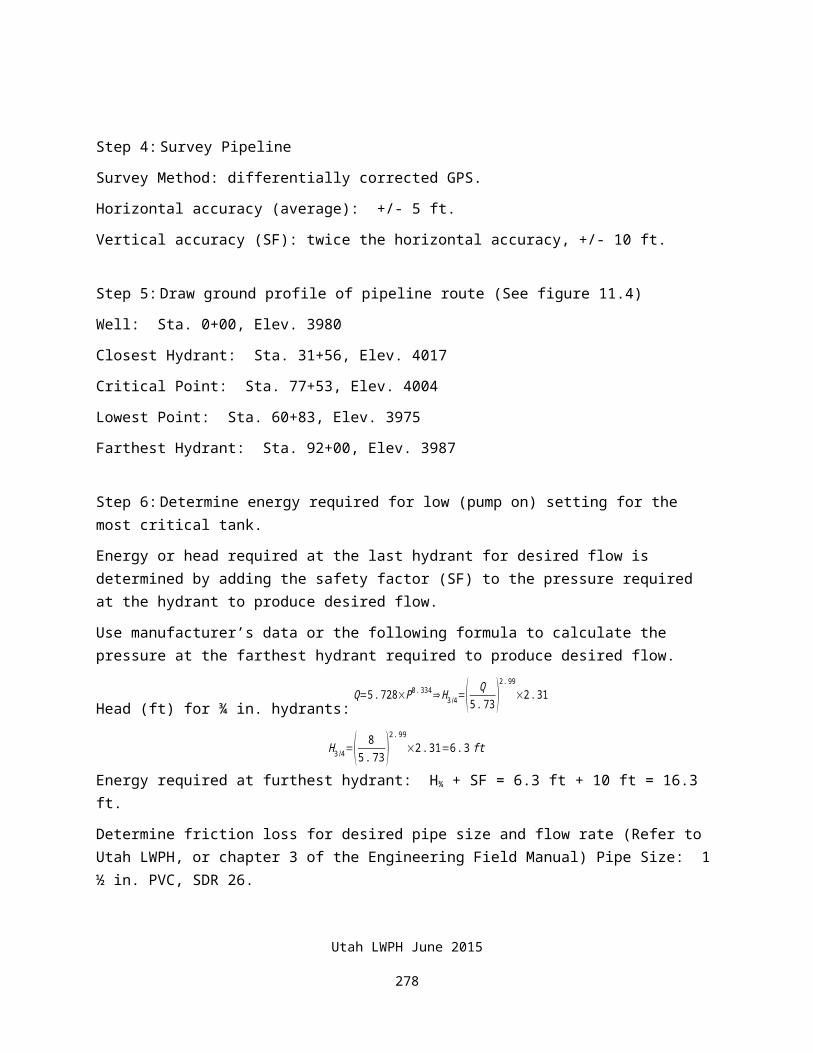
APPENDIX C -- MATERIALS SOURCES
Material Source information for the Utah Livestock Water and Pipeline Handbook will be added at later date.
Utah LWPH June 2015
279


![[Pipeline] Inspecting Pipeline Installation](https://img.pdfslide.net/doc/110x75/55cf8d045503462b1391543e/pipeline-inspecting-pipeline-installation.jpg)