Embed Size (px)
Citation preview

UTICA Summit IV Canton, Ohio
Petrochemicals and More: Sustainable Benefits of Utica Energy
October 11, 2016
Downstream Economics Joe Eddy, President/CEO
Eagle Manufacturing Company

WhygrowthofGas,OilandCoalaresoimportanttoourfuture
WhyalltheHypeaboutShaleGas?
3Source:EIAAnnualEnergyOutlook2014
(Trillio
nCu
bicFeet)
History2014ProjecHons
25%Increasewith
50%ofTotalIn2030From
AppalachianShaleGas

Marcellus,U@caandDevonianShaleunderlieouren@rearea(sodoothershaleforma@ons!!!!)Devonianat2000to5000’deepMarcellusat5000to7000’deepU@caat8000to9000’deep
AppalachianBasin

MarcellusRegionGasProducHonGrowth
• 2007at1.2BCFD• 2016atover18BCFD• 2020projover20BCFD• NGLnowover450,000Bbl/day• Drilling,FrackingTechniquesImprove• ReservoirDefini@onImproves(oil/gas)
MarcellusShaleIQImproves• AvgProduc@vity/WellIncreasing• 2011at2MMCFD,2016at12MMCFD• LongerLaterals=MoreFracStages• ProlificWellstes@ngover20MMCFD• ReturnonInvestmentImproves(pricing)• InfrastructureBuildoutCon@nues
U.S.EnergyInforma@onAdministra@on|DrillingProduc@vityReport

Ohio’sUHcaRegionGasProducHonGrowth
UHcaShaleIQImproves
• 2012Produc@onat160MMCFD• [email protected]• [email protected]• Drilling,FrackingTechniquesImprove• ReservoirDefini@onImproves(oil/gas)
• AvgProduc@vity/WellIncreasing• 2011at1.0MMCFD,2016at8MMCFD• LongerLaterals=MoreFracStages• ProlificWellsTes@ngover50MMCFD• ReturnonInvestmentImproves
U.S.EnergyInforma@onAdministra@on|DrillingProduc@vityReport
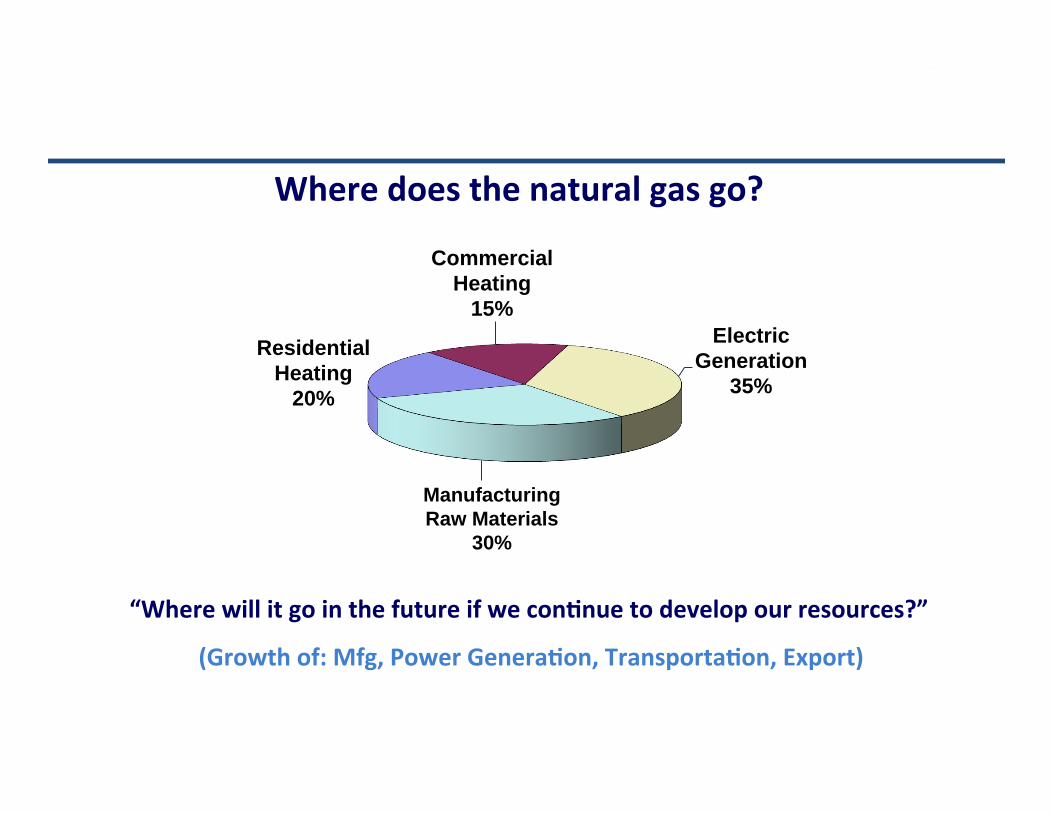
Wheredoesthenaturalgasgo?
Residential Heating
20%
Commercial Heating
15% Electric
Generation 35%
Manufacturing Raw Materials
30%
“WherewillitgointhefutureifweconHnuetodevelopourresources?”
(Growthof:Mfg,PowerGeneraHon,TransportaHon,Export)

Dry Gas
Methane
Consumers or Industry Gas Processing Plant
Wellhead Gas
Wet Gas
NGL Fractionation & Storage
LPG Light Naphtha (pentanes)
Pipeline Distribution System
Ethane NGLs Ethane
Propane Butane Pentane
Cracker
Shale Gas Value Chain – The Downstream Segment
• The Midstream buildout positions the basin for Downsteam Development

The Midstream Segment – Fractionating NGL’s Creating Opportunity for Downstream Expansion
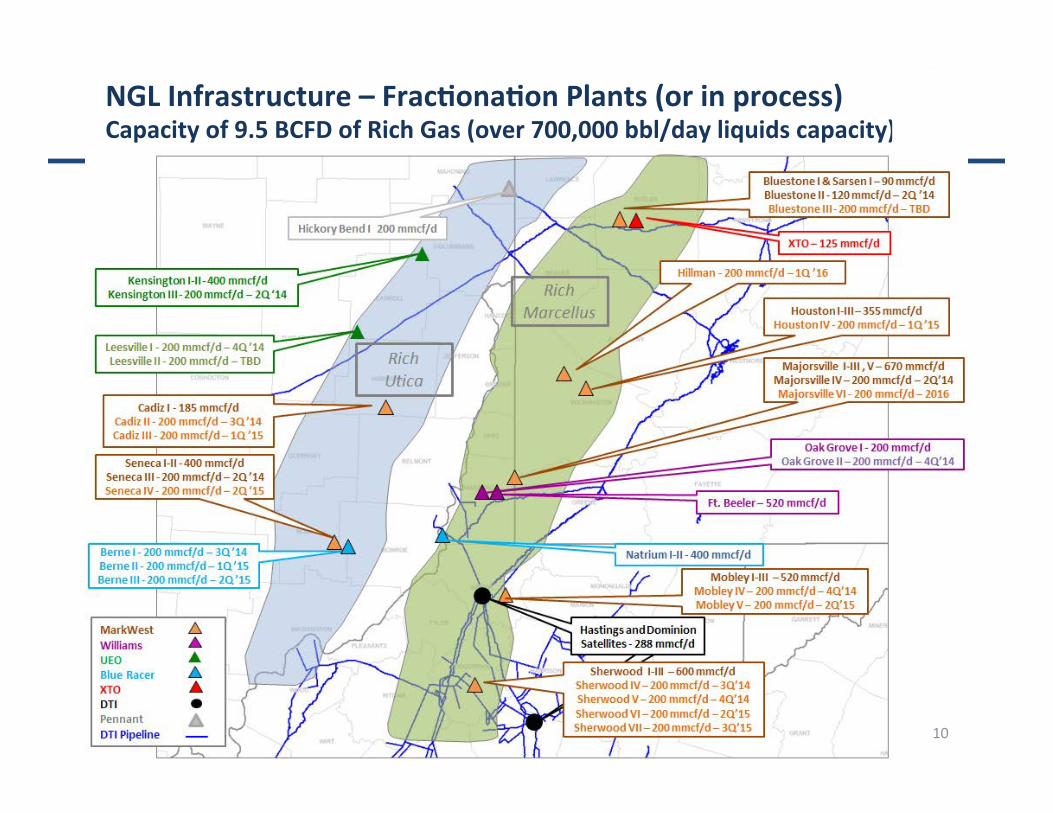
NGLInfrastructure–FracHonaHonPlants(orinprocess)Capacityof9.5BCFDofRichGas(over700,000bbl/dayliquidscapacity)
10

11
EthaneBalance–Only3thingstodowithEthane1.MoveawaybyPipeline(below)2.RejectintoGas(BTU),3.Consumeitlocally–Crackit

12
INEOSInsight–1of8newDragonClassshipsmoving27,000cubicmeterseach(226Mbbl)EthaneFromMarcusHookTerminalto2IneosCrackersinNorwayandSweden(3800miles)(SunocoLogis@csMarinerEastpipeline300milesfromWesternPA,extintoOhio)

13
PTTGlobalChemical
ShellChemical
ProposedAppalachianStorageHubPipelineRoute(methane,ethane,ethylene,propane,propylene,chlorine)
RegionalExtrac6on-Consump6onStrategy
BraskemASCENT
KanawhaValley
Canton

14
ShellChemicalPetrochemicalComplex–SiteWorkMonaca,PA($7.0BillionInvestment)
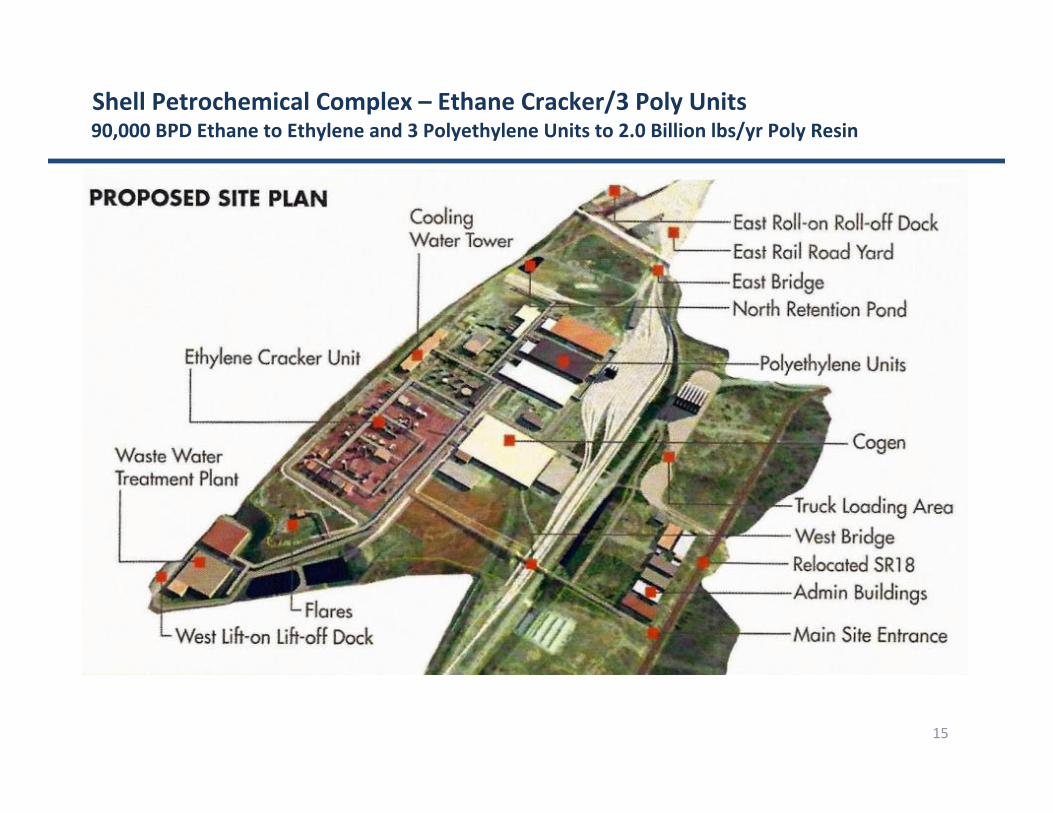
15
90,000BPDEthanetoEthyleneand3PolyethyleneUnitsto2.0Billionlbs/yrPolyResinShellPetrochemicalComplex–EthaneCracker/3PolyUnits

Dry Gas
Methane
Consumers or Industry Gas Processing Plant
Wellhead Gas
Wet Gas
NGL Fractionation & Storage
LPG Light Naphtha (pentanes)
Pipeline Distribution System
Ethane NGLs Ethane
Propane Butane Pentane
Cracker
Shale Gas Value Chain – The Downstream Segment
• The real “Value Proposition” keeping the ethane here and cracking it into ethylene

Ethane Cracker Plant (also cracks propane and butane)

Nat
ural
Sha
le G
as
Ethane
Methane
Propane
Butane
Ammonia
Methanol
Ethylene
Propylene
N-Butylene
Isobutylene
Market Sectors
Apparel and Accessories
Beverages and Tobacco Products
Chemicals
Computer and Electronics
Fabricated Metal Products
Food and Kindred Products
Leather and Allied Products
Machinery, Except Electrical
Nonmetalic Mineral Products
Paper
Petroleum and Coal Products
Pharmaceuticals
Plastics and Rubber Products
Primary Metal Manufacturing
Printed Matter and Related Products
Textile and Fabrics
Textile Mill Products
Transportation Equipment
Wood Products
Product Categories
Fertilizers
Adhesives
Alkyd Resins
Solvents
Corrosion Inhibitors
Textiles
Inks, Adhesives
Shampoos, Detergents, Soaps
Paints
Coatings
Pipes, Hoses, Wire Coating
Coolant, Antifreeze
Films, Packaging, Bottles
Paint Remover
Plastics
Tires and Rubber
Lubricant Additives
Solvent, Industrial Cleaners Source: PwC and TopLine Analytics
Shale Gas Value Chain-Downstream
• Ethane, Propane, Butane downstream of cracker • Focus on Ethane to Ethylene to Polyethylene Stream
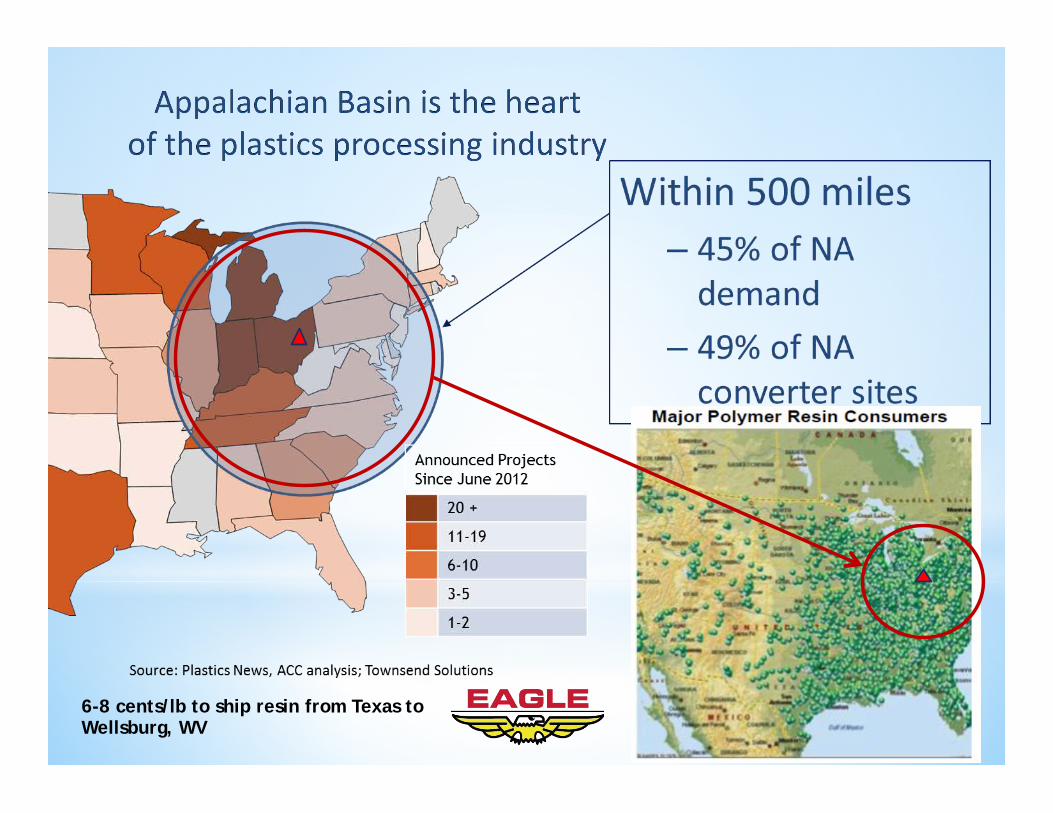
6-8 cents/lb to ship resin from Texas to Wellsburg, WV

Tri-StateShaleSummit• Government
– DOE(NETL)– StateofWestVirginia
October 13, 2015
ProposedEthaneDemand/EthyleneSupply(Crackers)
Canton
100MileRadius 80%

North American HDPE Capacity with announced additions
Source: IHS Chemical
Current NA HDPE Capacity = 20 Billion lb/yr Total HDPE Additions = 7 Billion lb/yr

N/A Poly Resin Capacity Increase by Company (Current N/A PE capacity = 44 B lbs = 20M Mt)
Source: IHS Chemical
Added capacity will support, secure & stabilize plastics processing industry growth

HDPE Pricing vs. Feedstock Pricing
Source: IHS Chemical
Poly Prices remain stable with nat gas, ethane and ethylene remaining low, supporting cracker margins and economics, especially if converting ethylene to polyethylene at same plant (ethane 2010 at $.90/gal, 2016 at <$.15/gal)

Downstream - Plastics Processing Industry
Resin Suppliers
Acetal – Acrylics
ABS – Alkyds Alloys – Blends
--------------------------------
Polyethylene --------------------------------
Barrier Resins Cellulosics
Diallyl Phthalates Engineered Plastics
Epoxies Fluoropolymers
Melamine Nitrile Resins
Nylon/PVC/Urea Silicone/Phenolics
Polycarbonates Polyester/Polystyrene
Polypropylene Polyurethanes
Additive Suppliers
Accelerators Antistats
Antioxidants Blowing Agents
Colorants Conductive
EMI Shielding Filters
Flame Retardants Inhibitors Lubricants Plasticizers Stabilizers
Processors
Custom Captive
Rotational Molding Injection Molding
Blow Molding Structural Foam IM
------------------------------- Blown / Cast Film
Coaters Pultrusion
Thermoforming Calendering
Compression Molding Reaction Molding Transfer Molding
Distributors Compounders Direct Sales
Enduser Market Home Indust Gov Export
Industrial Safety Environmental
Building & Construction Material Handling
Agricultural ------------------------------------------------------------------------------------
Appliances Auto/Transportation Telecommunications
Computers/Electronics/Elect Furniture
Food Processing Recreation/Toys Textiles/Flooring
Recycling
Post Consumer Post Industrial
Distributors Direct Sales
Machinery Suppliers
Extruders
Injection Molding BlowMolding
Compression Presses Transfer Presses
Thermoforming Machines Molds/Dies
Auxillery Equipment Liquid/Solids Dispensing
Plotters Gravimetric Systems
Process Controls Silos/Transfer Systems

A Plastic Processing Model – Eagle Mfg Company ___________________________________________________________
• Current Capacity: 20 million lb/HDPE/Year
• Facility: 800,000sf w/250,000sf dedicated to plastics (in WV)
• Resin Storage: 2 million lbs, plus 2 rail sidings (20 rail cars-4 mil lbs)
• Products: Over 400 Eagle plastic product models
• Employees: 195 w/60 dedicated to plastics production Quick Review: 1. Processing Equipment
2. Poly Products – Eagle & Region 3. Value Chain Example –
One Cracker Supports 100 Eagle Equivalent Operations

Plastics Processing – Eagle Manufacturing Company Extrusion Blow-Molding

Plastics Processing – Eagle Manufacturing Company
Structural Foam Injection Molding
Injection Molding Rotational Molding
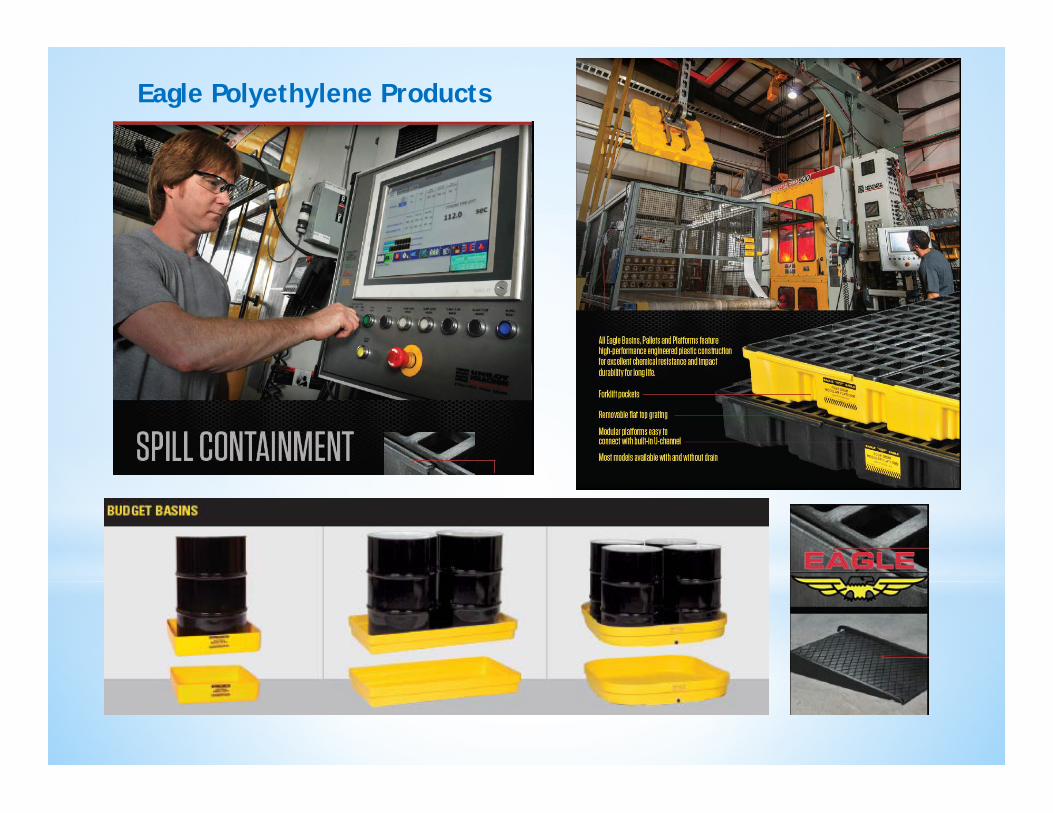
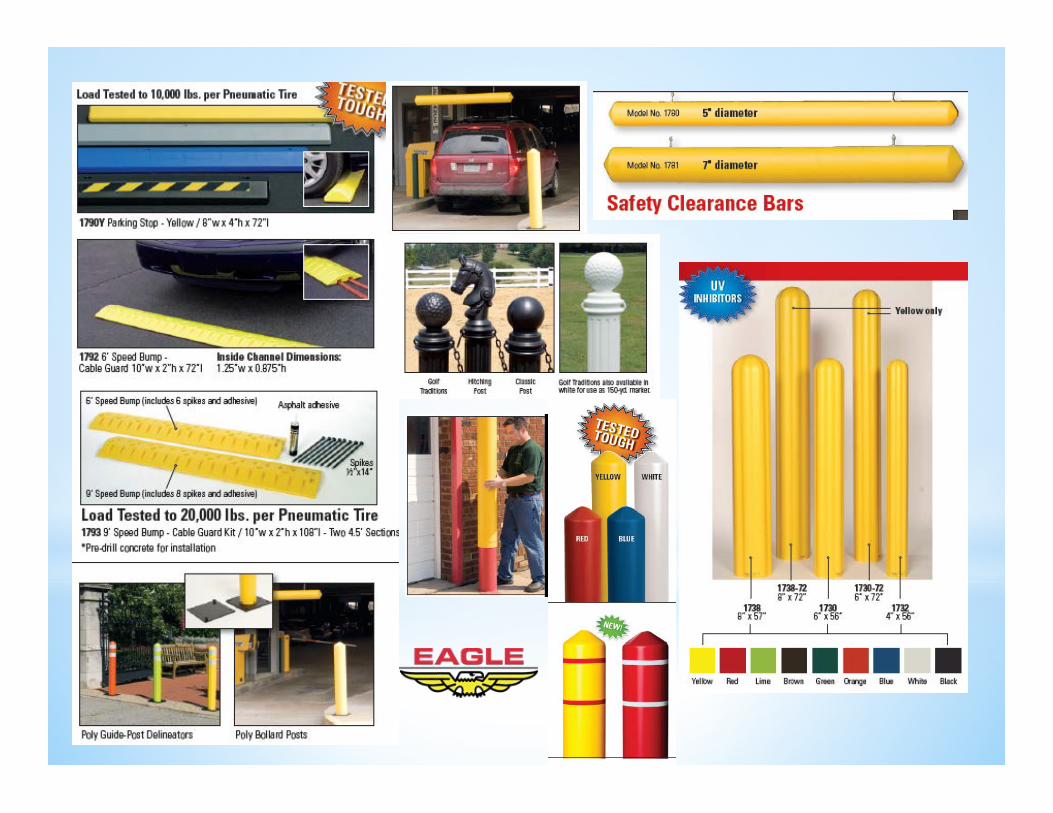
Eagle Polyethylene Products


Other Plastic Products made in our area Over 1000 Plastic Processors - 1,000’s of Products
Poly Foam Building, Packing & Insulation Materials
Vinyl Windows, Doors, Siding
Kitchen/Bath Fixtures
Tool & Die Makers
Urethanes
Plastic Pipe Cooling Towers
Bottles, Jars, Caps & Lids Food Containers

Shale Gas Value Chain-Plastics Model Economics Ethane to Ethylene to Polyethylene-vs-Pipeline Out of Region
• Estimated 20:1 value added ratio of downstream economy (jobs, tax base, future economic development)
Pipeline Ethane Pipeline 100,000 BPD = 36.0 Million Bbl/yr 100 Direct/425 Indir Jobs = $27.8 Million/yr Total Value Added: $330 Million/yr
INPUT – OUTPUT: Ethane Ethylene Polyethylene Poly Products
Based upon: 100,000 BPD ethane at $.20/gal, cracker/reactor net output of 2.0 billion lbs/yr polyethylene, plus 20% value for addl products (ethylene, propylene, butylene, butadiene), ethylene at $.40/lb, direct jobs at $65,000/yr, indirect jobs at 4.25x direct at $50,000/yr, polyethylene at $.65/lb, poly product wholesale value of $1.90/lb, Value Added=Material Output Value + Labor Costs, # of processors based on 50 at 24 million lb/yr, TVA=Total Value Added
36 M bbl/yr 2.5 B lb/yr 2.0 B lb/yr 2.0 B lb/yr $302 M/yr ($1.0 B/yr) $1.30 B/yr $3.80 B/yr
Value Added $330M/yr
Cracker Reactors Plastics
Processors
Fractionation
Markets 100+425 Jobs
350+1,575 Jobs 100+425 Jobs 4,000+18,000 Jobs
$1.43 B/yr $4.96 B/yr TVA = $6.39 B/yr
Value Added Ratio: 1.0/1.0 4.33/1.0 15.0/1.0 19.4/1.0
Same Plant
Update: 10/10/16
Material Value Material Volume
Labor Costs $27.8 M/yr $101.5 M/yr $129.3 M/yr $1.16 B/yr

Key Takeaways:
• Marcellus & Utica are most prolific, productive, profitable shales
• At forefront of shale gas development (10% or less)
• Regional Extraction-Consumption Strategy (App Storage Hub) -Lowers Risk for Additional Crackers/Chemical Buildout in the Basin
-Improves National Security-reduces threat from weather or terrorism in Gulf Coast (Mt Belvieu System)
-Creates Regional Supply-Demand based Pricing Hub (improves value across chain)
-Secures, Stabilizes Plastic Industry with local Supply and much reduced Freight Costs
• Value Proposition is in cracking ethane into ethylene regionally
• Local Ethylene and Polyethylene create major downstream mfg expansion
• Realize an estimated 20:1 Value Added Ratio, economic development worth billions
• What to Do? Engage, Embrace, Educate and Endure with the Industry
Cracker Reactors Plastics
Processors
Fractionation
Markets
100+425 Jobs
350+1575 Jobs 100+425 Jobs 4,000+18,000 Jobs
25,000 Industry Jobs $1.4 Billion/Yr Payrolls $6.4 Billion/Yr TVA