Embed Size (px)
Citation preview
________________________________________________________________________________________________ Financial Accounting Institute 201-568-0249 Utility Finance and Accounting Seminars www.financialaccounting.com
1
UTILITY FINANCIAL STATEMENTS:
CONCEPTS AND ANALYSIS
By
Joel Berk
Financial Accounting Institute
P.O. Box 118
Tenafly, NJ 07670
201-568-0249
www.financialaccounting.com
2013
________________________________________________________________________________________________ Financial Accounting Institute 201-568-0249 Utility Finance and Accounting Seminars www.financialaccounting.com
2
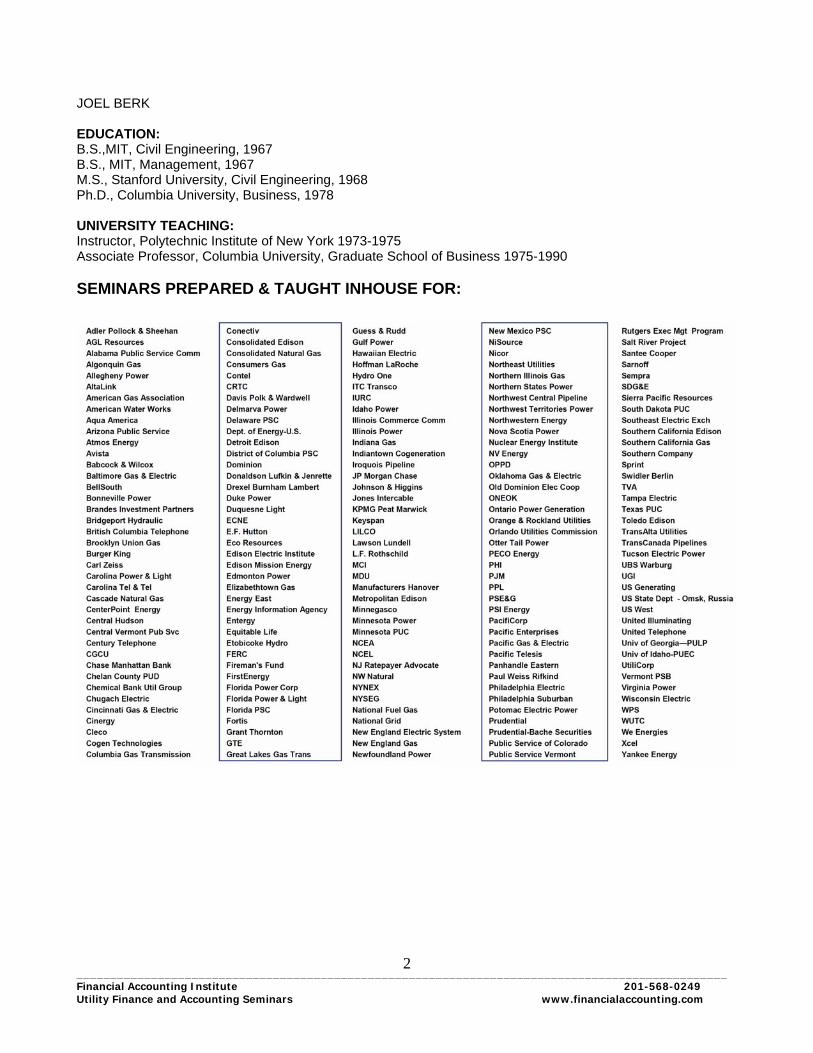
JOEL BERK EDUCATION: B.S.,MIT, Civil Engineering, 1967 B.S., MIT, Management, 1967 M.S., Stanford University, Civil Engineering, 1968 Ph.D., Columbia University, Business, 1978 UNIVERSITY TEACHING: Instructor, Polytechnic Institute of New York 1973-1975 Associate Professor, Columbia University, Graduate School of Business 1975-1990 SEMINARS PREPARED & TAUGHT INHOUSE FOR:

________________________________________________________________________________________________ Financial Accounting Institute 201-568-0249 Utility Finance and Accounting Seminars www.financialaccounting.com
3
PREFACE
This programmed text will take between six and ten hours to complete. In some instances, the issues involved have been simplified in an effort to facilitate your understanding of this introduction to utility financial statements. Be sure to use a calculator or your smart phone. In order to get the most out of the program, you should attempt to answer each question before looking at the answer. Some of the questions are quite easy; others may be difficult if you are not familiar with the concepts. Do not let the difficult questions bother you. Try your best to deal with them and then look at the answer. You should verify your answer before proceeding to the next numbered question. If there are several parts to a question (labeled with letters), answer all parts before looking at the answers. Joel Berk
________________________________________________________________________________________________ Financial Accounting Institute 201-568-0249 Utility Finance and Accounting Seminars www.financialaccounting.com
4
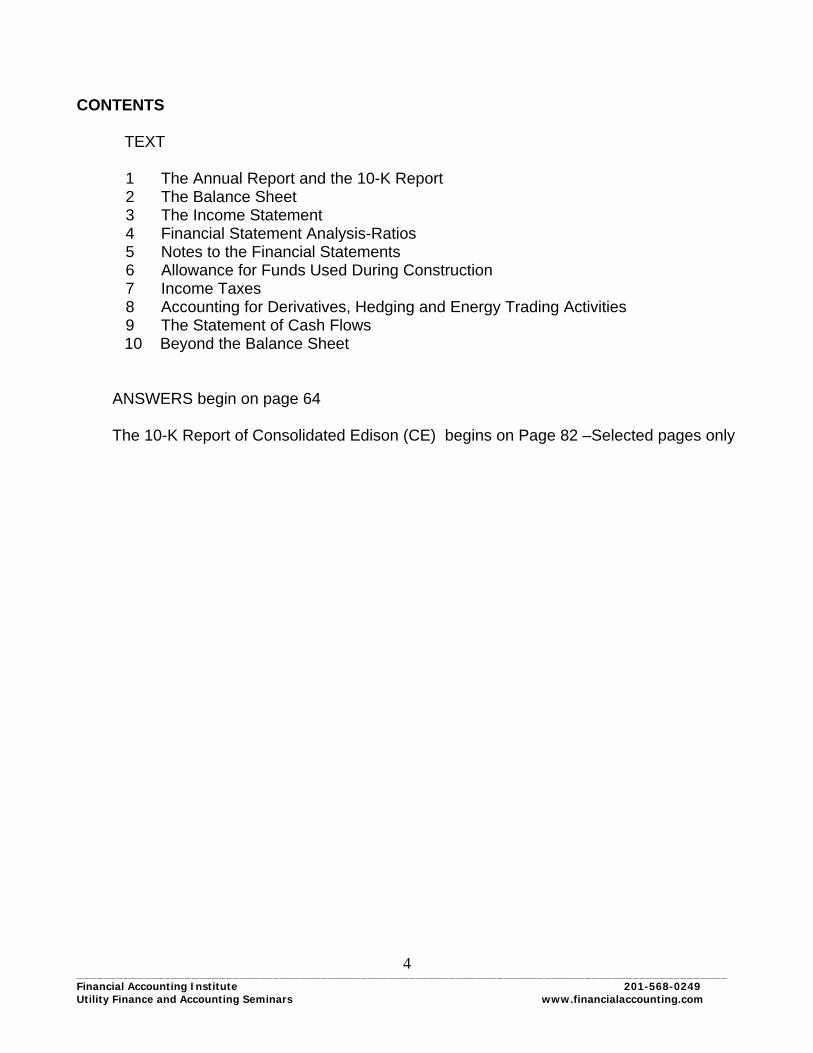
CONTENTS
TEXT 1 The Annual Report and the 10-K Report 2 The Balance Sheet 3 The Income Statement 4 Financial Statement Analysis-Ratios 5 Notes to the Financial Statements 6 Allowance for Funds Used During Construction 7 Income Taxes 8 Accounting for Derivatives, Hedging and Energy Trading Activities 9 The Statement of Cash Flows 10 Beyond the Balance Sheet ANSWERS begin on page 64 The 10-K Report of Consolidated Edison (CE) begins on Page 82 –Selected pages only
________________________________________________________________________________________________ Financial Accounting Institute 201-568-0249 Utility Finance and Accounting Seminars www.financialaccounting.com
5
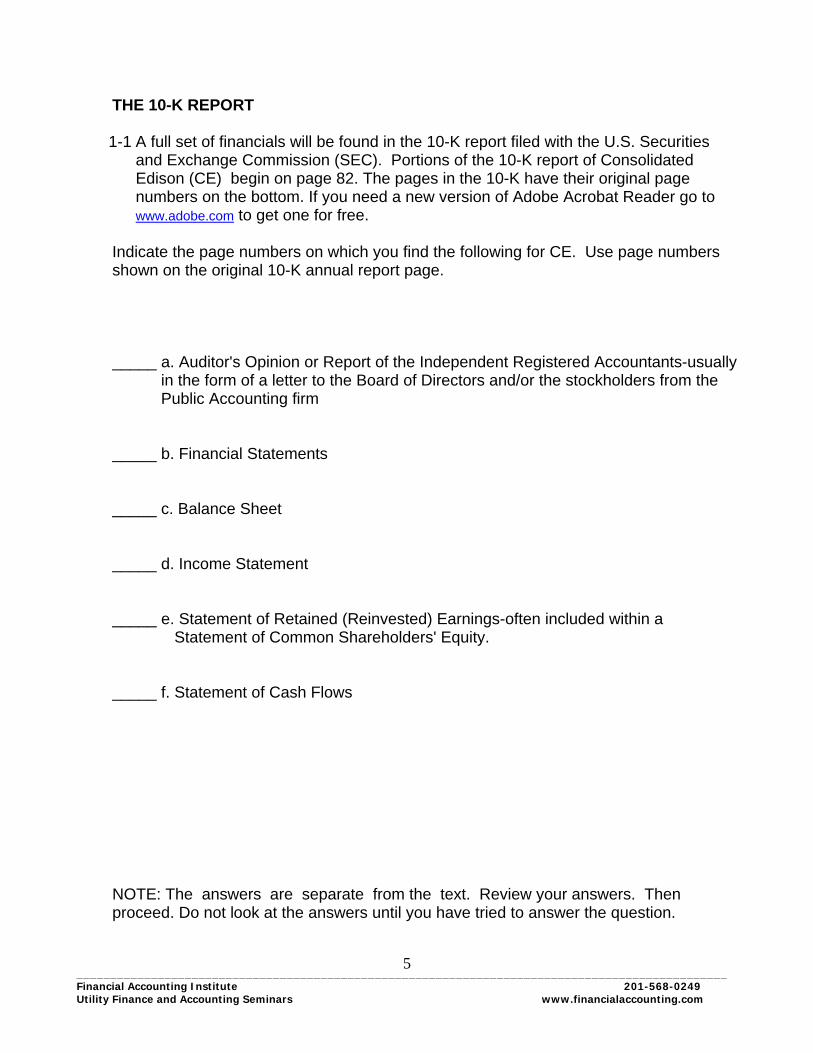
THE 10-K REPORT
1-1 A full set of financials will be found in the 10-K report filed with the U.S. Securities and Exchange Commission (SEC). Portions of the 10-K report of Consolidated Edison (CE) begin on page 82. The pages in the 10-K have their original page numbers on the bottom. If you need a new version of Adobe Acrobat Reader go to www.adobe.com to get one for free.
Indicate the page numbers on which you find the following for CE. Use page numbers shown on the original 10-K annual report page. _____ a. Auditor's Opinion or Report of the Independent Registered Accountants-usually in the form of a letter to the Board of Directors and/or the stockholders from the Public Accounting firm _____ b. Financial Statements _____ c. Balance Sheet _____ d. Income Statement _____ e. Statement of Retained (Reinvested) Earnings-often included within a Statement of Common Shareholders' Equity. _____ f. Statement of Cash Flows NOTE: The answers are separate from the text. Review your answers. Then proceed. Do not look at the answers until you have tried to answer the question.

________________________________________________________________________________________________ Financial Accounting Institute 201-568-0249 Utility Finance and Accounting Seminars www.financialaccounting.com
6
1-2 Look at the Financial Data below from the CE annual report. Is each of the following shown?
a. Return on equity b. Earnings for the year
c. Income from Continuing Operations (or Income before Non-recurring items) d. Stock price performance e. Forecasts of next year's earnings

________________________________________________________________________________________________ Financial Accounting Institute 201-568-0249 Utility Finance and Accounting Seminars www.financialaccounting.com
7
f. Rate Base g. Total return for common stockholders (shareholder return) h. Book Value
i. Market Capitalization
We will explain some of these items at length as we proceed through this text.

________________________________________________________________________________________________ Financial Accounting Institute 201-568-0249 Utility Finance and Accounting Seminars www.financialaccounting.com
8
THE BALANCE SHEET-AN OVERVIEW 2-1 Refer to the CE Financial Statements. The Balance Sheet on pages 71 and 72 shows a picture of the assets, liabilities and stockholders' equity at a point in time. At what two points in time are Balance Sheet amounts shown? 2-2 Notice the Balance Sheet is made up of two parts: ASSETS LIABILITIES AND EQUITY The Liabilities and Equity are broken up into five categories on page 72. Current Liabilities Non Current Liabilities Deferred Credits and Regulatory Liabilities Long Term Debt Shareholder’s Equity Capitalization is the relatively long term capital invested in the company, typically debt, preferred stock, and common stock equity. List the amounts of each type of capital below. Show all answers in millions of dollars as they are shown on the Financial Statement of this company. Answer all questions on the Balance Sheet by referring to December 31, 2011 data. a. Long term debt b. Preferred stock c. Common stock equity d. Total capitalization
________________________________________________________________________________________________ Financial Accounting Institute 201-568-0249 Utility Finance and Accounting Seminars www.financialaccounting.com
9
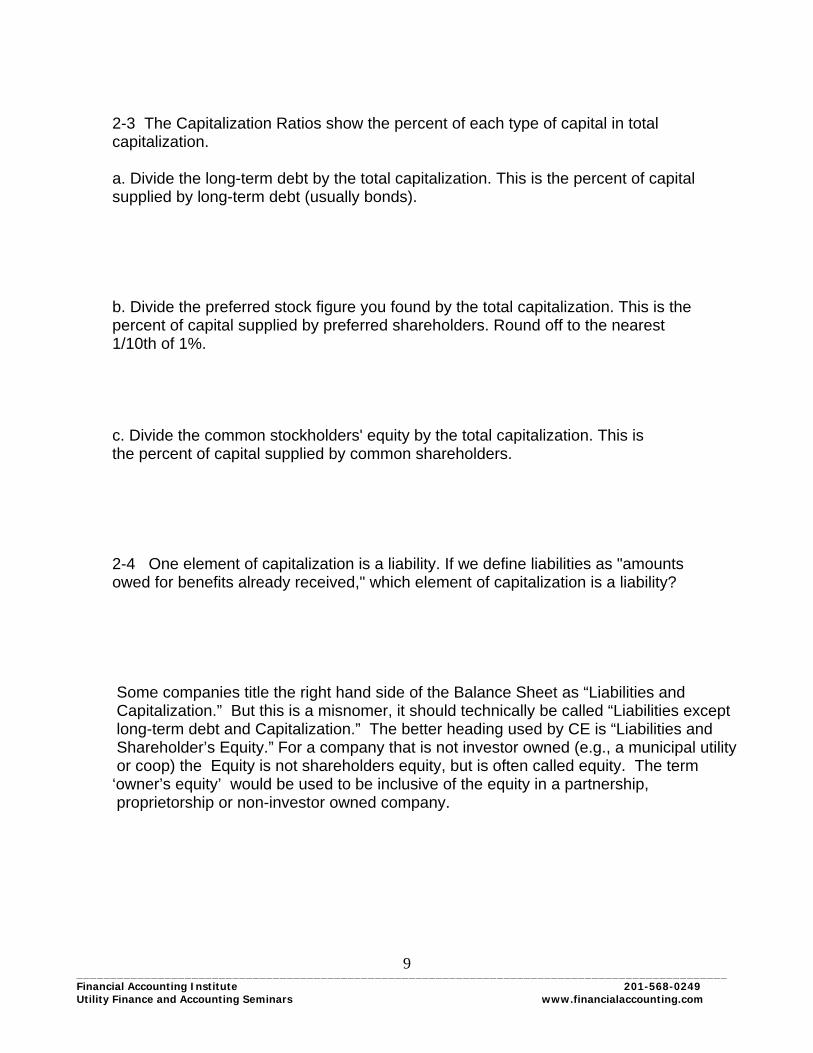
2-3 The Capitalization Ratios show the percent of each type of capital in total capitalization. a. Divide the long-term debt by the total capitalization. This is the percent of capital supplied by long-term debt (usually bonds). b. Divide the preferred stock figure you found by the total capitalization. This is the percent of capital supplied by preferred shareholders. Round off to the nearest 1/10th of 1%. c. Divide the common stockholders' equity by the total capitalization. This is the percent of capital supplied by common shareholders. 2-4 One element of capitalization is a liability. If we define liabilities as "amounts owed for benefits already received," which element of capitalization is a liability? Some companies title the right hand side of the Balance Sheet as “Liabilities and Capitalization.” But this is a misnomer, it should technically be called “Liabilities except long-term debt and Capitalization.” The better heading used by CE is “Liabilities and Shareholder’s Equity.” For a company that is not investor owned (e.g., a municipal utility or coop) the Equity is not shareholders equity, but is often called equity. The term ‘owner’s equity’ would be used to be inclusive of the equity in a partnership, proprietorship or non-investor owned company.

________________________________________________________________________________________________ Financial Accounting Institute 201-568-0249 Utility Finance and Accounting Seminars www.financialaccounting.com
10
2-5 Common and preferred stock are not liabilities since the holders of this stock have no legal claim on the utility for any dividends. If the utility does not have the cash to pay dividends, the utility cannot be sued for these dividends. Note that Con Ed, NV Energy and other utilities have omitted their common dividends, due to financial difficulties, in the last 30 years. NV Energy did continue to pay the preferred dividends, and it is in this sense that the preferred stock has preference over the common. (Also, in the event of bankruptcy of the company, preferred shareholders will be better off.) No answer required. 2-6 The other liabilities listed (e.g., Current Liabilities and Deferred Credits) are also sources of capital for the utility but are not considered to be as permanent. Taken together, the sources of capital (the liabilities and the owners' equity) which CE has amounts to: 2-7 This capital has been used over the years to finance resources to be used in the business. These economic resources, which have benefit to the future, are called Assets. The total amount of the assets is: 2-8 The liabilities and owners' equity must be equal to the assets since the former represent the sources of the assets. The Balance Sheet must balance. Write an equation relating the terms assets, liabilities and owners' equity. 2-9 What is the largest category of assets which CE has? (This is typical of a utility.)
________________________________________________________________________________________________ Financial Accounting Institute 201-568-0249 Utility Finance and Accounting Seminars www.financialaccounting.com
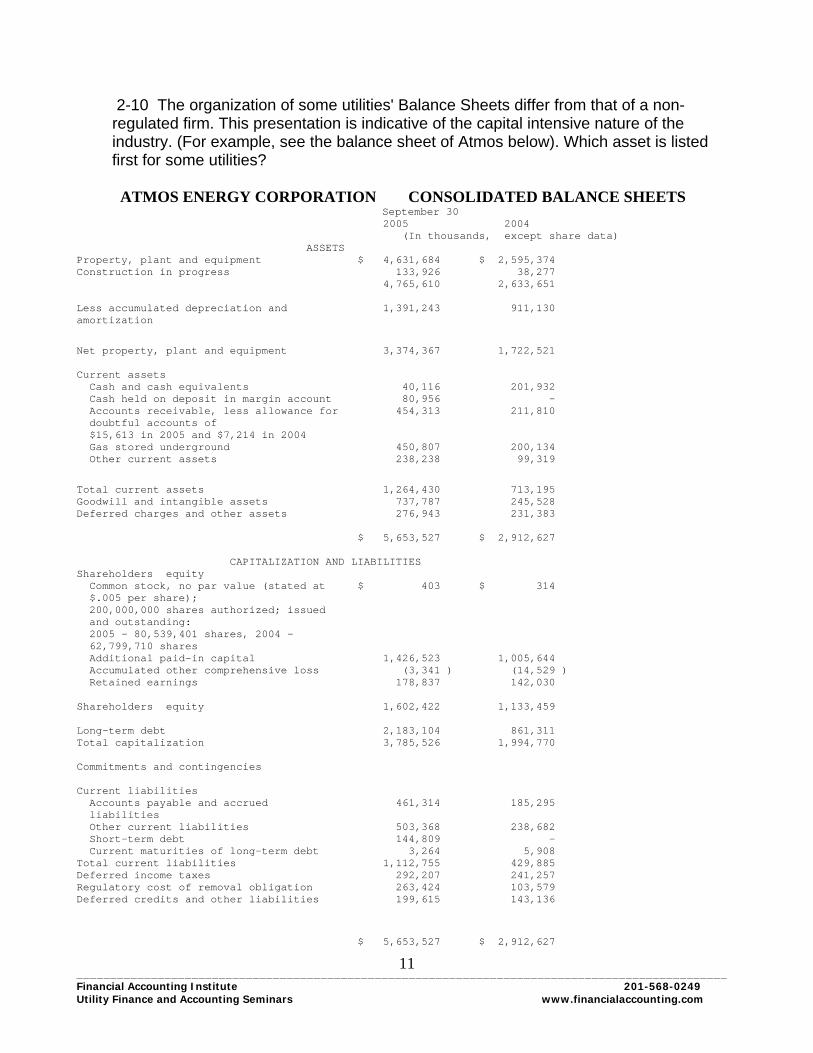
11
2-10 The organization of some utilities' Balance Sheets differ from that of a non- regulated firm. This presentation is indicative of the capital intensive nature of the industry. (For example, see the balance sheet of Atmos below). Which asset is listed first for some utilities? ATMOS ENERGY CORPORATION CONSOLIDATED BALANCE SHEETS September 30 2005 2004 (In thousands, except share data) ASSETS Property, plant and equipment $ 4,631,684 $ 2,595,374 Construction in progress 133,926 38,277 4,765,610 2,633,651 Less accumulated depreciation and 1,391,243 911,130 amortization
Net property, plant and equipment 3,374,367 1,722,521 Current assets Cash and cash equivalents 40,116 201,932 Cash held on deposit in margin account 80,956 - Accounts receivable, less allowance for 454,313 211,810 doubtful accounts of $15,613 in 2005 and $7,214 in 2004 Gas stored underground 450,807 200,134 Other current assets 238,238 99,319
Total current assets 1,264,430 713,195 Goodwill and intangible assets 737,787 245,528 Deferred charges and other assets 276,943 231,383 $ 5,653,527 $ 2,912,627 CAPITALIZATION AND LIABILITIES Shareholders equity Common stock, no par value (stated at $ 403 $ 314 $.005 per share); 200,000,000 shares authorized; issued and outstanding: 2005 - 80,539,401 shares, 2004 - 62,799,710 shares Additional paid-in capital 1,426,523 1,005,644 Accumulated other comprehensive loss (3,341 ) (14,529 ) Retained earnings 178,837 142,030 Shareholders equity 1,602,422 1,133,459 Long-term debt 2,183,104 861,311 Total capitalization 3,785,526 1,994,770 Commitments and contingencies Current liabilities Accounts payable and accrued 461,314 185,295 liabilities Other current liabilities 503,368 238,682 Short-term debt 144,809 - Current maturities of long-term debt 3,264 5,908 Total current liabilities 1,112,755 429,885 Deferred income taxes 292,207 241,257 Regulatory cost of removal obligation 263,424 103,579 Deferred credits and other liabilities 199,615 143,136
$ 5,653,527 $ 2,912,627

________________________________________________________________________________________________ Financial Accounting Institute 201-568-0249 Utility Finance and Accounting Seminars www.financialaccounting.com
12
2-11 The Balance Sheet of CE has a presentation in a format used by non-rate regulated companies. What category of assets is listed first for a non-rate regulated company?
2-12 Which element of Liabilities and Owners' Equity is listed first for some utili- ties? (See Atmos on previous page) A non-regulated firm and most utility holding companies would have the Current Liabilities listed first. 2-13 There are three major categories of assets for a utility. Looking at the CE Financial Statements, can you list them? 2-14 Property Plant and Equipment usually shows the total original cost and accumulated depreciation of all of the company's plant, property and equipment which is used (or will be used in the case of Construction Work in Progress and held for future use) to supply utility services. a. How much did CE pay for all its regulated plant in service? b. Can you tell from the balance sheet what it would cost to replace these facilities at the Balance Sheet date? Yes or No? 2-15 The original cost of the Plant must be adjusted to show that some of the plant has been "used up." That is, some of the service life of the plant has expired. Depreciation is taken each year, to account for the amount of original cost related to the service life that has passed. Over the years, the depreciation is accumulat- ed. It is shown on the Balance Sheet under what title?
________________________________________________________________________________________________ Financial Accounting Institute 201-568-0249 Utility Finance and Accounting Seminars www.financialaccounting.com
13
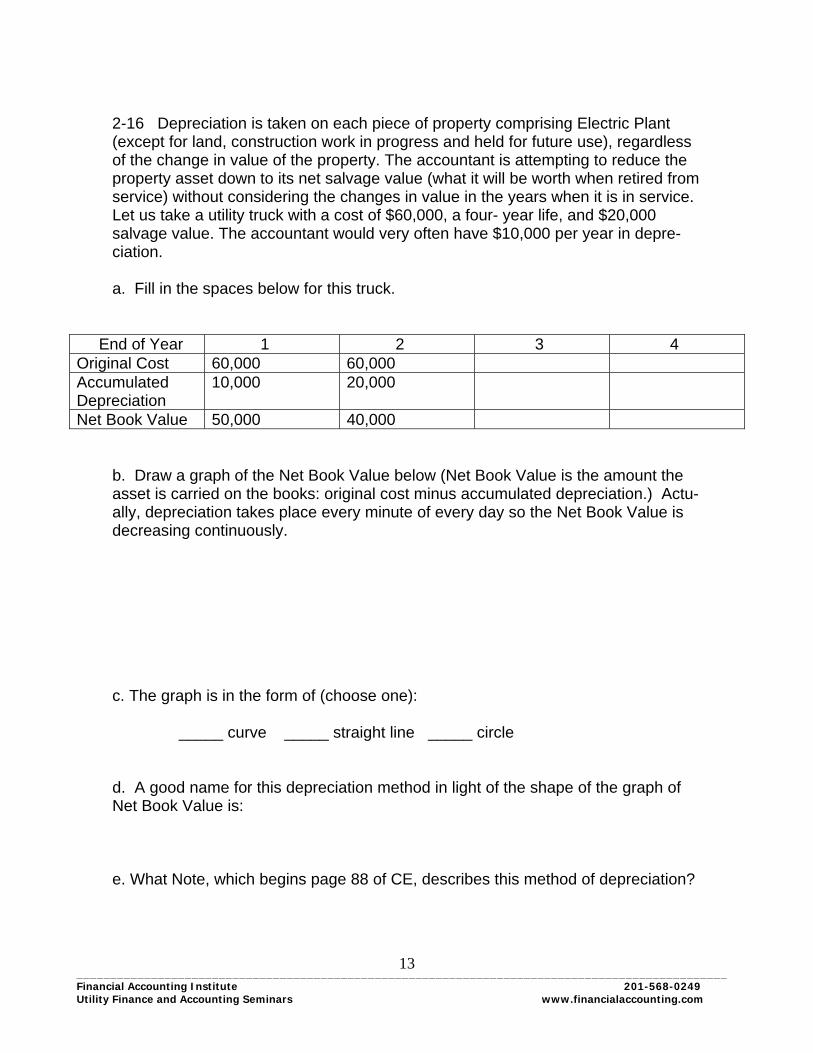
2-16 Depreciation is taken on each piece of property comprising Electric Plant (except for land, construction work in progress and held for future use), regardless of the change in value of the property. The accountant is attempting to reduce the property asset down to its net salvage value (what it will be worth when retired from service) without considering the changes in value in the years when it is in service. Let us take a utility truck with a cost of $60,000, a four- year life, and $20,000 salvage value. The accountant would very often have $10,000 per year in depre- ciation. a. Fill in the spaces below for this truck. End of Year 1 2 3 4 Original Cost 60,000 60,000 Accumulated Depreciation
10,000 20,000
Net Book Value 50,000 40,000 b. Draw a graph of the Net Book Value below (Net Book Value is the amount the asset is carried on the books: original cost minus accumulated depreciation.) Actu- ally, depreciation takes place every minute of every day so the Net Book Value is decreasing continuously. c. The graph is in the form of (choose one): _____ curve _____ straight line _____ circle d. A good name for this depreciation method in light of the shape of the graph of Net Book Value is: e. What Note, which begins page 88 of CE, describes this method of depreciation?
________________________________________________________________________________________________ Financial Accounting Institute 201-568-0249 Utility Finance and Accounting Seminars www.financialaccounting.com
14
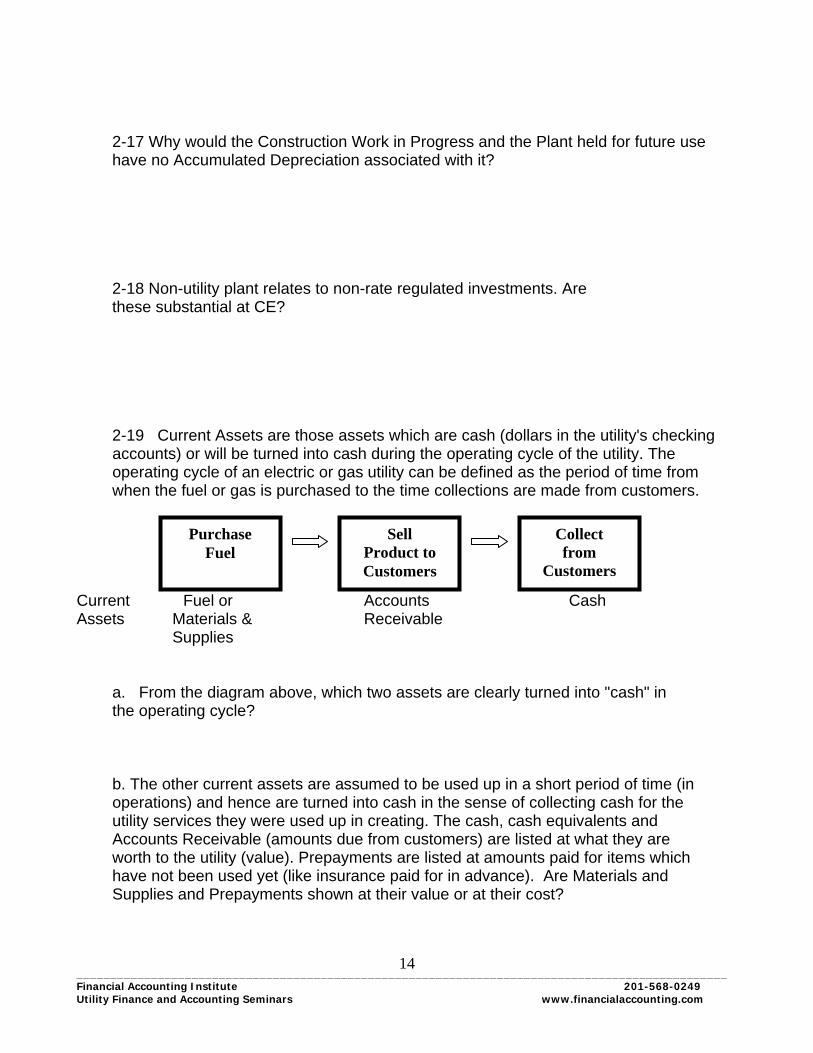
2-17 Why would the Construction Work in Progress and the Plant held for future use have no Accumulated Depreciation associated with it? 2-18 Non-utility plant relates to non-rate regulated investments. Are these substantial at CE? 2-19 Current Assets are those assets which are cash (dollars in the utility's checking accounts) or will be turned into cash during the operating cycle of the utility. The operating cycle of an electric or gas utility can be defined as the period of time from when the fuel or gas is purchased to the time collections are made from customers. Current Fuel or Accounts Cash Assets Materials & Receivable Supplies a. From the diagram above, which two assets are clearly turned into "cash" in the operating cycle? b. The other current assets are assumed to be used up in a short period of time (in operations) and hence are turned into cash in the sense of collecting cash for the utility services they were used up in creating. The cash, cash equivalents and Accounts Receivable (amounts due from customers) are listed at what they are worth to the utility (value). Prepayments are listed at amounts paid for items which have not been used yet (like insurance paid for in advance). Are Materials and Supplies and Prepayments shown at their value or at their cost?
Collect from
Customers
Sell Product to Customers
Purchase Fuel
________________________________________________________________________________________________ Financial Accounting Institute 201-568-0249 Utility Finance and Accounting Seminars www.financialaccounting.com
15
2-20 We all know the bookkeeping process is made up of Debits and Credits. Most of us know Debits always equal Credits. Few of us realize that Debits and Credits are completely unnecessary to the understanding of accounting. Do you see the Debits and Credits on the Balance Sheet (or on the Income Statement for that matter)? 2-21 Unfortunately, at times, some of the Debit and Credit notations creep into the Financial Statements. The Deferred Credits is one such instance. They are simply items which are not due in a legal sense of being owed, but will be paid in the future. Some Deferred Charges (also called Deferred Debits) are items, usually without physical existence, which have been paid for already, but which will generate revenue in the future. Some are assets (and have economic benefit to the future) because the rate-making process will allow the utility to recover these costs in rates in the future. a. How much money will be collected from ratepayers for regulatory assets? b. How much of this will be collected from the customers for environmental remediation costs (see page 102)?
________________________________________________________________________________________________ Financial Accounting Institute 201-568-0249 Utility Finance and Accounting Seminars www.financialaccounting.com
16
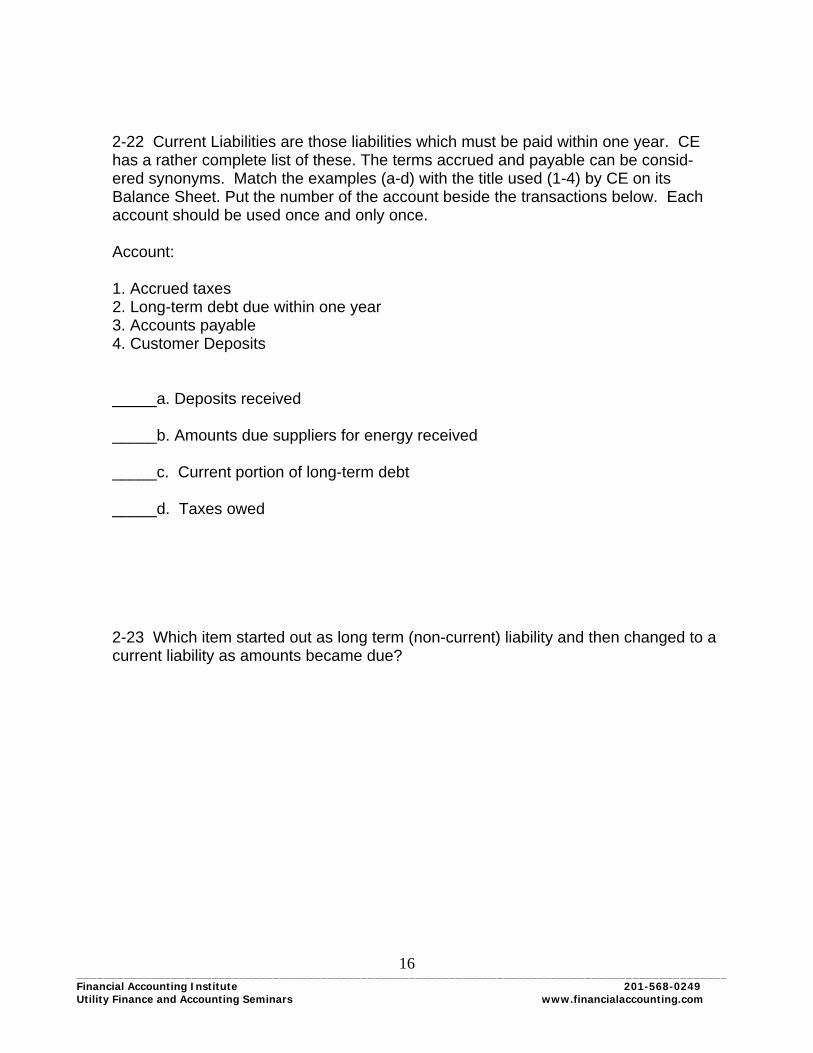
2-22 Current Liabilities are those liabilities which must be paid within one year. CE has a rather complete list of these. The terms accrued and payable can be consid- ered synonyms. Match the examples (a-d) with the title used (1-4) by CE on its Balance Sheet. Put the number of the account beside the transactions below. Each account should be used once and only once. Account: 1. Accrued taxes 2. Long-term debt due within one year 3. Accounts payable 4. Customer Deposits _____a. Deposits received _____b. Amounts due suppliers for energy received _____c. Current portion of long-term debt _____d. Taxes owed 2-23 Which item started out as long term (non-current) liability and then changed to a current liability as amounts became due?
________________________________________________________________________________________________ Financial Accounting Institute 201-568-0249 Utility Finance and Accounting Seminars www.financialaccounting.com
17
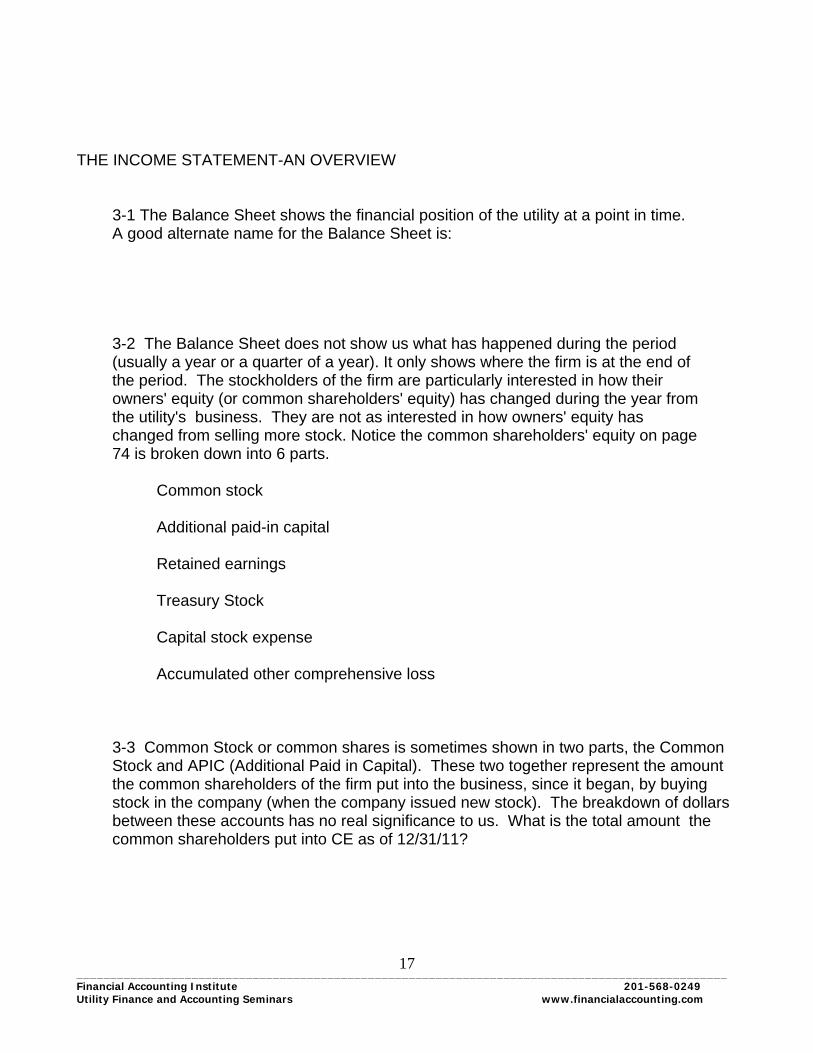
THE INCOME STATEMENT-AN OVERVIEW 3-1 The Balance Sheet shows the financial position of the utility at a point in time. A good alternate name for the Balance Sheet is: 3-2 The Balance Sheet does not show us what has happened during the period (usually a year or a quarter of a year). It only shows where the firm is at the end of the period. The stockholders of the firm are particularly interested in how their owners' equity (or common shareholders' equity) has changed during the year from the utility's business. They are not as interested in how owners' equity has changed from selling more stock. Notice the common shareholders' equity on page 74 is broken down into 6 parts. Common stock Additional paid-in capital Retained earnings Treasury Stock Capital stock expense Accumulated other comprehensive loss 3-3 Common Stock or common shares is sometimes shown in two parts, the Common Stock and APIC (Additional Paid in Capital). These two together represent the amount the common shareholders of the firm put into the business, since it began, by buying stock in the company (when the company issued new stock). The breakdown of dollars between these accounts has no real significance to us. What is the total amount the common shareholders put into CE as of 12/31/11?
________________________________________________________________________________________________ Financial Accounting Institute 201-568-0249 Utility Finance and Accounting Seminars www.financialaccounting.com
18
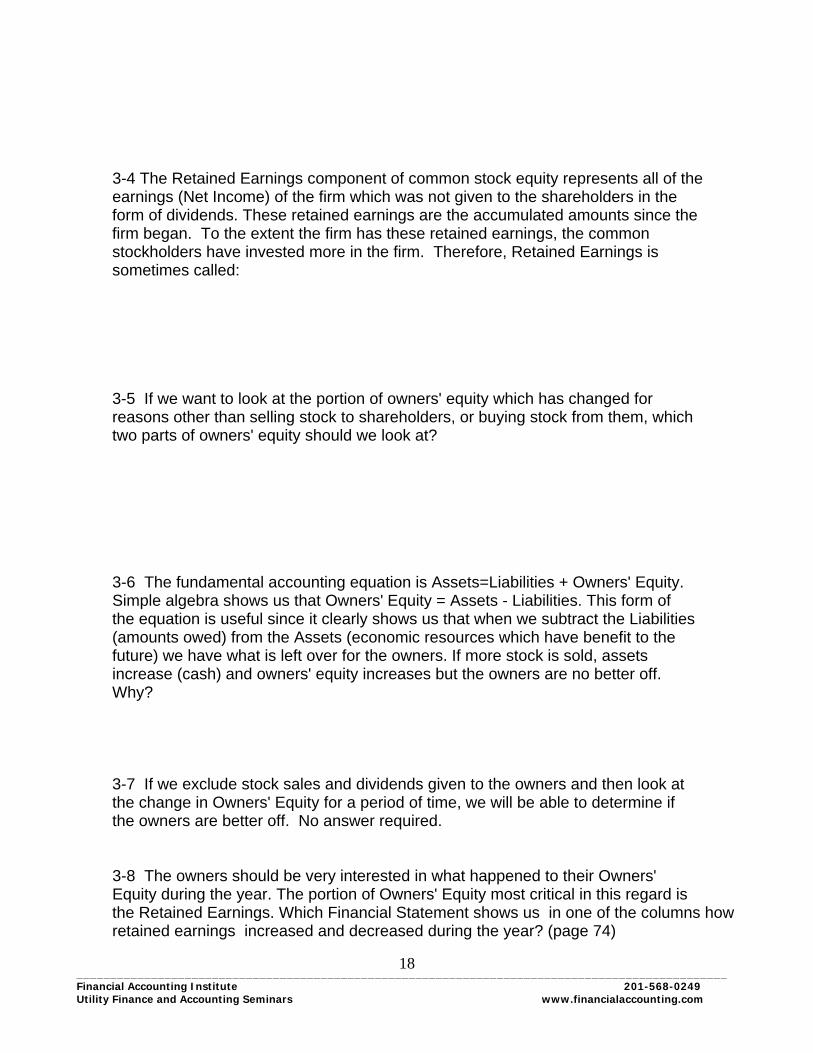
3-4 The Retained Earnings component of common stock equity represents all of the earnings (Net Income) of the firm which was not given to the shareholders in the form of dividends. These retained earnings are the accumulated amounts since the firm began. To the extent the firm has these retained earnings, the common stockholders have invested more in the firm. Therefore, Retained Earnings is sometimes called: 3-5 If we want to look at the portion of owners' equity which has changed for reasons other than selling stock to shareholders, or buying stock from them, which two parts of owners' equity should we look at? 3-6 The fundamental accounting equation is Assets=Liabilities + Owners' Equity. Simple algebra shows us that Owners' Equity = Assets - Liabilities. This form of the equation is useful since it clearly shows us that when we subtract the Liabilities (amounts owed) from the Assets (economic resources which have benefit to the future) we have what is left over for the owners. If more stock is sold, assets increase (cash) and owners' equity increases but the owners are no better off. Why? 3-7 If we exclude stock sales and dividends given to the owners and then look at the change in Owners' Equity for a period of time, we will be able to determine if the owners are better off. No answer required. 3-8 The owners should be very interested in what happened to their Owners' Equity during the year. The portion of Owners' Equity most critical in this regard is the Retained Earnings. Which Financial Statement shows us in one of the columns how retained earnings increased and decreased during the year? (page 74)
________________________________________________________________________________________________ Financial Accounting Institute 201-568-0249 Utility Finance and Accounting Seminars www.financialaccounting.com
19
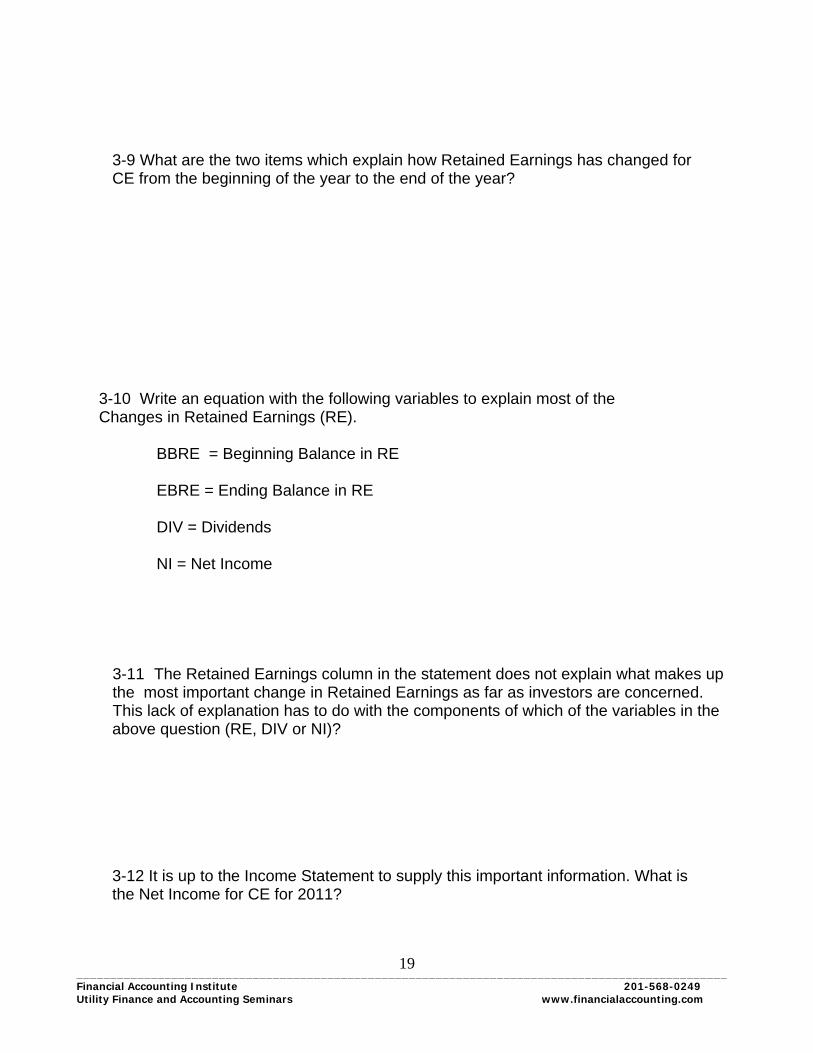
3-9 What are the two items which explain how Retained Earnings has changed for CE from the beginning of the year to the end of the year? 3-10 Write an equation with the following variables to explain most of the Changes in Retained Earnings (RE). BBRE = Beginning Balance in RE EBRE = Ending Balance in RE DIV = Dividends NI = Net Income
3-11 The Retained Earnings column in the statement does not explain what makes up the most important change in Retained Earnings as far as investors are concerned. This lack of explanation has to do with the components of which of the variables in the
above question (RE, DIV or NI)? 3-12 It is up to the Income Statement to supply this important information. What is the Net Income for CE for 2011?

________________________________________________________________________________________________ Financial Accounting Institute 201-568-0249 Utility Finance and Accounting Seminars www.financialaccounting.com
20
3-13 Everything above Net Income is an explanation as to why Net Income is as shown. The Income Statement shows us why Owners' Equity changed from the business of the company. Go down the Income Statement for CE and put + or - to the left of the amount of each item to show whether this item increased the Owners' Equity (increased Net Income) or decreased Owners' Equity. (Note: you may have to look at the subtotals to figure out whether certain items have been added or subtracted.) 3-14 The Net Income figure shows us how much the Owners' Equity has changed due to the process of doing business. It is a measure of the performance of the firm in that it shows us how the firm did during the year in terms of how much better off the owners are. In order to see what has caused the Bottom Line (Net Income) to be as shown, the Income Statements show the details of the perfor- mance of the firm. (No answer required) 3-15 A firm's Income Statement is often broken up into five major sections. Looking at the Income Statement of CE, list the five major sections before Net Income. 3-16 Can you tell by looking at the Income Statement of CE which regulated business has higher Net Income?

________________________________________________________________________________________________ Financial Accounting Institute 201-568-0249 Utility Finance and Accounting Seminars www.financialaccounting.com
21
3-17 Revenue is defined as a gross inflow of assets (e.g., cash or accounts receiv- able) from the operations of the company for which goods and services have been delivered to the customer during the accounting period. Which of the following are revenue items for a utility? (Check each that applies.) _____ a. sale of electricity _____ b. sale of plant to another utility _____ c. sale of common stock _____ d. sale of bonds 3-18 Often the cell phone company collects cash in December for January basic service. According to the definition of revenue, is this revenue in the year they collect the money or the next year? 3-19 Given the definition of revenue in 3-18 above, can you tell from CE's Income Statement how much cash was received from customers during the year? 3-20 The accountant uses accrual accounting for the Financial Statements. This means revenue is shown in the period (e.g. year) in which it is earned regardless of when the revenue is collected in cash. The utility shows revenue for its services when the services are delivered regardless of when the customer pays. An allowance is made for anticipated non-payments so revenue is not over-stated. Although the cash may not have been received for some of the revenue, the gross inflow of assets is in the form of Accounts Receivable. (Accounts Receivable are amounts due from customers which they will pay some time after they receive their bills.)
a. How much of CE's revenue has been billed to the customers but not collected yet that company expects to collect?
b. How much revenue did CE have in 2011?
________________________________________________________________________________________________ Financial Accounting Institute 201-568-0249 Utility Finance and Accounting Seminars www.financialaccounting.com
22
3-21 In order to measure the performance properly, we must subtract from the revenue all of the costs necessary to get that revenue. Costs needed to get the revenue are called expenses. Expenses also follow accrual accounting. It does not matter whether these costs have been paid for or not, if they were incurred in order to earn the revenue they are expenses (to be matched against that revenue). For CE, how much in operating expenses was required to get the revenue? 3-22 CE invested $1887 in additional plant in 2011. We can find this number on the Statement of Cash Flows on page 70. Was this the amount necessary to get the $12,938 in revenue (yes or no)? 3-23 Should this $1887 of new plant be considered an expense of 2011 (yes or no)? 3-24 Let us assume the $1887 addition to plant represents one generating unit which will get the company revenue over 40 years. How much of the plant is "used up" to get the revenue each year? (Make the simplest assumptions possible.) 3-25 If we spread the cost of the plant over 40 years by showing 1/40th of the cost as an expense each year, what method of depreciation are we using?
________________________________________________________________________________________________ Financial Accounting Institute 201-568-0249 Utility Finance and Accounting Seminars www.financialaccounting.com
23
3-26 It would not make sense to say that the amount paid for plant during the year is the depreciation expense. Doing so would be saying the whole plant was used up to get one year's revenue. This would not match revenues and expenses well and would not be _______________ accounting. 3-27 a. How much is Depreciation and Amortization expense in 2011 compared to the utility plant additions in 2011? b. Is there any apparent relationship between the plant additions and depreciation? 3-28 Which of the following best describes the Depreciation Expense figure shown on the Income Statement? _____a. cost of plant additions during the year _____b. cost of plant retired during the year _____c. cost of the portion of the plant "used up" during the year to get revenue _____d. cost of replacing the plant "used up" during the year to get revenue 3-29 The Depreciation Expense represents an allocation of a cost which could be 30 or 40 years old, when various utility plant was constructed. It might cost much more to replace the portion of plant which is used up during the year than it origi- nally cost. The Income Statement is based on those original (historical) costs. Many users of Financial Statements feel they want to know the current cost of replacing the plant which is depreciated. Does the figure we saw on the Statement of Cash Flows (which represents the additions to utility plant) give them the information they want? Why or why not?
________________________________________________________________________________________________ Financial Accounting Institute 201-568-0249 Utility Finance and Accounting Seminars www.financialaccounting.com
24
3-30 Another definition of Net Income is: Net Income = Revenue - Expenses If we use this definition of Net Income, we must force many items on a utility's Income Statement into either the Revenue or Expense category. Since we have specific definitions for Revenue and Expense, it would be best to enlarge this equation step by step and use one of the other forms. More complete forms in- clude: a. Net Income (NI) = Revenue - Expense + (Gains-Losses) b. Net Income = Revenue - Expenses + Other Income c. NI = (Operating Revenue - Operating Expenses) + Other Income - Interest
d. NI = Operating Revenues - Operating Expenses + Other Income - Interest - Income Taxes
Which form most parallels the CE Income Statement? 3-31 The terms Net Income, Income, Earnings and Profit sometimes have special meanings to the people who are using them. In general, however, these are syno- nyms. However, the word earnings in the term Earnings per Share always means the Earnings left over after preferred dividends (i.e., Earnings for Common Shares). a. What terms are used by CE for the Earnings and for Earnings for Common Shares?
b. Divide the average number of shares outstanding (basic) into the Net Income for Common Stock for CE. Does your answer agree with theirs?
________________________________________________________________________________________________ Financial Accounting Institute 201-568-0249 Utility Finance and Accounting Seminars www.financialaccounting.com
25
FINANCIAL STATEMENT ANALYSIS-RATIOS 4-1 In order to make sense out of the financial statement figures, we must com- pare them to something. In order to see this clearly, just think about what you would know about a company if you found out its earnings per share was $3.59 but know nothing else. a. Could you say its earnings were higher than last year? b. Could you say its earnings were higher than expected? c. Could you say the company was doing well? d. Could you say the common shareholders were earning a large amount on their investment? 4-2 One way to analyze the results of a company is to compare the company's performance from one year to the next. a. Which one of the financial statements helps to do this? b. How many years of data are given for comparison purposes? 4-3 Notice the assets used to get CE's income have increased since last year. More important than this, the amount of capital invested by the common stockholders has increased. What part of the Financial Statements shows this to us?

________________________________________________________________________________________________ Financial Accounting Institute 201-568-0249 Utility Finance and Accounting Seminars www.financialaccounting.com
26
4-4 In order to compare earnings to the equity investment, an important ratio is used. This ratio is called return on equity (ROE). It is measured by dividing the Income available for the Common Shareholders by the average equity contributed or left in the company by these shareholders. The average of the common equity is used since this equity has a different amount at the beginning and end of each year (due to stock sales and/or Net Income and Dividends during the year). a. Find the average of the beginning of the year and end of the year amounts of the Common Equity for CE 2011 from the Balance Sheet. b. Divide this into the "Earnings Applicable to Common Stock" from the Income Statement to get ROE. 4-5 It is important to understand that the ROE which we just found is not the return which a common shareholder feels directly. The ROE measures the earnings for common shareholders as a percent of the dollars they gave the company or left in as Retained Earnings. It does not consider the price that shareholders are current- ly paying each other to own the stock. The stockholders' return for the past year is measured by the dividends these investors get plus the percent increase (or minus the decrease) in the price of their stock. This return, which is the only return which the shareholder can turn into cash, can be found from the following formula: R = D/PB + (PE -PB)/(PB) where R is the Return, D the dividends earned on one share of stock during the year, P is the market price (e.g. on the New York Stock Exchange) of one share of stock. (The “B” indicates "at the beginning of the year" and E "at the end.") The price at the beginning of 2011 is the price at the end of 2010. Use the Financial Highlights from question 1-2 and apply the formula to find the return for the common stockholders in 2011. This metric or measure is often called Total Shareholder Return or TSR.
________________________________________________________________________________________________ Financial Accounting Institute 201-568-0249 Utility Finance and Accounting Seminars www.financialaccounting.com
27
4-6 Notice the return is made up of two parts: the dividends/price and change in price/price. It should be clear that if you bought a share of CE Common on 12/31/10 for $49.57 and received a $2.40 dividend on this, that your dividend yield is $2.40/49.57=4.8%. But you have stock, which is more valuable on 12/31/11 than when you bought it. It is worth $62.03 on 12/31/11. You have a return of (62.03-49.57)/49.57=25.1% on the increase in the stock price. Of course, to have made this portion of the return in cash you would have had to sell the share of stock on 12/31/11. We say the return for 2011 includes this increase whether you sold it or not. The total shareholder return is 4.8% + 25.1% = 29.9%. Is the shareholders return for 2011 the same as the ROE for 2011? 4-7 One reason the accountant's ROE is not the same as the return to the common stockholders is that the market price of the stock is not the same as the common equity per share. And the earnings per share of common is not the same as the dividends plus appreciation of stock price. The market price of the stock depends on the future expectations of returns to the common shareholders (this determines what investors will pay for the stock), while the common equity per share depends on past issuance of stock, income and dividends. It is up to the equity investors to use past (historical) information about the company to decide what they are willing to pay for future dividends and price appreciation of their stock. The only return the shareholders can get is in the form of dividends and stock appreciation. Net Income, by itself, cannot be spent by the shareholders. a. Two reasons could be stated as to why Net Income is not available to the share- holders in cash. One is that Net Income is not "cash income" because of what type of accounting? b. The second reason concerns the difference between what the utility earns and what the shareholders get from the utility. The shareholder only receives cash from the utility in the form of ______________________.

________________________________________________________________________________________________ Financial Accounting Institute 201-568-0249 Utility Finance and Accounting Seminars www.financialaccounting.com
28
4-8 The amount of dividends given to common shareholders as a percent of Net Income available to common stock is called the payout ratio. What is the payout ratio for CE for 2011? [Payout Ratio = Common Dividends per share/Earnings per Share (EPS) Basic] 4-9 If a company does not give its shareholders any cash dividends, then the shareholders will get none of their return in the form of dividends. All of their return will then be in the form of _____________________ . 4-10 Dividing the number of common shares outstanding on 12/31/11 into the common equity yields the common equity per share (often called Book Value). Using information from pages 72 and 75, what is the Book Value as of 12/31/11 for CE? 4-11 The book value represents the average amount which previous investors paid for stock issued by the company or which previous investors' earnings were re- tained by the business. The common shareholders set the market price of the stock by buying and selling at that price. This market value may be higher or lower than the book value of the company. When the market value is higher than the book value, it means common shareholders are willing to pay more for a stock than the average amount which previous shareholders have invested or left in the company. 4-12 Another important ratio is Times Interest Earned. Similar ratios are called the Fixed Charge Coverage Ratio or Pretax Interest Coverage Ratio. These ratios can be defined in many ways, one of the simplest being Income before Interest and Income Taxes by divided by Interest Expense. The interest cost is before any AFUDC. This will show the safety margin for meeting the fixed payments for interest. For CE, fill in the chart below from the Income Statement: Income before Interest and Income Tax ______________ Divided by Interest Expense ______________ = Times Interest Earned ______________
________________________________________________________________________________________________ Financial Accounting Institute 201-568-0249 Utility Finance and Accounting Seminars www.financialaccounting.com
29
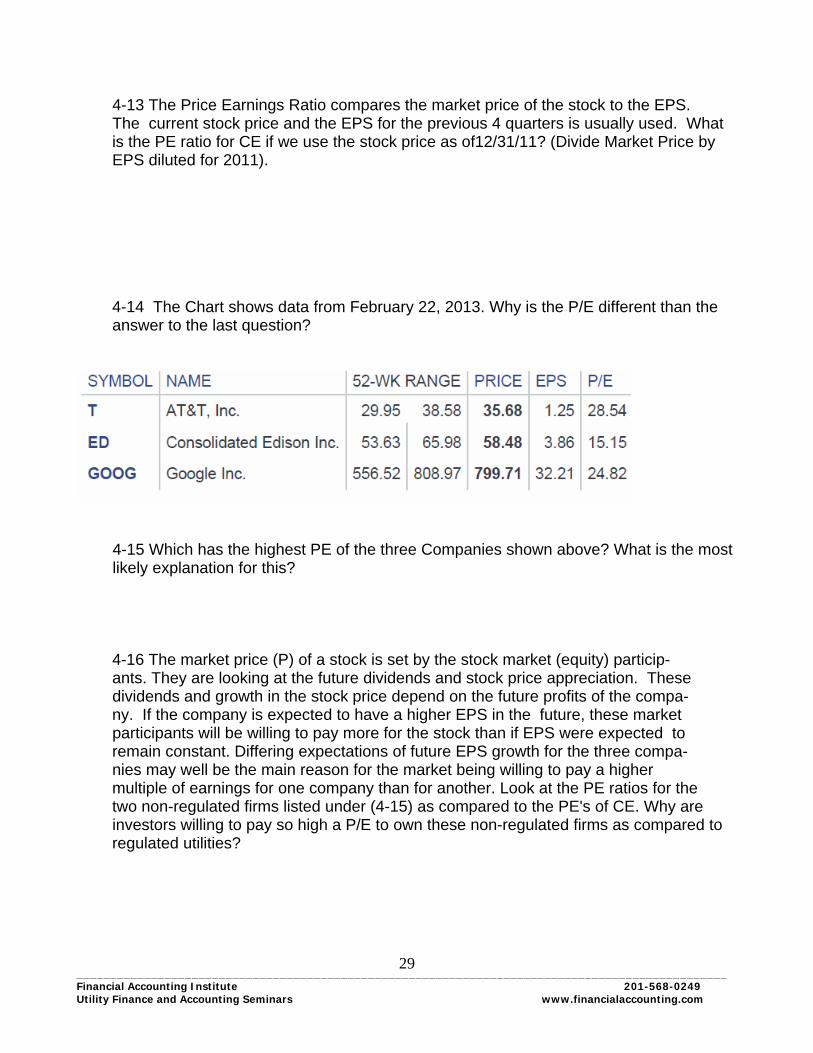
4-13 The Price Earnings Ratio compares the market price of the stock to the EPS. The current stock price and the EPS for the previous 4 quarters is usually used. What is the PE ratio for CE if we use the stock price as of12/31/11? (Divide Market Price by EPS diluted for 2011). 4-14 The Chart shows data from February 22, 2013. Why is the P/E different than the answer to the last question?
4-15 Which has the highest PE of the three Companies shown above? What is the most likely explanation for this?
4-16 The market price (P) of a stock is set by the stock market (equity) particip- ants. They are looking at the future dividends and stock price appreciation. These dividends and growth in the stock price depend on the future profits of the compa- ny. If the company is expected to have a higher EPS in the future, these market participants will be willing to pay more for the stock than if EPS were expected to remain constant. Differing expectations of future EPS growth for the three compa- nies may well be the main reason for the market being willing to pay a higher multiple of earnings for one company than for another. Look at the PE ratios for the two non-regulated firms listed under (4-15) as compared to the PE's of CE. Why are investors willing to pay so high a P/E to own these non-regulated firms as compared to regulated utilities?

________________________________________________________________________________________________ Financial Accounting Institute 201-568-0249 Utility Finance and Accounting Seminars www.financialaccounting.com
30
4-17 Many other ratios are useful. Each ratio allows us to standardize the account- ing figures so as to compare them to something. You could create your own ratios for this purpose. For example, if you wanted to see if CE had operating expense which appeared out of line with other utilities, you could compare the operating expense of some utilities. a. Find the Total Operating Expenses for CE. b. Why is the absolute number not meaningful? c. You can divide this number by the revenue to standardize it. Calculate that ratio for CE.
________________________________________________________________________________________________ Financial Accounting Institute 201-568-0249 Utility Finance and Accounting Seminars www.financialaccounting.com
31
STATEMENT NOTES 5-1 What statement is made at the bottom of each of the financial statements of CE concerning the notes? 5-2 The Notes to the financial statements are critical to understanding the state- ments. These Notes contain four types of information: 1. Explanation of accounting methods used 2. Information about assumptions and estimates used in applying the accounting methods 3. A more detailed breakdown of the figures shown on the financial statements 4. Disclosure of important (material) information not shown in the financial state- ments Although many of the Notes contain combinations of the above types of informa- tion, try to label each of the following Notes of CE with one and only one of the information types listed above. Note A _____ Note H_____ Note B _____ Note I _____ Note C _____ Note J_____ Note D _____ Note K_____ Note E _____ Note L_____ Note F _____ Note G ______

________________________________________________________________________________________________ Financial Accounting Institute 201-568-0249 Utility Finance and Accounting Seminars www.financialaccounting.com
32
5-3 The Notes are a very important addition to the financial statements because of which of the following (more than one may be correct)? a. The Notes tell us about information not included on the financial statements themselves b. The Notes show us which financial statement figures are wrong c. The Notes allow us to understand what some of the accounting figures mean d. The Notes summarize the figures on the financial statements 5-4 A section on the Significant Accounting Policies used by the company is re- quired (pages 88-92). For each of the following terms indicate in which section of the notes this is discussed:
1. Asset write downs
2. Retirement of plant
3. Temporary differences between the financials and tax
4. Allowance for funds used during construction
5. Rate Regulated Accounting

________________________________________________________________________________________________ Financial Accounting Institute 201-568-0249 Utility Finance and Accounting Seminars www.financialaccounting.com
33
5-5 Most rate regulated utilities follow rate regulated accounting. With reference to the note on page 88, which businesses of CE follow rate regulated accounting?
5-6 When a cost is capitalized it is considered an asset and not an expense. Identi- fy whether the company has capitalized (c) or expensed (e) each of the following: (See page 89) ___ a. Financing Costs of Construction ___ b. Maintenance of Plant ___ c. Construction Overhead Costs 5-7 What items are included in the cost of plant in addition to the usual construction costs? 5-8 Which item on the balance sheet is increased by the Allowance for Funds Used During Construction (AFUDC or AFDC)?
________________________________________________________________________________________________ Financial Accounting Institute 201-568-0249 Utility Finance and Accounting Seminars www.financialaccounting.com
34
5-9 Regulatory assets are typically costs which would have been an expense at a non- regulated firm but are assets at the regulated utility. The regulators (public utility commissions) create these assets by allowing the utility to collect these amounts through future rates.
a. How can CE have a regulatory asset for “Deferred derivative losses” (see page 102) when these were losses?
b. “Recoverable Energy Costs” are described on page 90. How do these create regulatory assets (or liabilities) and what amounts are shown on page 102?
5-10 On the Financial Statements, CE used different methods of accounting and different accounting estimates than on their tax return. Many of these differences create deferred taxes. Looking at the chart on page 120, which item appears to create the biggest difference?
5-11 Most plant assets use accelerated depreciation (so called return since the company is allowed more depreciation expense in earlier years than later years) on the tax return as well as shorter life estimates. The accounting methods and estimates used on the US tax return are established by the Congress of the United States with implementation being left to the Internal Revenue Service. (No answer required.)
5-12 The fact that the accounting methods and estimates used for tax purposes are different than the methods used for rate regulation and financial statement purposes, will mean that the taxable income on the company's tax return will not be the same as the
pretax income which can be derived from the Income Statement. Which number would the company like to be higher-pretax income or taxable income? Why?
________________________________________________________________________________________________ Financial Accounting Institute 201-568-0249 Utility Finance and Accounting Seminars www.financialaccounting.com
35
5-13 Accounting methods used for financial statements issued to the public (like the financial statements contained in the Annual Reports) are called Generally Accepted Accounting Principles (GAAP). At the present time, a private group called the Financial Accounting Standards Board (FASB) makes these rules for US GAAP while the International Accounting Standards Board make GAAP rules followed by most other countries. In the US the FASB has been allowed to make the rules by a government agency, the Securities and Exchange Commission (SEC). What change did the FASB make to Accounting Standards Codification 820 (ASC refers to the detailed GAAP rules on different topics) and why? (See page 135) 5-14 Will a company's tax return change due to the FASB's change in GAAP? 5-15 Which Public Utility Commission regulates CECONY’s utility business?
(See page 92) 5-16 Each state has a Public Utility Commission (PUC) which specifies accounting methods to be used for rate regulation purposes. Do you think the state and federal commissions which regulate rates must use the accounting methods which the other groups like the Congress or the FASB specify? 5-17 The Public Utility Commissions use the accounting methods which they feel are best. Very often the PUCs use the same methods as GAAP. When the PUCs choose a non-GAAP method, Rate Regulated Accounting (ASC 980) says the utility should deviate from the usual GAAP and follow the PUCs' method when necessary to match the expense with the revenue. Read the note in the second paragraph under Accounting Policies (page 88) What kinds of assets and liabilities are created when the PUC varies from normal GAAP?
________________________________________________________________________________________________ Financial Accounting Institute 201-568-0249 Utility Finance and Accounting Seminars www.financialaccounting.com
36
5-18 The Auditor's Opinion or Auditor's Report which begins on page 68, is not a part of the Notes but is a statement from the Independent Public Accountants concerning the financial statements. The opinion for CE is a clean opinion. No material problems with the audit or the statements have arisen. Which of the following did PricewaterhouseCoopers do? (choose 3): _____a. examined the financial statements _____b. prepared the financial statements _____c. chose the methods of accounting to be used _____d. checked to see if GAAP were followed _____e. used auditing procedures to test the accounting records _____f. told the company how to check the accounting records 5-19 PricewaterhouseCoopers LLP are registered "public" accountants (CPA) in the same sense that an investor owned utility is a public utility. They both provide a service to the public. The CPA, by rendering an opinion on the financial statements, gives the investor confidence that these financial statements are not misleading or fraud- ulent. Match the following one for one to describe the Independent Certified Public Accountant: _____ I. Independent a. serves investors and others outside the company _____ II. Certified b. is not an employee of the company _____ III. Public c. passed an examination & other criteria satisfied _____ IV. Accountant d. one who understands accounting
________________________________________________________________________________________________ Financial Accounting Institute 201-568-0249 Utility Finance and Accounting Seminars www.financialaccounting.com
37
THE ALLOWANCE FOR FUNDS USED DURING CONSTRUCTION (AFUDC) 6-1 A utility is usually not allowed to charge its ratepayers (customers) for any of the costs of utility plant which is being built (until that plant provides utility service). This Construction Work in Progress (CWIP), however, needs to be financed by selling stock and bonds or retaining the earnings of the common shareholders. The costs of this financing during construction will be collected from the ratepayers when the plant is in operation. In order to accomplish this, the cost of the plant is increased to include the financing costs during the construction period. When the ratepayers pay for the cost of the plant, they are also paying for the financing costs during the construction period. The above discussion would indicate that the CWIP figure on CE's Balance Sheet includes which of the following costs (choose all that apply): _____a. anticipated maintenance costs _____b. costs of financing the CWIP to date _____c. labor costs to build the plant _____d. real estate taxes on the land under the plant 6-2 The costs of financing the construction (the AFUDC) are added to one of the utility's assets, CWIP. The fundamental accounting equation tells us that if assets increase, liabilities or owners' equity (OE) must increase. In this case, no liability is created, hence, OE must increase. The common shareholders are better off since they have more assets and no additional liabilities. Net Income is the change in OE when shareholder transactions are excluded. Since OE has gone up due to the capitalization of the AFUDC, the firm has Net Income. Label each of the following as True or False: _____a. AFUDC increases both the assets of the utility and the Net Income _____b. The CWIP is a more valuable asset due to AFUDC because rates will be set in the future to recover these AFUDC costs. _____c. Abbreviations for AFUDC are AFC and AFDC.

________________________________________________________________________________________________ Financial Accounting Institute 201-568-0249 Utility Finance and Accounting Seminars www.financialaccounting.com
38
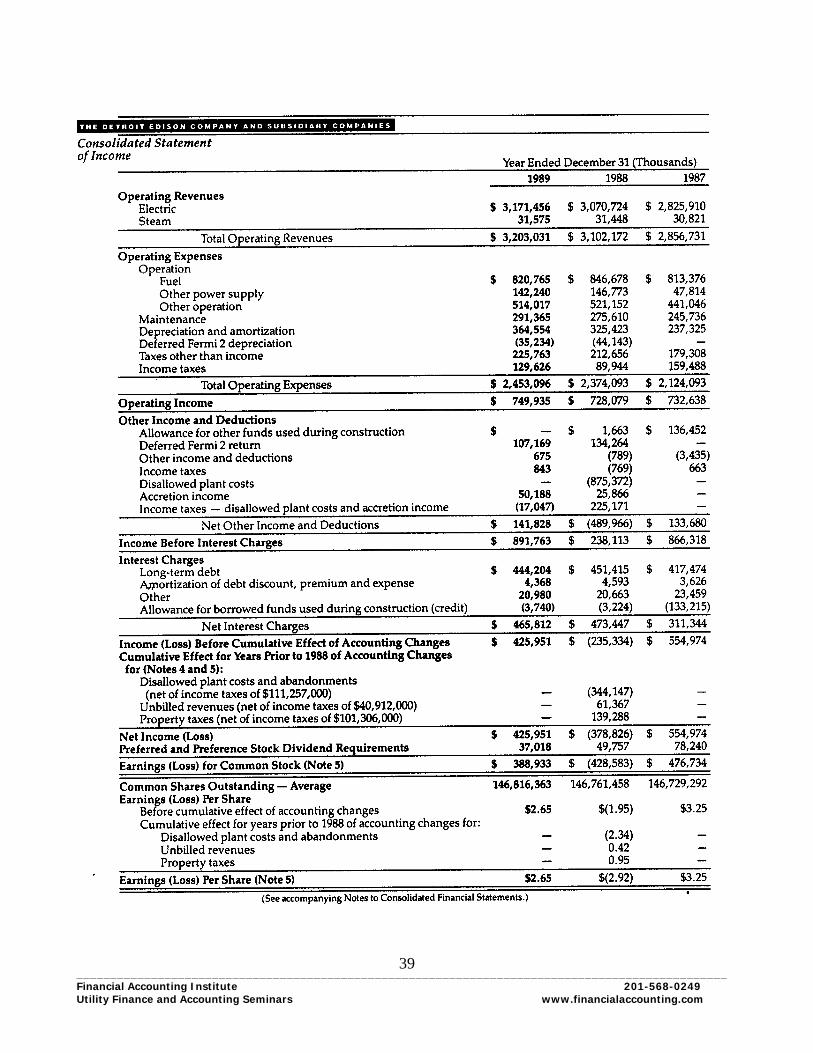
6-3 Revenue is shown as a part of Net Income even when this revenue has not yet been collected in cash. As long as this revenue increases an asset (e.g., accounts receivable), income is shown. What basic concept of accounting forces us to show income, even though the cash has not been collected? 6-4 The AFUDC income, which a utility shows on its Income Statement, is repre- sented by an increase in an asset, CWIP. The cash will be received for this in- creased asset as the ratepayers pay for this AFUDC in future years. The income is shown now and not in later years when this cash is collected. What basic concept of accounting calls for showing the income although the cash has not yet been received? 6-5 The biggest problem with the AFUDC income is that AFUDC is a non-cash income item. The cash for the AFUDC will not be seen for many years. It will be collected over the life of the plant (e.g., 20 to 30 years) and will not start to be collected until the plant is in use. Can the utility count on this AFUDC income to finance its continuing construction program? 6-6 The AFUDC, if material in amount, is required to be shown on the Income Statement of an electric utility in two parts: the debt portion and the other (pre- ferred and equity) portion. How much is the AFUDC – Debt and AFUDC --Equity for CE? 6-7 The Income Statement for Detroit Edison is on the next page. Add together the two parts of the AFUDC shown for 1987 in order to get the total AFUDC. Be careful to notice that both numbers increase income although one is shown as a negative number. Of the total Earnings on Common Shares for Detroit Edison in 1987, what percent is made up of AFUDC?
________________________________________________________________________________________________ Financial Accounting Institute 201-568-0249 Utility Finance and Accounting Seminars www.financialaccounting.com
39
________________________________________________________________________________________________ Financial Accounting Institute 201-568-0249 Utility Finance and Accounting Seminars www.financialaccounting.com
40
6-8 The above results indicate how significant AFUDC may be for a utility. If a utility had a large percentage of income as AFUDC, it would be in a form which cannot be used to pay dividends, interest or construction costs. Theoretically, however, this income is just as good as any income, it is just not in cash now. What two things must happen before this income can be collected in cash? (Hint: what must be the status of the CWIP and what must the regulators do?) 6-9 With a large percentage of AFUDC to Earnings, the uncertainty associated with the completion and regulatory action with respect to the full recovery of construc- tion (and AFUDC) costs causes investors much concern. If the construction were to be stopped, or once construction is completed it is not at all clear whether the ratepayers would have to pay the total costs for the plant or whether the common shareholders would have to take a loss on the plant (in the form of lower assets and owners' equity). (No answer required.) 6-10 Investors look upon AFUDC income as lower quality income. Other things being equal, we would expect utilities which have substantial AFUDC to have PE ratios which are different than the PE ratios for utilities with little or no AFUDC. Which utilities would have higher PE ratios?
________________________________________________________________________________________________ Financial Accounting Institute 201-568-0249 Utility Finance and Accounting Seminars www.financialaccounting.com
41
6-11 Some of the financial ratios which are used are sometimes calculated without considering the AFUDC. Would it make sense to exclude the AFUDC when we calculate a Times Interest Earned Ratio? Why? 6-12 Theoretically, the amount of AFUDC should be determined by the costs of financing the CWIP. However, this figure is not easily obtained and different methods are used to make an approximation. Each PUC decides what the AFUDC rate will be. What was the rate used by CECONY for 2011? (See page 88) 6-13 Sometimes ratepayers are required to pay the financing costs before con- struction is completed. This is accomplished by putting the CWIP into the rate base (the assets on which the utility is allowed by the PUC to earn a return). No AFUDC is needed when the revenue of the utility is made higher in order to give the utility its financing costs during the construction period. When CWIP is in rate base, the utility receives revenue in cash rather than AFUDC in the form of uncertain, future cash. Do you think CE has all of its CWIP in rate base?
________________________________________________________________________________________________ Financial Accounting Institute 201-568-0249 Utility Finance and Accounting Seminars www.financialaccounting.com
42
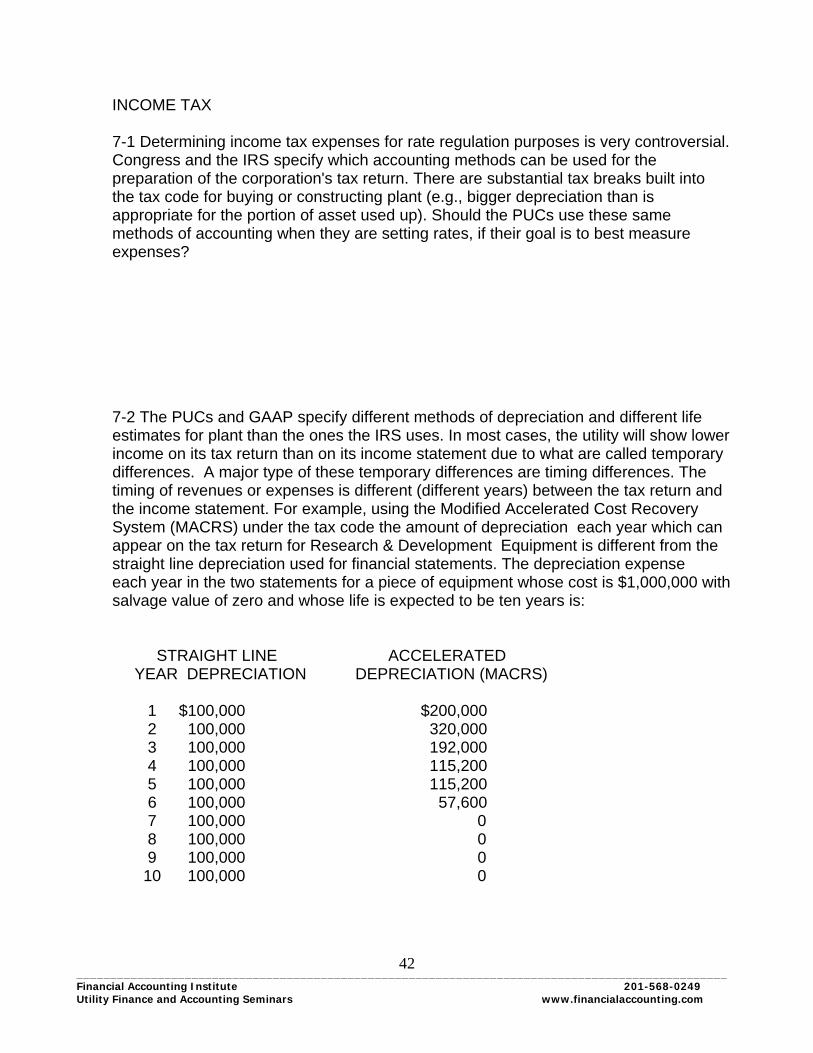
INCOME TAX 7-1 Determining income tax expenses for rate regulation purposes is very controversial. Congress and the IRS specify which accounting methods can be used for the preparation of the corporation's tax return. There are substantial tax breaks built into the tax code for buying or constructing plant (e.g., bigger depreciation than is appropriate for the portion of asset used up). Should the PUCs use these same methods of accounting when they are setting rates, if their goal is to best measure expenses? 7-2 The PUCs and GAAP specify different methods of depreciation and different life estimates for plant than the ones the IRS uses. In most cases, the utility will show lower income on its tax return than on its income statement due to what are called temporary differences. A major type of these temporary differences are timing differences. The timing of revenues or expenses is different (different years) between the tax return and the income statement. For example, using the Modified Accelerated Cost Recovery System (MACRS) under the tax code the amount of depreciation each year which can appear on the tax return for Research & Development Equipment is different from the straight line depreciation used for financial statements. The depreciation expense each year in the two statements for a piece of equipment whose cost is $1,000,000 with salvage value of zero and whose life is expected to be ten years is: STRAIGHT LINE ACCELERATED YEAR DEPRECIATION DEPRECIATION (MACRS) 1 $100,000 $200,000 2 100,000 320,000 3 100,000 192,000 4 100,000 115,200 5 100,000 115,200 6 100,000 57,600 7 100,000 0 8 100,000 0 9 100,000 0 10 100,000 0

________________________________________________________________________________________________ Financial Accounting Institute 201-568-0249 Utility Finance and Accounting Seminars www.financialaccounting.com
43
a. What is the total amount of depreciation expense over the ten year period for financial statement purposes? b. What is the total amount of tax depreciation over the ten years? c. How do you explain the fact that the total depreciation is the same regardless of which accounting method is used? d. In what sense is the difference in the financial statement depreciation versus tax depreciation a timing difference? e. How does the use of the accelerated depreciation push off paying taxes? (This excess of the accelerated depreciation over straight line depreciation creates de- ferred taxes.) f. In what way do the deferred taxes turn around and have to be paid?
________________________________________________________________________________________________ Financial Accounting Institute 201-568-0249 Utility Finance and Accounting Seminars www.financialaccounting.com
44
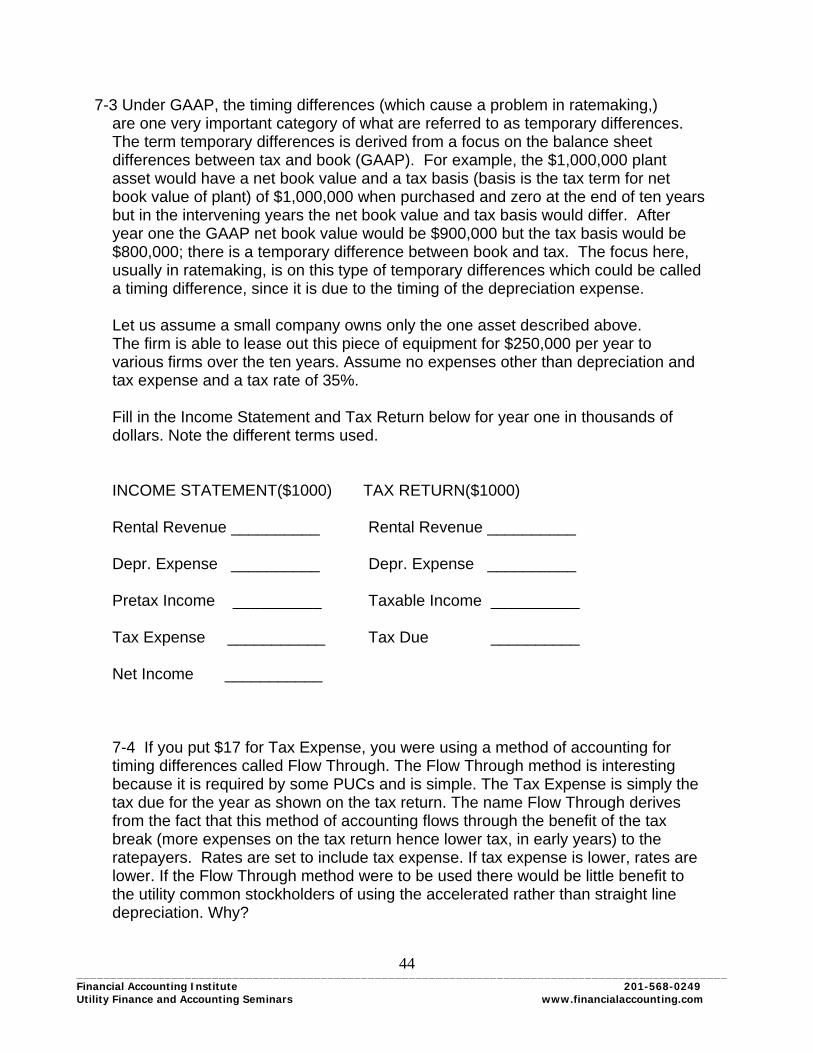
7-3 Under GAAP, the timing differences (which cause a problem in ratemaking,) are one very important category of what are referred to as temporary differences. The term temporary differences is derived from a focus on the balance sheet differences between tax and book (GAAP). For example, the $1,000,000 plant asset would have a net book value and a tax basis (basis is the tax term for net book value of plant) of $1,000,000 when purchased and zero at the end of ten years but in the intervening years the net book value and tax basis would differ. After year one the GAAP net book value would be $900,000 but the tax basis would be $800,000; there is a temporary difference between book and tax. The focus here, usually in ratemaking, is on this type of temporary differences which could be called a timing difference, since it is due to the timing of the depreciation expense. Let us assume a small company owns only the one asset described above. The firm is able to lease out this piece of equipment for $250,000 per year to various firms over the ten years. Assume no expenses other than depreciation and tax expense and a tax rate of 35%. Fill in the Income Statement and Tax Return below for year one in thousands of dollars. Note the different terms used. INCOME STATEMENT($1000) TAX RETURN($1000) Rental Revenue __________ Rental Revenue __________ Depr. Expense __________ Depr. Expense __________ Pretax Income __________ Taxable Income __________ Tax Expense ___________ Tax Due __________ Net Income ___________ 7-4 If you put $17 for Tax Expense, you were using a method of accounting for timing differences called Flow Through. The Flow Through method is interesting because it is required by some PUCs and is simple. The Tax Expense is simply the tax due for the year as shown on the tax return. The name Flow Through derives from the fact that this method of accounting flows through the benefit of the tax break (more expenses on the tax return hence lower tax, in early years) to the ratepayers. Rates are set to include tax expense. If tax expense is lower, rates are lower. If the Flow Through method were to be used there would be little benefit to the utility common stockholders of using the accelerated rather than straight line depreciation. Why?
________________________________________________________________________________________________ Financial Accounting Institute 201-568-0249 Utility Finance and Accounting Seminars www.financialaccounting.com
45
7-5 Flow Through is not allowed for ratemaking purposes for those timing differ- ences due to the use of the Accelerated Cost Recovery System or MACRS on the federal tax return. Congress, in 1981, forced the PUCs to allow the utilities to "keep" the tax benefits of the ACRS and MACRS depreciation. The alternative accounting method for the timing differences (called the liability Method) is usually called normalization in the utility industry. Normalization gives the ratepayers the tax break (through lower rates) over the regulatory life of the MACRS equipment. Normalization allows the utility to keep the cash tax savings until given to the ratepayers (since the utility has extra cash due to this tax break, rate base is often reduced by this interest free capital). Normalization refers to using the normal amount of tax expense which goes with the Pretax Income shown on the Income Statement or calculated for ratemaking purposes. a. For our simple example and using the Flow Through method, what is the ratio of Tax Expense to Pretax Income? (Remember, when we use the Flow Through method, the Tax Expense is the Tax Due.) b. This amount does not look normal since the tax rate is 35%. In order to get a normal amount of tax expense, what amount would be needed? This is the tax expense using normalization. c. The normalization method uses the Pretax Income on the Income Statement to find Tax Expense. The actual tax due is not relevant. In this simple situation, the Pretax Income is simply multiplied by the tax rate to get the Tax Expense. The Tax Ex- pense figure can now be thought of as being made up of two parts. Match the names of these parts with the appropriate descriptions: ____ I. current tax expense A. tax not due until the timing difference turns around ____ II. deferred tax expense B. tax due d. How does accrual accounting help us justify the showing of tax expense as a figure different than the amount paid or to be paid soon?

________________________________________________________________________________________________ Financial Accounting Institute 201-568-0249 Utility Finance and Accounting Seminars www.financialaccounting.com
46
7-6 When using the liability or normalization method, the tax expense is in part paid currently (i.e., cash is reduced or a taxes payable liability created to be paid in cash soon) and in part deferred. The deferred part of the tax expense is shown as a deferred tax liability. If a company had tax expense of 52.5 but the current portion was only 17.5, how much would the deferred tax liability increase? 7-7 The deferred tax liability is a strange sort of liability since the tax is really not owed to the government. As far as the IRS is concerned, the only tax due is the current portion of the tax expense; that is, the figure which shows up on this years' tax return. For this reason, the deferred tax liability is often referred to as a deferred tax credit. (Beware the term credit. In general, credit does not refer to something good. In this case, it represents dollars to be paid in tax in the future.) What does CE call the Deferred Tax Liability on its Balance Sheets? 7-8 It is possible to have a deferred tax asset on the Balance Sheet, but this is usually not a large amount for a utility. Deferred tax liabilities come about when temporary differences in assets or liabilities between the tax and book balance sheets result in paying taxes later rather than earlier. A deferred tax asset is created when the opposite occurs. That is, a deferred tax asset is created when expenses appear on the Income Statement before they appear on the tax return. Does the utility like to create deferred tax assets? Why? 7-9 CE shows Income Tax on one of the last lines on the Income Statement. This income tax expense includes both federal and state income taxes. What is the total income tax expense for 2011?
________________________________________________________________________________________________ Financial Accounting Institute 201-568-0249 Utility Finance and Accounting Seminars www.financialaccounting.com
47
7-10 Is the total Income Tax a good approximation for the amount of tax the company is going to pay for the year? Why? 7-11 The company must tell how much it owes in taxes to the IRS (and often the state or foreign governments) and to reconcile this amount due with the tax ex- pense figures on the Income Statement. This reconciliation is not in the same format from company to company. They are often very difficult to untangle. However, you can usually locate the current portion of the tax by looking for the word cur- rent. How much Federal and State Income Tax does CE have to pay for 2011? (See page 119) 7-12 The company in the financial statements must explain two specific items of concern (if these items are material in amount). One of these items is a reconcilia- tion of how much tax the company has to pay versus the tax expense which show up on the face of the Income Statement. This reconciliation may not be labeled very well. Which of the three charts on page 119-120 contains this reconcilia- tion? Hint: It obviously must contain the current tax figure if it is to reconcile this to tax expense. 7-13 What does the bottom line in this chart represent?
________________________________________________________________________________________________ Financial Accounting Institute 201-568-0249 Utility Finance and Accounting Seminars www.financialaccounting.com
48
7-14 Looking at the first chart on page 120 we can get some insight into
what has caused the deferred tax liabilities. The causes of these timing differ- ences are important to us. What are the three largest causes of the deferred tax liabilities?
7-15 If the timing difference, in aggregate, does not turn around, then these taxes are not paid. Stating this a different way, although the deferred taxes due to the older plant turn around, and are paid, new deferred taxes are created by new plant to offset these depreciation timing differences. Do the timing differences caused by largest three items appear to be turning around? 7-16 The fact that some of the timing differences in total may never turn around indicates a liability on the Balance Sheet may be too big and an expense on the Income Statement may be too big as well. What items are these?
7-17 By analysis, we could adjust the tax expense on the Income Statement for CE. If we felt the 2011 additional tax due to the plant difference would not be paid in the future and should therefore not be an expense, by what amount would Net Income change?

________________________________________________________________________________________________ Financial Accounting Institute 201-568-0249 Utility Finance and Accounting Seminars www.financialaccounting.com
49
7-18 One other reconciliation is also required in the financial statements if material in amount. This disclosure, which usually takes the form of a chart, explains why the tax expense figure (the number included in Net Income on the face of the Income Statement) is not equal to the federal tax rate times pretax income. In other words, if you take the pretax income (income before tax) from the Income State- ment figures and multiplied this by 35%, the chart explains why this result differs from the tax expense. For CE this is the second table on page 120. a. One reason that tax expense differs from the statutory (by statute or law) rate is the method of accounting for the temporary differences which we saw earlier. What method may be used for some of the temporary differences if they are unrelated to the tax depreciation differences?
b. A second reason is that some of the pretax income is either not tax deductible or is a tax in addition to the federal (eg. State taxes.) What item of this nature is shown in the chart?
7-19 We have been seeing the Investment Tax Credit (ITC) without an explicit discussion of what it is and how we account for it in rate making and financial reporting. If a business firm purchased or constructed qualified equipment (e.g. new utility plant but not buildings), a credit against tax due of up to 10% of the cost was allowed under the tax law. This credit was taken on the tax return for the year in which the equipment was put into service (or during construction in some cases). For rate making purposes, the Economic Recovery Tax Act of 1981 forced the Public Utility Commissions to normalize this tax savings. Although ITC was eliminated in the Tax Reform Act of 1986, it was reintroduced for certain renewable generating plants with a 30% credit. The ratemaking treatment of these credits causes them to be relevant. a. The term "normalization" was used in our discussion of timing differences. When used in that context, did normalization flow the tax savings through to the ratepay- ers?
________________________________________________________________________________________________ Financial Accounting Institute 201-568-0249 Utility Finance and Accounting Seminars www.financialaccounting.com
50
b. The tax savings from the ITC is also not flowed through to the ratepayers but is spread (normalized) over the life of the equipment. (This is the life used for regula- tory not tax purposes.) If a utility had purchased $10,000,000 of qualified equip- ment, how much would the ITC on the tax return be? (Assume the utility was enti- tled to and took the maximum ITC.) c. If the equipment had a 30 year life for ratemaking purposes, how much of the ITC would be amortized for ratemaking and financial reporting purposes each year? d. This amortized amount will reduce income tax expense and therefore rates each year for how many years? e. The remainder of the ITC (i.e., that portion not yet amortized) will be deferred ITC on the Balance Sheet (a liability). This regulatory liability has the interpretation of the amount of ITC's which will be returned to the ratepayers in later years. How much will this be after the first year of amortization? 7-20 One other area of accounting for income taxes is relevant for some utilities. The tax code allows a net operating loss carryover (NOLCO). If a firm has a loss on its tax return, it can use this loss to get a refund of taxes paid in prior years (going back 2 years maximum) and/or offset taxes due in future years (up to a maxi- mum of 20). The carrybacks mean a refund of taxes is forthcoming from the IRS. Do you think these carrybacks should be included in Net Income in the year of the loss? Why? 7-21 The benefit of the tax loss carry forward (TLCF) will be included in the Net Income if the company believes it is probable that it will be profitable for tax purposes in the future such that it can use the TLCF. No answer required.
________________________________________________________________________________________________ Financial Accounting Institute 201-568-0249 Utility Finance and Accounting Seminars www.financialaccounting.com
51
ACCOUNTING FOR DERIVATIVES, HEDGING AND ENERGY TRADING ACTIVITIES 8-1 In recent years, the FASB has been concerned about the cost basis of accounting, especially with respect to trading activities where the market value of assets could be determined.
Although most assets and liabilities follow the cost basis of accounting, which of the two liabilities have names which clearly show that these liability’s balance sheet values are changed to market value at each balance sheet date?
8-2 GAAP accounting requires showing values on the Balance Sheet for derivatives. A derivative is a financial instrument which derives its value from some underlying value. For example, an option to buy stock derives its value from the price of the stock. The stock option is a derivative. Why does CE use derivatives? See page 127 . 8-3 Under GAAP there are six different ways of accounting for derivatives. The accounting treatment depends on why the derivative contract was entered into and in the case of hedge contracts, whether the hedge “works” (an effective hedge.) Does this sound complex? 8-4 For utility companies, the most common reason for entering into contracts which might look like derivatives, is to buy energy, fuel, gas, etc. for their customers, or to sell product to their customers. These contracts illustrate a major exception to market-to-market accounting which is referred to as the normal purchases or sales exception. These contracts follow settlement (or accrual) accounting. (No answer required)

________________________________________________________________________________________________ Financial Accounting Institute 201-568-0249 Utility Finance and Accounting Seminars www.financialaccounting.com
52
8-5 The second reason that the derivative was entered into would be for specula- tion or energy trading. If the derivative does not qualify for settlement accounting nor as an effective hedge, the accounting would also be done as described here. A simple illustration of how we value energy trading contracts would be a forward contract (a contract to buy in the future) for energy. Assume CE signs a contract in November 2011 to buy 10,000 MWH of energy for delivery during March, 2012 at a price of $50/MWH. On 12/31/11, energy for delivery during the same month in 2012 is selling for 60/MWH. a. What would be the value of this contract? b. For this one contract, what would the asset for energy trading activities be as of 12/31/11?
The name of the derivative asset on the summarized Balance Sheet of companies varies. What is the amount of the net derivatives asset for CE as of 12/31/11? See page 128.
8-6 Any gains or losses due to these energy trading activity contracts must be shown in Net Income. These gains and losses are measured as the change in the value of the assets during the quarter or during the year. What would be the impact on Earnings before tax of the energy trading contract in the last example for 2011?
________________________________________________________________________________________________ Financial Accounting Institute 201-568-0249 Utility Finance and Accounting Seminars www.financialaccounting.com
53
8-7 For a simple example of an energy trading liability, assume as of 12/31/11, the fair value of a contract to buy energy to be delivered in March 2012 is $35/MWH. The company has a contract to buy at a price ($50) which is higher than the current forward price ($35) of this commodity. a. Under mark-to-market accounting, how much would the Energy Trading Liability be? b. What would be the 2011 loss before tax? 8-8 Many derivative instruments follow mark-to-market accounting. Important exceptions are normal purchases or sales contracts executed in the ordinary course of business with probable future delivery. The company will need to determine for each of its contracts or financial instruments whether they are derivatives under the GAAP rules. a. Would a contract to buy natural gas for five years at a fixed price in order to use for generation at the electric utility or deliver to customers at a gas distribution company use mark-to-market accounting? Why? b. The contracts that CE shows amounts for in the tables of page 117 would meet the “normal purchases” exception. Why?

________________________________________________________________________________________________ Financial Accounting Institute 201-568-0249 Utility Finance and Accounting Seminars www.financialaccounting.com
54
8-9 Although most derivatives will be shown on the Balance Sheet at fair value in the same manner as energy trading contracts or equities securities the change in the value of the derivatives will not always be included in the Net Income of the Firm. Each derivative needs to be classified into one of the following categories to determine whether the change in value ends up in Net Income. The six categories are: 1. Normal sales of purchases exception 2. Speculation or ineffective hedge 3. A fair value hedge 4. A cash flow hedge 5. A hedge where the gain or loss goes to the ratepayers through a fuel or gas adjustment clause 6. A foreign currency hedge 8-10 A fair value hedge is a derivative which offsets a company’s exposure to the changes in the fair value of one of their assets, liabilities or an unrecognized commitment. For example, a forward contract to sell energy at a fixed price could be entered into hedge a purchase commitment to buy energy at a fixed price. To perfectly hedge a commitment to buy 10,000 MWH at $50 in March 2014, what kind of contract could be entered into? 8-11 For fair value hedges, the derivatives and hedged asset, liability or commitment will be marked-to-market. If the hedge is effective, there will be no gain or loss. If the hedge is not effective, the gain or loss goes to the net income. Notice that a fair value hedge of a purchase commitment will require that purchase commitment to be shown at value in the Balance Sheet. 8-12 A company has natural gas in storage at a cost of $5/MCF. If the value of the gas goes up to $7, the company will have an unrealized gain of $2, but if the value were to drop to $4, it would have an unrealized loss of $1. To hedge against this fair value change, the company could enter into sales contract to sell gas at a fixed price. If the value of the gas goes up, this contract would decrease in value by the same amount as the gas increases in value, hence hedging the firm’s exposure to the fair value changes. Notice that the gas in storage will have to be on the Balance Sheet at Fair Value if this value is hedged. Assume a company has 10,000 MCF of gas in storage with a cost of $5 and a future contract to sell 10,000 MCF of gas at a fixed price. If the value of the gas goes up by one dollar, the fair value of the contract drops by 10,000. What is the gain or loss for the company?
________________________________________________________________________________________________ Financial Accounting Institute 201-568-0249 Utility Finance and Accounting Seminars www.financialaccounting.com
55
8-13 Another type of hedge is a cash flow hedge. This type of hedge protects the firm from variability in future cash flows. For example, the firm may be concerned that the cost of buying gas in the future will be higher than today’s price, hence requiring higher cash flows going out of the company. By entering into an option to buy gas at a fixed price, the firm could hedge the risk for these cash flow hedges. The portion of the hedge which is effective does not go into Net Income, but bypasses the Income Statement and is included in Other Comprehensive Income. (The ineffective portion of the hedge goes into Net Income). When the hedged position is closed out (e.g., when the gas is purchased), if the cost of gas is higher, the value of the option should have gone up by the same amount (for a perfect hedge). Both of these items are brought into income as the gas is sold, and the option value included in other comprehensive income is moved into Net Income at that time. 8-14 Reason number five for entering into a derivative contract is to hedge for the benefit of ratepayers. If gains or loses on hedges are included in an adjust- ment mechanism such as a fuel adjustment clause or a purchase gas adjustment clause, then any market-to-market gain or loss for hedges would be offsite by a regulatory liability or regulatory asset. 8-15 Reason number six - A foreign currency hedge has complex rules as to when and where the income or loss is shown.

________________________________________________________________________________________________ Financial Accounting Institute 201-568-0249 Utility Finance and Accounting Seminars www.financialaccounting.com
56
STATEMENT OF CASH FLOWS 9-1 The Statement of Cash Flows (page 70) is organized into three sections: Operating Activities, Investing Activities and Financing Activities. This organization explains all of the changes in cash and, at the same time, all of the changes in the other assets, liabilities and owners' equity. a. How much is the net cash provided by Operating Activities (sometimes called Cash
Flow)? b. How much is the cash used in Investing Activities? c. How much is the cash provided by Financing Activities? 9-2 The top part of the SCF gives us important information concerned with unravel- ing some of the accrual accounting figures shown on the Income Statement. The SCF almost always starts with an income figure and explains to us why this income is not cash. This is referred to as the indirect method. It tells us, in essence, how much more or less than this income the company generated in cash. a. For CE what is the title on first item which has dollar amounts to the right of it? b. What is the title of the last line of this reconciliation? c. The items in between these two explain why the accrual accounting income is not equal to the cash from operations. How many items, in 2011, explain the difference on the CE statement?
________________________________________________________________________________________________ Financial Accounting Institute 201-568-0249 Utility Finance and Accounting Seminars www.financialaccounting.com
57
9-3 The term Net Cash provided by operating activities is unfortunate since Oper- ating has a different definition here than Income from Operations (or Operating Income) has on the Income Statement. On the SCF, Operations means all items on the Income Statement except for gains and losses on investing or financing activities that are in Net Income. How is Operating Income defined on the Income Statement and how does this differ from the use of the term Operating on the SCF? 9-4 In order to reconcile income with Cash from operating activities (which could usually be rephrased, but never is, Cash from Net Income Items), we must show certain items were subtracted out when we determined Net Income but did not use any cash. We show these items as "add backs" to income. Other items use more cash than the expense amount subtracted from income. These amounts need to be subtracted from income to get to cash flow. Explain why the two largest of the positive figures for “add back” items for CE do not use cash. 9-5 The tax expense on the Income Statement is not the amount of tax due soon or already paid for the year. What portion of the tax expense for CE has not been paid because of deferred income taxes?
9-6 Shown on the next page is the Tucson Electric Statement of Cash Flows. They use a direct approach in presenting the cash from operating activities. Instead
of reconciling the cash from operating activities to the Net Income, the direct approach goes down the Income Statement and shows how much cash goes into and out of the bank from each income statement item. Notice how direct approach is much simpler than the reconciliation approach. In either way of presenting this, the Cash from Operations figure shows us how much the company has earned in cash from its business activities. Had CE used the direct approach, what would the amount be for their Net cash provided by operating activities (Cash Flow)?
________________________________________________________________________________________________ Financial Accounting Institute 201-568-0249 Utility Finance and Accounting Seminars www.financialaccounting.com
58
9-7 Out of this cash flow, dividends are paid, plant is built, and debt is retired. Look at the negative figures below CE’s Cash Flow. How much cash did they pay out for construction expenditures? 9-8 The company gets extra cash it needs from issuing stock and bonds. What did CE do in this regard?

________________________________________________________________________________________________ Financial Accounting Institute 201-568-0249 Utility Finance and Accounting Seminars www.financialaccounting.com
59
BEYOND THE BALANCE SHEET 10-1 The Balance Sheet shows us the Assets, Liabilities and Owners' Equity of the firm, as the accountant measures these items. These figures are not always what we might feel are the appropriate ones for a specific situation. Label each of the following as True or False: _____a. Utility plant is shown at its replacement cost (i.e., what it would cost to replace the plant) _____b. Common stockholders' equity is shown at the market value of the common stock _____ c. Long term debt is shown at the market value of this debt 10-2 Assets could be defined as economic resources which have benefit to the future. Applying this definition, which of the following would be assets: _____a. utility plant owned _____b. utility plant leased from others for its entire life _____c. franchise territory _____d. technical expertise of employees _____e. effective operations staff 10-3 However, accountants do not consider all economic resources, which have to benefit to the future to be assets. When the item does not have a measurable, out of pocket cost, it is usually not an asset. Even when the cost is measurable, the asset might be fully amortized (depreciated) while its value has not diminished. Most assets are never shown at an amount higher than its cost. Why are the following items usually not shown as assets: a. franchise territory b. technical expertise of employees c. effective operations staff

________________________________________________________________________________________________ Financial Accounting Institute 201-568-0249 Utility Finance and Accounting Seminars www.financialaccounting.com
60
10-4 Leased assets are a difficult problem since many leases are really financing arrangements and could better be considered a purchase of an asset and a loan. These leases are termed financing or capital leases. GAAP requires that capital leases be shown on the Balance Sheet as if the assets leased were owned by the company. Does CE have any capital leases? (see page 118) 10-5 Apparently, leased assets and the obligations to pay the rent, are not always shown on the Balance Sheet. Leases other than capital leases are termed operating leases. These leases are never shown on the Balance Sheet. Match the following by putting the appropriate letter next to the Roman numeral: _____ I. Financing Lease a. asset appears on Balance Sheet _____ II. Operating Lease b. asset and liability appears in Balance Sheet _____III. Purchase c. asset not on Balance Sheet 10-6 Does CE have any operating leases? (see page 118) 10-7 Explain why the term Off Balance Sheet Financing is appropriate for some leases.

________________________________________________________________________________________________ Financial Accounting Institute 201-568-0249 Utility Finance and Accounting Seminars www.financialaccounting.com
61
10-8 Other economic obligations which might not show up as liabilities on a company's Balance Sheet include: I. Commitments-usually executory contracts (i.e., those not yet fully executed or carried out). Some examples are on page 117 II. Contingencies- look at the item related to this on CE’s Balance Sheet. Some examples are on pages 115-116
III. Guarantees Some examples are on page 116 At what amount are these items shown on the Balance Sheet?
10-9 Concerning the commitments
a. How much does CECONY have to pay in the next 5 years for capacity and energy under long term contracts? (see page 117)
10-10 A general rule for contracts which have not been carried out is to show the impact of the contract on the assets, liabilities and owners' equity of the firm only to the extent that one party to the contract or the other has carried out the con- tract. We might call this the executory contract rule. The rule allows us to see why certain obligations do not show up as liabilities. For example, the utility enters into an employment agreement with a new Chief Executive Officer (CEO). The company agrees to pay $2,000,000 a year for five years and the CEO agrees to work for five years. a. When the contract is signed, to what extent has the company carried out the terms? b. When the contract is signed, to what extent has the CEO carried out the terms? c. At what amount will the obligations to pay the $2,000,000 per year for five years be shown as a liability?
________________________________________________________________________________________________ Financial Accounting Institute 201-568-0249 Utility Finance and Accounting Seminars www.financialaccounting.com
62
10-11 Which of the following types of contracts would not show up as liabilities due to the executory contract rule? _____a. Agreement to pay a construction firm $800,000,000 to build a facility. Work on the project is to begin next month. _____b. Purchase order for $100,000 of supplies to be delivered over the next two years. _____c. Take or pay contract agreeing to purchase power at stated prices for the next five years and agreeing to accept a specific amount each year. (The "take or pay" should more descriptively be called "take and pay or don't take and pay" since any power below the "specific amount" not taken must be paid for anyway.) _____d. Invoice to pay for $200,000,000 of power just received. _____e. Lease agreement which a company employee just signed to rent a Hertz car for two weeks at $229 per week. 10-12 A lease fits the definition of an executory contract but some leases (i.e., those which are really a purchase and a loan) will violate the executory contract rule. Which category of leases (operating or capital) violate the executory contract rule and which follow the rule? Violate ______________________ Follow _______________________ 10-13 Derivatives and energy trading contracts, which are market to market, clearly violate the executory contract rule. (No answer required) 10-14 The executory contract rule also causes some assets to be missing from the Balance Sheet. For example, if a financing (capital) lease were to follow the execu- tory contract rule, which asset would appear along with the lease liability?

________________________________________________________________________________________________ Financial Accounting Institute 201-568-0249 Utility Finance and Accounting Seminars www.financialaccounting.com
63
10-15 Concerning the Contingencies. Under GAAP contingencies, events that may happen are not shown liabilities unless they are probable. On what page does CE start to discuss their many contingencies? 10-16 Many of the off balance sheet assets and liabilities are disclosed in the Notes if material in amount. The financial statement figures can be adjusted for these differences whenever you feel this is appropriate. These adjustments might change the financial ratios you are interested in. (No answer required)

________________________________________________________________________________________________ Financial Accounting Institute 201-568-0249 Utility Finance and Accounting Seminars www.financialaccounting.com
64
ANSWERS 1-1 a. 68 b. 69-77 c. 71-72 d. 69 e. 74 f. 70 1-2
a. Yes
b. Yes, on a per share basis c. yes, but they have excluded some “special items” d. yes e. no f. no g. yes h. no
i. yes 2-1 The end of the day on December 31, 2010 and 2011 (only the last two years are required - hence most companies only show 2 years) 2-2 a. 10,143 b. 213 c. 11,436 d 21,792
________________________________________________________________________________________________ Financial Accounting Institute 201-568-0249 Utility Finance and Accounting Seminars www.financialaccounting.com
65
2-3 a. 46.5% b. 1.0% c. 52.5% (Remember: When your calculator has .4859 as the answer, this is 48.59% and when rounded is 48.6%) 2-4 Long-term debt 2-5 No answer required 2-6 39,214 2-7 39,214 2-8 Assets = Liabilities + Owners' Equity 2-9 Utility Plant 2-10 Property, Plant and Equipment 2-11 Current Assets 2-12 Capitalization or Common Shareholders' Equity 2-13 Current Assets Utility Plant Other Noncurrent Assets 2-14 a. 29,775 b. No 2-15 Accumulated depreciation
________________________________________________________________________________________________ Financial Accounting Institute 201-568-0249 Utility Finance and Accounting Seminars www.financialaccounting.com
66
2-16 a.
End of Year 3 4 Original Cost 60,000 60,000 Accumulated Depreciation 30,000 40,000 Net Book Value 30,000 20,000
b.
c. Straight Line d. Straight Line Depreciation e. Plant and Depreciation 2-17. Plant is not depreciated until it is in service 2-18 No

________________________________________________________________________________________________ Financial Accounting Institute 201-568-0249 Utility Finance and Accounting Seminars www.financialaccounting.com
67
2-19 a. Fuel and Accounts Receivable b. They are shown at what they cost. (Except for non-regulated items which are at lower of cost or market.) 2-20 No, except for the term Deferred Credits on the liability side of the Balance Sheet. 2-21 a. 9,337 + 164 = 9,501 b. 681 2-22 a. 4 b. 3 c. 2 d. 1 2-23 Long-term debt.due within one year 3-1 Statement of Financial Position 3-2 No answer required 3-3 5023 (32 + 4991) 3-4 Reinvested Earnings 3-5 Retained Earnings and Accumulated Other Comprehensive Income/(Loss) 3-6 There are more shares of stock. 3-7 No answer required 3-8 Statement of Common Shareholder’s Equity 3-9 Net Income for common stock Common Stock divide
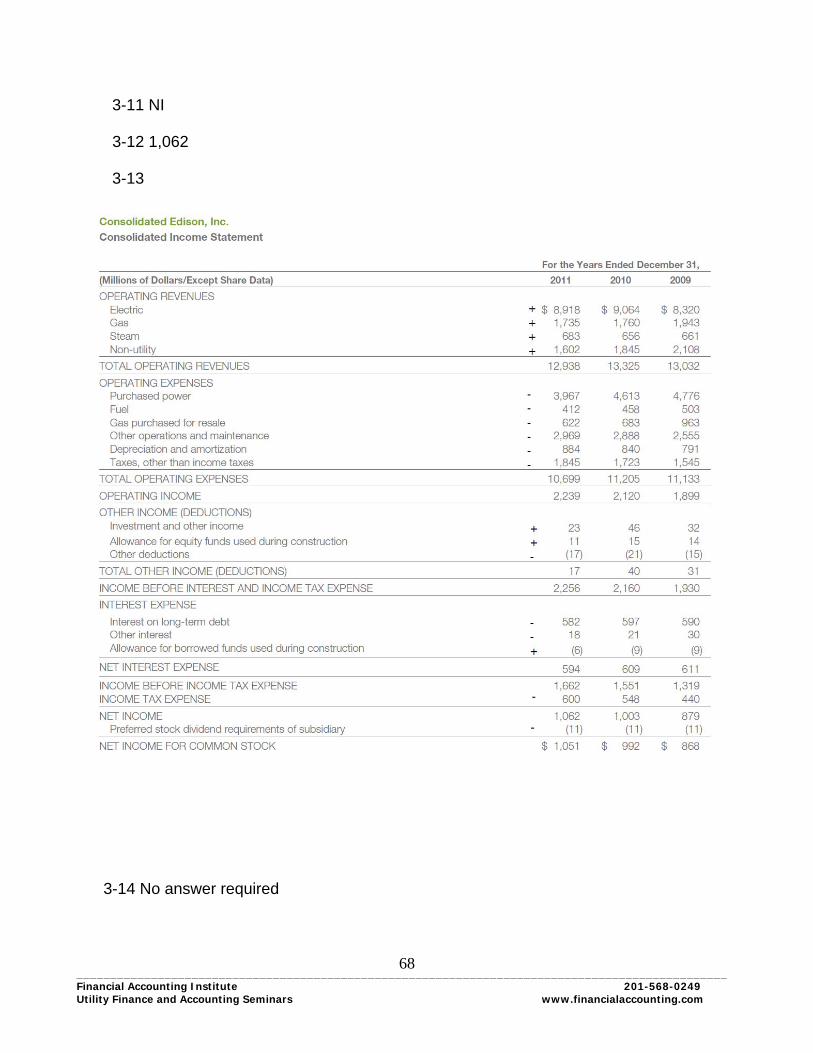
________________________________________________________________________________________________ Financial Accounting Institute 201-568-0249 Utility Finance and Accounting Seminars www.financialaccounting.com
68
3-11 NI 3-12 1,062 3-13
3-14 No answer required
________________________________________________________________________________________________ Financial Accounting Institute 201-568-0249 Utility Finance and Accounting Seminars www.financialaccounting.com
69
3-15 Operating Revenues Operating Expenses Other Income Interest Expense Income Tax Expense 3-16 No, since expenses are not shown by segment. Page 126 contains information in this regard. 3-17 a. Yes b. No c. No d. No 3-18 The next year 3-19 No, only how much revenue was earned in cash, accounts receivable and unbilled revenue. 3-20 a. Accounts Receivable –customers 1,123 b. 12,938 3-21 10,699 3-22 No
________________________________________________________________________________________________ Financial Accounting Institute 201-568-0249 Utility Finance and Accounting Seminars www.financialaccounting.com
70
3-23 No, since an expense is a cost necessary to get revenue and the 1887 was not needed to get revenue in 2011.. 3-24 1/40 if we assume it is used up evenly over the 40 years with 0 salvage value and 0 removal cost (or 1887/40=47.2) 3-25 Straight line 3-26 Accrual 3-27 a. 884/1887=46.8% b. No 3-28 c 3-29 No, it gives us the cost of plant added. The utility may have added more or less plant capacity than the amount used up. 3-30 d 3-31 a. Net Income and Net Income for Common Stock b. 1051/292.6=3.59 Yes. 4-1 a. No b. No c. No d. No
________________________________________________________________________________________________ Financial Accounting Institute 201-568-0249 Utility Finance and Accounting Seminars www.financialaccounting.com
71
4-2 a. Income Statement b. 3 . 4-3 Balance Sheet 4-4
a. (11,061 + 11,436)/2=11,248 b. 1051/ 11,248 = 9.34% 4-5 2.40/49.57 + (62.03 – 49.57)/49.57 = 4.84% + 25.14% = 29.98% 4-6 No 4-7 a. Accrual b. Dividends 4-8 2.40/3.59=66.9% 4-9 Stock price appreciation (or stock price decline if a negative return). 4-10 11,436/291.616 =39.22 4-11 No answer required
________________________________________________________________________________________________ Financial Accounting Institute 201-568-0249 Utility Finance and Accounting Seminars www.financialaccounting.com
72
4-12 Income before Interest and Income Taxes 2256 Divided by Interest Expense 600 = Times Interest Earned 3.76 4-13 62.03/3.57=17.4 4-14 A different point in time
4-15 AT&T- It has the highest expected growth in earnings. 4-16 Future growth of earnings, and therefore dividends and/or stock price growth is expected to be greater than the regulated utility. 4-17 a. 10,699 b. Companies vary in size. c. 10,699/12,938=82.7% 5-1 The accompanying notes are an integral part of these financial statements 5-2
A. 1,3 H. 4 B. 3,4 I. 4 C. 3,4 J. 4 D. 3 K. 3 E. 2 L. 3 F. 2 G. 3,4
5-3 a,c
________________________________________________________________________________________________ Financial Accounting Institute 201-568-0249 Utility Finance and Accounting Seminars www.financialaccounting.com
73
5-4 1. Impairments 2. Plant and Depreciation – Utility Plant 3. Federal Income Tax 4. Plant and Depreciation – Utility Plant 5. Accounting Policies 5-5 CECONY and O&R 5-6 a. c b. e c. c
5-7 “indirect costs such as engineering supervision, payroll taxes, pensions other benefits and … AFDC.” Page 88
5-8 Construction Works in Progress (CWIP) 5-9
a. These costs will be collected from ratepayers in the future
b. These costs will be collected from ratepayers in the future – an regulatory asset of 14 or returned to the ratepayers – a regulatory liability of 51.
5-10 Depreciation 5-11 No answer required 5-12 Pretax Income. This would allow the company to pay tax on lower profits than it shows to the regulators and financial statement users.
5-13 Expanded disclosure requirements in Fair Value Measurements in order to make the wording of US GAAP more like IFRS (International Financial Reporting Standards) the GAAP used by most countries .

________________________________________________________________________________________________ Financial Accounting Institute 201-568-0249 Utility Finance and Accounting Seminars www.financialaccounting.com
74
5-14 No, the tax rules are made by Congress not the FASB. 5-15 New York State Public Service Commission 5-16 No 5-17 Regulatory Assets and Liabilities 5-18 a, d, e 5-19 I. b II. c III. a IV. d 6-1 b, c, d 6-2 a. True b. True c. True 6-3 Accrual accounting 6-4 Accrual accounting 6-5 No, only cash can be used to pay for construction. 6-6 AFUDC – Debt 6 AFUDC - Equity 11 6-7 269,667/476,734 = 56.6%
________________________________________________________________________________________________ Financial Accounting Institute 201-568-0249 Utility Finance and Accounting Seminars www.financialaccounting.com
75
6-8 a. First, CWIP must be put into service, i.e., become utility plant in service. b. Second, the regulators must allow the cost of the plant (formally CWIP) to be collected from the ratepayers through depreciation. 6-9 No answer required. 6-10 Those with little or no AFUDC. 6-11 Yes, since the ratio is intended to show the degree of safety in paying, with cash, the interest. The AFUDC is not cash and may be misleading if included in the Net Income. 6-12 6.9% 6-13 No, since it has some AFUDC. 7-1 No 7-2
a. $1,000,000 b. $1,000,000
c. The cost of the assets is being spread (allocated) over a period of time. The total amount will be the same since each method of accounting is based on spreading the same cost. d. The timing of the expense is different although the total is the same. The $1,000,000 shows up in different amounts in different years. e. Higher deductions in earlier years reduces taxes. f. In later years, less deductions (0 in years 7 through 10) are allowed on the tax return and hence higher taxes will be paid than if straight line depreciation had been used.
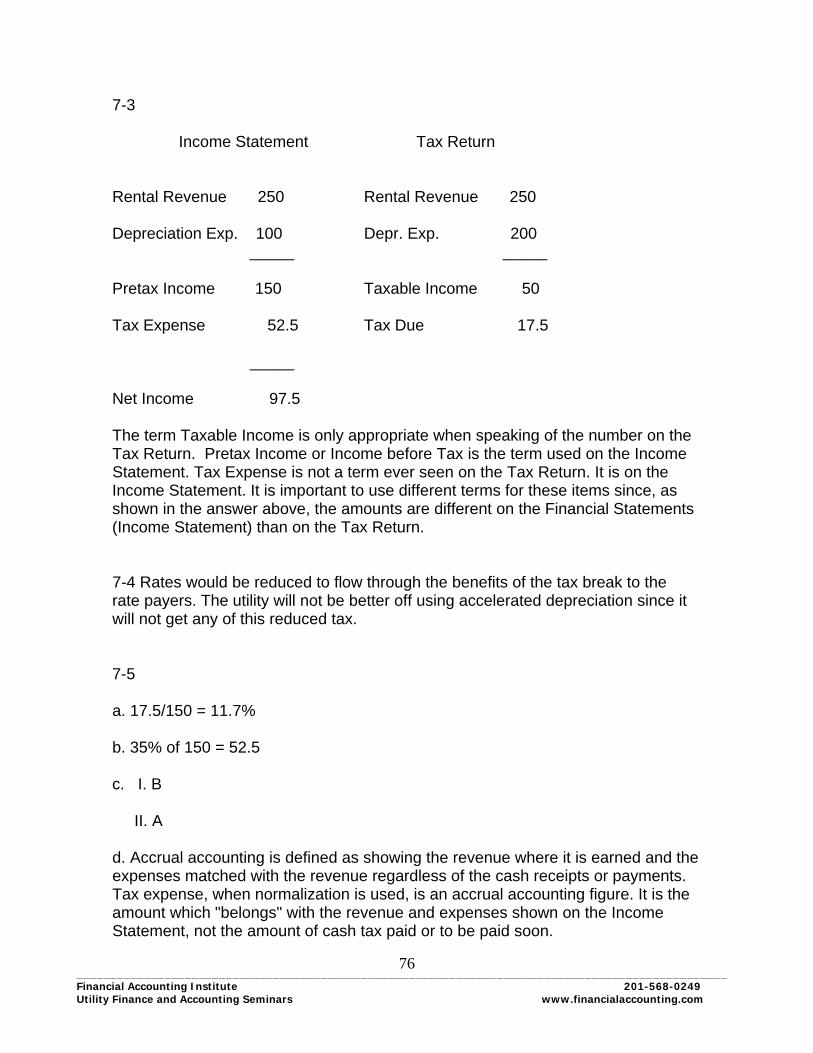
________________________________________________________________________________________________ Financial Accounting Institute 201-568-0249 Utility Finance and Accounting Seminars www.financialaccounting.com
76
7-3 Income Statement Tax Return Rental Revenue 250 Rental Revenue 250 Depreciation Exp. 100 Depr. Exp. 200 _____ _____ Pretax Income 150 Taxable Income 50 Tax Expense 52.5 Tax Due 17.5 _____ Net Income 97.5 The term Taxable Income is only appropriate when speaking of the number on the Tax Return. Pretax Income or Income before Tax is the term used on the Income Statement. Tax Expense is not a term ever seen on the Tax Return. It is on the Income Statement. It is important to use different terms for these items since, as shown in the answer above, the amounts are different on the Financial Statements (Income Statement) than on the Tax Return. 7-4 Rates would be reduced to flow through the benefits of the tax break to the rate payers. The utility will not be better off using accelerated depreciation since it will not get any of this reduced tax. 7-5 a. 17.5/150 = 11.7% b. 35% of 150 = 52.5 c. I. B II. A d. Accrual accounting is defined as showing the revenue where it is earned and the expenses matched with the revenue regardless of the cash receipts or payments. Tax expense, when normalization is used, is an accrual accounting figure. It is the amount which "belongs" with the revenue and expenses shown on the Income Statement, not the amount of cash tax paid or to be paid soon.
________________________________________________________________________________________________ Financial Accounting Institute 201-568-0249 Utility Finance and Accounting Seminars www.financialaccounting.com
77
7-6 35 7-7 Deferred income taxes 7-8 No, since they would be paying more than would be shown as appropriate on the Income Statement. 7-9 600 7-10 No. This is an accrual accounting figure and does not represent payments of cash. We know some of this tax expense may be deferred. 7-11 56 + 63 = 119 7-12 The first one. 7-13 Income Tax Expense (Total) 7-14 Depreciation Regulatory Asset – future income tax Unrecognized Pension… 7-15 No, the deferred tax liability due to these three items are going up from 2010 to 2011
7-16 Deferred tax Liability and Income Tax Expense 7-17 3,699 – 3,083 = 616 higher 7-18 a. Flow through b. State income tax
________________________________________________________________________________________________ Financial Accounting Institute 201-568-0249 Utility Finance and Accounting Seminars www.financialaccounting.com
78
7-19 a. No b. 3,000,000 c. 3,000,000/30 = 100,000 d. 30 e. 2,900,000 7-21 Yes, they are due to events in that year and we are sure the refund is forth- coming. 7-22 No answer required 8-1 Fair value of derivative assets Fair value of derivative liabilities 8-2 To hedge market price fluctuations of purchases
8-3 Yes 8-4 No answer required 8-5 a. $60-$50 = $10 $10 x 10,000 = $100,000 value b. $100,000
c. 70 8-6 greater by $100,000

________________________________________________________________________________________________ Financial Accounting Institute 201-568-0249 Utility Finance and Accounting Seminars www.financialaccounting.com
79
8-7 a. $50- $35 = $15 x 10,000 = $150,000
b. $150,000 8-8 a. No, these would be ‘normal purchase’ contracts b. They were buying this capacity and energy in their ordinary course of business expecting to deliver this power to their customers. 8-9 No answer required 8-10 A forward sales contract to sell in March 2008 10,000 MWH at $50/MWH 8-11 No answer required 8-12 0 8-13 No answer required 8-14 No answer required 8-15 No answer required 9-1 a. 3,137 b. (2,150) c. (677) 9-2 a. Net Income b. Net Cash Flows From Operating Activities c. 18
________________________________________________________________________________________________ Financial Accounting Institute 201-568-0249 Utility Finance and Accounting Seminars www.financialaccounting.com
80
9-3 Operation Income on the Income Statement refers to earnings from the main business activities of the company before financing costs and before income tax. Cash from operating activities on the SCF refers to all revenue and expenses providing or using cash except for gains or losses on financing or investing activities. Hence, operations on the Income Statement excludes items such as other income, interest expense, and income taxes while the SCF would consider these items as providing or using cash from operations. 9-4 Depreciation does not use any cash. Depreciation is the using up of a plant. The cash for plant was spent years ago when the plant was built, not this year. Some of the income tax expense was not paid in cash but was deferred instead. 9-5 491 9-6 3,137 9-7 1,887 9-8 Issued common stock for 118 10-1 a. False; shown at historical cost less accumulated depreciation. b. False; shown at the amount invested or left in business by common sharehold- ers. c. False. 10-2 all the answers (a-e) 10-3 a. The franchise territory is not shown as an asset because there is typically no out of pocket cost. b. Technical expertise of employees is not an out of pocket cost. c. Effective operations staff is not an out of pocket cost. 10-4 Yes with assets of 9 shown on the Balance Sheet

________________________________________________________________________________________________ Financial Accounting Institute 201-568-0249 Utility Finance and Accounting Seminars www.financialaccounting.com
81
10-5 I. b II. c III. a 10-6 Yes, with 263 of future obligation 10-7 Operating lease obligations do not show up as a liability. 10-8 Zero 10-9 492 + 491 + 433 + 221 + 158 = 1795 10-10 a. Terms not carried out; only an agreement to do so. b. Same as (a) above. c. Zero 10-11 a, b, c & e 10-12 Violate: Capital leases Follow: Operating leases 10-13 No answer required 10-14 The asset leased as utility plant. 10-15 Page 114 Note G 10-16 No answer required.

CG11
MAC
377
United StatesSecurities And Exchange Commission
Washington, D.C. 20549
FORM 10-K
È Annual Report Pursuant To Section 13 or 15(d) of the Securities Exchange Act of 1934
For The Fiscal Year Ended December 31, 2011
or
‘ Transition Report Pursuant to Section 13 or 15(d) of the Securities Exchange Act of 1934
For the transition period from to
Commission File Number 1-14514
CONSOLIDATED EDISON, INC.Exact name of registrant as specified in its charterand principal office address and telephone number
New York 13-3965100(State of Incorporation) I.R.S. Employer
ID. Number
4 Irving Place,New York, New York 10003
(212) 460-4600
Commission File Number 1-1217
CONSOLIDATED EDISON COMPANY OF NEW YORK, INC.Exact name of registrant as specified in its charterand principal office address and telephone number
New York 13-5009340(State of Incorporation) I.R.S. Employer
ID. Number
4 Irving Place,New York, New York 10003
(212) 460-4600
Securities Registered Pursuant to Section 12(b) of the Act:
Title of each className of each exchange
on which registered
Consolidated Edison, Inc.,Common Shares ($.10 par value) New York Stock Exchange
Consolidated Edison Company of New York, Inc.,$5 Cumulative Preferred Stock, without par value New York Stock ExchangeCumulative Preferred Stock, 4.65% Series C ($100 par value) New York Stock Exchange
Securities Registered Pursuant to Section 12(g) of the Act:
Title of each class
Consolidated Edison Company of New York, Inc.Cumulative Preferred Stock, 4.65% Series D ($100 par value)
CON EDISON ANNUAL REPORT 1

CG11
MAC
377
Glossary of TermsThe following is a glossary of frequently used abbreviations or acronyms that are used in the Companies’ SEC reports:
Con Edison Companies
Con Edison Consolidated Edison, Inc.CECONY Consolidated Edison Company of New York, Inc.Con Edison Development Consolidated Edison Development, Inc.Con Edison Energy Consolidated Edison Energy, Inc.Con Edison Solutions Consolidated Edison Solutions, Inc.O&R Orange and Rockland Utilities, Inc.Pike Pike County Light & Power CompanyRECO Rockland Electric CompanyThe Companies Con Edison and CECONYThe Utilities CECONY and O&R
Regulatory Agencies, Government Agencies, and Quasi-governmental Not-for-Profits
EPA U.S. Environmental Protection AgencyFERC Federal Energy Regulatory CommissionIRS Internal Revenue ServiceISO-NE ISO New England Inc.NJBPU New Jersey Board of Public UtilitiesNJDEP New Jersey Department of Environmental ProtectionNYISO New York Independent System OperatorNYPA New York Power AuthorityNYSAG New York State Attorney GeneralNYSDEC New York State Department of Environmental ConservationNYSERDA New York State Energy Research and Development AuthorityNYSPSC New York State Public Service CommissionNYSRC New York State Reliability Council, LLCPAPUC Pennsylvania Public Utility CommissionPJM PJM Interconnection LLCSEC U.S. Securities and Exchange Commission
Accounting
ABO Accumulated Benefit ObligationASU Accounting Standards UpdateFASB Financial Accounting Standards BoardLILO Lease In/Lease OutOCI Other Comprehensive IncomeSFAS Statement of Financial Accounting StandardsVIE Variable interest entity
Environmental
CO2 Carbon dioxideGHG Greenhouse gasesMGP Sites Manufactured gas plant sitesPCBs Polychlorinated biphenylsPRP Potentially responsible partySO2 Sulfur dioxideSuperfund Federal Comprehensive Environmental Response, Compensation and Liability Act of 1980
and similar state statutes
CON EDISON ANNUAL REPORT 3
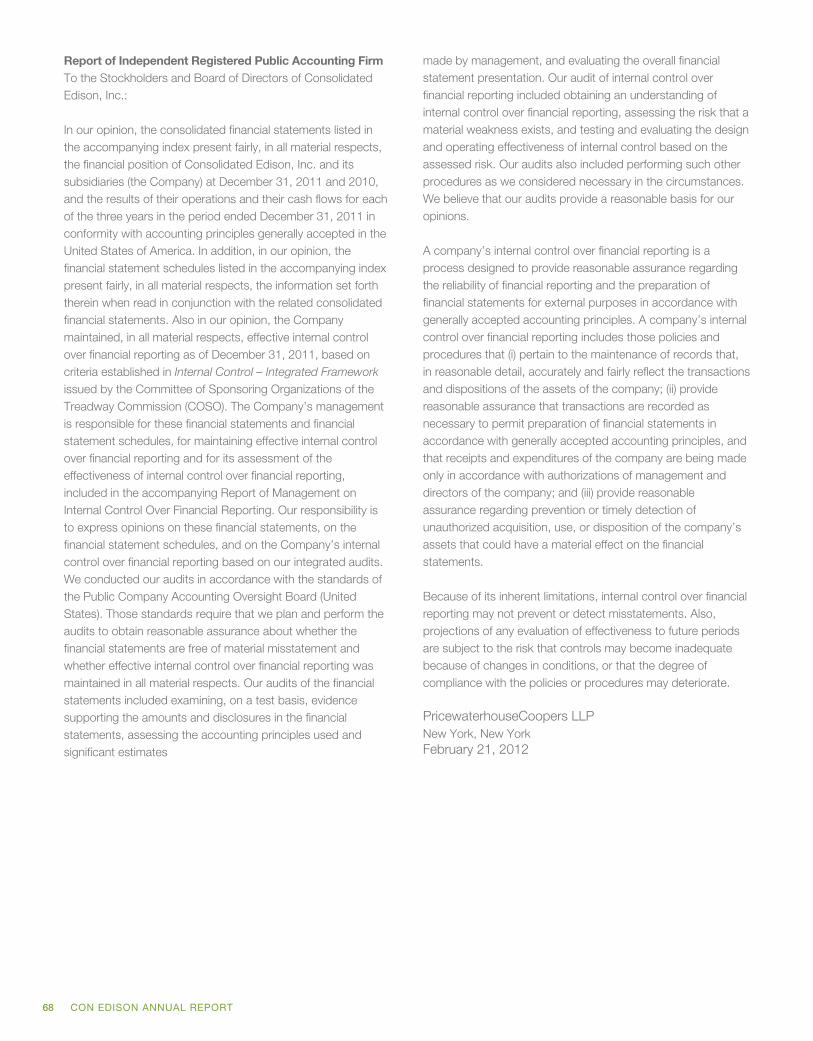
CG11
MAC
377
Report of Independent Registered Public Accounting FirmTo the Stockholders and Board of Directors of ConsolidatedEdison, Inc.:
In our opinion, the consolidated financial statements listed inthe accompanying index present fairly, in all material respects,the financial position of Consolidated Edison, Inc. and itssubsidiaries (the Company) at December 31, 2011 and 2010,and the results of their operations and their cash flows for eachof the three years in the period ended December 31, 2011 inconformity with accounting principles generally accepted in theUnited States of America. In addition, in our opinion, thefinancial statement schedules listed in the accompanying indexpresent fairly, in all material respects, the information set forththerein when read in conjunction with the related consolidatedfinancial statements. Also in our opinion, the Companymaintained, in all material respects, effective internal controlover financial reporting as of December 31, 2011, based oncriteria established in Internal Control – Integrated Frameworkissued by the Committee of Sponsoring Organizations of theTreadway Commission (COSO). The Company’s managementis responsible for these financial statements and financialstatement schedules, for maintaining effective internal controlover financial reporting and for its assessment of theeffectiveness of internal control over financial reporting,included in the accompanying Report of Management onInternal Control Over Financial Reporting. Our responsibility isto express opinions on these financial statements, on thefinancial statement schedules, and on the Company’s internalcontrol over financial reporting based on our integrated audits.We conducted our audits in accordance with the standards ofthe Public Company Accounting Oversight Board (UnitedStates). Those standards require that we plan and perform theaudits to obtain reasonable assurance about whether thefinancial statements are free of material misstatement andwhether effective internal control over financial reporting wasmaintained in all material respects. Our audits of the financialstatements included examining, on a test basis, evidencesupporting the amounts and disclosures in the financialstatements, assessing the accounting principles used andsignificant estimates
made by management, and evaluating the overall financialstatement presentation. Our audit of internal control overfinancial reporting included obtaining an understanding ofinternal control over financial reporting, assessing the risk that amaterial weakness exists, and testing and evaluating the designand operating effectiveness of internal control based on theassessed risk. Our audits also included performing such otherprocedures as we considered necessary in the circumstances.We believe that our audits provide a reasonable basis for ouropinions.
A company’s internal control over financial reporting is aprocess designed to provide reasonable assurance regardingthe reliability of financial reporting and the preparation offinancial statements for external purposes in accordance withgenerally accepted accounting principles. A company’s internalcontrol over financial reporting includes those policies andprocedures that (i) pertain to the maintenance of records that,in reasonable detail, accurately and fairly reflect the transactionsand dispositions of the assets of the company; (ii) providereasonable assurance that transactions are recorded asnecessary to permit preparation of financial statements inaccordance with generally accepted accounting principles, andthat receipts and expenditures of the company are being madeonly in accordance with authorizations of management anddirectors of the company; and (iii) provide reasonableassurance regarding prevention or timely detection ofunauthorized acquisition, use, or disposition of the company’sassets that could have a material effect on the financialstatements.
Because of its inherent limitations, internal control over financialreporting may not prevent or detect misstatements. Also,projections of any evaluation of effectiveness to future periodsare subject to the risk that controls may become inadequatebecause of changes in conditions, or that the degree ofcompliance with the policies or procedures may deteriorate.
PricewaterhouseCoopers LLPNew York, New YorkFebruary 21, 2012
68 CON EDISON ANNUAL REPORT

CG11
MAC
377
Consolidated Edison, Inc.Consolidated Income Statement
For the Years Ended December 31,
(Millions of Dollars/Except Share Data) 2011 2010 2009
OPERATING REVENUESElectric $ 8,918 $ 9,064 $ 8,320Gas 1,735 1,760 1,943Steam 683 656 661Non-utility 1,602 1,845 2,108
TOTAL OPERATING REVENUES 12,938 13,325 13,032
OPERATING EXPENSESPurchased power 3,967 4,613 4,776Fuel 412 458 503Gas purchased for resale 622 683 963Other operations and maintenance 2,969 2,888 2,555Depreciation and amortization 884 840 791Taxes, other than income taxes 1,845 1,723 1,545
TOTAL OPERATING EXPENSES 10,699 11,205 11,133
OPERATING INCOME 2,239 2,120 1,899
OTHER INCOME (DEDUCTIONS)Investment and other income 23 46 32Allowance for equity funds used during construction 11 15 14Other deductions (17) (21) (15)
TOTAL OTHER INCOME (DEDUCTIONS) 17 40 31
INCOME BEFORE INTEREST AND INCOME TAX EXPENSE 2,256 2,160 1,930
INTEREST EXPENSE
Interest on long-term debt 582 597 590Other interest 18 21 30Allowance for borrowed funds used during construction (6) (9) (9)
NET INTEREST EXPENSE 594 609 611
INCOME BEFORE INCOME TAX EXPENSE 1,662 1,551 1,319INCOME TAX EXPENSE 600 548 440
NET INCOME 1,062 1,003 879Preferred stock dividend requirements of subsidiary (11) (11) (11)
NET INCOME FOR COMMON STOCK $ 1,051 $ 992 $ 868
Net income for common stock per common share — basic $ 3.59 $ 3.49 $ 3.16
Net income for common stock per common share — diluted $ 3.57 $ 3.47 $ 3.14
DIVIDENDS DECLARED PER SHARE OF COMMON STOCK $ 2.40 $ 2.38 $ 2.36
AVERAGE NUMBER OF SHARES OUTSTANDING — BASIC (IN MILLIONS) 292.6 284.3 275.2
AVERAGE NUMBER OF SHARES OUTSTANDING — DILUTED (IN MILLIONS) 294.4 285.9 276.3
The accompanying notes are an integral part of these financial statements.
CON EDISON ANNUAL REPORT 69
CG11
MAC
377
Consolidated Edison, Inc.Consolidated Statement of Cash Flows
For the Twelve Months Ended December 31,
(Millions of Dollars) 2011 2010 2009
OPERATING ACTIVITIESNet Income $ 1,062 $ 1,003 $ 879PRINCIPAL NON-CASH CHARGES/(CREDITS) TO INCOME
Depreciation and amortization 884 840 791Deferred income taxes 491 659 436Rate case amortization and accruals 49 13 (63)Common equity component of allowance for funds used during construction (11) (15) (14)Net derivative (gains)/losses 22 (19) (31)Other non-cash items (net) 144 (18) (77)
CHANGES IN ASSETS AND LIABILITIESAccounts receivable – customers, less allowance for uncollectibles 50 (126) 51Materials and supplies, including fuel oil and gas in storage (8) 7 161Other receivables and other current assets 51 207 (346)Prepayments 196 (210) 566Recoverable energy costs - - 90Accounts payable (195) (22) (18)Pensions and retiree benefits 151 78 (14)Superfund and environmental remediation costs (net) (9) (3) (48)Accrued taxes 98 38 (6)Accrued interest 5 (1) 17Deferred charges, noncurrent assets and other regulatory assets (139) (287) 122Deferred credits and other regulatory liabilities 234 80 (23)Other assets - (9) (5)Other liabilities 62 166 (2)
NET CASH FLOWS FROM OPERATING ACTIVITIES 3,137 2,381 2,466
INVESTING ACTIVITIESUtility construction expenditures (1,887) (1,986) (2,170)Cost of removal less salvage (167) (149) (181)Non-utility construction expenditures (80) (28) (9)Proceeds from investment tax credits and grants related to renewable energy
investments 4 - -Net investment in Pilesgrove solar project (20) - -Purchase of additional ownership interest in Honeoye Storage Corporation - (12) -
NET CASH FLOWS USED IN INVESTING ACTIVITIES (2,150) (2,175) (2,360)
FINANCING ACTIVITIESNet payments of short-term debt - - (363)Issuance of long-term debt - 1,095 1,470Retirement of long-term debt (4) (1,011) (662)Issuance of common stock 118 439 257Repurchase of common stock (87) - -Debt issuance costs - (11) (10)Common stock dividends (693) (629) (601)Preferred stock dividends (11) (11) (11)
NET CASH FLOWS (USED IN)/FROM FINANCING ACTIVITIES (677) (128) 80
CASH AND TEMPORARY CASH INVESTMENTS:NET CHANGE FOR THE PERIOD 310 78 186BALANCE AT BEGINNING OF PERIOD 338 260 74
BALANCE AT END OF PERIOD $ 648 $ 338 $ 260
SUPPLEMENTAL DISCLOSURE OF CASH FLOW INFORMATIONCash paid/(refunded) during the period for:
Interest $ 563 $ 583 $ 558Income taxes $ (236) $ (25) $ 5
The accompanying notes are an integral part of these financial statements.
70 CON EDISON ANNUAL REPORT
CG11
MAC
377
Consolidated Edison, Inc.Consolidated Balance Sheet
(Millions of Dollars)December 31,
2011December 31,
2010
ASSETSCURRENT ASSETS
Cash and temporary cash investments $ 648 $ 338Accounts receivable — customers, less allowance for uncollectible accounts of $87 and $76 in
2011 and 2010, respectively 1,123 1,173Accrued unbilled revenue 474 633Other receivables, less allowance for uncollectible accounts of $10 and $8 in 2011 and 2010,
respectively 303 293Fuel oil, gas in storage, materials and supplies, at average cost 356 348Prepayments 145 341Deferred tax assets — current 266 162Regulatory assets 164 203Other current assets 159 178
TOTAL CURRENT ASSETS 3,638 3,669
INVESTMENTS 455 403
UTILITY PLANT, AT ORIGINAL COSTElectric 21,105 19,851Gas 4,727 4,344Steam 1,983 2,038General 1,960 1,911
TOTAL 29,775 28,144Less: Accumulated depreciation 6,051 5,808
Net 23,724 22,336Construction work in progress 1,241 1,458
NET UTILITY PLANT 24,965 23,794
NON-UTILITY PLANTNon-utility property, less accumulated depreciation of $59 and $51 in 2011 and 2010,
respectively 89 46Construction work in progress 39 23
NET PLANT 25,093 23,863
OTHER NONCURRENT ASSETSGoodwill 429 429Intangible assets, less accumulated amortization of $3 in 2011 and 2010 3 3Regulatory assets 9,337 7,683Other deferred charges and noncurrent assets 259 298
TOTAL OTHER NONCURRENT ASSETS 10,028 8,413
TOTAL ASSETS $39,214 $36,348
The accompanying notes are an integral part of these financial statements.
CON EDISON ANNUAL REPORT 71
CG11
MAC
377
Consolidated Edison, Inc.Consolidated Balance Sheet
(Millions of Dollars)December 31,
2011December 31,
2010
LIABILITIES AND SHAREHOLDERS’ EQUITYCURRENT LIABILITIES
Long-term debt due within one year $ 530 $ 5Accounts payable 961 1,151Customer deposits 303 289Accrued taxes 188 90Accrued interest 160 155Accrued wages 90 102Fair value of derivative liabilities 169 125Regulatory liabilities 118 159Other current liabilities 468 454
TOTAL CURRENT LIABILITIES 2,987 2,530
NONCURRENT LIABILITIESObligations under capital leases 2 7Provision for injuries and damages 181 165Pensions and retiree benefits 4,835 3,287Superfund and other environmental costs 489 512Asset retirement obligations 145 109Fair value of derivative liabilities 48 77Other noncurrent liabilities 131 113
TOTAL NONCURRENT LIABILITIES 5,831 4,270
DEFERRED CREDITS AND REGULATORY LIABILITIESDeferred income taxes and investment tax credits 7,563 6,769Regulatory liabilities 977 788Other deferred credits 64 46
TOTAL DEFERRED CREDITS AND REGULATORY LIABILITIES 8,604 7,603
LONG-TERM DEBT (See Statement of Capitalization) 10,143 10,671
SHAREHOLDERS’ EQUITYCommon shareholders’ equity (See Statement of Common Shareholders’ Equity) 11,436 11,061Preferred stock of subsidiary (See Statement of Capitalization) 213 213
TOTAL SHAREHOLDERS’ EQUITY 11,649 11,274
TOTAL LIABILITIES AND SHAREHOLDERS’ EQUITY $39,214 $36,348
The accompanying notes are an integral part of these financial statements.
72 CON EDISON ANNUAL REPORT
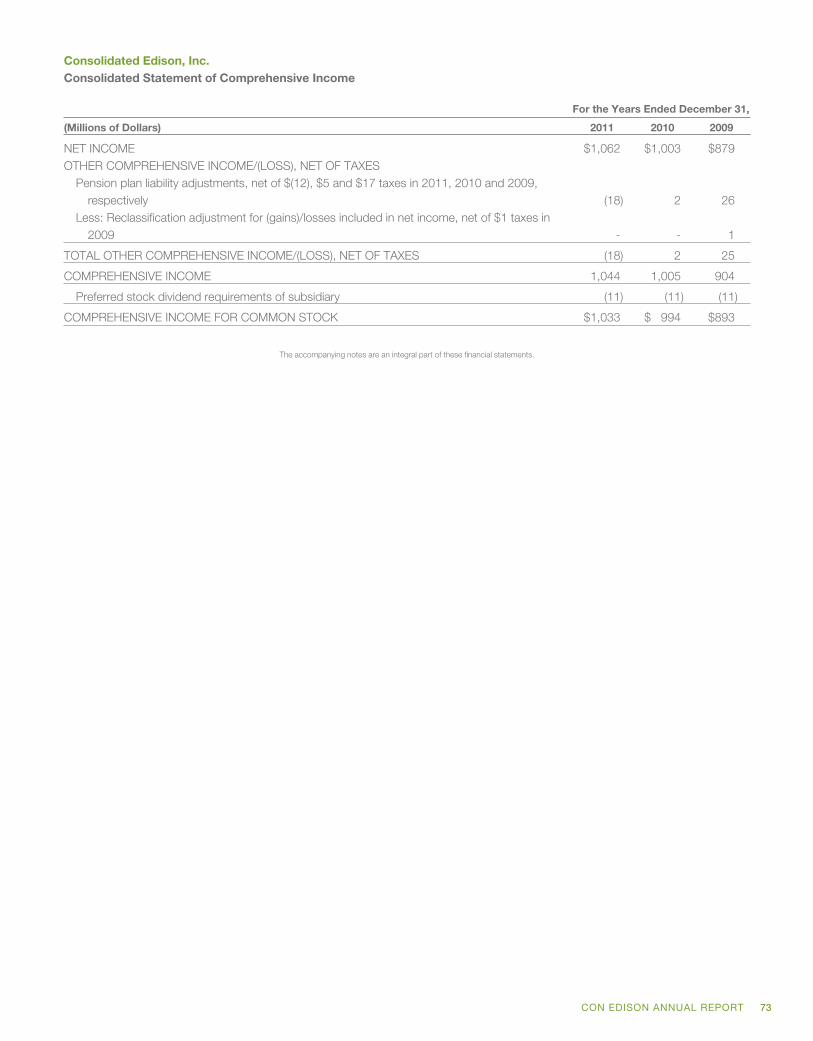
CG11
MAC
377
Consolidated Edison, Inc.Consolidated Statement of Comprehensive Income
For the Years Ended December 31,
(Millions of Dollars) 2011 2010 2009
NET INCOME $1,062 $1,003 $879OTHER COMPREHENSIVE INCOME/(LOSS), NET OF TAXES
Pension plan liability adjustments, net of $(12), $5 and $17 taxes in 2011, 2010 and 2009,respectively (18) 2 26
Less: Reclassification adjustment for (gains)/losses included in net income, net of $1 taxes in2009 - - 1
TOTAL OTHER COMPREHENSIVE INCOME/(LOSS), NET OF TAXES (18) 2 25
COMPREHENSIVE INCOME 1,044 1,005 904
Preferred stock dividend requirements of subsidiary (11) (11) (11)
COMPREHENSIVE INCOME FOR COMMON STOCK $1,033 $ 994 $893
The accompanying notes are an integral part of these financial statements.
CON EDISON ANNUAL REPORT 73
CG11
MAC
377
Consolidated Edison, Inc.Consolidated Statement of Common Shareholders’ Equity
(Millions of Dollars/ExceptShare Data)
Common StockAdditional
Paid- InCapital
RetainedEarnings
Treasury StockCapitalStock
Expense
AccumulatedOther
ComprehensiveIncome/(Loss) TotalShares Amount Shares Amount
BALANCE AS OFDECEMBER 31, 2008 273,721,686 $29 $4,112 $6,685 23,210,700 $(1,001) $(60) $(67) $ 9,698
Net income for common stock 868 868Common stock dividends (649) (649)Issuance of common shares –
public offering 5,000,000 1 214 (2) 213Issuance of common shares –
dividend reinvestment andemployee stock plans 2,402,055 94 94
Other comprehensive income 25 25BALANCE AS OF
DECEMBER 31, 2009 281,123,741 $30 $4,420 $6,904 23,210,700 $(1,001) $(62) $(42) $10,249Net income for common stock 992 992Common stock dividends (676) (676)Issuance of common shares –
public offering 6,300,000 1 307 (2) 306Issuance of common shares –
dividend reinvestment andemployee stock plans 4,192,593 188 188
Other comprehensive income 2 2BALANCE AS OF
DECEMBER 31, 2010 291,616,334 $31 $4,915 $7,220 23,210,700 $(1,001) $(64) $(40) $11,061Net income for common stock 1,051 1,051Common stock dividends (703) (703)Issuance of common shares –
dividend reinvestment andemployee stock plans 1,272,187 1 76 (1,538,166) 55 132
Common stock repurchases 1,521,541 (87) (87)Other comprehensive income (18) (18)BALANCE AS OF
DECEMBER 31, 2011 292,888,521 $32 $4,991 $7,568 23,194,075 $(1,033) $(64) $(58) $11,436
The accompanying notes are an integral part of these financial statements.
74 CON EDISON ANNUAL REPORT

CG11
MAC
377
Consolidated Edison, Inc.Consolidated Statement of Capitalization
Shares outstandingDecember 31, At December 31,
(Millions of Dollars) 2011 2010 2011 2010
TOTAL COMMON SHAREHOLDERS’ EQUITY BEFORE 292,888,521 291,616,334 $11,494 $11,101ACCUMULATED OTHER COMPREHENSIVE LOSSPension plan liability adjustments, net of $(34) and $(22) taxes in 2011 and
2010, respectively (55) (37)Unrealized gains/(losses) on derivatives qualified as cash flow hedges, less
reclassification adjustment for gains/(losses) included in net income andreclassification adjustment for unrealized losses included in regulatory assets,net of $(2) taxes in 2011 and 2010 (3) (3)
TOTAL ACCUMULATED OTHER COMPREHENSIVE LOSS, NET OF TAXES (58) (40)
TOTAL COMMON SHAREHOLDERS’ EQUITY (SEE STATEMENT OF COMMONSHAREHOLDERS’ EQUITY) 11,436 11,061
PREFERRED STOCK OF SUBSIDIARY$5 Cumulative Preferred, without par value, authorized 1,915,319 shares 1,915,319 1,915,319 175 175Cumulative Preferred, $100 par value, authorized 6,000,000 shares
4.65% Series C 153,296 153,296 16 164.65% Series D 222,330 222,330 22 22
TOTAL PREFERRED STOCK $ 213 $ 213
The accompanying notes are an integral part of these financial statements.
CON EDISON ANNUAL REPORT 75

CG11
MAC
377
Consolidated Edison, Inc.Consolidated Statement of Capitalization
LONG-TERM DEBT (Millions of Dollars) At December 31,
Maturity Interest Rate Series 2011 2010
DEBENTURES:
2012 5.625% 2002A $ 300 $ 300
2013 4.875 2002B 500 500
2013 3.85 2003B 200 200
2014 4.70 2004A 200 200
2014 5.55 2009A 275 275
2015 5.30 2005A 40 40
2015 5.375 2005C 350 350
2015 2.50 2010A 55 55
2016 5.45 2006A 75 75
2016 5.50 2006C 400 400
2016 5.30 2006D 250 250
2018 5.85 2008A 600 600
2018 6.15 2008A 50 50
2018 7.125 2008C 600 600
2019 4.96 2009A 60 60
2019 6.65 2009B 475 475
2020 4.45 2010A 350 350
2027 6.50 1997F 80 80
2033 5.875 2003A 175 175
2033 5.10 2003C 200 200
2034 5.70 2004B 200 200
2035 5.30 2005A 350 350
2035 5.25 2005B 125 125
2036 5.85 2006A 400 400
2036 6.20 2006B 400 400
2036 5.70 2006E 250 250
2037 6.30 2007A 525 525
2038 6.75 2008B 600 600
2039 6.00 2009B 60 60
2039 5.50 2009C 600 600
2040 5.70 2010B 350 350
2040 5.50 2010B 115 115
TOTAL DEBENTURES 9,210 9,210
TRANSITION BONDS:
2019* 5.22% 2004-1 29 32
TOTAL TRANSITION BONDS 29 32
76 CON EDISON ANNUAL REPORT
CG11
MAC
377
Consolidated Edison, Inc.Consolidated Statement of Capitalization
LONG-TERM DEBT (Millions of Dollars) At December 31,
Maturity Interest Rate Series 2011 2010
TAX-EXEMPT DEBT - Notes issued to New York State Energy Research andDevelopment Authority for Facilities Revenue Bonds**:
2015 0.20% 1995*** 44 44
2032 0.193 2004B Series 1 127 127
2034 0.139 1999A 293 293
2035 0.193 2004B Series 2 20 20
2036 0.222 2001B 98 98
2036 1.45 2010A**** 225 225
2039 0.21 2004A 98 98
2039 0.08 2004C 99 99
2039 0.067 2005A 126 126
TOTAL TAX-EXEMPT DEBT 1,130 1,130
Other long-term debt 321 323
Unamortized debt discount (17) (19)
TOTAL 10,673 10,676
Less: long-term debt due within one year 530 5
TOTAL LONG-TERM DEBT 10,143 10,671
TOTAL CAPITALIZATION $21,792 $21,945
* The final date to pay the entire remaining unpaid principal balance, if any, of all outstanding bonds is May 17, 2021.** Other than Series 2010A, rates reset weekly or by auction held every 35 days; December 30, 2011 rates shown.*** Issued for O&R pollution control financing.**** Subject to mandatory tender in 2012.
The accompanying notes are an integral part of these financial statements.
CON EDISON ANNUAL REPORT 77

CG11
MAC
377
Report of Management on Internal Control Over FinancialReportingManagement of Consolidated Edison Company of New York,Inc. and its subsidiaries (the Company) is responsible forestablishing and maintaining adequate internal control overfinancial reporting. Internal control over financial reporting is aprocess designed to provide reasonable, but not absolute,assurance regarding the reliability of financial reporting and thepreparation of financial statements for external purposes inaccordance with accounting principles generally accepted inthe United States of America.
Because of its inherent limitations, internal control over financialreporting may not prevent or detect misstatements. Also,projections of the effectiveness of controls to future periods aresubject to the risk that controls may become inadequatebecause of changes in conditions, or that the degree ofcompliance with policies or procedures may deteriorate.
Management of the Company assessed the effectiveness ofinternal control over financial reporting as of December 31,2011, using the criteria established by the Committee ofSponsoring Organizations of the Treadway Commission(COSO) in Internal Control – Integrated Framework. Based onthat assessment, management has concluded that theCompany had effective internal control over financial reportingas of December 31, 2011.
The effectiveness of the Company’s internal control overfinancial reporting as of December 31, 2011, has been auditedby PricewaterhouseCoopers LLP, the Company’s independentregistered public accounting firm, as stated in their report whichappears on the following page of this Annual Report onForm 10-K.
Kevin BurkeChairman and ChiefExecutive Officer
Robert HoglundSenior Vice President andChief Financial Officer
February 21, 2012
78 CON EDISON ANNUAL REPORT
CG11
MAC
377
Report of Independent Registered Public Accounting FirmTo the Stockholder and Board of Trustees of ConsolidatedEdison Company of New York, Inc.:
In our opinion, the consolidated financial statements listed inthe accompanying index present fairly, in all material respects,the financial position of Consolidated Edison Company ofNew York, Inc. and its subsidiaries (the Company) atDecember 31, 2011 and 2010, and the results of theiroperations and their cash flows for each of the three years inthe period ended December 31, 2011 in conformity withaccounting principles generally accepted in the United Statesof America. In addition, in our opinion, the financial statementschedule listed in the accompanying index presents fairly, inall material respects, the information set forth therein whenread in conjunction with the related consolidated financialstatements. Also in our opinion, the Company maintained, inall material respects, effective internal control over financialreporting as of December 31, 2011, based on criteriaestablished in Internal Control – Integrated Framework issuedby the Committee of Sponsoring Organizations of theTreadway Commission (COSO). The Company’smanagement is responsible for these financial statements andfinancial statement schedule, for maintaining effective internalcontrol over financial reporting and for its assessment of theeffectiveness of internal control over financial reporting,included in the accompanying Report of Management onInternal Control Over Financial Reporting. Our responsibility isto express opinions on these financial statements, on thefinancial statement schedule, and on the Company’s internalcontrol over financial reporting based on our audits. Weconducted our audits in accordance with the standards of thePublic Company Accounting Oversight Board (United States).Those standards require that we plan and perform the auditsto obtain reasonable assurance about whether the financialstatements are free of material misstatement and whethereffective internal control over financial reporting wasmaintained in all material respects. Our audits of the financialstatements included examining, on a test basis, evidencesupporting the amounts and disclosures in the financialstatements, assessing the accounting principles used and
significant estimates made by management, and evaluatingthe overall financial statement presentation. Our audit ofinternal control over financial reporting included obtaining anunderstanding of internal control over financial reporting,assessing the risk that a material weakness exists, and testingand evaluating the design and operating effectiveness ofinternal control based on the assessed risk. Our audits alsoincluded performing such other procedures as we considerednecessary in the circumstances. We believe that our auditsprovide a reasonable basis for our opinions.
A company’s internal control over financial reporting is aprocess designed to provide reasonable assurance regardingthe reliability of financial reporting and the preparation offinancial statements for external purposes in accordance withgenerally accepted accounting principles. A company’sinternal control over financial reporting includes those policiesand procedures that (i) pertain to the maintenance of recordsthat, in reasonable detail, accurately and fairly reflect thetransactions and dispositions of the assets of the company;(ii) provide reasonable assurance that transactions arerecorded as necessary to permit preparation of financialstatements in accordance with generally accepted accountingprinciples, and that receipts and expenditures of the companyare being made only in accordance with authorizations ofmanagement and directors of the company; and (iii) providereasonable assurance regarding prevention or timelydetection of unauthorized acquisition, use, or disposition ofthe company’s assets that could have a material effect on thefinancial statements.
Because of its inherent limitations, internal control overfinancial reporting may not prevent or detect misstatements.Also, projections of any evaluation of effectiveness to futureperiods are subject to the risk that controls may becomeinadequate because of changes in conditions, or that thedegree of compliance with the policies or procedures maydeteriorate.
PricewaterhouseCoopers LLPNew York, New YorkFebruary 21, 2012
CON EDISON ANNUAL REPORT 79
CG11
MAC
377
Consolidated Edison Company of New York, Inc.Consolidated Income Statement
For the Years Ended December 31,
(Millions of Dollars) 2011 2010 2009
OPERATING REVENUESElectric $ 8,280 $ 8,376 $ 7,674Gas 1,521 1,541 1,701Steam 683 656 661
TOTAL OPERATING REVENUES 10,484 10,573 10,036
OPERATING EXPENSESPurchased power 2,313 2,683 2,583Fuel 412 458 503Gas purchased for resale 518 574 818Other operations and maintenance 2,561 2,493 2,186Depreciation and amortization 829 787 744Taxes, other than income taxes 1,768 1,656 1,486
TOTAL OPERATING EXPENSES 8,401 8,651 8,320
OPERATING INCOME 2,083 1,922 1,716
OTHER INCOME (DEDUCTIONS)Investment and other income 4 32 34Allowance for equity funds used during construction 8 13 12Other deductions (14) (19) (13)
TOTAL OTHER INCOME (DEDUCTIONS) (2) 26 33
INCOME BEFORE INTEREST AND INCOME TAX EXPENSE 2,081 1,948 1,749
INTEREST EXPENSEInterest on long-term debt 523 537 534Other interest 16 19 27Allowance for borrowed funds used during construction (5) (7) (8)
NET INTEREST EXPENSE 534 549 553
INCOME FROM CONTINUING OPERATIONS BEFORE TAXES 1,547 1,399 1,196INCOME TAX EXPENSE 558 495 404
NET INCOME 989 904 792Preferred stock dividend requirements (11) (11) (11)
NET INCOME FOR COMMON STOCK $ 978 $ 893 $ 781
The accompanying notes are an integral part of these financial statements.
80 CON EDISON ANNUAL REPORT

CG11
MAC
377
Consolidated Edison Company of New York, Inc.Consolidated Statement of Cash Flows
For the Twelve Months Ended December 31,
(Millions of Dollars) 2011 2010 2009
OPERATING ACTIVITIESNet income $ 989 $ 904 $ 792PRINCIPAL NON-CASH CHARGES/(CREDITS) TO INCOME
Depreciation and amortization 829 787 744Deferred income taxes 462 622 364Rate case amortization and accruals 49 13 (63)Common equity component of allowance for funds used during construction (8) (13) (12)Other non-cash items (net) 96 (12) (56)
CHANGES IN ASSETS AND LIABILITIESAccounts receivable – customers, less allowance for uncollectibles 48 (121) 33Materials and supplies, including fuel oil and gas in storage (2) 4 133Other receivables and other current assets 170 11 (122)Prepayments (3) - 456Recoverable energy costs - - 111Accounts payable (132) (17) (118)Pensions and retiree benefits 102 68 -Superfund and environmental remediation costs (net) (9) (8) (51)Accrued taxes 95 13 (16)Accrued interest 3 (7) 6Deferred charges, noncurrent assets and other regulatory assets (32) (294) 71Deferred credits and other regulatory liabilities 224 70 (25)Other liabilities 52 185 (25)
NET CASH FLOWS FROM OPERATING ACTIVITIES 2,933 2,205 2,222
INVESTING ACTIVITIESUtility construction expenditures (1,785) (1,853) (2,045)Cost of removal less salvage (162) (145) (176)Loan to affiliate - - 113
NET CASH FLOWS USED IN INVESTING ACTIVITIES (1,947) (1,998) (2,108)
FINANCING ACTIVITIESNet payments of short-term debt - - (253)Issuance of long-term debt - 925 1,350Retirement of long-term debt - (850) (655)Debt issuance costs - (9) (10)Capital contribution by parent - 355 211Dividend to parent (681) (670) (652)Preferred stock dividends (11) (11) (11)
NET CASH FLOWS USED IN FINANCING ACTIVITIES (692) (260) (20)
CASH AND TEMPORARY CASH INVESTMENTS:NET CHANGE FOR THE PERIOD 294 (53) 94BALANCE AT BEGINNING OF PERIOD 78 131 37
BALANCE AT END OF PERIOD $ 372 $ 78 $ 131
SUPPLEMENTAL DISCLOSURE OF CASH FLOW INFORMATIONCash paid/(refunded) during the period for:
Interest $ 504 $ 528 $ 513Income taxes $ (198) $ (18) $ 18
The accompanying notes are an integral part of these financial statements.
CON EDISON ANNUAL REPORT 81

CG11
MAC
377
Consolidated Edison Company of New York, Inc.Consolidated Balance Sheet
(Millions of Dollars)December 31,
2011December 31,
2010
ASSETS
CURRENT ASSETSCash and temporary cash investments $ 372 $ 78Accounts receivable – customers, less allowance for uncollectible accounts of $79 and $68 in
2011 and 2010, respectively 977 1,025Other receivables, less allowance for uncollectible accounts of $9 and $7 in 2011 and 2010,
respectively 102 73Accrued unbilled revenue 366 473Accounts receivable from affiliated companies 54 273Fuel oil, gas in storage, materials and supplies, at average cost 308 306Prepayments 85 82Deferred tax assets – current 157 131Regulatory assets 140 151Other current assets 100 104
TOTAL CURRENT ASSETS 2,661 2,696
INVESTMENTS 177 167
UTILITY PLANT AT ORIGINAL COSTElectric 19,886 18,735Gas 4,200 3,844Steam 1,983 2,038General 1,785 1,746
TOTAL 27,854 26,363Less: Accumulated depreciation 5,523 5,314
Net 22,331 21,049Construction work in progress 1,165 1,345
NET UTILITY PLANT 23,496 22,394
NON-UTILITY PROPERTYNon-utility property, less accumulated depreciation of $24 and $22 in 2011 and 2010, respectively 6 7
NET PLANT 23,502 22,401
OTHER NONCURRENT ASSETSRegulatory assets 8,661 7,097Other deferred charges and noncurrent assets 217 244
TOTAL OTHER NONCURRENT ASSETS 8,878 7,341
TOTAL ASSETS $35,218 $32,605
The accompanying notes are an integral part of these financial statements.
82 CON EDISON ANNUAL REPORT
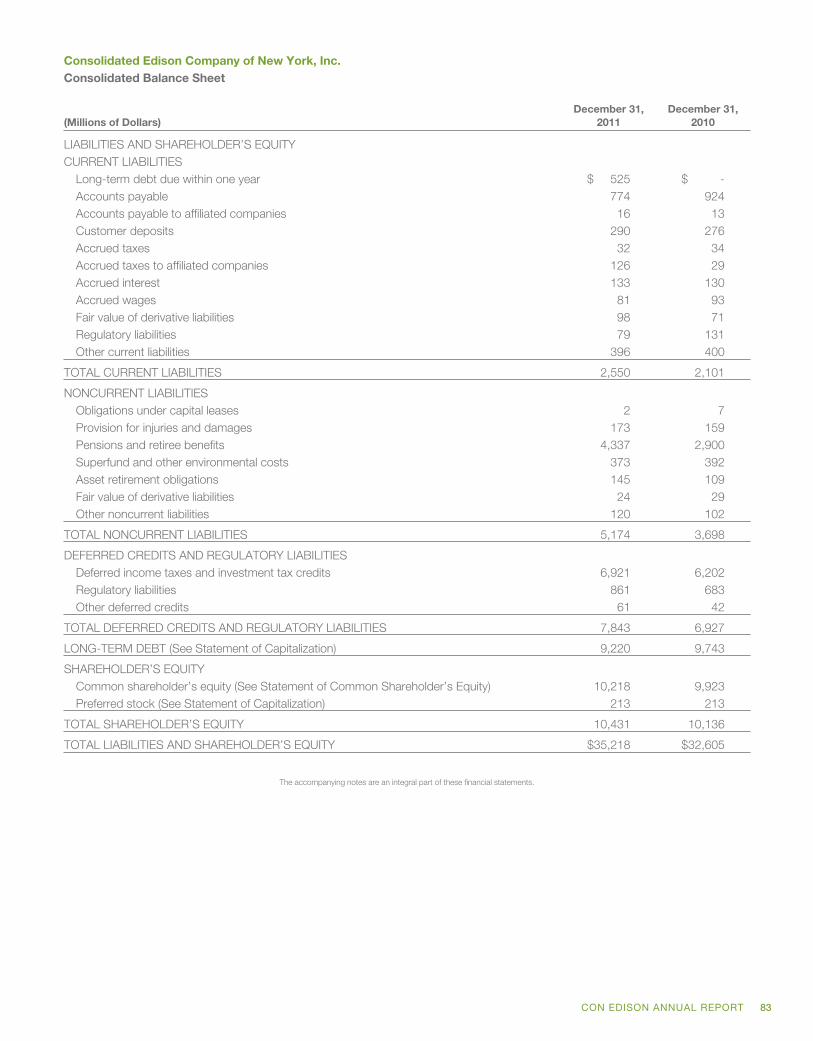
CG11
MAC
377
Consolidated Edison Company of New York, Inc.Consolidated Balance Sheet
(Millions of Dollars)December 31,
2011December 31,
2010
LIABILITIES AND SHAREHOLDER’S EQUITYCURRENT LIABILITIES
Long-term debt due within one year $ 525 $ -Accounts payable 774 924Accounts payable to affiliated companies 16 13Customer deposits 290 276Accrued taxes 32 34Accrued taxes to affiliated companies 126 29Accrued interest 133 130Accrued wages 81 93Fair value of derivative liabilities 98 71Regulatory liabilities 79 131Other current liabilities 396 400
TOTAL CURRENT LIABILITIES 2,550 2,101
NONCURRENT LIABILITIESObligations under capital leases 2 7Provision for injuries and damages 173 159Pensions and retiree benefits 4,337 2,900Superfund and other environmental costs 373 392Asset retirement obligations 145 109Fair value of derivative liabilities 24 29Other noncurrent liabilities 120 102
TOTAL NONCURRENT LIABILITIES 5,174 3,698
DEFERRED CREDITS AND REGULATORY LIABILITIESDeferred income taxes and investment tax credits 6,921 6,202Regulatory liabilities 861 683Other deferred credits 61 42
TOTAL DEFERRED CREDITS AND REGULATORY LIABILITIES 7,843 6,927
LONG-TERM DEBT (See Statement of Capitalization) 9,220 9,743
SHAREHOLDER’S EQUITYCommon shareholder’s equity (See Statement of Common Shareholder’s Equity) 10,218 9,923Preferred stock (See Statement of Capitalization) 213 213
TOTAL SHAREHOLDER’S EQUITY 10,431 10,136
TOTAL LIABILITIES AND SHAREHOLDER’S EQUITY $35,218 $32,605
The accompanying notes are an integral part of these financial statements.
CON EDISON ANNUAL REPORT 83

CG11
MAC
377
Consolidated Edison Company of New York, Inc.Consolidated Statement of Comprehensive Income
For the Years Ended December 31,
(Millions of Dollars) 2011 2010 2009
NET INCOME $989 $904 $792OTHER COMPREHENSIVE INCOME/(LOSS), NET OF TAXES
Pension plan liability adjustments, net of $(1), $(1) and $11 taxes in 2011, 2010 and 2009,respectively (2) (2) 16
TOTAL OTHER COMPREHENSIVE INCOME/(LOSS), NET OF TAXES (2) (2) 16
COMPREHENSIVE INCOME $987 $902 $808
The accompanying notes are an integral part of these financial statements.
84 CON EDISON ANNUAL REPORT

CG11
MAC
377
Consolidated Edison Company of New York, Inc.Consolidated Statement of Common Shareholder’s Equity
(Millions of Dollars/ExceptShare Data)
Common StockAdditional
Paid-InCapital
RetainedEarnings
RepurchasedCon Edison
Stock
CapitalStock
Expense
AccumulatedOther
ComprehensiveIncome/(Loss) TotalShares Amount
BALANCE AS OF DECEMBER 31,2008 235,488,094 $589 $3,664 $5,780 $(962) $(60) $(20) $ 8,991
Net income 792 792
Common stock dividend to parent (652) (652)
Capital contribution by parent 213 (2) 211
Cumulative preferred dividends (11) (11)
Other comprehensive income 16 16
BALANCE AS OF DECEMBER 31,2009 235,488,094 $589 $3,877 $5,909 $(962) $(62) $ (4) $ 9,347
Net income 904 904
Common stock dividend to parent (670) (670)
Capital contribution by parent 357 (2) 355
Cumulative preferred dividends (11) (11)
Other comprehensive income (2) (2)
BALANCE AS OF DECEMBER 31,2010 235,488,094 $589 $4,234 $6,132 $(962) $(64) $ (6) $ 9,923
Net income 989 989
Common stock dividend to parent (681) (681)
Cumulative preferred dividends (11) (11)
Other comprehensive income (2) (2)
BALANCE AS OF DECEMBER 31,2011 235,488,094 $589 $4,234 $6,429 $(962) $(64) $ (8) $10,218
The accompanying notes are an integral part of these financial statements.
CON EDISON ANNUAL REPORT 85
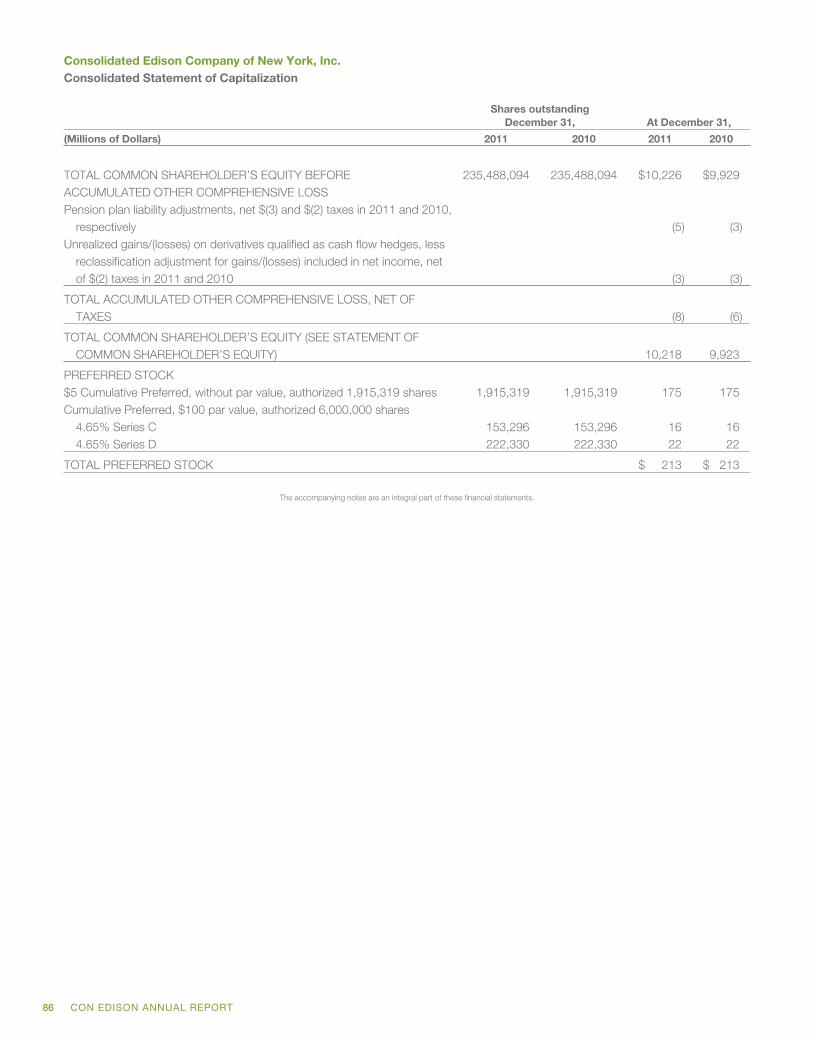
CG11
MAC
377
Consolidated Edison Company of New York, Inc.Consolidated Statement of Capitalization
Shares outstandingDecember 31, At December 31,
(Millions of Dollars) 2011 2010 2011 2010
TOTAL COMMON SHAREHOLDER’S EQUITY BEFORE 235,488,094 235,488,094 $10,226 $9,929ACCUMULATED OTHER COMPREHENSIVE LOSSPension plan liability adjustments, net $(3) and $(2) taxes in 2011 and 2010,
respectively (5) (3)Unrealized gains/(losses) on derivatives qualified as cash flow hedges, less
reclassification adjustment for gains/(losses) included in net income, netof $(2) taxes in 2011 and 2010 (3) (3)
TOTAL ACCUMULATED OTHER COMPREHENSIVE LOSS, NET OFTAXES (8) (6)
TOTAL COMMON SHAREHOLDER’S EQUITY (SEE STATEMENT OFCOMMON SHAREHOLDER’S EQUITY) 10,218 9,923
PREFERRED STOCK$5 Cumulative Preferred, without par value, authorized 1,915,319 shares 1,915,319 1,915,319 175 175Cumulative Preferred, $100 par value, authorized 6,000,000 shares
4.65% Series C 153,296 153,296 16 164.65% Series D 222,330 222,330 22 22
TOTAL PREFERRED STOCK $ 213 $ 213
The accompanying notes are an integral part of these financial statements.
86 CON EDISON ANNUAL REPORT

CG11
MAC
377
Consolidated Edison Company of New York, Inc.CONSOLIDATED STATEMENT OF CAPITALIZATION
LONG-TERM DEBT (Millions of Dollars) At December 31,
Maturity Interest Rate Series 2011 2010
DEBENTURES:2012 5.625% 2002A $ 300 $ 300
2013 4.875 2002B 500 500
2013 3.85 2003B 200 200
2014 4.70 2004A 200 200
2014 5.55 2009A 275 275
2015 5.375 2005C 350 350
2016 5.50 2006C 400 400
2016 5.30 2006D 250 250
2018 5.85 2008A 600 600
2018 7.125 2008C 600 600
2019 6.65 2009B 475 475
2020 4.45 2010A 350 350
2033 5.875 2003A 175 175
2033 5.10 2003C 200 200
2034 5.70 2004B 200 200
2035 5.30 2005A 350 350
2035 5.25 2005B 125 125
2036 5.85 2006A 400 400
2036 6.20 2006B 400 400
2036 5.70 2006E 250 250
2037 6.30 2007A 525 525
2038 6.75 2008B 600 600
2039 5.50 2009C 600 600
2040 5.70 2010B 350 350
TOTAL DEBENTURES 8,675 8,675
TAX-EXEMPT DEBT – Notes issued to New York State Energy Research and DevelopmentAuthority for Facilities Revenue Bonds*:
2032 0.193% 2004B Series 1 127 127
2034 0.139 1999A 293 293
2035 0.193 2004B Series 2 20 20
2036 0.222 2001B 98 98
2036 1.45 2010A** 225 225
2039 0.21 2004A 98 98
2039 0.08 2004C 99 99
2039 0.067 2005A 126 126
TOTAL TAX-EXEMPT DEBT 1,086 1,086
Unamortized debt discount (16) (18)
TOTAL 9,745 9,743Less: long-term debt due within one year 525 -
TOTAL LONG-TERM DEBT 9,220 9,743
TOTAL CAPITALIZATION $19,651 $19,879
* Other than Series 2010A, rates reset weekly or by auction held every 35 days; December 30, 2011 rates shown.** Subject to mandatory tender in 2012.
The accompanying notes are an integral part of these financial statements.
CON EDISON ANNUAL REPORT 87
CG11
MAC
377
Notes to the FinancialStatementsGeneralThese combined notes accompany and form an integral part ofthe separate consolidated financial statements of each of the twoseparate registrants: Consolidated Edison, Inc. and itssubsidiaries (Con Edison) and Consolidated Edison Company ofNew York, Inc. and its subsidiaries (CECONY). CECONY is asubsidiary of Con Edison and as such its financial condition andresults of operations and cash flows, which are presentedseparately in the CECONY consolidated financial statements, arealso consolidated, along with those of Con Edison’s other utilitysubsidiary, Orange and Rockland Utilities, Inc. (O&R), and ConEdison’s competitive energy businesses (discussed below) inCon Edison’s consolidated financial statements. The term“Utilities” is used in these notes to refer to CECONY and O&R.
As used in these notes, the term “Companies” refers to ConEdison and CECONY and, except as otherwise noted, theinformation in these combined notes relates to each of theCompanies. However, CECONY makes no representation as toinformation relating to Con Edison or the subsidiaries of ConEdison other than itself.
Con Edison has two regulated utility subsidiaries: CECONY andO&R. CECONY provides electric service and gas service in NewYork City and Westchester County. The company also providessteam service in parts of Manhattan. O&R, along with itsregulated utility subsidiaries, provides electric service insoutheastern New York and adjacent areas of northern NewJersey and eastern Pennsylvania and gas service in southeasternNew York and adjacent areas of eastern Pennsylvania. ConEdison has the following competitive energy businesses:Consolidated Edison Solutions, Inc. (Con Edison Solutions), aretail energy services company that sells electricity and alsooffers energy-related services; Consolidated Edison Energy, Inc.(Con Edison Energy), a wholesale energy supply and servicescompany; and Consolidated Edison Development, Inc. (ConEdison Development), a company that develops and participatesin infrastructure projects.
Note A — Summary of Significant Accounting PoliciesPrinciples of ConsolidationThe Companies’ consolidated financial statements include theaccounts of their respective majority-owned subsidiaries, andvariable interest entities (see Note Q), as required. Allintercompany balances and transactions have been eliminated.
Accounting Policies
The accounting policies of Con Edison and its subsidiariesconform to accounting principles generally accepted in theUnited States of America. For the Utilities, these accountingprinciples include the accounting rules for regulated operations
and the accounting requirements of the Federal EnergyRegulatory Commission (FERC) and the state public utilityregulatory commissions having jurisdiction.
The accounting rules for regulated operations specify theeconomic effects that result from the causal relationship of costsand revenues in the rate-regulated environment and how theseeffects are to be accounted for by a regulated enterprise.Revenues intended to cover some costs may be recorded eitherbefore or after the costs are incurred. If regulation providesassurance that incurred costs will be recovered in the future,these costs would be recorded as deferred charges or“regulatory assets” under the accounting rules for regulatedoperations. If revenues are recorded for costs that are expectedto be incurred in the future, these revenues would be recordedas deferred credits or “regulatory liabilities” under the accountingrules for regulated operations.
The Utilities’ principal regulatory assets and liabilities are detailedin Note B. The Utilities are receiving or being credited with areturn on all of their regulatory assets for which a cash outflowhas been made, and are paying or being charged with a returnon all of their regulatory liabilities for which a cash inflow hasbeen received. The Utilities’ regulatory assets and liabilities will berecovered from customers, or applied for customer benefit, inaccordance with rate provisions approved by the applicablepublic utility regulatory commission.
Other significant accounting policies of the Companies arereferenced below in this Note A and in the notes that follow.
Plant and DepreciationUtility PlantUtility plant is stated at original cost. The cost of repairs andmaintenance is charged to expense and the cost of bettermentsis capitalized. The capitalized cost of additions to utility plantincludes indirect costs such as engineering, supervision, payrolltaxes, pensions, other benefits and an allowance for funds usedduring construction (AFDC). The original cost of property ischarged to expense over the estimated useful lives of the assets.Upon retirement, the original cost of property is charged toaccumulated depreciation. See Note R. Rates used for AFDCinclude the cost of borrowed funds and a reasonable rate ofreturn on the Utilities’ own funds when so used, determined inaccordance with regulations of the FERC or the state publicutility regulatory authority having jurisdiction. The rate iscompounded semiannually, and the amounts applicableto borrowed funds are treated as a reduction of interest charges,while the amounts applicable to the Utilities’ own funds arecredited to other income (deductions). The AFDC rates forCECONY were 6.9 percent, 5.3 percent and 6.9 percent for2011, 2010, and 2009, respectively. The AFDC rates for O&Rwere 6.6 percent, 5.8 percent and 4.2 percent for 2011, 2010,and 2009, respectively.
88 CON EDISON ANNUAL REPORT
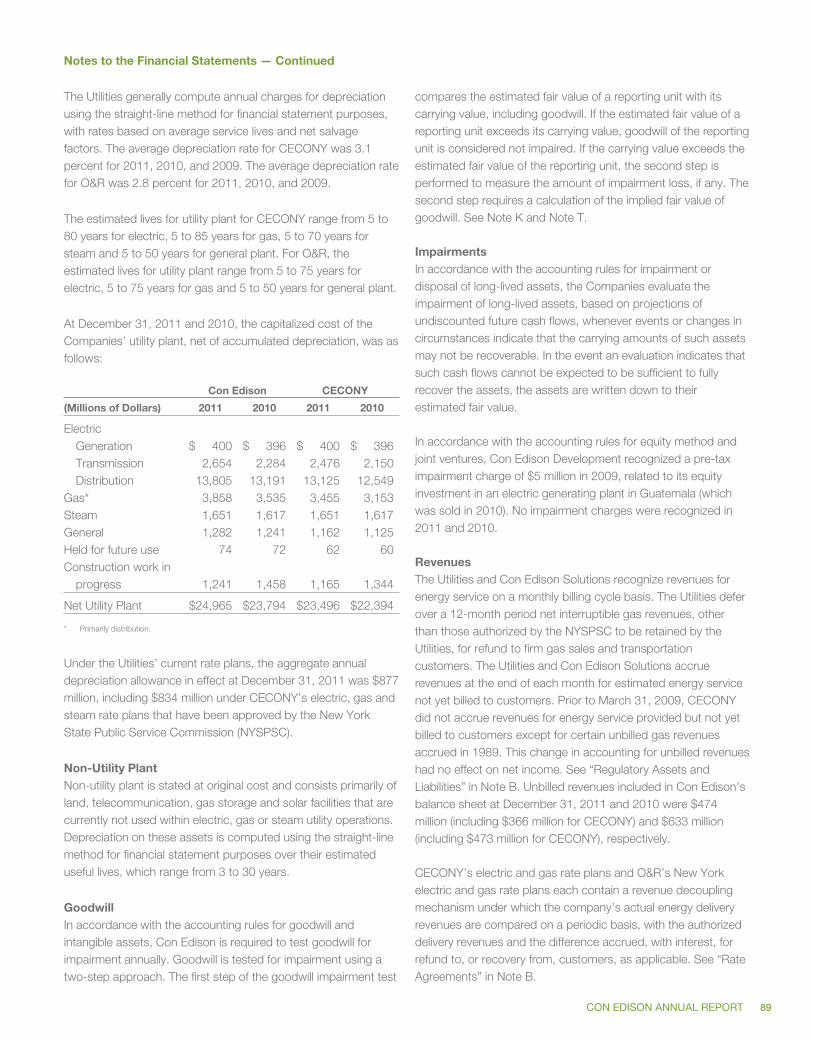
CG11
MAC
377
Notes to the Financial Statements — Continued
The Utilities generally compute annual charges for depreciationusing the straight-line method for financial statement purposes,with rates based on average service lives and net salvagefactors. The average depreciation rate for CECONY was 3.1percent for 2011, 2010, and 2009. The average depreciation ratefor O&R was 2.8 percent for 2011, 2010, and 2009.
The estimated lives for utility plant for CECONY range from 5 to80 years for electric, 5 to 85 years for gas, 5 to 70 years forsteam and 5 to 50 years for general plant. For O&R, theestimated lives for utility plant range from 5 to 75 years forelectric, 5 to 75 years for gas and 5 to 50 years for general plant.
At December 31, 2011 and 2010, the capitalized cost of theCompanies’ utility plant, net of accumulated depreciation, was asfollows:
Con Edison CECONY
(Millions of Dollars) 2011 2010 2011 2010
ElectricGeneration $ 400 $ 396 $ 400 $ 396Transmission 2,654 2,284 2,476 2,150Distribution 13,805 13,191 13,125 12,549
Gas* 3,858 3,535 3,455 3,153Steam 1,651 1,617 1,651 1,617General 1,282 1,241 1,162 1,125Held for future use 74 72 62 60Construction work in
progress 1,241 1,458 1,165 1,344
Net Utility Plant $24,965 $23,794 $23,496 $22,394
* Primarily distribution.
Under the Utilities’ current rate plans, the aggregate annualdepreciation allowance in effect at December 31, 2011 was $877million, including $834 million under CECONY’s electric, gas andsteam rate plans that have been approved by the New YorkState Public Service Commission (NYSPSC).
Non-Utility PlantNon-utility plant is stated at original cost and consists primarily ofland, telecommunication, gas storage and solar facilities that arecurrently not used within electric, gas or steam utility operations.Depreciation on these assets is computed using the straight-linemethod for financial statement purposes over their estimateduseful lives, which range from 3 to 30 years.
GoodwillIn accordance with the accounting rules for goodwill andintangible assets, Con Edison is required to test goodwill forimpairment annually. Goodwill is tested for impairment using atwo-step approach. The first step of the goodwill impairment test
compares the estimated fair value of a reporting unit with itscarrying value, including goodwill. If the estimated fair value of areporting unit exceeds its carrying value, goodwill of the reportingunit is considered not impaired. If the carrying value exceeds theestimated fair value of the reporting unit, the second step isperformed to measure the amount of impairment loss, if any. Thesecond step requires a calculation of the implied fair value ofgoodwill. See Note K and Note T.
ImpairmentsIn accordance with the accounting rules for impairment ordisposal of long-lived assets, the Companies evaluate theimpairment of long-lived assets, based on projections ofundiscounted future cash flows, whenever events or changes incircumstances indicate that the carrying amounts of such assetsmay not be recoverable. In the event an evaluation indicates thatsuch cash flows cannot be expected to be sufficient to fullyrecover the assets, the assets are written down to theirestimated fair value.
In accordance with the accounting rules for equity method andjoint ventures, Con Edison Development recognized a pre-taximpairment charge of $5 million in 2009, related to its equityinvestment in an electric generating plant in Guatemala (whichwas sold in 2010). No impairment charges were recognized in2011 and 2010.
RevenuesThe Utilities and Con Edison Solutions recognize revenues forenergy service on a monthly billing cycle basis. The Utilities deferover a 12-month period net interruptible gas revenues, otherthan those authorized by the NYSPSC to be retained by theUtilities, for refund to firm gas sales and transportationcustomers. The Utilities and Con Edison Solutions accruerevenues at the end of each month for estimated energy servicenot yet billed to customers. Prior to March 31, 2009, CECONYdid not accrue revenues for energy service provided but not yetbilled to customers except for certain unbilled gas revenuesaccrued in 1989. This change in accounting for unbilled revenueshad no effect on net income. See “Regulatory Assets andLiabilities” in Note B. Unbilled revenues included in Con Edison’sbalance sheet at December 31, 2011 and 2010 were $474million (including $366 million for CECONY) and $633 million(including $473 million for CECONY), respectively.
CECONY’s electric and gas rate plans and O&R’s New Yorkelectric and gas rate plans each contain a revenue decouplingmechanism under which the company’s actual energy deliveryrevenues are compared on a periodic basis, with the authorizeddelivery revenues and the difference accrued, with interest, forrefund to, or recovery from, customers, as applicable. See “RateAgreements” in Note B.
CON EDISON ANNUAL REPORT 89
CG11
MAC
377
Notes to the Financial Statements — Continued
The NYSPSC requires utilities to record gross receipts taxrevenues and expenses on a gross income statementpresentation basis (i.e., included in both revenue and expense).The recovery of these taxes is generally provided for in therevenue requirement within each of the respective NYSPSCapproved rate plans.
Recoverable Energy CostsThe Utilities generally recover all of their prudently incurred fuel,purchased power and gas costs, including hedging gains andlosses, in accordance with rate provisions approved by theapplicable state public utility commissions. If the actual energysupply costs for a given month are more or less than theamounts billed to customers for that month, the difference inmost cases is recoverable from or refundable to customers.Differences between actual and billed electric and steam supplycosts are generally deferred for charge or refund to customersduring the next billing cycle (normally within one or two months).In addition, CECONY recovers the costs of its electric demandmanagement program, in excess of the costs reflected in rates,as part of recoverable energy costs. For the Utilities’ gas costs,differences between actual and billed gas costs during the12-month period ending each August are charged or refunded tocustomers during a subsequent 12-month period.
New York Independent System Operator (NYISO)The Utilities purchase electricity through the wholesale electricitymarket administered by the NYISO. The difference betweenpurchased power and related costs initially billed to the Utilitiesby the NYISO and the actual cost of power subsequentlycalculated by the NYISO is refunded by the NYISO to the Utilities,or paid to the NYISO by the Utilities. The reconciliation paymentsor receipts are recoverable from or refundable to the Utilities’customers.
Certain other payments to or receipts from the NYISO are alsosubject to reconciliation, with shortfalls or amounts in excess ofspecified rate allowances recoverable from or refundable tocustomers. These include proceeds from the sale through theNYISO of transmission rights on CECONY’s transmission system(transmission congestion contracts or TCCs).
Sulfur Dioxide (SO2) AllowancesIn accordance with the federal Clean Air Act, CECONY has beenallocated SO2 emission allowances which the company may sell,trade or hold for future use. Generally, CECONY defers itsproceeds from the sale of SO2 allowances as regulatory liabilitiesto be applied for customer benefit. The proceeds received fromthe sale of SO2 allowances are included in net cash flows fromoperating activities in the Companies’ consolidated statements ofcash flows.
Temporary Cash InvestmentsTemporary cash investments are short-term, highly-liquidinvestments that generally have maturities of three months orless at the date of purchase. They are stated at cost, whichapproximates market. The Companies consider temporary cashinvestments to be cash equivalents.
InvestmentsInvestments consist primarily of the investments of Con Edison’scompetitive energy businesses, which are accounted for underthe equity method (depending on the subsidiaries’ percentageownership) or accounted for as leveraged leases in accordancewith the accounting rules for leases. See Note J for a discussionof investments in Lease In/Lease Out transactions. Utilities’investments are recorded at fair value and include the deferredincome plan and supplemental retirement income plan trustowned life insurance assets.
Pension and Other Postretirement BenefitsThe accounting rules for retirement benefits require an employerto recognize an asset or liability for the overfunded orunderfunded status of its pension and other postretirementbenefit plans. For a pension plan, the asset or liability is thedifference between the fair value of the plan’s assets and theprojected benefit obligation. For any other postretirement benefitplan, the asset or liability is the difference between the fair valueof the plan’s assets and the accumulated postretirement benefitobligation. The accounting rules generally require employers torecognize all unrecognized prior service costs and credits andunrecognized actuarial gains and losses in accumulated othercomprehensive income (OCI), net of tax. Such amounts will beadjusted as they are subsequently recognized as components ofnet periodic benefit cost or income pursuant to the currentrecognition and amortization provisions.
For the Utilities’ pension and other postretirement benefit plans,regulatory accounting treatment is generally applied inaccordance with the accounting rules for regulated operations.Unrecognized prior service costs or credits and unrecognizedactuarial gains and losses are recorded to regulatory assets orliabilities, rather than OCI. See Notes E and F.
The net periodic benefit costs are recognized in accordance withthe accounting rules for retirement benefits. Investment gains andlosses are recognized in expense over a 15-year period and otheractuarial gains and losses are recognized in expense over a10-year period, subject to the deferral provisions in the rate plans.
In accordance with the Statement of Policy issued by the NYSPSCand its current electric, gas and steam rate agreements, CECONYdefers for payment to or recovery from customers the differencebetween such expenses and the amounts for such expenses
90 CON EDISON ANNUAL REPORT

CG11
MAC
377
Notes to the Financial Statements — Continued
reflected in rates. Generally, O&R also defers such differencepursuant to its rate plans. See Note B – Regulatory Matters.
The Companies calculate the expected return on pension andother retirement benefit plan assets by multiplying the expectedrate of return on plan assets by the market-related value (MRV) ofplan assets at the beginning of the year, taking into considerationanticipated contributions and benefit payments that are to bemade during the year. The accounting rules allow the MRV ofplan assets to be either fair value or a calculated value thatrecognizes changes in fair value in a systematic and rationalmanner over not more than five years. The Companies use acalculated value when determining the MRV of the plan assetsthat adjusts for 20 percent of the difference between fair valueand expected MRV of plan assets. This calculated value has theeffect of stabilizing variability in assets to which the Companiesapply the expected return.
Federal Income TaxIn accordance with the accounting rules for income taxes, theCompanies have recorded an accumulated deferred federalincome tax liability for temporary differences between the bookand tax basis of assets and liabilities at current tax rates. Inaccordance with rate agreements, the Utilities have recoveredamounts from customers for a portion of the tax liability they willpay in the future as a result of the reversal or “turn-around” ofthese temporary differences. As to the remaining tax liability, inaccordance with the accounting rules for regulated operations,the Utilities have established regulatory assets for the netrevenue requirements to be recovered from customers for therelated future tax expense. See Notes B and L. In 1993, theNYSPSC issued a Policy Statement approving accountingprocedures consistent with the accounting rules for incometaxes and providing assurances that these future increases intaxes will be recoverable in rates. See Note L.
Accumulated deferred investment tax credits are amortizedratably over the lives of the related properties and applied as areduction to future federal income tax expense.
The Companies’ federal income tax returns reflect certain taxpositions with which the Internal Revenue Service (IRS) does notor may not agree. See “Lease In/Lease Out Transactions” inNote J and “Uncertain Tax Positions” in Note L.
Con Edison and its subsidiaries file a consolidated federalincome tax return. The consolidated income tax liability isallocated to each member of the consolidated group using theseparate return method. Each member pays or receives anamount based on its own taxable income or loss in accordancewith tax sharing agreements between the members of theconsolidated group.
State Income TaxCon Edison and its subsidiaries file a combined New York StateCorporation Business Franchise Tax Return. Similar to a federalconsolidated income tax return, the income of all entities in thecombined group is subject to New York State taxation, afteradjustments for differences between federal and New York lawand apportionment of income among the states in which thecompany does business. Each member of the group pays orreceives an amount based on its own New York State taxableincome or loss.
Research and Development CostsGenerally research and development costs are charged tooperating expenses as incurred. Research and developmentcosts were as follows:
For the Years Ended December 31,
(Millions of Dollars) 2011 2010 2009
Con Edison $23 $23 $27CECONY $21 $21 $25
ReclassificationCertain prior year amounts have been reclassified to conformwith the current year presentation.
Earnings Per Common ShareIn accordance with the accounting rules for earnings per share,Con Edison presents basic and diluted earnings per share on theface of its consolidated income statement. Basic earnings pershare (EPS) are calculated by dividing earnings available tocommon shareholders (“Net income for common stock” on ConEdison’s consolidated income statement) by the weightedaverage number of Con Edison common shares outstandingduring the period. In the calculation of diluted EPS, weightedaverage shares outstanding are increased for additional sharesthat would be outstanding if potentially dilutive securities wereconverted to common stock.
Potentially dilutive securities for Con Edison consist of restrictedstock units, deferred stock units and stock options for which theaverage market price of the common shares for the period wasgreater than the exercise price. See Note M.
CON EDISON ANNUAL REPORT 91

CG11
MAC
377
Notes to the Financial Statements — Continued
Basic and diluted EPS for Con Edison are calculated as follows:
For the Years EndedDecember 31,
(Millions of Dollars, except per share amounts/Shares in Millions) 2011 2010 2009
Net income for common stock $1,051 $ 992 $ 868
Weighted average common shares outstanding – Basic 292.6 284.3 275.2Add: Incremental shares attributable to effect of potentially dilutive securities 1.8 1.6 1.1
Adjusted weighted average common shares outstanding – Diluted 294.4 285.9 276.3
Net Income for common stock per common share – basic $ 3.59 $ 3.49 $ 3.16Net Income for common stock per common share – diluted $ 3.57 $ 3.47 $ 3.14
The computation of diluted earnings per share excludesimmaterial amounts of incremental Con Edison common sharesfor the years ended December 31, 2010 and 2009 because theexercise prices on the options exceeded the average closingmarket price during these periods. No such exclusion wasrequired for the computation of diluted earnings per share forthe year ended December 31, 2011.
EstimatesThe preparation of financial statements in conformity withgenerally accepted accounting principles requires managementto make estimates and assumptions that affect the reportedamounts of assets and liabilities and contingent assets andliabilities at the date of the financial statements and thereported amounts of revenues and expenses during thereporting period. Actual results could differ from thoseestimates.
Note B — Regulatory MattersRate AgreementsCECONY — ElectricThe NYSPSC’s March 2008 and April 2009 orders and theNovember 2009 Joint Proposal covering CECONY’s electricrates, discussed below, provided for the collection of a portionof the company’s electric revenues ($237 million in the rate yearended March 2009, $254 million for the rate year ended March2010 and, rate year ended March 2011, $249 million on anannual basis) subject to potential refund to customers followingNYSPSC review and completion of an investigation by theNYSPSC staff of the company’s capital expenditures during theApril 2005 through March 2008 period for transmission anddistribution utility plant (the 2005-2008 Capital ExpenditureReview). In December 2009, the company established a $24million regulatory liability for refund to customers with respect tothis matter and recognized a $14 million (after-tax) charge in its2009 consolidated financial statements. In March 2010, theNYSPSC issued an order approving a February 2010 JointProposal by the company and the NYSPSC staff relating to thismatter pursuant to which the company, among other things,provided a $36 million credit to customer bills in 2010.
In March 2008, the NYSPSC adopted an order, issued andeffective March 25, 2008, granting CECONY an electric rateincrease, effective April 1, 2008, of $425 million.
The NYSPSC ruling reflected the following major items:
• a return on common equity of 9.1 percent;
• an increase to $150 million from $60 million in thelevel of annual revenues that, for purposes of settingrates, it is assumed the company will receive andretain from the sale of transmission rights on thecompany’s transmission system, with the differencebetween such actual revenues for the rate year and$150 million to be recoverable from or refundable tocustomers, as the case may be;
• collection of $237 million of the $425 million rateincrease is subject to potential refund to customersfollowing the 2005-2008 Capital Expenditure Review(see discussion above in this Note B of the February2010 Joint Proposal);
• continuation of the rate provisions under whichpension and other postretirement benefit expensesand environmental remediation expenses arereconciled to amounts reflected in rates;
• change to the reconciliation provisions fortransmission and distribution expenditures and coststo relocate facilities to accommodate governmentprojects, which under the NYSPSC ruling will bereconciled only to the extent actual expenditures areless than amounts reflected in rates;
• discontinuation of the provisions under which propertytaxes were reconciled to amounts reflected in rates;
• potential operations penalties of up to $152 millionannually if certain customer service and systemreliability performance targets are not met;
92 CON EDISON ANNUAL REPORT
CG11
MAC
377
Notes to the Financial Statements — Continued
• implementation of a revenue decoupling mechanismunder which the company’s actual energy deliveryrevenues would be compared, on a periodic basis, withthe authorized delivery revenues and the differenceaccrued, with interest, for refund to, or recovery from,customers, as applicable; and
• continuation of the rate provisions pursuant to whichthe company recovers its purchased power and fuelcosts from customers.
In April 2009, the NYSPSC adopted an order granting CECONYan electric rate increase, effective April 6, 2009, of $523 million.The NYSPSC ruling reflects the following major items:
• A return on common equity of 10.0 percent, based oncertain assumptions, including a common equity ratio of48 percent and achievement by the company ofunspecified austerity measures required by theNYSPSC that would result in avoided revenuerequirements of $60 million;
• continuation of the revenue decoupling mechanism (in2009, the company increased revenues by $122 millionpursuant to this mechanism and the correspondingprovision of the March 2008 rate order);
• a decrease to $120 million from $150 million in the levelof annual revenues that, for purposes of setting rates, itis assumed the company will receive and retain fromthe sale of transmission rights on the company’stransmission system, with the difference between suchactual revenues for the rate year and $120 million to berecoverable from or refundable to customers, as thecase may be (in 2009, the company accrued $7 millionof revenues under this provision and the correspondingprovision of the March 2008 rate order);
• reconciliation of the actual amount of pension and otherpostretirement benefit costs, environmental remediationexpenses, property taxes and the cost of long-termdebt to amounts reflected in rates (in 2009, thecompany deferred recognition of $36.4 million ofexpenses under these provisions and thecorresponding provisions of the March 2008 rateorder);
• if actual generation, transmission, distribution andshared service plant expenditures (other than removalcosts) and capital costs incurred to relocate facilities toaccommodate government projects are less thanamounts reflected in rates for the respective category ofexpenditures, the company will accrue a regulatoryliability and reduce its revenues by the revenuerequirement impact of the difference (i.e., return on
investment, depreciation and income taxes) (in 2009,the company did not reduce revenues under theseprovisions and the corresponding provisions of theMarch 2008 rate order);
• collection of a surcharge (in addition to the electric rateincrease) from customers in connection with anincrease (estimated at $198 million), effective April2009, in a New York State assessment;
• continuation of provisions for potential operationspenalties of up to $152 million annually if certaincustomer service and system reliability performancetargets are not met (in 2009, the company did notreduce revenues under these provisions and thecorresponding provisions of the March 2008 rateorder);
• continuation of the collection of a portion (increased, toreflect higher capital costs, from $237 million collectedin the rate year ended March 2009 to $254 million forthe rate year ending March 2010) of the April 2008 rateincrease subject to potential refund to customersfollowing the 2005-2008 Capital Expenditure Review(see discussion above in this Note B of the February2010 Joint Proposal). The portion collected is alsosubject to refund in the event the NYSPSC determinesthat some disallowance of costs the company hasrecovered is warranted to address potential impacts ofalleged unlawful conduct by arrested employees andcontractors (see “Other Regulatory Matters” below inthis Note B and “Investigations of Vendor Payments” inNote H); and
• continuation of the rate provisions pursuant to whichthe company recovers its purchased power and fuelcosts from customers.
In May 2009, the company filed with the NYSPSC thecompany’s plan with respect to austerity measures that wouldreduce the company’s revenue requirements during the rate yearending March 31, 2010 by $60 million. The company’s austerityplans include reductions in labor costs, including compensationand other employee benefits, deferral of expenditures for capitalprojects and operating and maintenance programs and otherinitiatives. These reductions collectively represent $47 million ofthe $60 million reduction sought by the NYSPSC. In May 2009,the company filed with the NYSPSC a request for rehearing ofthe NYSPSC’s April 2009 order with respect to its austerityprovisions and certain other matters. Pursuant to the February2010 Joint Proposal (discussed above in Note B), the companywithdrew this request.
In November 2009, CECONY, the NYSPSC staff and otherparties entered into a Joint Proposal with respect to the
CON EDISON ANNUAL REPORT 93
CG11
MAC
377
Notes to the Financial Statements — Continued
company’s May 2009 request to the NYSPSC for an increase inthe rates the company can charge its customers for electricdelivery service. The Joint Proposal, which was approved inMarch 2010, covers the three-year period April 2010 throughMarch 2013 and provides for electric base rate increases of$420 million, effective April 2010 and 2011, and $287 million,effective April 2012, with an additional $133 million to becollected through a surcharge in the rate year ending March2013. In January 2012, the NYSPSC issued a notice solicitingcomments relating to the possible use of certain of thecompany’s regulatory liabilities (that would otherwise berefundable to or applied for the benefit of customers after therate year ended March 2013) to offset all or a portion of suchsurcharge.
The Joint Proposal reflects the following major items:
• A weighted average cost of capital of 7.76 percent,reflecting:
• return on common equity of 10.15 percent,assuming achievement by the company ofunspecified austerity measures that would result inreductions in operations and maintenanceexpenses of $27 million, $20 million and $13 millionin the rate years ending March 2011, 2012 and2013, respectively;
• cost of long-term debt of 5.65 percent;
• common equity ratio of 48 percent; and
• average rate base of $14,887 million, $15,987million and $16,826 million for the rate years endingMarch 2011, 2012 and 2013, respectively.
• Deferral as a regulatory liability of the revenuerequirement impact (i.e., return on investment,depreciation and income taxes) of the amount, if any,by which (A) actual average net plant balances allocableto the company’s electric business for (i) transmissionand distribution, excluding municipal infrastructuresupport (T&D), (ii) generation, shared services and,subject to certain adjustments, municipal infrastructuresupport (Other) and (iii) a finance and supply chainenterprise resource project (ERP) are less than(B) amounts reflected in rates for the respectivecategory for each rate year. The amounts reflected inrates are:
Rate Year Ending March 31,
(Millions of Dollars) 2011 2012 2013
T&D $13,818 $14,742 $15,414Other 1,487 1,565 1,650ERP - 25 115
• Any deferral for T&D and Other for the rate yearending March 2011 will be based on average netplant balances for the year and for the rate yearsending March 2012 and 2013 will be based onaverage net plant balances over the term of theJoint Proposal. The company has deferred $8million as a regulatory liability pursuant to thisprovision in 2011.
• Any deferral for ERP would be based on averagenet plant balances for ERP over the term of theJoint Proposal.
• During the term of the Joint Proposal, the company willnot accrue any additional revenue for carrying chargeson any capital expenditures allocable to its electricbusiness in excess of specified limits (which limitsexclude certain expenditures, including expenditures forprojects for which the company has been selected toreceive grants under the American Recovery andReinvestment Act of 2009):
• T&D capital expenditures – $1,200 million for therate year ending March 2011 and an aggregate$2,300 million for the period from April 2011through March 2013 (such capital expenditures forthe rate year ended March 2011 were less than$1,200 million);
• Other capital expenditures – $220 million for therate year ending March 2011 and an aggregate$402 million for the period from April 2011 throughMarch 2013 (such capital expenditures for the rateyear ended March 2011 were less than $220million); and
• ERP capital expenditures – $125 million (suchcapital expenditures for the rate year ended March2011 were less than $125 million).
• The company is not precluded from seeking to recoverin rates effective after March 2013 the annual revenuerequirement for T&D and Other capital expendituresmade during the term of the Joint Proposal in excess ofthe applicable capital expenditure limit; provided that:
• the company can justify the need for andreasonableness of, and the company’s inability toreasonably avoid, such excess capitalexpenditures; and
• the return on investment for any such excess T&Dor Other capital expenditures made during the rateyear ending March 2011 will be calculated basedon the company’s overall cost of debt. There wereno such excess expenditures for the rate yearended March 31, 2011.
94 CON EDISON ANNUAL REPORT

CG11
MAC
377
Notes to the Financial Statements — Continued
• Sharing with electric customers of any actual earnings,excluding the effects of any penalties and certain otheritems, above specified percentage returns on equity(based on actual average common equity ratio, subjectto a 50 percent maximum) as follows:
• for the rate year ending March 2011, the companywill allocate to customers the revenue requirementequivalent of 50 percent of earnings above 11.15percent up to and including 12.149 percent, 75percent of earnings equal to or in excess of 12.15percent up to and including 13.149 percent and 90percent of earnings equal to or in excess of 13.15percent (earnings were not above 11.15 percent forthe rate year ended March 2011);
• for the rate years ending March 2012 and 2013,the company will allocate to customers the revenuerequirement equivalent of 60 percent of theearnings, calculated on a cumulative basis for suchyears, in excess of 10.65 percent up to andincluding 12.149 percent, 75 percent of suchcumulative earnings equal to or in excess of 12.15percent up to and including 13.149 percent and 90percent of such cumulative earnings equal to or inexcess of 13.15 percent;
• the customers’ share of any such earnings and 50percent of the company’s share would be appliedto reduce regulatory assets for pensions and otherpostretirement benefits and other costs; and
• in the event the company does not file for a rateincrease to take effect in April 2013, the earningssharing levels for the rate year ending March 2013will continue in effect, calculated on an annualbasis, until base rates are reset by the NYSPSC.
• Deferral as a regulatory asset or liability, as the casemay be, of differences between the actual level ofcertain expenses, including, among others, expensesfor pension and other postretirement benefits,environmental remediation, relocation of facilities toaccommodate government projects, property taxes and(for the rate years ending March 2012 and 2013) long-term debt, and amounts for those expenses reflected inrates (with deferral for the difference in property taxeslimited to 80 percent of the difference, subject to annualmaximum for the remaining 20 percent of the differenceof not more than a 10 basis point impact on return oncommon equity and deferral of facility relocationexpenses in excess amounts reflected in rates subjectto certain limitations). In 2010 and 2011, the companydeferred $264 million as a net regulatory asset, and $39
million as a net regulatory liability, respectively, underthese provisions and the corresponding provisions ofthe April 2009 rate order.
• Continuation of the provisions in the April 2009 orderrelating to revenues from the sale of transmission rightson the company’s transmission system. In 2010 and2011, the company accrued $9 million and $26 millionof revenues, respectively, under this provision and thecorresponding provision of the April 2009 rate order.
• Continuation of the revenue decoupling mechanismunder which the company’s actual electric deliveryrevenues would be compared, on a periodic basis, withthe delivery revenues reflected in rates, and thedifference accrued as a regulatory liability (for refund toelectric customers) or a regulatory asset (for recoveryfrom electric customers), as the case may be. In 2010and 2011, the company deferred for customer benefit$124 million and $90 million of revenues, respectively,under this provision and the corresponding provision ofthe April 2009 rate order.
• Continuation of the rate provisions pursuant to whichthe company recovers its purchased power and fuelcosts from electric customers.
• Continuation of provisions for potential operationspenalties of up to $152 million annually if certain electriccustomer service and system reliability performancetargets are not met. In 2010 and 2009, the companydid not recognize any expenses under these provisionsand the corresponding provisions of the April 2009order. In 2011, the company recognized a $5 millionsystem reliability penalty.
• Collection from electric customers of $249 million on anannual basis subject to potential refund following the2005-2008 Capital Expenditure Review (see discussionabove in this Note B of the February 2010 JointProposal). The amount to be collected would also besubject to refund in the event the NYSPSC determinedthat some disallowance of costs the company hasrecovered is warranted to address potential impacts ofalleged unlawful conduct by arrested employees andcontractors (see “Other Regulatory Matters” below inthis Note B and “Investigations of Vendor Payments” inNote H).
O&R — ElectricIn July 2008, the NYSPSC approved a Joint Proposal amongO&R, the NYSPSC staff and other parties for the rates O&R cancharge its New York customers for electric service from July2008 through June 2011. The rate plan approved by the
CON EDISON ANNUAL REPORT 95

CG11
MAC
377
Notes to the Financial Statements — Continued
NYSPSC provides for electric rate increases of $15.6 million,$15.6 million and $5.7 million effective July 1, 2008, 2009 and2010, respectively, and the collection of an additional$9.9 million during the 12-month period beginning July 1, 2010.
The Joint Proposal reflected the following major items:
• an annual return on common equity of 9.4 percent;
• most of any actual earnings above a 10.2 percentreturn on equity (based on actual average commonequity ratio, subject to a 50 percent maximum) are tobe applied to reduce regulatory assets for pensionand other postretirement benefit expenses (thecompany did not reduce regulatory assets under thisprovision in 2011, 2010, or 2009);
• deferral as a regulatory asset or regulatory liability, asthe case may be, of the difference between actualpension and other postretirement benefit expenses,environmental remediation expenses, property taxes,tax-exempt debt costs and certain other expensesand amounts for those expenses reflected in rates(the company deferred recognition of $0.3 million ofexpenses, $0.7 million of revenue and $3 million ofexpenses under this provision in 2011, 2010, and2009, respectively);
• deferral as a regulatory liability of the revenuerequirement impact (i.e., return on investment,depreciation and income taxes) of the amount, if any,by which actual transmission and distribution relatedcapital expenditures are less than amounts reflectedin rates (the company deferred $7 million, $12 million,and $8 million of revenues under this provision in2011, 2010, and 2009, respectively);
• deferral as a regulatory asset of increases, if any, incertain expenses above a 4 percent annual inflationrate, but only if the actual annual return on commonequity is less than 9.4 percent (the company did notdefer any expenses under this provision in 2011, 2010or 2009);
• potential negative earnings adjustments of up to $3million annually if certain customer service and systemreliability performance targets are not met (thecompany met the performance targets in 2011 and2009; the company reduced revenues by $1 millionunder this provision in 2010);
• implementation of a revenue decoupling mechanismunder which actual energy delivery revenues would becompared, on a periodic basis, with the authorized
delivery revenues with the difference accrued, withinterest, for refund to, or recovery from, customers, asapplicable (the company accrued $3.3 million, $5.1million, and $12.5 million of revenues pursuant to thisprovision in 2011, 2010, and 2009, respectively);
• continuation of the rate provisions pursuant to whichthe company recovers its purchased power costsfrom customers; and
• withdrawal of the litigation O&R commenced seekingto annul the NYSPSC’s March and October 2007orders relating to O&R’s electric rates.
In June 2011, the NYSPSC adopted an order granting O&R anelectric rate increase, effective July 1, 2011, of $26.6 million.The NYSPSC ruling reflects the following major items:
• a weighted average cost of capital of 7.22 percent,reflecting:
• a return on common equity of 9.2 percent,assuming achievement by the company of$825,000 of austerity measures;
• cost of long-term debt of 5.50 percent; and
• common equity ratio of 48 percent.
• continuation of a revenue decoupling mechanism;
• a provision for reconciliation of certain differences inactual average net utility plant to the amount reflectedin rates ($718 million) and continuation of rateprovisions under which pension and otherpostretirement benefit expenses, environmentalremediation expenses, tax-exempt debt costs andcertain other expenses are reconciled to amounts forthose expenses reflected in rates;
• continuation of the rate provisions pursuant to whichthe company recovers its purchased power costsfrom customers;
• discontinuation of the provisions under which propertytaxes were reconciled to amounts reflected in rates;
• discontinuation of the inclusion in rates of funding forthe company’s annual incentive plan for non-officermanagement employees;
• continuation of provisions for potential operationspenalties of up to $3 million annually if certaincustomer service and system reliability performancetargets are not met (in 2011, O&R did not recognizeany operations penalties under these provisions or thecorresponding provisions of the Joint Proposaldiscussed above); and
96 CON EDISON ANNUAL REPORT
CG11
MAC
377
Notes to the Financial Statements — Continued
• O&R is directed to produce a report detailing itsimplementation plans for the recommendations made inconnection with the NYSPSC’s management audit ofCECONY, with a forecast of costs to achieve andexpected savings. (See “Rate Agreements – OtherRegulatory Matters” below in this Note B).
In July 2011, O&R filed a request with the NYSPSC for anincrease in the rates it charges for electric service rendered inNew York, effective July 1, 2012, of $17.7 million. The filingreflects a return on common equity of 10.75 percent and acommon equity ratio of 49.4 percent. Among other things, thefiling proposes continuation of the current provisions with respectto recovery from customers of the cost of purchased power andwith respect to the deferral of differences between actualexpenses allocable to the electric business for pensions andother postretirement benefits, environmental, and research anddevelopmental costs to the amounts for such costs reflected inelectric rates. The filing also includes an alternative proposal for athree-year electric rate plan with annual rate increases of $17.6million effective July 2012, 2013 and 2014. The multi-year filingreflects a return on common equity of 11.25 percent. InDecember 2011, to reflect certain increased costs, the companyupdated the requested July 1, 2012 increase to $31.4 millionand the alternative three-year rate plan’s annual increases to$22.2 million.
In March 2007, the New Jersey Board of Public Utilities (NJBPU)approved a three-year electric base rate plan for RocklandElectric Company (RECO), O&R’s New Jersey regulated utilitysubsidiary that went into effect on April 1, 2007. The planprovides for a $6.4 million rate increase during the first year, withno further increase during the final two years. The plan reflects areturn on common equity of 9.75 percent and a common equityratio of 46.5 percent of capitalization.
In May 2010, RECO, the Division of Rate Counsel, Staff of theNJBPU and certain other parties entered into a stipulation ofsettlement with respect to the company’s August 2009 requestto increase the rates that it can charge its customers for electricdelivery service. The stipulation, which was approved by theBoard of the NJBPU, provides for an electric rate increase,effective May 17, 2010, of $9.8 million. The stipulation reflects areturn on common equity of 10.3 percent and a common equityratio of approximately 50 percent. The stipulation continuescurrent provisions with respect to recovery from customers ofthe cost of purchased power and does not provide forreconciliation of actual expenses to amounts reflected in electricrates for pension and other postretirement benefit costs.
CECONY — GasIn September 2007, the NYSPSC approved the Joint Proposalthat CECONY had entered into in June 2007 with the staff of theNYSPSC and other parties with respect to the rates thecompany can charge its customers for gas service. The JointProposal had provided for rate increases of $84.6 million, $32.7million and $42.7 million, effective October 1, 2007, 2008 and2009, respectively, along with annual funding for new energyefficiency programs of $14 million. The NYSPSC modified theJoint Proposal to provide for levelized annual rate increases of$67.5 million in each year of the three year rate plan.
The Joint Proposal continues the previous gas rate planprovisions with respect to recovery from customers of the cost ofpurchased gas and environmental remediation expenses andcorresponding provisions pursuant to which the effects ofweather on gas income are moderated and for the reconciliationof actual expenses allocable to the gas business to the amountsfor such costs reflected in gas rates for pension and otherpostretirement benefit costs, property taxes and interferencecosts. Additional provisions of the gas rate plan include: arevenue decoupling mechanism (pursuant to which the companyaccrued $24 million, $25 million, and $17 million of revenues in2010, 2009, and 2008, respectively) and equal sharing withcustomers of earnings above a 10.7 percent return on commonequity (earnings for the rate years ended September 30, 2010,2009 and 2008 were reduced $6 million, $0 and $9 million,respectively, for earnings above the 10.7 percent threshold).
In May 2010, CECONY, the staff of the NYSPSC and otherparties entered into a Joint Proposal, with respect to thecompany’s rates for gas delivery service. The Joint Proposal,which was approved by the NYSPSC in September 2010, coversthe three-year period October 2010 through September 2013and provides for gas base rate increases of $47.1 million, $47.9million and $46.7 million, effective October 2010, 2011 and2012, respectively. The Joint Proposal reflects the followingmajor items:
• A weighted average cost of capital of 7.46 percent,reflecting:
• return on common equity of 9.6 percent, assumingachievement by the company of cost avoidance forproductivity and “austerity”. The unspecifiedausterity measures assume reductions in costs of$6 million, $4 million and $2 million in the rate yearsending September 2011, 2012 and 2013,respectively;
• cost of long-term debt of 5.57 percent;
• common equity ratio of 48 percent; and
CON EDISON ANNUAL REPORT 97
CG11
MAC
377
Notes to the Financial Statements — Continued
• average rate base of $3,027 million, $3,245million and $3,434 million for the rate years endingSeptember 2011, 2012 and 2013, respectively.
• Deferral as a regulatory liability of the revenuerequirement impact (i.e., return on investment,depreciation and income taxes) of the amount, if any,by which actual average net plant balances allocableto the company’s gas business are less than theamounts reflected in rates: $2,934 million, $3,148million and $3,346 million for the rate years endingSeptember 2011, 2012 and 2013, respectively. Nosuch deferral was required for the rate year endedSeptember 2011.
• Sharing with gas customers of any actual earnings,excluding the effects of any penalties and certainother items, above specified percentage returns onequity (based on actual average common equity ratio,subject to a 50 percent maximum), on a cumulativebasis over the term of the Joint Proposal, calculatedas follows:
• for the rate year ending September 2011, thecompany will allocate to customers the revenuerequirement equivalent of 60 percent of earningsabove 10.35 percent up to and including 11.59percent, 75 percent of earnings equal to or inexcess of 11.6 percent up to and including 12.59percent and 90 percent of earnings equal to or inexcess of 12.6 percent (earnings were not above10.35 percent for the rate year ended September2011);
• for the rate years ending September 2012 and2013, the company will allocate to customers therevenue requirement equivalent of 60 percent ofthe earnings in excess of 10.1 percent up to andincluding 11.59 percent, 75 percent of suchearnings equal to or in excess of 11.6 percent upto and including 12.59 percent and 90 percent ofsuch earnings equal to or in excess of 12.6percent;
• the customers’ share of any such earnings and50 percent of the company’s share, appropriatelyadjusted for taxes, would be applied to reduceregulatory assets for pensions and otherpostretirement benefits and other costs; and
• in the event the company does not file for a rateincrease to take effect in October 2013, theearnings sharing levels for the rate year endingSeptember 2013 will continue in effect,implemented on an annual basis, until base ratesare reset by the NYSPSC.
• Deferral as a regulatory asset or liability, as the casemay be, of differences between the actual level ofcertain expenses, including, among others, expensesfor pension and other postretirement benefits,environmental remediation, property taxes and long-term debt, and amounts for those expenses reflectedin rates (with deferral for the difference in propertytaxes limited to 80 percent of the difference, subjectto an annual maximum for the remaining 20 percent ofthe difference of not more than the equivalent inrevenue requirement of a 10 basis point impact onreturn on common equity). In 2010 and 2011, thecompany deferred $67 million of net regulatory assets,and $0.3 million of net regulatory liabilities,respectively, under these provisions and thecorresponding provisions of the September 2007 rateorder.
• Continuation of provisions pursuant to which thecompany will retain net revenues from non-firmcustomer transactions. In each year of the rate plan,the company will retain up to $58 million of any suchrevenues and 25 percent of any such revenues above$58 million. If such revenues are below $58 million in arate year, the company will accrue a regulatory assetequal to (A) the amount by which such revenues areless than $33 million plus (B) 80 percent of thedifference between $58 million and the level of suchrevenues at or above $33 million. The companyretained $40 million and $70 million of such netrevenues in 2010 and 2011, respectively, under theseprovisions and the corresponding provisions of theSeptember 2007 rate order.
• Continuation of the provisions pursuant to which theeffects of weather on gas delivery revenues duringeach billing cycle are reflected in customer bills forthat billing cycle, and a revenue decouplingmechanism under which the company’s actual gasdelivery revenues, inclusive of any such weatheradjustment, would be compared, on a periodic basis,with the delivery revenues reflected in rates, with thedifference accrued as a regulatory liability (for refundto gas customers) or a regulatory asset (for recoveryfrom gas customers), as the case may be. In 2010and 2011, the company deferred $14 million ofregulatory assets and $20 million of regulatoryliabilities, respectively, under this provision and thecorresponding provisions of the September 2007 rateorder.
• Continuation of the rate provisions pursuant to whichthe company recovers its costs of purchased gasfrom gas customers.
98 CON EDISON ANNUAL REPORT

CG11
MAC
377
Notes to the Financial Statements — Continued
• Continuation of provisions for potential penalties (up to$12.6 million annually) if certain gas customer serviceand system performance targets are not met. In 2010and 2011, the company did not recognize anyexpenses under these provisions or the correspondingprovisions of the September 2007 rate order.
• Continued collection from gas customers of $32 millionon an annual basis subject to potential refund (see“Other Regulatory Matters” below and “Investigations ofVendor Payments” in Note H).
O&R — GasIn October 2006, the NYSPSC approved the June 2006settlement agreement among O&R, the staff of the NYSPSC andother parties. The settlement agreement established a rate planthat covered the three-year period November 1, 2006 throughOctober 31, 2009. The rate plan provided for rate increases inbase rates of $12 million in the first year, $0.7 million in thesecond year and $1.1 million in the third year. To phase-in theeffect of the increase for customers, the rate plan provided forO&R to accrue revenues for, but defer billing to customers of,$5.5 million of the first rate year rate increase by establishing aregulatory asset which, together with interest, was billed tocustomers in the second and third years. As a result, O&R’sbillings to customers increased $6.5 million in each of the firsttwo years and $6.3 million in the third. The first year rate increaseincluded $2.3 million relating to a change in the way customersare provided the benefit of non-firm revenue from sales ofpipeline transportation capacity. Under the prior rate plan, baserates were reduced to reflect the assumption that the companywould realize these revenues. Under the 2006 rate plan, suchrevenues were used to offset the cost of gas to be recoveredfrom customers. The rate plan continued the provisions pursuantto which the company recovers its cost of purchasing gas andthe provisions pursuant to which the effects of weather on gasincome are moderated.
The rate plan provided that if the actual amount of pension orother postretirement benefit costs, environmental remediationcosts, property taxes and certain other costs vary from therespective amount for each such cost reflected in gas rates (costreconciliations), the company would defer recognition of thevariation in income and, as the case may be, establish aregulatory asset or liability for recovery from, or refund to,customers of the variation (86 percent of the variation, in thecase of property tax differences due to assessment changes).
Earnings attributable to its gas business excluding any revenuereductions (O&R Adjusted Earnings) in excess of an 11 percentannual return on common equity (based upon the actual averagecommon equity ratio, subject to a maximum 50 percent of
capitalization) were to be allocated as follows: above an 11percent return were to be used to offset up to one-half of anyregulatory asset to be recorded in that year resulting from thecost reconciliations (discussed in the preceding paragraph).One-half of any remaining O&R Adjusted Earnings between 11and 12 percent return were to be retained by the company, withthe balance deferred for the benefit of customers. Thirty-fivepercent of any remaining O&R Adjusted Earnings between a 12and 14 percent return were to be retained by the company, withthe balance deferred for the benefit of customers. Any remainingO&R Adjusted Earnings above a 14 percent return were to bedeferred for the benefit of customers. For purposes of theseearnings sharing provisions, if in any rate year O&R AdjustedEarnings was less than 11 percent, the shortfall was deductedfrom O&R Adjusted Earnings for the other rate years. Theearnings sharing thresholds were to each be reduced by 20basis points if certain objectives relating to the company’s retailchoice program are not met. O&R adjusted earnings were not inexcess of the 11 percent target return on equity for the rate yearsended October 31, 2009, and 2008.
The rate plan also included up to $1 million of potential earningsadjustments in the first year of the agreement, increasing up to$1.2 million, if the company did not comply with certainrequirements regarding gas main protection and customerservice. O&R recorded a regulatory liability of $0.4 million for notcomplying with certain requirements regarding safety andcustomer service for the rate year ended October 31, 2008. Thecompany met these requirements for the rate year endedOctober 31, 2009.
In October 2009, the NYSPSC adopted a June 2009 JointProposal among O&R, NYSPSC staff and other parties. Asapproved, the Joint Proposal establishes a gas rate plan thatcovers the three-year period November 1, 2009 throughOctober 31, 2012 and provides for increases in base rates of $9million in each of the first two years and $4.6 million in the thirdyear, with an additional $4.3 million to be collected through asurcharge in the third rate year. The rate plan reflects thefollowing major items:
• an annual return on common equity of 10.4 percent;
• most of any actual earnings above an 11.4 percentannual return on common equity (based upon theactual average common equity ratio, subject to amaximum 50 percent of capitalization) are to be appliedto reduce regulatory assets (in 2010 and 2011, thecompany did not defer any revenues under thisprovision);
• deferral as a regulatory asset or liability, as the casemay be, of differences between the actual level of
CON EDISON ANNUAL REPORT 99

CG11
MAC
377
Notes to the Financial Statements — Continued
certain expenses, including expenses for pension andother postretirement benefits, environmentalremediation, property taxes and taxable andtax-exempt long-term debt, and amounts for thoseexpenses reflected in rates (in 2010 and 2011, thecompany deferred $3.1 million and $2.9 million,respectively, of expenses under this provision);
• deferral as a regulatory liability of the revenuerequirement impact (i.e., return on investment,depreciation and income taxes) of the amount, if any,by which average gas net plant balances are less thanbalances reflected in rates (in 2010 and 2011, thecompany deferred $1.5 million of revenues and $1million of expenses, respectively, under this provision);
• deferral as a regulatory asset of increases, if any overthe course of the rate plan, in certain expenses abovea 4 percent annual inflation rate, but only if the actualannual return on common equity is less than 10.4percent (in 2010 and 2011, the company did not deferany revenues under this provision);
• implementation of a revenue decoupling mechanism(in 2010 and 2011, the company accrued $0.8 millionand $2.8 million, respectively, of revenues under thisprovision);
• continuation of the provisions pursuant to which thecompany recovers its cost of purchasing gas and theprovisions pursuant to which the effects of weather ongas income are moderated; and
• potential negative earnings adjustments of up to $1.4million annually if certain operations and customerservice requirements are not met (in 2010 and 2011,the company did not have any potential negativeearnings adjustments under this provision).
CECONY — SteamIn September 2008, the NYSPSC approved the June 2008Joint Proposal among the company, the NYSPSC staff andother parties with respect to the rates the company can chargeits customers for steam service. The Joint Proposal covers theperiod from October 1, 2008 through September 30, 2010.The Joint Proposal provides for steam rate increases of $43.7million effective October 1, 2008 and 2009.
The Joint Proposal reflects the following major items:
• an annual return on common equity of 9.3 percent;
• any actual earnings above a 10.1 percent return onequity (based on actual average common equity ratio,subject to a 50 percent maximum) are to be shared as
follows: half will be deferred for the benefit ofcustomers and the other half is to be retained by thecompany (with half of the company’s share subject tooffset to reduce any regulatory assets for under-collections of property taxes) (earnings for the rateyears ended September 30, 2009 and 2010 did notexceed a 10.1 percent return on equity);
• deferral as a regulatory asset or regulatory liability, asthe case may be, of the difference between (i) actualcosts for pension and other postretirement benefits,environmental remediation, property taxes, certaintax-exempt debt, municipal infrastructure support andcertain other costs and (ii) amounts for those costsreflected in rates (90 percent of the difference in thecase of property taxes and interference costs) (thecompany decreased expenses by $14.9 million and$14.4 million and increased expenses by $3.1 millionunder these provisions in 2010, 2009 and 2008,respectively);
• deferral as a regulatory liability of the revenuerequirement impact (i.e., return on investment,depreciation and income taxes) of the amount, if any,by which the actual capital expenditures related tosteam production plant are less than amountsreflected in rates (there was no regulatory liabilityrecorded for the rate year ended September 30, 2009and $4 million regulatory liability recorded for the rateyear ended September 30, 2010);
• potential negative earnings adjustments (revenuereductions) of approximately $0.95 million to $1 millionannually if certain business development, customerservice and safety performance targets are not met(the company did not record any such adjustments forthe rate years ended September 30, 2010, 2009 and2008);
• amortization of certain regulatory assets and liabilities,the net effect of which will be a non-cash increase insteam revenues of $20.3 million over the two-yearperiod covered by the Joint Proposal; and
• continuation of the rate provisions pursuant to whichthe company recovers its fuel and purchased steamcosts from customers.
In May 2010, CECONY, the NYSPSC staff and other partiesentered into a Joint Proposal, with respect to the company’srates for steam service. The Joint Proposal, which wasapproved by the NYSPSC in September 2010, covers thethree-year period October 2010 through September 2013 andprovides for rate increases of $49.5 million, effective October2010 and 2011,
100 CON EDISON ANNUAL REPORT

CG11
MAC
377
Notes to the Financial Statements — Continued
and $17.8 million, effective October 2012, with an additional$31.7 million to be collected through a surcharge in the rate yearending September 2013. The Joint Proposal reflects thefollowing major items:
• The same weighted average cost of capital, return oncommon equity (assuming, for the steam business,achievement of unspecified reductions in costs of $4.5million, $3 million and $1.5 million in the rate yearsending September 2011, 2012 and 2013, respectively),cost of long-term debt and common equity ratioprovided for in the May 2010 Joint Proposal withrespect to CECONY’s gas business (discussed above)and average steam rate base of $1,589 million, $1,603million and $1,613 million for the rate years endingSeptember 2011, 2012 and 2013, respectively.
• Deferral as a regulatory liability of the revenuerequirement impact of the amount, if any, by whichactual average net plant balances allocable to thecompany’s steam business are less than the amountsreflected in rates for the respective category for eachrate year. The company deferred $0.8 million for therate year ended September 2011. The amountsreflected in rates are:
Rate Year Ending September 30,
(Millions of Dollars) 2011 2012 2013
Steam production $415 $426 $433Steam distribution 521 534 543
• Earnings sharing, expense deferral and potential refund($6 million annually for steam) provisions as discussedabove with respect to CECONY’s gas business. In2011, the company did not recognize any suchearnings sharing, expense deferral or potential refund.
• Continuation of the rate provisions pursuant to whichthe company recovers its cost of fuel and purchasedsteam from its steam customers.
• Continuation of provisions for potential penalties (up toapproximately $1 million annually) if certain steamcustomer service and system performance targets arenot met. In 2011, the company did not recognize anyexpense under these provisions.
The NYSPSC order requires CECONY, in its next steam ratefiling, to propose a phase-in over a period of not more thanseven years of an increase in the allocation to steam customersof the fuel costs for the company’s East River RepoweringProject (ERRP, which cogenerates electricity and steam) that areabove the market value of the electric energy generated byERRP.
Other Regulatory MattersIn February 2009, the NYSPSC commenced a proceeding toexamine the prudence of certain CECONY expenditures (see“Investigations of Vendor Payments” in Note H). Pursuant toNYSPSC orders, a portion of the company’s revenues (currently,$249 million, $32 million and $6 million on an annual basis forelectric, gas and steam service, respectively) is being collectedsubject to potential refund to customers. At December 31, 2011,the company had collected an estimated $816 million fromcustomers subject to potential refund in connection with thisproceeding. In October 2010, a NYSPSC consultant reported its$21 million provisional assessment, which the company hasdisputed, of potential overcharges for construction work. Thepotential overcharges related to transactions that involved certainemployees who were arrested and a contractor that performedwork for the company. The NYSPSC’s consultant is expected tocontinue to review the company’s expenditures. AtDecember 31, 2011, the company had a $11 million regulatoryliability relating to this matter. The company is unable to estimatethe amount, if any, by which any refund required by the NYSPSCmay exceed this regulatory liability.
In August 2009, the NYSPSC released a report on itsmanagement audit of the company. The NYSPSC is required toaudit New York utilities every five years. The NYSPSC consultantthat performed the audit identified areas for improvement,including with respect to the company’s construction program,planning and business processes and regulatory relationships. InOctober 2009, the company filed with the NYSPSC thecompany’s plan to implement the recommendations contained inthe report. The company has implemented most of therecommendations.
In February 2011, the NYSPSC initiated a proceeding to examinethe existing mechanisms pursuant to which utilities recover siteinvestigation and remediation costs and possible alternatives.See Note G.
CON EDISON ANNUAL REPORT 101

CG11
MAC
377
Notes to the Financial Statements — Continued
Regulatory Assets and LiabilitiesRegulatory assets and liabilities at December 31, 2011 and 2010 were comprised of the following items:
Con Edison CECONY
(Millions of Dollars) 2011 2010 2011 2010
Regulatory assetsUnrecognized pension and other postretirement costs $5,852 $4,371 $5,554 $4,152Future income tax 1,798 1,592 1,724 1,514Environmental remediation costs 681 695 564 574Pension and other post retirement benefits deferrals 198 138 157 90Revenue taxes 163 145 158 140Deferred storm costs 128 57 80 43Net electric deferrals 121 156 121 156Surcharge for New York State assessment 90 121 82 112Deferred derivative losses – long-term 60 74 44 48O&R transition bond charges 44 48 - -Workers’ compensation 23 31 23 31Recoverable energy costs – long-term 14 42 14 42Property tax reconciliation 13 34 - 26World Trade Center restoration costs 5 45 5 45Other 147 134 135 124
Regulatory assets – long-term 9,337 7,683 8,661 7,097Deferred derivative losses – current 164 190 140 151Recoverable energy costs – current - 13 - -
Regulatory assets – current 164 203 140 151
Total Regulatory Assets $9,501 $7,886 $8,801 $7,248
Regulatory liabilitiesAllowance for cost of removal less salvage $ 448 $ 422 $ 372 $ 350Net unbilled revenue deferrals 104 136 104 136World Trade Center settlement proceeds 62 - 62 -Carrying charges on transmission and distribution net plant 38 28 14 5Bonus depreciation 35 1 34 1Property tax reconciliation 35 - 35 -Long-term interest rate reconciliation 30 13 30 13Energy efficiency programs 22 12 20 11Gas line losses 21 - 21 -New York State tax refund 20 30 20 30Gain on sale of properties 14 28 14 28Expenditure prudence proceeding 11 - 11 -Other 137 118 124 109
Regulatory liabilities – long-term 977 788 861 683Revenue decoupling mechanism 66 38 66 38Refundable energy costs – current 51 117 12 90Deferred derivative gains – current 1 4 1 3
Regulatory liabilities – current 118 159 79 131
Total Regulatory Liabilities $1,095 $ 947 $ 940 $ 814
“Unrecognized pension and other postretirement costs”represents the net regulatory asset associated with theaccounting rules for retirement benefits. See Note A.
“Net electric deferrals” represents the remaining unamortizedbalance of certain regulatory assets and liabilities of CECONYthat were combined effective April 1, 2010 and are beingamortized to income over a ten year period, in accordance withCECONY’s March 2010 rate plan.
“Revenue taxes” represents the timing difference between taxescollected and paid by the Utilities to fund mass transportation.
Effective March 31, 2009, the NYSPSC authorized CECONY toaccrue unbilled electric, gas and steam
102 CON EDISON ANNUAL REPORT

CG11
MAC
377
Notes to the Financial Statements — Continued
revenues. At December 31, 2011, CECONY has deferred the netmargin on the unbilled revenues for the future benefit ofcustomers by recording a regulatory liability of $104 million forthe difference between the unbilled revenues and energy costliabilities. Also, $44 million of the regulatory asset established in1989 for unbilled gas revenues and $91 million of deferred WorldTrade Center costs has been offset against the unbilled revenueregulatory liability.
Note C — CapitalizationCommon StockAt December 31, 2011 and 2010, Con Edison owned all of theissued and outstanding shares of common stock of the Utilitiesand the competitive energy businesses. CECONY owns21,976,200 shares of Con Edison stock, which it purchasedprior to 2001 in connection with Con Edison’s stock repurchaseplan. CECONY presents in the financial statements the cost ofthe Con Edison stock it owns as a reduction of commonshareholder’s equity.
Capitalization of Con EdisonThe outstanding capitalization for each of the Companies isshown on its Consolidated Statement of Capitalization, and forCon Edison includes the Utilities’ outstanding preferred stockand debt.
Preferred Stock of CECONYAs of December 31, 2011, 1,915,319 shares of CECONY’s $5Cumulative Preferred Stock (the “$5 Preferred”) and 375,626shares of its Cumulative Preferred Stock ($100 par value) wereoutstanding.
Dividends on the $5 Preferred Stock are $5 per share perannum, payable quarterly, and dividends on the CumulativePreferred Stock are $4.65 per share per annum, payablequarterly. The preferred dividends must be declared byCECONY’s Board of Trustees to become payable. See“Dividends” below.
With respect to any corporate action to be taken by a vote ofshareholders of CECONY, Con Edison (which owns all of the235,488,094 shares of CECONY’s common stock that areoutstanding) and the holders of the $5 Preferred are eachentitled to one vote for each share held. Except as otherwiserequired by law, holders of the Cumulative Preferred Stock haveno right to vote; provided, however, that if the $5 Preferred is nolonger outstanding, the holders of the Cumulative PreferredStock are entitled to one vote for each share with respect to anycorporate action to be taken by a vote of the shareholders ofCECONY. In addition, if dividends are in arrears for certainperiods, the holders are entitled to certain rights with respect tothe election of CECONY’s Trustees. Without the consent of the
holders of the Cumulative Preferred Stock, CECONY may notcreate or authorize any kind of stock ranking prior to theCumulative Preferred Stock or, if such actions would affect theholders of the Cumulative Preferred Stock adversely, be a partyto any consolidation or merger, create or amend the terms of theCumulative Preferred Stock or reclassify the CumulativePreferred Stock. CECONY may redeem the $5 Preferred at aredemption price of $105 per share and the CumulativePreferred Stock at a redemption price of $101 per share (in eachcase, plus accrued and unpaid dividends). In the event of thedissolution, liquidation or winding up of the affairs of CECONY,before any distribution of capital assets could be made to theholders of the company’s common stock, the holders of the $5Preferred and the Cumulative Preferred Stock would each beentitled to receive $100 per share, in the case of an involuntaryliquidation, or an amount equal to the redemption price pershare, in the case of a voluntary liquidation, in each casetogether with all accrued and unpaid dividends.
DividendsIn accordance with NYSPSC requirements, the dividends thatthe Utilities generally pay are limited to not more than 100percent of their respective income available for dividendscalculated on a two-year rolling average basis. Excluded from thecalculation of “income available for dividends” are non-cashcharges to income resulting from accounting changes or chargesto income resulting from significant unanticipated events. Therestriction also does not apply to dividends paid in order totransfer to Con Edison proceeds from major transactions, suchas asset sales, or to dividends reducing each utility subsidiary’sequity ratio to a level appropriate to its business risk.In addition, no dividends may be paid, or funds set apart forpayment, on CECONY’s common stock until all dividendsaccrued on the $5 Preferred Stock and Cumulative PreferredStock have been paid, or declared and set apart for payment.
Long-term DebtLong-term debt maturing in the period 2012-2016 is as follows:
(Millions of Dollars) Con Edison CECONY
2012 $530 $5252013 705 7002014 481 4752015 495 3502016 731 650
The Utilities have issued $269 million of tax-exempt debt throughthe New York State Energy Research and Development Authority(NYSERDA) that currently bear interest at a rate determinedweekly and is subject to tender by bondholders for purchase bythe Utilities. In 2010, CECONY issued $225 million of tax-exemptdebt that is subject to mandatory tender in 2012.
CON EDISON ANNUAL REPORT 103

CG11
MAC
377
Notes to the Financial Statements — Continued
The carrying amounts and fair values of long-term debt are:
December 31,(millions of dollars) 2011 2010
Long-Term Debt(includingcurrent portion)
CarryingAmount
FairValue
CarryingAmount
FairValue
Con Edison $ 10,673 $ 12,744 $ 10,676 $ 11,761
CECONY $ 9,745 $ 11,593 $ 9,743 $ 10,680
Fair values of long-term debt have been estimated primarily usingavailable market information.
At December 31, 2011 and 2010, long-term debt of Con Edisonincluded $29 million and $32 million, respectively, of TransitionBonds issued in 2004 by O&R’s New Jersey utility subsidiarythrough a special purpose entity.
Significant Debt CovenantsThe significant debt covenants under the financing arrangementsfor the notes of Con Edison and the debentures of CECONY areobligations to pay principal and interest when due, covenants notto consolidate with or merge into any other corporation unlesscertain conditions are met and, for Con Edison’s notes,covenants that Con Edison shall continue its utility business inNew York City and shall not permit Con Edison’s ratio ofconsolidated debt to consolidated capital to exceed 0.675 to 1.Con Edison’s notes are also subject to cross default provisionswith respect to other indebtedness of Con Edison or its materialsubsidiaries having a then outstanding principal balance inexcess of $100 million. CECONY’s debentures have no crossdefault provisions. The tax-exempt financing arrangements of theUtilities are subject to covenants for the CECONY debenturesdiscussed above and the covenants discussed below. TheCompanies believe that they were in compliance with theirsignificant debt covenants at December 31, 2011.
The tax-exempt financing arrangements involved the issuance ofuncollateralized promissory notes of the Utilities to NYSERDA inexchange for the net proceeds of a like amount of tax-exemptbonds with substantially the same terms sold to the public byNYSERDA. The tax-exempt financing arrangements includecovenants with respect to the tax-exempt status of the financing,including covenants with respect to the use of the facilities financed.The arrangements include provisions for the maintenance ofliquidity and credit facilities, the failure to comply with which would,except as otherwise provided, constitute an event of default withrespect to the debt to which such provisions applied.
The failure to comply with debt covenants would, except asotherwise provided, constitute an event of default with respect to
the debt to which such provisions applied. If an event of defaultwere to occur, the principal and accrued interest on the debt towhich such event of default applied and, in the case of the ConEdison notes, a make-whole premium might and, in the case ofcertain events of default would, become due and payableimmediately.
The liquidity and credit facilities currently in effect for thetax-exempt financing include covenants that the ratio of debt tototal capital of the obligated utility will not at any time exceed0.65 to 1 and that, subject to certain exceptions, the utility willnot mortgage, lien, pledge or otherwise encumber its assets.Certain of the facilities also include as events of default, defaultsin payments of other debt obligations in excess of specifiedlevels ($100 million for CECONY).
Note D — Short-Term BorrowingIn October 2011, Con Edison and the Utilities entered into aCredit Agreement (Credit Agreement), under which banks arecommitted to provide loans and letters of credit on a revolvingcredit basis, and terminated their Amended and Restated CreditAgreement (Prior Credit Agreement) which was to expire in June2012. Under the Credit Agreement, which expires in October2016, there is a maximum of $2.25 billion of credit available, withthe full amount available to CECONY and $1 billion available toCon Edison, including up to $1.2 billion of letters of credit. TheCredit Agreement supports the Companies’ commercial paperprograms. The Companies have not borrowed under the CreditAgreement. At December 31, 2011 and 2010, Con Edison andCECONY had no commercial paper outstanding.
The banks’ commitments under the Credit Agreement aresubject to certain conditions, including that there be no event ofdefault. The commitments are not subject to maintenance ofcredit rating levels or the absence of a material adverse change.Upon a change of control of, or upon an event of default by oneof the Companies, the banks may terminate their commitmentswith respect to that company, declare any amounts owed by thatcompany under the Credit Agreement immediately due andpayable and require that company to provide cash collateralrelating to the letters of credit issued for it under the CreditAgreement. Events of default include the exceeding at any timeof a ratio of consolidated debt to consolidated total capital of0.65 to 1 (at December 31, 2011 this ratio was 0.48 to 1 for ConEdison and CECONY); having liens on its assets in an aggregateamount exceeding 5 percent of its consolidated total capital,subject to certain exceptions; and the failure, following anyapplicable notice period, to meet certain other customarycovenants. Interest and fees charged for the revolving creditfacilities and any loans made or letters of credit issued under theCredit Agreement reflect the Companies’ respective creditratings.
104 CON EDISON ANNUAL REPORT
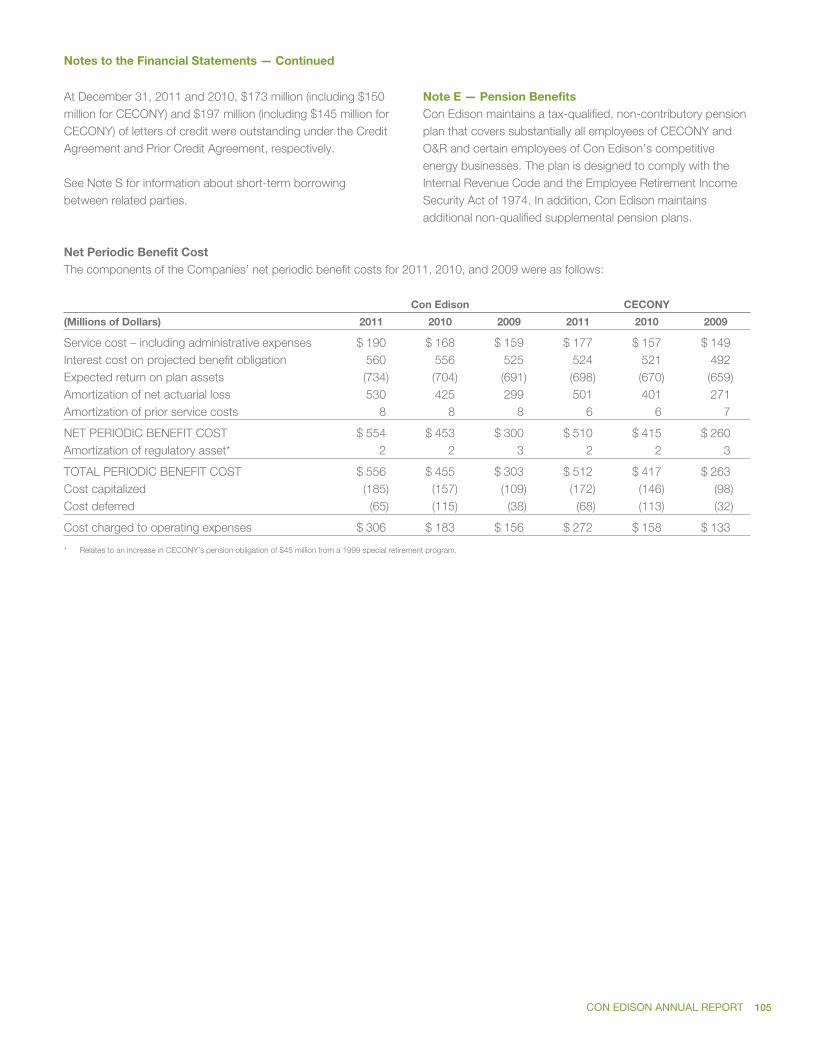
CG11
MAC
377
Notes to the Financial Statements — Continued
At December 31, 2011 and 2010, $173 million (including $150million for CECONY) and $197 million (including $145 million forCECONY) of letters of credit were outstanding under the CreditAgreement and Prior Credit Agreement, respectively.
See Note S for information about short-term borrowingbetween related parties.
Note E — Pension BenefitsCon Edison maintains a tax-qualified, non-contributory pensionplan that covers substantially all employees of CECONY andO&R and certain employees of Con Edison’s competitiveenergy businesses. The plan is designed to comply with theInternal Revenue Code and the Employee Retirement IncomeSecurity Act of 1974. In addition, Con Edison maintainsadditional non-qualified supplemental pension plans.
Net Periodic Benefit CostThe components of the Companies’ net periodic benefit costs for 2011, 2010, and 2009 were as follows:
Con Edison CECONY
(Millions of Dollars) 2011 2010 2009 2011 2010 2009
Service cost – including administrative expenses $ 190 $ 168 $ 159 $ 177 $ 157 $ 149Interest cost on projected benefit obligation 560 556 525 524 521 492Expected return on plan assets (734) (704) (691) (698) (670) (659)Amortization of net actuarial loss 530 425 299 501 401 271Amortization of prior service costs 8 8 8 6 6 7
NET PERIODIC BENEFIT COST $ 554 $ 453 $ 300 $ 510 $ 415 $ 260Amortization of regulatory asset* 2 2 3 2 2 3
TOTAL PERIODIC BENEFIT COST $ 556 $ 455 $ 303 $ 512 $ 417 $ 263Cost capitalized (185) (157) (109) (172) (146) (98)Cost deferred (65) (115) (38) (68) (113) (32)
Cost charged to operating expenses $ 306 $ 183 $ 156 $ 272 $ 158 $ 133
* Relates to an increase in CECONY’s pension obligation of $45 million from a 1999 special retirement program.
CON EDISON ANNUAL REPORT 105
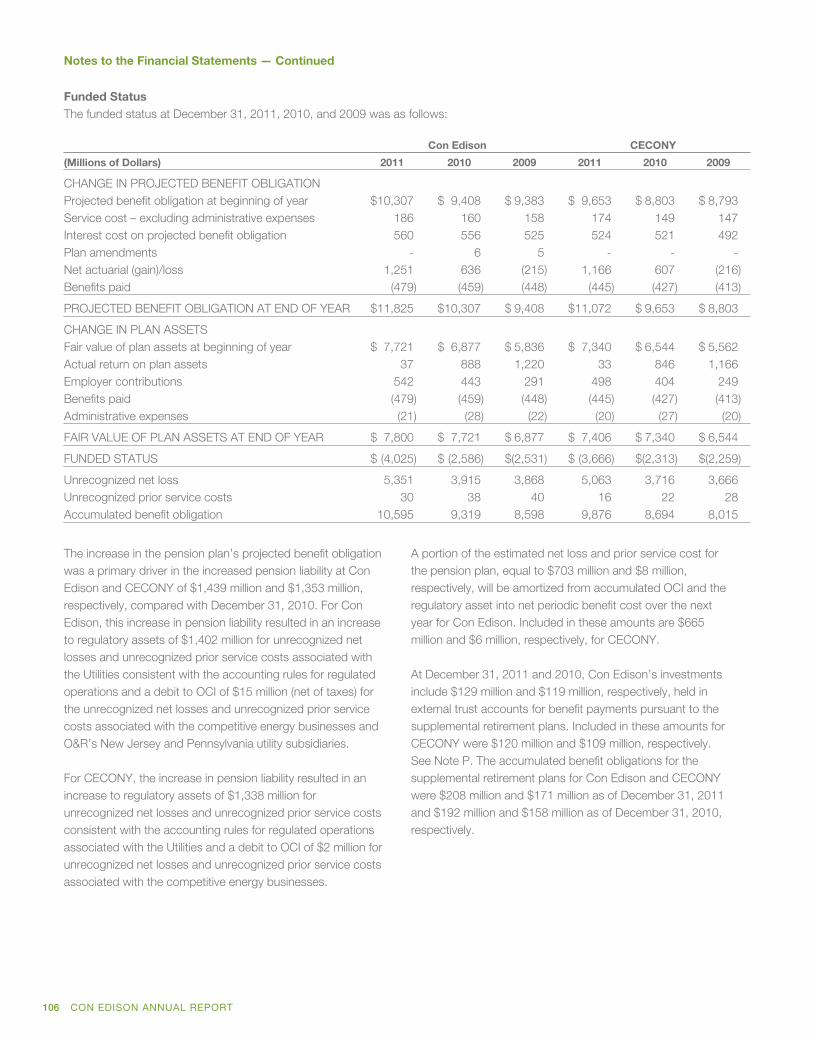
CG11
MAC
377
Notes to the Financial Statements — Continued
Funded StatusThe funded status at December 31, 2011, 2010, and 2009 was as follows:
Con Edison CECONY
(Millions of Dollars) 2011 2010 2009 2011 2010 2009
CHANGE IN PROJECTED BENEFIT OBLIGATIONProjected benefit obligation at beginning of year $10,307 $ 9,408 $ 9,383 $ 9,653 $ 8,803 $ 8,793Service cost – excluding administrative expenses 186 160 158 174 149 147Interest cost on projected benefit obligation 560 556 525 524 521 492Plan amendments - 6 5 - - -Net actuarial (gain)/loss 1,251 636 (215) 1,166 607 (216)Benefits paid (479) (459) (448) (445) (427) (413)
PROJECTED BENEFIT OBLIGATION AT END OF YEAR $11,825 $10,307 $ 9,408 $11,072 $ 9,653 $ 8,803
CHANGE IN PLAN ASSETSFair value of plan assets at beginning of year $ 7,721 $ 6,877 $ 5,836 $ 7,340 $ 6,544 $ 5,562Actual return on plan assets 37 888 1,220 33 846 1,166Employer contributions 542 443 291 498 404 249Benefits paid (479) (459) (448) (445) (427) (413)Administrative expenses (21) (28) (22) (20) (27) (20)
FAIR VALUE OF PLAN ASSETS AT END OF YEAR $ 7,800 $ 7,721 $ 6,877 $ 7,406 $ 7,340 $ 6,544
FUNDED STATUS $ (4,025) $ (2,586) $(2,531) $ (3,666) $(2,313) $(2,259)
Unrecognized net loss 5,351 3,915 3,868 5,063 3,716 3,666Unrecognized prior service costs 30 38 40 16 22 28Accumulated benefit obligation 10,595 9,319 8,598 9,876 8,694 8,015
The increase in the pension plan’s projected benefit obligationwas a primary driver in the increased pension liability at ConEdison and CECONY of $1,439 million and $1,353 million,respectively, compared with December 31, 2010. For ConEdison, this increase in pension liability resulted in an increaseto regulatory assets of $1,402 million for unrecognized netlosses and unrecognized prior service costs associated withthe Utilities consistent with the accounting rules for regulatedoperations and a debit to OCI of $15 million (net of taxes) forthe unrecognized net losses and unrecognized prior servicecosts associated with the competitive energy businesses andO&R’s New Jersey and Pennsylvania utility subsidiaries.
For CECONY, the increase in pension liability resulted in anincrease to regulatory assets of $1,338 million forunrecognized net losses and unrecognized prior service costsconsistent with the accounting rules for regulated operationsassociated with the Utilities and a debit to OCI of $2 million forunrecognized net losses and unrecognized prior service costsassociated with the competitive energy businesses.
A portion of the estimated net loss and prior service cost forthe pension plan, equal to $703 million and $8 million,respectively, will be amortized from accumulated OCI and theregulatory asset into net periodic benefit cost over the nextyear for Con Edison. Included in these amounts are $665million and $6 million, respectively, for CECONY.
At December 31, 2011 and 2010, Con Edison’s investmentsinclude $129 million and $119 million, respectively, held inexternal trust accounts for benefit payments pursuant to thesupplemental retirement plans. Included in these amounts forCECONY were $120 million and $109 million, respectively.See Note P. The accumulated benefit obligations for thesupplemental retirement plans for Con Edison and CECONYwere $208 million and $171 million as of December 31, 2011and $192 million and $158 million as of December 31, 2010,respectively.
106 CON EDISON ANNUAL REPORT
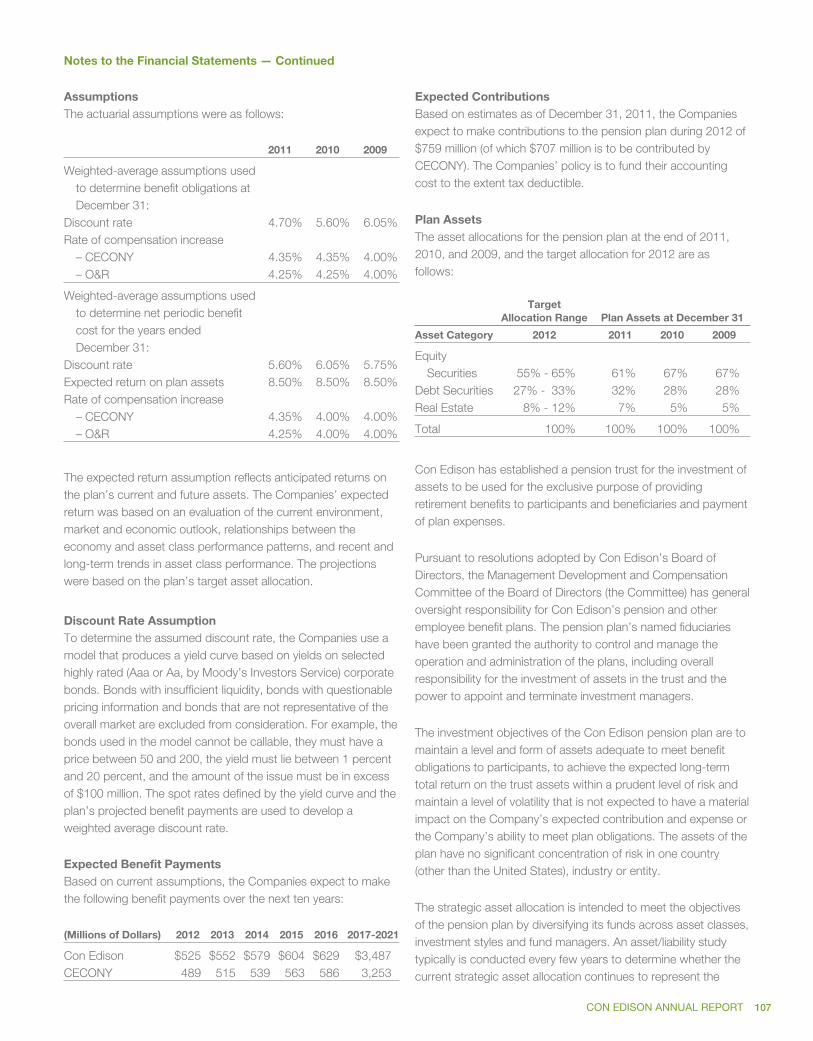
CG11
MAC
377
Notes to the Financial Statements — Continued
AssumptionsThe actuarial assumptions were as follows:
2011 2010 2009
Weighted-average assumptions usedto determine benefit obligations atDecember 31:
Discount rate 4.70% 5.60% 6.05%Rate of compensation increase
– CECONY 4.35% 4.35% 4.00%– O&R 4.25% 4.25% 4.00%
Weighted-average assumptions usedto determine net periodic benefitcost for the years endedDecember 31:
Discount rate 5.60% 6.05% 5.75%Expected return on plan assets 8.50% 8.50% 8.50%Rate of compensation increase
– CECONY 4.35% 4.00% 4.00%– O&R 4.25% 4.00% 4.00%
The expected return assumption reflects anticipated returns onthe plan’s current and future assets. The Companies’ expectedreturn was based on an evaluation of the current environment,market and economic outlook, relationships between theeconomy and asset class performance patterns, and recent andlong-term trends in asset class performance. The projectionswere based on the plan’s target asset allocation.
Discount Rate AssumptionTo determine the assumed discount rate, the Companies use amodel that produces a yield curve based on yields on selectedhighly rated (Aaa or Aa, by Moody’s Investors Service) corporatebonds. Bonds with insufficient liquidity, bonds with questionablepricing information and bonds that are not representative of theoverall market are excluded from consideration. For example, thebonds used in the model cannot be callable, they must have aprice between 50 and 200, the yield must lie between 1 percentand 20 percent, and the amount of the issue must be in excessof $100 million. The spot rates defined by the yield curve and theplan’s projected benefit payments are used to develop aweighted average discount rate.
Expected Benefit PaymentsBased on current assumptions, the Companies expect to makethe following benefit payments over the next ten years:
(Millions of Dollars) 2012 2013 2014 2015 2016 2017-2021
Con Edison $525 $552 $579 $604 $629 $3,487CECONY 489 515 539 563 586 3,253
Expected ContributionsBased on estimates as of December 31, 2011, the Companiesexpect to make contributions to the pension plan during 2012 of$759 million (of which $707 million is to be contributed byCECONY). The Companies’ policy is to fund their accountingcost to the extent tax deductible.
Plan AssetsThe asset allocations for the pension plan at the end of 2011,2010, and 2009, and the target allocation for 2012 are asfollows:
TargetAllocation Range Plan Assets at December 31
Asset Category 2012 2011 2010 2009
EquitySecurities 55% - 65% 61% 67% 67%
Debt Securities 27% - 33% 32% 28% 28%Real Estate 8% - 12% 7% 5% 5%
Total 100% 100% 100% 100%
Con Edison has established a pension trust for the investment ofassets to be used for the exclusive purpose of providingretirement benefits to participants and beneficiaries and paymentof plan expenses.
Pursuant to resolutions adopted by Con Edison’s Board ofDirectors, the Management Development and CompensationCommittee of the Board of Directors (the Committee) has generaloversight responsibility for Con Edison’s pension and otheremployee benefit plans. The pension plan’s named fiduciarieshave been granted the authority to control and manage theoperation and administration of the plans, including overallresponsibility for the investment of assets in the trust and thepower to appoint and terminate investment managers.
The investment objectives of the Con Edison pension plan are tomaintain a level and form of assets adequate to meet benefitobligations to participants, to achieve the expected long-termtotal return on the trust assets within a prudent level of risk andmaintain a level of volatility that is not expected to have a materialimpact on the Company’s expected contribution and expense orthe Company’s ability to meet plan obligations. The assets of theplan have no significant concentration of risk in one country(other than the United States), industry or entity.
The strategic asset allocation is intended to meet the objectivesof the pension plan by diversifying its funds across asset classes,investment styles and fund managers. An asset/liability studytypically is conducted every few years to determine whether thecurrent strategic asset allocation continues to represent the
CON EDISON ANNUAL REPORT 107
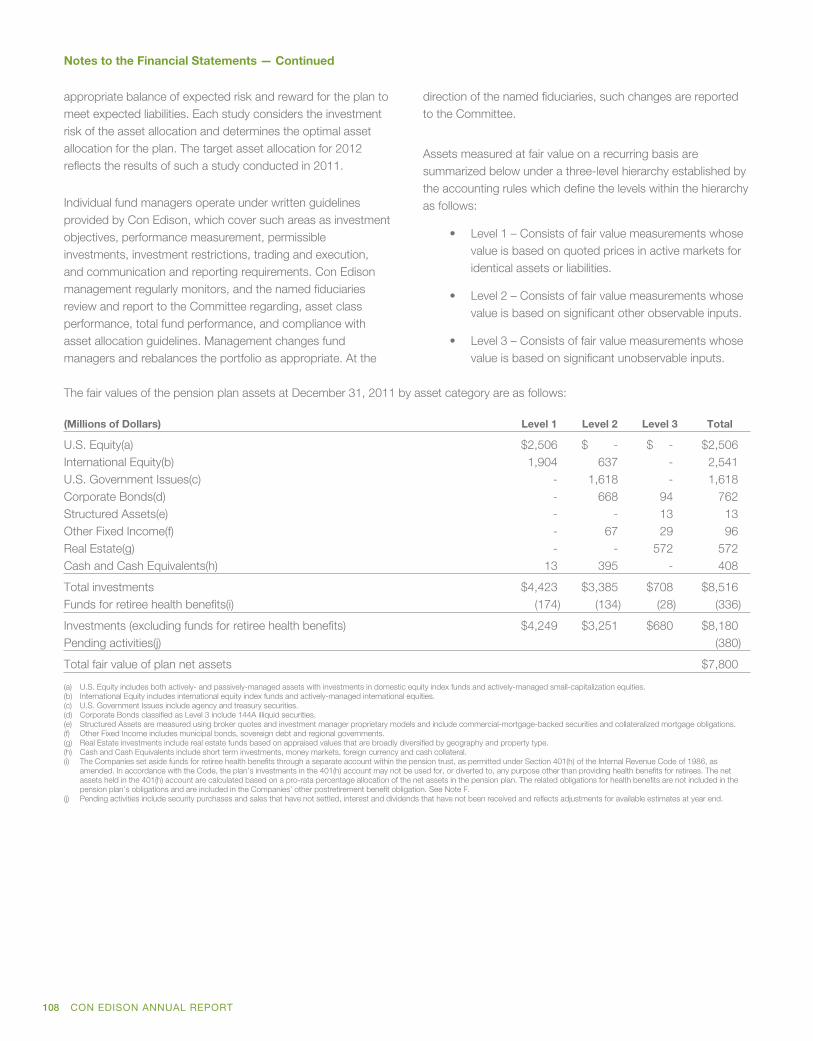
CG11
MAC
377
Notes to the Financial Statements — Continued
appropriate balance of expected risk and reward for the plan tomeet expected liabilities. Each study considers the investmentrisk of the asset allocation and determines the optimal assetallocation for the plan. The target asset allocation for 2012reflects the results of such a study conducted in 2011.
Individual fund managers operate under written guidelinesprovided by Con Edison, which cover such areas as investmentobjectives, performance measurement, permissibleinvestments, investment restrictions, trading and execution,and communication and reporting requirements. Con Edisonmanagement regularly monitors, and the named fiduciariesreview and report to the Committee regarding, asset classperformance, total fund performance, and compliance withasset allocation guidelines. Management changes fundmanagers and rebalances the portfolio as appropriate. At the
direction of the named fiduciaries, such changes are reportedto the Committee.
Assets measured at fair value on a recurring basis aresummarized below under a three-level hierarchy established bythe accounting rules which define the levels within the hierarchyas follows:
• Level 1 – Consists of fair value measurements whosevalue is based on quoted prices in active markets foridentical assets or liabilities.
• Level 2 – Consists of fair value measurements whosevalue is based on significant other observable inputs.
• Level 3 – Consists of fair value measurements whosevalue is based on significant unobservable inputs.
The fair values of the pension plan assets at December 31, 2011 by asset category are as follows:
(Millions of Dollars) Level 1 Level 2 Level 3 Total
U.S. Equity(a) $2,506 $ - $ - $2,506International Equity(b) 1,904 637 - 2,541U.S. Government Issues(c) - 1,618 - 1,618Corporate Bonds(d) - 668 94 762Structured Assets(e) - - 13 13Other Fixed Income(f) - 67 29 96Real Estate(g) - - 572 572Cash and Cash Equivalents(h) 13 395 - 408
Total investments $4,423 $3,385 $708 $8,516Funds for retiree health benefits(i) (174) (134) (28) (336)
Investments (excluding funds for retiree health benefits) $4,249 $3,251 $680 $8,180Pending activities(j) (380)
Total fair value of plan net assets $7,800
(a) U.S. Equity includes both actively- and passively-managed assets with investments in domestic equity index funds and actively-managed small-capitalization equities.(b) International Equity includes international equity index funds and actively-managed international equities.(c) U.S. Government Issues include agency and treasury securities.(d) Corporate Bonds classified as Level 3 include 144A illiquid securities.(e) Structured Assets are measured using broker quotes and investment manager proprietary models and include commercial-mortgage-backed securities and collateralized mortgage obligations.(f) Other Fixed Income includes municipal bonds, sovereign debt and regional governments.(g) Real Estate investments include real estate funds based on appraised values that are broadly diversified by geography and property type.(h) Cash and Cash Equivalents include short term investments, money markets, foreign currency and cash collateral.(i) The Companies set aside funds for retiree health benefits through a separate account within the pension trust, as permitted under Section 401(h) of the Internal Revenue Code of 1986, as
amended. In accordance with the Code, the plan’s investments in the 401(h) account may not be used for, or diverted to, any purpose other than providing health benefits for retirees. The netassets held in the 401(h) account are calculated based on a pro-rata percentage allocation of the net assets in the pension plan. The related obligations for health benefits are not included in thepension plan’s obligations and are included in the Companies’ other postretirement benefit obligation. See Note F.
(j) Pending activities include security purchases and sales that have not settled, interest and dividends that have not been received and reflects adjustments for available estimates at year end.
108 CON EDISON ANNUAL REPORT

CG11
MAC
377
Notes to the Financial Statements — Continued
The table below provides a reconciliation of the beginning and ending net balances for assets at December 31, 2011 classified asLevel 3 in the fair value hierarchy.
(Millions of Dollars)
BeginningBalance as of
January 1, 2011
Assets Still Heldat Reporting Date –Unrealized Gains/
(Losses)
Assets SoldDuring the
Period–RealizedGains
PurchasesSales and
Settlements
EndingBalance as ofDecember 31,
2011
Corporate Bonds $129 $ (9) $11 $ (37) $ 94Structured Assets 87 (1) 2 (75) 13Other Fixed Income 66 (1) 3 (39) 29Real Estate 398 65 - 109 572
Total investments $680 $54 $16 $ (42) $708Funds for retiree health benefits (30) 3 1 (2) (28)
Investments (excluding funds forretiree health benefits) $650 $57 $17 $ (44) $680
The fair values of the pension plan assets at December 31, 2010 by asset category are as follows:
(Millions of Dollars) Level 1 Level 2 Level 3 Total
U.S. Equity(a) $3,935 $ - $ - $3,935International Equity(b) 1,249 234 - 1,483U.S. Government Issues(c) - 1,300 - 1,300Corporate Bonds(d) - 571 129 700Structured Assets(e) - - 87 87Other Fixed Income(f) - 31 66 97Real Estate(g) - - 398 398Cash and Cash Equivalents(h) 3 232 - 235
Total investments $5,187 $2,368 $680 $8,235Funds for retiree health benefits(i) (226) (103) (30) (359)
Investments (excluding funds for retiree health benefits) $4,961 $2,265 $650 $7,876Pending activities(j) (155)
Total fair value of plan net assets $7,721
(a) U.S. Equity includes both actively- and passively-managed assets with investments in domestic equity index funds, actively-managed small-capitalization equities, rights and warrants.(b) International Equity includes international equity index funds, actively-managed international equities, rights and warrants.(c) U.S. Government Issues include agency and treasury securities.(d) Corporate Bonds held in institutional mutual funds which are measured at Net Asset Value (NAV) are classified as Level 3.(e) Structured Assets are measured using broker quotes and investment manager proprietary models and include commercial-mortgage-backed securities, collateralized mortgage obligations and
asset-backed securities.(f) Other Fixed Income includes emerging market debt valued using broker quotes, municipal bonds, sovereign debt, regional governments and government agencies.(g) Real Estate investments include real estate funds based on appraised values that are broadly diversified by geography and property type.(h) Cash and Cash Equivalents include short term investments, money markets and foreign currency.(i) The Companies set aside funds for retiree health benefits through a separate account within the pension trust, as permitted under Section 401(h) of the Internal Revenue Code of 1986, as
amended. In accordance with the Code, the plan’s investments in the 401(h) account may not be used for, or diverted to, any purpose other than providing health benefits for retirees. The netassets held in the 401(h) account are calculated based on a pro-rata percentage allocation of the net assets in the pension plan. The related obligations for health benefits are not included in thepension plan’s obligations and are included in the Companies’ other postretirement benefit obligation. See Note F.
(j) Pending activities include security purchases and sales that have not settled, interest and dividends that have not been received and reflects adjustments for available estimates at year end.
CON EDISON ANNUAL REPORT 109

CG11
MAC
377
Notes to the Financial Statements — Continued
The table below provides a reconciliation of the beginning and ending net balances for assets at December 31, 2010 classified asLevel 3 in the fair value hierarchy.
(Millions of Dollars)
BeginningBalance as of
January 1, 2010
Assets Still Heldat Reporting Date –
UnrealizedGains/(Losses)
Assets SoldDuring the
Period – RealizedGains/(Losses)
PurchasesSales and
Settlements
EndingBalance as ofDecember 31,
2010
U.S. Equity $ - $ - $ - $ - $ -International Equity 1 1 (1) (1) -Corporate Bonds 143 (3) 9 (20) 129Structured Assets 91 15 (6) (13) 87Other Fixed Income 46 - 2 18 66Swaps (3) 2 (1) 2 -Real Estate 344 47 - 7 398
Total investments $622 62 3 (7) $680Funds for retiree health benefits (28) (3) (2) 3 (30)
Investments (excluding funds forretiree health benefits) $594 $59 $ 1 $ (4) $650
The Companies also offer a defined contribution savings planthat covers substantially all employees and made contributionsto the plan as follows:
For the Years Ended December 31
(Millions of Dollars) 2011 2010 2009
Con Edison $23 $19 $19CECONY 21 17 17
Note F — Other Postretirement BenefitsThe Utilities currently have contributory comprehensive hospital,medical and prescription drug programs for all retirees, theirdependents and surviving spouses.
CECONY also has a contributory life insurance program forbargaining unit employees and provides basic life insurancebenefits up to a specified maximum at no cost to retiredmanagement employees. O&R has a non-contributory lifeinsurance program for retirees. Certain employees of ConEdison’s competitive energy businesses are eligible to receivebenefits under these programs.
Net Periodic Benefit CostThe components of the Companies’ net periodic postretirement benefit costs for 2011, 2010, and 2009 were as follows:
Con Edison CECONY
(Millions of Dollars) 2011 2010 2009 2011 2010 2009
Service cost $ 26 $ 24 $ 22 $ 20 $ 19 $ 18Interest cost on accumulated other postretirement benefit obligation 83 91 95 72 80 84Expected return on plan assets (88) (86) (86) (78) (78) (78)Amortization of net actuarial loss 88 92 74 80 85 65Amortization of prior service cost (10) (12) (12) (11) (14) (14)Amortization of transition obligation 4 3 3 4 3 3
NET PERIODIC POSTRETIREMENT BENEFIT COST $103 $112 $ 96 $ 87 $ 95 $ 78Cost capitalized (35) (39) (35) (29) (33) (29)Cost charged 14 4 3 13 1 1
Cost charged to operating expenses $ 82 $ 77 $ 64 $ 71 $ 63 $ 50
110 CON EDISON ANNUAL REPORT

CG11
MAC
377
Notes to the Financial Statements — Continued
Funded StatusThe funded status of the programs at December 31, 2011, 2010, and 2009 were as follows:
Con Edison CECONY
(Millions of Dollars) 2011 2010 2009 2011 2010 2009
CHANGE IN BENEFIT OBLIGATIONBenefit obligation at beginning of year $1,642 $1,697 $1,702 $1,426 $1,495 $1,495Service cost 25 24 22 20 19 18Interest cost on accumulated postretirement benefit obligation 83 91 95 72 80 84Net actuarial loss/(gain) 109 (68) (14) 86 (77) (3)Benefits paid and administrative expenses (144) (138) (141) (132) (126) (130)Participant contributions 33 29 26 32 28 25Medicare prescription benefit 8 7 7 7 7 6
BENEFIT OBLIGATION AT END OF YEAR $1,756 $1,642 $1,697 $1,511 $1,426 $1,495
CHANGE IN PLAN ASSETSFair value of plan assets at beginning of year $ 942 $ 866 $ 737 $ 839 $ 777 $ 668Actual return on plan assets 20 89 153 19 78 137Employer contributions 84 96 86 74 85 73Participant contributions 33 29 26 32 28 25Benefits paid (132) (138) (136) (124) (129) (126)
FAIR VALUE OF PLAN ASSETS AT END OF YEAR $ 947 $ 942 $ 866 $ 840 $ 839 $ 777
FUNDED STATUS $ (809) $ (700) $ (831) $ (671) $ (587) $ (718)
Unrecognized net loss 563 483 646 496 601 728Unrecognized prior service costs (1) (10) (23) (15) (40) (54)Unrecognized net transition liability at January 1, 1993 4 7 11 4 11 15
The increase in the value of other postretirement benefit planobligation was a primary driver in the increased liability for otherpostretirement benefits at Con Edison and CECONY of $109million and $84 million respectively, compared withDecember 31, 2010. For Con Edison, this increased liabilityresulted in an increase to regulatory assets of $79 million forunrecognized net losses and unrecognized prior service costsassociated with the Utilities consistent with the accounting rulesfor regulated operations and a debit to OCI of $3 million (net oftaxes) for the unrecognized net losses and unrecognized priorservice costs associated with the competitive energy businessesand O&R’s New Jersey and Pennsylvania utility subsidiaries.
For CECONY, the increase in liability resulted in an increase toregulatory assets of $64 million for unrecognized net losses andunrecognized prior service costs associated with the companyconsistent with the accounting rules for regulated operationsand an immaterial change to OCI for unrecognized net lossesand unrecognized prior service costs associated with thecompetitive energy businesses.
A portion of the estimated net loss, prior service costs andtransition obligation for the other postretirement benefits, equalto $97 million, $(6) million and $4 million, respectively, will be
amortized from accumulated OCI and the regulatory asset intonet periodic benefit cost over the next year for Con Edison.Included in these amounts are $86 million, $(8) million and $4million, respectively, for CECONY.
AssumptionsThe actuarial assumptions were as follows:
2011 2010 2009
Weighted-average assumptionsused to determine benefitobligations at December 31:
Discount Rate 4.55% 5.40% 5.95%
Weighted-average assumptionsused to determine net periodicbenefit cost for the years endedDecember 31:
Discount Rate 5.40% 5.95% 5.75%Expected Return on Plan Assets
Tax-Exempt 8.50% 8.50% 8.50%Taxable
CECONY 7.50% 7.50% 7.50%O&R 8.00% 8.00% 8.00%
CON EDISON ANNUAL REPORT 111

CG11
MAC
377
Notes to the Financial Statements — Continued
Refer to Note E for descriptions of the basis for determiningthe expected return on assets, investment policies andstrategies, and the assumed discount rate.
The health care cost trend rate used to determine net periodicbenefit cost for the year ended December 31, 2011 was 6.0percent, which is assumed to decrease gradually to 4.5percent by 2014 and remain at that level thereafter. The healthcare cost trend rate used to determine benefit obligations as ofDecember 31, 2011 was 6.0 percent, which is assumed todecrease gradually to 4.5 percent by 2018 and remain at thatlevel thereafter.
A one-percentage point change in the assumed health carecost trend rate would have the following effects atDecember 31, 2012:
Con Edison CECONY
1-Percentage-Point
(Millions of Dollars) Increase Decrease Increase Decrease
Effect onaccumulated otherpostretirementbenefit obligation $8 $(5) $(25) $22
Effect on servicecost and interestcost componentsfor 2011 1 (1) (1) 1
Expected Benefit PaymentsBased on current assumptions, the Companies expect to make the following benefit payments over the next ten years:
(Millions of Dollars) 2012 2013 2014 2015 2016 2017-2021
GROSS BENEFIT PAYMENTSCon Edison $122 $124 $126 $128 $128 $640CECONY 110 112 113 114 114 559
MEDICARE PRESCRIPTION BENEFIT RECEIPTSCon Edison $ 12 $ 13 $ 14 $ 15 $ 16 $ 94CECONY 11 12 13 14 14 85
Expected ContributionsBased on estimates as of December 31, 2011, Con Edisonexpects to make a contribution of $100 million, including $86million for CECONY, to the other postretirement benefit plans in2012.
Plan AssetsThe asset allocations for CECONY’s other postretirementbenefit plans at the end of 2011, 2010, and 2009, and thetarget allocation for 2012 are as follows:
Target Allocation RangePlan Assets atDecember 31
Asset Category 2012 2011 2010 2009
Equity Securities 57% - 73% 62% 67% 66%Debt Securities 26% - 44% 38% 33% 34%
Total 100% 100% 100% 100%
Con Edison has established postretirement health and lifeinsurance benefit plan trusts for the investment of assets to beused for the exclusive purpose of providing other postretirementbenefits to participants and beneficiaries.
Refer to Note E for a discussion of Con Edison’s investmentpolicy for its benefit plans.
112 CON EDISON ANNUAL REPORT
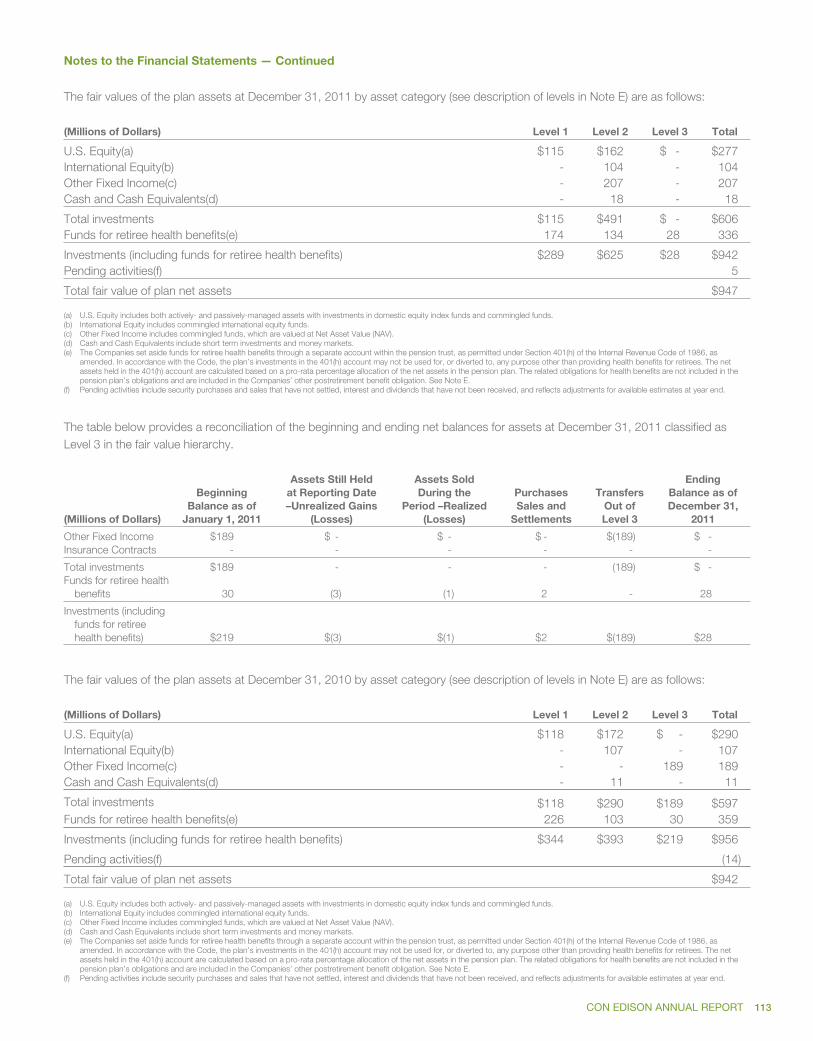
CG11
MAC
377
Notes to the Financial Statements — Continued
The fair values of the plan assets at December 31, 2011 by asset category (see description of levels in Note E) are as follows:
(Millions of Dollars) Level 1 Level 2 Level 3 Total
U.S. Equity(a) $115 $162 $ - $277International Equity(b) - 104 - 104Other Fixed Income(c) - 207 - 207Cash and Cash Equivalents(d) - 18 - 18
Total investments $115 $491 $ - $606Funds for retiree health benefits(e) 174 134 28 336
Investments (including funds for retiree health benefits) $289 $625 $28 $942Pending activities(f) 5
Total fair value of plan net assets $947
(a) U.S. Equity includes both actively- and passively-managed assets with investments in domestic equity index funds and commingled funds.(b) International Equity includes commingled international equity funds.(c) Other Fixed Income includes commingled funds, which are valued at Net Asset Value (NAV).(d) Cash and Cash Equivalents include short term investments and money markets.(e) The Companies set aside funds for retiree health benefits through a separate account within the pension trust, as permitted under Section 401(h) of the Internal Revenue Code of 1986, as
amended. In accordance with the Code, the plan’s investments in the 401(h) account may not be used for, or diverted to, any purpose other than providing health benefits for retirees. The netassets held in the 401(h) account are calculated based on a pro-rata percentage allocation of the net assets in the pension plan. The related obligations for health benefits are not included in thepension plan’s obligations and are included in the Companies’ other postretirement benefit obligation. See Note E.
(f) Pending activities include security purchases and sales that have not settled, interest and dividends that have not been received, and reflects adjustments for available estimates at year end.
The table below provides a reconciliation of the beginning and ending net balances for assets at December 31, 2011 classified asLevel 3 in the fair value hierarchy.
(Millions of Dollars)
BeginningBalance as of
January 1, 2011
Assets Still Heldat Reporting Date–Unrealized Gains
(Losses)
Assets SoldDuring the
Period –Realized(Losses)
PurchasesSales and
Settlements
TransfersOut ofLevel 3
EndingBalance as ofDecember 31,
2011
Other Fixed Income $189 $ - $ - $ - $(189) $ -Insurance Contracts - - - - - -
Total investments $189 - - - (189) $ -Funds for retiree health
benefits 30 (3) (1) 2 - 28
Investments (includingfunds for retireehealth benefits) $219 $(3) $(1) $2 $(189) $28
The fair values of the plan assets at December 31, 2010 by asset category (see description of levels in Note E) are as follows:
(Millions of Dollars) Level 1 Level 2 Level 3 Total
U.S. Equity(a) $118 $172 $ - $290International Equity(b) - 107 - 107Other Fixed Income(c) - - 189 189Cash and Cash Equivalents(d) - 11 - 11
Total investments $118 $290 $189 $597Funds for retiree health benefits(e) 226 103 30 359
Investments (including funds for retiree health benefits) $344 $393 $219 $956
Pending activities(f) (14)
Total fair value of plan net assets $942
(a) U.S. Equity includes both actively- and passively-managed assets with investments in domestic equity index funds and commingled funds.(b) International Equity includes commingled international equity funds.(c) Other Fixed Income includes commingled funds, which are valued at Net Asset Value (NAV).(d) Cash and Cash Equivalents include short term investments and money markets.(e) The Companies set aside funds for retiree health benefits through a separate account within the pension trust, as permitted under Section 401(h) of the Internal Revenue Code of 1986, as
amended. In accordance with the Code, the plan’s investments in the 401(h) account may not be used for, or diverted to, any purpose other than providing health benefits for retirees. The netassets held in the 401(h) account are calculated based on a pro-rata percentage allocation of the net assets in the pension plan. The related obligations for health benefits are not included in thepension plan’s obligations and are included in the Companies’ other postretirement benefit obligation. See Note E.
(f) Pending activities include security purchases and sales that have not settled, interest and dividends that have not been received, and reflects adjustments for available estimates at year end.
CON EDISON ANNUAL REPORT 113
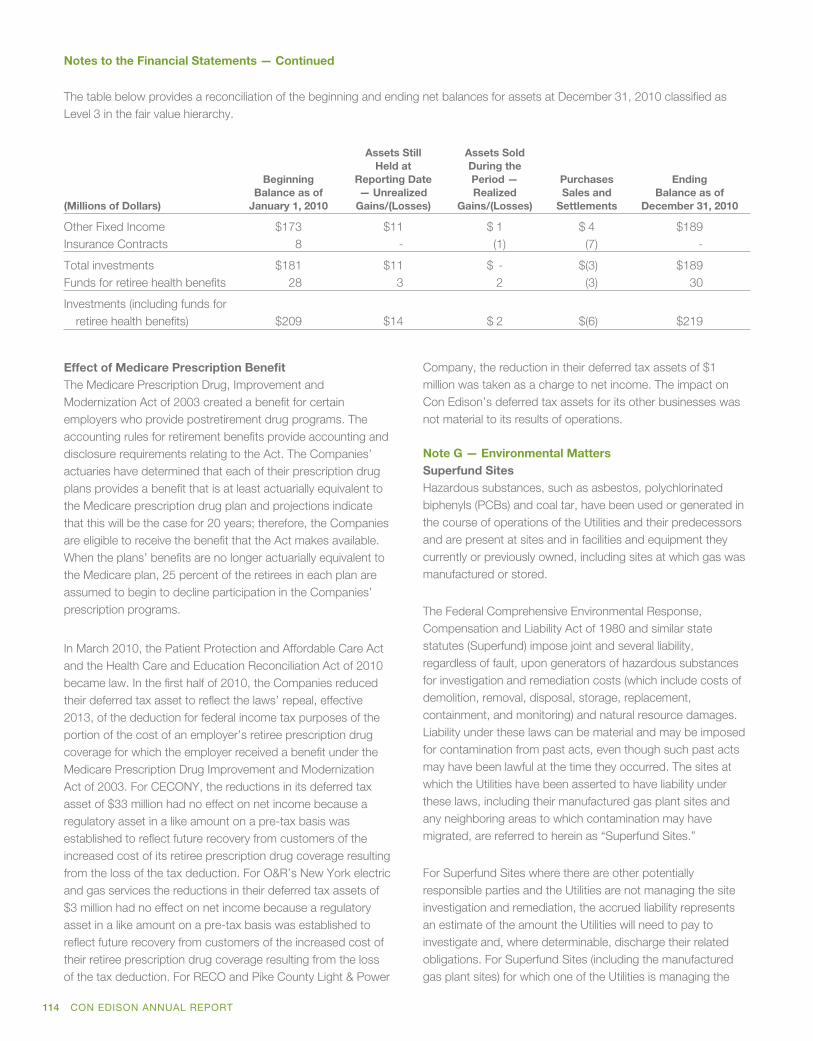
CG11
MAC
377
Notes to the Financial Statements — Continued
The table below provides a reconciliation of the beginning and ending net balances for assets at December 31, 2010 classified asLevel 3 in the fair value hierarchy.
(Millions of Dollars)
BeginningBalance as of
January 1, 2010
Assets StillHeld at
Reporting Date— Unrealized
Gains/(Losses)
Assets SoldDuring thePeriod —Realized
Gains/(Losses)
PurchasesSales and
Settlements
EndingBalance as of
December 31, 2010
Other Fixed Income $173 $11 $ 1 $ 4 $189Insurance Contracts 8 - (1) (7) -
Total investments $181 $11 $ - $(3) $189Funds for retiree health benefits 28 3 2 (3) 30
Investments (including funds forretiree health benefits) $209 $14 $ 2 $(6) $219
Effect of Medicare Prescription BenefitThe Medicare Prescription Drug, Improvement andModernization Act of 2003 created a benefit for certainemployers who provide postretirement drug programs. Theaccounting rules for retirement benefits provide accounting anddisclosure requirements relating to the Act. The Companies’actuaries have determined that each of their prescription drugplans provides a benefit that is at least actuarially equivalent tothe Medicare prescription drug plan and projections indicatethat this will be the case for 20 years; therefore, the Companiesare eligible to receive the benefit that the Act makes available.When the plans’ benefits are no longer actuarially equivalent tothe Medicare plan, 25 percent of the retirees in each plan areassumed to begin to decline participation in the Companies’prescription programs.
In March 2010, the Patient Protection and Affordable Care Actand the Health Care and Education Reconciliation Act of 2010became law. In the first half of 2010, the Companies reducedtheir deferred tax asset to reflect the laws’ repeal, effective2013, of the deduction for federal income tax purposes of theportion of the cost of an employer’s retiree prescription drugcoverage for which the employer received a benefit under theMedicare Prescription Drug Improvement and ModernizationAct of 2003. For CECONY, the reductions in its deferred taxasset of $33 million had no effect on net income because aregulatory asset in a like amount on a pre-tax basis wasestablished to reflect future recovery from customers of theincreased cost of its retiree prescription drug coverage resultingfrom the loss of the tax deduction. For O&R’s New York electricand gas services the reductions in their deferred tax assets of$3 million had no effect on net income because a regulatoryasset in a like amount on a pre-tax basis was established toreflect future recovery from customers of the increased cost oftheir retiree prescription drug coverage resulting from the lossof the tax deduction. For RECO and Pike County Light & Power
Company, the reduction in their deferred tax assets of $1million was taken as a charge to net income. The impact onCon Edison’s deferred tax assets for its other businesses wasnot material to its results of operations.
Note G — Environmental MattersSuperfund SitesHazardous substances, such as asbestos, polychlorinatedbiphenyls (PCBs) and coal tar, have been used or generated inthe course of operations of the Utilities and their predecessorsand are present at sites and in facilities and equipment theycurrently or previously owned, including sites at which gas wasmanufactured or stored.
The Federal Comprehensive Environmental Response,Compensation and Liability Act of 1980 and similar statestatutes (Superfund) impose joint and several liability,regardless of fault, upon generators of hazardous substancesfor investigation and remediation costs (which include costs ofdemolition, removal, disposal, storage, replacement,containment, and monitoring) and natural resource damages.Liability under these laws can be material and may be imposedfor contamination from past acts, even though such past actsmay have been lawful at the time they occurred. The sites atwhich the Utilities have been asserted to have liability underthese laws, including their manufactured gas plant sites andany neighboring areas to which contamination may havemigrated, are referred to herein as “Superfund Sites.”
For Superfund Sites where there are other potentiallyresponsible parties and the Utilities are not managing the siteinvestigation and remediation, the accrued liability representsan estimate of the amount the Utilities will need to pay toinvestigate and, where determinable, discharge their relatedobligations. For Superfund Sites (including the manufacturedgas plant sites) for which one of the Utilities is managing the
114 CON EDISON ANNUAL REPORT
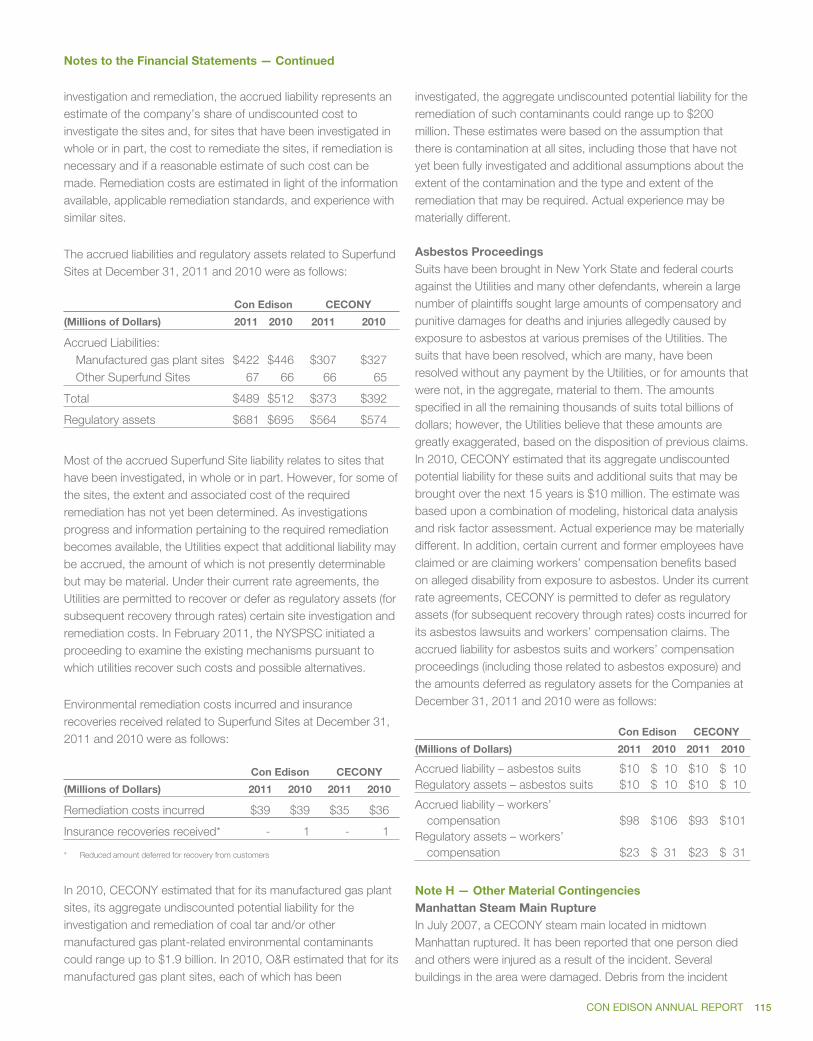
CG11
MAC
377
Notes to the Financial Statements — Continued
investigation and remediation, the accrued liability represents anestimate of the company’s share of undiscounted cost toinvestigate the sites and, for sites that have been investigated inwhole or in part, the cost to remediate the sites, if remediation isnecessary and if a reasonable estimate of such cost can bemade. Remediation costs are estimated in light of the informationavailable, applicable remediation standards, and experience withsimilar sites.
The accrued liabilities and regulatory assets related to SuperfundSites at December 31, 2011 and 2010 were as follows:
Con Edison CECONY
(Millions of Dollars) 2011 2010 2011 2010
Accrued Liabilities:Manufactured gas plant sites $422 $446 $307 $327Other Superfund Sites 67 66 66 65
Total $489 $512 $373 $392
Regulatory assets $681 $695 $564 $574
Most of the accrued Superfund Site liability relates to sites thathave been investigated, in whole or in part. However, for some ofthe sites, the extent and associated cost of the requiredremediation has not yet been determined. As investigationsprogress and information pertaining to the required remediationbecomes available, the Utilities expect that additional liability maybe accrued, the amount of which is not presently determinablebut may be material. Under their current rate agreements, theUtilities are permitted to recover or defer as regulatory assets (forsubsequent recovery through rates) certain site investigation andremediation costs. In February 2011, the NYSPSC initiated aproceeding to examine the existing mechanisms pursuant towhich utilities recover such costs and possible alternatives.
Environmental remediation costs incurred and insurancerecoveries received related to Superfund Sites at December 31,2011 and 2010 were as follows:
Con Edison CECONY
(Millions of Dollars) 2011 2010 2011 2010
Remediation costs incurred $39 $39 $35 $36
Insurance recoveries received* - 1 - 1
* Reduced amount deferred for recovery from customers
In 2010, CECONY estimated that for its manufactured gas plantsites, its aggregate undiscounted potential liability for theinvestigation and remediation of coal tar and/or othermanufactured gas plant-related environmental contaminantscould range up to $1.9 billion. In 2010, O&R estimated that for itsmanufactured gas plant sites, each of which has been
investigated, the aggregate undiscounted potential liability for theremediation of such contaminants could range up to $200million. These estimates were based on the assumption thatthere is contamination at all sites, including those that have notyet been fully investigated and additional assumptions about theextent of the contamination and the type and extent of theremediation that may be required. Actual experience may bematerially different.
Asbestos ProceedingsSuits have been brought in New York State and federal courtsagainst the Utilities and many other defendants, wherein a largenumber of plaintiffs sought large amounts of compensatory andpunitive damages for deaths and injuries allegedly caused byexposure to asbestos at various premises of the Utilities. Thesuits that have been resolved, which are many, have beenresolved without any payment by the Utilities, or for amounts thatwere not, in the aggregate, material to them. The amountsspecified in all the remaining thousands of suits total billions ofdollars; however, the Utilities believe that these amounts aregreatly exaggerated, based on the disposition of previous claims.In 2010, CECONY estimated that its aggregate undiscountedpotential liability for these suits and additional suits that may bebrought over the next 15 years is $10 million. The estimate wasbased upon a combination of modeling, historical data analysisand risk factor assessment. Actual experience may be materiallydifferent. In addition, certain current and former employees haveclaimed or are claiming workers’ compensation benefits basedon alleged disability from exposure to asbestos. Under its currentrate agreements, CECONY is permitted to defer as regulatoryassets (for subsequent recovery through rates) costs incurred forits asbestos lawsuits and workers’ compensation claims. Theaccrued liability for asbestos suits and workers’ compensationproceedings (including those related to asbestos exposure) andthe amounts deferred as regulatory assets for the Companies atDecember 31, 2011 and 2010 were as follows:
Con Edison CECONY
(Millions of Dollars) 2011 2010 2011 2010
Accrued liability – asbestos suits $10 $ 10 $10 $ 10Regulatory assets – asbestos suits $10 $ 10 $10 $ 10
Accrued liability – workers’compensation $98 $106 $93 $101
Regulatory assets – workers’compensation $23 $ 31 $23 $ 31
Note H — Other Material ContingenciesManhattan Steam Main RuptureIn July 2007, a CECONY steam main located in midtownManhattan ruptured. It has been reported that one person diedand others were injured as a result of the incident. Severalbuildings in the area were damaged. Debris from the incident
CON EDISON ANNUAL REPORT 115

CG11
MAC
377
Notes to the Financial Statements — Continued
included dirt and mud containing asbestos. The response to theincident required the closing of several buildings and streets forvarious periods. Approximately 93 suits are pending against thecompany seeking generally unspecified compensatory and, insome cases, punitive damages, for personal injury, propertydamage and business interruption. The company has notaccrued a liability for the suits. The company has notified itsinsurers of the incident and believes that the policies in force atthe time of the incident will cover most of the company’s costs,which the company is unable to estimate, but which could besubstantial, to satisfy its liability to others in connection with theincident.
Investigations of Vendor PaymentsIn January 2009, CECONY commenced an internal investigationrelating to the arrests of certain employees and retiredemployees (all of whom have since been convicted) for acceptingkickbacks from contractors that performed construction work forthe company. The company has retained a law firm, which hasretained an accounting firm, to assist in the company’sinvestigation. The company has provided information togovernmental authorities, which consider the company to be avictim of unlawful conduct, in connection with their investigationof the arrested employees and contractors. The company hasterminated its employment of the arrested employees and itscontracts with the contractors. In February 2009, the NYSPSCcommenced a proceeding that, among other things, will examinethe prudence of certain of the company’s expenditures relatingto the arrests and consider whether additional expendituresshould also be examined (see “Other Regulatory Matters” in NoteB).
CECONY is also investigating the September 2010 arrest of aretired employee (who has since been convicted of participatingin a bribery scheme in which the employee received paymentsfrom two companies that supplied materials to the company) andthe January 2011 arrest of an employee (for accepting kickbacksfrom an engineering firm that performed work for the company).CECONY has provided information to governmental authorities inconnection with their ongoing investigations of these matters.
The company, based upon its evaluation of its internal controlsfor 2011 and previous years, believes that the controls wereeffective to provide reasonable assurance that its financialstatements have been fairly presented, in all material respects, inconformity with generally accepted accounting principles.Because the company’s investigations are ongoing, thecompany is unable to predict the impact of any of theemployees’ unlawful conduct on the company’s internal controls,business, results of operations or financial position.
Other ContingenciesSee “Lease In/Lease Out Transactions” in Note J.
GuaranteesCon Edison and its subsidiaries enter into various agreementsproviding financial or performance assurance primarily to thirdparties on behalf of their subsidiaries. Maximum amountsguaranteed by Con Edison totaled $760 million and $859 millionat December 31, 2011 and 2010, respectively.
A summary, by type and term, of Con Edison’s total guaranteesat December 31, 2011 is as follows:
Guarantee Type0 – 3years
4 – 10years
> 10years Total
(Millions of Dollars)
Energy transactions $640 $ 3 $63 $706Intra-company guarantees 15 - 1 16Other guarantees 25 13 - 38
TOTAL $680 $16 $64 $760
Energy Transactions — Con Edison guarantees payments onbehalf of its competitive energy businesses in order to facilitatephysical and financial transactions in gas, pipeline capacity,transportation, oil, electricity and energy services. To the extentthat liabilities exist under the contracts subject to theseguarantees, such liabilities are included in Con Edison’sconsolidated balance sheet.
Intra-company Guarantees — Con Edison guaranteeselectricity sales made by Con Edison Energy and Con EdisonSolutions to O&R and CECONY.
Other Guarantees — Con Edison also guarantees the following:
• $13 million relates to guarantees issued by Con Edisonto CECONY covering a former Con Edison subsidiary’slease payment to use CECONY’s conduit system inaccordance with a tariff approved by the NYSPSC anda guarantee issued by Con Edison to a landlord toguarantee the former subsidiary’s obligations under abuilding lease. The former subsidiary is obligated toreimburse Con Edison for any payments made underthese guarantees. This obligation is fully secured byletters of credit;
• $25 million for guarantees provided by Con Edison toTravelers Insurance Company for indemnity agreementsfor surety bonds in connection with energy serviceprojects performed by Con Edison Solutions; and
116 CON EDISON ANNUAL REPORT

CG11
MAC
377
Notes to the Financial Statements — Continued
• Con Edison, on behalf of Con Edison Solutions, as aretail electric provider, issued a guarantee to thePublic Utility Commission of Texas with no specifiedlimitation on the amount guaranteed, covering the
payment of all obligations of a retail electric provider.Con Edison’s estimate of the maximum potentialobligation is $5 million as of December 31, 2011.
Note I — Electricity Purchase AgreementsCECONY has long-term electricity purchase agreements with non-utility generators and others for generating capacity. The companyrecovers its purchased power costs in accordance with provisions approved by the NYSPSC. See “Recoverable Energy Costs” inNote A.
At December 31, 2011, the significant terms of the electricity purchase agreements were as follows:
Facility Equity Owner
PlantOutput(MW)
ContractedOutput(MW)
ContractStartDate
ContractTerm
(Years)
Indian Point Entergy Nuclear Power Marketing, LLC 1,299 350* August 2001 16Independence Sithe/Independence Power Partners, LP 1,254 691 November 1994 20Linden Cogeneration Cogen Technologies Linden Venture, LP 1,035 624 May 1992 25Astoria Energy Astoria Energy, LLC 640 500 May 2006 10Selkirk Selkirk Cogen Partners, LP 446 265 September 1994 20Brooklyn Navy Yard Brooklyn Navy Yard Cogeneration Partners, LP 322 274 November 1996 40Indeck Corinth Indeck Energy Services of Corinth, Inc. 147 131 July 1995 20
* Contracted output will increase to 500 MW in 2013.
Assuming performance by the parties to the electricitypurchase agreements, CECONY is obligated over the terms ofthe agreements to make capacity and other fixed payments.
For the years 2012 through 2016, the capacity and other fixedpayments under the contracts are estimated to be as follows:
(Millions of Dollars) 2012 2013 2014 2015 2016
CECONY $492 $491 $433 $221 $158
For energy delivered under most of the electricity purchaseagreements, CECONY is obligated to pay variable prices. Thecompany’s payments under the agreements for capacity,energy and other fixed payments in 2011, 2010, and 2009were as follows:
For the Years EndedDecember 31,
(Millions of Dollars) 2011 2010 2009
Linden Cogeneration $ 379 $ 414 $ 395Indian Point 238 524 620Astoria Energy 225 223 192Selkirk 209 185 175Brooklyn Navy Yard 123 123 124Independence 121 119 122Indeck Corinth 77 68 68Wheelabrator - - 10
Total $1,372 $1,656 $1,706
Note J — LeasesCon Edison’s subsidiaries lease electric generating and gasdistribution facilities, other electric transmission and distributionfacilities, office buildings and equipment. In accordance withthe accounting rules for leases, these leases are classified aseither capital leases, operating leases or leveraged leases. Mostof the operating leases provide the option to renew at the fairrental value for future periods. Generally, it is expected thatleases will be renewed or replaced in the normal course ofbusiness.
CON EDISON ANNUAL REPORT 117
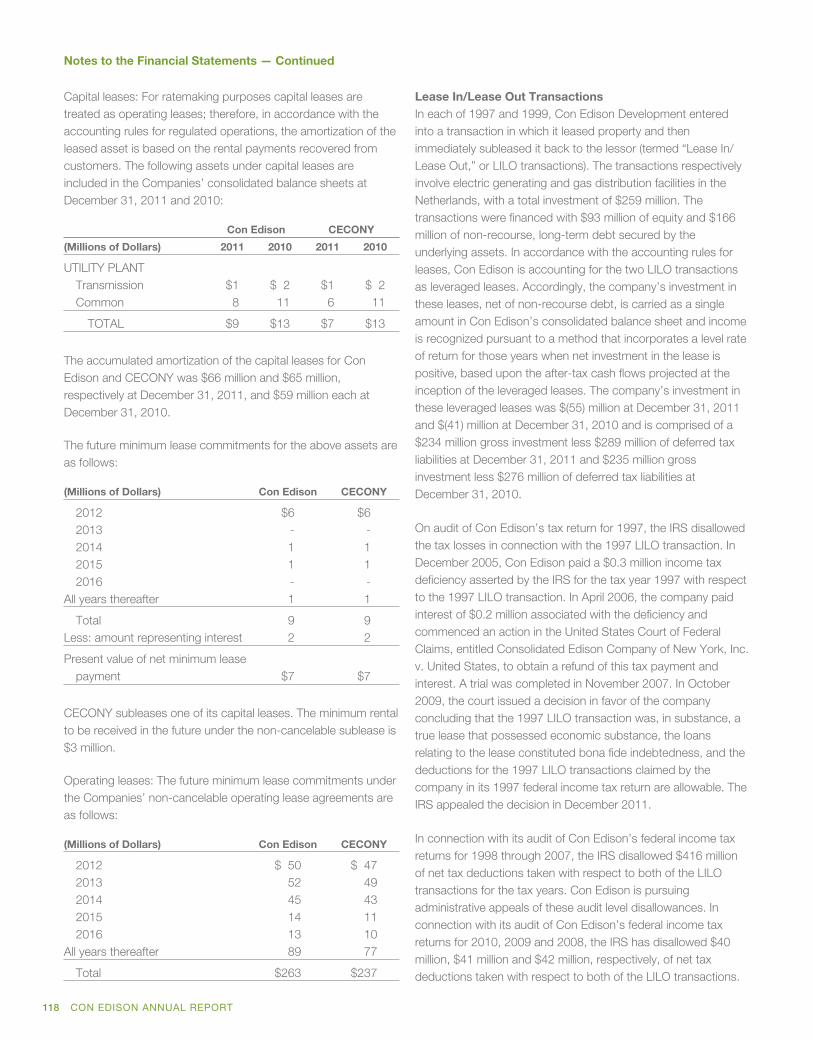
CG11
MAC
377
Notes to the Financial Statements — Continued
Capital leases: For ratemaking purposes capital leases aretreated as operating leases; therefore, in accordance with theaccounting rules for regulated operations, the amortization of theleased asset is based on the rental payments recovered fromcustomers. The following assets under capital leases areincluded in the Companies’ consolidated balance sheets atDecember 31, 2011 and 2010:
Con Edison CECONY
(Millions of Dollars) 2011 2010 2011 2010
UTILITY PLANTTransmission $1 $ 2 $1 $ 2Common 8 11 6 11
TOTAL $9 $13 $7 $13
The accumulated amortization of the capital leases for ConEdison and CECONY was $66 million and $65 million,respectively at December 31, 2011, and $59 million each atDecember 31, 2010.
The future minimum lease commitments for the above assets areas follows:
(Millions of Dollars) Con Edison CECONY
2012 $6 $62013 - -2014 1 12015 1 12016 - -
All years thereafter 1 1
Total 9 9Less: amount representing interest 2 2
Present value of net minimum leasepayment $7 $7
CECONY subleases one of its capital leases. The minimum rentalto be received in the future under the non-cancelable sublease is$3 million.
Operating leases: The future minimum lease commitments underthe Companies’ non-cancelable operating lease agreements areas follows:
(Millions of Dollars) Con Edison CECONY
2012 $ 50 $ 472013 52 492014 45 432015 14 112016 13 10
All years thereafter 89 77
Total $263 $237
Lease In/Lease Out TransactionsIn each of 1997 and 1999, Con Edison Development enteredinto a transaction in which it leased property and thenimmediately subleased it back to the lessor (termed “Lease In/Lease Out,” or LILO transactions). The transactions respectivelyinvolve electric generating and gas distribution facilities in theNetherlands, with a total investment of $259 million. Thetransactions were financed with $93 million of equity and $166million of non-recourse, long-term debt secured by theunderlying assets. In accordance with the accounting rules forleases, Con Edison is accounting for the two LILO transactionsas leveraged leases. Accordingly, the company’s investment inthese leases, net of non-recourse debt, is carried as a singleamount in Con Edison’s consolidated balance sheet and incomeis recognized pursuant to a method that incorporates a level rateof return for those years when net investment in the lease ispositive, based upon the after-tax cash flows projected at theinception of the leveraged leases. The company’s investment inthese leveraged leases was $(55) million at December 31, 2011and $(41) million at December 31, 2010 and is comprised of a$234 million gross investment less $289 million of deferred taxliabilities at December 31, 2011 and $235 million grossinvestment less $276 million of deferred tax liabilities atDecember 31, 2010.
On audit of Con Edison’s tax return for 1997, the IRS disallowedthe tax losses in connection with the 1997 LILO transaction. InDecember 2005, Con Edison paid a $0.3 million income taxdeficiency asserted by the IRS for the tax year 1997 with respectto the 1997 LILO transaction. In April 2006, the company paidinterest of $0.2 million associated with the deficiency andcommenced an action in the United States Court of FederalClaims, entitled Consolidated Edison Company of New York, Inc.v. United States, to obtain a refund of this tax payment andinterest. A trial was completed in November 2007. In October2009, the court issued a decision in favor of the companyconcluding that the 1997 LILO transaction was, in substance, atrue lease that possessed economic substance, the loansrelating to the lease constituted bona fide indebtedness, and thedeductions for the 1997 LILO transactions claimed by thecompany in its 1997 federal income tax return are allowable. TheIRS appealed the decision in December 2011.
In connection with its audit of Con Edison’s federal income taxreturns for 1998 through 2007, the IRS disallowed $416 millionof net tax deductions taken with respect to both of the LILOtransactions for the tax years. Con Edison is pursuingadministrative appeals of these audit level disallowances. Inconnection with its audit of Con Edison’s federal income taxreturns for 2010, 2009 and 2008, the IRS has disallowed $40million, $41 million and $42 million, respectively, of net taxdeductions taken with respect to both of the LILO transactions.
118 CON EDISON ANNUAL REPORT
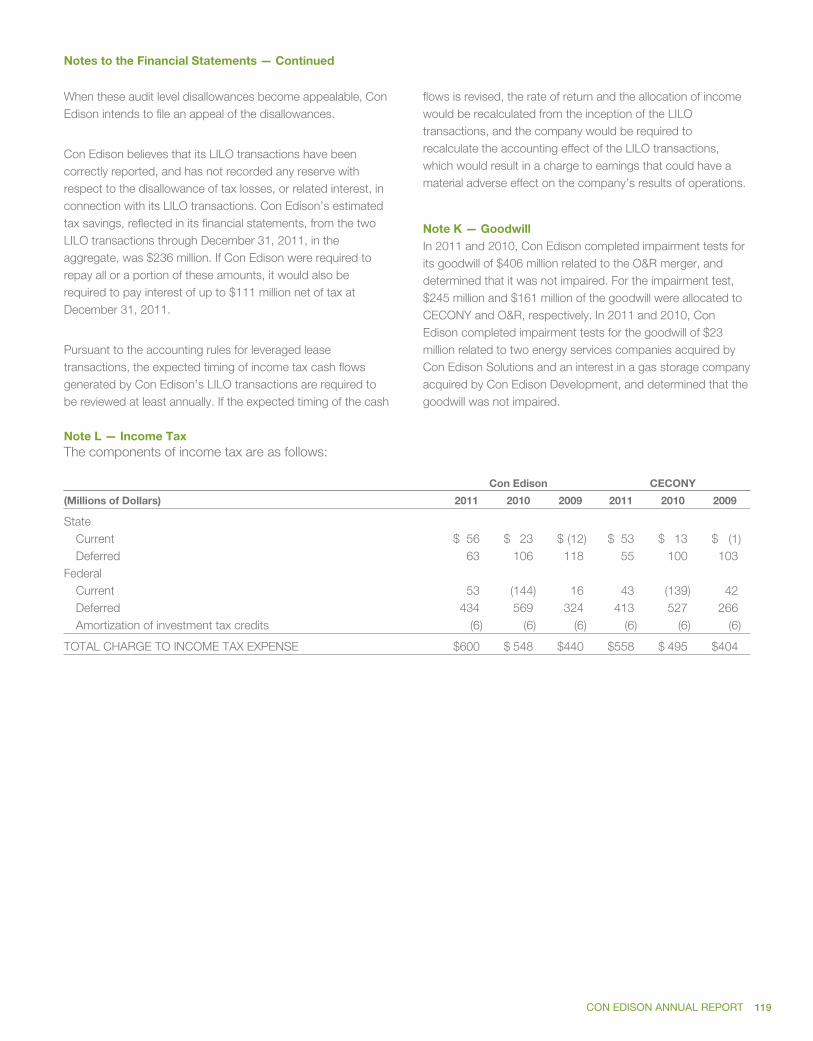
CG11
MAC
377
Notes to the Financial Statements — Continued
When these audit level disallowances become appealable, ConEdison intends to file an appeal of the disallowances.
Con Edison believes that its LILO transactions have beencorrectly reported, and has not recorded any reserve withrespect to the disallowance of tax losses, or related interest, inconnection with its LILO transactions. Con Edison’s estimatedtax savings, reflected in its financial statements, from the twoLILO transactions through December 31, 2011, in theaggregate, was $236 million. If Con Edison were required torepay all or a portion of these amounts, it would also berequired to pay interest of up to $111 million net of tax atDecember 31, 2011.
Pursuant to the accounting rules for leveraged leasetransactions, the expected timing of income tax cash flowsgenerated by Con Edison’s LILO transactions are required tobe reviewed at least annually. If the expected timing of the cash
flows is revised, the rate of return and the allocation of incomewould be recalculated from the inception of the LILOtransactions, and the company would be required torecalculate the accounting effect of the LILO transactions,which would result in a charge to earnings that could have amaterial adverse effect on the company’s results of operations.
Note K — GoodwillIn 2011 and 2010, Con Edison completed impairment tests forits goodwill of $406 million related to the O&R merger, anddetermined that it was not impaired. For the impairment test,$245 million and $161 million of the goodwill were allocated toCECONY and O&R, respectively. In 2011 and 2010, ConEdison completed impairment tests for the goodwill of $23million related to two energy services companies acquired byCon Edison Solutions and an interest in a gas storage companyacquired by Con Edison Development, and determined that thegoodwill was not impaired.
Note L — Income TaxThe components of income tax are as follows:
Con Edison CECONY
(Millions of Dollars) 2011 2010 2009 2011 2010 2009
StateCurrent $ 56 $ 23 $ (12) $ 53 $ 13 $ (1)Deferred 63 106 118 55 100 103
FederalCurrent 53 (144) 16 43 (139) 42Deferred 434 569 324 413 527 266Amortization of investment tax credits (6) (6) (6) (6) (6) (6)
TOTAL CHARGE TO INCOME TAX EXPENSE $600 $ 548 $440 $558 $ 495 $404
CON EDISON ANNUAL REPORT 119
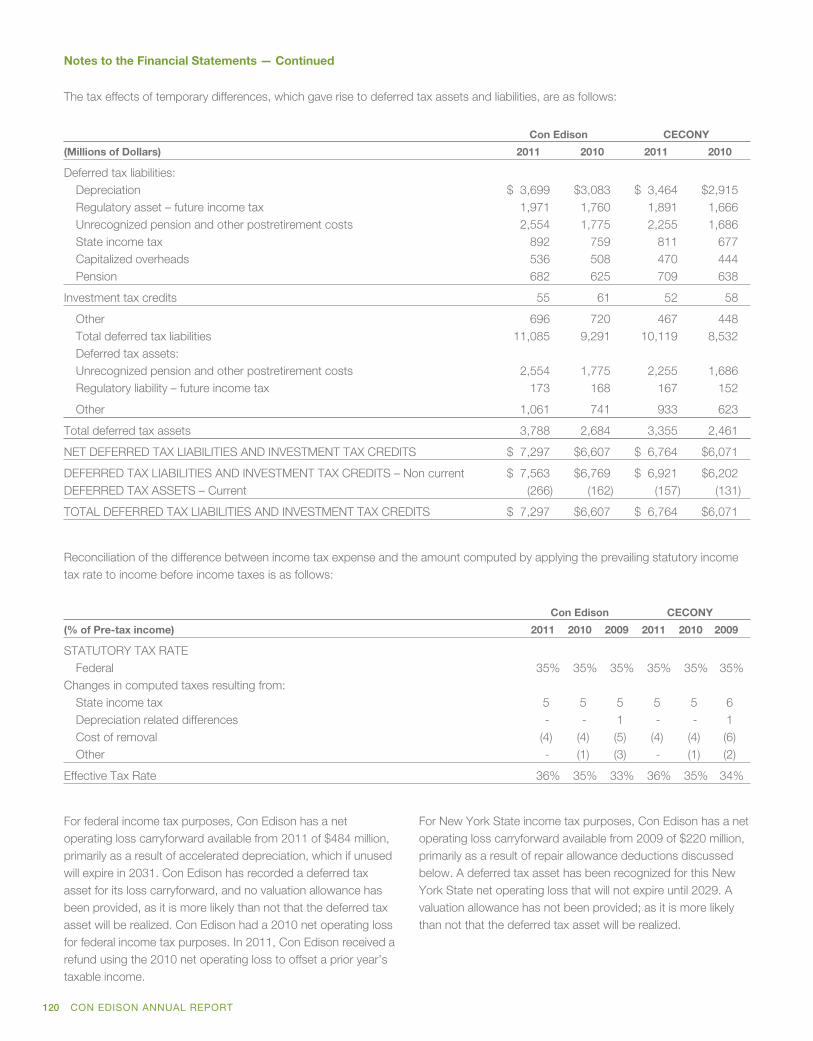
CG11
MAC
377
Notes to the Financial Statements — Continued
The tax effects of temporary differences, which gave rise to deferred tax assets and liabilities, are as follows:
Con Edison CECONY
(Millions of Dollars) 2011 2010 2011 2010
Deferred tax liabilities:Depreciation $ 3,699 $3,083 $ 3,464 $2,915Regulatory asset – future income tax 1,971 1,760 1,891 1,666Unrecognized pension and other postretirement costs 2,554 1,775 2,255 1,686State income tax 892 759 811 677Capitalized overheads 536 508 470 444Pension 682 625 709 638
Investment tax credits 55 61 52 58
Other 696 720 467 448Total deferred tax liabilities 11,085 9,291 10,119 8,532Deferred tax assets:Unrecognized pension and other postretirement costs 2,554 1,775 2,255 1,686Regulatory liability – future income tax 173 168 167 152
Other 1,061 741 933 623
Total deferred tax assets 3,788 2,684 3,355 2,461
NET DEFERRED TAX LIABILITIES AND INVESTMENT TAX CREDITS $ 7,297 $6,607 $ 6,764 $6,071
DEFERRED TAX LIABILITIES AND INVESTMENT TAX CREDITS – Non current $ 7,563 $6,769 $ 6,921 $6,202DEFERRED TAX ASSETS – Current (266) (162) (157) (131)
TOTAL DEFERRED TAX LIABILITIES AND INVESTMENT TAX CREDITS $ 7,297 $6,607 $ 6,764 $6,071
Reconciliation of the difference between income tax expense and the amount computed by applying the prevailing statutory incometax rate to income before income taxes is as follows:
Con Edison CECONY
(% of Pre-tax income) 2011 2010 2009 2011 2010 2009
STATUTORY TAX RATEFederal 35% 35% 35% 35% 35% 35%
Changes in computed taxes resulting from:State income tax 5 5 5 5 5 6Depreciation related differences - - 1 - - 1Cost of removal (4) (4) (5) (4) (4) (6)Other - (1) (3) - (1) (2)
Effective Tax Rate 36% 35% 33% 36% 35% 34%
For federal income tax purposes, Con Edison has a netoperating loss carryforward available from 2011 of $484 million,primarily as a result of accelerated depreciation, which if unusedwill expire in 2031. Con Edison has recorded a deferred taxasset for its loss carryforward, and no valuation allowance hasbeen provided, as it is more likely than not that the deferred taxasset will be realized. Con Edison had a 2010 net operating lossfor federal income tax purposes. In 2011, Con Edison received arefund using the 2010 net operating loss to offset a prior year’staxable income.
For New York State income tax purposes, Con Edison has a netoperating loss carryforward available from 2009 of $220 million,primarily as a result of repair allowance deductions discussedbelow. A deferred tax asset has been recognized for this NewYork State net operating loss that will not expire until 2029. Avaluation allowance has not been provided; as it is more likelythan not that the deferred tax asset will be realized.
120 CON EDISON ANNUAL REPORT
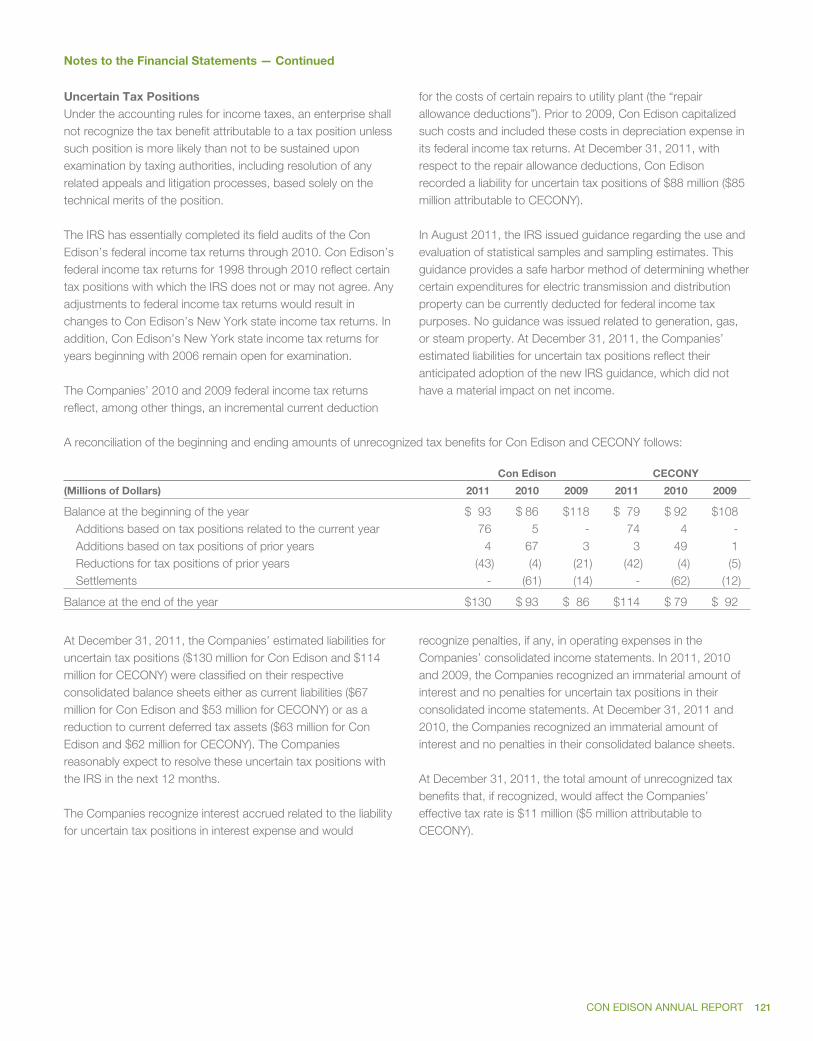
CG11
MAC
377
Notes to the Financial Statements — Continued
Uncertain Tax PositionsUnder the accounting rules for income taxes, an enterprise shallnot recognize the tax benefit attributable to a tax position unlesssuch position is more likely than not to be sustained uponexamination by taxing authorities, including resolution of anyrelated appeals and litigation processes, based solely on thetechnical merits of the position.
The IRS has essentially completed its field audits of the ConEdison’s federal income tax returns through 2010. Con Edison’sfederal income tax returns for 1998 through 2010 reflect certaintax positions with which the IRS does not or may not agree. Anyadjustments to federal income tax returns would result inchanges to Con Edison’s New York state income tax returns. Inaddition, Con Edison’s New York state income tax returns foryears beginning with 2006 remain open for examination.
The Companies’ 2010 and 2009 federal income tax returnsreflect, among other things, an incremental current deduction
for the costs of certain repairs to utility plant (the “repairallowance deductions”). Prior to 2009, Con Edison capitalizedsuch costs and included these costs in depreciation expense inits federal income tax returns. At December 31, 2011, withrespect to the repair allowance deductions, Con Edisonrecorded a liability for uncertain tax positions of $88 million ($85million attributable to CECONY).
In August 2011, the IRS issued guidance regarding the use andevaluation of statistical samples and sampling estimates. Thisguidance provides a safe harbor method of determining whethercertain expenditures for electric transmission and distributionproperty can be currently deducted for federal income taxpurposes. No guidance was issued related to generation, gas,or steam property. At December 31, 2011, the Companies’estimated liabilities for uncertain tax positions reflect theiranticipated adoption of the new IRS guidance, which did nothave a material impact on net income.
A reconciliation of the beginning and ending amounts of unrecognized tax benefits for Con Edison and CECONY follows:
Con Edison CECONY
(Millions of Dollars) 2011 2010 2009 2011 2010 2009
Balance at the beginning of the year $ 93 $ 86 $118 $ 79 $ 92 $108Additions based on tax positions related to the current year 76 5 - 74 4 -Additions based on tax positions of prior years 4 67 3 3 49 1Reductions for tax positions of prior years (43) (4) (21) (42) (4) (5)Settlements - (61) (14) - (62) (12)
Balance at the end of the year $130 $ 93 $ 86 $114 $ 79 $ 92
At December 31, 2011, the Companies’ estimated liabilities foruncertain tax positions ($130 million for Con Edison and $114million for CECONY) were classified on their respectiveconsolidated balance sheets either as current liabilities ($67million for Con Edison and $53 million for CECONY) or as areduction to current deferred tax assets ($63 million for ConEdison and $62 million for CECONY). The Companiesreasonably expect to resolve these uncertain tax positions withthe IRS in the next 12 months.
The Companies recognize interest accrued related to the liabilityfor uncertain tax positions in interest expense and would
recognize penalties, if any, in operating expenses in theCompanies’ consolidated income statements. In 2011, 2010and 2009, the Companies recognized an immaterial amount ofinterest and no penalties for uncertain tax positions in theirconsolidated income statements. At December 31, 2011 and2010, the Companies recognized an immaterial amount ofinterest and no penalties in their consolidated balance sheets.
At December 31, 2011, the total amount of unrecognized taxbenefits that, if recognized, would affect the Companies’effective tax rate is $11 million ($5 million attributable toCECONY).
CON EDISON ANNUAL REPORT 121

CG11
MAC
377
Notes to the Financial Statements — Continued
Note M — Stock-Based CompensationThe Companies may compensate employees and directorswith, among other things, stock options, restricted stock unitsand contributions to a discount stock purchase plan. The StockOption Plan provided for awards of stock options to officersand employees for up to 10 million shares of Con Edisoncommon stock. The Long Term Incentive Plan (LTIP), amongother things, provides for awards of restricted stock units,stock options and, to Con Edison’s non-officer directors,deferred stock units for up to 10 million shares of commonstock (of which not more than four million shares may berestricted stock or stock units).
Shares of Con Edison common stock used to satisfy theCompanies’ obligations with respect to stock-basedcompensation may be new (authorized, but unissued) shares,treasury shares or shares purchased in the open market. Theshares used during the period ended December 31, 2011 weretreasury shares and new shares. The shares used during theperiod ended December 31, 2010 were new shares.
Under the accounting rules for stock compensation, theCompanies have recognized the cost of stock-basedcompensation as an expense using a fair value measurementmethod. The following table summarizes stock-basedcompensation expense recognized by the Companies in theperiod ended December 31, 2011, 2010, and 2009:
Con Edison CECONY
(Millions of Dollars) 2011 2010 2009 2011 2010 2009
Restricted stock units $ 3 $ 1 $ 1 $ 3 $ 1 $ 1Performance-based restricted stock 48 27 20 44 25 19Non-officer director deferred stock compensation 1 1 1 1 1 1
Total $52 $29 $22 $48 $27 $21
Income Tax Benefit $21 $12 $ 9 $20 $11 $ 9
Stock Options
The Companies last issued stock options in 2006. The stockoptions generally vested over a three-year period and have aterm of ten years. Options were granted at an exercise priceequal to the fair market value of a common share when theoption was granted. The Companies generally recognizedcompensation expense (based on the fair value of stock optionawards) over the continuous service period in which the optionsvested. Awards to employees eligible for retirement wereexpensed in the month awarded.
The outstanding options are “equity awards” because shares ofCon Edison common stock are delivered upon exercise of theoptions. As equity awards, the fair value of the options ismeasured at the grant date. There were no options granted in2011 and 2010.
A summary of changes in the status of stock options awardedas of December 31, 2011 is as follows:
Con Edison CECONY
Shares
WeightedAverageExercise
Price Shares
WeightedAverageExercise
Price
Outstanding at12/31/10 2,935,250 $43.588 2,406,700 $43.652Exercised (1,999,975) 43.844 (1,656,575) 43.924Forfeited (8,250) 42.253 (9,250) 41.766
Outstanding at12/31/11 927,025 $43.046 740,875 $43.066
The changes in the fair value of all outstanding options fromtheir grant dates to December 31, 2011 and 2010 (aggregateintrinsic value) for Con Edison were $18 million. The changes inthe fair value of all outstanding options from their grant dates toDecember 31, 2011 and 2010 (aggregate intrinsic value) forCECONY were $14 million. The aggregate intrinsic value ofoptions exercised in 2011 and 2010 were $21 million and $15million, respectively, and the cash received by Con Edison forpayment of the exercise price was $88 million and $100 million,respectively. The weighted average remaining contractual life ofoptions outstanding is three years as of December 31, 2011.
122 CON EDISON ANNUAL REPORT
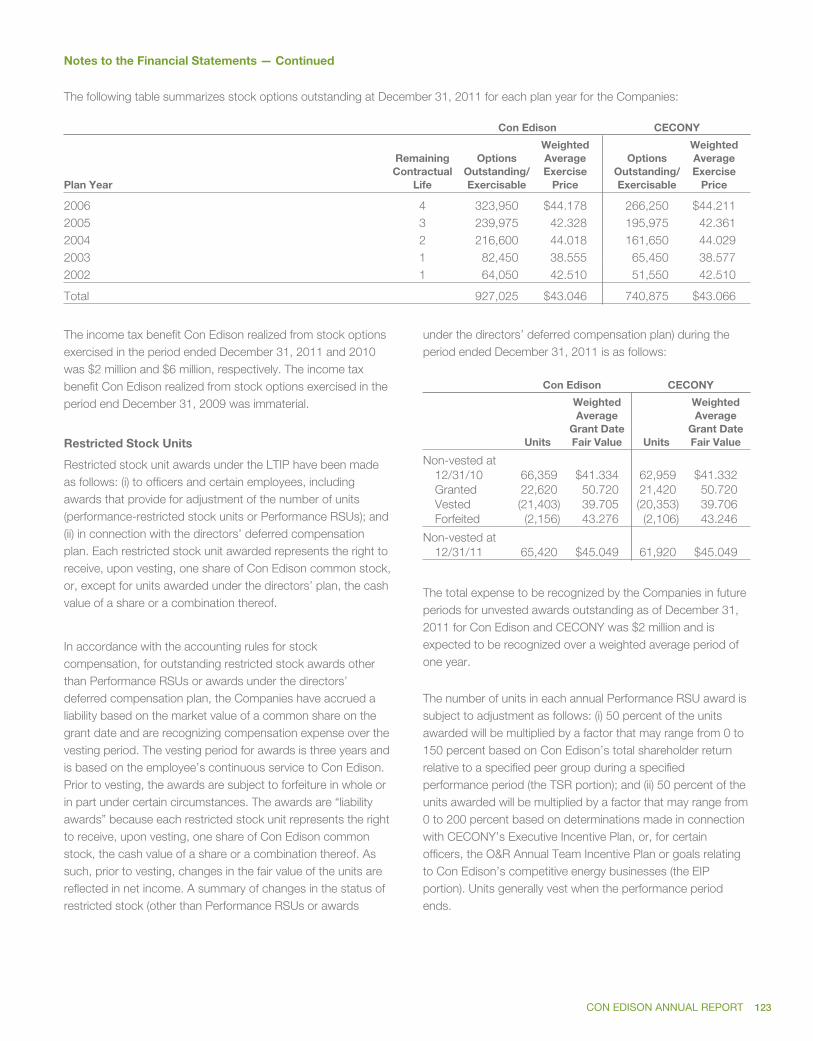
CG11
MAC
377
Notes to the Financial Statements — Continued
The following table summarizes stock options outstanding at December 31, 2011 for each plan year for the Companies:
Con Edison CECONY
Plan Year
RemainingContractual
Life
OptionsOutstanding/Exercisable
WeightedAverageExercise
Price
OptionsOutstanding/Exercisable
WeightedAverageExercise
Price
2006 4 323,950 $44.178 266,250 $44.2112005 3 239,975 42.328 195,975 42.3612004 2 216,600 44.018 161,650 44.0292003 1 82,450 38.555 65,450 38.5772002 1 64,050 42.510 51,550 42.510
Total 927,025 $43.046 740,875 $43.066
The income tax benefit Con Edison realized from stock optionsexercised in the period ended December 31, 2011 and 2010was $2 million and $6 million, respectively. The income taxbenefit Con Edison realized from stock options exercised in theperiod end December 31, 2009 was immaterial.
Restricted Stock Units
Restricted stock unit awards under the LTIP have been madeas follows: (i) to officers and certain employees, includingawards that provide for adjustment of the number of units(performance-restricted stock units or Performance RSUs); and(ii) in connection with the directors’ deferred compensationplan. Each restricted stock unit awarded represents the right toreceive, upon vesting, one share of Con Edison common stock,or, except for units awarded under the directors’ plan, the cashvalue of a share or a combination thereof.
In accordance with the accounting rules for stockcompensation, for outstanding restricted stock awards otherthan Performance RSUs or awards under the directors’deferred compensation plan, the Companies have accrued aliability based on the market value of a common share on thegrant date and are recognizing compensation expense over thevesting period. The vesting period for awards is three years andis based on the employee’s continuous service to Con Edison.Prior to vesting, the awards are subject to forfeiture in whole orin part under certain circumstances. The awards are “liabilityawards” because each restricted stock unit represents the rightto receive, upon vesting, one share of Con Edison commonstock, the cash value of a share or a combination thereof. Assuch, prior to vesting, changes in the fair value of the units arereflected in net income. A summary of changes in the status ofrestricted stock (other than Performance RSUs or awards
under the directors’ deferred compensation plan) during theperiod ended December 31, 2011 is as follows:
Con Edison CECONY
Units
WeightedAverage
Grant DateFair Value Units
WeightedAverage
Grant DateFair Value
Non-vested at12/31/10 66,359 $41.334 62,959 $41.332Granted 22,620 50.720 21,420 50.720Vested (21,403) 39.705 (20,353) 39.706Forfeited (2,156) 43.276 (2,106) 43.246
Non-vested at12/31/11 65,420 $45.049 61,920 $45.049
The total expense to be recognized by the Companies in futureperiods for unvested awards outstanding as of December 31,2011 for Con Edison and CECONY was $2 million and isexpected to be recognized over a weighted average period ofone year.
The number of units in each annual Performance RSU award issubject to adjustment as follows: (i) 50 percent of the unitsawarded will be multiplied by a factor that may range from 0 to150 percent based on Con Edison’s total shareholder returnrelative to a specified peer group during a specifiedperformance period (the TSR portion); and (ii) 50 percent of theunits awarded will be multiplied by a factor that may range from0 to 200 percent based on determinations made in connectionwith CECONY’s Executive Incentive Plan, or, for certainofficers, the O&R Annual Team Incentive Plan or goals relatingto Con Edison’s competitive energy businesses (the EIPportion). Units generally vest when the performance periodends.
CON EDISON ANNUAL REPORT 123
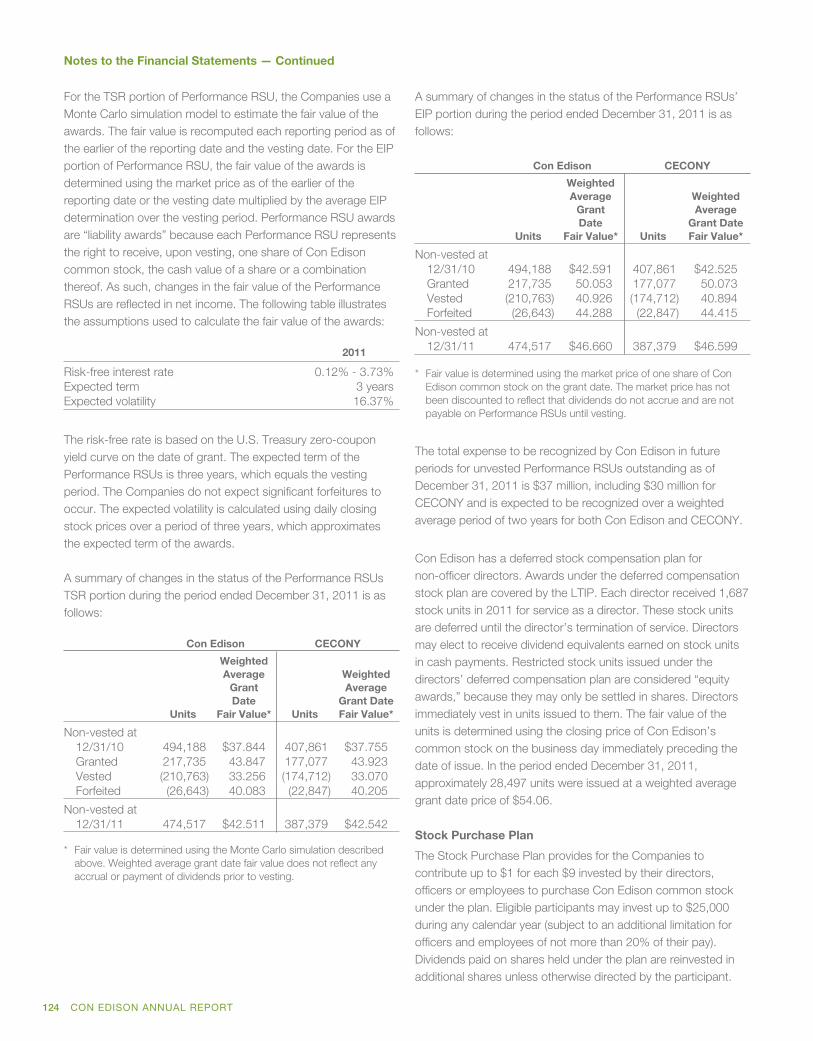
CG11
MAC
377
Notes to the Financial Statements — Continued
For the TSR portion of Performance RSU, the Companies use aMonte Carlo simulation model to estimate the fair value of theawards. The fair value is recomputed each reporting period as ofthe earlier of the reporting date and the vesting date. For the EIPportion of Performance RSU, the fair value of the awards isdetermined using the market price as of the earlier of thereporting date or the vesting date multiplied by the average EIPdetermination over the vesting period. Performance RSU awardsare “liability awards” because each Performance RSU representsthe right to receive, upon vesting, one share of Con Edisoncommon stock, the cash value of a share or a combinationthereof. As such, changes in the fair value of the PerformanceRSUs are reflected in net income. The following table illustratesthe assumptions used to calculate the fair value of the awards:
2011
Risk-free interest rate 0.12% - 3.73%Expected term 3 yearsExpected volatility 16.37%
The risk-free rate is based on the U.S. Treasury zero-couponyield curve on the date of grant. The expected term of thePerformance RSUs is three years, which equals the vestingperiod. The Companies do not expect significant forfeitures tooccur. The expected volatility is calculated using daily closingstock prices over a period of three years, which approximatesthe expected term of the awards.
A summary of changes in the status of the Performance RSUsTSR portion during the period ended December 31, 2011 is asfollows:
Con Edison CECONY
Units
WeightedAverage
GrantDate
Fair Value* Units
WeightedAverage
Grant DateFair Value*
Non-vested at12/31/10 494,188 $37.844 407,861 $37.755Granted 217,735 43.847 177,077 43.923Vested (210,763) 33.256 (174,712) 33.070Forfeited (26,643) 40.083 (22,847) 40.205
Non-vested at12/31/11 474,517 $42.511 387,379 $42.542
* Fair value is determined using the Monte Carlo simulation describedabove. Weighted average grant date fair value does not reflect anyaccrual or payment of dividends prior to vesting.
A summary of changes in the status of the Performance RSUs’EIP portion during the period ended December 31, 2011 is asfollows:
Con Edison CECONY
Units
WeightedAverage
GrantDate
Fair Value* Units
WeightedAverage
Grant DateFair Value*
Non-vested at12/31/10 494,188 $42.591 407,861 $42.525Granted 217,735 50.053 177,077 50.073Vested (210,763) 40.926 (174,712) 40.894Forfeited (26,643) 44.288 (22,847) 44.415
Non-vested at12/31/11 474,517 $46.660 387,379 $46.599
* Fair value is determined using the market price of one share of ConEdison common stock on the grant date. The market price has notbeen discounted to reflect that dividends do not accrue and are notpayable on Performance RSUs until vesting.
The total expense to be recognized by Con Edison in futureperiods for unvested Performance RSUs outstanding as ofDecember 31, 2011 is $37 million, including $30 million forCECONY and is expected to be recognized over a weightedaverage period of two years for both Con Edison and CECONY.
Con Edison has a deferred stock compensation plan fornon-officer directors. Awards under the deferred compensationstock plan are covered by the LTIP. Each director received 1,687stock units in 2011 for service as a director. These stock unitsare deferred until the director’s termination of service. Directorsmay elect to receive dividend equivalents earned on stock unitsin cash payments. Restricted stock units issued under thedirectors’ deferred compensation plan are considered “equityawards,” because they may only be settled in shares. Directorsimmediately vest in units issued to them. The fair value of theunits is determined using the closing price of Con Edison’scommon stock on the business day immediately preceding thedate of issue. In the period ended December 31, 2011,approximately 28,497 units were issued at a weighted averagegrant date price of $54.06.
Stock Purchase Plan
The Stock Purchase Plan provides for the Companies tocontribute up to $1 for each $9 invested by their directors,officers or employees to purchase Con Edison common stockunder the plan. Eligible participants may invest up to $25,000during any calendar year (subject to an additional limitation forofficers and employees of not more than 20% of their pay).Dividends paid on shares held under the plan are reinvested inadditional shares unless otherwise directed by the participant.
124 CON EDISON ANNUAL REPORT
CG11
MAC
377
Notes to the Financial Statements — Continued
Participants in the plan immediately vest in shares purchasedby them under the plan. The fair value of the shares of ConEdison common stock purchased under the plan wascalculated using the average of the high and low compositesale prices at which shares were traded at the New York StockExchange on the trading day immediately preceding suchpurchase dates. During 2011, 2010, and 2009, 721,520,738,951, and 868,622 shares were purchased under the StockPurchase Plan at a weighted average price of $52.50, $45.52,and $38.15 per share, respectively.
Note N — Financial Information by Business SegmentThe business segments of each of the Companies, which areits operating segments, were determined based onmanagement’s reporting and decision-making requirements inaccordance with the accounting rules for segment reporting.
Con Edison’s principal business segments are CECONY’sregulated utility activities, O&R’s regulated utility activities andCon Edison’s competitive energy businesses. CECONY’sprincipal business segments are its regulated electric, gas andsteam utility activities.
All revenues of these business segments, excluding revenuesearned by Con Edison Development on certain energyinfrastructure projects, which are deemed to be immaterial, arefrom customers located in the United States of America. Also,all assets of the business segments, excluding certaininvestments in energy infrastructure projects by Con EdisonDevelopment ($234 million at December 31, 2011), are locatedin the United States of America. The accounting policies of thesegments are the same as those described in Note A.
Common services shared by the business segments areassigned directly or allocated based on various cost factors,depending on the nature of the service provided.
CON EDISON ANNUAL REPORT 125
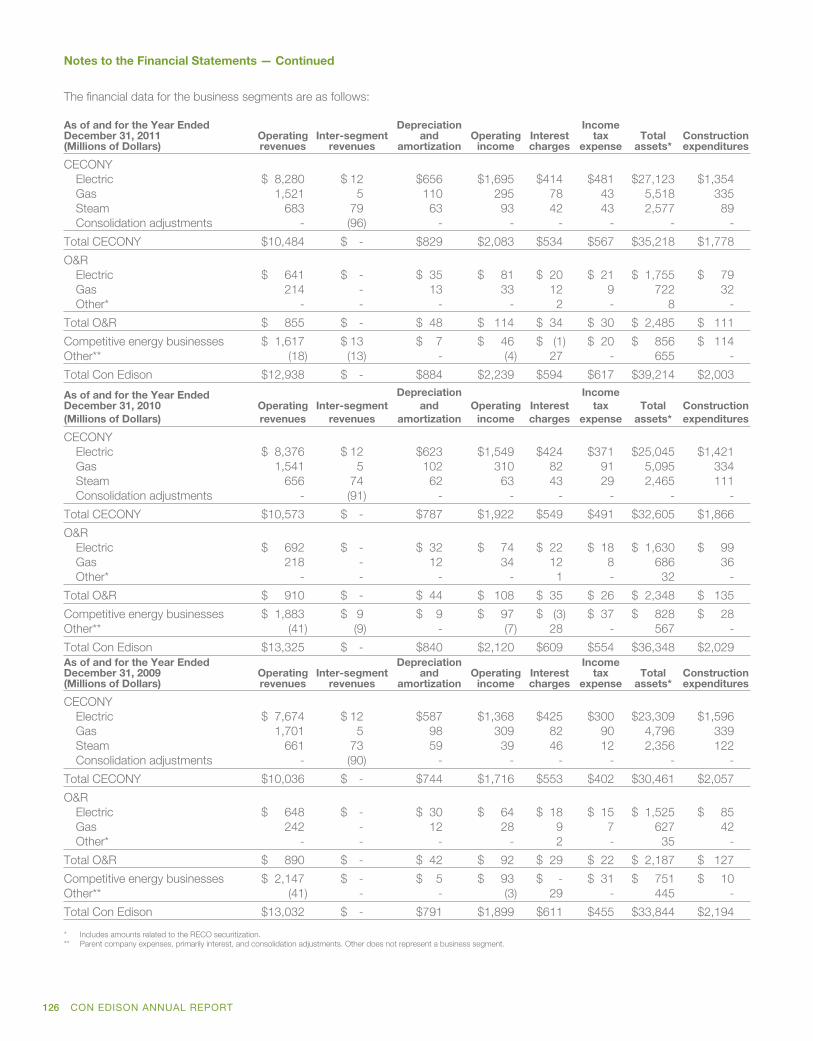
CG11
MAC
377
Notes to the Financial Statements — Continued
The financial data for the business segments are as follows:
As of and for the Year EndedDecember 31, 2011(Millions of Dollars)
Operatingrevenues
Inter-segmentrevenues
Depreciationand
amortizationOperating
incomeInterestcharges
Incometax
expenseTotal
assets*Constructionexpenditures
CECONYElectric $ 8,280 $ 12 $656 $1,695 $414 $481 $27,123 $1,354Gas 1,521 5 110 295 78 43 5,518 335Steam 683 79 63 93 42 43 2,577 89Consolidation adjustments - (96) - - - - - -
Total CECONY $10,484 $ - $829 $2,083 $534 $567 $35,218 $1,778
O&RElectric $ 641 $ - $ 35 $ 81 $ 20 $ 21 $ 1,755 $ 79Gas 214 - 13 33 12 9 722 32Other* - - - - 2 - 8 -
Total O&R $ 855 $ - $ 48 $ 114 $ 34 $ 30 $ 2,485 $ 111
Competitive energy businesses $ 1,617 $ 13 $ 7 $ 46 $ (1) $ 20 $ 856 $ 114Other** (18) (13) - (4) 27 - 655 -
Total Con Edison $12,938 $ - $884 $2,239 $594 $617 $39,214 $2,003
As of and for the Year EndedDecember 31, 2010(Millions of Dollars)
Operatingrevenues
Inter-segmentrevenues
Depreciationand
amortizationOperating
incomeInterestcharges
Incometax
expenseTotal
assets*Constructionexpenditures
CECONYElectric $ 8,376 $ 12 $623 $1,549 $424 $371 $25,045 $1,421Gas 1,541 5 102 310 82 91 5,095 334Steam 656 74 62 63 43 29 2,465 111Consolidation adjustments - (91) - - - - - -
Total CECONY $10,573 $ - $787 $1,922 $549 $491 $32,605 $1,866
O&RElectric $ 692 $ - $ 32 $ 74 $ 22 $ 18 $ 1,630 $ 99Gas 218 - 12 34 12 8 686 36Other* - - - - 1 - 32 -
Total O&R $ 910 $ - $ 44 $ 108 $ 35 $ 26 $ 2,348 $ 135
Competitive energy businesses $ 1,883 $ 9 $ 9 $ 97 $ (3) $ 37 $ 828 $ 28Other** (41) (9) - (7) 28 - 567 -
Total Con Edison $13,325 $ - $840 $2,120 $609 $554 $36,348 $2,029As of and for the Year EndedDecember 31, 2009(Millions of Dollars)
Operatingrevenues
Inter-segmentrevenues
Depreciationand
amortizationOperating
incomeInterestcharges
Incometax
expenseTotal
assets*Constructionexpenditures
CECONYElectric $ 7,674 $ 12 $587 $1,368 $425 $300 $23,309 $1,596Gas 1,701 5 98 309 82 90 4,796 339Steam 661 73 59 39 46 12 2,356 122Consolidation adjustments - (90) - - - - - -
Total CECONY $10,036 $ - $744 $1,716 $553 $402 $30,461 $2,057
O&RElectric $ 648 $ - $ 30 $ 64 $ 18 $ 15 $ 1,525 $ 85Gas 242 - 12 28 9 7 627 42Other* - - - - 2 - 35 -
Total O&R $ 890 $ - $ 42 $ 92 $ 29 $ 22 $ 2,187 $ 127
Competitive energy businesses $ 2,147 $ - $ 5 $ 93 $ - $ 31 $ 751 $ 10Other** (41) - - (3) 29 - 445 -
Total Con Edison $13,032 $ - $791 $1,899 $611 $455 $33,844 $2,194
* Includes amounts related to the RECO securitization.** Parent company expenses, primarily interest, and consolidation adjustments. Other does not represent a business segment.
126 CON EDISON ANNUAL REPORT

CG11
MAC
377
Notes to the Financial Statements — Continued
Note O — Derivative Instruments and Hedging Activities
Under the accounting rules for derivatives and hedging,derivatives are recognized on the balance sheet at fair value,unless an exception is available under the accounting rules.Certain qualifying derivative contracts have been designated asnormal purchases or normal sales contracts. These contractsare not reported at fair value under the accounting rules.
Energy Price Hedging
Con Edison’s subsidiaries hedge market price fluctuationsassociated with physical purchases and sales of electricity,natural gas, and steam by using derivative instrumentsincluding futures, forwards, basis swaps, options, transmissioncongestion contracts and financial transmission rightscontracts. The fair values of these hedges at December 31,2011 and 2010 were as follows:
Con Edison CECONY
(Millions of Dollars) 2011 2010 2011 2010
Fair value of net derivativeassets/(liabilities) – gross $(249) $(261) $(144) $(156)
Impact of netting of cashcollateral 110 176 46 104
Fair value of net derivativeassets/(liabilities) – net $(139) $ (85) $ (98) $ (52)
Credit ExposureThe Companies are exposed to credit risk related totransactions entered into primarily for the various energy supplyand hedging activities by the Utilities and the competitiveenergy businesses. The Companies use credit policies tomanage this risk, including an established credit approvalprocess, monitoring of counterparty limits, netting provisionswithin agreements, collateral or prepayment arrangements,credit insurance and credit default swaps.
At December 31, 2011, Con Edison and CECONY had $119million and $12 million of credit exposure in connection withenergy supply and hedging activities, net of collateral,respectively. Con Edison’s net credit exposure consisted of$45 million with investment-grade counterparties, $38 millionwith commodity exchange brokers, $33 million withindependent system operators and $3 million with non-ratedcounterparties. CECONY’s net credit exposure was withcommodity exchange brokers.
Economic Hedges
The Companies enter into certain derivative instruments that donot qualify or are not designated as hedges under theaccounting rules for derivatives and hedging. However,management believes these instruments represent economichedges that mitigate exposure to fluctuations in commodityprices.
CON EDISON ANNUAL REPORT 127

CG11
MAC
377
Notes to the Financial Statements — Continued
The fair values of the Companies’ commodity derivatives at December 31, 2011 were:
Fair Value of Commodity Derivatives(a)
(Millions of Dollars) Balance Sheet Location Con Edison CECONY
Derivatives Asset
Current Other current assets $ 139 $ 16Long-term Other deferred charges and non-current assets 26 14
Total derivatives asset $ 165 $ 30Impact of netting (95) (6)
Net derivatives asset $ 70 $ 24
Derivatives Liability
Current Fair value of derivative liabilities $ 331 $127Long-term Fair value of derivative liabilities 83 48
Total derivatives liability $ 414 $175Impact of netting (205) (53)
Net derivatives liability $ 209 $122
(a) Qualifying derivative contracts, which have been designated as normal purchases or normal sales contracts, are not reported at fair value under the accounting rules for derivatives and hedgingand, therefore, are excluded from the table.
The fair values of the Companies’ commodity derivatives at December 31, 2010 were:
Fair Value of Commodity Derivatives(a)
(Millions of Dollars) Balance Sheet Location Con Edison CECONY
Derivatives Asset
Current Other current assets $ 184 $ 29Long-term Other deferred charges and non-current assets 51 19
Total derivatives asset $ 235 $ 48Impact of netting (129) -
Net derivatives asset $ 106 $ 48
Derivatives Liability
Current Fair value of derivative liabilities $ 385 $ 148Long-term Fair value of derivative liabilities 111 56
Total derivatives liability $ 496 $ 204Impact of netting (305) (104)
Net derivatives liability $ 191 $ 100
(a) Qualifying derivative contracts, which have been designated as normal purchases or normal sales contracts, are not reported at fair value under the accounting rules for derivatives and hedgingand, therefore, are excluded from the table.
The Utilities generally recover all of their prudently incurred fuel,purchased power and gas cost, including hedging gains andlosses, in accordance with rate provisions approved by theapplicable state utility commissions. See “Recoverable EnergyCosts” in Note A. In accordance with the accounting rules forregulated operations, the Utilities record a regulatory asset orliability to defer recognition of unrealized gains and losses on
their electric and gas derivatives. As gains and losses arerealized in future periods, they will be recognized as purchasedpower, gas and fuel costs in the Companies’ consolidatedincome statements. Con Edison’s competitive energybusinesses record realized and unrealized gains and losses ontheir derivative contracts in earnings in the reporting period inwhich they occur.
128 CON EDISON ANNUAL REPORT
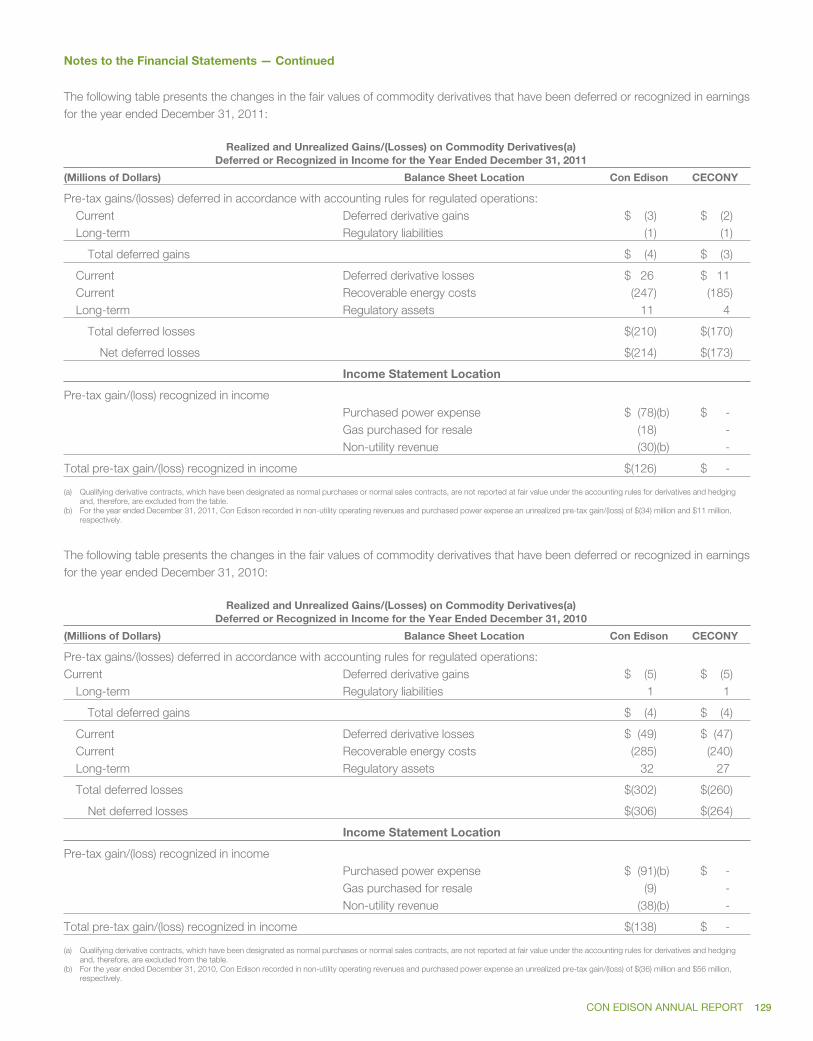
CG11
MAC
377
Notes to the Financial Statements — Continued
The following table presents the changes in the fair values of commodity derivatives that have been deferred or recognized in earningsfor the year ended December 31, 2011:
Realized and Unrealized Gains/(Losses) on Commodity Derivatives(a)Deferred or Recognized in Income for the Year Ended December 31, 2011
(Millions of Dollars) Balance Sheet Location Con Edison CECONY
Pre-tax gains/(losses) deferred in accordance with accounting rules for regulated operations:Current Deferred derivative gains $ (3) $ (2)Long-term Regulatory liabilities (1) (1)
Total deferred gains $ (4) $ (3)
Current Deferred derivative losses $ 26 $ 11Current Recoverable energy costs (247) (185)Long-term Regulatory assets 11 4
Total deferred losses $(210) $(170)
Net deferred losses $(214) $(173)
Income Statement Location
Pre-tax gain/(loss) recognized in incomePurchased power expense $ (78)(b) $ -Gas purchased for resale (18) -Non-utility revenue (30)(b) -
Total pre-tax gain/(loss) recognized in income $(126) $ -
(a) Qualifying derivative contracts, which have been designated as normal purchases or normal sales contracts, are not reported at fair value under the accounting rules for derivatives and hedgingand, therefore, are excluded from the table.
(b) For the year ended December 31, 2011, Con Edison recorded in non-utility operating revenues and purchased power expense an unrealized pre-tax gain/(loss) of $(34) million and $11 million,respectively.
The following table presents the changes in the fair values of commodity derivatives that have been deferred or recognized in earningsfor the year ended December 31, 2010:
Realized and Unrealized Gains/(Losses) on Commodity Derivatives(a)Deferred or Recognized in Income for the Year Ended December 31, 2010
(Millions of Dollars) Balance Sheet Location Con Edison CECONY
Pre-tax gains/(losses) deferred in accordance with accounting rules for regulated operations:Current Deferred derivative gains $ (5) $ (5)
Long-term Regulatory liabilities 1 1
Total deferred gains $ (4) $ (4)
Current Deferred derivative losses $ (49) $ (47)Current Recoverable energy costs (285) (240)Long-term Regulatory assets 32 27
Total deferred losses $(302) $(260)
Net deferred losses $(306) $(264)
Income Statement Location
Pre-tax gain/(loss) recognized in incomePurchased power expense $ (91)(b) $ -Gas purchased for resale (9) -Non-utility revenue (38)(b) -
Total pre-tax gain/(loss) recognized in income $(138) $ -
(a) Qualifying derivative contracts, which have been designated as normal purchases or normal sales contracts, are not reported at fair value under the accounting rules for derivatives and hedgingand, therefore, are excluded from the table.
(b) For the year ended December 31, 2010, Con Edison recorded in non-utility operating revenues and purchased power expense an unrealized pre-tax gain/(loss) of $(36) million and $56 million,respectively.
CON EDISON ANNUAL REPORT 129

CG11
MAC
377
Notes to the Financial Statements — Continued
As of December 31, 2011, Con Edison had 1,328 contracts, including 572 CECONY contracts, which were considered to bederivatives under the accounting rules for derivatives and hedging (excluding qualifying derivative contracts, which have beendesignated as normal purchases or normal sales contracts). The following table presents the number of contracts by commoditytype:
Electric Derivatives Gas Derivatives
Number ofEnergy
Contracts(a) MWhs(b)
Number ofCapacity
Contracts(a) MWs(b)
Numberof
Contracts(a) Dths(b)
Total NumberOf
Contracts(a)
Con Edison 687 15,602,445 46 6,499 595 97,101,500 1,328CECONY 141 3,822,500 - - 431 89,524,000 572
(a) Qualifying derivative contracts, which have been designated as normal purchases or normal sales contracts, are not reported at fair value under the accounting rules for derivatives and hedgingand, therefore, are excluded from the table.
(b) Volumes are reported net of long and short positions.
The Companies also enter into electric congestion and gasbasis swap contracts to hedge the congestion andtransportation charges which are associated with electric andgas contracts and hedged volumes.
The collateral requirements associated with, and settlement of,derivative transactions are included in net cash flows fromoperating activities in the Companies’ consolidated statementof cash flows. Most derivative instrument contracts containprovisions that may require the Companies to provide collateralon derivative instruments in net liability positions. The amount ofcollateral to be provided will depend on the fair value of thederivative instruments and the Companies’ credit ratings.
The aggregate fair value of all derivative instruments with credit-risk-related contingent features that are in a net liability positionand collateral posted at December 31, 2011, and the additionalcollateral that would have been required to be posted had thelowest applicable credit rating been reduced one level and tobelow investment grade were:
(Millions of Dollars) Con Edison(a) CECONY(a)
Aggregate fair value – net liabilities $209 $122Collateral posted $ 60 $ 53(b)Additional collateral(c) (downgrade
one level from current ratings(d)) $ 20 $ 11Additional collateral(c) (downgrade
to below investment grade fromcurrent ratings(d)) $195(e) $ 83(e)
(a) Non-derivative transactions for the purchase and sale of electricity and gas and qualifyingderivative instruments, which have been designated as normal purchases or normal sales,are excluded from the table. These transactions primarily include purchases of electricityfrom independent system operators. In the event the Utilities and Con Edison’s competitiveenergy businesses were no longer extended unsecured credit for such purchases, theCompanies would be required to post collateral, which at December 31, 2011, would haveamounted to an estimated $51 million for Con Edison, including $11 million for CECONY.For certain other such non-derivative transactions, the Companies could be required topost collateral under certain circumstances, including in the event counterparties hadreasonable grounds for insecurity.
(b) Across the Utilities’ energy derivative positions, credit limits for the same counterparties aregenerally integrated. At December 31, 2011, the Utilities posted combined collateral of $58million, including an estimated $5 million attributable to O&R.
(c) The Companies measure the collateral requirements by taking into consideration the fairvalue amounts of derivative instruments that contain credit-risk-related contingent featuresthat are in a net liabilities position plus amounts owed to counterparties for settledtransactions and amounts required by counterparties for minimum financial security. Thefair value amounts represent unrealized losses, net of any unrealized gains where theCompanies have a legally enforceable right of setoff.
(d) The current ratings are Moody’s, S&P and Fitch long-term credit rating of, as applicable,Con Edison (Baa1/BBB+/BBB+), CECONY (A3/A-/A-) or O&R (Baa1/A-/A-). Credit ratingsassigned by rating agencies are expressions of opinions that are subject to revision orwithdrawal at any time by the assigning rating agency.
(e) Derivative instruments that are net assets have been excluded from the table. AtDecember 31, 2011, if Con Edison had been downgraded to below investment grade, itwould have been required to post additional collateral for such derivative instruments ofnot more than $19 million.
Interest Rate Swaps
O&R has an interest rate swap pursuant to which it pays afixed-rate of 6.09 percent and receives a LIBOR-based variablerate. The fair value of this interest rate swap at December 31,2011 was an unrealized loss of $8 million, which has beenincluded in Con Edison’s consolidated balance sheet as anoncurrent liability/fair value of derivative liabilities and aregulatory asset. The increase in the fair value of the swap forthe year ended December 31, 2011 was $2 million. In the eventO&R’s credit rating was downgraded to BBB- or lower by S&Por Baa3 or lower by Moody’s, the swap counterparty couldelect to terminate the agreement and, if it did so, the partieswould then be required to settle the transaction.
130 CON EDISON ANNUAL REPORT

CG11
MAC
377
Notes to the Financial Statements — Continued
Note P — Fair Value Measurements
The accounting rules for fair value measurements anddisclosures define fair value as the price that would be receivedto sell an asset or paid to transfer a liability in an orderlytransaction between market participants at the measurementdate in a principal or most advantageous market. Fair value is amarket-based measurement that is determined based on inputs,which refer broadly to assumptions that market participants usein pricing assets or liabilities. These inputs can be readilyobservable, market corroborated, or generally unobservable firminputs. The Companies often make certain assumptions thatmarket participants would use in pricing the asset or liability,including assumptions about risk, and the risks inherent in theinputs to valuation techniques. The Companies use valuationtechniques that maximize the use of observable inputs andminimize the use of unobservable inputs.
The accounting rules for fair value measurements anddisclosures established a fair value hierarchy, which prioritizesthe inputs to valuation techniques used to measure fair value inthree broad levels. The rules require that assets and liabilities beclassified in their entirety based on the level of input that issignificant to the fair value measurement. Assessing thesignificance of a particular input may require judgmentconsidering factors specific to the asset or liability, and mayaffect the valuation of the asset or liability and their placementwithin the fair value hierarchy. The Companies classify fair valuebalances based on the fair value hierarchy defined by theaccounting rules for fair value measurements and disclosures asfollows:
• Level 1 – Consists of assets or liabilities whose value isbased on unadjusted quoted prices in active markets atthe measurement date. An active market is one in whichtransactions for assets or liabilities occur with sufficientfrequency and volume to provide pricing information onan ongoing basis. This category includes contractstraded on active exchange markets valued usingunadjusted prices quoted directly from the exchange.
• Level 2 – Consists of assets or liabilities valued usingindustry standard models and based on prices, otherthan quoted prices within Level 1, that are either directlyor indirectly observable as of the measurement date.The industry standard models consider observableassumptions including time value, volatility factors, andcurrent market and contractual prices for the underlyingcommodities, in addition to other economic measures.This category includes contracts traded on activeexchanges or in over-the-counter markets priced withindustry standard models.
• Level 3 – Consists of assets or liabilities whose fairvalue is estimated based on internally developedmodels or methodologies using inputs that are generallyless readily observable and supported by little, if any,market activity at the measurement date. Unobservableinputs are developed based on the best availableinformation and subject to cost benefit constraints. Thiscategory includes contracts priced using models thatare internally developed and contracts placed in illiquidmarkets. It also includes contracts that expire after theperiod of time for which quoted prices are available andinternal models are used to determine a significantportion of the value.
The valuation technique used by the Companies with regard tocommodity derivatives and other assets that fall into either Level2 or Level 3 is the market approach, which uses prices and otherrelevant information generated by market transactions involvingidentical or comparable assets and liabilities. The valuationtechnique used by the Companies with regard to the interest ratecontract that falls into Level 3 is the income approach whichuses valuation techniques to convert future income streamamounts to a single amount in present value terms.
CON EDISON ANNUAL REPORT 131
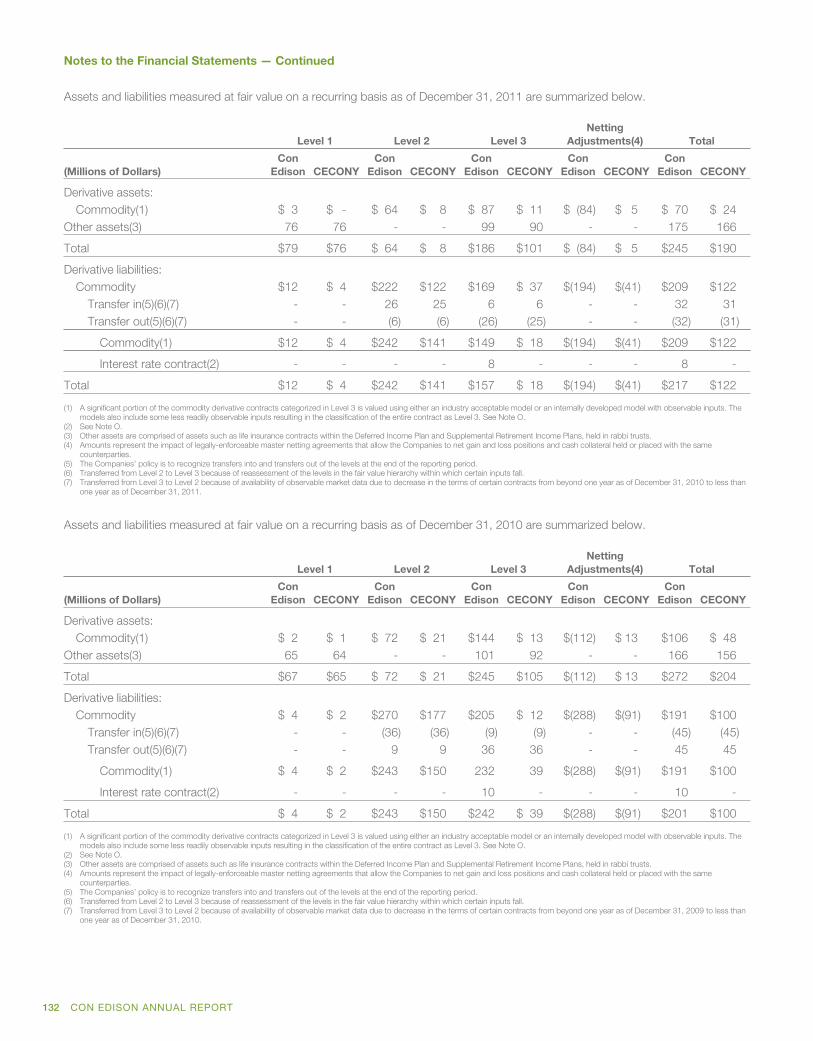
CG11
MAC
377
Notes to the Financial Statements — Continued
Assets and liabilities measured at fair value on a recurring basis as of December 31, 2011 are summarized below.
Level 1 Level 2 Level 3Netting
Adjustments(4) Total
(Millions of Dollars)Con
Edison CECONYCon
Edison CECONYCon
Edison CECONYCon
Edison CECONYCon
Edison CECONY
Derivative assets:Commodity(1) $ 3 $ - $ 64 $ 8 $ 87 $ 11 $ (84) $ 5 $ 70 $ 24
Other assets(3) 76 76 - - 99 90 - - 175 166
Total $79 $76 $ 64 $ 8 $186 $101 $ (84) $ 5 $245 $190
Derivative liabilities:Commodity $12 $ 4 $222 $122 $169 $ 37 $(194) $(41) $209 $122
Transfer in(5)(6)(7) - - 26 25 6 6 - - 32 31Transfer out(5)(6)(7) - - (6) (6) (26) (25) - - (32) (31)
Commodity(1) $12 $ 4 $242 $141 $149 $ 18 $(194) $(41) $209 $122
Interest rate contract(2) - - - - 8 - - - 8 -
Total $12 $ 4 $242 $141 $157 $ 18 $(194) $(41) $217 $122
(1) A significant portion of the commodity derivative contracts categorized in Level 3 is valued using either an industry acceptable model or an internally developed model with observable inputs. Themodels also include some less readily observable inputs resulting in the classification of the entire contract as Level 3. See Note O.
(2) See Note O.(3) Other assets are comprised of assets such as life insurance contracts within the Deferred Income Plan and Supplemental Retirement Income Plans, held in rabbi trusts.(4) Amounts represent the impact of legally-enforceable master netting agreements that allow the Companies to net gain and loss positions and cash collateral held or placed with the same
counterparties.(5) The Companies’ policy is to recognize transfers into and transfers out of the levels at the end of the reporting period.(6) Transferred from Level 2 to Level 3 because of reassessment of the levels in the fair value hierarchy within which certain inputs fall.(7) Transferred from Level 3 to Level 2 because of availability of observable market data due to decrease in the terms of certain contracts from beyond one year as of December 31, 2010 to less than
one year as of December 31, 2011.
Assets and liabilities measured at fair value on a recurring basis as of December 31, 2010 are summarized below.
Level 1 Level 2 Level 3Netting
Adjustments(4) Total
(Millions of Dollars)Con
Edison CECONYCon
Edison CECONYCon
Edison CECONYCon
Edison CECONYCon
Edison CECONY
Derivative assets:Commodity(1) $ 2 $ 1 $ 72 $ 21 $144 $ 13 $(112) $ 13 $106 $ 48
Other assets(3) 65 64 - - 101 92 - - 166 156
Total $67 $65 $ 72 $ 21 $245 $105 $(112) $ 13 $272 $204
Derivative liabilities:Commodity $ 4 $ 2 $270 $177 $205 $ 12 $(288) $(91) $191 $100
Transfer in(5)(6)(7) - - (36) (36) (9) (9) - - (45) (45)Transfer out(5)(6)(7) - - 9 9 36 36 - - 45 45
Commodity(1) $ 4 $ 2 $243 $150 232 39 $(288) $(91) $191 $100
Interest rate contract(2) - - - - 10 - - - 10 -
Total $ 4 $ 2 $243 $150 $242 $ 39 $(288) $(91) $201 $100
(1) A significant portion of the commodity derivative contracts categorized in Level 3 is valued using either an industry acceptable model or an internally developed model with observable inputs. Themodels also include some less readily observable inputs resulting in the classification of the entire contract as Level 3. See Note O.
(2) See Note O.(3) Other assets are comprised of assets such as life insurance contracts within the Deferred Income Plan and Supplemental Retirement Income Plans, held in rabbi trusts.(4) Amounts represent the impact of legally-enforceable master netting agreements that allow the Companies to net gain and loss positions and cash collateral held or placed with the same
counterparties.(5) The Companies’ policy is to recognize transfers into and transfers out of the levels at the end of the reporting period.(6) Transferred from Level 2 to Level 3 because of reassessment of the levels in the fair value hierarchy within which certain inputs fall.(7) Transferred from Level 3 to Level 2 because of availability of observable market data due to decrease in the terms of certain contracts from beyond one year as of December 31, 2009 to less than
one year as of December 31, 2010.
132 CON EDISON ANNUAL REPORT
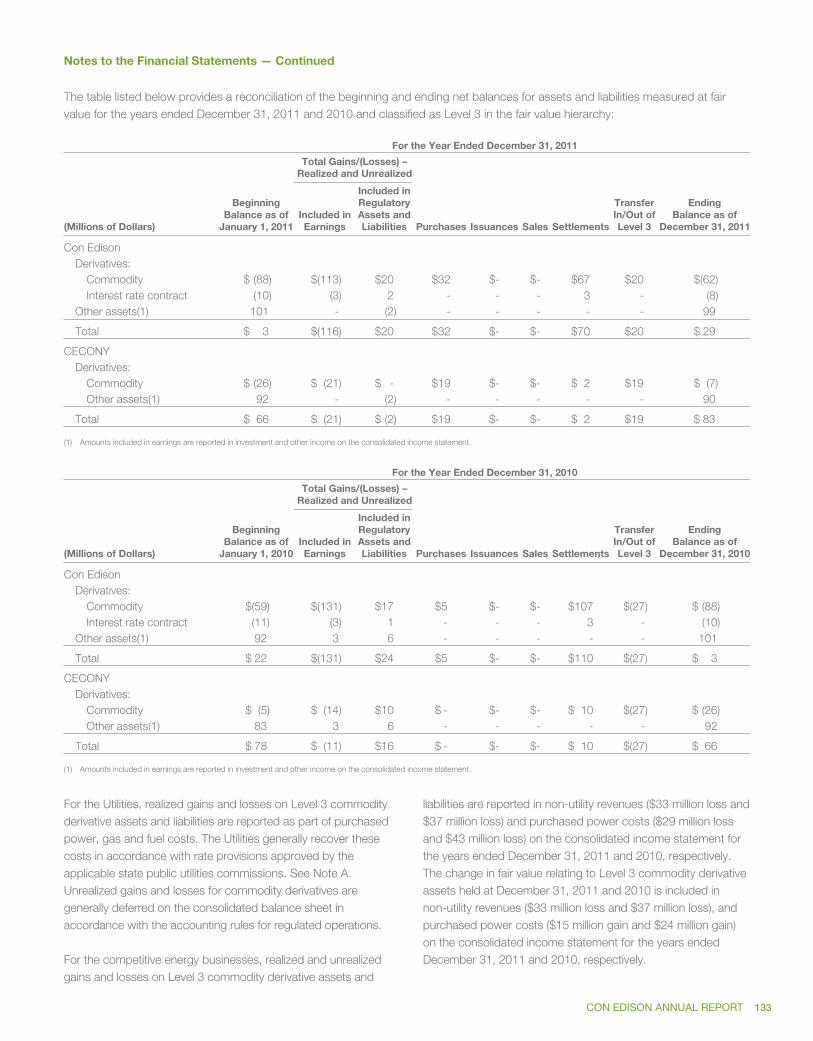
CG11
MAC
377
Notes to the Financial Statements — Continued
The table listed below provides a reconciliation of the beginning and ending net balances for assets and liabilities measured at fairvalue for the years ended December 31, 2011 and 2010 and classified as Level 3 in the fair value hierarchy:
For the Year Ended December 31, 2011
Total Gains/(Losses) –Realized and Unrealized
(Millions of Dollars)
BeginningBalance as of
January 1, 2011Included inEarnings
Included inRegulatoryAssets andLiabilities Purchases Issuances Sales Settlements
TransferIn/Out ofLevel 3
EndingBalance as of
December 31, 2011
Con EdisonDerivatives:
Commodity $ (88) $(113) $20 $32 $- $- $67 $20 $(62)Interest rate contract (10) (3) 2 - - - 3 - (8)
Other assets(1) 101 - (2) - - - - - 99
Total $ 3 $(116) $20 $32 $- $- $70 $20 $ 29
CECONYDerivatives:
Commodity $ (26) $ (21) $ - $19 $- $- $ 2 $19 $ (7)Other assets(1) 92 - (2) - - - - - 90
Total $ 66 $ (21) $ (2) $19 $- $- $ 2 $19 $ 83
(1) Amounts included in earnings are reported in investment and other income on the consolidated income statement.
For the Year Ended December 31, 2010
Total Gains/(Losses) –Realized and Unrealized
(Millions of Dollars)
BeginningBalance as of
January 1, 2010Included inEarnings
Included inRegulatoryAssets andLiabilities Purchases Issuances Sales Settlements
TransferIn/Out ofLevel 3
EndingBalance as of
December 31, 2010
Con EdisonDerivatives:
Commodity $(59) $(131) $17 $5 $- $- $107 $(27) $ (88)Interest rate contract (11) (3) 1 - - - 3 - (10)
Other assets(1) 92 3 6 - - - - - 101
Total $ 22 $(131) $24 $5 $- $- $110 $(27) $ 3
CECONYDerivatives:
Commodity $ (5) $ (14) $10 $ - $- $- $ 10 $(27) $ (26)Other assets(1) 83 3 6 - - - - - 92
Total $ 78 $ (11) $16 $ - $- $- $ 10 $(27) $ 66
(1) Amounts included in earnings are reported in investment and other income on the consolidated income statement.
For the Utilities, realized gains and losses on Level 3 commodityderivative assets and liabilities are reported as part of purchasedpower, gas and fuel costs. The Utilities generally recover thesecosts in accordance with rate provisions approved by theapplicable state public utilities commissions. See Note A.Unrealized gains and losses for commodity derivatives aregenerally deferred on the consolidated balance sheet inaccordance with the accounting rules for regulated operations.
For the competitive energy businesses, realized and unrealizedgains and losses on Level 3 commodity derivative assets and
liabilities are reported in non-utility revenues ($33 million loss and$37 million loss) and purchased power costs ($29 million lossand $43 million loss) on the consolidated income statement forthe years ended December 31, 2011 and 2010, respectively.The change in fair value relating to Level 3 commodity derivativeassets held at December 31, 2011 and 2010 is included innon-utility revenues ($33 million loss and $37 million loss), andpurchased power costs ($15 million gain and $24 million gain)on the consolidated income statement for the years endedDecember 31, 2011 and 2010, respectively.
CON EDISON ANNUAL REPORT 133
CG11
MAC
377
Notes to the Financial Statements — Continued
The accounting rules for fair value measurements anddisclosures require consideration of the impact ofnonperformance risk (including credit risk) from a marketparticipant perspective in the measurement of the fair value ofassets and liabilities. At December 31, 2011, the Companiesdetermined that nonperformance risk would have no materialimpact on their financial position or results of operations. Toassess nonperformance risk, the Companies consideredinformation such as collateral requirements, master nettingarrangements, letters of credit and parent company guarantees,and applied a market-based method by using the counterparty(for an asset) or the Companies’ (for a liability) credit defaultswaps rates.
Note Q – Variable Interest Entities
The Companies have not identified any interests they have in anyvariable interest entity (VIE) that would require the Companies toinclude the financial position and results of operations of the VIEin the Companies’ consolidated financial statements.
The accounting rules for consolidation address the consolidationof a VIE by a business enterprise that is the primary beneficiary.A VIE is an entity that does not have a sufficient equityinvestment at risk to permit it to finance its activities withoutadditional subordinated financial support, or whose equityinvestors lack the characteristics of a controlling financial interest.The primary beneficiary is the business enterprise that has thepower to direct the activities of the VIE that most significantlyimpact the VIE’s economic performance and either absorbs asignificant amount of the VIE’s losses or has the right to receivebenefits that could be significant to the VIE.
Con Edison enters into arrangements including leases,partnerships and electricity purchase agreements, with variousentities. As a result of these arrangements, Con Edison retains ormay retain a variable interest in these entities.
CECONY has a variable interest in a non-consolidated VIE,Astoria Energy, LLC (Astoria Energy), with which CECONY hasentered into a long-term electricity purchase agreement.CECONY is not the primary beneficiary of this VIE sinceCECONY does not have the power to direct the activitiesthat CECONY believes most significantly impact the economicperformance of Astoria Energy. In particular, CECONY has notinvested in, or guaranteed the indebtedness of, Astoria Energyand CECONY does not operate or maintain Astoria Energy’sgenerating facilities. CECONY also has long-term electricitypurchase agreements with the following five potential VIEs: Sithe/Independence Power Partners, LP, Cogen Technologies LindenVenture, LP, Selkirk Cogen Partners, LP, Brooklyn Navy YardCogeneration Partners, LP, and Indeck Energy Services ofCorinth, Inc. In 2011, requests were made of these five
counterparties for information necessary to determine whetherthe entity was a VIE and whether CECONY is the primarybeneficiary; however, the information was not made available.See Note I for information on these electricity purchaseagreements, the payments pursuant to which constituteCECONY’s maximum exposure to loss with respect to AstoriaEnergy and the five potential VIEs.
Con Edison has a variable interest in a non-consolidated VIE,Pilesgrove Solar, LLC (Pilesgrove), in which Con EdisonDevelopment, starting in 2010, participated with a third party todevelop, construct, and operate a photovoltaic solar energygeneration project. The project was constructed forapproximately $90 million and commenced commercialoperation in August 2011. Con Edison is not the primarybeneficiary of this VIE since the power to direct the activities thatmost significantly impact the economics of Pilesgrove is sharedequally between Con Edison Development and the third party.Included in the Con Edison’s consolidated balance sheet atDecember 31, 2011 is $43 million in assets related to Pilesgrovewhich represents the investment of Con Edison Development.The current maximum exposure to loss in Pilesgrove is $29million.
Note R – Asset Retirement Obligations
Con Edison and CECONY account for retirement obligations ontheir assets in accordance with the accounting rules for assetretirement obligations. This accounting standard requiresrecognition of a liability for legal obligations associated with theretirement of long-lived assets. When the liability is initiallyrecorded, asset retirement costs are capitalized by increasing thecarrying amount of the related asset. The liability is accreted toits present value each period and the capitalized cost isdepreciated over the useful life of the related asset.
The Utilities include in depreciation the estimated removal costs,less salvage, for utility plant assets. In accordance with theaccounting rules for asset retirement obligations, future removalcosts that do not represent legal asset retirement obligations arerecorded as regulatory liabilities pursuant to the accounting rulesfor regulated operations. The related regulatory liabilitiesrecorded for Con Edison and CECONY were $448 million and$372 million at December 31, 2011 and $421 million and $349million at December 31, 2010, respectively.
The Companies identified future asset retirement obligationsassociated with the removal of asbestos and asbestos-containing material in their buildings and equipment within thegenerating stations and substations, and within the steam andgas distribution systems. The Companies also identified assetretirement obligations relating to gas pipelines abandoned inplace. The estimates of future liabilities were developed using
134 CON EDISON ANNUAL REPORT
CG11
MAC
377
Notes to the Financial Statements — Continued
historical information, and where available, quoted prices fromoutside contractors. The obligation for the cost of asbestosremoval from the Companies’ generating stations and substationstructures was not accrued since the retirement dates cannot bereasonably estimated.
At December 31, 2011, the liabilities of Con Edison andCECONY for the fair value of their legal asset retirementobligations were $145 million, as compared with $109 million atDecember 31, 2010. In addition, Con Edison and CECONYincreased utility plant, net of accumulated depreciation, for assetretirement costs at December 31, 2011 by $38 million, ascompared with $18 million at December 31, 2010. Pursuant tothe accounting rules for regulated operations, CECONY alsorecorded a reduction of $107 million and $91 million atDecember 31, 2011 and 2010, respectively, to the regulatoryliability associated with cost of removal to reflect accumulateddepreciation and interest accretion costs.
Note S – Related Party Transactions
The Utilities and Con Edison’s competitive businesses provideadministrative and other services to each other pursuant to costallocation procedures approved by the NYSPSC. The costs ofadministrative and other services provided by CECONY to, andreceived by it from, Con Edison and its other subsidiaries for theyears ended December 31, 2011, 2010, and 2009 were asfollows:
CECONY
(Millions of Dollars) 2011 2010 2009
Cost of services provided $79 $74 $75Cost of services received $48 $45 $45
In addition, CECONY and O&R have joint gas supplyarrangements, in connection with which CECONY sold to O&R$81 million, $99 million and $124 million of natural gas for theyears ended December 31, 2011, 2010, and 2009, respectively.These amounts are net of the effect of related hedgingtransactions.
FERC has authorized CECONY through 2013 to lend funds toO&R from time to time, for periods of not more than 12 months,in amounts not to exceed $250 million outstanding at any time,at prevailing market rates. There were no outstanding loans toO&R at December 31, 2011 and 2010.
Note T – New Financial Accounting Standards
In May 2011, the Financial Accounting Standards Board (FASB)issued amendments to the guidance for fair value measurementthrough Accounting Standards Update (ASU) No. 2011-04, “FairValue Measurement (Topic 820): Amendments to AchieveCommon Fair Value Measurement and Disclosure Requirementsin U.S. GAAP and IFRSs.” The amendments expand AccountingStandards Codification 820’s existing disclosure requirements forfair value measurements and makes other amendments. Many ofthese amendments were made to eliminate unnecessary wordingdifferences between U.S. generally accepted accountingprinciples and International Financial Reporting Standards. Forpublic entities, the amendments are effective prospectivelyduring interim and annual periods beginning after December 15,2011. The application of this guidance is not expected to have amaterial impact on the Companies’ financial position, results ofoperations and liquidity.
In June 2011, the FASB issued new guidance for presentation ofcomprehensive income through ASU No. 2011–05,“Comprehensive Income (Topic 220): Presentation ofComprehensive Income.” The amendments require that thecomprehensive income be presented either in a singlecontinuous statement of comprehensive income or in twoseparate but consecutive statements. In the two-statementapproach, the first statement should present total net incomeand its components followed consecutively by a secondstatement that should present total other comprehensiveincome, the components of other comprehensive income, andthe total of comprehensive income. The amendments in thisupdate are applicable retrospectively for public entities effectivefor fiscal years, and interim periods within those years, beginningafter December 15, 2011. Early adoption is permitted. Theapplication of this guidance does not have a material impact onthe Companies’ financial position, results of operations andliquidity.
In September 2011, the FASB issued amendments to theguidance for goodwill impairment testing through ASUNo. 2011-08, “Intangibles-Goodwill and Other (Topic 350):Testing Goodwill for Impairment.” The amendments provideguidance that exempts an entity from calculating the fair value ofa reporting unit, if on an initial assessment of qualitative factors itis more likely than not that the fair value of a reporting unit isgreater than its carrying amount. For public entities, theamendments are effective for interim and annual goodwill testsperformed for years beginning after December 15, 2011. Theapplication of this guidance is not expected to have a materialimpact on the Companies’ financial position, results ofoperations or liquidity.
CON EDISON ANNUAL REPORT 135

CG11
MAC
377
Notes to the Financial Statements — Continued
In September 2011, the FASB issued amendments to guidancefor disclosures related to retirement benefits through ASUNo. 2011-09, “Compensation – Retirement Benefits –Multiemployer Plans (Subtopic 715-80): Disclosures about anEmployer’s Participation in a Multiemployer Plan.” Theamendment provides guidance that requires employers toprovide additional separate disclosures for multiemployerpension plans and multiemployer other postretirement benefitplans about the commitments an employer has made to amultiemployer plan and the potential future cash flow implicationof participation in such a plan. For public entities, theamendments are effective for interim and annual periods endingafter December 15, 2011. The application of this guidance is notexpected to have a material impact on the Companies’ financialposition, results of operations or liquidity.
In December 2011, the FASB issued amendments to guidancefor disclosures related to balance sheet off-setting through ASUNo. 2011-11,” Balance Sheet (Topic 210): Disclosures aboutOffsetting Assets and Liabilities.” The amendments provideguidance that requires a reporting entity to disclose certainquantitative information concerning financial and derivativeinstruments that are offset in the balance sheet and a descriptionof the rights of setoff, including the nature of such rights,associated with recognized assets and liabilities that are subjectto an enforceable master netting arrangement or similaragreement. For public companies, the amendments are effective
for annual periods beginning on or after January 1, 2013 andretrospectively for all comparative periods presented. Theapplication of this guidance is not expected to have a materialimpact on the Companies’ financial position, results ofoperations or liquidity.
In December 2011, the FASB issued amendments to guidancefor disclosures related to reclassification adjustments throughASU No. 2011-12, “Comprehensive Income (Topic 220): Deferralof the Effective Date for Amendments to the Presentation ofReclassifications of Items Out of Accumulated OtherComprehensive Income in Accounting Standards UpdateNo. 2011-05.” The amendments defer the effective date for therequirements per ASU 2011-05 for the presentation ofreclassification adjustments and the effect of such reclassificationadjustments as a component of net income and a component ofother comprehensive income. The guidance requires reportingentities to continue reporting reclassifications out of accumulatedother comprehensive income on the face of, or the notes to thefinancial statements consistent with the presentationrequirements in effect before update ASU 2011-05. Theamendments in this update are applicable retrospectively forpublic entities effective for fiscal years, and interim periods withinthose years, beginning after December 15, 2011. Early adoptionis permitted. The application of this guidance does not have amaterial impact on the Companies’ financial position, results ofoperations and liquidity.
136 CON EDISON ANNUAL REPORT

“Joel is a fantastic speaker & brings a lot of knowledge to the table. Found he often answered all my questions without asking.” Richard Wathy, Team Lead Financial Reporting, Union Gas.
“Joel Berk is a known and valued commodity at our company.” One of the seminar’s strong points is “the big picture context which gives the mechanics and definitions meaning. I thought all the info was great.” Stephen D. Nigloschy, Vice President Finance, National Grid.
“This is an excellent seminar that provides a solid foundation of knowledge for those unfamiliar with utility accounting and buttresses existing knowledge for those who work in utility ratemaking and accounting on a daily basis.” Wes Owens, Manager Regulatory Affairs, San Jose Water.
“Excellent communications and teaching skills. Working for a utility almost 20 years, I wish I had this class at the start of my career.” Roberta Cleveland, Financial Analyst, Idaho Power.
“One of the strong points of the seminar was “discussion on the current issues on troublesome account situations...bringing other company situations or financial statements into case studies, involving group discussions and covering the appropriate topics. The bond/credit ratings discussion was extremely beneficial.” Kevin Christ, Manager Accounting & Reporting, Northern Natural Gas.
“Great presentation. Very helpful in decision making by financial analysis via financial statements & analysis. Simple, clear, sophisticated. I learned in two days the materials which took me two years in school to learn (Basic & Intermediate Accounting).” Tina Tran, Business Analyst, SCE.
“One of the best & most engaging seminars I have attended in 10+ years; reminds me of my Master’s Degree seminars.” Robert Lukosh, Telecom Engineer, NW Natural Gas.
UTILITYFINANCE &
ACCOUNTINGfor Financial Professionals
2014 Boston May 21-23 Las Vegas May 28-30 Las Vegas October 22-24
UTILITYFINANCE &
ACCOUNTINGfor Non-Financial Professionals
2014
Las Vegas May 14-16 Boston October 6-8 Las Vegas October 15-17
Ask forCPE Credit
Ask forCPE Credit
UTILITY FINANCE & ACCOUNTING SEMINARSLAS VEGAS & BOSTON
“Joel provides in-depth training on fundamental issues in utility finance and accounting with a unique focus on timely subjects and does so in an enjoy-able and engaging manner.” John Caldwell, Director of Economics, Edison Electric.
“Easy to follow, straightforward teaching on the unique and complex arena of rate-based accounting and the principles behind regulatory rate making.” Tony Mitchell, Project Management Office, Spectra Energy.
“Excellent. Met my needs for my job-I work with capital decisions, ratemaking, PPAs for an IOU.” Kevin M. Pera, Transmission Analyst, Xcel Energy.
“I came away feeling confident that I really understood the material & can apply it in my day to day work.” Linda Thompson, Director Ethics, Compliance & Federal Regulatory, APS.
“The most worthwhile & beneficial course I have taken while on the job.” Casey A. Tomasiak, Property Valuation Specialist, FPL Group.
“Excellent resource for any employee. Should be mandatory for any new employees or those who manage Projects and Budgets.” William Rochford, Sec-tion Manager IT Tech Operations, National Grid.
“Educational as well as entertaining. A great way to train new employees on basic utility accounting & finance. Instructor had an incredible amount of industry knowlege.” David Thomason, Analysis & Reporting Manager, Pacific Gas & Electric.
“Joel Berk is the only accounting instructor I know who can make accounting interesting and fun for an engineer like me. Enjoyed the course immensely.” James J. Bonner, Jr., Manager, National Grid.
www.financialaccounting.com
3811_Utility_January2014.indd 13811_Utility_January2014.indd 1 1/31/2014 9:15:59 AM1/31/2014 9:15:59 AM

UTILITY FINANCE & ACCOUNTING SEMINARS
LEARNING OBJECTIVES: To provide a working understanding of f inance & accounting as applied to the regulated util ity companies. Upon completion of the seminar (group-live) participants will be able to:-Understand accrual accounting-”Read” an annual report of the company-Calculate key financial ratios-See the link between finance & accounting & the strategic plans of the company
-Understand how a utility makes money-Analyze whether shareholder value is being created as opposed to net income-Do a capital budgeting analysis (engineering economics)
Review of Homework Modifications to Rate of Return Regulation Learning Objective: To see the many different regulatory mechanisms which are possible and the implications of alternative regulatory frameworks.
Adjustment Clauses and Cost Recovery Rates Rate FreezesDecoupling Pre-approvalsFormula Ratemaking
We discuss the many different ways of modifying the traditional rate of return regula-tory framework along with a discussion of what each accomplishes for the utility.Present Value Analysis and Exercise Learning Objective: Be able to calculate the present value of a series of cash flows.We begin with compound interest and risk and return. Then we turn around the compound interest solution to see how it becomes present value analysis. A pres-ent value problem follows.Shareholder Value MaximizationLearning Objective: Learn how to make decisions in order to increase the stock price.
TheoryMeasurement TechniquesRisk MeasurementRelationship to Accounting Performance Measures Financing Decisions, Operating Decisions & Investing Decisions
We develop the concept of shareholder value maximization as the present value of the future free cash flows. All decisions at the firm should be made by incremental analysis of the future free cash flows as impacted by the four sets of books. Illustra-tions of common financing, investing and operating decisions are used.Accounting for Utility Plant Learning Objective: Appreciation of the fact that there is ambiguity in whether costs should be capitalized or expensed and the implications of the choice.
Capitalization Versus ExpenseMethods of Capitalizing More or LessWhich is Better for the UtilityRetirement Units of Property
Straight Line DepreciationAccelerated Depreciation
We look at straight line and accelerated depreciation for the four sets of books. We discuss the issue of when to capitalize costs in terms of units of property. Some conclusions are drawn as to what would be a better method for the company--to capitalize costs or expense them.
DAY THREE: 8:00-3:00Accounting for Income Taxes Learning Objective: Understanding the accounting for tax-book differences and normalization versus flow through for ratemaking.
Temporary DifferencesWe discuss the use of normalization or flow through for ratemaking. We look at the utility’s deferred tax balances, where they came from and the ratemaking implica-tions. An illustration of the flow through regulatory asset is included. Cost of CapitalLearning Objective: To be able to calculate the two different weighted average cost of capital figures for the company, one which is used for ratemaking and the other for capital budgeting.
Cost of Debt and PreferredCost of Equity Comparable CompaniesWeighted Average Cost of Capital
After introductory material we will determine the cost of debt, preferred and equity for a utility. Two methods of determining the cost of equity will be used -- the DCF method and the risk premium approach. Testimony from rate cases will be reviewed.Capital Project Analysis Review CaseLearning Objective: Learn to do a present value analysis using incremental cash flows as impacted by the four sets of books.
Identify Incremental Cash Flows as Opposed to Accrual FiguresMeasuring Impact on Shareholder ValueSelecting the Appropriate Discount RateUse a Spread Sheet ApproachIncorporate Into the Analysis Tax and Ratemaking Impacts on Cash
FlowsShareholder Value Measurement
As a group project we will prepare a spreadsheet to see whether a capital project should be done. The groups will present answers to questions which come up in the analysis. The project and the presentations of answers is a comprehensive hands-on review of much of the material in the seminar.Conclusions
FOR NON-FINANCIAL PROFESSIONALSCourse prerequisites: none. Advanced preparation: none.
UTILITY FINANCE & ACCOUNTING FOR NONFINANCIAL PROFESSIONALSA comprehensive, 3 day, group-live seminar for nonfinancial individuals working with the utility industry or financial individuals who are new to the utility industry and who need to understand a) how the utility runs as a business b) the unique language of utility ratemaking, finance & accounting, c) the key aspects of the utility’s four sets of books d) how to understand & “read” a utility’s financial statements e) learn where the numbers come from on the balance sheet & income statement and f) how the regulators set rates & identify various features of ratemaking.This seminar will enable you to understand: 1) accrual accounting 2) tax book tempo-rary differences 3) present value analysis 4) basic financial statement analysis 5) basic rate of return regulation 6) incremental analysis for making capital budgeting decision. Program level: Basic. Recommended CPE Credits: 22.
DAY ONE: 8:00-4:00Introduction Basic Accounting Concepts
Balance SheetIncome Statement
Learning Objective: Understanding of where the numbers come from that we use at the utility to run the company (managerial accounting), prepare the financial statements, set rates and prepare the company’s tax return. This leads to gaining the insight needed to use accounting information to create shareholder value.We use a spreadsheet approach in making accounting entries for a simple utility company which avoids the use of debits and credits. This is not a simplified version of accounting but a conceptual version perfectly suited to users of accounting information as contrasted with the debit and credit approach needed for preparers of accounting information (i.e., accountants). We develop the Income Statement and Balance Sheet and discuss the significance of these. We compare our simple example with the real financial statements of the company. While doing our transactions analysis (i.e., pre-paring the spreadsheet) we discuss general accounting concepts like the cost basis of accounting, accrual accounting, accounting methods and accounting estimates. Material which may be covered in more depth later such as the Statement of Cash Flows and Tax Book Temporary Differences is introduced.Financial Statement Analysis
Return on EquityTotal Shareholder Return
Learning Objective: Mechanics of the calculations, relation to the accounting numbers used and the relation to the allowed ROE and Shareholder Value. We calculate the ratios indicated above from the financials and market price data for the sample utility while discussing the significance of each measure. The Utility’s Four “Sets of Books”Learning Objectives: Understanding of why we end up with different accounting methods and different accounting estimates for the four major uses of accounting.
GAAP, Tax, Rates, ManagerialRate Case ConceptsCost of Service RegulationRate Base, Operating Expenses, Allowed ReturnAbove-the-line versus Below-the-line Expenses
We discuss the conflicting goals of the groups who make accounting rules for the four major places where we use accounting data. This leads to a discussion of tax-book temporary differences as well as regulatory assets and liabilities. Most of the time in this session is spent on how ratemaking uses the accounting methods and estimates. We will look at the details of a rate case revenue requirement development.Role Playing Exercise -- Rate Case Learning Objective: See how different parties to the rate case are able to effectively argue their positions such that the utility can never be sure their position will prevail.
Interveners -- Consumer Group, Industrial RatepayersRate Case StepsAbove-the-Line and Below-the-Line Issues
This is a role playing exercise. Groups of 4-6 people play the roles of Consumer Ad-vocate, CEO of the Utility, Commission Staff Advisor, Large Industrial Ratepayer, CFO the Utility and the Commissioners. Each group presents arguments on why certain costs should or should not be included in rates.Ethics ConsiderationsLearning Objective: Get insight through discussion of unethical behavior at some utility companies.
HOMEWORK PROBLEM: FINANCIAL STATEMENT ANALYSISCalculation of the ratios discussed today from the financials and market price data for a real utility company.
COCKTAILS 4:30 - 5:30
DAY TWO: 8:00–4:00
3811_Utility_January2014.indd 23811_Utility_January2014.indd 2 1/31/2014 9:16:03 AM1/31/2014 9:16:03 AM

FOR FINANCIAL PROFESSIONALS
Course prerequisites: Completion of FAI’s Seminar for Non-Financial Professionals or a position in the finance, accounting or the rates area or an educational background includ-ing at least three classes in accounting. Advanced Preparation: None except preceding.
UTILITY FINANCE & ACCOUNTING FOR FINANCIAL PROFESSIONALSAn indepth three day group-live seminar for financial professionals who already work in the area of utility finance & accounting who need to enhance their understanding of critical finance & accounting skills including GAAP for utilities, capitalization versus expense, bond ratings, IFRS & accounting for taxes.Program level: Intermediate. Recommended CPE Credits: 22
DAY ONE: 8:00-4:00Calculation of ROE for the Utility Learning Objective: Mechanics of the calculation and relation to the allowed ROE. We begin before 8 am (for those who arrive early) with an individual assignment using the financial statements of a real utility company.Rate of Return Regulation Learning Objectives: Understanding of why ratemaking drives the GAAP accounting and how different accounting methods and different accounting estimates are used for four major uses of accounting.
GAAP TaxRates Managerial
We discuss the conflicting goals of the groups who make accounting rules for the four major places where we use accounting data. This leads to a preliminary discussion of tax-book temporary and permanent differences as well as ASC 980 regulatory assets and liabilities. Most of the time in this session is spent on how ratemaking uses the ac-counting methods and estimates. We will look at the details of the rate case revenue requirement development.Modifications to Rate of Return Regulation Learning Objective: To see the many different regulatory mechanisms which are possible and the implications of alternative regulatory frameworks.
Adjustment Clauses and Cost Recovery RatesRate FreezesDecouplingPre-approvalsFormula Ratemaking
We discuss the many different ways of modifying the traditional rate of return regulatory framework along with a discussion of what each accomplishes for the utility.Energy Adjustment Clauses Learning Objective: To see how adjustment mechanisms work and reduce risk at the utility.
Theory of these Ratemaking AdjustmentsExamples of Fuel, Gas and Weatherization Normalization ClausesImplications for Making Management Decisions
After an introduction to this topic and a discussion of the many different types of clauses and the different ways that they work, we work on a group project to see the implica-tions for decision making when the utility has an adjustment mechanism in place. We look at rate review proceedings concerning the adjustment clause.GAAP For Utilities Learning Objective: Understanding the applicability of ASC 980 and why its provisions make sense.
Why and How GAAP Differs from non-regulated operationsRegulatory Assets and When to Remove ThemPlant Write-Offs Under GAAP
We discuss specific pieces of GAAP with examples from the financials. We review the utility’s note on Significant Accounting Policies to see in which area the utility violates normal GAAP. We look at each of the regulatory assets and liabilities of a utility as shown on the financials and answer the question--why is this a regulatory asset or regulatory liability and not a normal asset or liability.COCKTAILS 4:30 - 5:30
DAY TWO: 8:00-4:00 Capitalization Versus Expense Learning Objective: Mastering the theory of capitalization versus expense and the motivations of managers and top management with respect to the issue.
Influences and MotivationsFinancial Reporting, Tax Accounting, Ratemaking, Managerial Ac-
countingProblems in Recovery of Plant CostsRetirement Units of Property
We discuss the impact on the numbers in the four sets of books when costs are capital-ized rather than expensed and vice versa. Using an example of plant overhaul costs we analyze the impact on rates. Plant Issues Learning Objective: Appreciation of the significance of the ratemaking estimates of the life and removal costs and how under normal conditions errors in the estimates are corrected through accumulated depreciation.
Accounting for Plant RetirementRisks of a Reserve DeficiencyAsset Retirement ObligationsMass Property Accounting
We go through the accounting for retirement of plant. This accounting differs from most
UTILITY FINANCE & ACCOUNTING SEMINARSnonregulated companies. The large regulatory liability which shows up is discussed. Also discussed is the concept of reserve deficiency.Accounting for Income Taxes Learning Objective: Understanding the accounting for tax-book differences and normalization versus flow through for ratemaking.
Permanent DifferencesTemporary Differences
We will talk about two different income tax issues; most the time is spent on the use of normalization or flow through for ratemaking. We look at the utility’s deferred tax balances, where they came from and the ratemaking implications. An illustration of the regulatory tax asset is included. A Problem of Definition Learning Objective: To recognize the different terminology used by the utility industry and by Wall Street.
Statement of Cash FlowsDifferent Definitions for New Income, Op Inc and Cash Flow
We begin with the Statement of Cash Flow. We look at how and why the utility sometimes organizes its Balance Sheet and Income Statement differently than other companies. Then we investigate the many meanings of the terms Net Income, Operating Income and Cash Flow.
DAY THREE: 8:00-3:00CWIP AND AFUDC Learning Objective: Understanding how the utility recovers its construction financ-ing costs from the ratepayers.
AFUDC versus Interest CapitalizationAnalysis of the two methods of rate setting --CWIP in rate base and CWIP not in rate base. Comparison of interest capitalization under usual GAAP and the regulated company’s method.
Accounting Methods and their Impact on Financial Metrics Learning Objective: Gain an understanding that key financial measures and ratios can be significantly influenced by alternative accounting methods and estimates.
EBITDACash FlowEPSDebt/CapitalizationLeasing Example
We will look at how key financial measures are impacted by the classification of transactions under GAAP and how the classification for ratemaking can impact rates. Examples of the difference between Operating or Capital Lease Accounting will be studied.Credit RatingLearning Objective: See how the bond raters rate the bonds of a company in order to see what we need to do as a company to improve or maintain our rating.
S&P Targets for Bond RatingCapitalization RatiosFunds Flow RatiosAdjustments to Financial Statement Figures
This is a specific example using the financial statements in financial analysis. We focus on how S&P uses ratios to determine the bond rating for a company. We compare our answer to the actual rating.
LEARNING OBJECTIVES: Professional development to enhance the understanding of critical finance and accounting skills. Upon completion of the seminar (group-live) participants will be able to: -Learn the mechanics of the calculation of ROE - Understand why different accounting methods and estimates are used
for setting rates; managerial accounting and GAAP -Learn the applicability of ASC 980 - Understand the theory of capitalization versus expense and the motiva-
tions of managers with respect to the issue -Understand the role of depreciation in ratemaking estimates - Find out how the utility recovers its construction financing costs from
ratepayers - Learn the difference between normalization versus flow through for
ratemaking
3811_Utility_January2014.indd 33811_Utility_January2014.indd 3 1/31/2014 9:16:03 AM1/31/2014 9:16:03 AM

Seminar City _________________________________Date ________________________ mo. day year
Name ____________________________________Nickname ________________________ (for Nametag)
Title ____________________________________________
Organization _______________________________________________________________
Street Address ______________________________________________________________
City/State/Zip ______________________________________________________________
Office phone ________________________ Home phone ___________________________
Email _____________________________________________________________________
Home Address _____________________________________________________________
__________________________________________________________________________
How did you learn about this seminar? ___________________________________________
CPA Information: Will you want CPE credit? ________________ In which state? _________
Fee: $1995 per person. This fee includes updated materials when relevant once every 6 months by email.
Payment Method (check one):
Check Enclosed (payable to FAI, PO Box 118, Tenafly, NJ 07670)
Charge my VISA MasterCard American Express
Card #_________________________________________________ Exp. Date_______
Signature______________________________________________________________
• Call: 201-568-0249 • Fax registration form to: 201-568-4668• Web Registration: www.financialaccounting.com• Mail registration form with check or credit card information to: Financial Accounting Institute, PO Box 118, Tenafly, NJ 07670
The Financial Accounting Institute is registered with the National Association of State Boards of Account ancy (NASBA), as a sponsor of continuing professional education on the National Registry of CPE Sponsors. State boards of accountancy have fi nal authority on the acceptance of individual courses for CPE credit. Complaints regarding sponsors may be addressed to the National Registry of CPE Sponsors, 150 Fourth Ave nue North, Suite 700, Nashville, TN 37219-2417Web site:www.nasba.org
Registration InformationSpace is limited. Please register early.• Registration includes seminar materials, continental breakfast
and lunch each day at the hotel and a reception after class the first day.
• A block of rooms is reserved at the hotel in Las Vegas and in Boston. Please call the hotel directly at the phone number be-low and mention you want a room in FAI’s block on a specific date. In Las Vegas, also mention the identity of the block by the information at the right of the date.
• Call early. The block of rooms is only held open, unless filled, until four weeks prior to each seminar. Thank you.
LAS VEGASGolden Nugget Hotel May 14-16 (FAI May#1)129 East Fremont Street May 28-30 (FAI May#2)Las Vegas, NV 89101 Oct. 15-17 (FAI Oct#1)800-634-3454 Oct. 22-24 (FAI Oct#2)
BOSTON Omni Parker House May 21-2360 School Street October 6-8Boston, MA 02108 1-800-THE-OMNI
• Cancellations with full refund are accepted up to 3 weeks prior to the seminar date, or a colleague may attend in your place at any time. FAI is not responsible for any loss or dam-age as a result of a substitution, alteration or cancellation, postponement or rescheduling of a seminar other than the refund of your registration fee.
For further information, call: 201-568-0249 www.financialaccounting.com
DR. JOEL BERK’s stimulating and intensive “mini-MBA” course for the utility industry incorporates lecture, discussion, individual and group work and homework. Dr. Berk was a professor for thirteen years at the Graduate School of Business, Columbia University. He also has taught in the EEI Rate Fundamentals Course, AGA Gas Rate Fundamentals Program, Columbia University’s Columbia Institute for Tele-Information Training Workshop, the University of Idaho’s Public Utility Executive Course, Rutger’s Executive Management Program, and for the Southeast Electric Exchange and the US State Department.
A recipient of the William H. Newman Award for Teaching Excellence and Innovation, Dr. Berk’s unique teaching style and abilities are endorsed by the thou-sands of industry professionals who have taken his courses as well as the over 200 utilities, investment banks, law firms, public utility commissions and other organizations for whom he has customized and taught on site programs.
Dr. Joel Berk will be teaching each seminar.
4 WAYS TO SIGN UP:
FAI HAS CUSTOMIZED AND TAUGHT INHOUSE PROGRAMS FOR:AGL ResourcesAlabama Public Service Comm.Alder Pollock & SheehanAllegheny PowerAltaLinkAmerenAmerican Gas AssociationAmerican Water WorksAqua AmericaArizona Public ServiceAT&T CommunicationsAtlantic ElectricAtmos EnergyAvistaBabcock & WilcoxBaltimore Gas & ElectricBELLSOUTHBlack Hills EnergyBonneville PowerBrandesBridgeport HydraulicBritish Columbia TelephoneBrooklyn Union GasCarolina Power & LightCarolina Telephone & TelegraphCenterPoint EnergyCentral Vermont Public ServiceCentury TelephoneCGCUChase Securities, Inc.Chelan County PUDChemical Bank Utility GroupChugach Electric AssociationCincinnati Gas & ElectricCINergy
ClecoCoGen TechnologiesColumbia EnergyColumbia University Exec. Prog.ConectivConsolidated EdisonConsolidated Gas TransmissionConsolidated Natural GasConstellation EnergyConsumers Gas CompanyContelCRTCDelaware PSCDelmarva PowerDetroit EdisonDistrict of Columbia PSCDept. of Energy-U.S.Dominion ResourcesDonaldson, Lufkin & JenretteDrexel Burnham LambertDuke Power Duquesne LightECO ResourcesE.F. HuttonEdison Electric InstituteEdison Mission EnergyEdmonton PowerElectric Council of New EnglandEnergy EastEntergyEtobicoke HydroFERCFireman’s FundFirstEnergy
Florida Power CorporationFlorida Power & LightFlorida PSCFortisBCGPUGrant ThorntonGreat Lakes Gas TransmissionGTE of CaliforniaGTE of the SouthGuess & RuddGulf PowerHawaii Electric Light CompanyHouston Lighting & PowerHydro OneIdaho PowerIndiana Utility Regulatory Comm.Illinois Commerce CommissionIllinois PowerIndiana Gas CompanyIndiantown CogenIntegrysIroquois PipelineITCJohnson & HigginsJones Intercable J.P. Morgan ChaseKeyspan EnergyKPMG Peat MarwickL.F. RothschildLILCOMCIManufacturers Hanover Utility Grp.Metropolitan EdisonMiddle South Utilities
MinnegascoMinnesota PowerMinnesota PSCMontana Dakota UtilitiesNational Fuel GasNational GridNCELNEINew England Electric SystemNew England TelephoneNJ Div. of Ratepayer AdvocateNJ American WaterNew Mexico PSCNew York TelephoneNewfoundland PowerNICORNiSourceNorth Central Electric LeagueNorthWestern EnergyNova Scotia PowerNYNEXNYSEGNorthern States PowerNortheast UtilitiesNorthwest Central PipelineNorthwest Territories Power Corp.Nuclear Energy InstituteNV EnergyNW NaturalOld Dominion Electric Coop.Oklahoma Gas & ElectricOmaha Public Power DistrictONEOKOntario Power Generation
Orange & Rockland UtilitiesOrlando Utilities CommissionOtter Tail PowerPacific BellPacific Gas & ElectricPacifiCorpPacific Power Utah PowerPacific TelesisPanhandle Eastern Corp.Paul, Weiss, RifkinPennsylvania ElectricPennsylvania Power & LightPECO EnergyPhiladelphia Suburban Water Co.PJM Interconnection Assoc.Potomac Electric Power CompanyPrudential-Bache SecuritiesPrudential Capital Utility GroupPSE&GPSI EnergyPublic Service Co. of ColoradoPublic Service Co. of NMPublic Service of VermontQwestRUSRutgers Executive Mgmt. ProgramSalt River ProjectSantee CooperSarnoff CorporationSAWSSDG&ESempra EnergySharylandSierra Pacific PowerSouth Central Bell
South Dakota PUCSouthern California EdisonSouthern California GasSouthern CompanySouthwestern BellSprintSwidler Berlin Shereff FriedmanSWWCTampa ElectricTexas PUCThree Cities ResearchToledo EdisonTransAlta UtilitiesTransCanada PipelinesTucson Electric PowerTVAUBS WarburgUGI UtilitiesUnited IlluminatingUniversity of Georgia-PULPUniversity of Idaho-PUECU.S. Generating CompanyU.S. Dept. of EnergyU.S. State Dept.-Omsk, RussiaUS WestUtilicorpVermont Dept. of Public ServiceVermont Public Service BoardVirginia PowerWe EnergiesWisconsin ElectricWisconsin Public Service Corp.WUTCXcel EnergyYankee Energy
INSTRUCTOR:
3811_Utility_January2014.indd 43811_Utility_January2014.indd 4 1/31/2014 9:16:03 AM1/31/2014 9:16:03 AM