Embed Size (px)
Citation preview
DMD#35147
1
Utility of inter-system extrapolation factors (ISEFs) in early reaction phenotyping and the
quantitative extrapolation of human liver microsomal intrinsic clearance using
recombinant cytochrome P450s
Yuan Chen, Liling Liu, Khanh Nguyen, and Adrian J. Fretland
Department of Drug Metabolism and Pharmacokinetics, Roche – Pal Alto, LLC (Y.C., L.L.,
K.N., A.F.)
DMD Fast Forward. Published on December 8, 2010 as doi:10.1124/dmd.110.035147
Copyright 2010 by the American Society for Pharmacology and Experimental Therapeutics.
This article has not been copyedited and formatted. The final version may differ from this version.DMD Fast Forward. Published on December 8, 2010 as DOI: 10.1124/dmd.110.035147
at ASPE
T Journals on January 11, 2020
dmd.aspetjournals.org
Dow
nloaded from
DMD#35147
2
Running title: Scaling Recombinant Cytochrome P450 Data using ISEFs
Address for correspondence: Dr. Yuan Chen
Department of Drug Metabolism and Pharmacokinetics
Genentech, A Member of the Roche Group
M/S 41 2A
1 DNA Way,
South San Francisco, CA 94080
Tel: (650) 467-6707
FAX: (650) 467-3487
Email: [email protected]
Number of Text pages: 25
Number of Tables: 7
Number of Figures: 4
Number of References: 18
Words in Abstract: 238
Words in Introduction: 510
Words in Discussion: 1498
Abbreviations: ISEF, Inter-system Extrapolation Factors; rhCYP, recombinant human
cytochrome P450; HLM, human liver microsomes; CLint, intrinsic clearance
This article has not been copyedited and formatted. The final version may differ from this version.DMD Fast Forward. Published on December 8, 2010 as DOI: 10.1124/dmd.110.035147
at ASPE
T Journals on January 11, 2020
dmd.aspetjournals.org
Dow
nloaded from
ABSTRACT: Reaction phenotyping using recombinant human CYP450s has great utility in early discovery.
However, to fully realize the advantages of using recombinant expressed P450s, the
extrapolation of data from recombinant systems to human liver microsomes (HLM) is required.
In this study, inter-system extrapolation factors (ISEF) were established for CYP1A2, CYP2C8,
CYP2C9, CYP2C19, CYP2D6, and CYP3A4 using 11 probe substrates, based on substrate
depletion and/or metabolite formation kinetics. The ISEF values for CYP2C9, CYP2D6, and
CYP3A4 determined using multiple substrates were similar across substrates. When using
enzyme kinetics of metabolite formation for CYP1A2, 2C9, 2D6, 3A4, the ISEFs determined
were generally within 2-fold of that determined based on substrate depletion. Validation of
ISEFs was conducted using ten marketed drugs by comparing the extrapolated data with
published data. The major isoforms responsible for the metabolism were identified, and the
contribution of the predominant CYPs was similar to that of previously reported data.
Additionally, phenotyping data from internal compounds, extrapolated using the rhCYP-ISEF
method, were comparable to that obtained using a HLM-based inhibition assay approach.
Moreover, the CLint calculated from extrapolated rhCYP data correlated well with measured
HLM CLint. The ISEF method established in our laboratory provides a convenient tool in early
reaction phenotyping for situations where the HLM-based inhibition approach is limited by low
turnover and/or unavailable metabolite formation. Furthermore, this method allows for
quantitative extrapolation of HLM intrinsic clearance from rhCYP phenotyping data
simultaneously to obtaining the participating metabolizing enzymes.
This article has not been copyedited and formatted. The final version may differ from this version.DMD Fast Forward. Published on December 8, 2010 as DOI: 10.1124/dmd.110.035147
at ASPE
T Journals on January 11, 2020
dmd.aspetjournals.org
Dow
nloaded from
DMD#35147
4
INTRODUCTION Identification of drug metabolizing enzymes is critical in assessing potential drug interactions
and human pharmacokinetic variation. Quantitative in vitro reaction phenotyping data can be
obtained through studies using chemical inhibitors in human liver microsomes or expressed
cytochrome P450 (CYP) isoforms. Recombinant human CYPs (rhCYPs) have been used
increasingly in early discovery due to their availability and simplicity; however, translation of
this type of data directly to a contribution to metabolism in human liver microsomes can be
problematic. The disconnect can be attributed to intrinsic differences between rhCYP and HLM
systems and include, variability in intrinsic activity or turnover number (activity per unit amount
of CYP enzyme) among different rhCYP expression systems and HLM, differences in the
expression level of accessory proteins between recombinant systems and HLM (primarily
cytochrome P450 reductase and cytochrome b5), and importantly the abundance of the
respective CYP isoforms (Crespi, 1995, Crespi and Miller, 1999, Venkatakrishnan et al., 2000).
Proper consideration and correction of these factors is necessary when scaling reaction
phenotyping data generated from rhCYP systems to HLM.
The use of intersystem extrapolation factors (ISEFs) integrates the variables of intrinsic activity
and accessory protein expression between two systems (Proctor et al., 2004). When calculating
the ratio of metabolic rates in rhCYP and HLM for ISEF, the turnover numbers in HLM are
expressed as per pmole CYP by including the hepatic CYP abundance. This approach allows the
prediction of metabolism due to the variability of CYP abundance in HLM and rhCYP systems.
ISEF values may vary widely depending on the rhCYP expression system, HLM preparation,
probe substrate selected, and/or assay conditions used in each laboratory (Proctor et al., 2004). In
previous studies, ISEF’s were defined with respect to either Vmax of metabolite formation of a
This article has not been copyedited and formatted. The final version may differ from this version.DMD Fast Forward. Published on December 8, 2010 as DOI: 10.1124/dmd.110.035147
at ASPE
T Journals on January 11, 2020
dmd.aspetjournals.org
Dow
nloaded from
DMD#35147
5
probe substrate or CLint calculated from metabolite formation enzyme kinetics, CLint=Vmax/Km,
(Proctor et al., 2004). Additionally, the extrapolation of rhCYP data measured as either
metabolite formation or substrate depletion using extrapolation factors calculated from kinetic
data of metabolite formation has been used for reaction phenotyping (Crespi, 1995, Nakajima et
al., 1999, Venkatakrishnan et al.,2000) and CLint prediction (Emoto et al., 2006). However,
extrapolation of substrate depletion data of test compounds obtained in rhCYP using
extrapolation factors (such as ISEF) determined based on substrate depletion of probe substrate
hasn’t been previously reported, and could be a more practical approach in drug discovery.
In the present study, we determined ISEF for the six most prominent CYPs responsible for drug
metabolism, CYP1A2, CYP2C8, CYP2C9, CYP2C19, CYP2D6, and CYP3A4. The ISEF values
were determined using multiple substrates and three different methods, substrate depletion (CLint)
and metabolite formation enzyme kinetics (Vmax, and CLint=Vmax/Km). Using rhCYP-ISEF
extrapolation, we estimated the relative contribution of the major CYP isoforms to the overall
metabolism for ten marketed drugs and ten internal compounds. In addition, we explored a novel
approach in which the intrinsic clearance in rhCYPs is extrapolated using ISEF determined based
on substrate depletion to an intrinsic clearance in human liver microsomes. The overall
extrapolation accuracy for CYP contribution and CLint prediction between ISEFs determined
using different approaches were compared.
This article has not been copyedited and formatted. The final version may differ from this version.DMD Fast Forward. Published on December 8, 2010 as DOI: 10.1124/dmd.110.035147
at ASPE
T Journals on January 11, 2020
dmd.aspetjournals.org
Dow
nloaded from
DMD#35147
6
Materials and Methods
Chemicals and Biological Reagents: Probe substrates and associated metabolites for CYP1A2
CYP2C8, CYP2C9, CYP2C19, CYP2D6, and CYP3A4 (Table 1) were purchased from BD
Bioscience (San Jose, CA). NADPH, DMSO, formic acid, acetic acid, acetonitrile and methanol
were purchased from Sigma-Aldrich (St. Louis, MO). All other chemicals were of the highest
grade commercially available.
Recombinant expressed CYPs and control preparations from baculovirus-infected Sf9 insect
cells (supersomes) were purchased from BD Gentest (Woburn, MA). Cytochrome c reductase
was co-expressed in all preparations, and cytochrome b5 was expressed in cDNA-expressed
CYP2C8, 2C9, 2C19, and 3A4. Human liver microsomes, 50-donor pool, were purchased from
BD Gentest.
Incubations in rhCYP450s and HLM: The substrate and protein concentrations for the CLint
determinations used in ISEF calculation are summarized in Table 1. The probe substrate
concentrations were chosen to be below Km so that the depletion of substrate is predominantly
through a specific CYP pathway. Reaction mixtures were prepared containing phosphate buffer
(50 mM, pH 7.4), magnesium chloride (5 mM), recombinant supersomes or HLM, and probe
substrates according to final concentrations listed in Table 1. The mixture was pre-incubated at
37°C for five minutes before transferring to Biomek 2000 liquid handler (Beckman Coulter,
Fullerton, CA) for subsequent processing and incubation. Reactions were initiated by the
addition of NADPH (2 mM), and terminated by addition of one volume of acetonitrile at pre-
determined time points (0, 5, 10, 20 min). Following quenching, one volume of sample was
transferred to an injection plate containing one volume of 0.1% acetic acid in water with internal
This article has not been copyedited and formatted. The final version may differ from this version.DMD Fast Forward. Published on December 8, 2010 as DOI: 10.1124/dmd.110.035147
at ASPE
T Journals on January 11, 2020
dmd.aspetjournals.org
Dow
nloaded from
DMD#35147
7
standard (100 ng/mL, 7-hydroxy coumarin). The quenched reaction mixtures were centrifuged,
and supernatants were collected, and analyzed using LC-MS/MS.
The CLint in rhCYP for marketed drugs used in the validation (Table 2) and internal compounds
were determined following similar incubation conditions mentioned previously. The test
compounds (0.1 or 1.0 µM) were incubated with six CYPs plus insect control. All experiments
included six probe substrate incubations that were used as positive controls. The CLint was
calculated based on parent compound percentage remaining normalized to insect control. The
CLint in each CYP was scaled to CLint in HLM using ISEF and the CYP contributions (fm) were
calculated using the equations shown in the data analysis section.
The enzyme kinetics (Km and Vmax) of selected probe substrates for CYP1A2 (phenacetin),
CYP2C9 (diclofenac), CYP2D6 (bufuralol), and CYP3A4 (midazolam) were determined in
HLM and recombinant CYPs based on the formation of the isoform specific metabolites (Table
1) at concentrations ranging from 0.1 to 100 µM using similar incubation procedures. The Vmax
and CLint, calculated based on CLint =Vmax/Km, were used for the ISEF calculation (see data
analysis section)
Human liver microsomal inhibition studies were performed using isoform selective chemical
inhibitors or inhibitory antibodies, furafylline (1A2), sulfaphenazole (2C9), quinidine (2D6),
ketoconazole (3A4), and antibodies to either CYP2C8 or CYP2C19. Reaction mixtures were
prepared containing phosphate buffer (50 mM, pH 7.4), magnesium chloride (5 mM), HLM (0.5
mg/mL), and chemical or inhibitory antibody. The mixture was pre-incubated at 37°C for five
minutes. Reactions were initiated by the addition of NADPH (2 mM), and terminated by addition
of acetonitrile at pre-determined time points (0, 5, 10, 20 min). Intrinsic clearance (CLint) were
determined based on substrate depletion, and the percentage contribution of each CYP isozyme
This article has not been copyedited and formatted. The final version may differ from this version.DMD Fast Forward. Published on December 8, 2010 as DOI: 10.1124/dmd.110.035147
at ASPE
T Journals on January 11, 2020
dmd.aspetjournals.org
Dow
nloaded from
DMD#35147
8
were calculated based on the changes of CLint in the presence and absence of isoform specific
inhibitors.
HPLC-MS/MS Analysis: The HPLC system consisted of Shimadzu Prominence LC-20AD
binary pumps (Shimadzu, Columbia, MD), a HTC PAL autosampler (Leap Technologies,
Carrboro, NC), and a BDS Hypersil C18 column (50 x 2.1 mm). The mobile phase contained
0.1% formic acid in water with 5 mM ammonium acetate (A), and 0.1% formic acid in
acetonitrile/methanol (1:1) (B). The gradient was as following: 5% mobile phase B was held for
1.0 minute followed by an increase to 90% over 3 minutes. The total flow was 0.4 mL/min and
the sample injection volume was 10 µL.
The API 4000 Mass Spectrometer (AB SCIEX, Foster City, CA) equipped with the ESI source
was used for the detection of marker substrates and its metabolites using MRM transitions at
optimized MS conditions. The system was operated by Analyst 1.4.1 software (AB SCIEX,
Foster City, CA).
Data Analysis:
Calculation of CLint. The percentage remaining of parent drug at each incubation time was
calculated. The slope (reaction rate) was obtained from the linear regression of the natural log %
parent remaining versus time plot. The CLint was calculated by normalizing the rate to the
amount of CYP (pmole/mL) or HLM protein (mg/mL).
Estimation of Km and Vmax. Non-linear curve fitting was performed using WinNonlin v5.2
(Pharsight, Mountain View, CA). The Km and Vmax was estimated using the simple Emax model
(E=Emax*C / C+EC50, where Emax represents Vmax; EC50 represents Km; C represents [S] substrate
concentration; and E represents the rate of metabolism).
This article has not been copyedited and formatted. The final version may differ from this version.DMD Fast Forward. Published on December 8, 2010 as DOI: 10.1124/dmd.110.035147
at ASPE
T Journals on January 11, 2020
dmd.aspetjournals.org
Dow
nloaded from
DMD#35147
9
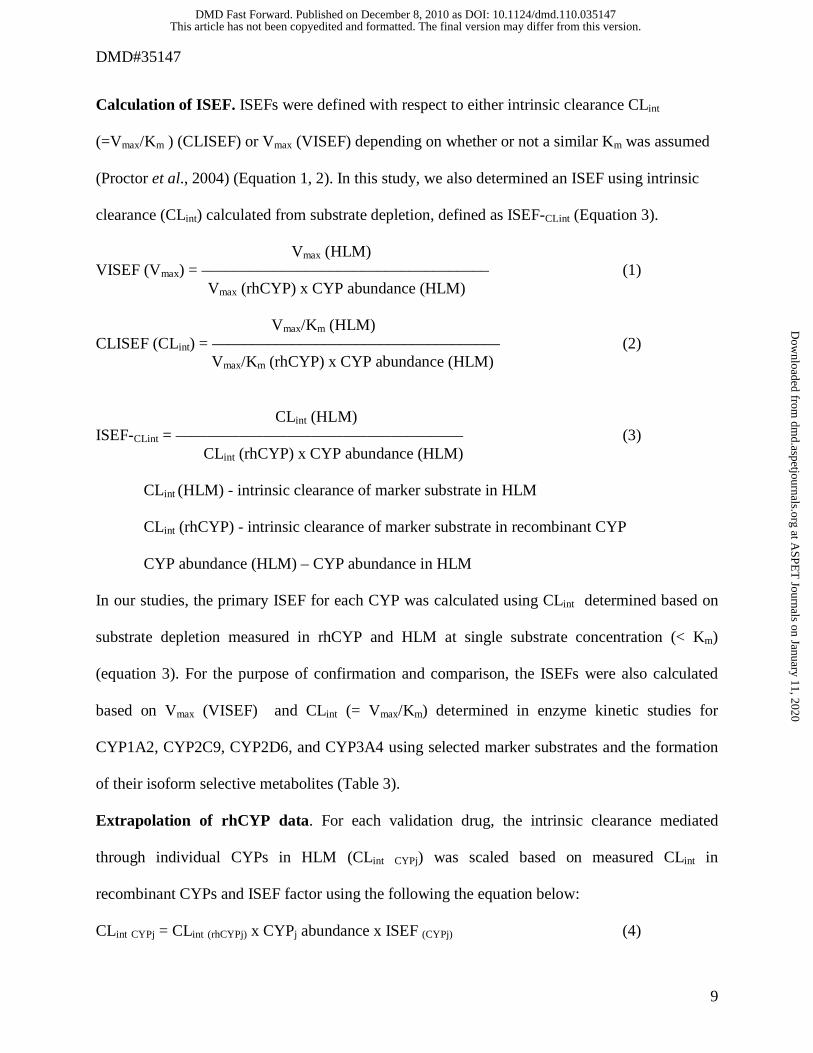
Calculation of ISEF. ISEFs were defined with respect to either intrinsic clearance CLint
(=Vmax/Km ) (CLISEF) or Vmax (VISEF) depending on whether or not a similar Km was assumed
(Proctor et al., 2004) (Equation 1, 2). In this study, we also determined an ISEF using intrinsic
clearance (CLint) calculated from substrate depletion, defined as ISEF-CLint (Equation 3).
Vmax (HLM) VISEF (Vmax) = –––––––––––––––––––––––––––––––––––– (1) Vmax (rhCYP) x CYP abundance (HLM) Vmax/Km (HLM) CLISEF (CLint) = –––––––––––––––––––––––––––––––––––– (2) Vmax/Km (rhCYP) x CYP abundance (HLM) CLint (HLM) ISEF-CLint = –––––––––––––––––––––––––––––––––––– (3) CLint (rhCYP) x CYP abundance (HLM) CLint (HLM) - intrinsic clearance of marker substrate in HLM
CLint (rhCYP) - intrinsic clearance of marker substrate in recombinant CYP
CYP abundance (HLM) – CYP abundance in HLM
In our studies, the primary ISEF for each CYP was calculated using CLint determined based on
substrate depletion measured in rhCYP and HLM at single substrate concentration (< Km)
(equation 3). For the purpose of confirmation and comparison, the ISEFs were also calculated
based on Vmax (VISEF) and CLint (= Vmax/Km) determined in enzyme kinetic studies for
CYP1A2, CYP2C9, CYP2D6, and CYP3A4 using selected marker substrates and the formation
of their isoform selective metabolites (Table 3).
Extrapolation of rhCYP data. For each validation drug, the intrinsic clearance mediated
through individual CYPs in HLM (CLint CYPj) was scaled based on measured CLint in
recombinant CYPs and ISEF factor using the following the equation below:
CLint CYPj = CLint (rhCYPj) x CYPj abundance x ISEF (CYPj) (4)
This article has not been copyedited and formatted. The final version may differ from this version.DMD Fast Forward. Published on December 8, 2010 as DOI: 10.1124/dmd.110.035147
at ASPE
T Journals on January 11, 2020
dmd.aspetjournals.org
Dow
nloaded from
DMD#35147
10
CYPj – the jth CYP isoform tested/analyzed
CLint CYPj – Intrinsic clearance by CYPj in HLM (μl/min/mg_protein)
CLint (rhCYPj) – Intrinsic clearance in rh CYPj (μl/min/pmole_CYP)
CYPj abundance – abundance of CYPj (pmole_CYP/mg_protein)
ISEF (CYPj) – ISEF for CYPj
Calculation of extrapolated human liver microsome intrinsic clearance (HLM CLint). The
Clint in HLM was extrapolated from scaled rhCYP data as following:
n
CLint HLM = ∑CLint CYPj (5) j=1
CLint CYPj – Extrapolated intrinsic clearance by CYPj in HLM (μl/min/mg_protein)
Calculation of contribution of each CYPs. The involvement and contribution of each CYP in
HLM, was calculated as follows:
n % contribution, CYPj = CLint CYPj / ∑ (CLint CYPj) (6) J=1
Statistical analysis. The correlation between measured and ISEF extrapolated CLint and the
variability of extrapolated data using ISEF determined from different approaches were evaluated.
The correlation coefficient (R), root mean square error (RMSE), and mean residual sum (MRS)
were calculated using data analysis tool (Microsoft EXCEL 2003) based on equations 7 and 8.
The RMSE was calculated to compare variables between different ISEF extrapolated data and
directly measured data. A smaller RMSE indicates less variability between the two methods. The
MRS was used to measure the bias of different methods. A negative value indicates under-
estimation and a positive value indicates over-estimation.
This article has not been copyedited and formatted. The final version may differ from this version.DMD Fast Forward. Published on December 8, 2010 as DOI: 10.1124/dmd.110.035147
at ASPE
T Journals on January 11, 2020
dmd.aspetjournals.org
Dow
nloaded from
DMD#35147
11
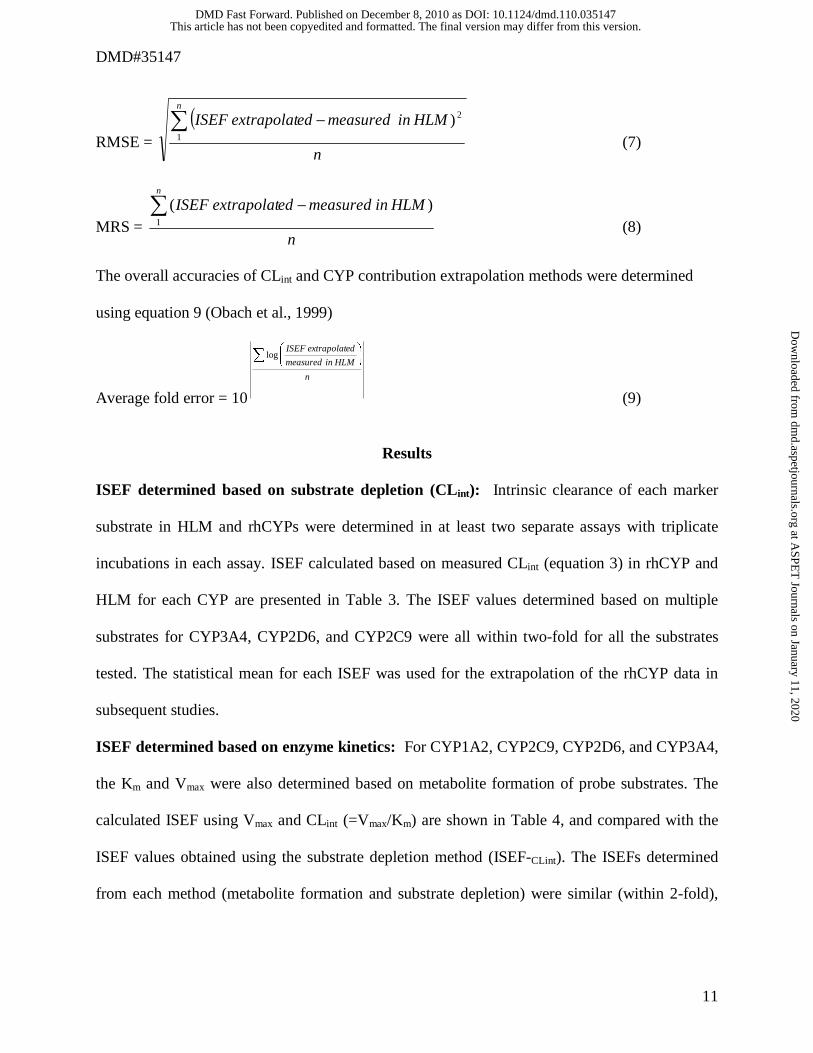
RMSE = (
n
HLMinmeasurededextrapolatISEFn
∑ −1
2) (7)
MRS = n
HLMinmeasurededextrapolatISEFn
∑ −1
)( (8)
The overall accuracies of CLint and CYP contribution extrapolation methods were determined
using equation 9 (Obach et al., 1999)
Average fold error = 10
n
HLMinmeasured
edextrapolatISEF∑ ⎟⎟
⎠
⎞⎜⎜⎝
⎛log
(9)
Results
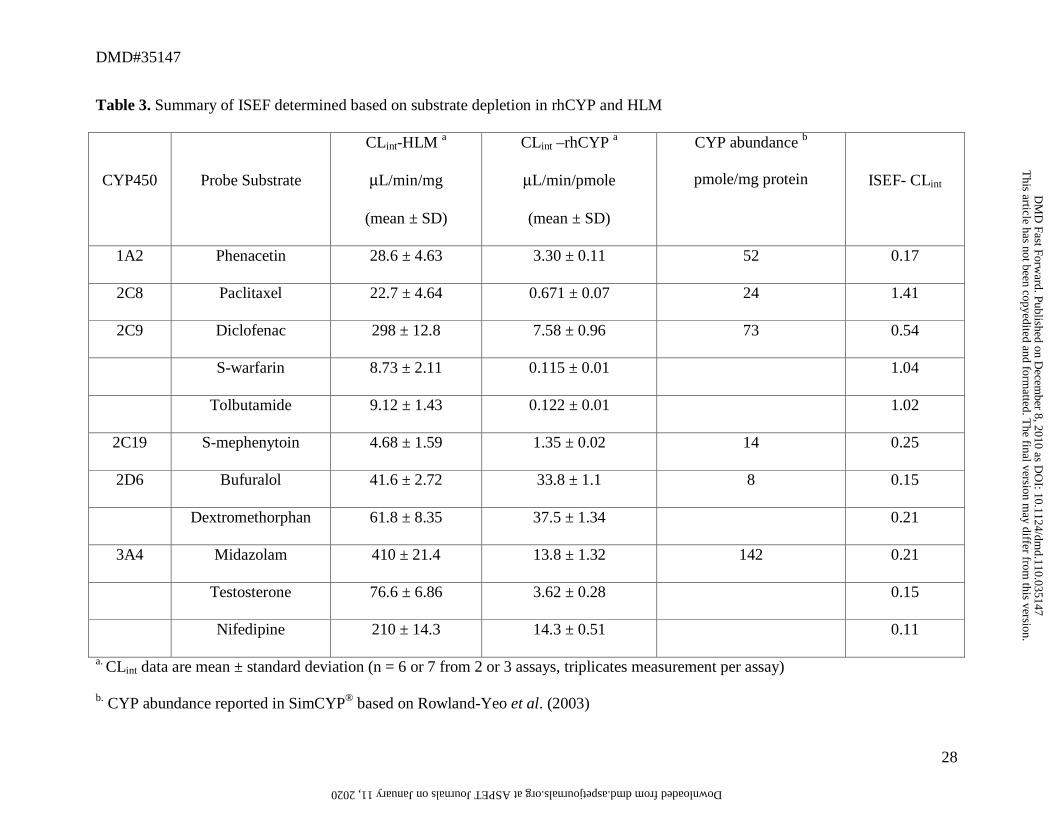
ISEF determined based on substrate depletion (CLint): Intrinsic clearance of each marker
substrate in HLM and rhCYPs were determined in at least two separate assays with triplicate
incubations in each assay. ISEF calculated based on measured CLint (equation 3) in rhCYP and
HLM for each CYP are presented in Table 3. The ISEF values determined based on multiple
substrates for CYP3A4, CYP2D6, and CYP2C9 were all within two-fold for all the substrates
tested. The statistical mean for each ISEF was used for the extrapolation of the rhCYP data in
subsequent studies.
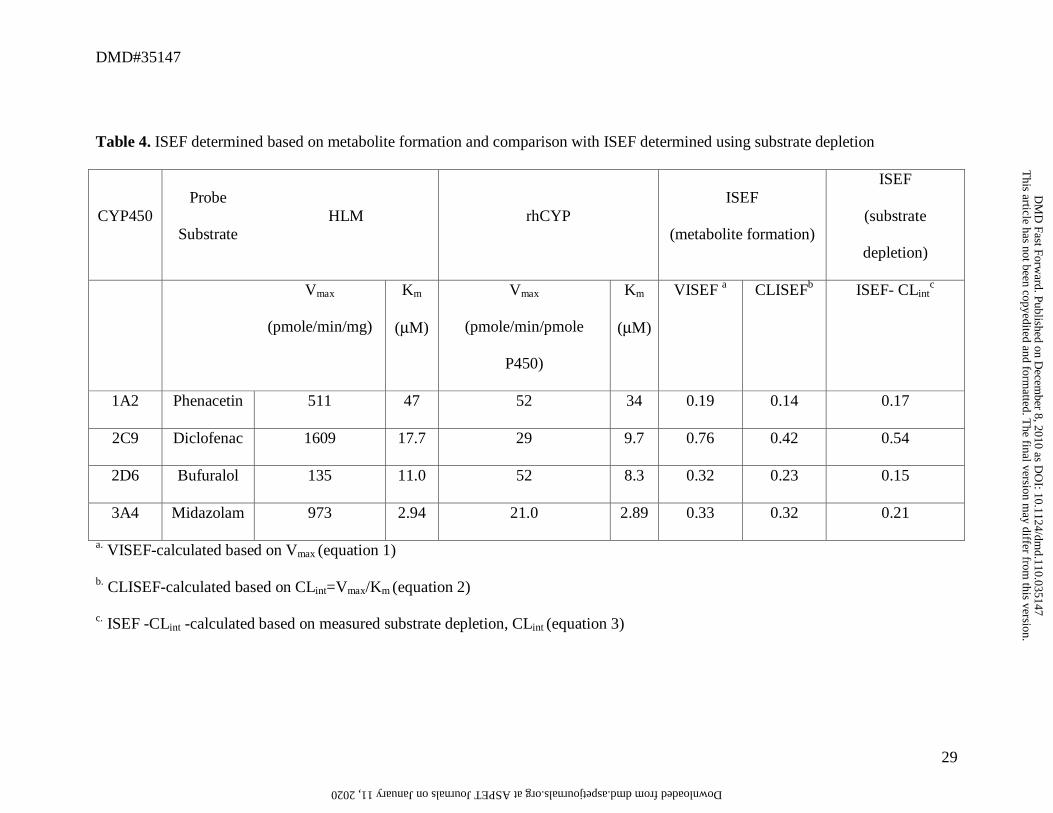
ISEF determined based on enzyme kinetics: For CYP1A2, CYP2C9, CYP2D6, and CYP3A4,
the Km and Vmax were also determined based on metabolite formation of probe substrates. The
calculated ISEF using Vmax and CLint (=Vmax/Km) are shown in Table 4, and compared with the
ISEF values obtained using the substrate depletion method (ISEF-CLint). The ISEFs determined
from each method (metabolite formation and substrate depletion) were similar (within 2-fold),
This article has not been copyedited and formatted. The final version may differ from this version.DMD Fast Forward. Published on December 8, 2010 as DOI: 10.1124/dmd.110.035147
at ASPE
T Journals on January 11, 2020
dmd.aspetjournals.org
Dow
nloaded from
DMD#35147
12
with the exception of the VISEF for CYP2D6, which was slightly greater than 2-fold when
compared to the ISEF-CLint.
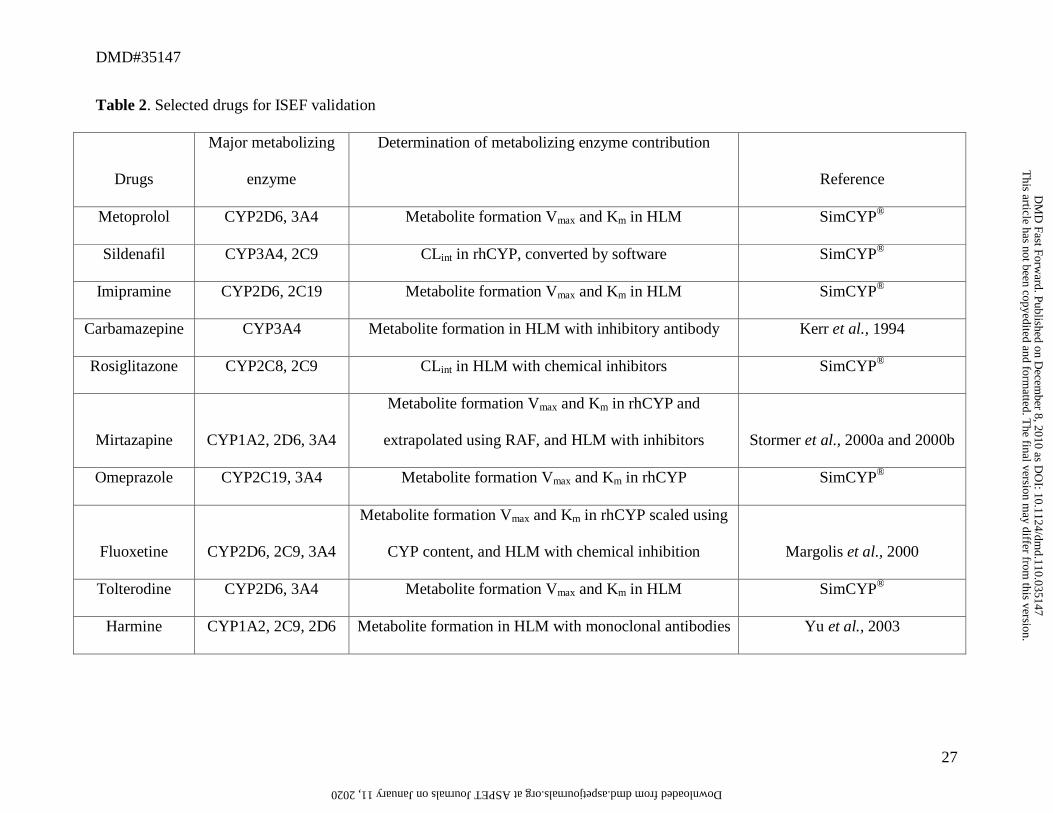
Validation of ISEF: Ten compounds were selected for the validation of in-house generated
ISEFs (Table 2). These compounds were chosen based on available literature data and multiple
CYPs contributing to their metabolism. The CLint determined in each recombinant CYP isoform
were extrapolated to HLM CLint using ISEF (Equation 4). The sum of extrapolated HLM CLint
by each CYP represents the total HLM CLint and was used for the calculation of percent
contribution by each isoform (Equation 5 and 6). The contribution of individual CYP isoforms to
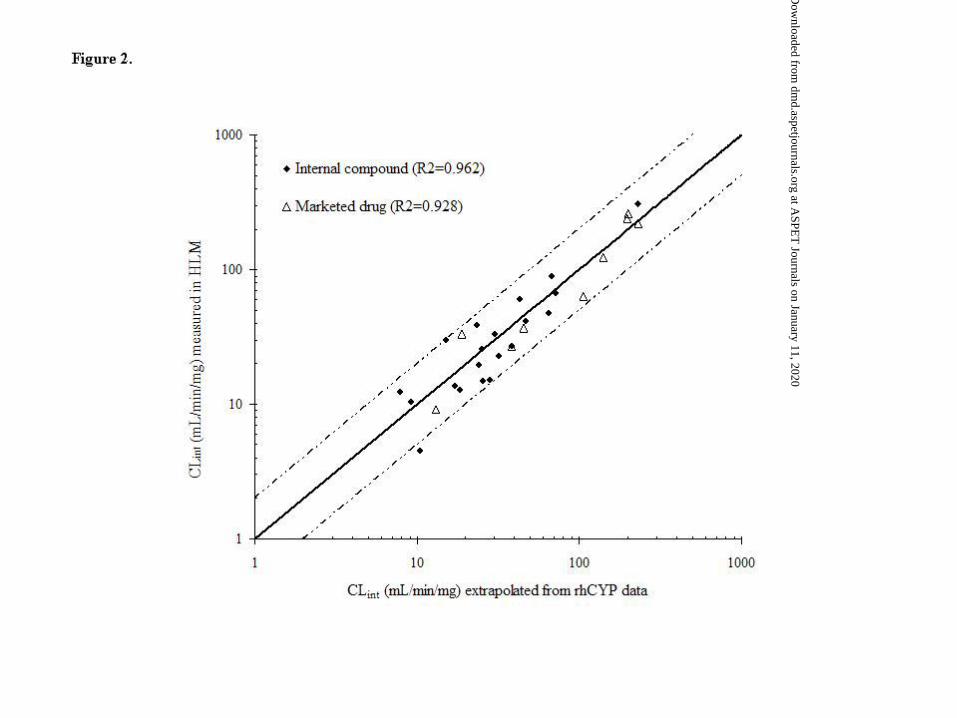
the metabolism was determined and compared with reported data (Figure 1). The total HLM
CLint based on extrapolated data (using ISEF-CLint) was also compared with the measured HLM
CLint data to insure no major CYP pathways were missed (all within 2-fold), and a good
correlation (R2=0.928) was observed (Figure 2).
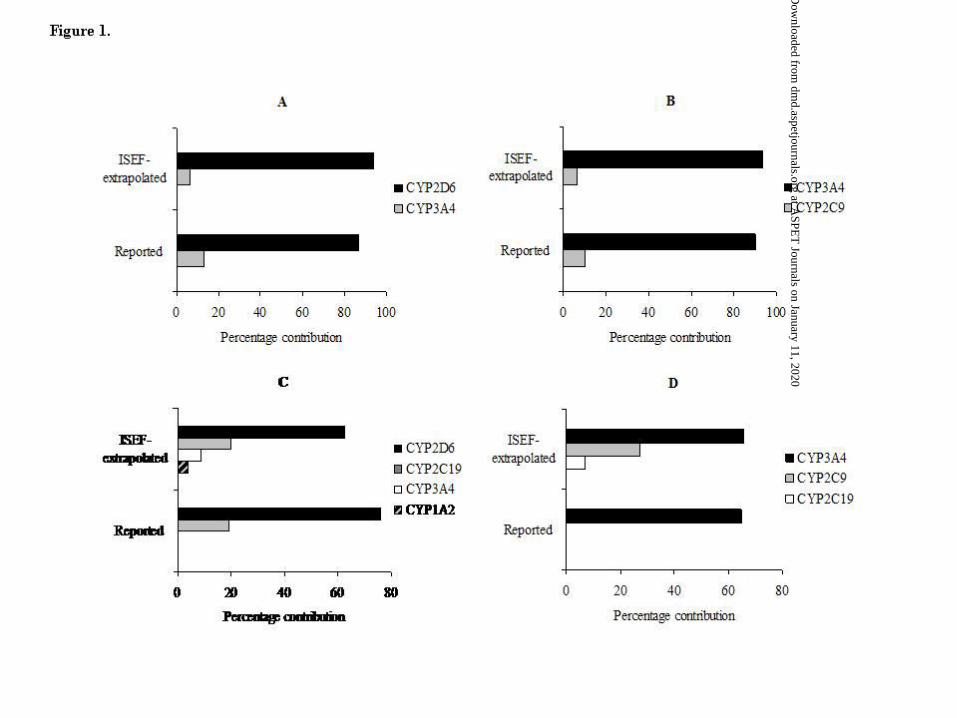
In general, the CYP profile obtained using rhCYP-ISEF extrapolation approach is in good
agreement with reported data. For all drugs tested, the major CYP isoforms responsible for the
HLM metabolism was identified, and the contribution of predominant CYPs to total metabolism
are similar to previously reported data. Considering the relatively high variability of phenotyping
data reported across different laboratories, data generated from these studies using the rhCYP-
ISEF approach fall in the range that are well accepted.
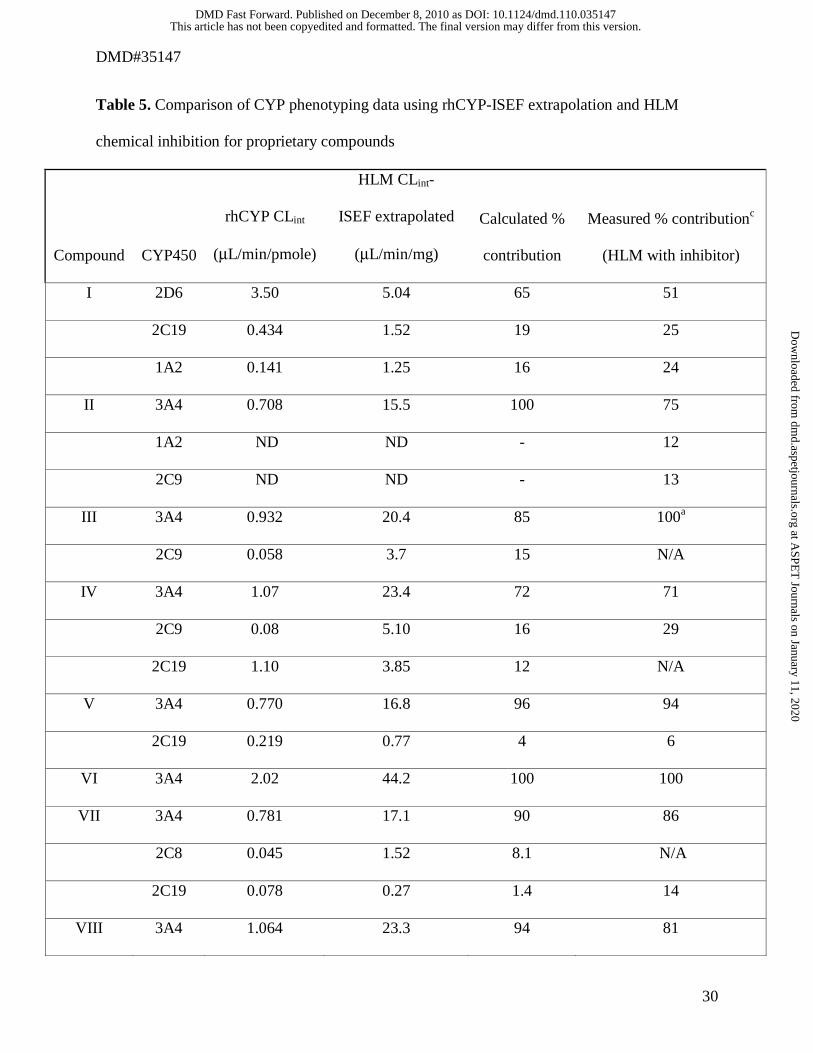
rhCYP-ISEF extrapolated data for internal compounds: Data from a retrospective analysis
of more than a dozen proprietary compounds were used as a test set to gain confidence in the use
of ISEF generated in house. For ten internal compounds, full phenotyping data previously
obtained from a HLM assay using chemical inhibition were compared with the data extrapolated
using rhCYP-ISEF method, and presented in Table 5. The percentage contribution of each CYP
This article has not been copyedited and formatted. The final version may differ from this version.DMD Fast Forward. Published on December 8, 2010 as DOI: 10.1124/dmd.110.035147
at ASPE
T Journals on January 11, 2020
dmd.aspetjournals.org
Dow
nloaded from
DMD#35147
13
extrapolated from the rhCYP assay and measured from HLM chemical inhibition assay were
compared. The data obtained from both methods are comparable regarding the major
contributing isoform and their contribution to the total CLint in HLM. For twenty internal
compounds, the CLint by each CYP in HLM was obtained using rhCYP-ISEF (ISEF-CLint)
extrapolation. The sum of CLint by each CYP in HLM, representing extrapolated intrinsic CLint
in HLM, was compared with measured HLM CLint. A good correlation (R2=0.962) was observed
and all extrapolated data were within 2-fold of the corresponding HLM CLint values (Figure 2).
Discussion
The accurate prediction of CYP isoform contribution to a specific transformation in the
metabolism of a drug can be challenging, especially in early drug discovery as often the detailed
metabolic pathway and complete structural information of metabolites are usually unavailable. In
practice, determination of relative contribution of major isoforms has been done using changes in
substrate depletion in the presence and absence of selective CYP inhibitors. This approach can
be problematic for compounds that have a low CLint. Often times, the use of rhCYP isoforms can
overcome this challenge by providing a system with greater metabolic activity when compared
with HLM. However, the scaling of data generated from recombinant CYP incubations
introduces other confounding factors. The use of ISEFs has been proposed as a method to
extrapolate these types of data, and utilizing ISEFs established in an individual laboratory is
necessary (Proctor et al., 2004).
Based on the level of confidence in the rhCYP-ISEF extrapolation required, ISEF values can be
derived using either substrate depletion or metabolite formation enzyme kinetics. For early
reaction phenotyping, an approach that incorporates a moderate confidence level with higher
This article has not been copyedited and formatted. The final version may differ from this version.DMD Fast Forward. Published on December 8, 2010 as DOI: 10.1124/dmd.110.035147
at ASPE
T Journals on January 11, 2020
dmd.aspetjournals.org
Dow
nloaded from
DMD#35147
14
throughput compatibility is more appropriate. In our study, for the first time, we used a single
substrate concentration (< Km) and measured substrate depletion in both rhCYP and HLM as a
primary method for ISEF determination. The substrate depletion method is based on the
assumptions that the probe substrate is highly selective to the isozyme at the concentration below
Km and the effect of non-specific microsomal binding on the Km in rhCYP and HLM can be
ignored. In our studies, an identical protein concentration was used in both incubations;
therefore the latter assumption is reasonable. The ISEF for six CYPs were generated based on
substrate depletion ISEF-Clint and compared with the ISEF determined using the more traditional
method, metabolite formation (VISEF, CLISEF) (Table 4). The VISEF tended to be slightly
higher than that determined based on measured substrate depletion (ISEF-CLint), but are well
within 2-fold for CYP1A2, 2C9 and 3A4, and slightly over two-fold for CYP2D6. The CLISEF
values determined based on CLint (= Vmax /Km), are generally lower than VISEF, and well within
two-old of that determined based on measured CLint (ISEF-CLint) for all four CYPs (Table 4).
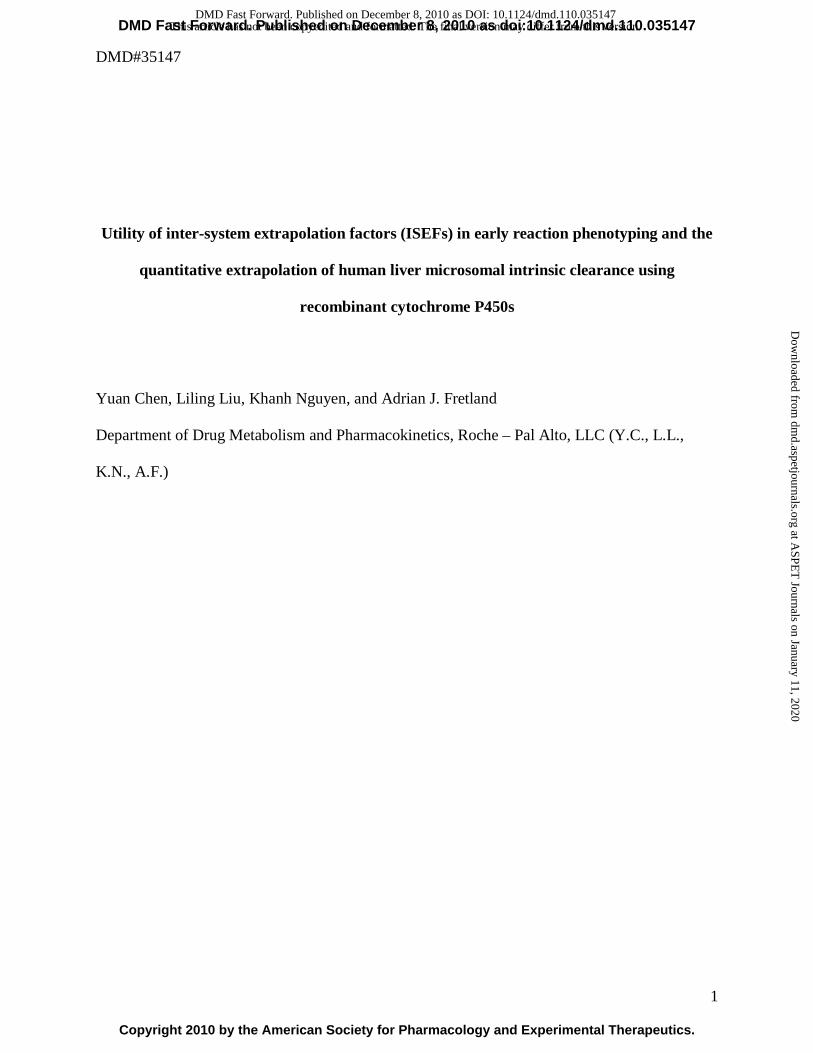
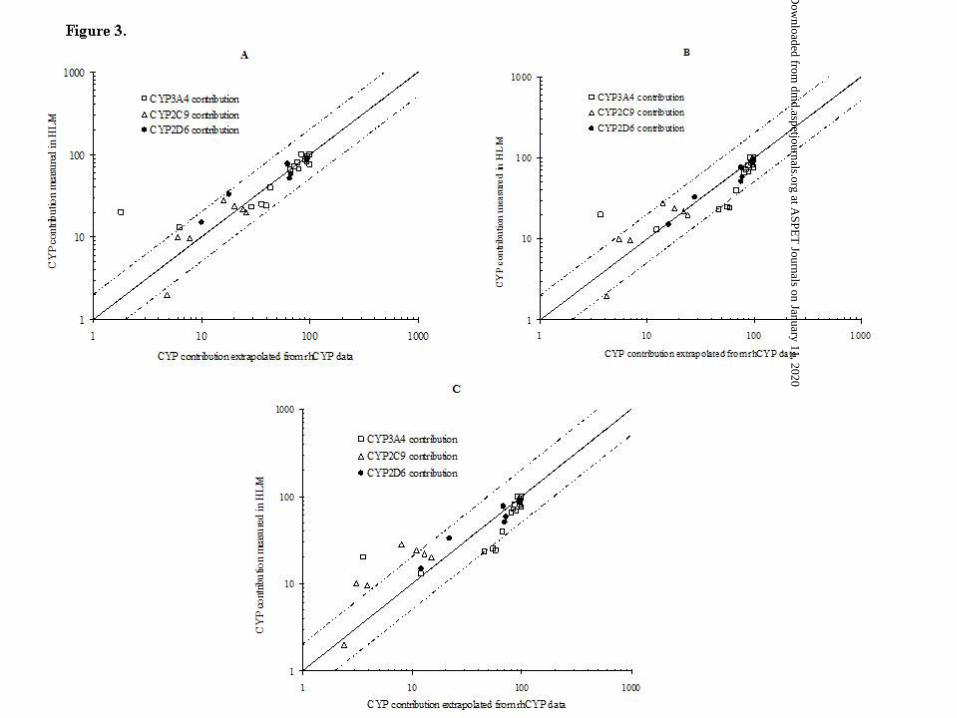
The contributions of CYP3A4, CYP2C9, and CYP2D6 extrapolated using ISEF-CLint, VISEF,
and CLISEF were compared with directly measured data (using HLM inhibition assay or
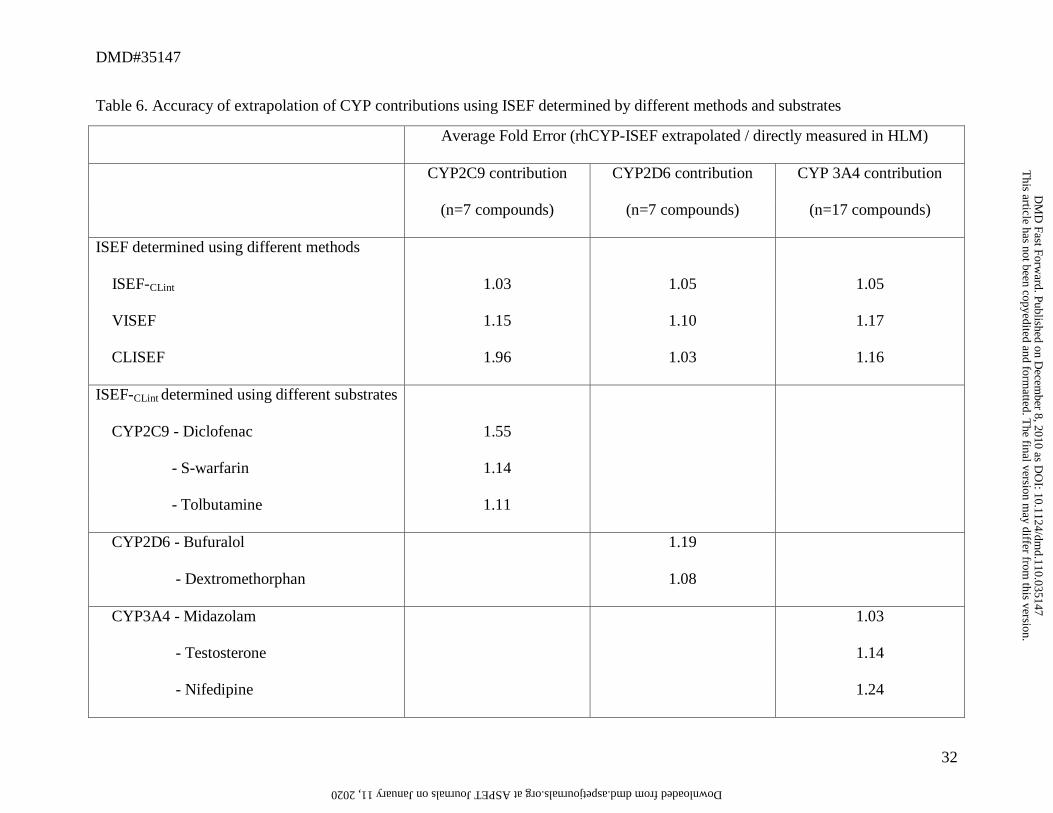
metabolite formation as reported) (Figure 3). Additionally, the overall extrapolation accuracy for
each ISEF methods was evaluated and is presented in Table 6. The average fold error values for
the three different approaches in the ISEF determination and for all three CYPs were less than 2-
fold. For CYP3A4 and CYP2C9, extrapolation using ISEF-CLint had a better accuracy, whereas,
for CYP2D6, the extrapolation accuracy using the three different ISEFs was similar (Table 6,
Figure 3). Using the CLISEF yielded relatively poor extrapolation accuracy when compared
directly to the measured data for CYP2C9 (average fold error 1.96). Theses data suggest that
substrate depletion method is a suitable alternative to traditional approaches.
This article has not been copyedited and formatted. The final version may differ from this version.DMD Fast Forward. Published on December 8, 2010 as DOI: 10.1124/dmd.110.035147
at ASPE
T Journals on January 11, 2020
dmd.aspetjournals.org
Dow
nloaded from
DMD#35147
15
Considering the possible substrate dependency of ISEF, we tested multiple substrates for
CYP2C9, 2D6, and 3A4 in its ISEF determination. With all other conditions set, the change of
substrate, alone, resulted in a less than two-fold difference in ISEF values for CYP2C9, 2D6, and
3A4. The contribution of CYP3A4 extrapolated using ISEFs determined from three substrates,
CYP2C9 from three substrates, and CYP2D6 from two substrates were compared with the
directly measured data (Table 6). For CYP3A4 and CYP2D6, the extrapolation using ISEF
determined from the different substrates provided a similar extrapolation accuracy (Table 6). For
CYPC9, the extrapolation accuracy using the ISEF determined from diclofenac yielded a
relatively poor extrapolation accuracy as compared to the other two probe substrates. Since there
are a number of factors that can differ in determining ISEF values, including the recombinant
and HLM system, substrate, and assay conditions between each laboratory, the combination of
these variant could easily cause 10- to 100-fold difference in ISEF values (Proctor et al., 2004).
For preliminary phenotyping determinations, an average ISEF from multiple substrate
measurement can be used.
The relative contribution of each CYP isoform to the overall metabolism is a function of
substrate concentration depending on the metabolic pathway. Reaction phenotyping at high
substrate concentrations may not reflect the relative importance of the isoform at the
therapeutically relevant concentrations. The ISEF extrapolation of CLint in individual CYP
isoforms at low substrate concentrations provided a reasonable prediction of the major CYP
isoform contributing to the metabolism in our data set. For example, the metabolism of
mirtazapine is reported to involve five CYP isoforms through at least three metabolic pathways
(Stormer et al. 2000a and 2000b). Stormer et al. concluded that the relative contribution from
three major isoforms, CYP1A2, 2D6, and 3A4, is concentration dependent in each metabolic
This article has not been copyedited and formatted. The final version may differ from this version.DMD Fast Forward. Published on December 8, 2010 as DOI: 10.1124/dmd.110.035147
at ASPE
T Journals on January 11, 2020
dmd.aspetjournals.org
Dow
nloaded from
DMD#35147
16
pathway, ranging from 15 to 50% at concentrations of 0.1 to 5 µM. CYP2C8 and 2C9 contribute
less than 10% to mirtazapine metabolism (Stormer et al. 2000a and 2000b). Our study using the
ISEF approach based on mirtazapine substrate depletion at 1 µM in rhCYPs predicted a 32%
contribution of CYP1A2, 17% of CYP2D6, and 34% of CYP3A4. The ISEF extrapolation
predicted an 11% contribution of CYP2C8, and less than 10% from CYP2C19. Our studies
indicated no contribution of CYP2C9. The data presented in these studies demonstrate the utility
of ISEF approach in phenotyping of drugs with multi-enzyme biotransformation pathways.
A potential application of the ISEF approach in early drug discovery is the prediction of
metabolic clearance in human liver microsome with information of predominant contributing
isoforms to the intrinsic clearance. Assuming all major metabolizing enzymes were identified
and their contributions were quantified using rhCYP-ISEF method, the addition of contribution
of each CYP to the metabolism would be close to total CLint in HLM. Based on the data obtained
from our studies, there is a good correlation between the ISEF-CLint extrapolated CLint and HLM
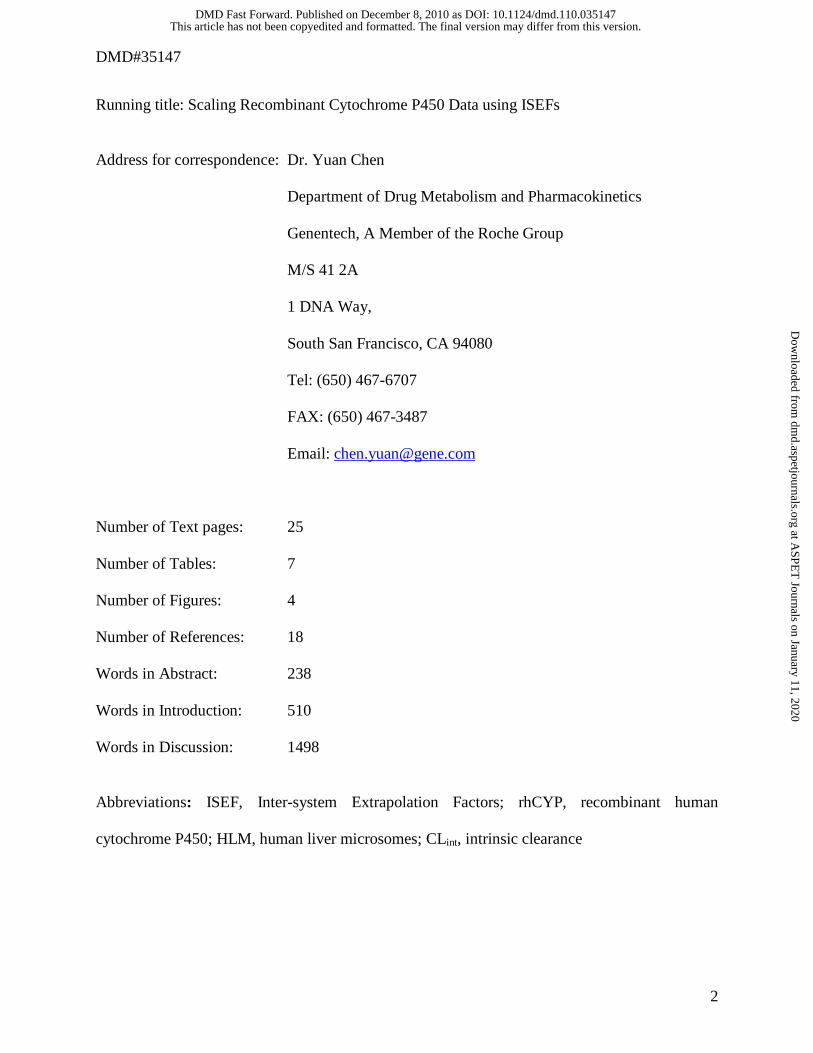
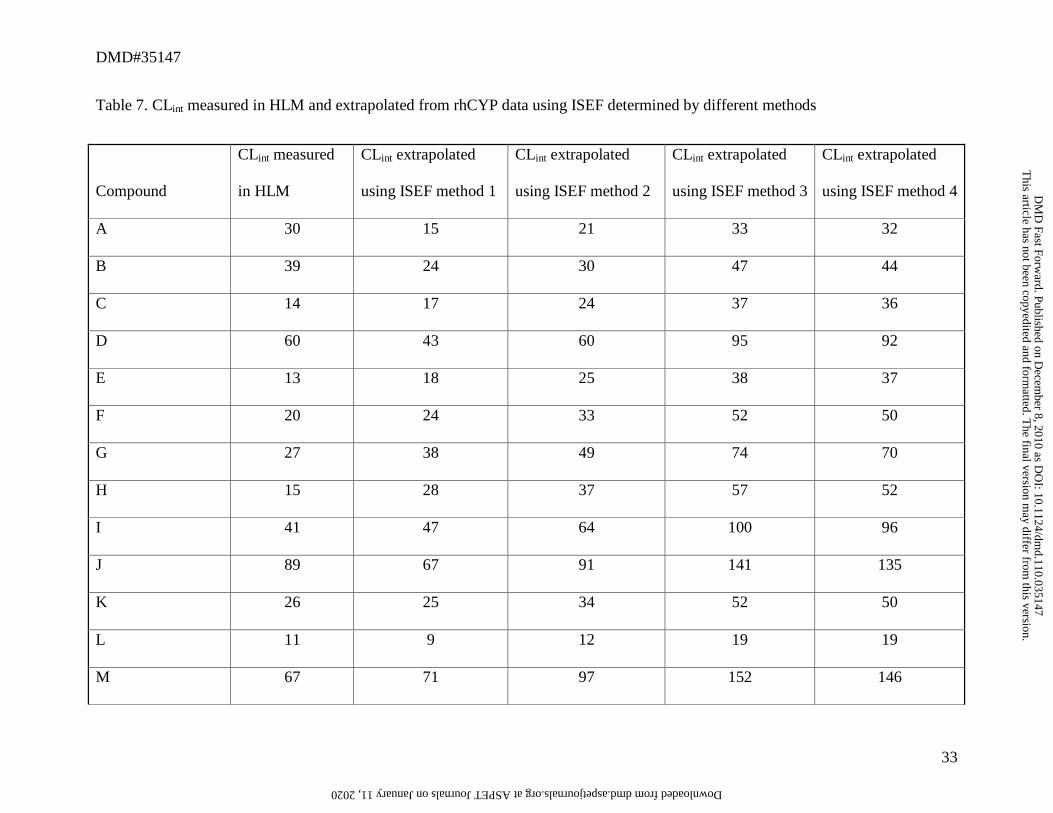
measured data (Figure 2). Additionally, the correlation and variability between HLM measured
data and extrapolated data using the ISEFs from different approaches for twenty two compounds
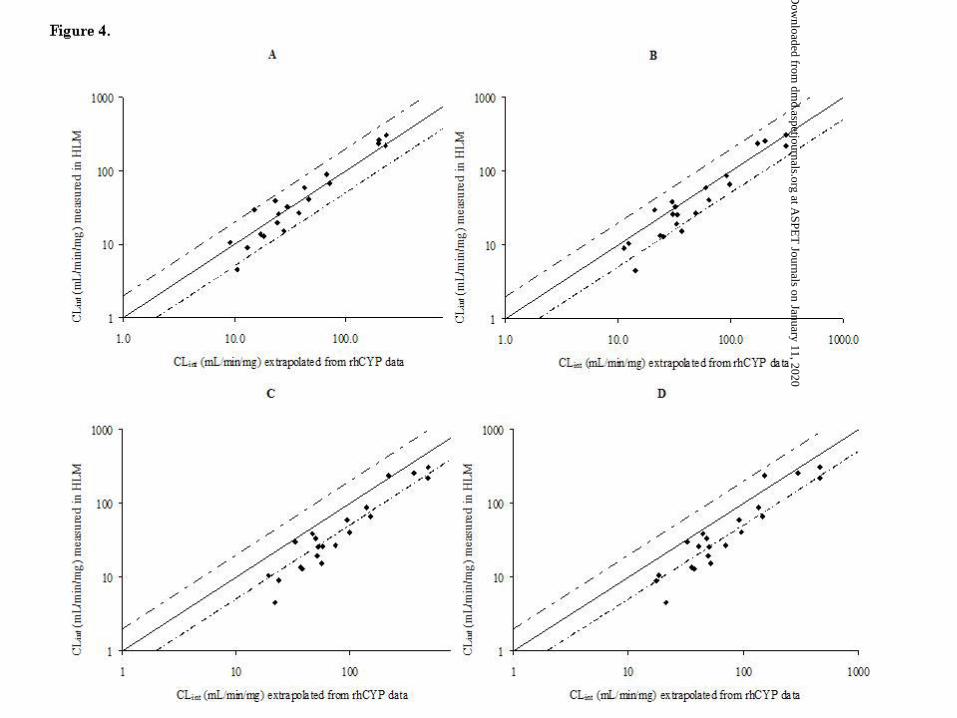
that are mainly metabolized (>90%) by CYP1A2, 2C9, 2D6 and 3A4 were analyzed (Table 7 and
Figure 4). The extrapolated CLint using ISEF determined based on substrate depletion (R2 =
0.966 using ISEF-CLint mean value of multiple substrates, Figure 4A, R2 = 0.901 using ISEF-CLint
from single substrate, Figure 4B) is better correlated with CLint measured in HLM than those
extrapolated using ISEF based on enzyme kinetics of single substrate (R2 = 0.888 using VISEF,
Figure 4C, and R2 = 0.821 using CLISEF, Figure 4D). Nearly 90% of extrapolated data using
ISEF-CLint were within a 2-fold range of HLM data, and near uniformly distributed about unity.
Approximately 50% of extrapolated data using VISEF and CLISEF were more than 2-fold
This article has not been copyedited and formatted. The final version may differ from this version.DMD Fast Forward. Published on December 8, 2010 as DOI: 10.1124/dmd.110.035147
at ASPE
T Journals on January 11, 2020
dmd.aspetjournals.org
Dow
nloaded from
DMD#35147
17
higher than those measured in HLM. Additionally, the RMSE values for the extrapolations using
ISEF-CLint were smaller than those using VISEF and CLISEF, indicating less variability between
ISEF-CLint extrapolated data and HLM measured data (Table 7). Of the four ISEF approaches
established in this study, the extrapolation using mean value of ISEF determined based on
substrate depletion gave the best extrapolation accuracy (average fold error of 1.03). Overall,
these data provided information for both HLM metabolic CLint and major CYP contributions to
the metabolic clearance. Incorporating the rhCYP data and ISEF into modeling and simulation
software, such as SimCYP®, provides convenient tools for the understanding the in vitro-in vivo
correlation (Howgate et al. 2006).
Other approaches that have been used in scaling phenotyping data generated from rhCYP system
to HLM include incorporation of CYP450 abundance factors and relative activity factor (RAF)
(Crespi, 1995, Crespi and Penman, 1997, Crespi and Miller, 1999, Venkatakrishnan et al., 2000).
When using CYP450 abundance factors, typically the average abundance of each CYP in human
liver is used, and the differences in intrinsic activity or accessory protein expression between the
two systems are not corrected. This may lead to an under or over-estimation of contribution due
to differences in activity between different recombinant isoforms. The RAF approach has been
successfully used to estimate CYP isoform contribution to drug metabolism in several
laboratories (Kobayashi et al., 1997, von Moltke et al., 1998, Venkatakrishnan et al., 1998,
Nakajima et al., 1999). The use of RAF scaling factors in the prediction of metabolism due to
variability of CYP abundance between the HLM and rhCYP systems can be difficult (Proctor et
al., 2004).
In conclusion, this method would not provide a replacement for more traditional approaches
using chemical inhibition or correlation analysis; rather it would serve as an additional tool for
This article has not been copyedited and formatted. The final version may differ from this version.DMD Fast Forward. Published on December 8, 2010 as DOI: 10.1124/dmd.110.035147
at ASPE
T Journals on January 11, 2020
dmd.aspetjournals.org
Dow
nloaded from
DMD#35147
18
reaction phenotyping when traditional approaches are not feasible for compounds with low
turnover in HLM. This approach would also provide quantitative extrapolated HLM intrinsic
clearance data along with reaction phenotyping data. Additionally, these studies provide added
support for the ISEF approach in early reaction phenotyping, but also suggest additional aspects
that will aid in the characterization of drugs in later stage development.
This article has not been copyedited and formatted. The final version may differ from this version.DMD Fast Forward. Published on December 8, 2010 as DOI: 10.1124/dmd.110.035147
at ASPE
T Journals on January 11, 2020
dmd.aspetjournals.org
Dow
nloaded from
DMD#35147
19
Acknowledgement
The author’s would like to thank Mario Monshouwer for his constructive discussions and
suggestions on this work.
This article has not been copyedited and formatted. The final version may differ from this version.DMD Fast Forward. Published on December 8, 2010 as DOI: 10.1124/dmd.110.035147
at ASPE
T Journals on January 11, 2020
dmd.aspetjournals.org
Dow
nloaded from
DMD#35147
20
Authorship Contribution
Participated in research design: Chen, Liu, Nguyen, Fretland
Conducted experiments: Liu, Nguyen
Performed data analysis: Chen
Wrote or contributed to the writing of the manuscript: Chen, Fretland
This article has not been copyedited and formatted. The final version may differ from this version.DMD Fast Forward. Published on December 8, 2010 as DOI: 10.1124/dmd.110.035147
at ASPE
T Journals on January 11, 2020
dmd.aspetjournals.org
Dow
nloaded from
DMD#35147
21
References
Crespi CL (1995) Xenobiotic metabolizing human cells as tools for pharmacological and
toxicological research. Adv Drug Res. 26: 179-235
Crespi CL and Penman BW (1997) Use of cDNA-expressed human cytochrome P450 enzymes
to study potential drug-drug interactions. Adv. Pharmacol 43:171-188
Crespi CL and Miller VP (1999) Use of heterologously expressed drug metabolizing enzymes -
state of the art and prospects for the future. Pharmacol Ther 84: 121-131.
Emoto C, Murase S, and Iwasaki K (2006) Approach to the prediction of the contribution of
major cytechrome P450 enzymes to drug metabolism in the early drug-discovery stage.
Xenobiotica 36 (8): 671-683
Howgate EM, Rowland-Yeo K, Proctor NJ, Tucker GT, and Rostami-Hodjegan A (2006)
Prediction of in vitro drug clearance from in vitro data, I: Impact of inter-individual
variability. Xenobiotica 36 (6): 473-497
Kerr MB, Thummel KE, Wurden CJ, Klein SM, Kroetz DL, Gonzalez FJ, and Levy RH (1994)
Human liver carbamazepine metabolism. Biochemical Pharmacology 47(11): 1969-1979
Kobayashi K, Chiba K, Yagi T, Shimada N, Taniguch T, Horie T, Tani M, Yamamoto T,
Ishizaki T, and Kuroiwa Y (1997) Identification of cytochrome P450 isoforms involved
in citalopram N-demethylation by human liver microsomes. J Pharmacol Exp Ther 280:
927-933
Margolis JM, O’Donnell JP, Mankowski DC, Ekins S, and Obach RS (2000) (R), (S), and
racemic fluoxitine N-demethylation by human cytochrome P450 enzymes. Drug Metab
Dispos 28: 1187-1191.
This article has not been copyedited and formatted. The final version may differ from this version.DMD Fast Forward. Published on December 8, 2010 as DOI: 10.1124/dmd.110.035147
at ASPE
T Journals on January 11, 2020
dmd.aspetjournals.org
Dow
nloaded from
DMD#35147
22
Nakajima M, Nakamura S, Tokudome S, Shimada N, Yamazaki H, and Yokoi T (1999)
Azelastine N-demethylation by cytochrome P-450 (CYP)3A4, CYP2D6, and CYP1A2 in
human liver microsomes: Evaluation of approach to predict the contribution of multiple
CYPs. Drug Metab Dispos 27:1381-1391.
Obach RS (1999) Prediction of human clearance of twenty-nine drugs from hepatic microsomal
intrinsic clearance data: an examination of in vitro half-life approach and nonspecific
binding to microsomes. Drug Metab Dispos 27: 1350 - 1359
Proctor NJ, Tucker GT, and Rostami-Hodjegan A (2004) Predicting drug clearance from
recombinantly expressed CYPs: intersystem extrapolation factors. Xenobiotica 34(2):
151-178.
Rowland-Yeo K, Rostami-Hodjega A, and Tucker GT (2003) Abundance of cytochromes P450
in human liver: a meta-analysis. British Journal of Clinical Pharmacology 57 (5): 687-
688.
Stormer E, Von Moltke LL, and Greenblatt DJ (2000a) Scaling drug biotransformation data from
cDNA-Expresssed cytpchrome P450 to human liver: A comparison of relative activity
factors and human liver abundance in studies of Mirtazapine metabolism. J Pharmacol
Exp Ther 295:793-801.
Stormer E, Von Moltke LL, Shader RI, and Greenblatt DJ (2000b) Metabolism of the
antidepressant Mirtazapine in vitro: contribution of cytochromes P-450 1A2, 2D6, and
3A4. Drug Metab Dispos 28: 1168-1175.
Venkatakrishnan K, Von Moltke LL and Greenblatt DJ (1998) Relative quantities of catalytically
active CYP2C9 and 2C19 in human liver microsomes: Application of the relative activity
factor approach. J Pharm Sci 87:845-853
This article has not been copyedited and formatted. The final version may differ from this version.DMD Fast Forward. Published on December 8, 2010 as DOI: 10.1124/dmd.110.035147
at ASPE
T Journals on January 11, 2020
dmd.aspetjournals.org
Dow
nloaded from
DMD#35147
23
Venkatakrishnan K, von Moltke LL, Court MH, Harmatz JS, Crespi CL and Greenblatt DJ (2000)
Comparison between CYP content and relative activity approaches to scaling from
cDNA-expressed cytochromes P450 to human liver microsomes: ratios of accessory
proteins as sources of discrepancies between the approaches. Drug Metab. Dispos.
28:1493-1504
von Moltke LL, Greenblatt DJ, Grassi JM, Granda BW, Venkatakrishnan K , Schmider J,
Harmatz JS, and Shader RI (1998) Multiple human cytochromes contribute to
biotransformation of dextromethorphan in-vitro: Role of CYP2C9, CYP2C19, CYP2D6,
and CYP3A. J Pharm Pharmacol 50: 997-1004
Yu A-M, Idle JR, Krausz KW, Kupfer A, and Gonzalez FJ (2003) Contribution of individual
cytochrome P450 Isozyme to the O-demethylation of the psychotropic β-carboline
alkaloids harmaline and harmine. J Pharmacol Exp Ther 305:315-322.
This article has not been copyedited and formatted. The final version may differ from this version.DMD Fast Forward. Published on December 8, 2010 as DOI: 10.1124/dmd.110.035147
at ASPE
T Journals on January 11, 2020
dmd.aspetjournals.org
Dow
nloaded from
DMD#35147
24
Footnotes page Current Affiliation: Y.C. Department of Drug Metabolism and Pharmacokinetics, Genentech, Inc., South San
Francisco, California
L.L, A.F. Department of Drug Metabolism and Pharmacokinetics, Roche - Nutley, Nutley, New
Jersey
Portions of this work were presented at the 16th Annual ISSX meeting in Baltimore, Maryland
(2009)
This article has not been copyedited and formatted. The final version may differ from this version.DMD Fast Forward. Published on December 8, 2010 as DOI: 10.1124/dmd.110.035147
at ASPE
T Journals on January 11, 2020
dmd.aspetjournals.org
Dow
nloaded from
DMD#35147
25
Figure Legends:
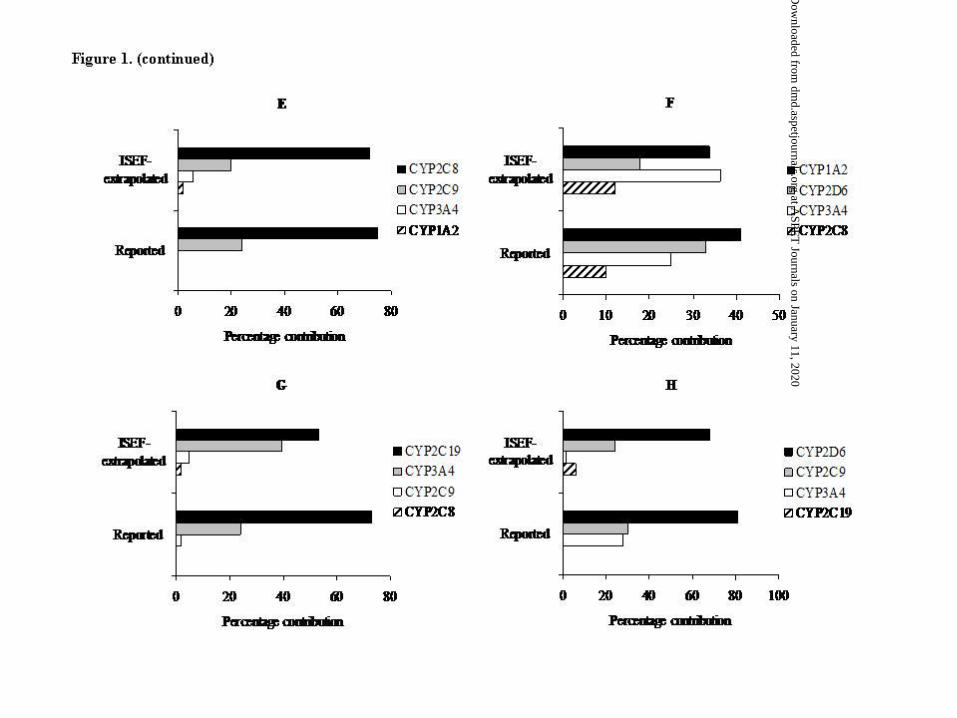
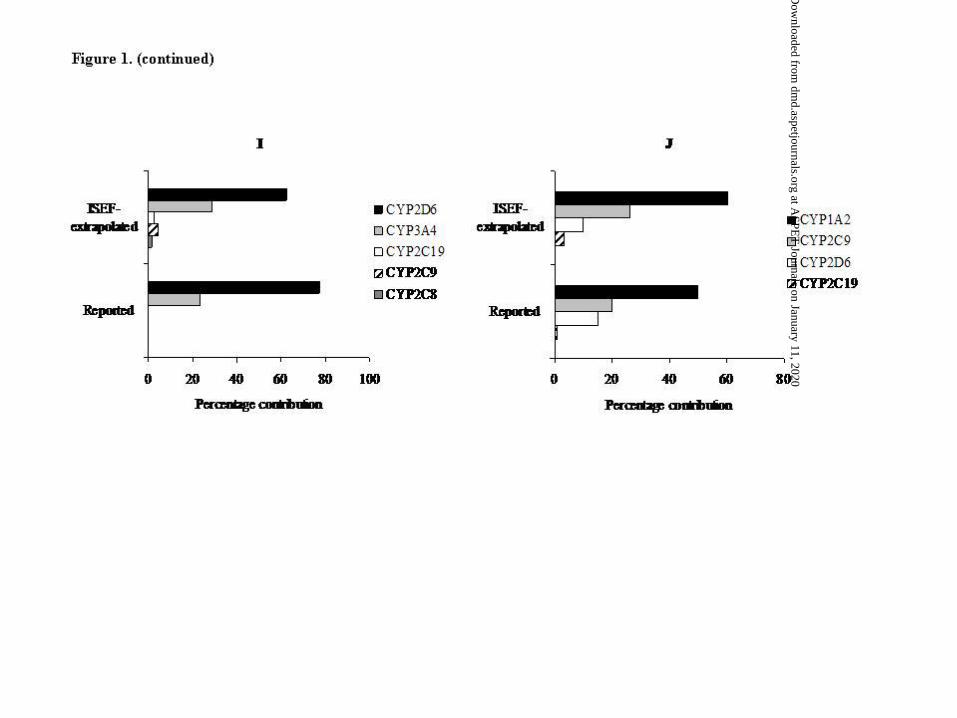
Figure 1. Reaction phenotyping data for ten validation drugs – comparison of ISEF-extrapolated
data with reported data. A - Metoprolol (SIMCYP®); B –Sildenafil (SIMCYP®); C –Imipramine
(SIMCYP®); D –Carbamazepine (Kerr et al. 1994 ); E –Rosiglitazone (SIMCYP®); F –
Mirtazapine (Stormer et al. 2000b ); G –Omeprazole (SIMCYP®); H –Fluoxetine (Margolis et al.
2000); I –Tolterodine ( SIMCYP®); J –Harmine (Yu et al. 2003). The ISEFs used in the
extrapolations are the value determined based on substrate depletion. For CYPs, when multiple
probe substrates were used, the mean value of ISEF was used (Table 3).
Figure 2. Correlation between Clint extrapolated using ISEF-CLint from rhCYP data and measured
in HLM for all validation drugs and internal compounds tested
Figure 3. Correlation between CYP contribution extrapolated using different ISEF methods and
that measured using HLM inhibition methods. A – extrapolations based on ISEF-CLint; B –
extrapolations based on VISEF; C – extrapolations based on CLISEF
Figure 4. Correlation between intrinsic clearance (CLint) extrapolated using the different ISEF
approaches and measured in HLM for twenty two compounds metabolized predominantly (>90%)
by CYP1A2, 2C9, 2D6, and 3A4. A – ISEF determined based on substrate depletion (ISEF-CLint),
mean ISEF value for CYP2C9, 2D6, and 3A4 using multiple substrates; B - ISEF determined
based on substrate depletion (ISEF-CLint) of single substrate for CYP2C9 (diclofenac), CYP2D6
(bufuralol), and CYP3A4 (midazolam); C - ISEF determined based on metabolite formation
enzyme kinetics, VISEF; D - ISEF determined based on metabolite formation enzyme kinetics,
CLISEF
This article has not been copyedited and formatted. The final version may differ from this version.DMD Fast Forward. Published on December 8, 2010 as DOI: 10.1124/dmd.110.035147
at ASPE
T Journals on January 11, 2020
dmd.aspetjournals.org
Dow
nloaded from
DMD#35147
26
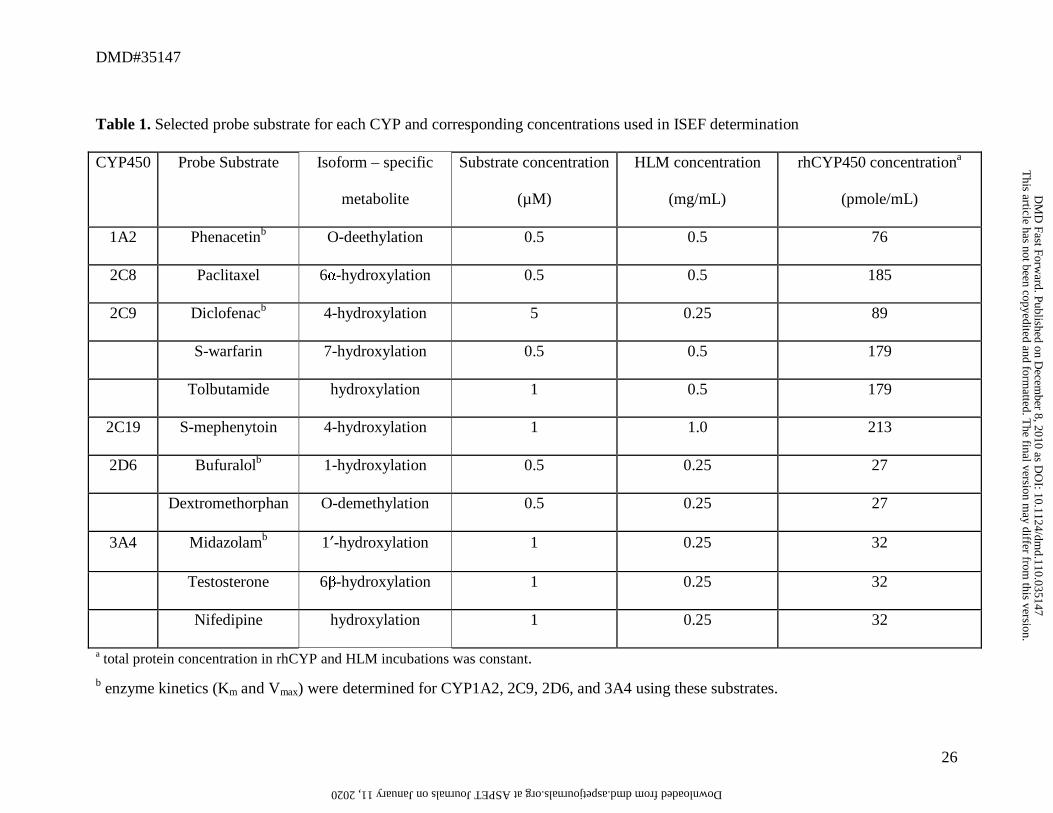
Table 1. Selected probe substrate for each CYP and corresponding concentrations used in ISEF determination
CYP450 Probe Substrate Isoform – specific
metabolite
Substrate concentration
(µM)
HLM concentration
(mg/mL)
rhCYP450 concentrationa
(pmole/mL)
1A2 Phenacetinb O-deethylation 0.5 0.5 76
2C8 Paclitaxel 6α-hydroxylation 0.5 0.5 185
2C9 Diclofenacb 4-hydroxylation 5 0.25 89
S-warfarin 7-hydroxylation 0.5 0.5 179
Tolbutamide hydroxylation 1 0.5 179
2C19 S-mephenytoin 4-hydroxylation 1 1.0 213
2D6 Bufuralolb 1-hydroxylation 0.5 0.25 27
Dextromethorphan O-demethylation 0.5 0.25 27
3A4 Midazolamb 1′-hydroxylation 1 0.25 32
Testosterone 6β-hydroxylation 1 0.25 32
Nifedipine hydroxylation 1 0.25 32
a total protein concentration in rhCYP and HLM incubations was constant.
b enzyme kinetics (Km and Vmax) were determined for CYP1A2, 2C9, 2D6, and 3A4 using these substrates.
This article has not been copyedited and form
atted. The final version m
ay differ from this version.
DM
D Fast Forw
ard. Published on Decem
ber 8, 2010 as DO
I: 10.1124/dmd.110.035147
at ASPET Journals on January 11, 2020 dmd.aspetjournals.org Downloaded from
DMD#35147
27
Table 2. Selected drugs for ISEF validation
Drugs
Major metabolizing
enzyme
Determination of metabolizing enzyme contribution
Reference
Metoprolol CYP2D6, 3A4 Metabolite formation Vmax and Km in HLM SimCYP®
Sildenafil CYP3A4, 2C9 CLint in rhCYP, converted by software SimCYP®
Imipramine CYP2D6, 2C19 Metabolite formation Vmax and Km in HLM SimCYP®
Carbamazepine CYP3A4 Metabolite formation in HLM with inhibitory antibody Kerr et al., 1994
Rosiglitazone CYP2C8, 2C9 CLint in HLM with chemical inhibitors SimCYP®
Mirtazapine CYP1A2, 2D6, 3A4
Metabolite formation Vmax and Km in rhCYP and
extrapolated using RAF, and HLM with inhibitors Stormer et al., 2000a and 2000b
Omeprazole CYP2C19, 3A4 Metabolite formation Vmax and Km in rhCYP SimCYP®
Fluoxetine CYP2D6, 2C9, 3A4
Metabolite formation Vmax and Km in rhCYP scaled using
CYP content, and HLM with chemical inhibition Margolis et al., 2000
Tolterodine CYP2D6, 3A4 Metabolite formation Vmax and Km in HLM SimCYP®
Harmine CYP1A2, 2C9, 2D6 Metabolite formation in HLM with monoclonal antibodies Yu et al., 2003
This article has not been copyedited and form
atted. The final version m
ay differ from this version.
DM
D Fast Forw
ard. Published on Decem
ber 8, 2010 as DO
I: 10.1124/dmd.110.035147
at ASPET Journals on January 11, 2020 dmd.aspetjournals.org Downloaded from
DMD#35147
28
Table 3. Summary of ISEF determined based on substrate depletion in rhCYP and HLM
CYP450 Probe Substrate
CLint-HLM a
μL/min/mg
(mean ± SD)
CLint –rhCYP a
μL/min/pmole
(mean ± SD)
CYP abundance b
pmole/mg protein ISEF- CLint
1A2 Phenacetin 28.6 ± 4.63 3.30 ± 0.11 52 0.17
2C8 Paclitaxel 22.7 ± 4.64 0.671 ± 0.07 24 1.41
2C9 Diclofenac 298 ± 12.8 7.58 ± 0.96 73 0.54
S-warfarin 8.73 ± 2.11 0.115 ± 0.01 1.04
Tolbutamide 9.12 ± 1.43 0.122 ± 0.01 1.02
2C19 S-mephenytoin 4.68 ± 1.59 1.35 ± 0.02 14 0.25
2D6 Bufuralol 41.6 ± 2.72 33.8 ± 1.1 8 0.15
Dextromethorphan 61.8 ± 8.35 37.5 ± 1.34 0.21
3A4 Midazolam 410 ± 21.4 13.8 ± 1.32 142 0.21
Testosterone 76.6 ± 6.86 3.62 ± 0.28 0.15
Nifedipine 210 ± 14.3 14.3 ± 0.51 0.11
a. CLint data are mean ± standard deviation (n = 6 or 7 from 2 or 3 assays, triplicates measurement per assay)
b. CYP abundance reported in SimCYP® based on Rowland-Yeo et al. (2003)
This article has not been copyedited and form
atted. The final version m
ay differ from this version.
DM
D Fast Forw
ard. Published on Decem
ber 8, 2010 as DO
I: 10.1124/dmd.110.035147
at ASPET Journals on January 11, 2020 dmd.aspetjournals.org Downloaded from
DMD#35147
29
Table 4. ISEF determined based on metabolite formation and comparison with ISEF determined using substrate depletion
CYP450 Probe
Substrate HLM rhCYP
ISEF
(metabolite formation)
ISEF
(substrate
depletion)
Vmax
(pmole/min/mg)
Km
(μM)
Vmax
(pmole/min/pmole
P450)
Km
(μM)
VISEF a CLISEFb ISEF- CLintc
1A2 Phenacetin 511 47 52 34 0.19 0.14 0.17
2C9 Diclofenac 1609 17.7 29 9.7 0.76 0.42 0.54
2D6 Bufuralol 135 11.0 52 8.3 0.32 0.23 0.15
3A4 Midazolam 973 2.94 21.0 2.89 0.33 0.32 0.21
a. VISEF-calculated based on Vmax (equation 1)
b. CLISEF-calculated based on CLint=Vmax/Km (equation 2)
c. ISEF -CLint -calculated based on measured substrate depletion, CLint (equation 3)
This article has not been copyedited and form
atted. The final version m
ay differ from this version.
DM
D Fast Forw
ard. Published on Decem
ber 8, 2010 as DO
I: 10.1124/dmd.110.035147
at ASPET Journals on January 11, 2020 dmd.aspetjournals.org Downloaded from
DMD#35147
30
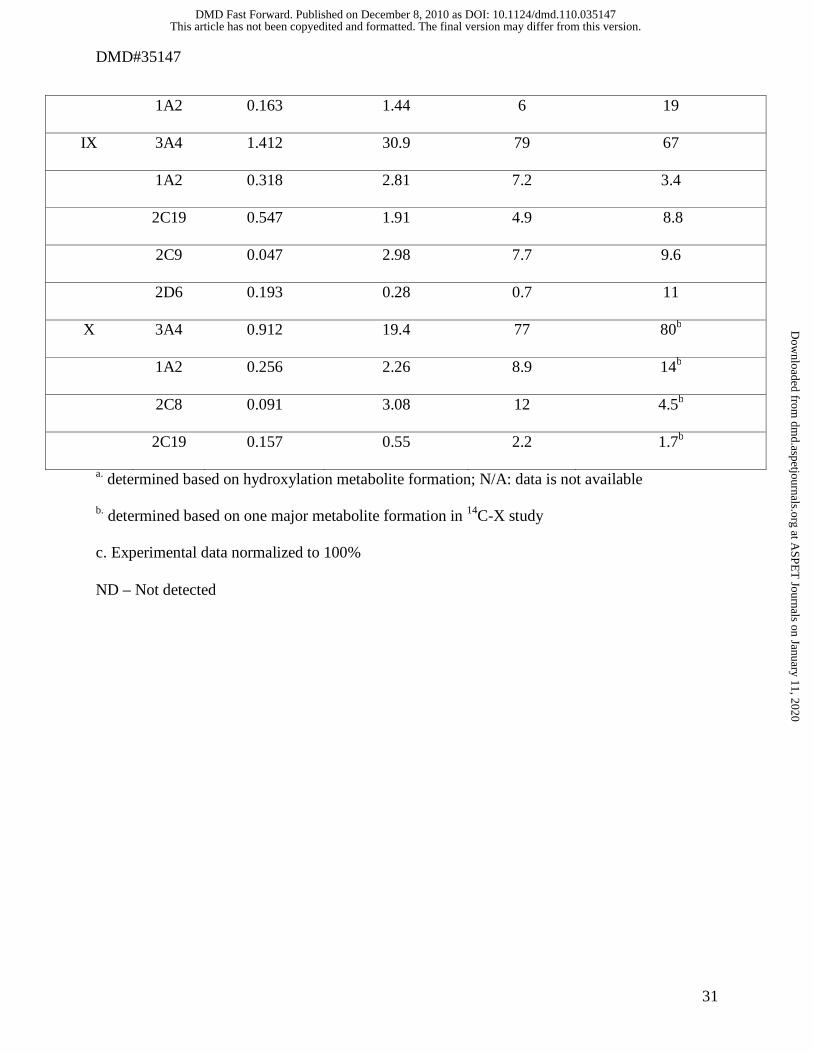
Table 5. Comparison of CYP phenotyping data using rhCYP-ISEF extrapolation and HLM
chemical inhibition for proprietary compounds
Compound CYP450
rhCYP CLint
(μL/min/pmole)
HLM CLint-
ISEF extrapolated
(μL/min/mg)
Calculated %
contribution
Measured % contributionc
(HLM with inhibitor)
I 2D6 3.50 5.04 65 51
2C19 0.434 1.52 19 25
1A2 0.141 1.25 16 24
II 3A4 0.708 15.5 100 75
1A2 ND ND - 12
2C9 ND ND - 13
III 3A4 0.932 20.4 85 100a
2C9 0.058 3.7 15 N/A
IV 3A4 1.07 23.4 72 71
2C9 0.08 5.10 16 29
2C19 1.10 3.85 12 N/A
V 3A4 0.770 16.8 96 94
2C19 0.219 0.77 4 6
VI 3A4 2.02 44.2 100 100
VII 3A4 0.781 17.1 90 86
2C8 0.045 1.52 8.1 N/A
2C19 0.078 0.27 1.4 14
VIII 3A4 1.064 23.3 94 81
This article has not been copyedited and formatted. The final version may differ from this version.DMD Fast Forward. Published on December 8, 2010 as DOI: 10.1124/dmd.110.035147
at ASPE
T Journals on January 11, 2020
dmd.aspetjournals.org
Dow
nloaded from
DMD#35147
31
1A2 0.163 1.44 6 19
IX 3A4 1.412 30.9 79 67
1A2 0.318 2.81 7.2 3.4
2C19 0.547 1.91 4.9 8.8
2C9 0.047 2.98 7.7 9.6
2D6 0.193 0.28 0.7 11
X 3A4 0.912 19.4 77 80b
1A2 0.256 2.26 8.9 14b
2C8 0.091 3.08 12 4.5b
2C19 0.157 0.55 2.2 1.7b
a. determined based on hydroxylation metabolite formation; N/A: data is not available
b. determined based on one major metabolite formation in 14C-X study
c. Experimental data normalized to 100%
ND – Not detected
This article has not been copyedited and formatted. The final version may differ from this version.DMD Fast Forward. Published on December 8, 2010 as DOI: 10.1124/dmd.110.035147
at ASPE
T Journals on January 11, 2020
dmd.aspetjournals.org
Dow
nloaded from
DMD#35147
32
Table 6. Accuracy of extrapolation of CYP contributions using ISEF determined by different methods and substrates
Average Fold Error (rhCYP-ISEF extrapolated / directly measured in HLM)
CYP2C9 contribution CYP2D6 contribution CYP 3A4 contribution
(n=7 compounds) (n=7 compounds) (n=17 compounds)
ISEF determined using different methods
ISEF-CLint 1.03 1.05 1.05
VISEF 1.15 1.10 1.17
CLISEF 1.96 1.03 1.16
ISEF-CLint determined using different substrates
CYP2C9 - Diclofenac 1.55
- S-warfarin 1.14
- Tolbutamine 1.11
CYP2D6 - Bufuralol 1.19
- Dextromethorphan 1.08
CYP3A4 - Midazolam 1.03
- Testosterone 1.14
- Nifedipine 1.24
This article has not been copyedited and form
atted. The final version m
ay differ from this version.
DM
D Fast Forw
ard. Published on Decem
ber 8, 2010 as DO
I: 10.1124/dmd.110.035147
at ASPET Journals on January 11, 2020 dmd.aspetjournals.org Downloaded from
DMD#35147
33
Table 7. CLint measured in HLM and extrapolated from rhCYP data using ISEF determined by different methods
Compound
CLint measured
in HLM
CLint extrapolated
using ISEF method 1
CLint extrapolated
using ISEF method 2
CLint extrapolated
using ISEF method 3
CLint extrapolated
using ISEF method 4
A 30 15 21 33 32
B 39 24 30 47 44
C 14 17 24 37 36
D 60 43 60 95 92
E 13 18 25 38 37
F 20 24 33 52 50
G 27 38 49 74 70
H 15 28 37 57 52
I 41 47 64 100 96
J 89 67 91 141 135
K 26 25 34 52 50
L 11 9 12 19 19
M 67 71 97 152 146
This article has not been copyedited and form
atted. The final version m
ay differ from this version.
DM
D Fast Forw
ard. Published on Decem
ber 8, 2010 as DO
I: 10.1124/dmd.110.035147
at ASPET Journals on January 11, 2020 dmd.aspetjournals.org Downloaded from
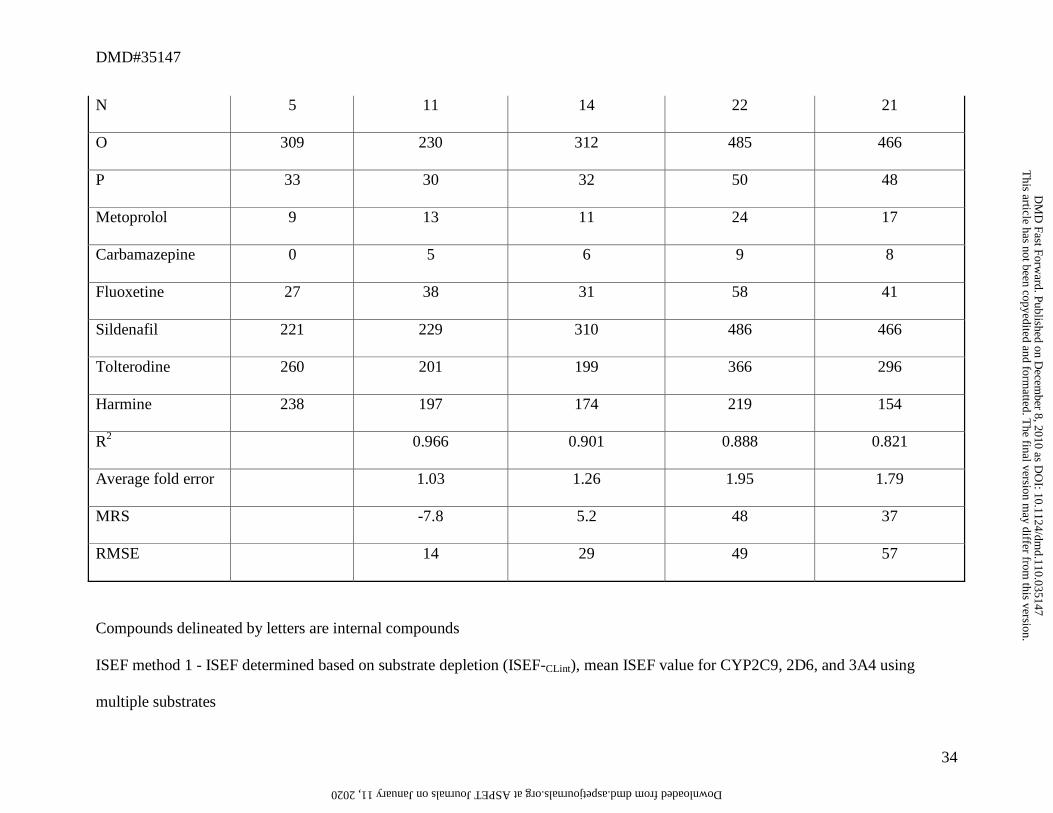
DMD#35147
34
N 5 11 14 22 21
O 309 230 312 485 466
P 33 30 32 50 48
Metoprolol 9 13 11 24 17
Carbamazepine 0 5 6 9 8
Fluoxetine 27 38 31 58 41
Sildenafil 221 229 310 486 466
Tolterodine 260 201 199 366 296
Harmine 238 197 174 219 154
R2 0.966 0.901 0.888 0.821
Average fold error 1.03 1.26 1.95 1.79
MRS -7.8 5.2 48 37
RMSE 14 29 49 57
Compounds delineated by letters are internal compounds
ISEF method 1 - ISEF determined based on substrate depletion (ISEF-CLint), mean ISEF value for CYP2C9, 2D6, and 3A4 using
multiple substrates
This article has not been copyedited and form
atted. The final version m
ay differ from this version.
DM
D Fast Forw
ard. Published on Decem
ber 8, 2010 as DO
I: 10.1124/dmd.110.035147
at ASPET Journals on January 11, 2020 dmd.aspetjournals.org Downloaded from
DMD#35147
35
ISEF method 2 - ISEF determined based on substrate depletion (ISEF-CLint) of single substrate for CYP2C9 (diclofenac), CYP2D6
(bufuralol), and CYP3A4 (midazolam)
ISEF method 3 - ISEF determined based on metabolite formation enzyme kinetics, VISEF
ISEF method 4 - ISEF determined based on metabolite formation enzyme kinetics, CLISEF
This article has not been copyedited and form
atted. The final version m
ay differ from this version.
DM
D Fast Forw
ard. Published on Decem
ber 8, 2010 as DO
I: 10.1124/dmd.110.035147
at ASPET Journals on January 11, 2020 dmd.aspetjournals.org Downloaded from
This article has not been copyedited and formatted. The final version may differ from this version.DMD Fast Forward. Published on December 8, 2010 as DOI: 10.1124/dmd.110.035147
at ASPE
T Journals on January 11, 2020
dmd.aspetjournals.org
Dow
nloaded from
This article has not been copyedited and formatted. The final version may differ from this version.DMD Fast Forward. Published on December 8, 2010 as DOI: 10.1124/dmd.110.035147
at ASPE
T Journals on January 11, 2020
dmd.aspetjournals.org
Dow
nloaded from
This article has not been copyedited and formatted. The final version may differ from this version.DMD Fast Forward. Published on December 8, 2010 as DOI: 10.1124/dmd.110.035147
at ASPE
T Journals on January 11, 2020
dmd.aspetjournals.org
Dow
nloaded from
This article has not been copyedited and formatted. The final version may differ from this version.DMD Fast Forward. Published on December 8, 2010 as DOI: 10.1124/dmd.110.035147
at ASPE
T Journals on January 11, 2020
dmd.aspetjournals.org
Dow
nloaded from
This article has not been copyedited and formatted. The final version may differ from this version.DMD Fast Forward. Published on December 8, 2010 as DOI: 10.1124/dmd.110.035147
at ASPE
T Journals on January 11, 2020
dmd.aspetjournals.org
Dow
nloaded from
This article has not been copyedited and formatted. The final version may differ from this version.DMD Fast Forward. Published on December 8, 2010 as DOI: 10.1124/dmd.110.035147
at ASPE
T Journals on January 11, 2020
dmd.aspetjournals.org
Dow
nloaded from