Embed Size (px)
Citation preview

NYSERDA DG/CHP Integrated Database System Utility Rate Details
CDH Energy Corporation 1 September 25, 2008
Utility Rate Database Documentation
List of Available Utility Companies Complete Consolidated Edison Electric Tariff ............................................................................. 24 Complete Long Island Power Authority Electric Tariff ............................................................... 73 Complete New York State Electric & Gas Electric Tariff............................................................ 85 Complete National Grid New York Electric Tariff .................................................................... 161 Complete Orange & Rockland Utility Electric Tariff................................................................. 319 Complete National Grid – Massachusetts Electric Tariff ........................................................... 340 Complete National Grid – Rhode Island Electric Tariff............................................................. 366 Complete Connecticut Light and Power Tariff........................................................................... 371 Complete Western Massachusetts Electric Co. Tariff ................................................................ 392 Complete Rochester Gas & Electric Tariff ................................................................................. 394 Summary of Alaska Light & Power Rates.................................................................................. 396 Complete Pacific Gas & Electric Tariff...................................................................................... 399 Complete Southern California Edison Tariff.............................................................................. 418 Complete Florida Light & Power Tariff ..................................................................................... 440 Complete Commonwealth Edison Company Tariff ................................................................... 445 Complete Commonwealth Electric Tariff................................................................................... 456 Average Hawaiian Electric Company Rates............................................................................... 460 Complete PPL Electric Utilities Tariff ....................................................................................... 463
List of Available Utility Rates Complete Consolidated Edison Electric Tariff ............................................................................. 24
Service Classification 1-1 – Residential and Religious for New York City – February 2006 to January 2007 .....................................................................................................................24
Service Classification 1-1 – Residential and Religious for New York City – July 2007 to June 2008 ...................................................................................................................................25
Service Classification 1-2 – Residential and Religious – Voluntary Time-of-Day for New York City – February 2006 to January 2007...............................................................................25
Service Classification 2-1 – General Small for New York City – May 2005 to April 2006 .......26 Service Classification 2-1 – General Small for New York City – November 2005 to October
2006 ...................................................................................................................................26 Service Classification 2-1 – General Small for New York City – July 2007 to June 2008.......27 Service Classification 2-1 – General Small for Westchester County - May 2005 to April 2006
...........................................................................................................................................27 Service Classification 2-1 – General Small for Westchester County – November 2005 to
October 2006 .....................................................................................................................28 Service Classification 2-1 – General Small for Westchester County –July 2007 to June 2008
...........................................................................................................................................28 Service Classification 2-2 – General Small Time-of-Use for New York City – May 2005 to April
2006 ...................................................................................................................................29

NYSERDA DG/CHP Integrated Database System Utility Rate Details
CDH Energy Corporation 2 September 25, 2008
Service Classification 2-2 – General Small Time-of-Use for New York City – November 2005 to October 2006 .................................................................................................................29
Service Classification 2-2 – General Small Time-of-Use for New York City – July 2007 to June 2008 ..........................................................................................................................30
Service Classification 2-2 – General Small Time-of-Use for Westchester County – May 2005 to April 2006 .......................................................................................................................30
Service Classification 2-2 – General Small Time-of-Use for Westchester County – November 2005 to October 2006 ........................................................................................................31
Service Classification 2-2 – General Small Time-of-Use for Westchester County – July 2007-June2008 ...........................................................................................................................31
Service Classification 7-1 – Residential and Religious – Heating for New York City – February 2006 to January 2007 ........................................................................................................32
Service Classification 7-1 – Residential and Religious – Heating for New York City – July 2007 to June 2008 .............................................................................................................32
Service Classification 7-2 – Residential and Religious – Heating – Voluntary Time-of-Day for New York City – February 2006 to January 2007 ..............................................................33
Service Classification 7-2 – Residential and Religious – Heating – Voluntary Time-of-Day for New York City –July 2007 to June 2008 ............................................................................33
Service Classification 9-1 General Large – Low Tension (No TOU) for New York City – May 2005 to April 2006 ..............................................................................................................34
Service Classification 9-1 General Large – Low Tension (No TOU) for New York City – November 2005 to October 2006.......................................................................................35
Service Classification 9-1 General Large – Low Tension (No TOU) for New York City – July 2007 to June 2008 .............................................................................................................36
Service Classification 9-1 General Large – Low Tension (No TOU) for Westchester County – May 2005 to April 2006 ......................................................................................................37
Service Classification 9-1 General Large – Low Tension (No TOU) for Westchester County – November 2005 to October 2006.......................................................................................38
Service Classification 9-1 General Large – Low Tension (No TOU) for Westchester County – July 2007 to June 2008 ......................................................................................................39
Service Classification 9-1 General Large – High Tension (No TOU) for New York City – May 2005 to April 2006 ..............................................................................................................40
Service Classification 9-1 General Large – High Tension (No TOU) for New York City – November 2005 to October 2006.......................................................................................41
Service Classification 9-1 General Large – High Tension (No TOU) for New York City – July 2007 to June 2008 .............................................................................................................42
Service Classification 9-1 General Large – High Tension (No TOU) for Westchester County – May 2005 to April 2006 ......................................................................................................43
Service Classification 9-1 General Large – High Tension (No TOU) for Westchester County – November 2005 to October 2006.......................................................................................44
Service Classification 9-1 General Large – High Tension (No TOU) for Westchester County – July 2007 to June 2008 ......................................................................................................45
Service Classification 9-2 General Large – Low Tension (Time-of-Use) for New York City – May 2005 to April 2006 ......................................................................................................46
Service Classification 9-2 General Large – Low Tension (Time-of-Use) for New York City – November 2005 to October 2006.......................................................................................47
Service Classification 9-2 General Large – Low Tension (Time-of-Use) for New York City – July 2007 to June 2008 ......................................................................................................48
Service Classification 9-2 General Large – Low Tension (Time-of-Use) for Westchester County – May 2005 to April 2006.......................................................................................49

NYSERDA DG/CHP Integrated Database System Utility Rate Details
CDH Energy Corporation 3 September 25, 2008
Service Classification 9-2 General Large – Low Tension (Time-of-Use) for Westchester County – November 2005 to October 2006 .......................................................................50
Service Classification 9-2 General Large – Low Tension (Time-of-Use) for Westchester County – July 2007 to June 2008.......................................................................................51
Service Classification 9-2 General Large – High Tension (Time-of-Use) for New York City – May 2005 to April 2006 ......................................................................................................52
Service Classification 9-2 General Large – High Tension (Time-of-Use) for New York City – November 2005 to October 2006.......................................................................................53
Service Classification 9-2 General Large – High Tension (Time-of-Use) for New York City – December 2006 to November 2007 ...................................................................................54
Service Classification 9-2 General Large – High Tension (Time-of-Use) for New York City –July 2007 to June 2008 ......................................................................................................55
Service Classification 9-2 General Large – High Tension (Time-of-Use) for Westchester County – May 2005 to April 2006.......................................................................................56
Service Classification 9-2 General Large – High Tension (Time-of-Use) for Westchester County – November 2005 to October 2006 .......................................................................57
Service Classification 9-2 General Large – High Tension (Time-of-Use) for Westchester County – July 2007 to June 2008.......................................................................................58
Service Classification 14RA – Standby (SC9 Rate 1 Base) – Low Tension for New York City – May 2005 to April 2006 ......................................................................................................59
Service Classification 14RA – Standby (SC9 Rate 1 Base) – Low Tension for New York City – November 2005 to October 2006.......................................................................................60
Service Classification 14RA – Standby (SC9 Rate 1 Base) – Low Tension for New York City – July 2007 to June 2008 ......................................................................................................61
Service Classification 14RA – Standby (SC9 Rate 1 Base) – Low Tension for Westchester County – May 2005 to April 2006.......................................................................................62
Service Classification 14RA – Standby (SC9 Rate 1 Base) – Low Tension for Westchester County – November 2005 to October 2006 .......................................................................63
Service Classification 14RA – Standby (SC9 Rate 1 Base) – Low Tension for Westchester County – July 2007 to June 2008.......................................................................................64
Service Classification 14RA – Standby (SC9 Rate 1 Base) – High Tension for New York City – May 2005 to April 2006 ...................................................................................................65
Service Classification 14RA – Standby (SC9 Rate 1 Base) – High Tension for New York City – November 2005 to October 2006....................................................................................66
Service Classification 14RA – Standby (SC9 Rate 1 Base) – High Tension for New York City – July 2007 to June 2008 ...................................................................................................67
Service Classification 14RA – Standby (SC9 Rate 1 Base) – High Tension for Westchester County – May 2005 to April 2006.......................................................................................68
Service Classification 14RA – Standby (SC9 Rate 1 Base) – High Tension for Westchester County – November 2005 to October 2006 .......................................................................69
Service Classification 14RA – Standby (SC9 Rate 1 Base) – High Tension for Westchester County – July 2007 to June 2008.......................................................................................70
Service Classification 14RA – Standby (SC9 Rate 2 Base) – High Tension for New York City – December 2006 to November 2007 ................................................................................71
Service Classification 14RA – Standby (SC9 Rate 2 Base) – High Tension for New York City – July 2007 to June 2008 ...................................................................................................72
Complete Long Island Power Authority Electric Tariff ............................................................... 73 Service Classification 1 (Rate Code: 180, 183, 186) – Residential Service – June 2008.......73 Service Classification 1 (Rate Code: 380) – Residential Service (Water Heating) – June 2008
...........................................................................................................................................73

NYSERDA DG/CHP Integrated Database System Utility Rate Details
CDH Energy Corporation 4 September 25, 2008
Service Classification 1 (Rate Code: 580, 581, 882, 883) – Residential Service (Space Heating) – June 2008.........................................................................................................74
Service Classification 1 (Rate Code: 880, 881) – Residential Service (Space and Water Heating) – June 2008.........................................................................................................74
Service Classification 1-VMRP (L) (Rate Code: 184) – Voluntary Large Residential Service with Multiple Rate Periods – June 2008.............................................................................75
Service Classification 1-VMRP (L) (Rate Code: 181) – Voluntary Large Residential Service with Multiple Rate Periods – June 2008.............................................................................75
Service Classification 1-VMRP (L) (Rate Code: 182) – Voluntary Large Residential Service with Multiple Rate Periods – June 2008.............................................................................76
Service Classification 1-VMRP (S) (Rate Code: 188) – Voluntary Small Residential Service with Multiple Rate Periods – June 2008.............................................................................76
Service Classification 2 (Rate Code: 280) – General Service – Small – October 2002..........77 Service Classification 2 (Rate Code: 280) – General Service – Small – July 2006 ................77 Service Classification 2 (Rate Code: 280) – General Service – Small – June 2008...............78 Service Classification 2-L (Rate Code: 281) – General Service – Large (Primary Service) –
May 1998 ...........................................................................................................................78 Service Classification 2-L (Rate Code: 281) – General Service – Large (Primary Service) –
July 2006............................................................................................................................79 Service Classification 2-L (Rate Code: 281) – General Service – Large (Primary Service) –
June 2008 ..........................................................................................................................79 Service Classification 2-L (Rate Code: 281) – General Service – Large (Secondary Service) –
May 1998 ...........................................................................................................................80 Service Classification 2-L (Rate Code: 281) – General Service – Large (Secondary Service) –
July 2006............................................................................................................................80 Service Classification 2-L (Rate Code: 281) – General Service – Large (Secondary Service) –
June 2008 ..........................................................................................................................81 Service Classification 2-MRP (Rate Code 285) - Large General with Multiple Rate Periods –
Secondary – December 2000 ............................................................................................81 Service Classification 2-MRP (Rate Code 285) - Large General with Multiple Rate Periods –
Secondary – July 2006.......................................................................................................82 Service Classification 2-MRP (Rate Code 285) - Large General with Multiple Rate Periods –
Secondary – June 2008 .....................................................................................................82 Service Classification 12 (Rate Code 680) – Backup and Maintenance with Supplemental
Service – Secondary – January 2001 ................................................................................83 Service Classification 12 (Rate Code 680) – Backup and Maintenance with Supplemental
Service – Secondary – July 2006.......................................................................................84 Service Classification 12 (Rate Code 680) – Backup and Maintenance with Supplemental
Service – Secondary – June 2008 .....................................................................................84 Complete New York State Electric & Gas Electric Tariff............................................................ 85
Service Classification 2 –General – Fixed Pricing Option – February 2006 ...........................85 Service Classification 2 –General – Fixed Pricing Option – October 2006 .............................85 Service Classification 2 –General – Fixed Pricing Option – November 2005 to October 2006
...........................................................................................................................................86 Service Classification 2 –General – Fixed Pricing Option – July 2007 to June 2008..............86 Service Classification 7-1 – Large General TOU – Fixed Price – Secondary – February 2006
...........................................................................................................................................87 Service Classification 7-1 – Large General TOU – Fixed Price – Secondary – October 200687 Service Classification 7-1 – Large General TOU – Fixed Price – Secondary – November 2005
to October 2006 .................................................................................................................88

NYSERDA DG/CHP Integrated Database System Utility Rate Details
CDH Energy Corporation 5 September 25, 2008
Service Classification 7-1 – Large General TOU – Fixed Price – Secondary – July 2007 to June 2008 ..........................................................................................................................88
Service Classification 7-2 – Large General TOU – Fixed Price – Primary – February 2006 ..89 Service Classification 7-2 – Large General TOU – Fixed Price – Primary – October 2006 ....89 Service Classification 7-2 – Large General TOU – Fixed Price – Primary – November 2005 to
October 2006 .....................................................................................................................90 Service Classification 7-2 – Large General TOU – Fixed Price – Primary – July 2007 to June
2008 ...................................................................................................................................90 Service Classification 7-2 – Large General TOU – Fixed Price – Primary – Economic
Development Zone.............................................................................................................91 Service Classification 7-2 – Large General TOU – Variable Pricing Option – Primary –
Economic Development Zone ............................................................................................92 Taxes and Surcharges ................................................................................................................... 92
Service Classification 7-3 – Large General TOU – Fixed Price – SubTransmission – February 2006 ...................................................................................................................................93
Service Classification 7-3 – Large General TOU – Fixed Price – SubTransmission – October 2006 ...................................................................................................................................94
Service Classification 7-3 – Large General TOU – Fixed Price – SubTransmission – November 2005 to October 2006.......................................................................................94
Service Classification 7-3 – Large General TOU – Fixed Price – SubTransmission – July 2007 to June 2008 .............................................................................................................95
Service Classification 7-4 – Large General TOU – Fixed Price – Transmission – February 2006 ...................................................................................................................................95
Service Classification 7-4 – Large General TOU – Fixed Price – Transmission – October 2006 ...................................................................................................................................96
Service Classification 7-4 – Large General TOU – Fixed Price – Transmission – November 2005 to October 2006 ........................................................................................................96
Service Classification 7-4 – Large General TOU – Fixed Price – Transmission – July 2007 to June 2008 ..........................................................................................................................97
Service Classification 10 – Cogeneration – Secondary (Contract Demand less than 500 kW) – Capital Region – February 2005 to January 2006 ..........................................................97
Service Classification 10 – Cogeneration – Secondary (Contract Demand less than 500 kW) – Capital Region – October 2005 to September 2006 .......................................................98
Service Classification 10 – Cogeneration – Secondary (Contract Demand less than 500 kW) – Capital Region – June 2007 to May 2008 .......................................................................99
Service Classification 10 – Cogeneration – Secondary (Contract Demand larger than 500 kW) – Capital Region – February 2005 to January 2006 ........................................................100
Service Classification 10 – Cogeneration – Secondary (Contract Demand larger than 500 kW) – Capital Region – October 2005 to September 2006 .....................................................101
Service Classification 10 – Cogeneration – Secondary (Contract Demand larger than 500 kW) – Capital Region – June 2007 to May 2008 .....................................................................101
Service Classification 10 – Cogeneration – Primary – Capital Region – February 2005 to January 2006 ...................................................................................................................102
Service Classification 10 – Cogeneration – Primary – Capital Region – October 2005 to September 2006...............................................................................................................102
Service Classification 10 – Cogeneration – Primary – Capital Region – June 2007 to May 2008 .................................................................................................................................103
Service Classification 10 – Cogeneration – Secondary (Contract Demand less than 500 kW) – Central Region – February 2005 to January 2006 ........................................................103
Service Classification 10 – Cogeneration – Secondary (Contract Demand less than 500 kW) – Central Region – October 2005 to September 2006.....................................................105

NYSERDA DG/CHP Integrated Database System Utility Rate Details
CDH Energy Corporation 6 September 25, 2008
Service Classification 10 – Cogeneration – Secondary (Contract Demand less than 500 kW) – Central Region – June 2007 to May 2008.....................................................................106
Service Classification 10 – Cogeneration – Secondary (Contract Demand larger than 500 kW) – Central Region – February 2005 to January 2006 ........................................................107
Service Classification 10 – Cogeneration – Secondary (Contract Demand larger than 500 kW) – Central Region – October 2005 to September 2006.....................................................107
Service Classification 10 – Cogeneration – Secondary (Contract Demand larger than 500 kW) – Central Region – June 2007 to May 2008.....................................................................108
Service Classification 10 – Cogeneration – Primary – Central Region – February 2005 to January 2006 ...................................................................................................................108
Service Classification 10 – Cogeneration – Primary – Central Region – October 2005 to September 2006...............................................................................................................109
Service Classification 10 – Cogeneration – Primary – Central Region – June 2007 to May 2008 .................................................................................................................................109
Service Classification 10 – Cogeneration – Secondary (Contract Demand less than 500 kW) – Genesee Region – February 2005 to January 2006 .....................................................110
Service Classification 10 – Cogeneration – Secondary (Contract Demand less than 500 kW) – Genesee Region – October 2005 to September 2006..................................................111
Service Classification 10 – Cogeneration – Secondary (Contract Demand less than 500 kW) – Genesee Region – June 2007 to May 2008..................................................................112
Service Classification 10 – Cogeneration – Secondary (Contract Demand larger than 500 kW) – Genesee Region – February 2005 to January 2006 .....................................................113
Service Classification 10 – Cogeneration – Secondary (Contract Demand larger than 500 kW) – Genesee Region – October 2005 to September 2006..................................................113
Service Classification 10 – Cogeneration – Secondary (Contract Demand larger than 500 kW) – Genesee Region – June 2007 to May 2008..................................................................114
Service Classification 10 – Cogeneration – Primary – Genesee Region – February 2005 to January 2006 ...................................................................................................................114
Service Classification 10 – Cogeneration – Primary – Genesee Region – October 2005 to September 2006...............................................................................................................115
Service Classification 10 – Cogeneration – Primary – Genesee Region – June 2007 to May 2008 .................................................................................................................................115
Service Classification 10 – Cogeneration – Secondary (Contract Demand less than 500 kW) – Hudson Valley Region – February 2005 to January 2006 ............................................116
Service Classification 10 – Cogeneration – Secondary (Contract Demand less than 500 kW) – Hudson Valley Region – October 2005 to September 2006 .........................................117
Service Classification 10 – Cogeneration – Secondary (Contract Demand less than 500 kW) – Hudson Valley Region – June 2007 to May 2008 .........................................................118
Service Classification 10 – Cogeneration – Secondary (Contract Demand larger than 500 kW) – Hudson Valley Region – February 2005 to January 2006 ............................................119
Service Classification 10 – Cogeneration – Secondary (Contract Demand larger than 500 kW) – Hudson Valley Region – October 2005 to September 2006 .........................................119
Service Classification 10 – Cogeneration – Secondary (Contract Demand larger than 500 kW) – Hudson Valley Region – June 2007 to May 2008 .........................................................120
Service Classification 10 – Cogeneration – Primary – Hudson Valley Region – February 2005 to January 2006 ...............................................................................................................120
Service Classification 10 – Cogeneration – Primary – Hudson Valley Region – October 2005 to September 2006...........................................................................................................121
Service Classification 10 – Cogeneration – Primary – Hudson Valley Region – June 2007 to May 2008 .........................................................................................................................121

NYSERDA DG/CHP Integrated Database System Utility Rate Details
CDH Energy Corporation 7 September 25, 2008
Service Classification 10 – Cogeneration – Secondary (Contract Demand less than 500 kW) – Mohawk Valley Region – February 2005 to January 2006 ...........................................122
Service Classification 10 – Cogeneration – Secondary (Contract Demand less than 500 kW) – Mohawk Valley Region – October 2005 to September 2006 ........................................123
Service Classification 10 – Cogeneration – Secondary (Contract Demand less than 500 kW) – Mohawk Valley Region – June 2007 to May 2008 ........................................................124
Service Classification 10 – Cogeneration – Secondary (Contract Demand larger than 500 kW) – Mohawk Valley Region – February 2005 to January 2006 ...........................................125
Service Classification 10 – Cogeneration – Secondary (Contract Demand larger than 500 kW) – Mohawk Valley Region – October 2005 to September 2006 ........................................125
Service Classification 10 – Cogeneration – Secondary (Contract Demand larger than 500 kW) – Mohawk Valley Region – June 2007 to May 2008 ........................................................126
Service Classification 10 – Cogeneration – Primary – Mohawk Valley Region – February 2005 to January 2006 ......................................................................................................126
Service Classification 10 – Cogeneration – Primary – Mohawk Valley Region – October 2005 to September 2006...........................................................................................................127
Service Classification 10 – Cogeneration – Primary – Mohawk Valley Region – June 2007 to May 2008 .........................................................................................................................127
Service Classification 10 – Cogeneration – Secondary (Contract Demand less than 500 kW) – North Region – February 2005 to January 2006...........................................................128
Service Classification 10 – Cogeneration – Secondary (Contract Demand less than 500 kW) – North Region – October 2005 to September 2006........................................................129
Service Classification 10 – Cogeneration – Secondary (Contract Demand less than 500 kW) – North Region – June 2007 to May 2008 .......................................................................130
Service Classification 10 – Cogeneration – Secondary (Contract Demand larger than 500 kW) – North Region – February 2005 to January 2006...........................................................131
Service Classification 10 – Cogeneration – Secondary (Contract Demand larger than 500 kW) – North Region – October 2005 to September 2006........................................................131
Service Classification 10 – Cogeneration – Secondary (Contract Demand larger than 500 kW) – North Region – June 2007 to May 2008 .......................................................................132
Service Classification 10 – Cogeneration – Primary – North Region – February 2005 to January 2006 ...................................................................................................................132
Service Classification 10 – Cogeneration – Primary – North Region – October 2005 to September 2006...............................................................................................................133
Service Classification 10 – Cogeneration – Primary – North Region – June 2007 to May 2008.........................................................................................................................................133
Service Classification 10 – Cogeneration – Secondary (Contract Demand less than 500 kW) – West Region – February 2005 to January 2006 ...........................................................134
Service Classification 10 – Cogeneration – Secondary (Contract Demand less than 500 kW) – West Region – October 2005 to September 2006 ........................................................135
Service Classification 10 – Cogeneration – Secondary (Contract Demand less than 500 kW) – West Region – June 2007 to May 2008 ........................................................................136
Service Classification 10 – Cogeneration – Secondary (Contract Demand larger than 500 kW) – West Region – February 2005 to January 2006 ...........................................................137
Service Classification 10 – Cogeneration – Secondary (Contract Demand larger than 500 kW) – West Region – October 2005 to September 2006 ........................................................137
Service Classification 10 – Cogeneration – Secondary (Contract Demand larger than 500 kW) – West Region – June 2007 to May 2008 ........................................................................138
Service Classification 10 – Cogeneration – Primary – West Region – February 2005 to January 2006 ...................................................................................................................138

NYSERDA DG/CHP Integrated Database System Utility Rate Details
CDH Energy Corporation 8 September 25, 2008
Service Classification 10 – Cogeneration – Primary – West Region – October 2005 to September 2006...............................................................................................................139
Service Classification 10 – Cogeneration – Primary – West Region – June 2007 to May 2008.........................................................................................................................................139
Service Classification 11 – Standby – Based on SC2 Variable Pricing Option – Capital Region – February 2005 to January 2006 ....................................................................................140
Service Classification 11 – Standby – Based on SC2 Variable Pricing Option – Capital Region – October 2005 to September 2006.................................................................................141
Service Classification 11 – Standby – Based on SC2 Variable Pricing Option – Capital Region – July 2007 to June 2008 .................................................................................................142
Service Classification 11 – Standby – Based on SC2 Variable Pricing Option – Central Region – February 2005 to January 2006........................................................................143
Service Classification 11 – Standby – Based on SC2 Variable Pricing Option – Central Region – October 2005 to September 2006 ....................................................................144
Service Classification 11 – Standby – Based on SC2 Variable Pricing Option – Central Region – July 2007 to June 2008.....................................................................................145
Service Classification 11 – Standby – Based on SC2 Variable Pricing Option – Genesee Region – February 2005 to January 2006........................................................................146
Service Classification 11 – Standby – Based on SC2 Variable Pricing Option – Genesee Region – October 2005 to September 2006 ....................................................................147
Service Classification 11 – Standby – Based on SC2 Variable Pricing Option – Genesee Region – July 2007 to June 2008.....................................................................................148
Service Classification 11 – Standby – Based on SC2 Variable Pricing Option – Hudson Region – February 2005 to January 2006........................................................................149
Service Classification 11 – Standby – Based on SC2 Variable Pricing Option – Hudson Region – October 2005 to September 2006 ....................................................................150
Service Classification 11 – Standby – Based on SC2 Variable Pricing Option – Hudson Region – July 2007 to June 2008.....................................................................................151
Service Classification 11 – Standby – Based on SC2 Variable Pricing Option – Mohawk Region – February 2005 to January 2006........................................................................152
Service Classification 11 – Standby – Based on SC2 Variable Pricing Option – Mohawk Region – October 2005 to September 2006 ....................................................................153
Service Classification 11 – Standby – Based on SC2 Variable Pricing Option – Mohawk Region – July 2007 to June 2008.....................................................................................154
Service Classification 11 – Standby – Based on SC2 Variable Pricing Option – North Region – February 2005 to January 2006 ....................................................................................155
Service Classification 11 – Standby – Based on SC2 Variable Pricing Option – North Region – October 2005 to September 2006.................................................................................156
Service Classification 11 – Standby – Based on SC2 Variable Pricing Option – North Region –July 2007 to June 2008 ..................................................................................................157
Service Classification 11 – Standby – Based on SC2 Variable Pricing Option – West Region – February 2005 to January 2006 .......................................................................................158
Service Classification 11 – Standby – Based on SC2 Variable Pricing Option – West Region – October 2005 to September 2006....................................................................................159
Service Classification 11 – Standby – Based on SC2 Variable Pricing Option – West Region – July 2007 to June 2008 ....................................................................................................160
Complete National Grid New York Electric Tariff .................................................................... 161 Service Classification 1 – Standard Residential (Frontier Region) – February 2005 to January
2006 .................................................................................................................................161 Service Classification 1 – Standard Residential (Frontier Region) – October 2005 to
September 2006...............................................................................................................162

NYSERDA DG/CHP Integrated Database System Utility Rate Details
CDH Energy Corporation 9 September 25, 2008
Service Classification 1 – Standard Residential (Frontier Region) – February 2006 to January 2007 .................................................................................................................................163
Service Classification 1 – Standard Residential (Frontier Region) – July 2007 to June 2008.........................................................................................................................................164
Service Classification 1 – Standard Residential (Capital Region) – February 2006 to January 2007 .................................................................................................................................165
Service Classification 1 – Standard Residential (Capital Region) – July 2007 to June 2008166 Service Classification 2ND – Small General Non-Demand (Genesee Region) – February
2005 to January 2006 ......................................................................................................167 Service Classification 2ND – Small General Non-Demand (Genesee Region) – October 2005
to September 2006...........................................................................................................168 Service Classification 2ND – Small General Non-Demand (Genesee Region) – July 2007 to
June 2008 ........................................................................................................................169 Service Classification 2ND – Small General Non-Demand (Central Region) – February 2005
to January 2006 ...............................................................................................................170 Service Classification 2ND – Small General Non-Demand (Central Region) – October 2005 to
September 2006...............................................................................................................171 Service Classification 2ND – Small General Non-Demand (Central Region) – July 2007 to
June 2008 ........................................................................................................................172 Service Classification 2ND – Small General Non-Demand (Adirondack Region) – February
2005 to January 2006 ......................................................................................................173 Service Classification 2ND – Small General Non-Demand (Adirondack Region) – October
2005 to September 2006..................................................................................................174 Service Classification 2ND – Small General Non-Demand (Adirondack Region) – July 2007 to
June 2008 ........................................................................................................................175 Service Classification 2ND – Small General Non-Demand (Utica Region) – February 2005 to
January 2006 ...................................................................................................................176 Service Classification 2ND – Small General Non-Demand (Utica Region) – October 2005 to
September 2006...............................................................................................................177 Service Classification 2ND – Small General Non-Demand (Utica Region) – July 2007 to June
2008 .................................................................................................................................178 Service Classification 2ND – Small General Non-Demand (Capital Region) – February 2005
to January 2006 ...............................................................................................................179 Service Classification 2ND – Small General Non-Demand (Capital Region) – October 2005 to
September 2006...............................................................................................................180 Service Classification 2ND – Small General Non-Demand (Capital Region) – July 2007 to
June 2008 ........................................................................................................................181 Service Classification 2D – Small General Demand (Frontier Region) – February 2005 to
January 2006 ...................................................................................................................182 Service Classification 2D – Small General Demand (Frontier Region) – October 2005 to
September 2006...............................................................................................................183 Service Classification 2D – Small General Demand (Frontier Region) – July 2007 to June
2008 .................................................................................................................................184 Service Classification 2D – Small General Demand (Genesee Region) – February 2005 to
January 2006 ...................................................................................................................185 Service Classification 2D – Small General Demand (Genesee Region) – October 2005 to
September 2006...............................................................................................................186 Service Classification 2D – Small General Demand (Genesee Region) – July 2007 to June
2008 .................................................................................................................................187 Service Classification 2D – Small General Demand (Central Region) – February 2005 to
January 2006 ...................................................................................................................188

NYSERDA DG/CHP Integrated Database System Utility Rate Details
CDH Energy Corporation 10 September 25, 2008
Service Classification 2D – Small General Demand (Central Region) – October 2005 to September 2006...............................................................................................................189
Service Classification 2D – Small General Demand (Central Region) – July 2007 to June 2008 .................................................................................................................................190
Service Classification 2D – Small General Demand (Adirondack Region) – February 2005 to January 2006 ...................................................................................................................191
Service Classification 2D – Small General Demand (Adirondack Region) – October 2005 to September 2006...............................................................................................................192
Service Classification 2D – Small General Demand (Adirondack Region) – July 2007 to June 2008 .................................................................................................................................193
Service Classification 2D – Small General Demand (Utica Region) – February 2005 to January 2006 ...................................................................................................................194
Service Classification 2D – Small General Demand (Utica Region) – October 2005 to September 2006...............................................................................................................195
Service Classification 2D – Small General Demand (Utica Region) – July 2007 to June 2008.........................................................................................................................................196
Service Classification 2D – Small General Demand (Capital Region) – February 2005 to January 2006 ...................................................................................................................197
Service Classification 2D – Small General Demand (Capital Region) – October 2005 to September 2006...............................................................................................................198
Service Classification 2D – Small General Demand (Capital Region) – July 2007 to June 2008 .................................................................................................................................199
Service Classification 3 – Large General - Secondary (Frontier Region) – February 2005 to January 2006 ...................................................................................................................200
Service Classification 3 – Large General - Secondary (Frontier Region) – October 2005 to September 2006...............................................................................................................201
Service Classification 3 – Large General - Secondary (Frontier Region) – July 2007 to June 2008 .................................................................................................................................202
Service Classification 3 – Large General - Secondary (Genesee Region) – February 2005 to January 2006 ...................................................................................................................203
Service Classification 3 – Large General - Secondary (Genesee Region) – October 2005 to September 2006...............................................................................................................204
Service Classification 3 – Large General - Secondary (Genesee Region) – July 2007 to June 2008 .................................................................................................................................205
Service Classification 3 – Large General - Secondary (Central Region) – February 2005 to January 2006 ...................................................................................................................206
Service Classification 3 – Large General - Secondary (Central Region) – October 2005 to September 2006...............................................................................................................207
Service Classification 3 – Large General - Secondary (Central Region) – July 2007 to June 2008 .................................................................................................................................208
Service Classification 3 – Large General - Secondary (Adirondack Region) – February 2005 to January 2006 ...............................................................................................................209
Service Classification 3 – Large General - Secondary (Adirondack Region) – October 2005 to September 2006...............................................................................................................210
Service Classification 3 – Large General - Secondary (Adirondack Region) – July 2007 to June 2008 ........................................................................................................................211
Service Classification 3 – Large General - Secondary (Utica Region) – February 2005 to January 2006 ...................................................................................................................212
Service Classification 3 – Large General - Secondary (Utica Region) – October 2005 to September 2006...............................................................................................................213

NYSERDA DG/CHP Integrated Database System Utility Rate Details
CDH Energy Corporation 11 September 25, 2008
Service Classification 3 – Large General - Secondary (Utica Region) – July 2007 to June 2008 .................................................................................................................................214
Service Classification 3 – Large General - Secondary (Capital Region) – February 2005 to January 2006 ...................................................................................................................215
Service Classification 3 – Large General - Secondary (Capital Region) – October 2005 to September 2006...............................................................................................................216
Service Classification 3 – Large General - Secondary (Capital Region) – July 2007 to June 2008 .................................................................................................................................217
Service Classification 3 – Large General – Primary (Frontier Region) – February 2005 to January 2006 ...................................................................................................................218
Service Classification 3 – Large General – Primary (Frontier Region) – October 2005 to September 2006...............................................................................................................219
Service Classification 3 – Large General – Primary (Frontier Region) – July 2007 to June 2008 .................................................................................................................................220
Service Classification 3 – Large General – Primary (Genesee Region) – February 2005 to January 2006 ...................................................................................................................221
Service Classification 3 – Large General – Primary (Genesee Region) – October 2005 to September 2006...............................................................................................................222
Service Classification 3 – Large General – Primary (Genesee Region) – July 2007 to June 2008 .................................................................................................................................223
Service Classification 3 – Large General – Primary (Central Region) – February 2005 to January 2006 ...................................................................................................................224
Service Classification 3 – Large General – Primary (Central Region) – October 2005 to September 2006...............................................................................................................225
Service Classification 3 – Large General – Primary (Central Region) – July 2007 to June 2008 .................................................................................................................................226
Service Classification 3 – Large General – Primary (Adirondack Region) – February 2005 to January 2006 ...................................................................................................................227
Service Classification 3 – Large General – Primary (Adirondack Region) – October 2005 to September 2006...............................................................................................................228
Service Classification 3 – Large General – Primary (Adirondack Region) – July 2007 to June 2008 .................................................................................................................................229
Service Classification 3 – Large General – Primary (Utica Region) – February 2005 to January 2006 ...................................................................................................................230
Service Classification 3 – Large General – Primary (Utica Region) – October 2005 to September 2006...............................................................................................................231
Service Classification 3 – Large General – Primary (Utica Region) – July 2007 to June 2008.........................................................................................................................................232
Service Classification 3 – Large General – Primary (Capital Region) – February 2005 to January 2006 ...................................................................................................................233
Service Classification 3 – Large General – Primary (Capital Region) – October 2005 to September 2006...............................................................................................................234
Service Classification 3 – Large General – Primary (Capital Region) – July 2007 to June 2008.........................................................................................................................................235
Service Classification 3a – Large General Time-of-Use - Secondary – Electric Supply Charge (Frontier Region) – February 2005 to January 2006........................................................236
Service Classification 3a – Large General Time-of-Use - Secondary – Electric Supply Charge (Frontier Region) – October 2005 to September 2006.....................................................237
Service Classification 3a – Large General Time-of-Use - Secondary – Electric Supply Charge (Frontier Region) – July 2007 to June 2008.....................................................................238

NYSERDA DG/CHP Integrated Database System Utility Rate Details
CDH Energy Corporation 12 September 25, 2008
Service Classification 3a – Large General Time-of-Use - Secondary – Electric Supply Charge (Genesee Region) – February 2005 to January 2006......................................................239
Service Classification 3a – Large General Time-of-Use - Secondary – Electric Supply Charge (Genesee Region) – October 2005 to September 2006 ..................................................241
Service Classification 3a – Large General Time-of-Use - Secondary – Electric Supply Charge (Genesee Region) – July 2007 to June 2008...................................................................242
Service Classification 3a – Large General Time-of-Use - Secondary – Electric Supply Charge (Central Region) – February 2005 to January 2006.........................................................243
Service Classification 3a – Large General Time-of-Use - Secondary – Electric Supply Charge (Central Region) – October 2005 to September 2006 .....................................................245
Service Classification 3a – Large General Time-of-Use - Secondary – Electric Supply Charge (Central Region) – July 2007 to June 2008......................................................................246
Service Classification 3a – Large General Time-of-Use - Secondary – Electric Supply Charge (Adirondack Region) – February 2005 to January 2006 ..................................................247
Service Classification 3a – Large General Time-of-Use - Secondary – Electric Supply Charge (Adirondack Region) – October 2005 to September 2006 ...............................................248
Service Classification 3a – Large General Time-of-Use - Secondary – Electric Supply Charge (Adirondack Region) – July 2007 to June 2008 ...............................................................249
Service Classification 3a – Large General Time-of-Use - Secondary – Electric Supply Charge (Utica Region) – February 2005 to January 2006 ............................................................250
Service Classification 3a – Large General Time-of-Use - Secondary – Electric Supply Charge (Utica Region) – October 2005 to September 2006.........................................................251
Service Classification 3a – Large General Time-of-Use - Secondary – Electric Supply Charge (Utica Region) – July 2007 to June 2008 .........................................................................252
Service Classification 3a – Large General Time-of-Use - Secondary – Electric Supply Charge (Capital Region) – February 2005 to January 2006 .........................................................253
Service Classification 3a – Large General Time-of-Use - Secondary – Electric Supply Charge (Capital Region) – October 2005 to September 2006......................................................254
Service Classification 3a – Large General Time-of-Use - Secondary – Electric Supply Charge (Capital Region) – July 2007 to June 2008 ......................................................................255
Service Classification 3a – Large General Time-of-Use - Primary – Electric Supply Charge (Frontier Region) – February 2005 to January 2006........................................................256
Service Classification 3a – Large General Time-of-Use - Primary – Electric Supply Charge (Frontier Region) – October 2005 to September 2006.....................................................257
Service Classification 3a – Large General Time-of-Use - Primary – Electric Supply Charge (Frontier Region) – July 2007 to June 2008.....................................................................258
Service Classification 3a – Large General Time-of-Use - Primary – Electric Supply Charge (Genesee Region) – February 2005 to January 2006......................................................259
Service Classification 3a – Large General Time-of-Use - Primary – Electric Supply Charge (Genesee Region) – October 2005 to September 2006 ..................................................260
Service Classification 3a – Large General Time-of-Use - Primary – Electric Supply Charge (Genesee Region) –July 2007 to June 2008....................................................................261
Service Classification 3a – Large General Time-of-Use - Primary – Electric Supply Charge (Central Region) – February 2005 to January 2006.........................................................262
Service Classification 3a – Large General Time-of-Use - Primary – Electric Supply Charge (Central Region) – October 2005 to September 2006 .....................................................263
Service Classification 3a – Large General Time-of-Use - Primary – Electric Supply Charge (Central Region) – December 2006 to November 2007...................................................264
Service Classification 3a – Large General Time-of-Use - Primary – Electric Supply Charge (Central Region) – July 2007 to June 2008......................................................................265

NYSERDA DG/CHP Integrated Database System Utility Rate Details
CDH Energy Corporation 13 September 25, 2008
Service Classification 3a – Large General Time-of-Use - Primary – Electric Supply Charge (Adirondack Region) – February 2005 to January 2006 ..................................................266
Service Classification 3a – Large General Time-of-Use - Primary – Electric Supply Charge (Adirondack Region) – October 2005 to September 2006 ...............................................267
Service Classification 3a – Large General Time-of-Use - Primary – Electric Supply Charge (Adirondack Region) – July 2007 to June 2008 ...............................................................268
Service Classification 3a – Large General Time-of-Use - Primary – Electric Supply Charge (Utica Region) – February 2005 to January 2006 ............................................................269
Service Classification 3a – Large General Time-of-Use - Primary – Electric Supply Charge (Utica Region) – October 2005 to September 2006.........................................................270
Service Classification 3a – Large General Time-of-Use - Primary – Electric Supply Charge (Utica Region) – July 2007 to June 2008 .........................................................................271
Service Classification 3a – Large General Time-of-Use - Primary – Electric Supply Charge (Capital Region) – February 2005 to January 2006 .........................................................272
Service Classification 3a – Large General Time-of-Use - Primary – Electric Supply Charge (Capital Region) – October 2005 to September 2006......................................................273
Service Classification 3a – Large General Time-of-Use - Primary – Electric Supply Charge (Capital Region) – July 2007 to June 2008 ......................................................................274
Service Classification 7 – Standby – Based on SC1 Residential (Frontier Region) – February 2005 to January 2006 ......................................................................................................275
Service Classification 7 – Standby – Based on SC1 Residential (Frontier Region) – October 2005 to September 2006..................................................................................................275
Service Classification 7 – Standby – Based on SC1 Residential (Frontier Region) – February 2006 to January 2007 ......................................................................................................276
Service Classification 7 – Standby – Based on SC1 Residential (Frontier Region) –July 2007 to June 2008 ....................................................................................................................276
Service Classification 7 – Standby – Based on SC1 Residential (Capital Region) – February 2006 to January 2007 ......................................................................................................277
Service Classification 7 – Standby – Based on SC1 Residential (Capital Region) –July 2007 to June 2008 ....................................................................................................................277
Service Classification 7 – Standby – Based on SC3 Secondary (Frontier Region) – February 2005 to January 2006 ......................................................................................................278
Service Classification 7 – Standby – Based on SC3 Secondary (Frontier Region) – October 2005 to September 2006..................................................................................................279
Service Classification 7 – Standby – Based on SC3 Secondary (Frontier Region) – July 2007 to June 2008 ....................................................................................................................280
Service Classification 7 – Standby – Based on SC3 Secondary (Genesee Region) – February 2005 to January 2006 ......................................................................................................281
Service Classification 7 – Standby – Based on SC3 Secondary (Genesee Region) – October 2005 to September 2006..................................................................................................282
Service Classification 7 – Standby – Based on SC3 Secondary (Genesee Region) – July 2007 to June 2008 ...........................................................................................................283
Service Classification 7 – Standby – Based on SC3 Secondary (Central Region) – February 2005 to January 2006 ......................................................................................................284
Service Classification 7 – Standby – Based on SC3 Secondary (Central Region) – October 2005 to September 2006..................................................................................................285
Service Classification 7 – Standby – Based on SC3 Secondary (Central Region) – July 2007 to June 2008 ....................................................................................................................286
Service Classification 7 – Standby – Based on SC3 Secondary (Adirondack Region) – February 2005 to January 2006 .......................................................................................287

NYSERDA DG/CHP Integrated Database System Utility Rate Details
CDH Energy Corporation 14 September 25, 2008
Service Classification 7 – Standby – Based on SC3 Secondary (Adirondack Region) – October 2005 to September 2006....................................................................................288
Service Classification 7 – Standby – Based on SC3 Secondary (Adirondack Region) – July 2007 to June 2008 ...........................................................................................................289
Service Classification 7 – Standby – Based on SC3 Secondary (Utica Region) – February 2005 to January 2006 ......................................................................................................290
Service Classification 7 – Standby – Based on SC3 Secondary (Utica Region) – October 2005 to September 2006..................................................................................................291
Service Classification 7 – Standby – Based on SC3 Secondary (Utica Region) – July 2007 to June 2008 ........................................................................................................................292
Service Classification 7 – Standby – Based on SC3 Secondary (Capital Region) – February 2005 to January 2006 ......................................................................................................293
Service Classification 7 – Standby – Based on SC3 Secondary (Capital Region) – October 2005 to September 2006..................................................................................................294
Service Classification 7 – Standby – Based on SC3 Secondary (Capital Region) – July 2007 to June 2008 ....................................................................................................................295
Service Classification 7 – Standby – Based on SC3a Secondary (Frontier Region) – February 2005 to January 2006 ......................................................................................................296
Service Classification 7 – Standby – Based on SC3a Secondary (Frontier Region) – October 2005 to September 2006..................................................................................................297
Service Classification 7 – Standby – Based on SC3a Secondary (Frontier Region) – July 2007 to June 2008 ...........................................................................................................298
Service Classification 7 – Standby – Based on SC3a Secondary (Genesee Region) – February 2005 to January 2006 .......................................................................................299
Service Classification 7 – Standby – Based on SC3a Secondary (Genesee Region) – October 2005 to September 2006..................................................................................................300
Service Classification 7 – Standby – Based on SC3a Secondary (Genesee Region) – July 2007 to June 2008 ...........................................................................................................301
Service Classification 7 – Standby – Based on SC3a Secondary (Central Region) – February 2005 to January 2006 ......................................................................................................302
Service Classification 7 – Standby – Based on SC3a Secondary (Central Region) – October 2005 to September 2006..................................................................................................303
Service Classification 7 – Standby – Based on SC3a Secondary (Central Region) – July 2007 to June 2008 ....................................................................................................................304
Service Classification 7 – Standby – Based on SC3a Secondary (Adirondack Region) – February 2005 to January 2006 .......................................................................................305
Service Classification 7 – Standby – Based on SC3a Secondary (Adirondack Region) – October 2005 to September 2005....................................................................................306
Service Classification 7 – Standby – Based on SC3a Secondary (Adirondack Region) – July 2007 to June 2008 ...........................................................................................................307
Service Classification 7 – Standby – Based on SC3a Secondary (Utica Region) – February 2005 to January 2006 ......................................................................................................308
Service Classification 7 – Standby – Based on SC3a Secondary (Utica Region) – October 2005 to September 2006..................................................................................................309
Service Classification 7 – Standby – Based on SC3a Secondary (Utica Region) – July 2007 to June 2008 ....................................................................................................................310
Service Classification 7 – Standby – Based on SC3a Secondary (Capital Region) – February 2005 to January 2006 ......................................................................................................311
Service Classification 7 – Standby – Based on SC3a Secondary (Capital Region) – October 2005 to September 2006..................................................................................................312

NYSERDA DG/CHP Integrated Database System Utility Rate Details
CDH Energy Corporation 15 September 25, 2008
Service Classification 7 – Standby – Based on SC3a Secondary (Capital Region) – July 2007 to June 2008 ....................................................................................................................313
Service Classification 7 – Standby – Based on SC3a Primary (Central Region) – December 2006 to November 2007...................................................................................................314
Service Classification 3a – Large General Time-of-Use - Primary – Electric Supply Charge (Central Region) – May 2007 to April 2008......................................................................315
Service Classification 3a – Large General Time-of-Use – Subtransmission – Electric Supply Charge (Central Region) – May 2007 to April 2008 .........................................................316
Service Classification 7 – Standby – Based on SC3a Primary (Central Region) – May 2007 to April 2008 .........................................................................................................................317
Service Classification 7 – Standby – Based on SC3a Subtransmission (Central Region) – May 2007 to April 2008 ....................................................................................................318
Complete Orange & Rockland Utility Electric Tariff................................................................. 319 Service Classification 2 – General – Secondary – March 2005 to February 2006................319 Service Classification 2 – General – Secondary – November 2005 to October 2006...........320 Service Classification 2 – General – Secondary – July 2007 to June 2008..........................321 Service Classification 2 – General – Primary – March 2005 to February 2006 ....................322 Service Classification 2 – General – Primary – November 2005 to October 2006 ...............323 Service Classification 2 – General – Primary – July2007 to June 2008................................324 Service Classification 9 – General Large Commercial – Primary – March 2005 to February
2006 .................................................................................................................................325 Service Classification 9 – General Large Commercial – Primary – November 2005 to October
2006 .................................................................................................................................326 Service Classification 9 – General Large Commercial – Primary –July 2007 to June 2008 .327 Service Classification 20 – General Time-of-Use – March 2005 to February 2006 ..............328 Service Classification 20 – General Time-of-Use – November 2005 to October 2006 .........329 Service Classification 20 – General Time-of-Use – July 2007 to June 2008 ........................330 Service Classification 22 – General Large Manufacturing – Primary – March 2005 to February
2006 .................................................................................................................................331 Service Classification 22 – General Large Manufacturing – Primary – November 2005 to
October 2006 ...................................................................................................................332 Service Classification 22 – General Large Manufacturing – Primary – July 2007 to June 2008
.........................................................................................................................................333 Service Classification 25 – Standby – Based on SC2 Secondary – March 2005 to February
2006 .................................................................................................................................334 Service Classification 25 – Standby – Based on SC2 Secondary – November 2005 to
October 2006 ...................................................................................................................335 Service Classification 25 – Standby – Based on SC2 Secondary – July 2007 to June 2008336 Service Classification 25 – Standby – Based on SC2 Primary – March 2005 to February 2006
.........................................................................................................................................337 Service Classification 25 – Standby – Based on SC2 Primary – November 2005 to October
2006 .................................................................................................................................338 Service Classification 25 – Standby – Based on SC2 Primary – July 2007 to June 2008 ....339
Complete National Grid – Massachusetts Electric Tariff ........................................................... 340 Service Classification R-1 – Residential Regular – Variable Option – November 2005 to
October 2006 ...................................................................................................................340 Service Classification R-1 – Residential Regular – Variable Option – May 2006 to April 2007
.........................................................................................................................................340 Service Classification R-1 – Residential Regular – Variable Option – July 2007 to June 2008
.........................................................................................................................................341

NYSERDA DG/CHP Integrated Database System Utility Rate Details
CDH Energy Corporation 16 September 25, 2008
Service Classification R-1 – Residential Regular – Fixed Option – November 2005 to October 2006 .................................................................................................................................341
Service Classification R-1 – Residential Regular – Fixed Option – May 2006 to April 2007 341 Service Classification R-1 – Residential Regular – Fixed Option – July 2007 to June 2008 342 Service Classification R-4 – Residential Regular – Variable Option – November 2005 to
October 2006 ...................................................................................................................342 Service Classification R-4 – Residential Regular – Variable Option – May 2006 to April 2007
.........................................................................................................................................343 Service Classification R-4 – Residential Regular – Variable Option – July 2007-June 2008343 Service Classification R-4 – Residential Regular – Fixed Option – November 2005 to October
2006 .................................................................................................................................344 Service Classification R-4 – Residential Regular – Fixed Option – May 2006 to April 2007 344 Service Classification R-4 – Residential Regular – Fixed Option – July 2007 to June 2008 345 Service Classification G-1 – General Service – Variable Option – November 2005 to October
2006 .................................................................................................................................345 Service Classification G-1 – General Service – Variable Option – May 2006 to April 2007 .346 Service Classification G-1 – General Service – Variable Option – July 2007 to June 2008 .346 Service Classification G-1 – General Service – Fixed Option – November 2005 to October
2006 .................................................................................................................................346 Service Classification G-1 – General Service – Fixed Option – May 2006 to April 2007......347 Service Classification G-1 – General Service – Fixed Option – July 2007 to June 2008......347 Service Classification G-2 – General Service Demand – Southeastern Mass – Variable
Option – November 2005 to October 2006 ......................................................................347 Service Classification G-2 – General Service Demand – Southeastern Mass – Variable
Option – February 2006 to January 2007 ........................................................................348 Service Classification G-2 – General Service Demand – Southeastern Mass – Variable
Option –July 2007 to June 2008 ......................................................................................348 Service Classification G-2 – General Service Demand – Southeastern Mass – Fixed Option –
November 2005 to October 2006.....................................................................................349 Service Classification G-2 – General Service Demand – Southeastern Mass – Fixed Option –
February 2006 to January 2007 .......................................................................................349 Service Classification G-2 – General Service Demand – Southeastern Mass – Fixed Option –
July 2007 to June 2008 ....................................................................................................349 Service Classification G-2 – General Service Demand – Western and Central Mass –
Variable Option – November 2005 to October 2006 ........................................................350 Service Classification G-2 – General Service Demand – Western and Central Mass –
Variable Option – February 2006 to January 2007 ..........................................................350 Service Classification G-2 – General Service Demand – Western and Central Mass –
Variable Option – July 2007 to June 2008 .......................................................................351 Service Classification G-2 – General Service Demand – Western and Central Mass – Fixed
Option – November 2005 to October 2006 ......................................................................351 Service Classification G-2 – General Service Demand – Western and Central Mass – Fixed
Option – February 2006 to January 2007 ........................................................................352 Service Classification G-2 – General Service Demand – Western and Central Mass – Fixed
Option –July 2007 to June 2008 ......................................................................................352 Service Classification G-2 – General Service Demand – Northeastern Mass – Variable Option
– November 2005 to October 2006..................................................................................353 Service Classification G-2 – General Service Demand – Northeastern Mass – Variable Option
– February 2006 to January 2007 ....................................................................................353 Service Classification G-2 – General Service Demand – Northeastern Mass – Variable Option
– July 2007 to June 2008 .................................................................................................354

NYSERDA DG/CHP Integrated Database System Utility Rate Details
CDH Energy Corporation 17 September 25, 2008
Service Classification G-2 – General Service Demand – Northeastern Mass – Fixed Option – November 2005 to October 2006.....................................................................................354
Service Classification G-2 – General Service Demand – Northeastern Mass – Fixed Option – February 2006 to January 2007 .......................................................................................355
Service Classification G-2 – General Service Demand – Northeastern Mass – Fixed Option – July 2007 to June 2008 ....................................................................................................355
Service Classification G-3 – General Service Time-of-Use – Southeastern Mass – Variable Option – November 2005 to October 2006 ......................................................................356
Service Classification G-3 – General Service Time-of-Use – Southeastern Mass – Variable Option – February 2006 to January 2007 ........................................................................356
Service Classification G-3 – General Service Time-of-Use – Southeastern Mass – Variable Option – July 2007 to June 2008 .....................................................................................357
Service Classification G-3 – General Service Time-of-Use – Southeastern Mass – Fixed Option – November 2005 to October 2006 ......................................................................357
Service Classification G-3 – General Service Time-of-Use – Southeastern Mass – Fixed Option – February 2006 to January 2007 ........................................................................358
Service Classification G-3 – General Service Time-of-Use – Southeastern Mass – Fixed Option – July 2007 to June 2008 .....................................................................................358
Service Classification G-3 – General Service Time-of-Use – Western and Central Mass – Variable Option – November 2005 to October 2006 ........................................................359
Service Classification G-3 – General Service Time-of-Use – Western and Central Mass – Variable Option – February 2006 to January 2007 ..........................................................359
Service Classification G-3 – General Service Time-of-Use – Western and Central Mass – Variable Option – July 2007 to June 2008 .......................................................................360
Service Classification G-3 – General Service Time-of-Use – Western and Central Mass – Fixed Option – November 2005 to October 2006 ............................................................360
Service Classification G-3 – General Service Time-of-Use – Western and Central Mass – Fixed Option – February 2006 to January 2007...............................................................361
Service Classification G-3 – General Service Time-of-Use – Western and Central Mass – Fixed Option – July 2007 to June 2008............................................................................361
Service Classification G-3 – General Service Time-of-Use – Northeastern Mass – Variable Option – November 2005 to October 2006 ......................................................................362
Service Classification G-3 – General Service Time-of-Use – Northeastern Mass – Variable Option – February 2006 to January 2007 ........................................................................362
Service Classification G-3 – General Service Time-of-Use – Northeastern Mass – Variable Option – December 2006 to November 2007 ..................................................................363
Service Classification G-3 – General Service Time-of-Use – Northeastern Mass – Variable Option – July 2007 to June 2008 .....................................................................................364
Service Classification G-3 – General Service Time-of-Use – Northeastern Mass – Fixed Option – November 2005 to October 2006 ......................................................................364
Service Classification G-3 – General Service Time-of-Use – Northeastern Mass – Fixed Option – February 2006 to January 2007 ........................................................................365
Service Classification G-3 – General Service Time-of-Use – Northeastern Mass – Fixed Option – July 2007 to June 2008 .....................................................................................365
Complete National Grid – Rhode Island Electric Tariff............................................................. 366 Service Classification B-32 – C&I Supplemental – Standard Option – November 2005 to
October 2006 ...................................................................................................................366 Service Classification B-32 – C&I Supplemental – Standard Option – January 2007 .........366 Service Classification B-32 – C&I Supplemental – Standard Option – June 2008 ..............366 Service Classification B-62 – 3000 kW Supplemental – Standard Option – January 2006 ..367 Service Classification B-62 – 3000 kW Supplemental – Standard Option – January 2007 ..367

NYSERDA DG/CHP Integrated Database System Utility Rate Details
CDH Energy Corporation 18 September 25, 2008
Service Classification B-62 – 3000 kW Supplemental – Standard Option – December 2007.........................................................................................................................................367
Service Classification B-62 – 3000 kW Supplemental – Standard Option – June 2008 .......368 Service Classification G-32 – 200 kW Demand – Standard Option – November 2005 to
October 2006 ...................................................................................................................368 Service Classification G-32 – 200 kW Demand – Standard Option – January 2007 ...........368 Service Classification G-32 – 200 kW Demand – Standard Option – June 2008 ................369 Service Classification G-62 – 3000 kW Demand – Standard Option – January 2006 .........369 Service Classification G-62 – 3000 kW Demand – Standard Option – January 2007 .........369 Service Classification G-62 – 3000 kW Demand – Standard Option – December 2007 .....370 Service Classification G-62 – 3000 kW Demand – Standard Option – June 2008 ..............370
Complete Connecticut Light and Power Tariff........................................................................... 371 Rate 1 – Residential Electric Service – October 2006 ..........................................................371 Rate 1 – Residential Electric Service – June 2008 ...............................................................371 Rate 5 – Residential Electric Heating Service – October 2006.............................................372 Rate 5 – Residential Electric Heating Service – June 2008..................................................372 Rate 7 – Residential Time-of-Day Electric Service – October 2006 .....................................372 Rate 7 – Residential Time-of-Day Electric Service – June 2008 ..........................................373 Rate 27 – Small Time-of-Day General Electric Service – October 2006 ..............................373 Rate 27 – Small Time-of-Day General Electric Service – June 2008 ...................................374 Rate 30 – Small General Electric Service – October 2006 ...................................................374 Rate 30 – Small General Electric Service – June 2008 ........................................................375 Rate 55 – Intermediate Time-of-Day – Manufacturers – October 2006 ................................375 Rate 55 – Intermediate Time-of-Day – Manufacturers – June 2008 .....................................376 Rate 56 – Intermediate Time-of-Day – Non-Manufacturers – October 2006 ........................376 Rate 56 – Intermediate Time-of-Day – Non-Manufacturers – June 2008 .............................377 Rate 57 – Large Time-of-Day – Manufacturers – below 2000 kW – October 2006 ..............377 Rate 57 – Large Time-of-Day – Manufacturers – below 2000 kW – June 2008 ...................378 Rate 57 – Large Time-of-Day – Manufacturers – 2000 to 5000 kW – October 2006............378 Rate 57 – Large Time-of-Day – Manufacturers – 2000 to 5000 kW –June 2008..................379 Rate 57 – Large Time-of-Day – Manufacturers – above 5000 kW – October 2006..............379 Rate 57 – Large Time-of-Day – Manufacturers – above 5000 kW – June 2008...................380 Rate 58 – Large Time-of-Day – Non-Manufacturers – below 2000 kW – October 2006 ......380 Rate 58 – Large Time-of-Day – Non-Manufacturers – below 2000 kW – June 2008 ...........381 Rate 58– Large Time-of-Day – Non-Manufacturers – 2000 to 5000 kW – October 2006.....381 Rate 58– Large Time-of-Day – Non-Manufacturers – 2000 to 5000 kW – June 2008..........382 Rate 58 – Large Time-of-Day – Non-Manufacturers – above 5000 kW – October 2006 ......382 Rate 58 – Large Time-of-Day – Non-Manufacturers – above 5000 kW – June 2008 ...........383 Rate 984 Supplemental – based on Rate 55 – Intermediate Time-of-Day – Manufacturers –
October 2006 ...................................................................................................................383 Rate 984 Supplemental – based on Rate 55 – Intermediate Time-of-Day – Manufacturers –
June 2008 ........................................................................................................................384 Rate 984 Supplemental – based on Rate 56 – Intermediate Time-of-Day – Non-
Manufacturers – October 2006 ........................................................................................384 Rate 984 Supplemental – based on Rate 56 – Intermediate Time-of-Day – Non-
Manufacturers – June 2008 .............................................................................................385 Rate 984 Supplemental – based on Rate 57 – Large Time-of-Day – Manufacturers – below
2000 kW – October 2006 .................................................................................................385 Rate 984 Supplemental – based on Rate 57 – Large Time-of-Day – Manufacturers – below
2000 kW – June 2008 ......................................................................................................386

NYSERDA DG/CHP Integrated Database System Utility Rate Details
CDH Energy Corporation 19 September 25, 2008
Rate 984 Supplemental – based on Rate 57 – Large Time-of-Day – Manufacturers – 2000 to 5000 kW – October 2006 .................................................................................................386
Rate 984 Supplemental – based on Rate 57 – Large Time-of-Day – Manufacturers – 2000 to 5000 kW – June 2008 ......................................................................................................387
Rate 984 Supplemental – based on Rate 57 – Large Time-of-Day – Manufacturers – above 5000 kW – October 2006 .................................................................................................387
Rate 984 Supplemental – based on Rate 57 – Large Time-of-Day – Manufacturers – above 5000 kW – June 2008 ......................................................................................................388
Rate 984 Supplemental – based on Rate 58 – Large Time-of-Day – Non-Manufacturers – below 2000 kW – October 2006.......................................................................................388
Rate 984 Supplemental – based on Rate 58 – Large Time-of-Day – Non-Manufacturers – below 2000 kW – June 2008............................................................................................389
Rate 984 Supplemental – based on Rate 58 – Large Time-of-Day – Non-Manufacturers –2000 to 5000 kW – October 2006 ....................................................................................389
Rate 984 Supplemental – based on Rate 58 – Large Time-of-Day – Non-Manufacturers –2000 to 5000 kW – June 2008 .........................................................................................390
Rate 984 Supplemental – based on Rate 58 – Large Time-of-Day – Non-Manufacturers – above 5000 kW – October 2006 ......................................................................................390
Rate 984 Supplemental – based on Rate 58 – Large Time-of-Day – Non-Manufacturers – above 5000 kW – June 2008 ...........................................................................................391
Complete Western Massachusetts Electric Co. Tariff ................................................................ 392 Rate T-2 - Large Primary Time-of-Use – Fixed Pricing Option – March 2006 ......................392 Rate T-2 - Large Primary Time-of-Use – Fixed Pricing Option – December 2006................393 Rate T-2 - Large Primary Time-of-Use – Fixed Pricing Option – June 2008 ........................393
Complete Rochester Gas & Electric Tariff ................................................................................. 394 Service Classification 8 – Large General Time-of-Use – Fixed Pricing – Secondary – March
2006 .................................................................................................................................394 Service Classification 8 – Large General Time-of-Use – Fixed Pricing – Secondary – October
2006 .................................................................................................................................394 Service Classification 8 – Large General Time-of-Use – Fixed Pricing – Secondary – June
2008 .................................................................................................................................395 Summary of Alaska Light & Power Rates.................................................................................. 396
Rate 10 – General Residential ..............................................................................................396 Rate 10 – General Residential - June 2008..........................................................................396 Rate 10-D –Residential with Demand...................................................................................396 Rate 20 – Small Commercial ................................................................................................397 Rate 20-D – Small Commercial with Demand.......................................................................397 Rate 24 – Large Commercial ................................................................................................397 Rate 41 – Manufacturing.......................................................................................................398
Complete Pacific Gas & Electric Tariff...................................................................................... 399 Rate Schedule E-1 – Residential Service – Baseline P – July 2006.....................................399 Rate Schedule E-1 – Residential Service – Baseline P – October 2006 ..............................399 Rate Schedule E-1 – Residential Service – Baseline P – January 2007 ..............................400 Rate Schedule E-1 – Residential Service – Baseline P – July 2008.....................................400 Rate Schedule E-7 – Residential Time-of-Use – Baseline P – July 2006.............................401 Rate Schedule E-7 – Residential Time-of-Use – Baseline P – October 2006 ......................401 Rate Schedule E-7 – Residential Time-of-Use – Baseline P – January 2007 ......................402 Rate Schedule E-7 – Residential Time-of-Use – Baseline P – July 2008.............................402 Rate Schedule ES – Multi-Family – Baseline P – January 2007 ..........................................403 Rate Schedule ES – Multi-Family – Baseline P – July08......................................................403

NYSERDA DG/CHP Integrated Database System Utility Rate Details
CDH Energy Corporation 20 September 25, 2008
Rate Schedule A-1 – Small General Service – Single-Phase – July 2006 ...........................404 Rate Schedule A-1 – Small General Service – Single-Phase – October 2006.....................404 Rate Schedule A-1 – Small General Service – Single-Phase – July 2008 ...........................405 Rate Schedule A-1 – Small General Service – Poly-Phase – July 2006 ..............................405 Rate Schedule A-1 – Small General Service – Poly-Phase – October 2006 ........................406 Rate Schedule A-1 – Small General Service – Poly-Phase – July 2008 ..............................406 Rate Schedule A-6 – Small General Time-of-Use – Single-Phase – July 2006....................407 Rate Schedule A-6 – Small General Time-of-Use – Single-Phase – October 2006 .............407 Rate Schedule A-6 – Small General Time-of-Use – Single-Phase – July 2008....................408 Rate Schedule A-6 – Small General Time-of-Use – Poly-Phase – July 2006.......................408 Rate Schedule A-6 – Small General Time-of-Use – Poly-Phase – October 2006 ................409 Rate Schedule A-6 – Small General Time-of-Use – Poly-Phase – July 2008.......................409 Rate Schedule E-19 – Medium General Demand-Metered Time-of-Use – Secondary – July
2006 .................................................................................................................................410 Rate Schedule E-19 – Medium General Demand-Metered Time-of-Use – Secondary –
October 2006 ...................................................................................................................410 Rate Schedule E-19 – Medium General Demand-Metered Time-of-Use – Secondary – July
2008 .................................................................................................................................411 Rate Schedule E-19 – Medium General Demand-Metered Time-of-Use – Secondary - Fixed
Transition – July 2006 ......................................................................................................411 Rate Schedule E-19 – Medium General Demand-Metered Time-of-Use – Secondary - Fixed
Transition – October 2006................................................................................................412 Rate Schedule E-19 – Medium General Demand-Metered Time-of-Use – Secondary - Fixed
Transition – July 2008 ......................................................................................................413 Rate Schedule E-19 – Medium General Demand-Metered Time-of-Use – Primary – July 2006
.........................................................................................................................................413 Rate Schedule E-19 – Medium General Demand-Metered Time-of-Use – Primary – October
2006 .................................................................................................................................414 Rate Schedule E-19 – Medium General Demand-Metered Time-of-Use – Primary – July 2008
.........................................................................................................................................414 Rate Schedule E-19 – Medium General Demand-Metered Time-of-Use – Primary – Fixed
Transition – July 2006 ......................................................................................................415 Rate Schedule E-19 – Medium General Demand-Metered Time-of-Use – Primary – Fixed
Transition – October 2006................................................................................................416 Rate Schedule E-19 – Medium General Demand-Metered Time-of-Use – Primary – Fixed
Transition – July 2008 ......................................................................................................417 Complete Southern California Edison Tariff.............................................................................. 418
Schedule D Domestic - Single-Family - Baseline 10 – Single Family ...................................418 Schedule D Domestic - Single-Family - Baseline 10 – Single Family – January 07 .............418 Schedule D Domestic - Single-Family - Baseline 10 – Single Family – June 2008 ..............419 Schedule D Domestic - Multi-Family - Baseline 10 – Multi Family – January 07 ..................419 Schedule D Domestic - Multi-Family - Baseline 10 – Multi Family – June 2008 ...................419 Schedule D Domestic - Single-Family - Baseline 10 – Single Family All Electric .................420 Schedule D Domestic - Single-Family - Baseline 10 – Single Family All Electric – January 07
.........................................................................................................................................420 Schedule D Domestic - Single-Family - Baseline 10 – Single Family All Electric – June 2008
.........................................................................................................................................421 Schedule D Domestic - Multi-Family - Baseline 10 – Multi Family All Electric – January 07 421 Schedule D Domestic - Multi-Family - Baseline 10 – Multi Family All Electric – June 2008 .422 Schedule D Domestic - Single-Family - Baseline 15 – Single Family ...................................422 Schedule D Domestic - Single-Family - Baseline 15 – Single Family – January 07 .............423

NYSERDA DG/CHP Integrated Database System Utility Rate Details
CDH Energy Corporation 21 September 25, 2008
Schedule D Domestic - Single-Family - Baseline 15 – Single Family – June 2008 ..............423 Schedule D Domestic - Multi-Family - Baseline 15 – Multi Family – January 07 ..................424 Schedule D Domestic - Multi-Family - Baseline 15 – Multi Family – June 2008 ...................424 Schedule D Domestic - Single-Family - Baseline 15 – Single Family All Electric .................425 Schedule D Domestic - Single-Family - Baseline 15 – Single Family All Electric – January 07
.........................................................................................................................................425 Schedule D Domestic - Single-Family - Baseline 15 – Single Family All Electric – June 2008
.........................................................................................................................................426 Schedule D Domestic - Multi-Family - Baseline 15 – Multi Family All Electric – January 07 426 Schedule D Domestic - Multi-Family - Baseline 15 – Multi Family All Electric – June 2008 .427 Schedule GS-1 General Service Non-Demand – Secondary Single-Phase .........................427 Schedule GS-1 General Service Non-Demand – Secondary Single-Phase June 2008 .......427 Schedule GS-1 General Service Non-Demand – Secondary Three-Phase..........................428 Schedule GS-1 General Service Non-Demand – Secondary Three-Phase – June 2008.....428 Schedule GS-1 General Service Non-Demand – Primary ....................................................429 Schedule GS-1 General Service Non-Demand – Primary – June 2008 ...............................429 Schedule GS-2 General Service Demand – Secondary Single-Phase.................................430 Schedule GS-2 General Service Demand – Secondary Single-Phase – June 2008 ............430 Schedule GS-2 General Service Demand – Secondary Three-Phase .................................431 Schedule GS-2 General Service Demand – Secondary Three-Phase –June 2008..............431 Schedule GS-2 General Service Demand – Time-of-Use - Secondary Single-Phase..........432 Schedule GS-2 General Service Demand – Time-of-Use - Secondary Single-Phase – June
2008 .................................................................................................................................433 Schedule GS-2 General Service Demand – Time-of-Use - Secondary Three-Phase ..........434 Schedule GS-2 General Service Demand – Time-of-Use - Secondary Three-Phase – June
2008 .................................................................................................................................435 Schedule TOU-8 – General Service - Large .........................................................................436 Schedule TOU-8 – General Service - Large – June 2008 ....................................................437 Schedule TOU-8 – General Service – Large – 2 kV through 50 kV – December 2007 ........438 Schedule TOU-8 – General Service – Large – 2 kV through 50 kV – June 2008 .................439
Complete Florida Light & Power Tariff ..................................................................................... 440 Rate Schedule RS-1 – Residential Service...........................................................................440 Rate Schedule RS-1 – Residential Service – June 2008......................................................440 Rate Schedule RST-1 – Residential Service - Time-of-Use .................................................440 Rate Schedule RST-1 – Residential Service - Time-of-Use – June 2008.............................441 Rate Schedule GS-1 – General Service Non-Demand.........................................................441 Rate Schedule GS-1 – General Service Non-Demand – June 2008 ....................................441 Rate Schedule GST-1 – General Service Non-Demand Time-of-Use ..................................442 Rate Schedule GST-1 – General Service Non-Demand Time-of-Use - June 2008 ..............442 Rate Schedule GSD-1 – General Service Demand ..............................................................442 Rate Schedule GSD-1 – General Service Demand - June 2008 .........................................443 Rate Schedule GSDT-1 – General Service Demand – Time-of-Use ....................................443 Rate Schedule GSDT-1 – General Service Demand – Time-of-Use - June 2008 ...............444
Complete Commonwealth Edison Company Tariff ................................................................... 445 Rate 1 - Residential Service..................................................................................................445 Rate 1 - Residential Service - July 2008...............................................................................445 Rate 1DR Residential Service – Time of Day .......................................................................446 Rate 1DR Residential Service – Time of Day - July 2008.....................................................446 Rate 14 - Residential Service – Space Heating....................................................................447 Rate 14 - Residential Service – Space Heating - July 2008 .................................................447 Rate 6 – General Service – Non-Time of Day.......................................................................448

NYSERDA DG/CHP Integrated Database System Utility Rate Details
CDH Energy Corporation 22 September 25, 2008
Rate 6 – General Service – Non-Time of Day - July 2008....................................................448 Rate 6 – General Service – Time of Day ..............................................................................449 Rate 6 – General Service – Time of Day - July 2008............................................................449 Rate 6L – Large General Service – Time of Day – Less than 10,000 kW ............................450 Rate 6L – Large General Service – Time of Day – Less than 10,000 kW – December 2007
.........................................................................................................................................450 Rate 6L – Large General Service – Time of Day – Less than 10,000 kW – July 2008 .........451 Rate 18 Standby - Less than 500 kW Generation.................................................................452 Rate 18 Standby - Less than 500 kW Generation - July 2008..............................................453 Rate 18 Standby - 1000 kW to 10000 kW Generation – December 2007 ............................454 Rate 18 Standby - 1000 kW to 10000 kW Generation – July 2008\......................................455
Complete Commonwealth Electric Tariff................................................................................... 456 Rate R-1 - Residential...........................................................................................................456 Rate R-1 - Residential - July 2008 ........................................................................................456 Rate R-3 – Residential Space Heating .................................................................................456 Rate R-3 – Residential Space Heating - July 2008...............................................................457 Rate R-6 – Residential Time-of-Use .....................................................................................457 Rate R-5 – Residential Time-of-Use - July 2008...................................................................457 Rate G-1 – General Service..................................................................................................458 Rate G-1 – General Service - July 2008 ...............................................................................458 Rate G-2 – Medium General Time-of-Use ............................................................................459 Rate SB-G2 – General Service Standby - Supplemental......................................................459
Average Hawaiian Electric Company Rates............................................................................... 460 Schedule R – Residential Service – Single-Phase Service ..................................................460 Schedule R – Residential Service – Three-Phase Service ...................................................460 Schedule G – General Service Non-Demand – Single-Phase Service.................................460 Schedule G – General Service Non-Demand – Secondary ..................................................461 Schedule G – General Service Non-Demand – Primary.......................................................461 Schedule J – General Service Demand – Secondary Single Phase.....................................461 Schedule J – General Service Demand – Secondary Three Phase .....................................462 Schedule U – Time-of-Use Service.......................................................................................462
Complete PPL Electric Utilities Tariff ....................................................................................... 463 Rate Schedule RS – Residential Service..............................................................................463 Rate Schedule RS – Residential Service - July 2008 ...........................................................463 Rate Schedule RTD – Residential Service – Time-of-Day....................................................464 Rate Schedule RTD – Residential Service – Time-of-Day - July 2008 .................................464 Rate Schedule GS-1 – Small General Service – Secondary Voltage ...................................465 Rate Schedule GS-1 – Small General Service – Secondary Voltage - July 2008 ................465 Rate Schedule GS-3 – Large General Service – Secondary Voltage...................................466 Rate Schedule GS-3 – Large General Service – Secondary Voltage or Higher – December
2007 .................................................................................................................................466 Rate Schedule GS-3 – Large General Service – Secondary Voltage or Higher – July 2008466 Rate Schedule DR – Residential Service – Inland Baseline – January 2007 .......................467 Rate Schedule DR – Residential Service – Inland Baseline – July 2008..............................467 Rate Schedule DR – Residential Service – Inland Baseline – All Electric – January 2007 ..468 Rate Schedule DR – Residential Service – Inland Baseline – All Electric – July 2008.........468 Rate Schedule DR – Residential Service - TOU – Inland Baseline – January 2007 ............469 Rate Schedule DR – Residential Service - TOU – Inland Baseline – July 2008...................469 Rate Schedule DR – Residential Service - TOU – Inland Baseline – All Electric – January
2007 .................................................................................................................................470

NYSERDA DG/CHP Integrated Database System Utility Rate Details
CDH Energy Corporation 23 September 25, 2008
Rate Schedule DR – Residential Service - TOU – Inland Baseline – All Electric – July 2008.........................................................................................................................................470
Rate Schedule DM – Multi-Family Service – Inland Baseline – January 2007 .....................471 Rate Schedule DM – Multi-Family Service – Inland Baseline – July 2008............................471 Rate Schedule DM – Multi-Family Service – Inland Baseline – All Electric – January 2007 472 Rate Schedule DM – Multi-Family Service – Inland Baseline – All Electric – July 2008.......472 Rate Schedule R – Residential Service – RSE – January 2007...........................................473 Rate Schedule R – Residential Service – RSE – July 2008 .................................................473 Rate Schedule R – Residential Service – RWE – January 2007..........................................474 Rate Schedule R – Residential Service – RWE – July 2008 ................................................474 Rate Schedule R – Residential Service – TOU Option 1 - RTE – January 2007..................475 Rate Schedule R – Residential Service – TOU Option 1 - RTE – July 2008 ........................475 Rate Schedule R – Residential Service – TOU Option 2 – RTE5 – January 2007 ...............476 Rate Schedule R – Residential Service – TOU Option 2 – RTE5 – July 2008 .....................476 Class D-4 – Primary Power Large Rate – Time-of-Use ........................................................477 Class SB-L5 – Standby Large General Service at Primary Voltage – 50% Generation
Capacity ...........................................................................................................................478

NYSERDA DG/CHP Integrated Database System Utility Rate Details
CDH Energy Corporation 24 September 25, 2008
Complete Consolidated Edison Electric Tariff
Currently the Consolidated Edison rate definitions encompass the tariff release on April 1, 2008. The variable monthly charges are from documents available at the Consolidated Edison website covering May 2005 – April 2006, and November 2005 – October 2006 and July 2007 – June 2008.
Consolidated Edison
Service Classification 1-1 – Residential and Religious for New York City – February 2006 to January 2007 This rate has a block structure for both demand and energy with a maximum rate limit. This is for all customers, including water heating customers, other than those billed under Rate II. Customers can choose between this rate and SC1-2. Only residencies located in a New York City borough can take service under this rate. Service Charge $ 11.04 Periods Summer June 1 – September 30 Other All Hours not included in Summer Energy Charges $ per total kWh within defined period System Benefits Charge, Renewable Portfolio Charge $ 0.0020 / kWh for all periods Market Supply and Monthly Adjustment $ / kWh Jan Feb Mar Apr May Jun Jul Aug Sep Oct Nov Dec $ 0.1203 $ 0.1434 $ 0.1404 $ 0.1345 $ 0.1334 $ 0.1423 $ 0.1488 $ 0.1388 $ 0.1264 $ 0.1337 $ 0.1105 $ 0.1192 Block Charges: Transmission and Distribution Charges First 250 kWh Over 250 kWh Summer $0.05177 / kWh $0.05827 / kWh Other $0.05177 / kWh $0.04759 / kWh
Filename: CONED_SC1-1_NYC_Feb06-Jan07.csv

NYSERDA DG/CHP Integrated Database System Utility Rate Details
CDH Energy Corporation 25 September 25, 2008
Consolidated Edison
Service Classification 1-1 – Residential and Religious for New York City – July 2007 to June 2008 This rate has a block structure for both demand and energy with a maximum rate limit. This is for all customers, including water heating customers, other than those billed under Rate II. Customers can choose between this rate and SC1-2. Only residencies located in a New York City borough can take service under this rate. Service Charge $ 12.42 Periods Summer June 1 – September 30 Other All Hours not included in Summer Energy Charges $ per total kWh within defined period System Benefits Charge, Renewable Portfolio Charge $ 0.0022 / kWh for all periods Market Supply and Monthly Adjustment $ / kWh Jan Feb Mar Apr May Jun Jul Aug Sep Oct Nov Dec $ 0.1388 $ 0.1452 $ 0.1331 $ 0.1362 $ 0.1450 $ 0.1483 $ 0.1617 $ 0.1504 $ 0.1374 $ 0.1396 $ 0.1237 $ 0.1250 Block Charges: Transmission and Distribution Charges First 250 kWh Over 250 kWh Summer $0.05823 / kWh $0.06554 / kWh Other $0.05823 / kWh $0.05353 / kWh
Filename: CONED_SC1-1_NYC_Jul07-Jun08.csv
Consolidated Edison
Service Classification 1-2 – Residential and Religious – Voluntary Time-of-Day for New York City – February 2006 to January 2007 This rate has variable energy rates from February 2006 through January 2007 from the utility tariffs. There is no demand charge. This is for customers who elect to be billed at a time-of-day rate. Customers can choose between this rate and SC1-1. Only facilities located in a New York City borough can take service under this rate. Service Charge $ 15.83 Periods On-Peak 10 AM – 10 PM Off-Peak All Hours not included in On-Peak Energy Charges1 $ per total kWh within defined period System Benefits Charge, Competitive Supply Related Charge, Competitive Supply Collections-Related Surcharge, Renewable Portfolio Charge $ 0.0057 / kWh for all periods Market Supply and Monthly Adjustment, Energy Delivery Charge On-Peak Charges $ / kWh Jan Feb Mar Apr May Jun Jul Aug Sep Oct Nov Dec $ 0.2524 $ 0.2698 $ 0.2662 $ 0.2606 $ 0.2824 $ 0.4144 $ 0.4121 $ 0.4042 $ 0.3846 $ 0.2729 $ 0.2303 $ 0.2355 Off-Peak Charges $ / kWh Jan Feb Mar Apr May Jun Jul Aug Sep Oct Nov Dec $ 0.0860 $ 0.0998 $ 0.0972 $ 0.0908 $ 0.0778 $ 0.0833 $ 0.0947 $ 0.0834 $ 0.0773 $ 0.0846 $ 0.0731 $ 0.0839
Filename: CONED_SC1-2_NYC_ Feb06-Jan07.csv

NYSERDA DG/CHP Integrated Database System Utility Rate Details
CDH Energy Corporation 26 September 25, 2008
Consolidated Edison
Service Classification 2-1 – General Small for New York City – May 2005 to April 2006 This rate has a block structure for both demand and energy with a maximum rate limit. The facility's peak demand must be less than 10 kW to qualify for service under this classification. Customers can choose between this rate and SC2-2. Only facilities located in a New York City borough can take service under this rate. Service Charge $ 13.32 Periods Summer June 1 – September 30 Other All Hours not included in Summer Energy Charges $ per total kWh within defined period System Benefits Charge, Renewable Portfolio Charge $ 0.0018 / kWh for all periods Market Supply and Monthly Adjustment $ / kWh Jan Feb Mar Apr May Jun Jul Aug Sep Oct Nov Dec $ 0.1549 $ 0.1568 $ 0.1535 $ 0.1462 $ 0.1465 $ 0.1465 $ 0.1466 $ 0.1507 $ 0.1448 $ 0.1429 $ 0.1359 $ 0.1371 Block Charges: Transmission and Distribution Charges 0-900 kWh 900-2000 kW Over 2000 kWh Summer $0.0666 / kWh $0.0596 / kWh $0.0274 / kWh Other $0.0596 / kWh $0.0500 / kWh $0.0169 / kWh
Filename: CONED_SC2-1_NYC_May05-Apr06.csv
Consolidated Edison
Service Classification 2-1 – General Small for New York City – November 2005 to October 2006 This rate has a block structure for both demand and energy with a maximum rate limit. The facility's peak demand must be less than 10 kW to qualify for service under this classification. Customers can choose between this rate and SC2-2. Only facilities located in a New York City borough can take service under this rate. Service Charge $ 13.32 Periods Summer June 1 – September 30 Other All Hours not included in Summer Energy Charges $ per total kWh within defined period System Benefits Charge, Renewable Portfolio Charge $ 0.0018 / kWh for all periods Market Supply and Monthly Adjustment $ / kWh Jan Feb Mar Apr May Jun Jul Aug Sep Oct Nov Dec $ 0.1549 $ 0.1568 $ 0.1535 $ 0.1462 $ 0.1522 $ 0.1660 $ 0.1659 $ 0.1643 $ 0.1517 $ 0.1542 $ 0.1359 $ 0.1371 Block Charges: Transmission and Distribution Charges 0-900 kWh 900-2000 kW Over 2000 kWh Summer $0.0697 / kWh $0.0623 / kWh $0.0274 / kWh Other $0.0596 / kWh $0.0500 / kWh $0.0169 / kWh
Filename: CONED_SC2-1_NYC_Nov05-Oct06.csv

NYSERDA DG/CHP Integrated Database System Utility Rate Details
CDH Energy Corporation 27 September 25, 2008
Consolidated Edison
Service Classification 2-1 – General Small for New York City – July 2007 to June 2008 This rate has a block structure for both demand and energy with a maximum rate limit. The facility's peak demand must be less than 10 kW to qualify for service under this classification. Customers can choose between this rate and SC2-2. Only facilities located in a New York City borough can take service under this rate. Service Charge $ 15.08 Periods Summer June 1 – September 30 Other All Hours not included in Summer Energy Charges $ per total kWh within defined period System Benefits Charge, Renewable Portfolio Charge $ 0.0024 / kWh for all periods Market Supply and Monthly Adjustment $ / kWh Jan Feb Mar Apr May Jun Jul Aug Sep Oct Nov Dec $ 0.1522 $ 0.1529 $ 0.1445 $ 0.1485 $ 0.1441 $ 0.1537 $ 0.1874 $ 0.1828 $ 0.1698 $ 0.1685 $ 0.1407 $ 0.1417 Block Charges: Transmission and Distribution Charges 0-900 kWh 900-2000 kW Over 2000 kWh Summer $0.0789 / kWh $0.0705 / kWh $0.0324 / kWh Other $0.0674 / kWh $0.0592 / kWh $0.0200 / kWh
Filename: CONED_SC2-1_NYC_Jul07-Jun08.csv
Consolidated Edison
Service Classification 2-1 – General Small for Westchester County - May 2005 to April 2006 This rate has a block structure for both demand and energy with a maximum rate limit. The facility's peak demand must be less than 10 kW to qualify for service under this classification. Customers can choose between this rate and SC2-2. Only facilities located in Westchester County can take service under this rate. Service Charge $ 13.32 Periods Summer June 1 – September 30 Other All Hours not included in Summer Energy Charges $ per total kWh within defined period System Benefits Charge, Renewable Portfolio Charge $ 0.0018 / kWh for all periods Market Supply and Monthly Adjustment $ / kWh Jan Feb Mar Apr May Jun Jul Aug Sep Oct Nov Dec $ 0.1265 $ 0.1433 $ 0.1383 $ 0.1319 $ 0.1379 $ 0.1371 $ 0.1328 $ 0.1381 $ 0.1346 $ 0.1332 $ 0.1202 $ 0.1208 Block Charges: Transmission and Distribution Charges 0-900 kWh 900-2000 kW Over 2000 kWh Summer $0.0666 / kWh $0.0596 / kWh $0.0274 / kWh Other $0.0596 / kWh $0.0500 / kWh $0.0169 / kWh
Filename: CONED_SC2-1_West_ May05-Apr06.csv

NYSERDA DG/CHP Integrated Database System Utility Rate Details
CDH Energy Corporation 28 September 25, 2008
Consolidated Edison
Service Classification 2-1 – General Small for Westchester County – November 2005 to October 2006 This rate has a block structure for both demand and energy with a maximum rate limit. The facility's peak demand must be less than 10 kW to qualify for service under this classification. Customers can choose between this rate and SC2-2. Only facilities located in Westchester County can take service under this rate. Service Charge $ 13.32 Periods Summer June 1 – September 30 Other All Hours not included in Summer Energy Charges $ per total kWh within defined period System Benefits Charge, Renewable Portfolio Charge $ 0.0018 / kWh for all periods Market Supply and Monthly Adjustment $ / kWh Jan Feb Mar Apr May Jun Jul Aug Sep Oct Nov Dec $ 0.1265 $ 0.1433 $ 0.1383 $ 0.1319 $ 0.1054 $ 0.1168 $ 0.1152 $ 0.1234 $ 0.1174 $ 0.1207 $ 0.1202 $ 0.1208 Block Charges: Transmission and Distribution Charges 0-900 kWh 900-2000 kW Over 2000 kWh Summer $0.0697 / kWh $0.0623 / kWh $0.0287 / kWh Other $0.0596 / kWh $0.0523 / kWh $0.0177 / kWh
Filename: CONED_SC2-1_West_ Nov05-Oct06.csv
Consolidated Edison
Service Classification 2-1 – General Small for Westchester County –July 2007 to June 2008 This rate has a block structure for both demand and energy with a maximum rate limit. The facility's peak demand must be less than 10 kW to qualify for service under this classification. Customers can choose between this rate and SC2-2. Only facilities located in Westchester County can take service under this rate. Service Charge $ 15.08 Periods Summer June 1 – September 30 Other All Hours not included in Summer Energy Charges $ per total kWh within defined period System Benefits Charge, Renewable Portfolio Charge $ 0.0024 / kWh for all periods Market Supply and Monthly Adjustment $ / kWh Jan Feb Mar Apr May Jun Jul Aug Sep Oct Nov Dec $ 0.1242 $ 0.1284 $ 0.1217 $ 0.1288 $ 0.1265 $ 0.1348 $ 0.1270 $ 0.1303 $ 0.1224 $ 0.1218 $ 0.1167 $ 0.1176 Block Charges: Transmission and Distribution Charges 0-900 kWh 900-2000 kW Over 2000 kWh Summer $0.0789 / kWh $0.0705 / kWh $0.0324 / kWh Other $0.0674/ kWh $0.0592 / kWh $0.0200 / kWh
Filename: CONED_SC2-1_West_ Jul07-Jun08.csv

NYSERDA DG/CHP Integrated Database System Utility Rate Details
CDH Energy Corporation 29 September 25, 2008
Consolidated Edison
Service Classification 2-2 – General Small Time-of-Use for New York City – May 2005 to April 2006 This rate has variable energy rates from May 2005 through April 2005 from the utility tariffs. There is no demand charge. A facility must have a peak demand less than 10 kW to qualify for service under this rate. Customers can choose between this rate and SC2-1. Only facilities located in a New York City borough can take service under this rate. Service Charge $ 19.73 Periods On-Peak 8 AM – 10 PM Off-Peak All Hours not included in On-Peak Energy Charges1 $ per total kWh within defined period System Benefits Charge, Competitive Supply Related Charge, Competitive Supply Collections-Related Surcharge, Renewable Portfolio Charge $ 0.0045 / kWh for all periods Market Supply and Monthly Adjustment, Energy Delivery Charge On-Peak Charges $ / kWh Jan Feb Mar Apr May Jun Jul Aug Sep Oct Nov Dec $ 0.2735 $ 0.2646 $ 0.2608 $ 0.2549 $ 0.2616 $ 0.3348 $ 0.3323 $ 0.3397 $ 0.3253 $ 0.2540 $ 0.2388 $ 0.2412 Off-Peak Charges $ / kWh Jan Feb Mar Apr May Jun Jul Aug Sep Oct Nov Dec $ 0.1279 $ 0.1009 $ 0.0983 $ 0.0915 $ 0.0739 $ 0.0692 $ 0.0865 $ 0.0795 $ 0.0813 $ 0.0826 $ 0.1053 $ 0.1083
Filename: CONED_SC2-2_NYC_ May05-Apr06.csv
Consolidated Edison
Service Classification 2-2 – General Small Time-of-Use for New York City – November 2005 to October 2006 This rate has variable energy rates from May 2005 through April 2005 from the utility tariffs. There is no demand charge. A facility must have a peak demand less than 10 kW to qualify for service under this rate. Customers can choose between this rate and SC2-1. Only facilities located in a New York City borough can take service under this rate. Service Charge $ 19.73 Periods On-Peak 8 AM – 10 PM Off-Peak All Hours not included in On-Peak Energy Charges1 $ per total kWh within defined period System Benefits Charge, Competitive Supply Related Charge, Competitive Supply Collections-Related Surcharge, Renewable Portfolio Charge $ 0.0045 / kWh for all periods Market Supply and Monthly Adjustment, Energy Delivery Charge On-Peak Charges $ / kWh Jan Feb Mar Apr May Jun Jul Aug Sep Oct Nov Dec $ 0.2735 $ 0.2646 $ 0.2608 $ 0.2549 $ 0.2757 $ 0.3604 $ 0.3551 $ 0.3584 $ 0.3399 $ 0.2738 $ 0.2388 $ 0.2412 Off-Peak Charges $ / kWh Jan Feb Mar Apr May Jun Jul Aug Sep Oct Nov Dec $ 0.1279 $ 0.1009 $ 0.0983 $ 0.0915 $ 0.0801 $ 0.0874 $ 0.0942 $ 0.0863 $ 0.0818 $ 0.0865 $ 0.1053 $ 0.1083
Filename: CONED_SC2-2_NYC_ Nov05-Oct06.csv

NYSERDA DG/CHP Integrated Database System Utility Rate Details
CDH Energy Corporation 30 September 25, 2008
Consolidated Edison
Service Classification 2-2 – General Small Time-of-Use for New York City – July 2007 to June 2008 This rate has variable energy rates from May 2005 through April 2005 from the utility tariffs. There is no demand charge. A facility must have a peak demand less than 10 kW to qualify for service under this rate. Customers can choose between this rate and SC2-1. Only facilities located in a New York City borough can take service under this rate. Service Charge $ 21.94 Periods On-Peak 8 AM – 10 PM Off-Peak All Hours not included in On-Peak Energy Charges1 $ per total kWh within defined period System Benefits Charge, Competitive Supply Related Charge, Competitive Supply Collections-Related Surcharge, Renewable Portfolio Charge $ 0.0024 / kWh for all periods Market Supply and Monthly Adjustment, Energy Delivery Charge On-Peak Charges $ / kWh Jan Feb Mar Apr May Jun Jul Aug Sep Oct Nov Dec $ 0.2744 $ 0.2739 $ 0.2710 $ 0.2754 $ 0.2639 $ 0.3556 $ 0.4154 $ 0.4098 $ 0.3904 $ 0.3125 $ 0.2644 $ 0.2688 Off-Peak Charges $ / kWh Jan Feb Mar Apr May Jun Jul Aug Sep Oct Nov Dec $ 0.1030 $ 0.1050 $ 0.0900 $ 0.0939 $ 0.0945 $ 0.0954 $ 0.0954 $ 0.0920 $ 0.0875 $ 0.0881 $ 0.0866 $ 0.0867
Filename: CONED_SC2-2_NYC_ Jul07-Jun08.csv
Consolidated Edison
Service Classification 2-2 – General Small Time-of-Use for Westchester County – May 2005 to April 2006 This rate has variable energy rates from May 2005 through April 2005 from the utility tariffs. There is no demand charge. A facility must have a peak demand less than 10 kW to qualify for service under this rate. Customers can choose between this rate and SC2-1. Only facilities located in Westchester County can take service under this rate. Service Charge $ 19.73 Periods On-Peak 8 AM – 10 PM Off-Peak All Hours not included in On-Peak Energy Charges1 $ per total kWh within defined period System Benefits Charge, Competitive Supply Related Charge, Competitive Supply Collections-Related Surcharge, Renewable Portfolio Charge $ 0.0045 / kWh for all periods Market Supply and Monthly Adjustment, Energy Delivery Charge On-Peak Charges $ / kWh Jan Feb Mar Apr May Jun Jul Aug Sep Oct Nov Dec $ 0.2150 $ 0.2307 $ 0.2264 $ 0.2218 $ 0.2197 $ 0.2908 $ 0.2849 $ 0.2949 $ 0.2833 $ 0.2123 $ 0.2019 $ 0.2041 Off-Peak Charges $ / kWh Jan Feb Mar Apr May Jun Jul Aug Sep Oct Nov Dec $ 0.1131 $ 0.0967 $ 0.0918 $ 0.0857 $ 0.0698 $ 0.0648 $ 0.0776 $ 0.0717 $ 0.0757 $ 0.0773 $ 0.0992 $ 0.1016
Filename: CONED_SC2-2_West_ May05-Apr06.csv

NYSERDA DG/CHP Integrated Database System Utility Rate Details
CDH Energy Corporation 31 September 25, 2008
Consolidated Edison
Service Classification 2-2 – General Small Time-of-Use for Westchester County – November 2005 to October 2006 This rate has variable energy rates from May 2005 through April 2005 from the utility tariffs. There is no demand charge. A facility must have a peak demand less than 10 kW to qualify for service under this rate. Customers can choose between this rate and SC2-1. Only facilities located in Westchester County can take service under this rate. Service Charge $ 19.73 Periods On-Peak 8 AM – 10 PM Off-Peak All Hours not included in On-Peak Energy Charges1 $ per total kWh within defined period System Benefits Charge, Competitive Supply Related Charge, Competitive Supply Collections-Related Surcharge, Renewable Portfolio Charge $ 0.0045 / kWh for all periods Market Supply and Monthly Adjustment, Energy Delivery Charge On-Peak Charges $ / kWh Jan Feb Mar Apr May Jun Jul Aug Sep Oct Nov Dec $ 0.2150 $ 0.2307 $ 0.2264 $ 0.2218 $ 0.2020 $ 0.2856 $ 0.2767 $ 0.2928 $ 0.2846 $ 0.2193 $ 0.2019 $ 0.2041 Off-Peak Charges $ / kWh Jan Feb Mar Apr May Jun Jul Aug Sep Oct Nov Dec $ 0.1131 $ 0.0967 $ 0.0918 $ 0.0857 $ 0.0679 $ 0.0709 $ 0.0794 $ 0.0773 $ 0.0746 $ 0.0800 $ 0.0992 $ 0.1016
Filename: CONED_SC2-2_West_ Nov05-Oct06.csv
Consolidated Edison
Service Classification 2-2 – General Small Time-of-Use for Westchester County – July 2007-June2008 This rate has variable energy rates from May 2005 through April 2005 from the utility tariffs. There is no demand charge. A facility must have a peak demand less than 10 kW to qualify for service under this rate. Customers can choose between this rate and SC2-1. Only facilities located in Westchester County can take service under this rate. Service Charge $ 21.94 Periods On-Peak 8 AM – 10 PM Off-Peak All Hours not included in On-Peak Energy Charges1 $ per total kWh within defined period System Benefits Charge, Competitive Supply Related Charge, Competitive Supply Collections-Related Surcharge, Renewable Portfolio Charge $ 0.0024 / kWh for all periods Market Supply and Monthly Adjustment, Energy Delivery Charge On-Peak Charges $ / kWh Jan Feb Mar Apr May Jun Jul Aug Sep Oct Nov Dec $ 0.2299 $ 0.2340 $ 0.2710 $ 0.2404 $ 0.2350 $ 0.3556 $ 0.3173 $ 0.2969 $ 0.3343 $ 0.2330 $ 0.2270 $ 0.2292 Off-Peak Charges $ / kWh Jan Feb Mar Apr May Jun Jul Aug Sep Oct Nov Dec $ 0.943 $ 0.0985 $ 0.0900 $ 0.0918 $ 0.0913 $ 0.0954 $ 0.0831 $ 0.0827 $ 0.0866 $ 0.0835 $ 0.0814 $ 0.0808
Filename: CONED_SC2-2_West_ Jul07-Jun08.csv

NYSERDA DG/CHP Integrated Database System Utility Rate Details
CDH Energy Corporation 32 September 25, 2008
Consolidated Edison
Service Classification 7-1 – Residential and Religious – Heating for New York City – February 2006 to January 2007 This rate has a block structure for both demand and energy with a maximum rate limit. This is for all customers other than those billed under Rate II. Customers can choose between this rate and SC7-2. Only residencies located in a New York City borough can take service under this rate. Service Charge $ 11.04 Periods Summer June 1 – September 30 Other All Hours not included in Summer Energy Charges $ per total kWh within defined period System Benefits Charge, Renewable Portfolio Charge $ 0.0020 / kWh for all periods Market Supply and Monthly Adjustment $ / kWh Jan Feb Mar Apr May Jun Jul Aug Sep Oct Nov Dec $ 0.1111 $ 0.1263 $ 0.1236 $ 0.1194 $ 0.1271 $ 0.1401 $ 0.1418 $ 0.1430 $ 0.1363 $ 0.1371 $ 0.0975 $ 0.1026 Block Charges: Transmission and Distribution Charges First 250 kWh Over 250 kWh First 250 kWh Next 110 kWh Over 360 kWh Summer $0.05177 / kWh $0.05827 / kWh Other $0.05177 / kWh $0.04759 / kWh $0.03576 / kWh
Filename: CONED_SC7-1_NYC_Feb06-Jan07.csv
Consolidated Edison
Service Classification 7-1 – Residential and Religious – Heating for New York City – July 2007 to June 2008 This rate has a block structure for both demand and energy with a maximum rate limit. This is for all customers other than those billed under Rate II. Customers can choose between this rate and SC7-2. Only residencies located in a New York City borough can take service under this rate. Service Charge $ 12.42 Periods Summer June 1 – September 30 Other All Hours not included in Summer Energy Charges $ per total kWh within defined period System Benefits Charge, Renewable Portfolio Charge $ 0.0024 / kWh for all periods Market Supply and Monthly Adjustment $ / kWh Jan Feb Mar Apr May Jun Jul Aug Sep Oct Nov Dec $ 0.1183 $ 0.1269 $ 0.1107 $ 0.1141 $ 0.1269 $ 0.1397 $ 0.1513 $ 0.1501 $ 0.1411 $ 0.1363 $ 0.1088 $ 0.1042 Block Charges: Transmission and Distribution Charges First 250 kWh Over 250 kWh First 250 kWh Next 110 kWh Over 360 kWh Summer $0.05823 / kWh $0.06554 / kWh Other $0.05823 / kWh $0.05353 / kWh $0.04007 / kWh
Filename: CONED_SC7-1_NYC_Jul07-Jun08.csv

NYSERDA DG/CHP Integrated Database System Utility Rate Details
CDH Energy Corporation 33 September 25, 2008
Consolidated Edison
Service Classification 7-2 – Residential and Religious – Heating – Voluntary Time-of-Day for New York City – February 2006 to January 2007 This rate has variable energy rates from February 2006 through January 2007 from the utility tariffs. There is no demand charge. This is for customers who elect to be billed at a time-of-day rate. Customers can choose between this rate and SC7-1. Only facilities located in a New York City borough can take service under this rate. Service Charge $ 25.96 Periods On-Peak 10 AM – 10 PM Off-Peak All Hours not included in On-Peak Energy Charges1 $ per total kWh within defined period System Benefits Charge, Competitive Supply Related Charge, Competitive Supply Collections-Related Surcharge, Renewable Portfolio Charge $ 0.0057 / kWh for all periods Market Supply and Monthly Adjustment, Energy Delivery Charge On-Peak Charges $ / kWh Jan Feb Mar Apr May Jun Jul Aug Sep Oct Nov Dec $ 0.2053 $ 0.2216 $ 0.2187 $ 0.2164 $ 0.2593 $ 0.3513 $ 0.3380 $ 0.3574 $ 0.3499 $ 0.2728 $ 0.1934 $ 0.1896 Off-Peak Charges $ / kWh Jan Feb Mar Apr May Jun Jul Aug Sep Oct Nov Dec $ 0.0799 $ 0.1000 $ 0.0976 $ 0.0920 $ 0.0790 $ 0.0857 $ 0.0963 $ 0.0861 $ 0.0818 $ 0.0872 $ 0.0730 $ 0.0830
Filename: CONED_SC7-2_NYC_ Feb06-Jan07.csv
Consolidated Edison
Service Classification 7-2 – Residential and Religious – Heating – Voluntary Time-of-Day for New York City –July 2007 to June 2008 This rate has variable energy rates from July 2007 through June 2008 from the utility tariffs. There is no demand charge. This is for customers who elect to be billed at a time-of-day rate. Customers can choose between this rate and SC7-1. Only facilities located in a New York City borough can take service under this rate. Service Charge $ 28.75 Periods On-Peak 10 AM – 10 PM Off-Peak All Hours not included in On-Peak Energy Charges1 $ per total kWh within defined period System Benefits Charge, Competitive Supply Related Charge, Competitive Supply Collections-Related Surcharge, Renewable Portfolio Charge $ 0.0024 / kWh for all periods Market Supply and Monthly Adjustment, Energy Delivery Charge On-Peak Charges $ / kWh Jan Feb Mar Apr May Jun Jul Aug Sep Oct Nov Dec $ 0.2181 $ 0.2265 $ 0.2158 $ 0.2212 $ 0.3248 $ 0.3386 $ 0.3840 $ 0.3901 $ 0.3784 $ 0.2875 $ 0.2072 $ 0.2116 Off-Peak Charges $ / kWh Jan Feb Mar Apr May Jun Jul Aug Sep Oct Nov Dec $ 0.1010 $ 0.1086 $ 0.0890 $ 0.0917 $ 0.0977 $ 0.0986 $ 0.0984 $ 0.0931 $ 0.0878 $ 0.0879 $ 0.0843 $ 0.0821
Filename: CONED_SC7-2_NYC_ Jul07-Jun08.csv

NYSERDA DG/CHP Integrated Database System Utility Rate Details
CDH Energy Corporation 34 September 25, 2008
Consolidated Edison
Service Classification 9-1 General Large – Low Tension (No TOU) for New York City – May 2005 to April 2006 This rate has a block structure for both demand and constant energy charges with a maximum rate limit. The facility's peak demand must be over 10 kW to qualify for service under this classification. Facilities may select between this classification and SC9-3 if they do not qualify for service under SC9-2. Low Tension is any Alternating Current Service with 1-3 phases at 120-480V. Only facilities located in a New York City borough can take service under this rate. Periods Summer June 1 – September 30 Other All Hours not included in Summer Demand Charges1 $ per peak kW within the defined period/block Market Supply and Monthly Adjustment Charges $ per peak kW for all Hours Jan Feb Mar Apr May Jun Jul Aug Sep Oct Nov Dec $ 1.51 $ 8.52 $ 8.46 $ 8.09 $ 10.70 $ 10.53 $ 8.99 $ 9.92 $ 10.33 $ 10.14 $ 4.40 $ 3.85 Block Charges: Transmission and Distribution Charges 0-900 kW Over 900 kW Summer $13.34 / kW $12.04 / kW Other $10.66 / kW $9.36 / kW Energy Charges1 $ per total kWh for All Hours System Benefits, Renewable Portfolio and Energy Delivery Charge
$0.0160 per total kWh for all hours
Market Supply and Monthly Adjustment Charge Jan Feb Mar Apr May Jun Jul Aug Sep Oct Nov Dec $ 0.1631 $ 0.1204 $ 0.1172 $ 0.1118 $ 0.0911 $ 0.0921 $ 0.1070 $ 0.1036 $ 0.0949 $ 0.0947 $ 0.1256 $ 0.1296
Maximum Rate Maximum $/kWh for Total Bill Jan Feb Mar Apr May Jun Jul Aug Sep Oct Nov Dec $ 0.3446 $ 0.3525 $ 0.3487 $ 0.3406 $ 0.3351 $ 0.3338 $ 0.3336 $ 0.3366 $ 0.3317 $ 0.3317 $ 0.3308 $ 0.3313
Filename: CONED_SC9-1_LT_NYC_ May05-Apr06.csv

NYSERDA DG/CHP Integrated Database System Utility Rate Details
CDH Energy Corporation 35 September 25, 2008
Consolidated Edison
Service Classification 9-1 General Large – Low Tension (No TOU) for New York City – November 2005 to October 2006 This rate has a block structure for both demand and constant energy charges with a maximum rate limit. The facility's peak demand must be over 10 kW to qualify for service under this classification. Facilities may select between this classification and SC9-3 if they do not qualify for service under SC9-2. Low Tension is any Alternating Current Service with 1-3 phases at 120-480V. Only facilities located in a New York City borough can take service under this rate. Periods Summer June 1 – September 30 Other All Hours not included in Summer Demand Charges1 $ per peak kW within the defined period/block Market Supply and Monthly Adjustment Charges $ per peak kW for all Hours Jan Feb Mar Apr May Jun Jul Aug Sep Oct Nov Dec $ 1.51 $ 8.52 $ 8.46 $ 8.09 $ 12.40 $ 12.70 $ 10.96 $ 12.14 $ 12.69 $ 12.05 $ 4.40 $ 3.85 Block Charges: Transmission and Distribution Charges 0-900 kW Over 900 kW Summer $13.34 / kW $12.04 / kW Other $10.66 / kW $9.36 / kW Energy Charges1 $ per total kWh for All Hours System Benefits, Renewable Portfolio and Energy Delivery Charge
$0.0160 per total kWh for all hours
Market Supply and Monthly Adjustment Charge Jan Feb Mar Apr May Jun Jul Aug Sep Oct Nov Dec $ 0.1631 $ 0.1204 $ 0.1172 $ 0.1118 $ 0.0933 $ 0.1035 $ 0.1133 $ 0.1056 $ 0.0908 $ 0.0975 $ 0.1256 $ 0.1296
Maximum Rate Maximum $/kWh for Total Bill Jan Feb Mar Apr May Jun Jul Aug Sep Oct Nov Dec $ 0.3446 $ 0.3525 $ 0.3487 $ 0.3406 $ 0.3418 $ 0.3540 $ 0.3114 $ 0.3484 $ 0.3387 $ 0.3407 $ 0.3308 $ 0.3313
Filename: CONED_SC9-1_LT_NYC_ Nov05-Oct06.csv

NYSERDA DG/CHP Integrated Database System Utility Rate Details
CDH Energy Corporation 36 September 25, 2008
Consolidated Edison
Service Classification 9-1 General Large – Low Tension (No TOU) for New York City – July 2007 to June 2008 This rate has a block structure for both demand and constant energy charges with a maximum rate limit. The facility's peak demand must be over 10 kW to qualify for service under this classification. Facilities may select between this classification and SC9-3 if they do not qualify for service under SC9-2. Low Tension is any Alternating Current Service with 1-3 phases at 120-480V. Only facilities located in a New York City borough can take service under this rate. Periods Summer June 1 – September 30 Other All Hours not included in Summer Demand Charges1 $ per peak kW within the defined period/block Market Supply and Monthly Adjustment Charges $ per peak kW for all Hours Jan Feb Mar Apr May Jun Jul Aug Sep Oct Nov Dec $ 9.06 $ 7.31 $ 8.96 $ 9034 $ 6083 $ 6083 $ 13.64 $ 14.41 $ 15.09 $ 14.78 $ 9.79 $ 9.95 Block Charges: Transmission and Distribution Charges 0-900 kW Over 900 kW Summer $15.44 / kW $13.94 / kW Other $12.34 / kW $10.83 / kW Energy Charges1 $ per total kWh for All Hours System Benefits, Renewable Portfolio and Energy Delivery Charge
$0.0189 per total kWh for all hours
Market Supply and Monthly Adjustment Charge Jan Feb Mar Apr May Jun Jul Aug Sep Oct Nov Dec $ 0.1152 $ 0.1225 $ 0.1074 $ 0.1082 $ 0.1086 $ 0.1163 $ 0.1188 $ 0.1112 $ 0.0952 $ 0.0956 $ 0.0967 $ 0.0987
Maximum Rate Maximum $/kWh for Total Bill Jan Feb Mar Apr May Jun Jul Aug Sep Oct Nov Dec $ 0.4175 $ 0.3682 $ 0.3510 $ 0.3541 $ 0.3970 $ 0.4047 $ 0.4258 $ 0.4262 $ 0.4167 $ 0.4153 $ 0.4084 $ 0.4102
Filename: CONED_SC9-1_LT_NYC_ Jul07-Jun08.csv

NYSERDA DG/CHP Integrated Database System Utility Rate Details
CDH Energy Corporation 37 September 25, 2008
Consolidated Edison
Service Classification 9-1 General Large – Low Tension (No TOU) for Westchester County – May 2005 to April 2006 This rate has a block structure for both demand and constant energy charges with a maximum rate limit. The facility's peak demand must be over 10 kW to qualify for service under this classification. Facilities may select between this classification and SC9-3 if they do not qualify for service under SC9-2. Low Tension is any Alternating Current Service with 1-3 phases at 120-480V. Only facilities located in Westchester County can take service under this rate. Periods Summer June 1 – September 30 Other All Hours not included in Summer Demand Charges1 $ per peak kW within the defined period/block Market Supply and Monthly Adjustment Charges $ per peak kW for all Hours Jan Feb Mar Apr May Jun Jul Aug Sep Oct Nov Dec $ (1.54) $ 5.70 $ 5.64 $ 5.27 $ 6.38 $ 6.21 $ 4.67 $ 5.72 $ 6.13 $ 5.94 $ 1.35 $ 0.80 Block Charges: Transmission and Distribution Charges 0-900 kW Over 900 kW Summer $13.34 / kW $12.04 / kW Other $10.66 / kW $9.36 / kW Energy Charges1 $ per total kWh for All Hours System Benefits, Renewable Portfolio and Energy Delivery Charge
$0.0160 per total kWh for all hours
Market Supply and Monthly Adjustment Charge Jan Feb Mar Apr May Jun Jul Aug Sep Oct Nov Dec $ 0.1370 $ 0.1113 $ 0.1067 $ 0.1023 $ 0.0863 $ 0.0853 $ 0.0962 $ 0.0939 $ 0.0877 $ 0.0878 $ 0.1148 $ 0.1184
Maximum Rate Maximum $/kWh for Total Bill Jan Feb Mar Apr May Jun Jul Aug Sep Oct Nov Dec $ 0.3101 $ 0.3355 $ 0.3303 $ 0.3232 $ 0.3167 $ 0.3145 $ 0.3101 $ 0.3149 $ 0.3125 $ 0.3125 $ 0.3119 $ 0.3121
Filename: CONED_SC9-1_LT_West_ May05-Apr06.csv

NYSERDA DG/CHP Integrated Database System Utility Rate Details
CDH Energy Corporation 38 September 25, 2008
Consolidated Edison
Service Classification 9-1 General Large – Low Tension (No TOU) for Westchester County – November 2005 to October 2006 This rate has a block structure for both demand and constant energy charges with a maximum rate limit. The facility's peak demand must be over 10 kW to qualify for service under this classification. Facilities may select between this classification and SC9-3 if they do not qualify for service under SC9-2. Low Tension is any Alternating Current Service with 1-3 phases at 120-480V. Only facilities located in Westchester County can take service under this rate. Periods Summer June 1 – September 30 Other All Hours not included in Summer Demand Charges1 $ per peak kW within the defined period/block Market Supply and Monthly Adjustment Charges $ per peak kW for all Hours Jan Feb Mar Apr May Jun Jul Aug Sep Oct Nov Dec $ (1.54) $ 5.70 $ 5.64 $ 5.27 $ 4.91 $ 5.21 $ 3.47 $ 6.68 $ 7.23 $ 6.59 $ 1.35 $ 0.80 Block Charges: Transmission and Distribution Charges 0-900 kW Over 900 kW Summer $13.34 / kW $12.04 / kW Other $10.66 / kW $9.36 / kW Energy Charges1 $ per total kWh for All Hours System Benefits, Renewable Portfolio and Energy Delivery Charge
$0.0160 per total kWh for all hours
Market Supply and Monthly Adjustment Charge Jan Feb Mar Apr May Jun Jul Aug Sep Oct Nov Dec $ 0.1370 $ 0.1113 $ 0.1067 $ 0.1023 $ 0.0811 $ 0.0863 $ 0.0976 $ 0.0904 $ 0.0816 $ 0.0892 $ 0.1148 $ 0.1184
Maximum Rate Maximum $/kWh for Total Bill Jan Feb Mar Apr May Jun Jul Aug Sep Oct Nov Dec $ 0.3101 $ 0.3355 $ 0.3303 $ 0.3232 $ 0.3078 $ 0.3172 $ 0.3087 $ 0.3178 $ 0.3144 $ 0.3170 $ 0.3119 $ 0.3121
Filename: CONED_SC9-1_LT_West_ Nov05-Oct06.csv

NYSERDA DG/CHP Integrated Database System Utility Rate Details
CDH Energy Corporation 39 September 25, 2008
Consolidated Edison
Service Classification 9-1 General Large – Low Tension (No TOU) for Westchester County – July 2007 to June 2008 This rate has a block structure for both demand and constant energy charges with a maximum rate limit. The facility's peak demand must be over 10 kW to qualify for service under this classification. Facilities may select between this classification and SC9-3 if they do not qualify for service under SC9-2. Low Tension is any Alternating Current Service with 1-3 phases at 120-480V. Only facilities located in Westchester County can take service under this rate. Periods Summer June 1 – September 30 Other All Hours not included in Summer Demand Charges1 $ per peak kW within the defined period/block Market Supply and Monthly Adjustment Charges $ per peak kW for all Hours Jan Feb Mar Apr May Jun Jul Aug Sep Oct Nov Dec $ 4.85 $ 3.70 $ 5.35 $ 5.73 $ 4.80 $ 4.80 $ 4.53 $ 6.18 $ 6.86 $ 6.55 $ 5.58 $ 5.74 Block Charges: Transmission and Distribution Charges 0-900 kW Over 900 kW Summer $15.44 / kW $13.94 / kW Other $12.34 / kW $10.83 / kW Energy Charges1 $ per total kWh for All Hours System Benefits, Renewable Portfolio and Energy Delivery Charge
$0.0189 per total kWh for all hours
Market Supply and Monthly Adjustment Charge Jan Feb Mar Apr May Jun Jul Aug Sep Oct Nov Dec $ 0.1046 $ 0.1127 $ 0.0994 $ 0.1031 $ 0.1016 $ 0.1083 $ 0.1027 $ 0.0981 $ 0.0871 $ 0.0880 $ 0.0900 $ 0.0920
Maximum Rate Maximum $/kWh for Total Bill Jan Feb Mar Apr May Jun Jul Aug Sep Oct Nov Dec $ 0.3958 $ 0.3893 $ 0.3907 $ 0.4008 $ 0.3841 $ 0.3908 $ 0.3837 $ 0.3906 $ 0.3861 $ 0.3861 $ 0.3906 $ 0.3922
Filename: CONED_SC9-1_LT_West_ Jul07-Jun08.csv

NYSERDA DG/CHP Integrated Database System Utility Rate Details
CDH Energy Corporation 40 September 25, 2008
Consolidated Edison
Service Classification 9-1 General Large – High Tension (No TOU) for New York City – May 2005 to April 2006 This rate has a block structure for both demand and constant energy charges with a maximum rate limit. The facility's peak demand must be over 10 kW to qualify for service under this classification. Facilities may select between this classification and SC9-3 if they do not qualify for service under SC9-2. High Tension is any Alternating Current Service with a voltage level greater than 480V. Only facilities located in a New York City borough can take service under this rate. Periods Summer June 1 – September 30 Other All Hours not included in Summer Demand Charges1 $ per peak kW within the defined period/block Market Supply and Monthly Adjustment Charges $ per peak kW for all Hours Jan Feb Mar Apr May Jun Jul Aug Sep Oct Nov Dec $ 1.51 $ 8.52 $ 8.46 $ 8.09 $ 10.70 $ 10.53 $ 8.99 $ 9.92 $ 10.33 $ 10.14 $ 4.40 $ 3.85 Block Charges: Transmission and Distribution Charges 0-900 kW Over 900 kW Summer $ 10.32 / kW $ 9.36 / kW Other $ 7.64 / kW $ 6.68 / kW Energy Charges1 $ per total kWh for All Hours
System Benefits, Renewable Portfolio and Energy Delivery Charge
$0.0150 per total kWh for all hours
Market Supply and Monthly Adjustment Charge Jan Feb Mar Apr May Jun Jul Aug Sep Oct Nov Dec $ 0.1631 $ 0.1204 $ 0.1172 $ 0.1118 $ 0.0911 $ 0.0921 $ 0.1070 $ 0.1036 $ 0.0949 $ 0.0947 $ 0.1256 $ 0.1296
Maximum Rate Maximum $/kWh for Total Bill Jan Feb Mar Apr May Jun Jul Aug Sep Oct Nov Dec $ 0.3446 $ 0.3525 $ 0.3487 $ 0.3406 $ 0.3351 $ 0.3338 $ 0.3336 $ 0.3366 $ 0.3317 $ 0.3317 $ 0.3308 $ 0.3313
Filename: CONED_SC9-1_HT_NYC_ May05-Apr06.csv

NYSERDA DG/CHP Integrated Database System Utility Rate Details
CDH Energy Corporation 41 September 25, 2008
Consolidated Edison
Service Classification 9-1 General Large – High Tension (No TOU) for New York City – November 2005 to October 2006 This rate has a block structure for both demand and constant energy charges with a maximum rate limit. The facility's peak demand must be over 10 kW to qualify for service under this classification. Facilities may select between this classification and SC9-3 if they do not qualify for service under SC9-2. High Tension is any Alternating Current Service with a voltage level greater than 480V. Only facilities located in a New York City borough can take service under this rate. Periods Summer June 1 – September 30 Other All Hours not included in Summer Demand Charges1 $ per peak kW within the defined period/block Market Supply and Monthly Adjustment Charges $ per peak kW for all Hours Jan Feb Mar Apr May Jun Jul Aug Sep Oct Nov Dec $ 1.51 $ 8.52 $ 8.46 $ 8.09 $ 12.40 $ 12.70 $ 10.96 $ 12.14 $ 12.69 $ 12.05 $ 4.40 $ 3.85 Block Charges: Transmission and Distribution Charges 0-900 kW Over 900 kW Summer $ 10.32 / kW $ 9.36 / kW Other $ 7.64 / kW $ 6.68 / kW Energy Charges1 $ per total kWh for All Hours
System Benefits, Renewable Portfolio and Energy Delivery Charge
$0.0150 per total kWh for all hours
Market Supply and Monthly Adjustment Charge Jan Feb Mar Apr May Jun Jul Aug Sep Oct Nov Dec $ 0.1631 $ 0.1204 $ 0.1172 $ 0.1118 $ 0.0933 $ 0.1035 $ 0.1133 $ 0.1056 $ 0.0908 $ 0.0975 $ 0.1256 $ 0.1296
Maximum Rate Maximum $/kWh for Total Bill Jan Feb Mar Apr May Jun Jul Aug Sep Oct Nov Dec $ 0.3446 $ 0.3525 $ 0.3487 $ 0.3406 $ 0.3418 $ 0.3540 $ 0.3114 $ 0.3484 $ 0.3387 $ 0.3407 $ 0.3308 $ 0.3313
Filename: CONED_SC9-1_HT_NYC_ Nov05-Oct06.csv

NYSERDA DG/CHP Integrated Database System Utility Rate Details
CDH Energy Corporation 42 September 25, 2008
Consolidated Edison
Service Classification 9-1 General Large – High Tension (No TOU) for New York City – July 2007 to June 2008 This rate has a block structure for both demand and constant energy charges with a maximum rate limit. The facility's peak demand must be over 10 kW to qualify for service under this classification. Facilities may select between this classification and SC9-3 if they do not qualify for service under SC9-2. High Tension is any Alternating Current Service with a voltage level greater than 480V. Only facilities located in a New York City borough can take service under this rate. Periods Summer June 1 – September 30 Other All Hours not included in Summer Demand Charges1 $ per peak kW within the defined period/block Market Supply and Monthly Adjustment Charges $ per peak kW for all Hours Jan Feb Mar Apr May Jun Jul Aug Sep Oct Nov Dec $ 9.06 $ 7.31 $ 8.96 $ 9.34 $ 6.83 $ 6.83 $ 13.64 $ 14.41 $ 15.09 $ 14.78 $ 9.79 $ 9.95 Block Charges: Transmission and Distribution Charges 0-900 kW Over 900 kW Summer $ 11.94 / kW $ 10.83 / kW Other $ 8.84 / kW $ 7.72 / kW Energy Charges1 $ per total kWh for All Hours
System Benefits, Renewable Portfolio and Energy Delivery Charge
$0.0177 per total kWh for all hours
Market Supply and Monthly Adjustment Charge Jan Feb Mar Apr May Jun Jul Aug Sep Oct Nov Dec $ 0.1152 $ 0.1225 $ 0.1159 $ 0.1082 $ 0.1086 $ 0.1163 $ 0.1188 $ 0.1112 $ 0.0952 $ 0.0956 $ 0.0967 $ 0.0987
Maximum Rate Maximum $/kWh for Total Bill Jan Feb Mar Apr May Jun Jul Aug Sep Oct Nov Dec $ 0.4175 $ 0.4088 $ 0.3797 $ 0.4156 $ 0.3773 $ 0.3850 $ 0.4258 $ 0.4262 $ 0.4167 $ 0.4153 $ 0.4084 $ 0.4100
Filename: CONED_SC9-1_HT_NYC_ Jul07-Jun08.csv

NYSERDA DG/CHP Integrated Database System Utility Rate Details
CDH Energy Corporation 43 September 25, 2008
Consolidated Edison
Service Classification 9-1 General Large – High Tension (No TOU) for Westchester County – May 2005 to April 2006 This rate has a block structure for both demand and constant energy charges with a maximum rate limit. The facility's peak demand must be over 10 kW to qualify for service under this classification. Facilities may select between this classification and SC9-3 if they do not qualify for service under SC9-2. High Tension is any Alternating Current Service with a voltage level greater than 480V. Only facilities located in Westchester County can take service under this rate. Periods Summer June 1 – September 30 Other All Hours not included in Summer Demand Charges1 $ per peak kW within the defined period/block Market Supply and Monthly Adjustment Charges $ per peak kW for all Hours Jan Feb Mar Apr May Jun Jul Aug Sep Oct Nov Dec $ (1.54) $ 5.70 $ 5.64 $ 5.27 $ 6.38 $ 6.21 $ 4.67 $ 5.72 $ 6.13 $ 5.94 $ 1.35 $ 0.80 Block Charges: Transmission and Distribution Charges 0-900 kW Over 900 kW Summer $ 10.32 / kW $ 9.36 / kW Other $ 7.64 / kW $ 6.68 / kW Energy Charges1 $ per total kWh for All Hours System Benefits, Renewable Portfolio and Energy Delivery Charge
$0.0150 per total kWh for all hours
Market Supply and Monthly Adjustment Charge Jan Feb Mar Apr May Jun Jul Aug Sep Oct Nov Dec $ 0.1370 $ 0.1113 $ 0.1067 $ 0.1023 $ 0.0863 $ 0.0853 $ 0.0962 $ 0.0939 $ 0.0877 $ 0.0878 $ 0.1148 $ 0.1184
Maximum Rate Maximum $/kWh for Total Bill Jan Feb Mar Apr May Jun Jul Aug Sep Oct Nov Dec $ 0.3101 $ 0.3355 $ 0.3303 $ 0.3232 $ 0.3167 $ 0.3145 $ 0.3101 $ 0.3149 $ 0.3125 $ 0.3125 $ 0.3119 $ 0.3121
Filename: CONED_SC9-1_HT_West_ May05-Apr06.csv

NYSERDA DG/CHP Integrated Database System Utility Rate Details
CDH Energy Corporation 44 September 25, 2008
Consolidated Edison
Service Classification 9-1 General Large – High Tension (No TOU) for Westchester County – November 2005 to October 2006 This rate has a block structure for both demand and constant energy charges with a maximum rate limit. The facility's peak demand must be over 10 kW to qualify for service under this classification. Facilities may select between this classification and SC9-3 if they do not qualify for service under SC9-2. High Tension is any Alternating Current Service with a voltage level greater than 480V. Only facilities located in Westchester County can take service under this rate. Periods Summer June 1 – September 30 Other All Hours not included in Summer Demand Charges1 $ per peak kW within the defined period/block Market Supply and Monthly Adjustment Charges $ per peak kW for all Hours Jan Feb Mar Apr May Jun Jul Aug Sep Oct Nov Dec $ (1.54) $ 5.70 $ 5.64 $ 5.27 $ 4.91 $ 5.21 $ 3.47 $ 6.68 $ 7.23 $ 6.59 $ 1.35 $ 0.80 Block Charges: Transmission and Distribution Charges 0-900 kW Over 900 kW Summer $ 10.32 / kW $ 9.36 / kW Other $ 7.64 / kW $ 6.68 / kW Energy Charges1 $ per total kWh for All Hours System Benefits, Renewable Portfolio and Energy Delivery Charge
$0.0150 per total kWh for all hours
Market Supply and Monthly Adjustment Charge Jan Feb Mar Apr May Jun Jul Aug Sep Oct Nov Dec $ 0.1370 $ 0.1113 $ 0.1067 $ 0.1023 $ 0.0811 $ 0.0888 $ 0.0976 $ 0.0904 $ 0.0816 $ 0.0892 $ 0.1148 $ 0.1184
Maximum Rate Maximum $/kWh for Total Bill Jan Feb Mar Apr May Jun Jul Aug Sep Oct Nov Dec $ 0.3101 $ 0.3355 $ 0.3303 $ 0.3232 $ 0.3078 $ 0.3172 $ 0.3087 $ 0.3178 $ 0.3144 $ 0.3170 $ 0.3119 $ 0.3121
Filename: CONED_SC9-1_HT_West_ Nov05-Oct06.csv

NYSERDA DG/CHP Integrated Database System Utility Rate Details
CDH Energy Corporation 45 September 25, 2008
Consolidated Edison
Service Classification 9-1 General Large – High Tension (No TOU) for Westchester County – July 2007 to June 2008 This rate has a block structure for both demand and constant energy charges with a maximum rate limit. The facility's peak demand must be over 10 kW to qualify for service under this classification. Facilities may select between this classification and SC9-3 if they do not qualify for service under SC9-2. High Tension is any Alternating Current Service with a voltage level greater than 480V. Only facilities located in Westchester County can take service under this rate. Periods Summer June 1 – September 30 Other All Hours not included in Summer Demand Charges1 $ per peak kW within the defined period/block Market Supply and Monthly Adjustment Charges $ per peak kW for all Hours Jan Feb Mar Apr May Jun Jul Aug Sep Oct Nov Dec $ 4.85 $ 3.70 $ 5.35 $ 5.73 $ 4.80 $ 4.80 $ 4.53 $ 6.18 $ 6.86 $ 6.55 $ 5.58 $ 5.74 Block Charges: Transmission and Distribution Charges 0-900 kW Over 900 kW Summer $ 11.94 / kW $ 10.38 / kW Other $ 8.84 / kW $ 7.72 / kW Energy Charges1 $ per total kWh for All Hours System Benefits, Renewable Portfolio and Energy Delivery Charge
$0.0177 per total kWh for all hours
Market Supply and Monthly Adjustment Charge Jan Feb Mar Apr May Jun Jul Aug Sep Oct Nov Dec $ 0.1046 $ 0.1127 $ 0.0994 $ 0.1031 $ 0.1016 $ 0.1083 $ 0.1027 $ 0.0981 $ 0.0871 $ 0.0880 $ 0.0900 $ 0.0920
Maximum Rate Maximum $/kWh for Total Bill Jan Feb Mar Apr May Jun Jul Aug Sep Oct Nov Dec $ 0.3958 $ 0.3893 $ 0.3907 $ 0.4008 $ 0.3841 $ 0.2687 $ 0.3837 $ 0.3906 $ 0.3861 $ 0.3852 $ 0.3906 $ 0.3922
Filename: CONED_SC9-1_HT_West_ Jul07-Jun08.csv

NYSERDA DG/CHP Integrated Database System Utility Rate Details
CDH Energy Corporation 46 September 25, 2008
Consolidated Edison Service Classification 9-2 General Large – Low Tension (Time-of-Use) for New York City – May 2005 to April 2006 This rate has multiple time of day periods with varying energy and demand charges. A facility will be billed under this classification if the peak demand is over 1,500 kW in any month. A facility will remain under this classification until the peak demand for a 12-month period is less than 900 kW. Low Tension is any Alternating Current Service with 1-3 phases at 120-480V. Only facilities located in a New York City borough can take service under this rate. Periods On-Peak Mon-Fri, 8am-10pm Off-Peak All Hours not included in On-Peak M-F 8am - 6pm June 1 – September 30 Mon-Fri, 8am-6pm Demand Charges1 $ per peak kW within the defined period On-Peak Market Supply and Monthly Adjustment Charges and Demand Charge Jan Feb Mar Apr May Jun Jul Aug Sep Oct Nov Dec $11.18 $18.84 $18.74 $18.08 $21.02 $10.24 $10.24 $10.24 $10.24 $20.57 $13.75 $13.06 M-F 8am - 6pm Jan Feb Mar Apr May Jun Jul Aug Sep Oct Nov Dec $18.63 $17.03 $18.21 $18.63 All Hours, All Days Jan Feb Mar Apr May Jun Jul Aug Sep Oct Nov Dec $ 3.72 $ 3.72 $ 3.72 $ 3.72 $ 3.72 $ 10.11 $ 10.11 $ 10.11 $ 10.11 $ 3.72 $ 3.72 $ 3.72 Energy Charges $ per total kWh within defined period
System Benefits, Renewable Portfolio and Energy Delivery Charge
$0.0070 per total kWh for all hours
On-Peak Market Supply and Monthly Adjustment Charges Jan Feb Mar Apr May Jun Jul Aug Sep Oct Nov Dec $0.2057 $0.1412 $0.1380 $0.1334 $0.1084 $0.1156 $0.1280 $0.1282 $0.1101 $0.1084 $0.1482 $0.1542 Off-Peak Market Supply and Monthly Adjustment Charges Jan Feb Mar Apr May Jun Jul Aug Sep Oct Nov Dec $0.1327 $0.0986 $0.0961 $0.0892 $0.0697 $0.0647 $0.0851 $0.0767 $0.0778 $0.0796 $0.1057 $0.1093
Filename: CONED_SC9-2_LT_NYC_ May05-Apr06.csv

NYSERDA DG/CHP Integrated Database System Utility Rate Details
CDH Energy Corporation 47 September 25, 2008
Consolidated Edison Service Classification 9-2 General Large – Low Tension (Time-of-Use) for New York City – November 2005 to October 2006 This rate has multiple time of day periods with varying energy and demand charges. A facility will be billed under this classification if the peak demand is over 1,500 kW in any month. A facility will remain under this classification until the peak demand for a 12-month period is less than 900 kW. Low Tension is any Alternating Current Service with 1-3 phases at 120-480V. Only facilities located in a New York City borough can take service under this rate. Periods On-Peak Mon-Fri, 8am-10pm Off-Peak All Hours not included in On-Peak M-F 8am - 6pm June 1 – September 30 Mon-Fri, 8am-6pm Demand Charges1 $ per peak kW within the defined period On-Peak Market Supply and Monthly Adjustment Charges and Demand Charge Jan Feb Mar Apr May Jun Jul Aug Sep Oct Nov Dec $11.18 $18.84 $18.74 $18.08 $23.28 $10.24 $10.24 $10.24 $10.24 $22.78 $13.75 $13.06 M-F 8am - 6pm Jan Feb Mar Apr May Jun Jul Aug Sep Oct Nov Dec $21.46 $19.64 $20.52 $21.21 All Hours, All Days Jan Feb Mar Apr May Jun Jul Aug Sep Oct Nov Dec $ 3.27 $ 3.27 $ 3.27 $ 3.27 $ 3.27 $ 10.11 $ 10.11 $ 10.11 $ 10.11 $ 3.27 $ 3.27 $ 3.27 Energy Charges $ per total kWh within defined period
System Benefits, Renewable Portfolio and Energy Delivery Charge
$0.0070 per total kWh for all hours
On-Peak Market Supply and Monthly Adjustment Charges Jan Feb Mar Apr May Jun Jul Aug Sep Oct Nov Dec $0.2057 $0.1412 $0.1380 $0.1334 $0.1070 $0.1207 $0.1330 $0.1233 $0.0993 $0.1083 $0.1482 $0.1542 Off-Peak Market Supply and Monthly Adjustment Charges Jan Feb Mar Apr May Jun Jul Aug Sep Oct Nov Dec $0.1327 $0.0986 $0.0961 $0.0892 $0.0759 $0.0819 $0.0925 $0.0802 $0.0745 $0.0816 $0.1057 $0.1093
Filename: CONED_SC9-2_LT_NYC_ Nov05-Oct06.csv

NYSERDA DG/CHP Integrated Database System Utility Rate Details
CDH Energy Corporation 48 September 25, 2008
Consolidated Edison Service Classification 9-2 General Large – Low Tension (Time-of-Use) for New York City – July 2007 to June 2008 This rate has multiple time of day periods with varying energy and demand charges. A facility will be billed under this classification if the peak demand is over 1,500 kW in any month. A facility will remain under this classification until the peak demand for a 12-month period is less than 900 kW. Low Tension is any Alternating Current Service with 1-3 phases at 120-480V. Only facilities located in Westchester County can take service under this rate. Periods On-Peak Mon-Fri, 8am-10pm Off-Peak All Hours not included in On-Peak M-F 8am - 6pm June 1 – September 30 Mon-Fri, 8am-6pm Demand Charges1 $ per peak kW within the defined period On-Peak Market Supply and Monthly Adjustment Charges and Demand Charge Jan Feb Mar Apr May Jun Jul Aug Sep Oct Nov Dec $ 18.69 $17.23 $18.63 $19.21 $16.75 $11.09 $10.80 $10.80 $10.80 $24.34 $18.72 $19.59 M-F 8am - 6pm Jan Feb Mar Apr May Jun Jul Aug Sep Oct Nov Dec $14.47 $22.10 $21.54 $22.41 All Hours, All Days Jan Feb Mar Apr May Jun Jul Aug Sep Oct Nov Dec $ 3.45 $ 3.45 $ 3.45 $ 3.54 $ 3.54 $ 10.94 $ 10.66 $ 10.66 $ 10.66 $ 3.45 $ 3.45 $ 3.45 Energy Charges $ per total kWh within defined period
System Benefits, Renewable Portfolio and Energy Delivery Charge
$0.0082per total kWh for all hours
On-Peak Market Supply and Monthly Adjustment Charges Jan Feb Mar Apr May Jun Jul Aug Sep Oct Nov Dec $0.1315 $0.1468 $0.1282 $0.1268 $0.1274 $0.1412 $0.1467 $0.1338 $0.1071 $0.1075 $0.1083 $0.1136 Off-Peak Market Supply and Monthly Adjustment Charges Jan Feb Mar Apr May Jun Jul Aug Sep Oct Nov Dec $0.0962 $0.1013 $0.0829 $0.0859 $0.0890 $0.0899 $0.0901 $0.0834 $0.0772 $0.0789 $0.0763 $0.0770
Filename: CONED_SC9-2_LT_NYC_ Jul07-Jun08.csv

NYSERDA DG/CHP Integrated Database System Utility Rate Details
CDH Energy Corporation 49 September 25, 2008
Consolidated Edison Service Classification 9-2 General Large – Low Tension (Time-of-Use) for Westchester County – May 2005 to April 2006 This rate has multiple time of day periods with varying energy and demand charges. A facility will be billed under this classification if the peak demand is over 1,500 kW in any month. A facility will remain under this classification until the peak demand for a 12-month period is less than 900 kW. Low Tension is any Alternating Current Service with 1-3 phases at 120-480V. Only facilities located in Westchester County can take service under this rate. Periods On-Peak Mon-Fri, 8am-10pm Off-Peak All Hours not included in On-Peak M-F 8am - 6pm June 1 – September 30 Mon-Fri, 8am-6pm Demand Charges1 $ per peak kW within the defined period On-Peak Market Supply and Monthly Adjustment Charges and Demand Charge Jan Feb Mar Apr May Jun Jul Aug Sep Oct Nov Dec $ 7.22 $15.18 $15.08 $14.42 $15.50 $10.24 $10.24 $10.24 $10.24 $15.17 $9.79 $9.10 M-F 8am - 6pm Jan Feb Mar Apr May Jun Jul Aug Sep Oct Nov Dec $13.11 $11.51 $12.81 $13.23 All Hours, All Days Jan Feb Mar Apr May Jun Jul Aug Sep Oct Nov Dec $ 3.72 $ 3.72 $ 3.72 $ 3.72 $ 3.72 $ 10.11 $ 10.11 $ 10.11 $ 10.11 $ 3.72 $ 3.72 $ 3.72 Energy Charges $ per total kWh within defined period
System Benefits, Renewable Portfolio and Energy Delivery Charge
$0.0070 per total kWh for all hours
On-Peak Market Supply and Monthly Adjustment Charges Jan Feb Mar Apr May Jun Jul Aug Sep Oct Nov Dec $0.1688 $0.1273 $0.1235 $0.1203 $0.1012 $0.1064 $0.1153 $0.1169 $0.1015 $0.1000 $0.1329 $0.1387 Off-Peak Market Supply and Monthly Adjustment Charges Jan Feb Mar Apr May Jun Jul Aug Sep Oct Nov Dec $0.1179 $0.0944 $0.0896 $0.0834 $0.0656 $0.0603 $0.0762 $0.0689 $0.0722 $0.0743 $0.0996 $0.1026
Filename: CONED_SC9-2_LT_West_ May05-Apr06.csv

NYSERDA DG/CHP Integrated Database System Utility Rate Details
CDH Energy Corporation 50 September 25, 2008
Consolidated Edison Service Classification 9-2 General Large – Low Tension (Time-of-Use) for Westchester County – November 2005 to October 2006 This rate has multiple time of day periods with varying energy and demand charges. A facility will be billed under this classification if the peak demand is over 1,500 kW in any month. A facility will remain under this classification until the peak demand for a 12-month period is less than 900 kW. Low Tension is any Alternating Current Service with 1-3 phases at 120-480V. Only facilities located in Westchester County can take service under this rate. Periods On-Peak Mon-Fri, 8am-10pm Off-Peak All Hours not included in On-Peak M-F 8am - 6pm June 1 – September 30 Mon-Fri, 8am-6pm Demand Charges1 $ per peak kW within the defined period On-Peak Market Supply and Monthly Adjustment Charges and Demand Charge Jan Feb Mar Apr May Jun Jul Aug Sep Oct Nov Dec $ 7.22 $15.18 $15.08 $14.42 $13.65 $10.24 $10.24 $10.24 $10.24 $15.61 $9.79 $9.10 M-F 8am - 6pm Jan Feb Mar Apr May Jun Jul Aug Sep Oct Nov Dec $11.83 $10.01 $13.35 $14.04 All Hours, All Days Jan Feb Mar Apr May Jun Jul Aug Sep Oct Nov Dec $ 3.27 $ 3.27 $ 3.27 $ 3.27 $ 3.27 $ 10.11 $ 10.11 $ 10.11 $ 10.11 $ 3.27 $ 3.27 $ 3.27 Energy Charges $ per total kWh within defined period
System Benefits, Renewable Portfolio and Energy Delivery Charge
$0.0070 per total kWh for all hours
On-Peak Market Supply and Monthly Adjustment Charges Jan Feb Mar Apr May Jun Jul Aug Sep Oct Nov Dec $0.1688 $0.1273 $0.1235 $0.1203 $0.0950 $0.1076 $0.1163 $0.1021 $0.0884 $0.0982 $0.1329 $0.1387 Off-Peak Market Supply and Monthly Adjustment Charges Jan Feb Mar Apr May Jun Jul Aug Sep Oct Nov Dec $0.1179 $0.0944 $0.0896 $0.0834 $0.0637 $0.0654 $0.0777 $0.0712 $0.0673 $0.0751 $0.0996 $0.1026
Filename: CONED_SC9-2_LT_West_ Nov05-Oct06.csv
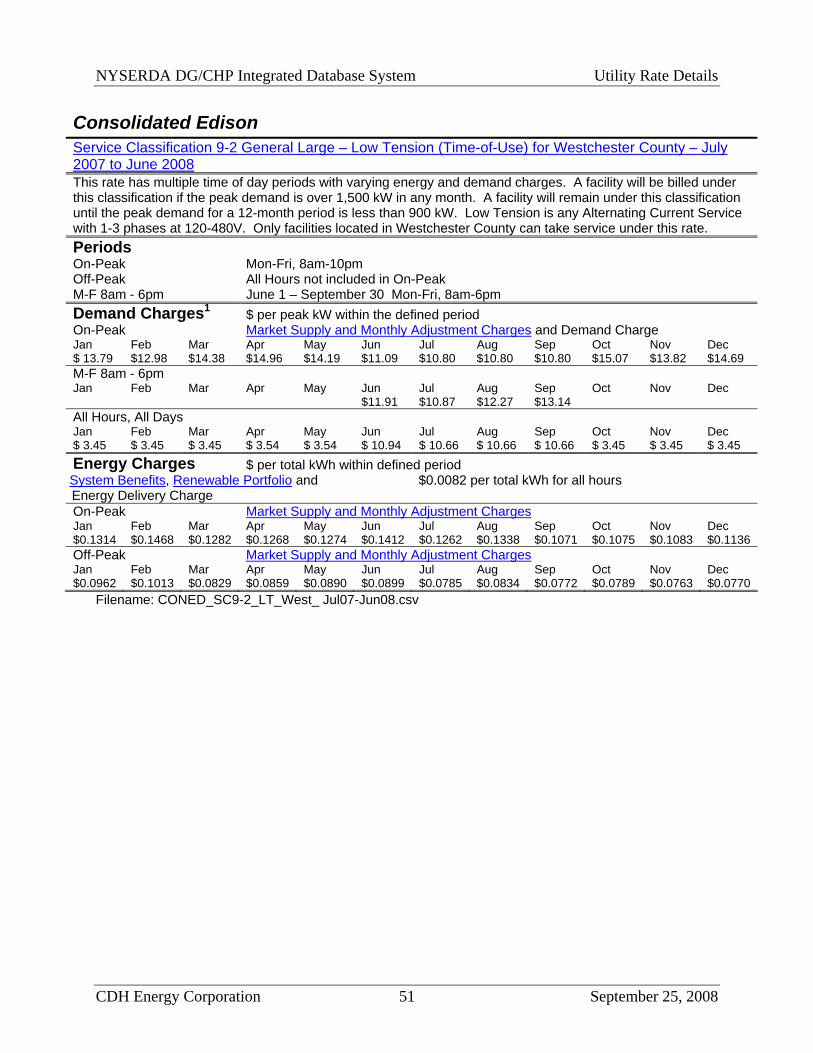
NYSERDA DG/CHP Integrated Database System Utility Rate Details
CDH Energy Corporation 51 September 25, 2008
Consolidated Edison Service Classification 9-2 General Large – Low Tension (Time-of-Use) for Westchester County – July 2007 to June 2008 This rate has multiple time of day periods with varying energy and demand charges. A facility will be billed under this classification if the peak demand is over 1,500 kW in any month. A facility will remain under this classification until the peak demand for a 12-month period is less than 900 kW. Low Tension is any Alternating Current Service with 1-3 phases at 120-480V. Only facilities located in Westchester County can take service under this rate. Periods On-Peak Mon-Fri, 8am-10pm Off-Peak All Hours not included in On-Peak M-F 8am - 6pm June 1 – September 30 Mon-Fri, 8am-6pm Demand Charges1 $ per peak kW within the defined period On-Peak Market Supply and Monthly Adjustment Charges and Demand Charge Jan Feb Mar Apr May Jun Jul Aug Sep Oct Nov Dec $ 13.79 $12.98 $14.38 $14.96 $14.19 $11.09 $10.80 $10.80 $10.80 $15.07 $13.82 $14.69 M-F 8am - 6pm Jan Feb Mar Apr May Jun Jul Aug Sep Oct Nov Dec $11.91 $10.87 $12.27 $13.14 All Hours, All Days Jan Feb Mar Apr May Jun Jul Aug Sep Oct Nov Dec $ 3.45 $ 3.45 $ 3.45 $ 3.54 $ 3.54 $ 10.94 $ 10.66 $ 10.66 $ 10.66 $ 3.45 $ 3.45 $ 3.45 Energy Charges $ per total kWh within defined period
System Benefits, Renewable Portfolio and Energy Delivery Charge
$0.0082 per total kWh for all hours
On-Peak Market Supply and Monthly Adjustment Charges Jan Feb Mar Apr May Jun Jul Aug Sep Oct Nov Dec $0.1314 $0.1468 $0.1282 $0.1268 $0.1274 $0.1412 $0.1262 $0.1338 $0.1071 $0.1075 $0.1083 $0.1136 Off-Peak Market Supply and Monthly Adjustment Charges Jan Feb Mar Apr May Jun Jul Aug Sep Oct Nov Dec $0.0962 $0.1013 $0.0829 $0.0859 $0.0890 $0.0899 $0.0785 $0.0834 $0.0772 $0.0789 $0.0763 $0.0770
Filename: CONED_SC9-2_LT_West_ Jul07-Jun08.csv

NYSERDA DG/CHP Integrated Database System Utility Rate Details
CDH Energy Corporation 52 September 25, 2008
Consolidated Edison Service Classification 9-2 General Large – High Tension (Time-of-Use) for New York City – May 2005 to April 2006 This rate has multiple time of day periods with varying energy and demand charges. A facility will be billed under this classification if the peak demand is over 1,500 kW in any month. A facility will remain under this classification until the peak demand for a 12-month period is less than 900 kW. High Tension is any Alternating Current Service with a voltage level greater than 480V. Only facilities located in a New York City borough can take service under this rate. Periods On-Peak Mon-Fri, 8am-10pm Off-Peak All Hours not included in On-Peak M-F 8am - 6pm June 1 – September 30 Mon-Fri, 8am-6pm Demand Charges1 $ per peak kW within the defined period On-Peak Market Supply and Monthly Adjustment Charges and Demand Charge Jan Feb Mar Apr May Jun Jul Aug Sep Oct Nov Dec $11.18 $18.84 $18.74 $18.08 $21.02 $10.24 $10.24 $10.24 $10.24 $20.57 $13.75 $13.06 M-F 8am - 6pm Jan Feb Mar Apr May Jun Jul Aug Sep Oct Nov Dec $18.63 $17.03 $18.21 $18.63 Energy Charges $ per total kWh within defined period
System Benefits, Renewable Portfolio and Energy Delivery Charge
$0.0070 per total kWh for all hours
On-Peak Market Supply and Monthly Adjustment Charges Jan Feb Mar Apr May Jun Jul Aug Sep Oct Nov Dec $0.2057 $0.1412 $0.1380 $0.1334 $0.1084 $0.1156 $0.1280 $0.1282 $0.1101 $0.1084 $0.1482 $0.1542 Off-Peak Market Supply and Monthly Adjustment Charges Jan Feb Mar Apr May Jun Jul Aug Sep Oct Nov Dec $0.1327 $0.0986 $0.0961 $0.0892 $0.0697 $0.0647 $0.0851 $0.0767 $0.0778 $0.0796 $0.1057 $0.1093
Filename: CONED_SC9-2_HT_NYC_ May05-Apr06.csv

NYSERDA DG/CHP Integrated Database System Utility Rate Details
CDH Energy Corporation 53 September 25, 2008
Consolidated Edison Service Classification 9-2 General Large – High Tension (Time-of-Use) for New York City – November 2005 to October 2006 This rate has multiple time of day periods with varying energy and demand charges. A facility will be billed under this classification if the peak demand is over 1,500 kW in any month. A facility will remain under this classification until the peak demand for a 12-month period is less than 900 kW. High Tension is any Alternating Current Service with a voltage level greater than 480V. Only facilities located in a New York City borough can take service under this rate. Periods On-Peak Mon-Fri, 8am-10pm Off-Peak All Hours not included in On-Peak M-F 8am - 6pm June 1 – September 30 Mon-Fri, 8am-6pm Demand Charges1 $ per peak kW within the defined period On-Peak Market Supply and Monthly Adjustment Charges and Demand Charge Jan Feb Mar Apr May Jun Jul Aug Sep Oct Nov Dec $11.18 $18.84 $18.74 $18.08 $23.28 $10.24 $10.24 $10.24 $10.24 $22.78 $13.75 $13.06 M-F 8am - 6pm Jan Feb Mar Apr May Jun Jul Aug Sep Oct Nov Dec $21.46 $19.64 $18.62 $21.21 Energy Charges $ per total kWh within defined period
System Benefits, Renewable Portfolio and Energy Delivery Charge
$0.0070 per total kWh for all hours
On-Peak Market Supply and Monthly Adjustment Charges Jan Feb Mar Apr May Jun Jul Aug Sep Oct Nov Dec $0.2057 $0.1412 $0.1380 $0.1334 $0.1070 $0.1207 $0.1330 $0.1233 $0.0993 $0.1083 $0.1482 $0.1542 Off-Peak Market Supply and Monthly Adjustment Charges Jan Feb Mar Apr May Jun Jul Aug Sep Oct Nov Dec $0.1327 $0.0986 $0.0961 $0.0892 $0.0759 $0.0819 $0.0925 $0.0802 $0.0745 $0.0816 $0.1057 $0.1093
Filename: CONED_SC9-2_HT_NYC_ Nov05-Oct06.csv

NYSERDA DG/CHP Integrated Database System Utility Rate Details
CDH Energy Corporation 54 September 25, 2008
Consolidated Edison Service Classification 9-2 General Large – High Tension (Time-of-Use) for New York City – December 2006 to November 2007 This rate has multiple time of day periods with varying energy and demand charges. A facility will be billed under this classification if the peak demand is over 1,500 kW in any month. A facility will remain under this classification until the peak demand for a 12-month period is less than 900 kW. High Tension is any Alternating Current Service with a voltage level greater than 480V. Only facilities located in a New York City borough can take service under this rate. Periods On-Peak Mon-Fri, 8am-10pm Off-Peak All Hours not included in On-Peak M-F 8am - 6pm June 1 – September 30 Mon-Fri, 8am-6pm Demand Charges1 $ per peak kW within the defined period On-Peak Market Supply and Monthly Adjustment Charges and Demand Charge Jan Feb Mar Apr May Jun Jul Aug Sep Oct Nov Dec $18.33 $20.28 $20.10 $20.11 $24.54 $10.80 $10.80 $10.80 $10.80 $24.34 $18.72 $18.26 M-F 8am - 6pm Jan Feb Mar Apr May Jun Jul Aug Sep Oct Nov Dec $22.10 $20.94 $21.54 $22.41 Energy Charges $ per total kWh within defined period
System Benefits, Renewable Portfolio and Energy Delivery Charge
$0.0077 per total kWh for all hours
On-Peak Market Supply and Monthly Adjustment Charges Jan Feb Mar Apr May Jun Jul Aug Sep Oct Nov Dec $0.1302 $0.1000 $0.1036 $0.1052 $0.1088 $0.1207 $0.1467 $0.1338 $0.1071 $0.1075 $0.1083 $0.1065 Off-Peak Market Supply and Monthly Adjustment Charges Jan Feb Mar Apr May Jun Jul Aug Sep Oct Nov Dec $0.0850 $0.0696 $0.0724 $0.0735 $0.0743 $0.0765 $0.0901 $0.0834 $0.0772 $0.0789 $0.0763 $0.0809
Filename: CONED_SC9-2_HT_NYC_ Dec06-Nov07.csv

NYSERDA DG/CHP Integrated Database System Utility Rate Details
CDH Energy Corporation 55 September 25, 2008
Consolidated Edison Service Classification 9-2 General Large – High Tension (Time-of-Use) for New York City –July 2007 to June 2008 This rate has multiple time of day periods with varying energy and demand charges. A facility will be billed under this classification if the peak demand is over 1,500 kW in any month. A facility will remain under this classification until the peak demand for a 12-month period is less than 900 kW. High Tension is any Alternating Current Service with a voltage level greater than 480V. Only facilities located in a New York City borough can take service under this rate. Periods On-Peak Mon-Fri, 8am-10pm Off-Peak All Hours not included in On-Peak M-F 8am - 6pm June 1 – September 30 Mon-Fri, 8am-6pm Demand Charges1 $ per peak kW within the defined period On-Peak Market Supply and Monthly Adjustment Charges and Demand Charge Jan Feb Mar Apr May Jun Jul Aug Sep Oct Nov Dec $18.69 $17.23 $18.63 $19.21 $16.75 $11.09 $10.80 $10.80 $10.80 $24.34 $18.72 $18.26 M-F 8am - 6pm Jan Feb Mar Apr May Jun Jul Aug Sep Oct Nov Dec $14.47 $20.94 $21.54 $22.41 Energy Charges $ per total kWh within defined period
System Benefits, Renewable Portfolio and Energy Delivery Charge
$0.0082 per total kWh for all hours
On-Peak Market Supply and Monthly Adjustment Charges Jan Feb Mar Apr May Jun Jul Aug Sep Oct Nov Dec $0.1314 $0.1468 $0.1282 $0.1268 $0.1274 $0.1412 $0.1467 $0.1338 $0.1071 $0.1075 $0.1083 $0.1065 Off-Peak Market Supply and Monthly Adjustment Charges Jan Feb Mar Apr May Jun Jul Aug Sep Oct Nov Dec $0.0962 $0.1013 $0.0829 $0.0859 $0.0890 $0.0899 $0.0901 $0.0834 $0.0772 $0.0789 $0.0763 $0.0809
Filename: CONED_SC9-2_HT_NYC_ Jul07-Jun08.csv

NYSERDA DG/CHP Integrated Database System Utility Rate Details
CDH Energy Corporation 56 September 25, 2008
Consolidated Edison Service Classification 9-2 General Large – High Tension (Time-of-Use) for Westchester County – May 2005 to April 2006 This rate has multiple time of day periods with varying energy and demand charges. A facility will be billed under this classification if the peak demand is over 1,500 kW in any month. A facility will remain under this classification until the peak demand for a 12-month period is less than 900 kW. High Tension is any Alternating Current Service with a voltage level greater than 480V. Only facilities located in Westchester County can take service under this rate. Periods On-Peak Mon-Fri, 8am-10pm Off-Peak All Hours not included in On-Peak M-F 8am - 6pm June 1 – September 30 Mon-Fri, 8am-6pm Demand Charges1 $ per peak kW within the defined period On-Peak Market Supply and Monthly Adjustment Charges and Demand Charge Jan Feb Mar Apr May Jun Jul Aug Sep Oct Nov Dec $ 7.22 $15.18 $15.08 $14.42 $15.50 $10.24 $10.24 $10.24 $10.24 $15.17 $9.79 $9.10 M-F 8am - 6pm Jan Feb Mar Apr May Jun Jul Aug Sep Oct Nov Dec $13.11 $11.51 $12.81 $13.23 Energy Charges $ per total kWh within defined period
System Benefits, Renewable Portfolio and Energy Delivery Charge
$0.0070 per total kWh for all hours
On-Peak Market Supply and Monthly Adjustment Charges Jan Feb Mar Apr May Jun Jul Aug Sep Oct Nov Dec $0.1688 $0.1273 $0.1235 $0.1203 $0.1012 $0.1064 $0.1153 $0.1169 $0.1015 $0.1000 $0.1329 $0.1387 Off-Peak Market Supply and Monthly Adjustment Charges Jan Feb Mar Apr May Jun Jul Aug Sep Oct Nov Dec $0.1179 $0.0944 $0.0896 $0.0834 $0.0656 $0.0603 $0.0762 $0.0689 $0.0722 $0.0743 $0.0996 $0.1093
Filename: CONED_SC9-2_HT_West_ May05-Apr06.csv

NYSERDA DG/CHP Integrated Database System Utility Rate Details
CDH Energy Corporation 57 September 25, 2008
Consolidated Edison Service Classification 9-2 General Large – High Tension (Time-of-Use) for Westchester County – November 2005 to October 2006 This rate has multiple time of day periods with varying energy and demand charges. A facility will be billed under this classification if the peak demand is over 1,500 kW in any month. A facility will remain under this classification until the peak demand for a 12-month period is less than 900 kW. High Tension is any Alternating Current Service with a voltage level greater than 480V. Only facilities located in Westchester County can take service under this rate. Periods On-Peak Mon-Fri, 8am-10pm Off-Peak All Hours not included in On-Peak M-F 8am - 6pm June 1 – September 30 Mon-Fri, 8am-6pm Demand Charges1 $ per peak kW within the defined period On-Peak Market Supply and Monthly Adjustment Charges and Demand Charge Jan Feb Mar Apr May Jun Jul Aug Sep Oct Nov Dec $ 7.22 $15.18 $15.08 $14.42 $13.65 $10.24 $10.24 $10.24 $10.24 $15.61 $9.79 $9.10 M-F 8am - 6pm Jan Feb Mar Apr May Jun Jul Aug Sep Oct Nov Dec $11.83 $10.01 $13.35 $14.04 Energy Charges $ per total kWh within defined period
System Benefits, Renewable Portfolio and Energy Delivery Charge
$0.0070 per total kWh for all hours
On-Peak Market Supply and Monthly Adjustment Charges Jan Feb Mar Apr May Jun Jul Aug Sep Oct Nov Dec $0.1688 $0.1273 $0.1235 $0.1203 $0.0950 $0.1076 $0.1163 $0.1021 $0.0884 $0.0982 $0.1329 $0.1387 Off-Peak Market Supply and Monthly Adjustment Charges Jan Feb Mar Apr May Jun Jul Aug Sep Oct Nov Dec $0.1179 $0.0944 $0.0896 $0.0834 $0.0637 $0.0654 $0.0777 $0.0712 $0.0673 $0.0751 $0.0996 $0.1093
Filename: CONED_SC9-2_HT_West_ Nov05-Oct06.csv

NYSERDA DG/CHP Integrated Database System Utility Rate Details
CDH Energy Corporation 58 September 25, 2008
Consolidated Edison Service Classification 9-2 General Large – High Tension (Time-of-Use) for Westchester County – July 2007 to June 2008 This rate has multiple time of day periods with varying energy and demand charges. A facility will be billed under this classification if the peak demand is over 1,500 kW in any month. A facility will remain under this classification until the peak demand for a 12-month period is less than 900 kW. High Tension is any Alternating Current Service with a voltage level greater than 480V. Only facilities located in Westchester County can take service under this rate. Periods On-Peak Mon-Fri, 8am-10pm Off-Peak All Hours not included in On-Peak M-F 8am - 6pm June 1 – September 30 Mon-Fri, 8am-6pm Demand Charges1 $ per peak kW within the defined period On-Peak Market Supply and Monthly Adjustment Charges and Demand Charge Jan Feb Mar Apr May Jun Jul Aug Sep Oct Nov Dec $ 13.79 $12.98 $14.38 $14.96 $14.19 $11.09 $10.80 $10.80 $10.80 $15.07 $13.82 $14.69 M-F 8am - 6pm Jan Feb Mar Apr May Jun Jul Aug Sep Oct Nov Dec $11.91 $10.87 $12.27 $13.14 Energy Charges $ per total kWh within defined period
System Benefits, Renewable Portfolio and Energy Delivery Charge
$0.0082 per total kWh for all hours
On-Peak Market Supply and Monthly Adjustment Charges Jan Feb Mar Apr May Jun Jul Aug Sep Oct Nov Dec $0.1135 $0.1338 $0.1148 $0.1187 $0.1166 $0.1282 $0.1250 $0.1171 $0.0965 $0.0972 $0.1008 $0.1017 Off-Peak Market Supply and Monthly Adjustment Charges Jan Feb Mar Apr May Jun Jul Aug Sep Oct Nov Dec $0.0962 $0.0948 $0.0807 $0.0838 $0.0858 $0.0872 $0.0785 $0.0741 $0.0718 $0.0743 $0.0704 $0.0711
Filename: CONED_SC9-2_HT_West_ Jul07-Jun08.csv

NYSERDA DG/CHP Integrated Database System Utility Rate Details
CDH Energy Corporation 59 September 25, 2008
Consolidated Edison
Service Classification 14RA – Standby (SC9 Rate 1 Base) – Low Tension for New York City – May 2005 to April 2006 This tariff applies to a facility that generates all or part of its electric load by use of an onsite generator or other power-generating equipment and needs power from the utility to supplement all or part of its electric needs. This rate has variable energy and demand charges by month. The Energy Charges are the same as the otherwise applicable Service Classification. The facility's peak demand must be over 10 kW to qualify for service under this classification. Facilities may select between this classification and SC9-3 if they do not qualify for service under SC9-2. Low Tension is any Alternating Current Service with 1-3 phases at 120-480V. Only facilities located in New York City can take service under this rate. Monthly Service Charge $ / month Jan Feb Mar Apr May Jun Jul Aug Sep Oct Nov Dec $ 19.26 $ 72.57 $ 71.87 $ 68.68 $ 76.89 $ 72.97 $ 57.22 $ 64.87 $ 68.86 $ 67.78 $ 49.19 $ 44.01 Contract Demand1 $ per contract kW Jan Feb Mar Apr May Jun Jul Aug Sep Oct Nov Dec $ 1.19 $ 4.49 $ 4.45 $ 4.25 $ 4.76 $ 4.51 $ 3.53 $ 4.01 $ 4.26 $ 4.19 $ 3.04 $ 2.72 Periods Period 1 Monday – Friday 8:00AM – 6:00PM Period 2 Monday – Friday 8:00AM – 10:00PM Demand Charges $ per peak kW within defined period Market Supply and Monthly Adjustment Charges $ per peak kW for All Hours Jan Feb Mar Apr May Jun Jul Aug Sep Oct Nov Dec $ 1.51 $ 8.52 $ 8.46 $ 8.09 $ 10.70 $ 10.53 $ 8.99 $ 9.92 $ 10.33 $ 10.14 $ 4.40 $ 3.85 As-used Daily Demand Charge and Monthly Adjustment Clauses $ per daily peak kW within Period 1 Jan Feb Mar Apr May Jun Jul Aug Sep Oct Nov Dec $0.7533 $0.2633 $0.2985 $0.3168 As-used Daily Demand Charge and Monthly Adjustment Clauses $ per daily peak kW within Period 2 Jan Feb Mar Apr May Jun Jul Aug Sep Oct Nov Dec $0.2418 $0.1058 $0.3986 $0.3948 $0.3772 $0.6506 $0.6657 $0.5520 $0.5918 $0.4000 $0.3723 $0.2702 Energy Charges $ per total kWh for All Hours System Benefits, Renewable Portfolio and Energy Delivery Charge
$0.0160 per total kWh for all hours
Market Supply and Monthly Adjustment Charge $ / kWh Jan Feb Mar Apr May Jun Jul Aug Sep Oct Nov Dec $ 0.1631 $ 0.1204 $ 0.1172 $ 0.1118 $ 0.0911 $ 0.0921 $ 0.1070 $ 0.1036 $ 0.0949 $ 0.0947 $ 0.1256 $ 0.1296
1 – Contract Demand for the purpose of this Service Classification means the Customer’s maximum potential demand.
Filename: CONED_SC14RA_SC9-1_LT_NYC_ May05-Apr06.csv

NYSERDA DG/CHP Integrated Database System Utility Rate Details
CDH Energy Corporation 60 September 25, 2008
Consolidated Edison
Service Classification 14RA – Standby (SC9 Rate 1 Base) – Low Tension for New York City – November 2005 to October 2006 This tariff applies to a facility that generates all or part of its electric load by use of an onsite generator or other power-generating equipment and needs power from the utility to supplement all or part of its electric needs. This rate has variable energy and demand charges by month. The Energy Charges are the same as the otherwise applicable Service Classification. The facility's peak demand must be over 10 kW to qualify for service under this classification. Facilities may select between this classification and SC9-3 if they do not qualify for service under SC9-2. Low Tension is any Alternating Current Service with 1-3 phases at 120-480V. Only facilities located in New York City can take service under this rate. Monthly Service Charge $ / month Jan Feb Mar Apr May Jun Jul Aug Sep Oct Nov Dec $ 19.26 $ 72.57 $ 71.87 $ 68.68 $ 78.10 $ 78.80 $ 61.59 $ 72.34 $ 77.41 $ 72.68 $ 49.19 $ 44.01 Contract Demand1 $ per contract kW Jan Feb Mar Apr May Jun Jul Aug Sep Oct Nov Dec $ 1.19 $ 4.49 $ 4.45 $ 4.25 $ 4.76 $ 4.51 $ 3.83 $ 4.01 $ 4.79 $ 4.50 $ 3.04 $ 2.72 Periods Period 1 Monday – Friday 8:00AM – 6:00PM Period 2 Monday – Friday 8:00AM – 10:00PM Demand Charges $ per peak kW within defined period Market Supply and Monthly Adjustment Charges $ per peak kW for All Hours Jan Feb Mar Apr May Jun Jul Aug Sep Oct Nov Dec $ 1.51 $ 8.52 $ 8.46 $ 8.09 $ 12.40 $ 12.70 $ 10.96 $ 12.14 $ 12.69 $ 12.05 $ 4.40 $ 3.85 As-used Daily Demand Charge and Monthly Adjustment Clauses $ per daily peak kW within Period 1 Jan Feb Mar Apr May Jun Jul Aug Sep Oct Nov Dec $0.3625 $0.2834 $0.3328 $0.3562 As-used Daily Demand Charge and Monthly Adjustment Clauses $ per daily peak kW within Period 2 Jan Feb Mar Apr May Jun Jul Aug Sep Oct Nov Dec $0.2418 $0.1058 $0.3986 $0.3948 $0.4290 $0.7188 $0.5618 $0.6599 $0.7062 $0.3993 $0.3723 $0.2702 Energy Charges $ per total kWh for All Hours System Benefits, Renewable Portfolio and Energy Delivery Charge
$0.0160 per total kWh for all hours
Market Supply and Monthly Adjustment Charge $ / kWh Jan Feb Mar Apr May Jun Jul Aug Sep Oct Nov Dec $ 0.1631 $ 0.1204 $ 0.1172 $ 0.1118 $ 0.0933 $ 0.1035 $ 0.1133 $ 0.1056 $ 0.0908 $ 0.0975 $ 0.1256 $ 0.1296
1 – Contract Demand for the purpose of this Service Classification means the Customer’s maximum potential demand.
Filename: CONED_SC14RA_SC9-1_LT_NYC_ Nov05-Oct06.csv

NYSERDA DG/CHP Integrated Database System Utility Rate Details
CDH Energy Corporation 61 September 25, 2008
Consolidated Edison
Service Classification 14RA – Standby (SC9 Rate 1 Base) – Low Tension for New York City – July 2007 to June 2008 This tariff applies to a facility that generates all or part of its electric load by use of an onsite generator or other power-generating equipment and needs power from the utility to supplement all or part of its electric needs. This rate has variable energy and demand charges by month. The Energy Charges are the same as the otherwise applicable Service Classification. The facility's peak demand must be over 10 kW to qualify for service under this classification. Facilities may select between this classification and SC9-3 if they do not qualify for service under SC9-2. Low Tension is any Alternating Current Service with 1-3 phases at 120-480V. Only facilities located in New York City can take service under this rate. Monthly Service Charge $ / month Jan Feb Mar Apr May Jun Jul Aug Sep Oct Nov Dec $ 87.59 $ 66.08 $ 83.28 $ 77.60 $ 72.33 $ 68.29 $ 65.73 $ 79.40 $ 85.48 $ 84.17 $ 96.11 $ 96.22 Contract Demand1 $ per contract kW Jan Feb Mar Apr May Jun Jul Aug Sep Oct Nov Dec $ 15.42 $ 3.55 $ 5.16 $ 6.07 $ 6.11 $ 5.77 $ 4.85 $ 4.92 $ 5.29 $ 5.21 $ 5.95 $ 5.96 Periods Period 1 Monday – Friday 8:00AM – 6:00PM Period 2 Monday – Friday 8:00AM – 10:00PM Demand Charges $ per peak kW within defined period Market Supply and Monthly Adjustment Charges $ per peak kW for All Hours Jan Feb Mar Apr May Jun Jul Aug Sep Oct Nov Dec $ 6.96 $ 7.56 $ 8.63 $ 8.94 $ 12.53 $ 12.19 $ 11.24 $ 11.90 $ 12.27 $ 12.19 $ 7.49 $ 7.5 As-used Daily Demand Charge and Monthly Adjustment Clauses $ per daily peak kW within Period 1 Jan Feb Mar Apr May Jun Jul Aug Sep Oct Nov Dec $0.3625 $0.2834 $0.3328 $0.3562 As-used Daily Demand Charge and Monthly Adjustment Clauses $ per daily peak kW within Period 2 Jan Feb Mar Apr May Jun Jul Aug Sep Oct Nov Dec $0.4584 $0.3402 $0.4349 $0.5298 $0.5331 $0.8501 $0.5846 $0.6865 $0.7420 $0.4396 $0.5052 $0.5058 Energy Charges $ per total kWh for All Hours System Benefits, Renewable Portfolio and Energy Delivery Charge
$0.0160 per total kWh for all hours
Market Supply and Monthly Adjustment Charge $ / kWh Jan Feb Mar Apr May Jun Jul Aug Sep Oct Nov Dec $ 0.1152 $ 0.1225 $ 0.1074 $ 0.1082 $ 0.1086 $ 0.1163 $ 0.1188 $ 0.1112 $ 0.0952 $ 0.0956 $ 0.0967 $ 0.0987
1 – Contract Demand for the purpose of this Service Classification means the Customer’s maximum potential demand.
Filename: CONED_SC14RA_SC9-1_LT_NYC_ Jul07-Jun08.csv

NYSERDA DG/CHP Integrated Database System Utility Rate Details
CDH Energy Corporation 62 September 25, 2008
Consolidated Edison
Service Classification 14RA – Standby (SC9 Rate 1 Base) – Low Tension for Westchester County – May 2005 to April 2006 This tariff applies to a facility that generates all or part of its electric load by use of an onsite generator or other power-generating equipment and needs power from the utility to supplement all or part of its electric needs. This rate has variable energy and demand charges by month. The Energy Charges are the same as the otherwise applicable Service Classification. The facility's peak demand must be over 10 kW to qualify for service under this classification. Facilities may select between this classification and SC9-3 if they do not qualify for service under SC9-2. Low Tension is any Alternating Current Service with 1-3 phases at 120-480V. Only facilities located in Westchester County can take service under this rate. Monthly Service Charge $ / month Jan Feb Mar Apr May Jun Jul Aug Sep Oct Nov Dec $ 43.87 $ 84.77 $ 85.11 $ 81.37 $102.48 $ 97.10 $ 84.55 $ 90.95 $ 91.36 $ 92.01 $ 62.72 $ 57.82 Contract Demand1 $ per contract kW Jan Feb Mar Apr May Jun Jul Aug Sep Oct Nov Dec $ 2.71 $ 5.24 $ 5.27 $ 5.03 $ 6.34 $ 6.01 $ 5.23 $ 5.63 $ 5.65 $ 5.69 $ 3.88 $ 2.58 Periods Period 1 Monday – Friday 8:00AM – 6:00PM Period 2 Monday – Friday 8:00AM – 10:00PM Demand Charges $ per peak kW within defined period Market Supply and Monthly Adjustment Charges $ per peak kW for All Hours Jan Feb Mar Apr May Jun Jul Aug Sep Oct Nov Dec ($ 1.54) $ 5.70 $ 5.64 $ 5.27 $ 6.38 $ 6.21 $ 4.67 $ 5.72 $ 6.13 $ 5.94 $ 1.35 $ 0.80 As-used Daily Demand Charge and Monthly Adjustment Clauses $ per daily peak kW within Period 1 Jan Feb Mar Apr May Jun Jul Aug Sep Oct Nov Dec $0.4467 $0.3890 $0.4185 $0.4203 As-used Daily Demand Charge and Monthly Adjustment Clauses $ per daily peak kW within Period 2 Jan Feb Mar Apr May Jun Jul Aug Sep Oct Nov Dec $0.2410 $0.4656 $0.4675 $0.4470 $0.5629 $0.8858 $0.7713 $0.8297 $0.8334 $0.5054 $0.3445 $0.3176 Energy Charges $ per total kWh for All Hours System Benefits, Renewable Portfolio and Energy Delivery Charge
$0.0160 per total kWh for all hours
Market Supply and Monthly Adjustment Charge $ / kWh Jan Feb Mar Apr May Jun Jul Aug Sep Oct Nov Dec $ 0.1370 $ 0.1113 $ 0.1067 $ 0.1023 $ 0.0863 $ 0.0853 $ 0.0962 $ 0.0939 $ 0.0877 $ 0.0878 $ 0.1148 $ 0.1184
1 – Contract Demand for the purpose of this Service Classification means the Customer’s maximum potential demand.
Filename: CONED_SC14RA_SC9-1_LT_West_ May05-Apr06.csv

NYSERDA DG/CHP Integrated Database System Utility Rate Details
CDH Energy Corporation 63 September 25, 2008
Consolidated Edison
Service Classification 14RA – Standby (SC9 Rate 1 Base) – Low Tension for Westchester County – November 2005 to October 2006 This tariff applies to a facility that generates all or part of its electric load by use of an onsite generator or other power-generating equipment and needs power from the utility to supplement all or part of its electric needs. This rate has variable energy and demand charges by month. The Energy Charges are the same as the otherwise applicable Service Classification. The facility's peak demand must be over 10 kW to qualify for service under this classification. Facilities may select between this classification and SC9-3 if they do not qualify for service under SC9-2. Low Tension is any Alternating Current Service with 1-3 phases at 120-480V. Only facilities located in Westchester County can take service under this rate. Monthly Service Charge $ / month Jan Feb Mar Apr May Jun Jul Aug Sep Oct Nov Dec $ 43.87 $ 84.77 $ 85.11 $ 81.37 $87.69 $ 87.97 $ 70.34 $ 79.82 $ 83.14 $ 78.80 $ 62.72 $ 57.82 Contract Demand1 $ per contract kW Jan Feb Mar Apr May Jun Jul Aug Sep Oct Nov Dec $ 2.71 $ 5.24 $ 5.27 $ 5.03 $ 5.43 $ 5.44 $ 4.35 $ 4.94 $ 5.14 $ 4.87 $ 3.88 $ 2.58 Periods Period 1 Monday – Friday 8:00AM – 6:00PM Period 2 Monday – Friday 8:00AM – 10:00PM Demand Charges $ per peak kW within defined period Market Supply and Monthly Adjustment Charges $ per peak kW for All Hours Jan Feb Mar Apr May Jun Jul Aug Sep Oct Nov Dec ($ 1.54) $ 5.70 $ 5.64 $ 5.27 $ 4.91 $ 5.21 $ 3.47 $ 6.68 $ 7.23 $ 6.59 $ 1.35 $ 0.80 As-used Daily Demand Charge and Monthly Adjustment Clauses $ per daily peak kW within Period 1 Jan Feb Mar Apr May Jun Jul Aug Sep Oct Nov Dec $0.4047 $0.3236 $0.3672 $0.3825 As-used Daily Demand Charge and Monthly Adjustment Clauses $ per daily peak kW within Period 2 Jan Feb Mar Apr May Jun Jul Aug Sep Oct Nov Dec $0.2410 $0.4656 $0.4675 $0.4470 $0.4817 $0.8025 $0.6416 $0.7281 $0.7584 $0.4328 $0.3445 $0.3176 Energy Charges $ per total kWh for All Hours System Benefits, Renewable Portfolio and Energy Delivery Charge
$0.0160 per total kWh for all hours
Market Supply and Monthly Adjustment Charge $ / kWh Jan Feb Mar Apr May Jun Jul Aug Sep Oct Nov Dec $ 0.1370 $ 0.1113 $ 0.1067 $ 0.1023 $ 0.0811 $ 0.0863 $ 0.0976 $ 0.0904 $ 0.0816 $ 0.0892 $ 0.1148 $ 0.1184
1 – Contract Demand for the purpose of this Service Classification means the Customer’s maximum potential demand.
Filename: CONED_SC14RA_SC9-1_LT_West_ Nov05-Oct06.csv

NYSERDA DG/CHP Integrated Database System Utility Rate Details
CDH Energy Corporation 64 September 25, 2008
Consolidated Edison
Service Classification 14RA – Standby (SC9 Rate 1 Base) – Low Tension for Westchester County – July 2007 to June 2008 This tariff applies to a facility that generates all or part of its electric load by use of an onsite generator or other power-generating equipment and needs power from the utility to supplement all or part of its electric needs. This rate has variable energy and demand charges by month. The Energy Charges are the same as the otherwise applicable Service Classification. The facility's peak demand must be over 10 kW to qualify for service under this classification. Facilities may select between this classification and SC9-3 if they do not qualify for service under SC9-2. Low Tension is any Alternating Current Service with 1-3 phases at 120-480V. Only facilities located in Westchester County can take service under this rate. Monthly Service Charge $ / month Jan Feb Mar Apr May Jun Jul Aug Sep Oct Nov Dec $ 87.59 $ 66.08 $ 83.31 $ 77.60 $ 72.33 $ 68.29 $ 68.23 $ 79.40 $ 85.48 $ 84.17 $ 96.11 $ 96.22 Contract Demand1 $ per contract kW Jan Feb Mar Apr May Jun Jul Aug Sep Oct Nov Dec $ 5.42 $ 4.09 $ 5.16 $ 6.07 $ 5.77 $ 5.24 $ 4.21 $ 4.92 $ 5.29 $ 5.21 $ 5.95 $ 5.96 Periods Period 1 Monday – Friday 8:00AM – 6:00PM Period 2 Monday – Friday 8:00AM – 10:00PM Demand Charges $ per peak kW within defined period Market Supply and Monthly Adjustment Charges $ per peak kW for All Hours Jan Feb Mar Apr May Jun Jul Aug Sep Oct Nov Dec $ 4.85 $ 3.70 $ 5.35 $ 5.73 $ 4.80 $ 4.80 $ 4.53 $ 6.18 $ 6.86 $ 6.55 $ 5.58 $ 5.74 As-used Daily Demand Charge and Monthly Adjustment Clauses $ per daily peak kW within Period 1 Jan Feb Mar Apr May Jun Jul Aug Sep Oct Nov Dec $0.3651 $0.2948 $0.3457 $0.3734 As-used Daily Demand Charge and Monthly Adjustment Clauses $ per daily peak kW within Period 2 Jan Feb Mar Apr May Jun Jul Aug Sep Oct Nov Dec $0.4115 $0.3402 $0.4349 $0.4629 $0.4662 $0.7240 $0.5770 $0.6084 $0.6254 $0.4005 $0.5052 $0.5058 Energy Charges $ per total kWh for All Hours System Benefits, Renewable Portfolio and Energy Delivery Charge
$0.0189 per total kWh for all hours
Market Supply and Monthly Adjustment Charge $ / kWh Jan Feb Mar Apr May Jun Jul Aug Sep Oct Nov Dec $ 0.1046 $ 0.1127 $ 0.0994 $ 0.1031 $ 0.1086 $ 0.1163 $ 0.1027 $ 0.0981 $ 0.0871 $ 0.0880 $ 0.0900 $ 0.0920
1 – Contract Demand for the purpose of this Service Classification means the Customer’s maximum potential demand.
Filename: CONED_SC14RA_SC9-1_LT_West_ Jul07-Jun08.csv

NYSERDA DG/CHP Integrated Database System Utility Rate Details
CDH Energy Corporation 65 September 25, 2008
Consolidated Edison
Service Classification 14RA – Standby (SC9 Rate 1 Base) – High Tension for New York City – May 2005 to April 2006 This tariff applies to a facility that generates all or part of its electric load by use of an onsite generator or other power-generating equipment and needs power from the utility to supplement all or part of its electric needs. This rate has variable energy and demand charges by month. The Energy Charges are the same as the otherwise applicable Service Classification. The facility's peak demand must be over 10 kW to qualify for service under this classification. Facilities may select between this classification and SC9-3 if they do not qualify for service under SC9-2. High Tension is any Alternating Current Service with 3 phases and greater than 480V. Only facilities located in New York City can take service under this rate. Monthly Service Charge $ / month Jan Feb Mar Apr May Jun Jul Aug Sep Oct Nov Dec $ 19.26 $ 72.57 $ 71.87 $ 68.68 $ 76.89 $ 72.97 $ 57.22 $ 64.87 $ 68.86 $ 67.78 $ 49.19 $ 44.01 Contract Demand1 $ per contract Kw Jan Feb Mar Apr May Jun Jul Aug Sep Oct Nov Dec $ 0.90 $ 3.38 $ 3.35 $ 3.20 $ 3.58 $ 3.40 $ 2.67 $ 3.02 $ 3.21 $ 3.16 $ 2.29 $ 2.05 Periods Period 1 Monday – Friday 8:00AM – 6:00PM Period 2 Monday – Friday 8:00AM – 10:00PM Demand Charges $ per peak kW within defined period Market Supply and Monthly Adjustment Charges $ per peak kW for All Hours Jan Feb Mar Apr May Jun Jul Aug Sep Oct Nov Dec $ 1.51 $ 8.52 $ 8.46 $ 8.09 $ 10.70 $ 10.53 $ 8.99 $ 9.92 $ 10.33 $ 10.14 $ 4.40 $ 3.85 As-used Daily Demand Charge and Monthly Adjustment Clauses $ per daily peak kW within Period 1 Jan Feb Mar Apr May Jun Jul Aug Sep Oct Nov Dec $0.3325 $0.2607 $0.2956 $0.3138 As-used Daily Demand Charge and Monthly Adjustment Clauses $ per daily peak kW within Period 2 Jan Feb Mar Apr May Jun Jul Aug Sep Oct Nov Dec $0.0618 $0.2330 $0.2317 $0.2205 $0.2469 $0.2048 $0.1606 $0.1821 $0.1933 $0.2176 $0.1579 $0.1413 Energy Charges $ per total kWh for All Hours System Benefits, Renewable Portfolio and Energy Delivery Charge
$0.0150 per total kWh for all hours
Market Supply and Monthly Adjustment Charge $ / kWh Jan Feb Mar Apr May Jun Jul Aug Sep Oct Nov Dec $ 0.1631 $ 0.1204 $ 0.1172 $ 0.1118 $ 0.0911 $ 0.0921 $ 0.1070 $ 0.1036 $ 0.0949 $ 0.0947 $ 0.1256 $ 0.1296
1 – Contract Demand for the purpose of this Service Classification means the Customer’s maximum potential demand.
Filename: CONED_SC14RA_SC9-1_HT_NYC_ May05-Apr06.csv

NYSERDA DG/CHP Integrated Database System Utility Rate Details
CDH Energy Corporation 66 September 25, 2008
Consolidated Edison
Service Classification 14RA – Standby (SC9 Rate 1 Base) – High Tension for New York City – November 2005 to October 2006 This tariff applies to a facility that generates all or part of its electric load by use of an onsite generator or other power-generating equipment and needs power from the utility to supplement all or part of its electric needs. This rate has variable energy and demand charges by month. The Energy Charges are the same as the otherwise applicable Service Classification. The facility's peak demand must be over 10 kW to qualify for service under this classification. Facilities may select between this classification and SC9-3 if they do not qualify for service under SC9-2. High Tension is any Alternating Current Service with 3 phases and greater than 480V. Only facilities located in New York City can take service under this rate. Monthly Service Charge $ / month Jan Feb Mar Apr May Jun Jul Aug Sep Oct Nov Dec $ 19.26 $ 72.57 $ 71.87 $ 68.68 $ 78.10 $ 78.80 $ 61.59 $ 72.34 $ 77.41 $ 72.68 $ 49.19 $ 44.01 Contract Demand1 $ per contract Kw Jan Feb Mar Apr May Jun Jul Aug Sep Oct Nov Dec $ 0.90 $ 3.38 $ 3.35 $ 3.20 $ 3.64 $ 3.67 $ 2.87 $ 3.37 $ 3.61 $ 3.39 $ 2.29 $ 2.05 Periods Period 1 Monday – Friday 8:00AM – 6:00PM Period 2 Monday – Friday 8:00AM – 10:00PM Demand Charges $ per peak kW within defined period Market Supply and Monthly Adjustment Charges $ per peak kW for All Hours Jan Feb Mar Apr May Jun Jul Aug Sep Oct Nov Dec $ 1.51 $ 8.52 $ 8.46 $ 8.09 $ 12.40 $ 12.70 $ 10.96 $ 12.14 $ 12.69 $ 12.05 $ 4.40 $ 3.85 As-used Daily Demand Charge and Monthly Adjustment Clauses $ per daily peak kW within Period 1 Jan Feb Mar Apr May Jun Jul Aug Sep Oct Nov Dec $0.3590 $0.2806 $0.3296 $0.3527 As-used Daily Demand Charge and Monthly Adjustment Clauses $ per daily peak kW within Period 2 Jan Feb Mar Apr May Jun Jul Aug Sep Oct Nov Dec $0.0618 $0.2330 $0.2317 $0.2205 $0.2508 $0.2212 $0.1729 $0.2031 $0.2173 $0.2334 $0.1579 $0.1413 Energy Charges $ per total kWh for All Hours System Benefits, Renewable Portfolio and Energy Delivery Charge
$0.0150 per total kWh for all hours
Market Supply and Monthly Adjustment Charge $ / kWh Jan Feb Mar Apr May Jun Jul Aug Sep Oct Nov Dec $ 0.1631 $ 0.1204 $ 0.1172 $ 0.1118 $ 0.0933 $ 0.1035 $ 0.1133 $ 0.1056 $ 0.0908 $ 0.0975 $ 0.1256 $ 0.1296
1 – Contract Demand for the purpose of this Service Classification means the Customer’s maximum potential demand.
Filename: CONED_SC14RA_SC9-1_HT_NYC_ Nov05-Oct06.csv

NYSERDA DG/CHP Integrated Database System Utility Rate Details
CDH Energy Corporation 67 September 25, 2008
Consolidated Edison
Service Classification 14RA – Standby (SC9 Rate 1 Base) – High Tension for New York City – July 2007 to June 2008 This tariff applies to a facility that generates all or part of its electric load by use of an onsite generator or other power-generating equipment and needs power from the utility to supplement all or part of its electric needs. This rate has variable energy and demand charges by month. The Energy Charges are the same as the otherwise applicable Service Classification. The facility's peak demand must be over 10 kW to qualify for service under this classification. Facilities may select between this classification and SC9-3 if they do not qualify for service under SC9-2. High Tension is any Alternating Current Service with 3 phases and greater than 480V. Only facilities located in New York City can take service under this rate. Monthly Service Charge $ / month Jan Feb Mar Apr May Jun Jul Aug Sep Oct Nov Dec $ 87.59 $ 66.08 $ 83.28 $ 77.60 $ 72.33 $ 68.29 $ 65.73 $ 79.40 $ 85.48 $ 84.17 $ 96.11 $ 96.22 Contract Demand1 $ per contract Kw Jan Feb Mar Apr May Jun Jul Aug Sep Oct Nov Dec $4.08 $ 3.08 $ 3.88 $ 4.57 $ 4.59 $ 4.34 $ 3.18 $ 3.70 $ 3.98 $ 3.92 $ 4.47 $ 4.48 Periods Period 1 Monday – Friday 8:00AM – 6:00PM Period 2 Monday – Friday 8:00AM – 10:00PM Demand Charges $ per peak kW within defined period Market Supply and Monthly Adjustment Charges $ per peak kW for All Hours Jan Feb Mar Apr May Jun Jul Aug Sep Oct Nov Dec $ 9.06 $ 7.31 $ 8.96 $ 9.34 $ 6.83 $ 6.83 $ 13.64 $ 14.41 $ 15.09 $ 14.78 $ 9.79 $ 9.95 As-used Daily Demand Charge and Monthly Adjustment Clauses $ per daily peak kW within Period 1 Jan Feb Mar Apr May Jun Jul Aug Sep Oct Nov Dec $0.4246 $0.3109 $0.3618 $0.3895 As-used Daily Demand Charge and Monthly Adjustment Clauses $ per daily peak kW within Period 2 Jan Feb Mar Apr May Jun Jul Aug Sep Oct Nov Dec $0.2814 $0.2123 $0.2676 $0.3150 $0.3169 $0.2616 $0.1916 $0.2230 $0.1600 $0.2704 $0.3087 $0.3091 Energy Charges $ per total kWh for All Hours System Benefits, Renewable Portfolio and Energy Delivery Charge
$0.0177 per total kWh for all hours
Market Supply and Monthly Adjustment Charge $ / kWh Jan Feb Mar Apr May Jun Jul Aug Sep Oct Nov Dec $ 0.1152 $ 0.1225 $ 0.1159 $ 0.1082 $ 0.1086 $ 0.1163 $ 0.1188 $ 0.1112 $ 0.0952 $ 0.0956 $ 0.0967 $ 0.0987
1 – Contract Demand for the purpose of this Service Classification means the Customer’s maximum potential demand.
Filename: CONED_SC14RA_SC9-1_HT_NYC_ Jul07-Jun08.csv

NYSERDA DG/CHP Integrated Database System Utility Rate Details
CDH Energy Corporation 68 September 25, 2008
Consolidated Edison
Service Classification 14RA – Standby (SC9 Rate 1 Base) – High Tension for Westchester County – May 2005 to April 2006 This tariff applies to a facility that generates all or part of its electric load by use of an onsite generator or other power-generating equipment and needs power from the utility to supplement all or part of its electric needs. This rate has variable energy and demand charges by month. The Energy Charges are the same as the otherwise applicable Service Classification. The facility's peak demand must be over 10 kW to qualify for service under this classification. Facilities may select between this classification and SC9-3 if they do not qualify for service under SC9-2. High Tension is any Alternating Current Service with 3 phases and greater than 480V. Only facilities located in Westchester County can take service under this rate. Monthly Service Charge $ / month Jan Feb Mar Apr May Jun Jul Aug Sep Oct Nov Dec $ 43.87 $ 84.77 $ 85.11 $ 81.37 $102.48 $ 97.10 $ 84.55 $ 90.95 $ 91.36 $ 92.01 $ 62.72 $ 57.82 Contract Demand1 $ per contract kW Jan Feb Mar Apr May Jun Jul Aug Sep Oct Nov Dec $ 2.04 $ 3.95 $ 3.97 $ 3.79 $ 4.78 $ 4.52 $ 3.94 $ 4.24 $ 4.26 $ 4.29 $ 2.92 $ 2.69 Periods Period 1 Monday – Friday 8:00AM – 6:00PM Period 2 Monday – Friday 8:00AM – 10:00PM Demand Charges $ per peak kW within defined period Market Supply and Monthly Adjustment Charges $ per peak kW for All Hours Jan Feb Mar Apr May Jun Jul Aug Sep Oct Nov Dec ($ 1.54) $ 5.70 $ 5.64 $ 5.27 $ 6.38 $ 6.21 $ 4.67 $ 5.72 $ 6.13 $ 5.94 $ 1.35 $ 0.80 As-used Daily Demand Charge and Monthly Adjustment Clauses $ per daily peak kW within Period 1 Jan Feb Mar Apr May Jun Jul Aug Sep Oct Nov Dec $0.4424 $0.3852 $0.4144 $0.4161 As-used Daily Demand Charge and Monthly Adjustment Clauses $ per daily peak kW within Period 2 Jan Feb Mar Apr May Jun Jul Aug Sep Oct Nov Dec $0.1408 $0.2722 $0.2733 $0.2613 $0.3291 $0.2726 $0.2373 $0.2553 $0.2564 $0.2954 $0.2014 $0.1856 Energy Charges $ per total kWh for All Hours System Benefits, Renewable Portfolio and Energy Delivery Charge
$0.0150 per total kWh for all hours
Market Supply and Monthly Adjustment Charge $ / kWh Jan Feb Mar Apr May Jun Jul Aug Sep Oct Nov Dec $ 0.1370 $ 0.1113 $ 0.1067 $ 0.1023 $ 0.0863 $ 0.0853 $ 0.0962 $ 0.0939 $ 0.0877 $ 0.0878 $ 0.1148 $ 0.1184
1 – Contract Demand for the purpose of this Service Classification means the Customer’s maximum potential demand.
Filename: CONED_SC14RA_SC9-1_HT_West_ May05-Apr06.csv

NYSERDA DG/CHP Integrated Database System Utility Rate Details
CDH Energy Corporation 69 September 25, 2008
Consolidated Edison
Service Classification 14RA – Standby (SC9 Rate 1 Base) – High Tension for Westchester County – November 2005 to October 2006 This tariff applies to a facility that generates all or part of its electric load by use of an onsite generator or other power-generating equipment and needs power from the utility to supplement all or part of its electric needs. This rate has variable energy and demand charges by month. The Energy Charges are the same as the otherwise applicable Service Classification. The facility's peak demand must be over 10 kW to qualify for service under this classification. Facilities may select between this classification and SC9-3 if they do not qualify for service under SC9-2. High Tension is any Alternating Current Service with 3 phases and greater than 480V. Only facilities located in Westchester County can take service under this rate. Monthly Service Charge $ / month Jan Feb Mar Apr May Jun Jul Aug Sep Oct Nov Dec $ 43.87 $ 84.77 $ 85.11 $ 81.37 $87.69 $ 87.97 $ 70.34 $ 79.82 $ 83.14 $ 78.80 $ 62.72 $ 57.82 Contract Demand1 $ per contract kW Jan Feb Mar Apr May Jun Jul Aug Sep Oct Nov Dec $ 2.04 $ 3.95 $ 3.97 $ 3.79 $ 4.09 $ 4.10 $ 3.28 $ 3.72 $ 3.87 $ 3.67 $ 2.92 $ 2.69 Periods Period 1 Monday – Friday 8:00AM – 6:00PM Period 2 Monday – Friday 8:00AM – 10:00PM Demand Charges $ per peak kW within defined period Market Supply and Monthly Adjustment Charges $ per peak kW for All Hours Jan Feb Mar Apr May Jun Jul Aug Sep Oct Nov Dec ($ 1.54) $ 5.70 $ 5.64 $ 5.27 $ 4.91 $ 5.21 $ 3.47 $ 6.68 $ 7.23 $ 6.59 $ 1.35 $ 0.80 As-used Daily Demand Charge and Monthly Adjustment Clauses $ per daily peak kW within Period 1 Jan Feb Mar Apr May Jun Jul Aug Sep Oct Nov Dec $0.4008 $0.3205 $0.3637 $0.3788 As-used Daily Demand Charge and Monthly Adjustment Clauses $ per daily peak kW within Period 2 Jan Feb Mar Apr May Jun Jul Aug Sep Oct Nov Dec $0.1408 $0.2722 $0.2733 $0.2613 $0.2816 $0.2469 $0.1974 $0.2240 $0.2334 $0.2530 $0.2014 $0.1856 Energy Charges $ per total kWh for All Hours System Benefits, Renewable Portfolio and Energy Delivery Charge
$0.0150 per total kWh for all hours
Market Supply and Monthly Adjustment Charge $ / kWh Jan Feb Mar Apr May Jun Jul Aug Sep Oct Nov Dec $ 0.1370 $ 0.1113 $ 0.1067 $ 0.1023 $ 0.0811 $ 0.0863 $ 0.0976 $ 0.0904 $ 0.0816 $ 0.0892 $ 0.1148 $ 0.1184
1 – Contract Demand for the purpose of this Service Classification means the Customer’s maximum potential demand.
Filename: CONED_SC14RA_SC9-1_HT_West_ Nov05-Oct06.csv

NYSERDA DG/CHP Integrated Database System Utility Rate Details
CDH Energy Corporation 70 September 25, 2008
Consolidated Edison
Service Classification 14RA – Standby (SC9 Rate 1 Base) – High Tension for Westchester County – July 2007 to June 2008 This tariff applies to a facility that generates all or part of its electric load by use of an onsite generator or other power-generating equipment and needs power from the utility to supplement all or part of its electric needs. This rate has variable energy and demand charges by month. The Energy Charges are the same as the otherwise applicable Service Classification. The facility's peak demand must be over 10 kW to qualify for service under this classification. Facilities may select between this classification and SC9-3 if they do not qualify for service under SC9-2. High Tension is any Alternating Current Service with 3 phases and greater than 480V. Only facilities located in Westchester County can take service under this rate. Monthly Service Charge $ / month Jan Feb Mar Apr May Jun Jul Aug Sep Oct Nov Dec $ 87.59 $ 66.08 $ 83.31 $ 77.60 $72.33 $ 68.29 $ 68.23 $ 79.40 $ 85.48 $ 84.17 $ 96.11 $ 96.22 Contract Demand1 $ per contract kW Jan Feb Mar Apr May Jun Jul Aug Sep Oct Nov Dec $ 4.08 $ 3.08 $ 3.88 $ 4.57 $ 4.59 $ 4.34 $ 3.18 $ 3.70 $ 3.98 $ 3.98 $ 4.47 $ 4.48 Periods Period 1 Monday – Friday 8:00AM – 6:00PM Period 2 Monday – Friday 8:00AM – 10:00PM Demand Charges $ per peak kW within defined period Market Supply and Monthly Adjustment Charges $ per peak kW for All Hours Jan Feb Mar Apr May Jun Jul Aug Sep Oct Nov Dec $ 4.85 $ 3.70 $ 5.35 $ 5.73 $ 4.80 $ 4.80 $ 4.53 $ 6.18 $ 6.86 $ 6.55 $ 5.58 $ 5.74 As-used Daily Demand Charge and Monthly Adjustment Clauses $ per daily peak kW within Period 1 Jan Feb Mar Apr May Jun Jul Aug Sep Oct Nov Dec $0.4246 $0.3109 $0.3618 $0.3895 As-used Daily Demand Charge and Monthly Adjustment Clauses $ per daily peak kW within Period 2 Jan Feb Mar Apr May Jun Jul Aug Sep Oct Nov Dec $0.2814 $0.2123 $0.2676 $0.3150 $0.3169 $0.2616 $0.1916 $0.2230 $0.2400 $0.2704 $0.3087 $0.3091 Energy Charges $ per total kWh for All Hours System Benefits, Renewable Portfolio and Energy Delivery Charge
$0.0177 per total kWh for all hours
Market Supply and Monthly Adjustment Charge $ / kWh Jan Feb Mar Apr May Jun Jul Aug Sep Oct Nov Dec $ 0.1046 $ 0.1127 $ 0.0994 $ 0.1031 $ 0.1016 $ 0.1083 $ 0.1027 $ 0.0981 $ 0.0871 $ 0.0880 $ 0.0900 $ 0.0920
1 – Contract Demand for the purpose of this Service Classification means the Customer’s maximum potential demand.
Filename: CONED_SC14RA_SC9-1_HT_West_ Jul07-Jun08.csv

NYSERDA DG/CHP Integrated Database System Utility Rate Details
CDH Energy Corporation 71 September 25, 2008
Consolidated Edison
Service Classification 14RA – Standby (SC9 Rate 2 Base) – High Tension for New York City – December 2006 to November 2007 This tariff applies to a facility that generates all or part of its electric load by use of an onsite generator or other power-generating equipment and needs power from the utility to supplement all or part of its electric needs. This rate has variable energy and demand charges by month. The Energy Charges are the same as the otherwise applicable Service Classification. The facility's peak demand must be over 10 kW to qualify for service under this classification. Facilities may select between this classification and SC9-3 if they do not qualify for service under SC9-2. High Tension is any Alternating Current Service with 3 phases and greater than 480V. Only facilities located in New York City can take service under this rate. Monthly Service Charge $ / month Jan Feb Mar Apr May Jun Jul Aug Sep Oct Nov Dec $1,592.71 $1,687.52 $1,643.63 $1,682.25 $1,506.01 $1,325.43 $1,123.64 $1,228.76 $1,315.61 $1,349.94 $1,669.87 $1,546.25
Contract Demand1 $ per contract Kw Jan Feb Mar Apr May Jun Jul Aug Sep Oct Nov Dec $ 6.27 $ 6.64 $ 6.47 $ 6.62 $ 5.93 $ 5.22 $ 4.42 $ 4.83 $ 5.18 $ 5.31 $ 6.57 $ 6.09 Periods Period 1 Monday – Friday 8:00AM – 6:00PM Period 2 Monday – Friday 8:00AM – 10:00PM Demand Charges $ per peak kW within defined period Market Supply and Monthly Adjustment Charges $ per peak kW for All Hours Jan Feb Mar Apr May Jun Jul Aug Sep Oct Nov Dec $ 10.40 $ 12.35 $ 12.17 $ 12.18 $ 16.61 $ 16.39 $ 15.23 $ 15.83 $ 16.70 $ 16.41 $ 10.79 $ 10.33 As-used Daily Demand Charge and Monthly Adjustment Clauses $ per daily peak kW within Period 1 Jan Feb Mar Apr May Jun Jul Aug Sep Oct Nov Dec $0.4165 $0.3531 $0.3861 $0.4134 As-used Daily Demand Charge and Monthly Adjustment Clauses $ per daily peak kW within Period 2 Jan Feb Mar Apr May Jun Jul Aug Sep Oct Nov Dec $0.4571 $0.4844 $0.4718 $0.4828 $0.4322 $0.2625 $0.2225 $0.2433 $0.2605 $0.3874 $0.4792 $0.4438 Energy Charges $ per total kWh for All Hours System Benefits, Renewable Portfolio and Energy Delivery Charge
$0.0077 per total kWh for all hours
Market Supply and Monthly Adjustment Charge $ / kWh Jan Feb Mar Apr May Jun Jul Aug Sep Oct Nov Dec $ 0.1300 $ 0.1000 $ 0.1036 $ 0.1052 $ 0.1088 $ 0.1207 $ 0.1467 $ 0.1338 $ 0.1071 $ 0.1075 $ 0.1083 $ 0.1065
1 – Contract Demand for the purpose of this Service Classification means the Customer’s maximum potential demand.
Filename: CONED_SC14RA_SC9-2_HT_NYC_ Dec06-Nov07.csv

NYSERDA DG/CHP Integrated Database System Utility Rate Details
CDH Energy Corporation 72 September 25, 2008
Consolidated Edison
Service Classification 14RA – Standby (SC9 Rate 2 Base) – High Tension for New York City – July 2007 to June 2008 This tariff applies to a facility that generates all or part of its electric load by use of an onsite generator or other power-generating equipment and needs power from the utility to supplement all or part of its electric needs. This rate has variable energy and demand charges by month. The Energy Charges are the same as the otherwise applicable Service Classification. The facility's peak demand must be over 10 kW to qualify for service under this classification. Facilities may select between this classification and SC9-3 if they do not qualify for service under SC9-2. High Tension is any Alternating Current Service with 3 phases and greater than 480V. Only facilities located in New York City can take service under this rate. Monthly Service Charge $ / month Jan Feb Mar Apr May Jun Jul Aug Sep Oct Nov Dec $1,622.77 $1,211.89 $1,509.57 $1,454.06 $1,401.84 $1,182.15 $1,123.64 $1,228.76 $1,315.61 $1,349.94 $1,669.87 $1,782.18
Contract Demand1 $ per contract Kw Jan Feb Mar Apr May Jun Jul Aug Sep Oct Nov Dec $ 6.39 $ 4.77 $ 5.94 $ 6.65 $ 6.95 $ 5.86 $ 4.42 $ 4.83 $ 5.18 $ 5.31 $ 6.57 $ 6.09 Periods Period 1 Monday – Friday 8:00AM – 6:00PM Period 2 Monday – Friday 8:00AM – 10:00PM Demand Charges $ per peak kW within defined period Market Supply and Monthly Adjustment Charges $ per peak kW for All Hours Jan Feb Mar Apr May Jun Jul Aug Sep Oct Nov Dec $ 10.76 $ 9.3 $ 10.70 $ 11.07 $ 8.61 $ 8.61 $ 15.23 $ 15.83 $ 16.70 $ 16.41 $ 10.79 $ 10.33 As-used Daily Demand Charge and Monthly Adjustment Clauses $ per daily peak kW within Period 1 Jan Feb Mar Apr May Jun Jul Aug Sep Oct Nov Dec $0.4676 $0.3531 $0.3861 $0.4134 As-used Daily Demand Charge and Monthly Adjustment Clauses $ per daily peak kW within Period 2 Jan Feb Mar Apr May Jun Jul Aug Sep Oct Nov Dec $0.4657 $0.3478 $0.4332 $0.4848 $0.5065 $0.2947 $0.2225 $0.2433 $0.2605 $0.3874 $0.4792 $0.4438 Energy Charges $ per total kWh for All Hours System Benefits, Renewable Portfolio and Energy Delivery Charge
$0.0079 per total kWh for all hours
Market Supply and Monthly Adjustment Charge $ / kWh Jan Feb Mar Apr May Jun Jul Aug Sep Oct Nov Dec $ 0.1300 $ 0.1468 $ 0.1282 $ 0.1268 $ 0.1274 $ 0.1412 $ 0.1467 $ 0.1338 $ 0.1071 $ 0.1075 $ 0.1083 $ 0.1065
1 – Contract Demand for the purpose of this Service Classification means the Customer’s maximum potential demand.
Filename: CONED_SC14RA_SC9-2_HT_NYC_ Jul07-Jun08.csv

NYSERDA DG/CHP Integrated Database System Utility Rate Details
CDH Energy Corporation 73 September 25, 2008
Complete Long Island Power Authority Electric Tariff The Long Island Power Authority rates are up-to-date as of June 2008.
Long Island Power Authority
Service Classification 1 (Rate Code: 180, 183, 186) – Residential Service – June 2008 Applicable to customers who will use the service for residential purposes or as specified in Section 76 of the Public Service Law, for religious purposes, a community residence, or a post or hall owned or leased by a not-for-profit corporation that is a Veterans’ Organization. Service Charge $ 0.179 / day Periods Summer June 1 – September 30 Other All hours not in the Summer Period Block Charges: Energy Charge per kWh per month First 250 kWh Over 250 kWh Summer $0.0857 / kWh $0.0975 / kWh Other $0.0857 / kWh $0.0787 / kWh
Filename: LIPA_SC1_R180_R183_R186_Jun08.csv
Long Island Power Authority
Service Classification 1 (Rate Code: 380) – Residential Service (Water Heating) – June 2008 Applicable to customers using electricity for any residential purpose when the customer’s water is totally heated by an electric water heater that meets the authority’s specifications. The customer must be recorded on the authority’s books at the service location as of January 26, 1983, and the customer must have not terminated service at that location or removed the electric water heater. Service Charge $ 0.179 / day Periods Summer June 1 – September 30 Other All hours not in the Summer Period Block Charges: Energy Charge per kWh per month First 250 kWh Next 150 kWh Next 400 kWh Over 800 kWh Summer $0.0857 / kWh $0.0975 / kWh $0.0586 / kWh $0.0975 / kWh Other $0.0857 / kWh $0.0787 / kWh $0.0586 / kWh $0.0787 / kWh
Filename: LIPA_SC1_R380_Jun08.csv

NYSERDA DG/CHP Integrated Database System Utility Rate Details
CDH Energy Corporation 74 September 25, 2008
Long Island Power Authority
Service Classification 1 (Rate Code: 580, 581, 882, 883) – Residential Service (Space Heating) – June 2008 Applicable to customers using electricity for any residential purpose when the size and design of the customer’s heating and heat pump equipment meets the authority’s specifications. The customer must submit a signed application for this provision and a signed certificate of insulation compliance if it applies, and the electric resistance heater or heat pump (fireplaces, coal and wood stoves are excluded) must supply all of the heating requirements of the building and is permanently connected. Service Charge $ 0.179 / day Periods Summer June 1 – September 30 Other All hours not in the Summer Period Block Charges: Energy Charge per kWh per month First 250 kWh Next 150 kWh Over 400 kWh Summer $0.0857 / kWh $0.0975 / kWh $0.0975 / kWh Other $0.0857 / kWh $0.0787 / kWh $0.0515 / kWh
Filename: LIPA_SC1_R580_R581_R882_R883_Jun08.csv
Long Island Power Authority
Service Classification 1 (Rate Code: 880, 881) – Residential Service (Space and Water Heating) – June 2008 Applicable to customers using electricity for any residential purpose when using space and water heating. Service Charge $ 0.141 / day Periods Summer June 1 – September 30 Other All hours not in the Summer Period Block Charges: Energy Charge per kWh per month First 250 kWh Next 150 kWh Next 400 kWh Over 800 kWh Summer $0.0857 / kWh $0.0975 / kWh $0.0586 / kWh $0.0975 / kWh Other $0.0857 / kWh $0.0787 / kWh $0.0515 / kWh $0.0515 / kWh
Filename: LIPA_SC1_R880_R881_Jun08.csv
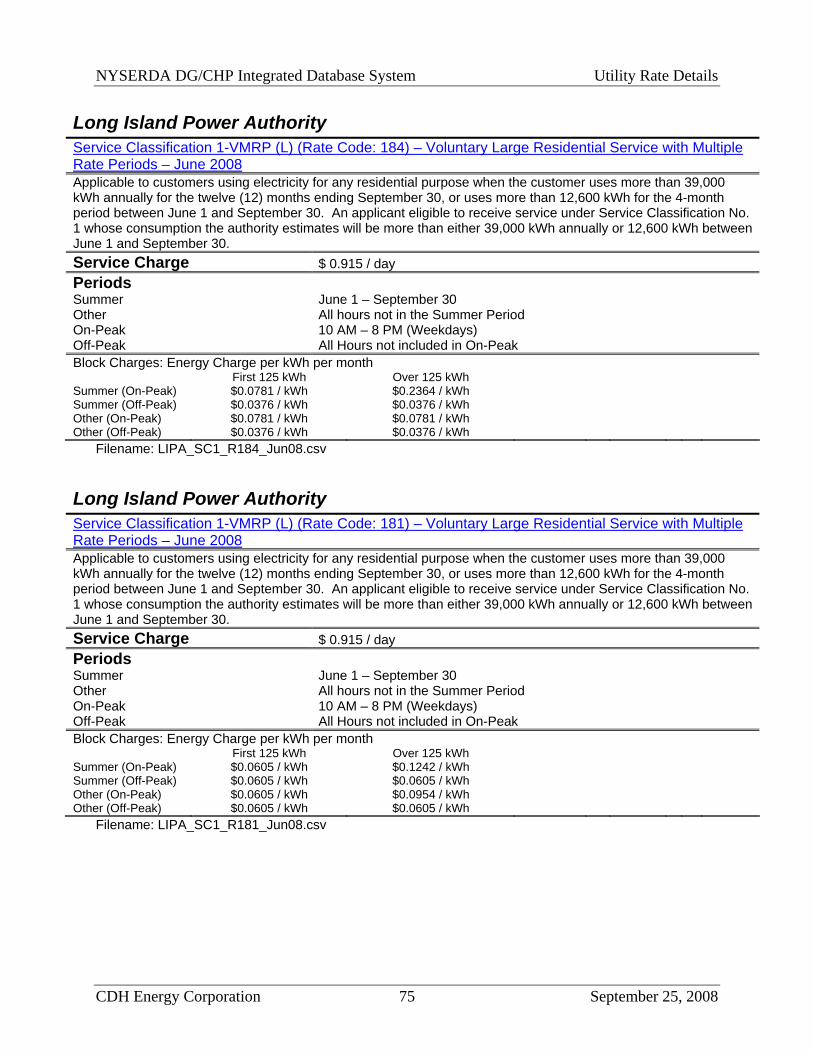
NYSERDA DG/CHP Integrated Database System Utility Rate Details
CDH Energy Corporation 75 September 25, 2008
Long Island Power Authority
Service Classification 1-VMRP (L) (Rate Code: 184) – Voluntary Large Residential Service with Multiple Rate Periods – June 2008 Applicable to customers using electricity for any residential purpose when the customer uses more than 39,000 kWh annually for the twelve (12) months ending September 30, or uses more than 12,600 kWh for the 4-month period between June 1 and September 30. An applicant eligible to receive service under Service Classification No. 1 whose consumption the authority estimates will be more than either 39,000 kWh annually or 12,600 kWh between June 1 and September 30. Service Charge $ 0.915 / day Periods Summer June 1 – September 30 Other All hours not in the Summer Period On-Peak 10 AM – 8 PM (Weekdays) Off-Peak All Hours not included in On-Peak Block Charges: Energy Charge per kWh per month First 125 kWh Over 125 kWh Summer (On-Peak) $0.0781 / kWh $0.2364 / kWh Summer (Off-Peak) $0.0376 / kWh $0.0376 / kWh Other (On-Peak) $0.0781 / kWh $0.0781 / kWh Other (Off-Peak) $0.0376 / kWh $0.0376 / kWh
Filename: LIPA_SC1_R184_Jun08.csv
Long Island Power Authority
Service Classification 1-VMRP (L) (Rate Code: 181) – Voluntary Large Residential Service with Multiple Rate Periods – June 2008 Applicable to customers using electricity for any residential purpose when the customer uses more than 39,000 kWh annually for the twelve (12) months ending September 30, or uses more than 12,600 kWh for the 4-month period between June 1 and September 30. An applicant eligible to receive service under Service Classification No. 1 whose consumption the authority estimates will be more than either 39,000 kWh annually or 12,600 kWh between June 1 and September 30. Service Charge $ 0.915 / day Periods Summer June 1 – September 30 Other All hours not in the Summer Period On-Peak 10 AM – 8 PM (Weekdays) Off-Peak All Hours not included in On-Peak Block Charges: Energy Charge per kWh per month First 125 kWh Over 125 kWh Summer (On-Peak) $0.0605 / kWh $0.1242 / kWh Summer (Off-Peak) $0.0605 / kWh $0.0605 / kWh Other (On-Peak) $0.0605 / kWh $0.0954 / kWh Other (Off-Peak) $0.0605 / kWh $0.0605 / kWh
Filename: LIPA_SC1_R181_Jun08.csv

NYSERDA DG/CHP Integrated Database System Utility Rate Details
CDH Energy Corporation 76 September 25, 2008
Long Island Power Authority
Service Classification 1-VMRP (L) (Rate Code: 182) – Voluntary Large Residential Service with Multiple Rate Periods – June 2008 Applicable to customers using electricity for any residential purpose when the customer uses more than 39,000 kWh annually for the twelve (12) months ending September 30, or uses more than 12,600 kWh for the 4-month period between June 1 and September 30. An applicant eligible to receive service under Service Classification No. 1 whose consumption the authority estimates will be more than either 39,000 kWh annually or 12,600 kWh between June 1 and September 30. Service Charge $ 0.915 / day Periods Summer June 1 – September 30 Other All hours not in the Summer Period On-Peak 10 AM – 8 PM (Weekdays) Off-Peak All Hours not included in On-Peak Block Charges: Energy Charge per kWh per month First 125 kWh Over 125 kWh Summer (On-Peak) $0.0605 / kWh $0.1242 / kWh Summer (Off-Peak) $0.0605 / kWh $0.0605 / kWh Other (On-Peak) $0.0605 / kWh $0.0455 / kWh Other (Off-Peak) $0.0605 / kWh $0.0455 / kWh
Filename: LIPA_SC1_R182_Jun08.csv
Long Island Power Authority
Service Classification 1-VMRP (S) (Rate Code: 188) – Voluntary Small Residential Service with Multiple Rate Periods – June 2008 Qualifying applicants who will use the service for residential purposes or as specified in Section 76 of the Public Service Law, for religious purposes, a community residence, or a post or hall owned or leased by a not-for-profit corporation that is a Veterans’ Organization as an alternative to Service Classification No. 1, but who do not qualify for Service Classification No. 1-VMRP(L). Service Charge $ 0.269 / day (Service Charge and Meter Charge) Periods On-Peak 10 AM – 8 PM (Weekdays) Off-Peak All Hours not included in On-Peak Energy Charge per kWh On-Peak Charges $ / kWh Jan Feb Mar Apr May Jun Jul Aug Sep Oct Nov Dec $ 0.0888 $ 0.0888 $ 0.0888 $ 0.0888 $ 0.0888 $ 0.2735 $ 0.2735 $ 0.2735 $ 0.2735 $ 0.0888 $ 0.0888 $ 0.0888 Off-Peak Charges $ / kWh Jan Feb Mar Apr May Jun Jul Aug Sep Oct Nov Dec $ 0.0437 $ 0.0437 $ 0.0437 $ 0.0437 $ 0.0437 $ 0.0578 $ 0.0578 $ 0.0578 $ 0.0578 $ 0.0437 $ 0.0437 $ 0.0437
Filename: LIPA_SC1_R188_Jun08.csv

NYSERDA DG/CHP Integrated Database System Utility Rate Details
CDH Energy Corporation 77 September 25, 2008
Long Island Power Authority
Service Classification 2 (Rate Code: 280) – General Service – Small – October 2002 Applicable to customers using electricity for any nonresidential purpose when the amount consumed during the preceding 12 months is less that 2,000 kWh in each of two consecutive monthly billing periods (4,000 kWh in one bimonthly billing period) or whenever it is estimated that an applicant’s demand is less than 7 kilowatts (kW). These conditions also apply to service supplied through a single meter to a multi-family residence and to accessory buildings not supplied through the same meter as the dwelling to which they are accessory. Service Charge $ 0.179 / day Periods Summer June 1 – September 30 Other All hours not in the Summer Period Energy Charges $ per total kWh Summer Energy: $ 0.1444 / kWh Other Energy: $ 0.1255 / kWh
Filename: LIPA_SC2_R280_Oct02.csv
Long Island Power Authority
Service Classification 2 (Rate Code: 280) – General Service – Small – July 2006 Applicable to customers using electricity for any nonresidential purpose when the amount consumed during the preceding 12 months is less that 2,000 kWh in each of two consecutive monthly billing periods (4,000 kWh in one bimonthly billing period) or whenever it is estimated that an applicant’s demand is less than 7 kilowatts (kW). These conditions also apply to service supplied through a single meter to a multi-family residence and to accessory buildings not supplied through the same meter as the dwelling to which they are accessory. Service Charge $ 0.179 / day Periods Summer June 1 – September 30 Other All hours not in the Summer Period Energy Charges $ per total kWh Summer Energy: $ 0.1052 / kWh Other Energy: $ 0.0863 / kWh
Filename: LIPA_SC2_R280_July06.csv

NYSERDA DG/CHP Integrated Database System Utility Rate Details
CDH Energy Corporation 78 September 25, 2008
Long Island Power Authority
Service Classification 2 (Rate Code: 280) – General Service – Small – June 2008 Applicable to customers using electricity for any nonresidential purpose when the amount consumed during the preceding 12 months is less that 2,000 kWh in each of two consecutive monthly billing periods (4,000 kWh in one bimonthly billing period) or whenever it is estimated that an applicant’s demand is less than 7 kilowatts (kW). These conditions also apply to service supplied through a single meter to a multi-family residence and to accessory buildings not supplied through the same meter as the dwelling to which they are accessory. Service Charge $ 0.179 / day Periods Summer June 1 – September 30 Other All hours not in the Summer Period Energy Charges $ per total kWh Summer Energy: $ 0.1052 / kWh Other Energy: $ 0.0863 / kWh
Filename: LIPA_SC2_R280_Jun08.csv
Long Island Power Authority
Service Classification 2-L (Rate Code: 281) – General Service – Large (Primary Service) – May 1998 Rate 281 applies to customers using electricity for any nonresidential purpose when the amount consumed during the preceding 12 months has equaled or exceeded 2,000 kWh in each of two consecutive monthly billing periods (4,000 kWh in one bimonthly billing period) or whenever it is estimated that an applicant’s demand is at least 7 kW, but not greater than 145 kW in a summer month (June through September) or not greater than 500 kW in any two other months. Primary Service is any voltage level greater than 480V. Service Charge $ 0.7220 / day Periods Summer June 1 – September 30 Other All hours not in the Summer Period Reactive Demand Charge $ 0.27 / RkVA in excess of 45% peak demand in kW Demand Charges $ per peak kW Summer Demand: $ 9.33 / kW Other Demand: $ 8.25 / kW Energy Charges $ per total kWh Summer Energy: $ 0.0922 / kWh Other Energy: $ 0.0773 / kWh
Filename: LIPA_SC2L_R281_Pri_May98.csv

NYSERDA DG/CHP Integrated Database System Utility Rate Details
CDH Energy Corporation 79 September 25, 2008
Long Island Power Authority
Service Classification 2-L (Rate Code: 281) – General Service – Large (Primary Service) – July 2006 Rate 281 applies to customers using electricity for any nonresidential purpose when the amount consumed during the preceding 12 months has equaled or exceeded 2,000 kWh in each of two consecutive monthly billing periods (4,000 kWh in one bimonthly billing period) or whenever it is estimated that an applicant’s demand is at least 7 kW, but not greater than 145 kW in a summer month (June through September) or not greater than 500 kW in any two other months. Primary Service is any voltage level greater than 480V. Service Charge $ 0.7220 / day Periods Summer June 1 – September 30 Other All hours not in the Summer Period Reactive Demand Charge $ 0.27 / RkVA in excess of 45% peak demand in kW Demand Charges $ per peak kW Summer Demand: $ 9.33 / kW Other Demand: $ 8.25 / kW Energy Charges $ per total kWh Summer Energy: $ 0.0530 / kWh Other Energy: $ 0.0381 / kWh
Filename: LIPA_SC2L_R281_Pri_July06.csv
Long Island Power Authority
Service Classification 2-L (Rate Code: 281) – General Service – Large (Primary Service) – June 2008 Rate 281 applies to customers using electricity for any nonresidential purpose when the amount consumed during the preceding 12 months has equaled or exceeded 2,000 kWh in each of two consecutive monthly billing periods (4,000 kWh in one bimonthly billing period) or whenever it is estimated that an applicant’s demand is at least 7 kW, but not greater than 145 kW in a summer month (June through September) or not greater than 500 kW in any two other months. Primary Service is any voltage level greater than 480V. Service Charge $ 0.7220 / day Periods Summer June 1 – September 30 Other All hours not in the Summer Period Reactive Demand Charge $ 0.27 / RkVA in excess of 45% peak demand in kW Demand Charges $ per peak kW Summer Demand: $ 9.33 / kW Other Demand: $ 8.25 / kW Energy Charges $ per total kWh Summer Energy: $ 0.0530 / kWh Other Energy: $ 0.0381 / kWh
Filename: LIPA_SC2L_R281_Pri_Jun08.csv

NYSERDA DG/CHP Integrated Database System Utility Rate Details
CDH Energy Corporation 80 September 25, 2008
Long Island Power Authority Service Classification 2-L (Rate Code: 281) – General Service – Large (Secondary Service) – May 1998 Rate 281 applies to customers using electricity for any nonresidential purpose when the amount consumed during the preceding 12 months has equaled or exceeded 2,000 kWh in each of two consecutive monthly billing periods (4,000 kWh in one bimonthly billing period) or whenever it is estimated that an applicant’s demand is at least 7 kW, but not greater than 145 kW in a summer month (June through September) or not greater than 500 kW in any two other months. Secondary Service is any single or three phase service at a voltage level between 120 and 480V. Service Charge $ 0.7220 / day Periods Summer June 1 – September 30 Other All hours not in the Summer Period Demand Charges $ per peak kW Summer Demand: $ 9.99 / kW Other Demand: $ 8.88 / kW Energy Charges $ per total kWh Summer Energy: $ 0.0928 / kWh Other Energy: $ 0.0779 / kWh
Filename: LIPA_SC2L_R281_Sec_May98.csv
Long Island Power Authority Service Classification 2-L (Rate Code: 281) – General Service – Large (Secondary Service) – July 2006 Rate 281 applies to customers using electricity for any nonresidential purpose when the amount consumed during the preceding 12 months has equaled or exceeded 2,000 kWh in each of two consecutive monthly billing periods (4,000 kWh in one bimonthly billing period) or whenever it is estimated that an applicant’s demand is at least 7 kW, but not greater than 145 kW in a summer month (June through September) or not greater than 500 kW in any two other months. Secondary Service is any single or three phase service at a voltage level between 120 and 480V. Service Charge $ 0.7220 / day Periods Summer June 1 – September 30 Other All hours not in the Summer Period Demand Charges $ per peak kW Summer Demand: $ 9.99 / kW Other Demand: $ 8.88 / kW Energy Charges $ per total kWh Summer Energy: $ 0.0536 / kWh Other Energy: $ 0.0387 / kWh
Filename: LIPA_SC2L_R281_Sec_July06.csv

NYSERDA DG/CHP Integrated Database System Utility Rate Details
CDH Energy Corporation 81 September 25, 2008
Long Island Power Authority Service Classification 2-L (Rate Code: 281) – General Service – Large (Secondary Service) – June 2008 Rate 281 applies to customers using electricity for any nonresidential purpose when the amount consumed during the preceding 12 months has equaled or exceeded 2,000 kWh in each of two consecutive monthly billing periods (4,000 kWh in one bimonthly billing period) or whenever it is estimated that an applicant’s demand is at least 7 kW, but not greater than 145 kW in a summer month (June through September) or not greater than 500 kW in any two other months. Secondary Service is any single or three phase service at a voltage level between 120 and 480V. Service Charge $ 0.7220 / day Periods Summer June 1 – September 30 Other All hours not in the Summer Period Demand Charges $ per peak kW Summer Demand: $ 9.99 / kW Other Demand: $ 8.88 / kW Energy Charges $ per total kWh Summer Energy: $ 0.0536 / kWh Other Energy: $ 0.0387 / kWh
Filename: LIPA_SC2L_R281_Sec_Jun08.csv
Long Island Power Authority
Service Classification 2-MRP (Rate Code 285) - Large General with Multiple Rate Periods – Secondary – December 2000 Applicable to customers using electricity for any non-residential purpose when either the demand has exceeded 500 kW in any two of the previous 12 months or 145 kW in any summer month (June through September). In the case of a newly established customer, LIPA determines if their estimated demand will meet these requirements. These customers are billed for energy and demand charges based on the time of year (summer/winter) and the time of day service is used. Secondary Service is any single or three phase service at a voltage level between 120 and 480V. Service Charge $ 0.7220 / day Service Charge per Meter $ 0.2264 / day / meter Periods On-Peak June 1 – September 30 10AM – 10PM Off-Peak 12AM – 7 PM throughout the year Intermediate All hours not in the Off-Peak or On-Peak periods Demand Charges $ per peak kW On-Peak Demand: $ 19.65 / kW Intermediate Demand: $ 4.68 / kW Energy Charges $ per total kWh On-Peak Energy: $ 0.0877 / kWh Off-Peak Energy: $ 0.0629 / kWh Intermediate Energy: $ 0.0770 / kWh
Filename: LIPA_SC2-MRP_R285_Sec_Dec00.csv

NYSERDA DG/CHP Integrated Database System Utility Rate Details
CDH Energy Corporation 82 September 25, 2008
Long Island Power Authority
Service Classification 2-MRP (Rate Code 285) - Large General with Multiple Rate Periods – Secondary – July 2006 Applicable to customers using electricity for any non-residential purpose when either the demand has exceeded 500 kW in any two of the previous 12 months or 145 kW in any summer month (June through September). In the case of a newly established customer, LIPA determines if their estimated demand will meet these requirements. These customers are billed for energy and demand charges based on the time of year (summer/winter) and the time of day service is used. Secondary Service is any single or three phase service at a voltage level between 120 and 480V. Service Charge $ 0.7220 / day Service Charge per Meter $ 0.2264 / day / meter Periods On-Peak June 1 – September 30 10AM – 10PM Off-Peak 12AM – 7 PM throughout the year Intermediate All hours not in the Off-Peak or On-Peak periods Demand Charges $ per peak kW On-Peak Demand: $ 19.65 / kW Intermediate Demand: $ 4.68 / kW Energy Charges $ per total kWh On-Peak Energy: $ 0.0485 / kWh Off-Peak Energy: $ 0.0237 / kWh Intermediate Energy: $ 0.0378 / kWh
Filename: LIPA_SC2-MRP_R285_Sec_July06.csv
Long Island Power Authority
Service Classification 2-MRP (Rate Code 285) - Large General with Multiple Rate Periods – Secondary – June 2008 Applicable to customers using electricity for any non-residential purpose when either the demand has exceeded 500 kW in any two of the previous 12 months or 145 kW in any summer month (June through September). In the case of a newly established customer, LIPA determines if their estimated demand will meet these requirements. These customers are billed for energy and demand charges based on the time of year (summer/winter) and the time of day service is used. Secondary Service is any single or three phase service at a voltage level between 120 and 480V. Service Charge $ 0.7220 / day Service Charge per Meter $ 0.2264 / day / meter Periods On-Peak June 1 – September 30 10AM – 10PM Off-Peak 12AM – 7 PM throughout the year Intermediate All hours not in the Off-Peak or On-Peak periods Demand Charges $ per peak kW On-Peak Demand: $ 19.65 / kW Intermediate Demand: $ 4.68 / kW Energy Charges $ per total kWh On-Peak Energy: $ 0.0485 / kWh Off-Peak Energy: $ 0.0237 / kWh Intermediate Energy: $ 0.0378 / kWh
Filename: LIPA_SC2-MRP_R285_Sec_Jun08.csv

NYSERDA DG/CHP Integrated Database System Utility Rate Details
CDH Energy Corporation 83 September 25, 2008
Long Island Power Authority
Service Classification 12 (Rate Code 680) – Backup and Maintenance with Supplemental Service – Secondary – January 2001 Rate 680 applies to customers whose electrical requirements are not entirely supplied by LIPA. The non-LIPA supply may or may not be connected in parallel with LIPA’s system. Back-up service is limited to a 10% load factor during any rating period. This rate applies to facilities with an anticipated demand in excess of 7kW. Secondary Service is any single or three phase service at a voltage level between 120 and 480V. Service Charge $ 40.11 Contract Demand Charge1 $ 2.46 / contract kW Periods Period 1 12AM – 7 PM throughout the year Period 2 June 1 – September 30 10AM – 10PM Period 3 All hours not in Period 1 or 2 Reactive Demand Charge $ 0.27 / RkVA in excess of 48% peak demand in kW Demand Charges $ per peak kW in any period As-used Peak Demand Charge $ 2.46 / kW Energy Charges $ per total kWh Period 1 Energy: $ 0.0604 / kWh Period 2 Energy: $ 0.3869 / kWh Period 3 Energy: $ 0.0882 / kWh
1 - The Contract Demand Charge is paid monthly for capacity contracted by the customer with a penalty for exceeding.
Filename: LIPA_SC12_R680_Sec_Sup_Jan01.csv

NYSERDA DG/CHP Integrated Database System Utility Rate Details
CDH Energy Corporation 84 September 25, 2008
Long Island Power Authority
Service Classification 12 (Rate Code 680) – Backup and Maintenance with Supplemental Service – Secondary – July 2006 Rate 680 applies to customers whose electrical requirements are not entirely supplied by LIPA. The non-LIPA supply may or may not be connected in parallel with LIPA’s system. Back-up service is limited to a 10% load factor during any rating period. This rate applies to facilities with an anticipated demand in excess of 7kW. Secondary Service is any single or three phase service at a voltage level between 120 and 480V. Service Charge $ 40.11 Contract Demand Charge1 $ 2.46 / contract kW Periods Period 1 12AM – 7 PM throughout the year Period 2 June 1 – September 30 10AM – 10PM Period 3 All hours not in Period 1 or 2 Reactive Demand Charge $ 0.27 / RkVA in excess of 48% peak demand in kW Demand Charges $ per peak kW in any period As-used Peak Demand Charge $ 2.46 / kW Energy Charges $ per total kWh Period 1 Energy: $ 0.0212 / kWh Period 2 Energy: $ 0.3477 / kWh Period 3 Energy: $ 0.0490 / kWh
1 - The Contract Demand Charge is paid monthly for capacity contracted by the customer with a penalty for exceeding.
Filename: LIPA_SC12_R680_Sec_Sup_July06.csv
Long Island Power Authority
Service Classification 12 (Rate Code 680) – Backup and Maintenance with Supplemental Service – Secondary – June 2008 Rate 680 applies to customers whose electrical requirements are not entirely supplied by LIPA. The non-LIPA supply may or may not be connected in parallel with LIPA’s system. Back-up service is limited to a 10% load factor during any rating period. This rate applies to facilities with an anticipated demand in excess of 7kW. Secondary Service is any single or three phase service at a voltage level between 120 and 480V. Service Charge $ 40.11 Contract Demand Charge1 $ 2.46 / contract kW Periods Period 1 12AM – 7 PM throughout the year Period 2 June 1 – September 30 10AM – 10PM Period 3 All hours not in Period 1 or 2 Reactive Demand Charge $ 0.27 / RkVA in excess of 48% peak demand in kW Demand Charges $ per peak kW in any period As-used Peak Demand Charge $ 2.46 / kW Energy Charges $ per total kWh Period 1 Energy: $ 0.0212 / kWh Period 2 Energy: $ 0.3477 / kWh Period 3 Energy: $ 0.0490 / kWh
1 - The Contract Demand Charge is paid monthly for capacity contracted by the customer with a penalty for exceeding.
Filename: LIPA_SC12_R680_Sec_Sup_Jun08.csv

NYSERDA DG/CHP Integrated Database System Utility Rate Details
CDH Energy Corporation 85 September 25, 2008
Complete New York State Electric & Gas Electric Tariff The New York State Electric & Gas rates are up-to-date as of October, 2006. The Cogeneration rate has variable daily energy rates and these run from November, 2005 through October, 2006.
New York State Electric & Gas
Service Classification 2 –General – Fixed Pricing Option – February 2006 General Services - with Demand Billing. (For estimated metered demands of more than 5 kilowatts but less than 500 kilowatts.) Service Charge $ 10.00
Reactive Energy Charge $ 0.000950 / RkVAh in excess of 33% total energy in kWh Demand Charges $ 8.85 per peak kW for all hours
Energy Charges1 $ per total kWh within defined period Block Charges: Energy Charge 0-200 hrs of peak kW 200-350 hrs of peak kW Above 350 hrs of peak kW Charge $0.11590 / kWh $0.11531 / kWh $0.11429 / kWh
Filename: NYSEG_SC2_FIXED_Feb06.CSV
New York State Electric & Gas
Service Classification 2 –General – Fixed Pricing Option – October 2006 General Services - with Demand Billing. (For estimated metered demands of more than 5 kilowatts but less than 500 kilowatts.) Service Charge $ 10.00
Reactive Energy Charge $ 0.000950 / RkVAh in excess of 33% total energy in kWh Demand Charges $ 8.85 per peak kW for all hours
Energy Charges1 $ per total kWh within defined period Block Charges: Energy Charge, Transition Charges, and Fixed Pricing Option Charge 0-200 hrs of peak kW 200-350 hrs of peak kW Above 350 hrs of peak kW Charge $0.13362 / kWh $0.13303 / kWh $0.13201 / kWh
Filename: NYSEG_SC2_FIXED_Oct06.CSV

NYSERDA DG/CHP Integrated Database System Utility Rate Details
CDH Energy Corporation 86 September 25, 2008
New York State Electric & Gas
Service Classification 2 –General – Fixed Pricing Option – November 2005 to October 2006 General Services - with Demand Billing. (For estimated metered demands of more than 5 kilowatts but less than 500 kilowatts.) Service Charge $ 10.00
Reactive Energy Charge $ 0.000950 / RkVAh in excess of 33% total energy in kWh Demand Charges $ 8.85 per peak kW for all hours
Energy Charges1 $ per total kWh within defined period Block Charges: Energy Charge and Fixed Pricing Option Charge 0-200 hrs of peak kW 200-350 hrs of peak kW Above 350 hrs of peak kW Charge $0.11205 / kWh $0.11146 / kWh $0.11044 / kWh Transition Charges $ / kWh Jan Feb Mar Apr May Jun Jul Aug Sep Oct Nov Dec
$(0.00945) $ 0.01198 $(0.00251) $0.01975 $0.01754 $0.02024 $0.01101 $0.01994 $0.01152 $0.02157 $(0.00949) $(0.00491)
Filename: NYSEG_SC2_FIXED_Nov05-Oct06.CSV
New York State Electric & Gas
Service Classification 2 –General – Fixed Pricing Option – July 2007 to June 2008 General Services - with Demand Billing. (For estimated metered demands of more than 5 kilowatts but less than 500 kilowatts.) Service Charge $ 5.66
Reactive Energy Charge $ 0.000950 / RkVAh in excess of 33% total energy in kWh Demand Charges $ 8.00 per peak kW for all hours
Energy Charges1 $ per total kWh within defined period Block Charges: Energy Charge and Fixed Pricing Option Charge 0-200 hrs of peak kW 200-350 hrs of peak kW Above 350 hrs of peak kW Charge $0.00566 / kWh $0.00566 / kWh $0.00566 / kWh Transition Charges $ / kWh Jan Feb Mar Apr May Jun Jul Aug Sep Oct Nov Dec
$ 0.00434 $ 0.00434 $ 0.00434 $ 0.00434 $ 0.00434 $ 0.00434 $ 0.00434 $ 0.00434 $ 0.00434 $ 0.00434 $ 0.00434 $ 0.00434
Filename: NYSEG_SC2_FIXED_Jul07-Jun08.CSV

NYSERDA DG/CHP Integrated Database System Utility Rate Details
CDH Energy Corporation 87 September 25, 2008
New York State Electric & Gas
Service Classification 7-1 – Large General TOU – Fixed Price – Secondary – February 2006 Large General Service with Time-of-Use Metering for any customer with a billing demand equal to or greater than 500 KW during any two of the previous twelve months and for continuing service thereafter. Secondary Service at 120, 120/208, 120/240, 208, 240, 240/416, 277/480, or 480 Volts. Service Charge $ 16.00 Periods On-Peak 7 AM – 10 PM, Monday-Friday Off-Peak All hours not included in On-Peak Reactive Demand Charge $ 0.000950 / RkVAh in excess of 33% total energy in kWh Demand Charges $ 9.15 per peak kW Energy Charges Delivery, Transition and Commodity Charges On-Peak Energy: $ 0.12429 / kWh Off-Peak Energy: $ 0.09963 / kWh
Filename: NYSEG_SC7-1_Sec_Feb06.CSV
New York State Electric & Gas
Service Classification 7-1 – Large General TOU – Fixed Price – Secondary – October 2006 Large General Service with Time-of-Use Metering for any customer with a billing demand equal to or greater than 500 KW during any two of the previous twelve months and for continuing service thereafter. Secondary Service at 120, 120/208, 120/240, 208, 240, 240/416, 277/480, or 480 Volts. Service Charge $ 16.00 Periods On-Peak 7 AM – 10 PM, Monday-Friday Off-Peak All hours not included in On-Peak Reactive Demand Charge $ 0.000950 / RkVAh in excess of 33% total energy in kWh Demand Charges $ 9.15 per peak kW Energy Charges Energy Charge, Transition Charges, and Fixed Pricing Option Charge On-Peak Energy: $ 0.14201 / kWh Off-Peak Energy: $ 0.11735 / kWh
Filename: NYSEG_SC7-1_Sec_Oct06.CSV

NYSERDA DG/CHP Integrated Database System Utility Rate Details
CDH Energy Corporation 88 September 25, 2008
New York State Electric & Gas
Service Classification 7-1 – Large General TOU – Fixed Price – Secondary – November 2005 to October 2006 Large General Service with Time-of-Use Metering for any customer with a billing demand equal to or greater than 500 KW during any two of the previous twelve months and for continuing service thereafter. Secondary Service at 120, 120/208, 120/240, 208, 240, 240/416, 277/480, or 480 Volts. Service Charge $ 16.00 Periods On-Peak 7 AM – 10 PM, Monday-Friday Off-Peak All hours not included in On-Peak Reactive Demand Charge $ 0.000950 / RkVAh in excess of 33% total energy in kWh Demand Charges $ 9.15 per peak kW Energy Charges Energy Charge and Fixed Pricing Option Charge On-Peak Energy: $ 0.12044 / kWh Off-Peak Energy: $ 0.09578 / kWh Transition Charges $ / kWh Jan Feb Mar Apr May Jun Jul Aug Sep Oct Nov Dec
$(0.00945) $ 0.01198 $(0.00251) $0.01975 $0.01754 $0.02024 $0.01101 $0.01994 $0.01152 $0.02157 $(0.00949) $(0.00491)
Filename: NYSEG_SC7-1_Sec_Nov05-Oct06.CSV
New York State Electric & Gas
Service Classification 7-1 – Large General TOU – Fixed Price – Secondary – July 2007 to June 2008 Large General Service with Time-of-Use Metering for any customer with a billing demand equal to or greater than 500 KW during any two of the previous twelve months and for continuing service thereafter. Secondary Service at 120, 120/208, 120/240, 208, 240, 240/416, 277/480, or 480 Volts. Service Charge $ 18.75 Periods On-Peak 7 AM – 10 PM, Monday-Friday Off-Peak All hours not included in On-Peak Reactive Demand Charge $ 0.000950 / RkVAh in excess of 33% total energy in kWh Demand Charges $ 8.60 per peak kW Energy Charges Energy Charge and Fixed Pricing Option Charge On-Peak Energy: $ 0.09664 / kWh Off-Peak Energy: $ 0.08507 / kWh Transition Charges $ / kWh Jan Feb Mar Apr May Jun Jul Aug Sep Oct Nov Dec
$0.00434 $0.00434 $0.00434 $0.00434 $0.00434 $0.00434 $0.00434 $0.00434 $0.00434 $0.00434 $0.00434 $0.00434

NYSERDA DG/CHP Integrated Database System Utility Rate Details
CDH Energy Corporation 89 September 25, 2008
Filename: NYSEG_SC7-1_Sec_Jul07-Jun08.CSV
New York State Electric & Gas
Service Classification 7-2 – Large General TOU – Fixed Price – Primary – February 2006 Large General Service with Time-of-Use Metering for any customer with a billing demand equal to or greater than 500 KW during any two of the previous twelve months and for continuing service thereafter. Primary (Distribution) Service at 2,400, 4,160, 4,800, 7,200, 8,320, 12,000, 12,470, 13,200, or 34,500 (Regulated) Volts. Service Charge $ 75.00 Periods On-Peak 7 AM – 10 PM, Monday-Friday Off-Peak All hours not included in On-Peak Reactive Demand Charge $ 0.000950 / RkVAh in excess of 33% total energy in kWh Demand Charges $ 7.67 per peak kW Energy Charges Delivery, Transition and Commodity Charges On-Peak Energy: $ 0.12428 / kWh Off-Peak Energy: $ 0.09306 / kWh
Filename: NYSEG_SC7-2_Pri_Feb06.CSV
New York State Electric & Gas
Service Classification 7-2 – Large General TOU – Fixed Price – Primary – October 2006 Large General Service with Time-of-Use Metering for any customer with a billing demand equal to or greater than 500 KW during any two of the previous twelve months and for continuing service thereafter. Primary (Distribution) Service at 2,400, 4,160, 4,800, 7,200, 8,320, 12,000, 12,470, 13,200, or 34,500 (Regulated) Volts. Service Charge $ 75.00 Periods On-Peak 7 AM – 10 PM, Monday-Friday Off-Peak All hours not included in On-Peak Reactive Demand Charge $ 0.000950 / RkVAh in excess of 33% total energy in kWh Demand Charges $ 7.67 per peak kW Energy Charges Energy Charge, Transition Charges, and Fixed Pricing Option Charge On-Peak Energy: $ 0.14200 / kWh Off-Peak Energy: $ 0.11078 / kWh
Filename: NYSEG_SC7-2_Pri_Oct06.CSV

NYSERDA DG/CHP Integrated Database System Utility Rate Details
CDH Energy Corporation 90 September 25, 2008
New York State Electric & Gas
Service Classification 7-2 – Large General TOU – Fixed Price – Primary – November 2005 to October 2006 Large General Service with Time-of-Use Metering for any customer with a billing demand equal to or greater than 500 KW during any two of the previous twelve months and for continuing service thereafter. Primary (Distribution) Service at 2,400, 4,160, 4,800, 7,200, 8,320, 12,000, 12,470, 13,200, or 34,500 (Regulated) Volts. Service Charge $ 75.00 Periods On-Peak 7 AM – 10 PM, Monday-Friday Off-Peak All hours not included in On-Peak Reactive Demand Charge $ 0.000950 / RkVAh in excess of 33% total energy in kWh Demand Charges $ 7.67 per peak kW Energy Charges Energy Charge and Fixed Pricing Option Charge On-Peak Energy: $ 0.12043 / kWh Off-Peak Energy: $ 0.08921 / kWh Transition Charges $ / kWh Jan Feb Mar Apr May Jun Jul Aug Sep Oct Nov Dec
$(0.00945) $ 0.01198 $(0.00251) $0.01975 $0.01754 $0.02024 $0.01101 $0.01994 $0.01152 $0.02157 $(0.00949) $(0.00491)
Filename: NYSEG_SC7-2_Pri_Nov05-Oct06.CSV
New York State Electric & Gas
Service Classification 7-2 – Large General TOU – Fixed Price – Primary – July 2007 to June 2008 Large General Service with Time-of-Use Metering for any customer with a billing demand equal to or greater than 500 KW during any two of the previous twelve months and for continuing service thereafter. Primary (Distribution) Service at 2,400, 4,160, 4,800, 7,200, 8,320, 12,000, 12,470, 13,200, or 34,500 (Regulated) Volts. Service Charge $ 185.88 Periods On-Peak 7 AM – 10 PM, Monday-Friday Off-Peak All hours not included in On-Peak Reactive Demand Charge $ 0.000950 / RkVAh in excess of 33% total energy in kWh Demand Charges $ 7.50 per peak kW Energy Charges Energy Charge and Fixed Pricing Option Charge On-Peak Energy: $ 0.082740 / kWh Off-Peak Energy: $ 0.09892 / kWh Transition Charges $ / kWh Jan Feb Mar Apr May Jun Jul Aug Sep Oct Nov Dec
$0.00434 $0.00434 $0.00434 $0.00434 $0.00434 $0.00434 $0.00434 $0.00434 $0.00434 $0.00434 $0.00434 $0.00434 Filename: NYSEG_SC7-2_Pri_Jul07-Jun08.CSV

NYSERDA DG/CHP Integrated Database System Utility Rate Details
CDH Energy Corporation 91 September 25, 2008
New York State Electric & Gas
Service Classification 7-2 – Large General TOU – Fixed Price – Primary – Economic Development Zone Large General Service with Time-of-Use Metering for any customer with a billing demand equal to or greater than 500 KW during any two of the previous twelve months and for continuing service thereafter. Primary (Distribution) Service at 2,400, 4,160, 4,800, 7,200, 8,320, 12,000, 12,470, 13,200, or 34,500 (Regulated) Volts. Economic Development Zone incentive approved. Service Charges Bill Issuance $ 0.89 EDZI Basic Service Charge $ 17.97 EDZI Meter Charge $ 5.80 EDZI Meter Service Charge $ 8.83 EDZI Meter Data Service Charge $ 8.60 Periods On-Peak 7 AM – 10 PM, Monday-Friday Off-Peak All hours not included in On-Peak Reactive Demand Charge $ 0.000950 / RkVAh in excess of 33% total energy in kWh Demand Charges $ 4.30 per peak kW Energy Charges Fixed Pricing Option Charge and Transition Charge On-Peak Energy: $ 0.10054 / kWh Off-Peak Energy: $ 0.08389 / kWh EDZ Incentive $ -0.0061 / kWh for All Hours System Benefits and Renewable Portfolio Surcharge $ 0.002 / kWh for All Hours Merchant Function Charge $ 0.0008 / kWh for All Hours EDZI Delivery Charge $ 0.00212 / kWh for All Hours Taxes and Surcharges Delivery/Supply Tax, County Sales and City Sales Total Taxes 5.0101 %
Filename: NYSEG_SC7-2_Pri_Fixed_EDZI.CSV

NYSERDA DG/CHP Integrated Database System Utility Rate Details
CDH Energy Corporation 92 September 25, 2008
New York State Electric & Gas
Service Classification 7-2 – Large General TOU – Variable Pricing Option – Primary – Economic Development Zone Large General Service with Time-of-Use Metering for any customer with a billing demand equal to or greater than 500 KW during any two of the previous twelve months and for continuing service thereafter. Primary (Distribution) Service at 2,400, 4,160, 4,800, 7,200, 8,320, 12,000, 12,470, 13,200, or 34,500 (Regulated) Volts. Economic Development Zone incentive approved. Service Charges Bill Issuance $ 0.89 EDZI Basic Service Charge $ 17.97 EDZI Meter Charge $ 5.80 EDZI Meter Service Charge $ 8.83 EDZI Meter Data Service Charge $ 8.60 Periods On-Peak 7 AM – 10 PM, Monday-Friday Off-Peak All hours not included in On-Peak Reactive Demand Charge $ 0.000950 / RkVAh in excess of 33% total energy in kWh Demand Charges $ 4.30 per peak kW Energy Charges Transition Charge $ 0.00298 / kWh EDZ Incentive $ -0.0061 / kWh for All Hours System Benefits and Renewable Portfolio Surcharge $ 0.002 / kWh for All Hours EDZI Delivery Charge $ 0.00212 / kWh for All Hours Merchant Function Charge $ 0.0008 / kWh for All Hours Hourly Electric Charges1 See Figure 1 Taxes and Surcharges Delivery/Supply Tax, County Sales and City Sales Total Taxes 5.0101 %
1 – Variable Energy Charges are the hourly Location Based Marginal Price (LBMP) from October 2006 through September 2007 as available at the NYISO website.
Filename: NYSEG_SC7-2_Pri_VPO_EDZI.CSV, Mohawk_Valley_LBMP.dat

NYSERDA DG/CHP Integrated Database System Utility Rate Details
CDH Energy Corporation 93 September 25, 2008
Hourly LBMP of Electricity for Mohawk Valley
Jan Feb Mar Apr May Jun Jul Aug Sep Oct Nov Dec-0.5
0.0
0.5
1.0
1.5LB
MP
Cos
t of E
lect
ricity
($/k
Wh)
Figure 1. Hourly LBMP Charges for Mohawk Valley Region
New York State Electric & Gas
Service Classification 7-3 – Large General TOU – Fixed Price – SubTransmission – February 2006 Large General Service with Time-of-Use Metering for any customer with a billing demand equal to or greater than 500 KW during any two of the previous twelve months and for continuing service thereafter. Subtransmission Service at 34,500 or 46,000 (Both Non-Regulated) Volts; and 34,500 (Regulated) Volts. Service Charge $ 300.00 Periods On-Peak 7 AM – 10 PM, Monday-Friday Off-Peak All hours not included in On-Peak Reactive Demand Charge $ 0.000950 / RkVAh in excess of 33% total energy in kWh Demand Charges $ 4.08 per peak kW Energy Charges Delivery, Transition and Commodity Charges On-Peak Energy: $ 0.12352 / kWh Off-Peak Energy: $ 0.08516 / kWh
Filename: NYSEG_SC7-3_Subtra_Feb06.CSV

NYSERDA DG/CHP Integrated Database System Utility Rate Details
CDH Energy Corporation 94 September 25, 2008
New York State Electric & Gas
Service Classification 7-3 – Large General TOU – Fixed Price – SubTransmission – October 2006 Large General Service with Time-of-Use Metering for any customer with a billing demand equal to or greater than 500 KW during any two of the previous twelve months and for continuing service thereafter. Subtransmission Service at 34,500 or 46,000 (Both Non-Regulated) Volts; and 34,500 (Regulated) Volts. Service Charge $ 300.00 Periods On-Peak 7 AM – 10 PM, Monday-Friday Off-Peak All hours not included in On-Peak Reactive Demand Charge $ 0.000950 / RkVAh in excess of 33% total energy in kWh Demand Charges $ 4.08 per peak kW Energy Charges Energy Charge, Transition Charges, and Fixed Pricing Option Charge On-Peak Energy: $ 0.14124 / kWh Off-Peak Energy: $ 0.10288 / kWh
Filename: NYSEG_SC7-3_Subtra_Oct06.CSV
New York State Electric & Gas
Service Classification 7-3 – Large General TOU – Fixed Price – SubTransmission – November 2005 to October 2006. Large General Service with Time-of-Use Metering for any customer with a billing demand equal to or greater than 500 KW during any two of the previous twelve months and for continuing service thereafter. Subtransmission Service at 34,500 or 46,000 (Both Non-Regulated) Volts; and 34,500 (Regulated) Volts. Service Charge $ 300.00 Periods On-Peak 7 AM – 10 PM, Monday-Friday Off-Peak All hours not included in On-Peak Reactive Demand Charge $ 0.000950 / RkVAh in excess of 33% total energy in kWh Demand Charges $ 4.08 per peak kW Energy Charges Energy Charge and Fixed Pricing Option Charge On-Peak Energy: $ 0.11967 / kWh Off-Peak Energy: $ 0.08131 / kWh Transition Charges $ / kWh Jan Feb Mar Apr May Jun Jul Aug Sep Oct Nov Dec
$(0.00945) $ 0.01198 $(0.00251) $0.01975 $0.01754 $0.02024 $0.01101 $0.01994 $0.01152 $0.02157 $(0.00949) $(0.00491)
Filename: NYSEG_SC7-3_Subtra_Nov05-Oct06.CSV

NYSERDA DG/CHP Integrated Database System Utility Rate Details
CDH Energy Corporation 95 September 25, 2008
New York State Electric & Gas
Service Classification 7-3 – Large General TOU – Fixed Price – SubTransmission – July 2007 to June 2008 Large General Service with Time-of-Use Metering for any customer with a billing demand equal to or greater than 500 KW during any two of the previous twelve months and for continuing service thereafter. Subtransmission Service at 34,500 or 46,000 (Both Non-Regulated) Volts; and 34,500 (Regulated) Volts. Service Charge $ 292.41 Periods On-Peak 7 AM – 10 PM, Monday-Friday Off-Peak All hours not included in On-Peak Reactive Demand Charge $ 0.000950 / RkVAh in excess of 33% total energy in kWh Demand Charges $ 4.06 per peak kW Energy Charges Energy Charge and Fixed Pricing Option Charge On-Peak Energy: $ 0.98460 / kWh Off-Peak Energy: $ 0.07535 / kWh Transition Charges $ / kWh Jan Feb Mar Apr May Jun Jul Aug Sep Oct Nov Dec
$0.0434 $0.0434 $0.0434 $0.0434 $0.0434 $0.0434 $0.0434 $0.0434 $0.0434 $0.0434 $0.0434 $0.0434 Filename: NYSEG_SC7-3_Subtra_Jul07-Jun08.CSV
New York State Electric & Gas
Service Classification 7-4 – Large General TOU – Fixed Price – Transmission – February 2006 Large General Service with Time-of-Use Metering for any customer with a billing demand equal to or greater than 500 KW during any two of the previous twelve months and for continuing service thereafter. Transmission Service at 115,000 Volts and above (Non-Regulated). Service Charge $ 850.00 Periods On-Peak 7 AM – 10 PM, Monday-Friday Off-Peak All hours not included in On-Peak Reactive Demand Charge $ 0.000950 / RkVAh in excess of 33% total energy in kWh Demand Charges $ 1.73 per peak kW Energy Charges Delivery, Transition and Commodity Charges On-Peak Energy: $ 0.12324 / kWh Off-Peak Energy: $ 0.08330 / kWh
Filename: NYSEG_SC7-4_Tra_Feb06.CSV

NYSERDA DG/CHP Integrated Database System Utility Rate Details
CDH Energy Corporation 96 September 25, 2008
New York State Electric & Gas
Service Classification 7-4 – Large General TOU – Fixed Price – Transmission – October 2006 Large General Service with Time-of-Use Metering for any customer with a billing demand equal to or greater than 500 KW during any two of the previous twelve months and for continuing service thereafter. Transmission Service at 115,000 Volts and above (Non-Regulated). Service Charge $ 850.00 Periods On-Peak 7 AM – 10 PM, Monday-Friday Off-Peak All hours not included in On-Peak Reactive Demand Charge $ 0.000950 / RkVAh in excess of 33% total energy in kWh Demand Charges $ 1.73 per peak kW Energy Charges Energy Charge, Transition Charges, and Fixed Pricing Option Charge On-Peak Energy: $ 0.14096 / kWh Off-Peak Energy: $ 0.10102 / kWh
Filename: NYSEG_SC7-4_Tra_Oct06.CSV
New York State Electric & Gas
Service Classification 7-4 – Large General TOU – Fixed Price – Transmission – November 2005 to October 2006 Large General Service with Time-of-Use Metering for any customer with a billing demand equal to or greater than 500 KW during any two of the previous twelve months and for continuing service thereafter. Transmission Service at 115,000 Volts and above (Non-Regulated). Service Charge $ 850.00 Periods On-Peak 7 AM – 10 PM, Monday-Friday Off-Peak All hours not included in On-Peak Reactive Demand Charge $ 0.000950 / RkVAh in excess of 33% total energy in kWh Demand Charges $ 1.73 per peak kW Energy Charges Energy Charge and Fixed Pricing Option Charge On-Peak Energy: $ 0.11939 / kWh Off-Peak Energy: $ 0.07945 / kWh Transition Charges $ / kWh Jan Feb Mar Apr May Jun Jul Aug Sep Oct Nov Dec
$(0.00945) $ 0.01198 $(0.00251) $0.01975 $0.01754 $0.02024 $0.01101 $0.01994 $0.01152 $0.02157 $(0.00949) $(0.00491)
Filename: NYSEG_SC7-4_Tra_Nov05-Oct06.CSV

NYSERDA DG/CHP Integrated Database System Utility Rate Details
CDH Energy Corporation 97 September 25, 2008
New York State Electric & Gas
Service Classification 7-4 – Large General TOU – Fixed Price – Transmission – July 2007 to June 2008 Large General Service with Time-of-Use Metering for any customer with a billing demand equal to or greater than 500 KW during any two of the previous twelve months and for continuing service thereafter. Transmission Service at 115,000 Volts and above (Non-Regulated). Service Charge $ 792.77 Periods On-Peak 7 AM – 10 PM, Monday-Friday Off-Peak All hours not included in On-Peak Reactive Demand Charge $ 0.000950 / RkVAh in excess of 33% total energy in kWh Demand Charges $ 1.73 per peak kW Energy Charges Energy Charge and Fixed Pricing Option Charge On-Peak Energy: $ 0.09733 / kWh Off-Peak Energy: $ 0.07452 / kWh Transition Charges $ / kWh Jan Feb Mar Apr May Jun Jul Aug Sep Oct Nov Dec
$0.0434 $0.0434 $0.0434 $0.0434 $0.0434 $0.0434 $0.0434 $0.0434 $0.0434 $0.0434 $0.0434 $0.0434 Filename: NYSEG_SC7-4_Tra_Jul07-Jun08.CSV
New York State Electric & Gas
Service Classification 10 – Cogeneration – Secondary (Contract Demand less than 500 kW) – Capital Region – February 2005 to January 2006 All customers with qualifying (or non-qualifying, as applicable) cogeneration or small power production facilities, with or without the requirement for supplemental service, back-up service, or maintenance service who choose to sell all or any excess energy to the Corporation whether or not engaging in simultaneous purchase, under the appropriate Service Classification, from the Corporation. This rate applies to facilities with less than 500 kW of demand and located in the Capital NYISO Region. Secondary Service at 120, 120/208, 120/240, 208, 240, 240/416, 277/480, or 480 Volts. Service Charge $ 34.96 Contract Demand Charge2 $ 1.91 per kW of contract demand Energy Charges1 $ per total kWh Hourly Electric Charges See Figure 2
1 – Variable Energy Charges are the hourly Location Based Marginal Price (LBMP) from February 2005 – January 2006 as available at the NYISO website.
2 - The Contract Demand is the Maximum demand import from the utility expected for the customer. Filenames: NYSEG_SC10_Sec_wDem_Capital_Feb05-Jan06.CSV, nyseg_capital_region_Feb05-
Jan06.dat

NYSERDA DG/CHP Integrated Database System Utility Rate Details
CDH Energy Corporation 98 September 25, 2008
NYISO LBMP for Capital Region
Jan Feb Mar Apr May Jun Jul Aug Sep Oct Nov Dec0.00
0.05
0.10
0.15
0.20
Hou
rly E
lect
ric R
ates
($/k
Wh)
Figure 2. Hourly Location Based Marginal Pricing for the Capital Region from Feb 05 - Jan 06
New York State Electric & Gas
Service Classification 10 – Cogeneration – Secondary (Contract Demand less than 500 kW) – Capital Region – October 2005 to September 2006 All customers with qualifying (or non-qualifying, as applicable) cogeneration or small power production facilities, with or without the requirement for supplemental service, back-up service, or maintenance service who choose to sell all or any excess energy to the Corporation whether or not engaging in simultaneous purchase, under the appropriate Service Classification, from the Corporation. This rate applies to facilities with less than 500 kW of demand and located in the Capital NYISO Region. Secondary Service at 120, 120/208, 120/240, 208, 240, 240/416, 277/480, or 480 Volts. Service Charge $ 34.96 Contract Demand Charge2 $ 1.91 per kW of contract demand Energy Charges1 $ per total kWh Hourly Electric Charges See Figure 3
1 – Variable Energy Charges are the hourly Location Based Marginal Price (LBMP) from February 2005 – January 2006 as available at the NYISO website.
2 - The Contract Demand is the Maximum demand import from the utility expected for the customer. Filenames: NYSEG_SC10_Sec_wDem_Capital_Oct05-Sept06.CSV, nyseg_capital_region_Oct05-
Sept06.dat

NYSERDA DG/CHP Integrated Database System Utility Rate Details
CDH Energy Corporation 99 September 25, 2008
NYISO LBMP for Capital Region from Oct05-Sept06
Jan Feb Mar Apr May Jun Jul Aug Sep Oct Nov Dec0.00
0.05
0.10
0.15
0.20
0.25
Hou
rly E
lect
ric R
ates
($/k
Wh)
Figure 3. Hourly Location Based Marginal Pricing for the Capital Region from Oct 05 – Sept 06
New York State Electric & Gas
Service Classification 10 – Cogeneration – Secondary (Contract Demand less than 500 kW) – Capital Region – June 2007 to May 2008 All customers with qualifying (or non-qualifying, as applicable) cogeneration or small power production facilities, with or without the requirement for supplemental service, back-up service, or maintenance service who choose to sell all or any excess energy to the Corporation whether or not engaging in simultaneous purchase, under the appropriate Service Classification, from the Corporation. This rate applies to facilities with less than 500 kW of demand and located in the Capital NYISO Region. Secondary Service at 120, 120/208, 120/240, 208, 240, 240/416, 277/480, or 480 Volts. Service Charge $ 34.96 Contract Demand Charge2 $ 1.91 per kW of contract demand Energy Charges1 $ per total kWh Hourly Electric Charges See Figure 4
1 – Variable Energy Charges are the hourly Location Based Marginal Price (LBMP) from June 2007 to May 2008 as available at the NYISO website.
2 - The Contract Demand is the Maximum demand import from the utility expected for the customer. Filenames: NYSEG_SC10_Sec_wDem_Capital_Jun07-May08.CSV, nyseg_capital_region_Jun07-
May08.dat

NYSERDA DG/CHP Integrated Database System Utility Rate Details
CDH Energy Corporation 100 September 25, 2008
Figure 4. Hourly Location Based Marginal Pricing for the Capital Region from Jun 07 – May 08
New York State Electric & Gas
Service Classification 10 – Cogeneration – Secondary (Contract Demand larger than 500 kW) – Capital Region – February 2005 to January 2006 All customers with qualifying (or non-qualifying, as applicable) cogeneration or small power production facilities, with or without the requirement for supplemental service, back-up service, or maintenance service who choose to sell all or any excess energy to the Corporation whether or not engaging in simultaneous purchase, under the appropriate Service Classification, from the Corporation. This rate applies to facilities with a contract demand greater than 500 kW and located in the Capital NYISO Region. Secondary Service at 120, 120/208, 120/240, 208, 240, 240/416, 277/480, or 480 Volts. Service Charge $ 38.97 Contract Demand Charge2 $ 1.91 per kW of contract demand Energy Charges1 $ per total kWh Hourly Electric Charges See Figure 2
1 – Variable Energy Charges are the hourly Location Based Marginal Price (LBMP) from February 2005 – January 2006 as available at the NYISO website.
2 - The Contract Demand is the Maximum demand import from the utility expected for the customer. Filenames: NYSEG_SC10_Sec_wDem_gt500_Capital_Feb05-Jan06.CSV, nyseg_capital_region_Feb05-Jan06.dat

NYSERDA DG/CHP Integrated Database System Utility Rate Details
CDH Energy Corporation 101 September 25, 2008
New York State Electric & Gas
Service Classification 10 – Cogeneration – Secondary (Contract Demand larger than 500 kW) – Capital Region – October 2005 to September 2006 All customers with qualifying (or non-qualifying, as applicable) cogeneration or small power production facilities, with or without the requirement for supplemental service, back-up service, or maintenance service who choose to sell all or any excess energy to the Corporation whether or not engaging in simultaneous purchase, under the appropriate Service Classification, from the Corporation. This rate applies to facilities with a contract demand greater than 500 kW and located in the Capital NYISO Region. Secondary Service at 120, 120/208, 120/240, 208, 240, 240/416, 277/480, or 480 Volts. Service Charge $ 38.97 Contract Demand Charge2 $ 1.91 per kW of contract demand Energy Charges1 $ per total kWh Hourly Electric Charges See Figure 3
1 – Variable Energy Charges are the hourly Location Based Marginal Price (LBMP) from February 2005 – January 2006 as available at the NYISO website.
2 - The Contract Demand is the Maximum demand import from the utility expected for the customer. Filenames: NYSEG_SC10_Sec_wDem_gt500_Capital_Oct05-Sept06.CSV, nyseg_capital_region_Oct05-Sept06.dat
New York State Electric & Gas
Service Classification 10 – Cogeneration – Secondary (Contract Demand larger than 500 kW) – Capital Region – June 2007 to May 2008 All customers with qualifying (or non-qualifying, as applicable) cogeneration or small power production facilities, with or without the requirement for supplemental service, back-up service, or maintenance service who choose to sell all or any excess energy to the Corporation whether or not engaging in simultaneous purchase, under the appropriate Service Classification, from the Corporation. This rate applies to facilities with a contract demand greater than 500 kW and located in the Capital NYISO Region. Secondary Service at 120, 120/208, 120/240, 208, 240, 240/416, 277/480, or 480 Volts. Service Charge $ 38.97 Contract Demand Charge2 $ 1.91 per kW of contract demand Energy Charges1 $ per total kWh Hourly Electric Charges See Figure 4
1 – Variable Energy Charges are the hourly Location Based Marginal Price (LBMP) from June 2007 to May 2008 as available at the NYISO website.
2 - The Contract Demand is the Maximum demand import from the utility expected for the customer. Filenames: NYSEG_SC10_Sec_wDem_gt500_Capital_Jun07-May08.CSV, nyseg_capital_region_Jun07-May08.dat

NYSERDA DG/CHP Integrated Database System Utility Rate Details
CDH Energy Corporation 102 September 25, 2008
New York State Electric & Gas
Service Classification 10 – Cogeneration – Primary – Capital Region – February 2005 to January 2006 All customers with qualifying (or non-qualifying, as applicable) cogeneration or small power production facilities, with or without the requirement for supplemental service, back-up service, or maintenance service who choose to sell all or any excess energy to the Corporation whether or not engaging in simultaneous purchase, under the appropriate Service Classification, from the Corporation. This rate applies to facilities with a contract demand greater than 500 kW and located in the Capital NYISO Region. Primary (Distribution) Service at 2,400, 4,160, 4,800, 7,200, 8,320, 12,000, 12,470, 13,200, or 34,500 (Regulated) Volts. Service Charge $ 50.18 Contract Demand Charge2 $ 1.51 per kW of contract demand Energy Charges1 $ per total kWh Hourly Electric Charges See Figure 2
1 – Variable Energy Charges are the hourly Location Based Marginal Price (LBMP) from February 2005 – January 2006 as available at the NYISO website.
2 - The Contract Demand is the Maximum demand import from the utility expected for the customer. Filenames: NYSEG_SC10_Sec_wDem_gt500_Capital_Feb05-Jan06.CSV, nyseg_capital_region_Feb05-Jan06.dat
New York State Electric & Gas
Service Classification 10 – Cogeneration – Primary – Capital Region – October 2005 to September 2006 All customers with qualifying (or non-qualifying, as applicable) cogeneration or small power production facilities, with or without the requirement for supplemental service, back-up service, or maintenance service who choose to sell all or any excess energy to the Corporation whether or not engaging in simultaneous purchase, under the appropriate Service Classification, from the Corporation. This rate applies to facilities with a contract demand greater than 500 kW and located in the Capital NYISO Region. Primary (Distribution) Service at 2,400, 4,160, 4,800, 7,200, 8,320, 12,000, 12,470, 13,200, or 34,500 (Regulated) Volts. Service Charge $ 50.18 Contract Demand Charge2 $ 1.51 per kW of contract demand Energy Charges1 $ per total kWh Hourly Electric Charges See Figure 3
1 – Variable Energy Charges are the hourly Location Based Marginal Price (LBMP) from February 2005 – January 2006 as available at the NYISO website.
2 - The Contract Demand is the Maximum demand import from the utility expected for the customer. Filenames: NYSEG_SC10_Sec_wDem_gt500_Capital_Oct05-Sept06.CSV, nyseg_capital_region_Oct05-Sept06.dat

NYSERDA DG/CHP Integrated Database System Utility Rate Details
CDH Energy Corporation 103 September 25, 2008
New York State Electric & Gas
Service Classification 10 – Cogeneration – Primary – Capital Region – June 2007 to May 2008 All customers with qualifying (or non-qualifying, as applicable) cogeneration or small power production facilities, with or without the requirement for supplemental service, back-up service, or maintenance service who choose to sell all or any excess energy to the Corporation whether or not engaging in simultaneous purchase, under the appropriate Service Classification, from the Corporation. This rate applies to facilities with a contract demand greater than 500 kW and located in the Capital NYISO Region. Primary (Distribution) Service at 2,400, 4,160, 4,800, 7,200, 8,320, 12,000, 12,470, 13,200, or 34,500 (Regulated) Volts. Service Charge $ 50.18 Contract Demand Charge2 $ 1.51 per kW of contract demand Energy Charges1 $ per total kWh Hourly Electric Charges See Figure 4
1 – Variable Energy Charges are the hourly Location Based Marginal Price (LBMP) from June 2007 – May 2008 as available at the NYISO website.
2 - The Contract Demand is the Maximum demand import from the utility expected for the customer. Filenames: NYSEG_SC10_Sec_wDem_gt500_Capital_Jun07-May08.CSV, nyseg_capital_region_Jun07-May08.dat
New York State Electric & Gas
Service Classification 10 – Cogeneration – Secondary (Contract Demand less than 500 kW) – Central Region – February 2005 to January 2006 All customers with qualifying (or non-qualifying, as applicable) cogeneration or small power production facilities, with or without the requirement for supplemental service, back-up service, or maintenance service who choose to sell all or any excess energy to the Corporation whether or not engaging in simultaneous purchase, under the appropriate Service Classification, from the Corporation. This rate applies to facilities with less than 500 kW of demand and located in the Central NYISO Region. Secondary Service at 120, 120/208, 120/240, 208, 240, 240/416, 277/480, or 480 Volts. Service Charge $ 34.96 Contract Demand Charge2 $ 1.91 per kW of contract demand Energy Charges1 $ per total kWh Hourly Electric Charges See Figure 5
1 – Variable Energy Charges are the hourly Location Based Marginal Price (LBMP) from February 2005 – January 2006 as available at the NYISO website.
2 - The Contract Demand is the Maximum demand import from the utility expected for the customer. Filenames: NYSEG_SC10_Sec_wDem_Central_Feb05-Jan06.CSV, nyseg_central_region_Feb05-
Jan06.dat

NYSERDA DG/CHP Integrated Database System Utility Rate Details
CDH Energy Corporation 104 September 25, 2008
Figure 5 Hourly Location Based Marginal Pricing for the Central Region from Feb 05 - Jan 06

NYSERDA DG/CHP Integrated Database System Utility Rate Details
CDH Energy Corporation 105 September 25, 2008
New York State Electric & Gas
Service Classification 10 – Cogeneration – Secondary (Contract Demand less than 500 kW) – Central Region – October 2005 to September 2006 All customers with qualifying (or non-qualifying, as applicable) cogeneration or small power production facilities, with or without the requirement for supplemental service, back-up service, or maintenance service who choose to sell all or any excess energy to the Corporation whether or not engaging in simultaneous purchase, under the appropriate Service Classification, from the Corporation. This rate applies to facilities with less than 500 kW of demand and located in the Central NYISO Region. Secondary Service at 120, 120/208, 120/240, 208, 240, 240/416, 277/480, or 480 Volts. Service Charge $ 34.96 Contract Demand Charge2 $ 1.91 per kW of contract demand Energy Charges1 $ per total kWh Hourly Electric Charges See Figure 6
1 – Variable Energy Charges are the hourly Location Based Marginal Price (LBMP) from February 2005 – January 2006 as available at the NYISO website.
2 - The Contract Demand is the Maximum demand import from the utility expected for the customer. Filenames: NYSEG_SC10_Sec_wDem_Central.CSV_Oct05-Sept06, nyseg_central_region_Oct05-
Sept06.dat
NYISO LBMP for Central Region from Oct05-Sept06
Jan Feb Mar Apr May Jun Jul Aug Sep Oct Nov Dec0.00
0.05
0.10
0.15
0.20
Hou
rly E
lect
ric R
ates
($/k
Wh)
Figure 6 Hourly Location Based Marginal Pricing for the Central Region from Oct 05 - Sept 06

NYSERDA DG/CHP Integrated Database System Utility Rate Details
CDH Energy Corporation 106 September 25, 2008
New York State Electric & Gas
Service Classification 10 – Cogeneration – Secondary (Contract Demand less than 500 kW) – Central Region – June 2007 to May 2008 All customers with qualifying (or non-qualifying, as applicable) cogeneration or small power production facilities, with or without the requirement for supplemental service, back-up service, or maintenance service who choose to sell all or any excess energy to the Corporation whether or not engaging in simultaneous purchase, under the appropriate Service Classification, from the Corporation. This rate applies to facilities with less than 500 kW of demand and located in the Central NYISO Region. Secondary Service at 120, 120/208, 120/240, 208, 240, 240/416, 277/480, or 480 Volts. Service Charge $ 34.96 Contract Demand Charge2 $ 1.91 per kW of contract demand Energy Charges1 $ per total kWh Hourly Electric Charges See Figure 7
1 – Variable Energy Charges are the hourly Location Based Marginal Price (LBMP) from June 2007 – May 2008 as available at the NYISO website.
2 - The Contract Demand is the Maximum demand import from the utility expected for the customer. Filenames: NYSEG_SC10_Sec_wDem_Central.CSV_Jun07-May08, nyseg_central_region_Jun07-May08.dat
Figure 7 Hourly Location Based Marginal Pricing for the Central Region from Jun 07 – May 08

NYSERDA DG/CHP Integrated Database System Utility Rate Details
CDH Energy Corporation 107 September 25, 2008
New York State Electric & Gas
Service Classification 10 – Cogeneration – Secondary (Contract Demand larger than 500 kW) – Central Region – February 2005 to January 2006 All customers with qualifying (or non-qualifying, as applicable) cogeneration or small power production facilities, with or without the requirement for supplemental service, back-up service, or maintenance service who choose to sell all or any excess energy to the Corporation whether or not engaging in simultaneous purchase, under the appropriate Service Classification, from the Corporation. This rate applies to facilities with a contract demand greater than 500 kW and located in the Central NYISO Region. Secondary Service at 120, 120/208, 120/240, 208, 240, 240/416, 277/480, or 480 Volts. Service Charge $ 38.97 Contract Demand Charge2 $ 1.91 per kW of contract demand Energy Charges1 $ per total kWh Hourly Electric Charges See Figure 5
1 – Variable Energy Charges are the hourly Location Based Marginal Price (LBMP) from February 2005 – January 2006 as available at the NYISO website.
2 - The Contract Demand is the Maximum demand import from the utility expected for the customer. Filenames: NYSEG_SC10_Sec_wDem_gt500_Central_Feb05-Jan06.CSV, nyseg_central_region_Feb05-Jan06.dat
New York State Electric & Gas
Service Classification 10 – Cogeneration – Secondary (Contract Demand larger than 500 kW) – Central Region – October 2005 to September 2006 All customers with qualifying (or non-qualifying, as applicable) cogeneration or small power production facilities, with or without the requirement for supplemental service, back-up service, or maintenance service who choose to sell all or any excess energy to the Corporation whether or not engaging in simultaneous purchase, under the appropriate Service Classification, from the Corporation. This rate applies to facilities with a contract demand greater than 500 kW and located in the Central NYISO Region. Secondary Service at 120, 120/208, 120/240, 208, 240, 240/416, 277/480, or 480 Volts. Service Charge $ 38.97 Contract Demand Charge2 $ 1.91 per kW of contract demand Energy Charges1 $ per total kWh Hourly Electric Charges See Figure 6
1 – Variable Energy Charges are the hourly Location Based Marginal Price (LBMP) from February 2005 – January 2006 as available at the NYISO website.
2 - The Contract Demand is the Maximum demand import from the utility expected for the customer. Filenames: NYSEG_SC10_Sec_wDem_gt500_Central_Oct05-Sept06.CSV, nyseg_central_region_Oct05-Sept06.dat
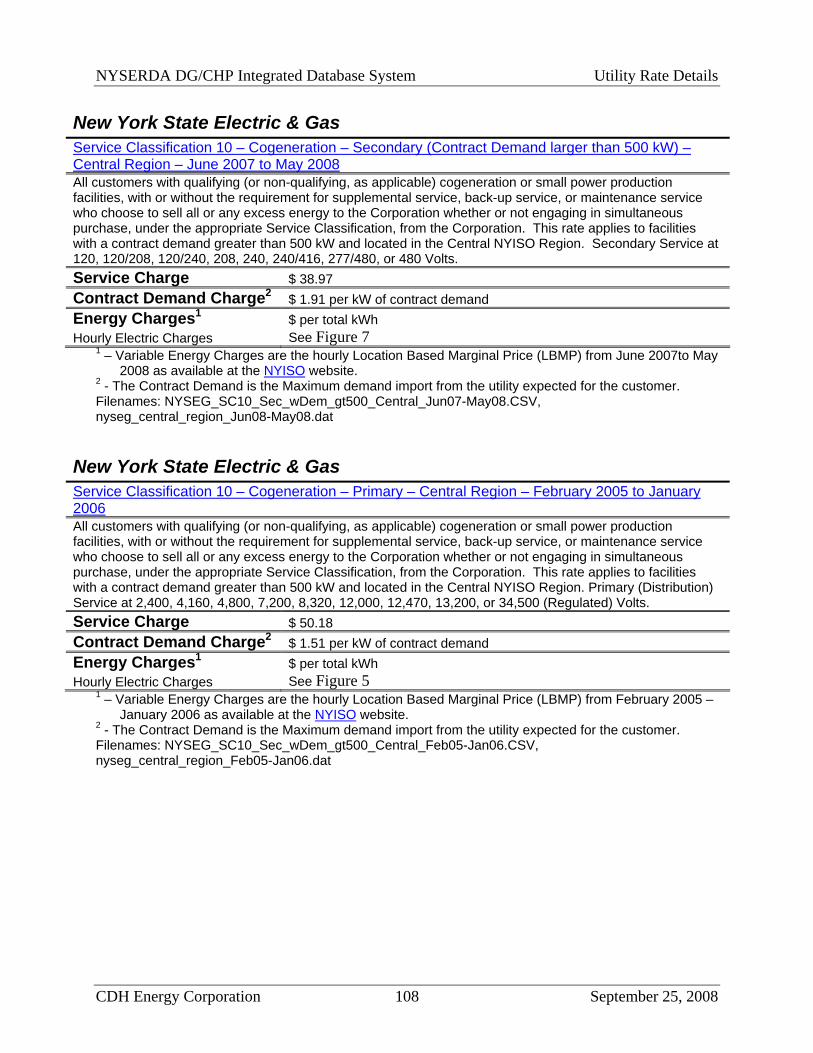
NYSERDA DG/CHP Integrated Database System Utility Rate Details
CDH Energy Corporation 108 September 25, 2008
New York State Electric & Gas
Service Classification 10 – Cogeneration – Secondary (Contract Demand larger than 500 kW) – Central Region – June 2007 to May 2008 All customers with qualifying (or non-qualifying, as applicable) cogeneration or small power production facilities, with or without the requirement for supplemental service, back-up service, or maintenance service who choose to sell all or any excess energy to the Corporation whether or not engaging in simultaneous purchase, under the appropriate Service Classification, from the Corporation. This rate applies to facilities with a contract demand greater than 500 kW and located in the Central NYISO Region. Secondary Service at 120, 120/208, 120/240, 208, 240, 240/416, 277/480, or 480 Volts. Service Charge $ 38.97 Contract Demand Charge2 $ 1.91 per kW of contract demand Energy Charges1 $ per total kWh Hourly Electric Charges See Figure 7
1 – Variable Energy Charges are the hourly Location Based Marginal Price (LBMP) from June 2007to May 2008 as available at the NYISO website.
2 - The Contract Demand is the Maximum demand import from the utility expected for the customer. Filenames: NYSEG_SC10_Sec_wDem_gt500_Central_Jun07-May08.CSV, nyseg_central_region_Jun08-May08.dat
New York State Electric & Gas
Service Classification 10 – Cogeneration – Primary – Central Region – February 2005 to January 2006 All customers with qualifying (or non-qualifying, as applicable) cogeneration or small power production facilities, with or without the requirement for supplemental service, back-up service, or maintenance service who choose to sell all or any excess energy to the Corporation whether or not engaging in simultaneous purchase, under the appropriate Service Classification, from the Corporation. This rate applies to facilities with a contract demand greater than 500 kW and located in the Central NYISO Region. Primary (Distribution) Service at 2,400, 4,160, 4,800, 7,200, 8,320, 12,000, 12,470, 13,200, or 34,500 (Regulated) Volts. Service Charge $ 50.18 Contract Demand Charge2 $ 1.51 per kW of contract demand Energy Charges1 $ per total kWh Hourly Electric Charges See Figure 5
1 – Variable Energy Charges are the hourly Location Based Marginal Price (LBMP) from February 2005 – January 2006 as available at the NYISO website.
2 - The Contract Demand is the Maximum demand import from the utility expected for the customer. Filenames: NYSEG_SC10_Sec_wDem_gt500_Central_Feb05-Jan06.CSV, nyseg_central_region_Feb05-Jan06.dat

NYSERDA DG/CHP Integrated Database System Utility Rate Details
CDH Energy Corporation 109 September 25, 2008
New York State Electric & Gas
Service Classification 10 – Cogeneration – Primary – Central Region – October 2005 to September 2006 All customers with qualifying (or non-qualifying, as applicable) cogeneration or small power production facilities, with or without the requirement for supplemental service, back-up service, or maintenance service who choose to sell all or any excess energy to the Corporation whether or not engaging in simultaneous purchase, under the appropriate Service Classification, from the Corporation. This rate applies to facilities with a contract demand greater than 500 kW and located in the Central NYISO Region. Primary (Distribution) Service at 2,400, 4,160, 4,800, 7,200, 8,320, 12,000, 12,470, 13,200, or 34,500 (Regulated) Volts. Service Charge $ 50.18 Contract Demand Charge2 $ 1.51 per kW of contract demand Energy Charges1 $ per total kWh Hourly Electric Charges See Figure 6
1 – Variable Energy Charges are the hourly Location Based Marginal Price (LBMP) from February 2005 – January 2006 as available at the NYISO website.
2 - The Contract Demand is the Maximum demand import from the utility expected for the customer. Filenames: NYSEG_SC10_Sec_wDem_gt500_Central_Oct05-Sept06.CSV, nyseg_central_region_Oct05-Sept06.dat
New York State Electric & Gas
Service Classification 10 – Cogeneration – Primary – Central Region – June 2007 to May 2008 All customers with qualifying (or non-qualifying, as applicable) cogeneration or small power production facilities, with or without the requirement for supplemental service, back-up service, or maintenance service who choose to sell all or any excess energy to the Corporation whether or not engaging in simultaneous purchase, under the appropriate Service Classification, from the Corporation. This rate applies to facilities with a contract demand greater than 500 kW and located in the Central NYISO Region. Primary (Distribution) Service at 2,400, 4,160, 4,800, 7,200, 8,320, 12,000, 12,470, 13,200, or 34,500 (Regulated) Volts. Service Charge $ 50.18 Contract Demand Charge2 $ 1.51 per kW of contract demand Energy Charges1 $ per total kWh Hourly Electric Charges See Figure 7
1 – Variable Energy Charges are the hourly Location Based Marginal Price (LBMP) from June 2007 – May 2008 as available at the NYISO website.
2 - The Contract Demand is the Maximum demand import from the utility expected for the customer. Filenames: NYSEG_SC10_Sec_wDem_gt500_Central_Jun07-May08.CSV, nyseg_central_region_Jun07-May08.dat

NYSERDA DG/CHP Integrated Database System Utility Rate Details
CDH Energy Corporation 110 September 25, 2008
New York State Electric & Gas
Service Classification 10 – Cogeneration – Secondary (Contract Demand less than 500 kW) – Genesee Region – February 2005 to January 2006 All customers with qualifying (or non-qualifying, as applicable) cogeneration or small power production facilities, with or without the requirement for supplemental service, back-up service, or maintenance service who choose to sell all or any excess energy to the Corporation whether or not engaging in simultaneous purchase, under the appropriate Service Classification, from the Corporation. This rate applies to facilities with less than 500 kW of demand and located in the Genesee NYISO Region. Secondary Service at 120, 120/208, 120/240, 208, 240, 240/416, 277/480, or 480 Volts. Service Charge $ 34.96 Contract Demand Charge2 $ 1.91 per kW of contract demand Energy Charges1 $ per total kWh Hourly Electric Charges See Figure 8
1 – Variable Energy Charges are the hourly Location Based Marginal Price (LBMP) from February 2005 – January 2006 as available at the NYISO website.
2 - The Contract Demand is the Maximum demand import from the utility expected for the customer. Filenames: NYSEG_SC10_Sec_wDem_Genesee_Feb05-Jan06.CSV, nyseg_genesee_region_Feb05-
Jan06.dat
NYISO LBMP for Genesee Region
Jan Feb Mar Apr May Jun Jul Aug Sep Oct Nov Dec0.00
0.05
0.10
0.15
0.20
Hou
rly E
lect
ric R
ates
($/k
Wh)
Figure 8 Hourly Location Based Marginal Pricing for the Genesee Region from Feb 05 - Jan 06

NYSERDA DG/CHP Integrated Database System Utility Rate Details
CDH Energy Corporation 111 September 25, 2008
New York State Electric & Gas
Service Classification 10 – Cogeneration – Secondary (Contract Demand less than 500 kW) – Genesee Region – October 2005 to September 2006 All customers with qualifying (or non-qualifying, as applicable) cogeneration or small power production facilities, with or without the requirement for supplemental service, back-up service, or maintenance service who choose to sell all or any excess energy to the Corporation whether or not engaging in simultaneous purchase, under the appropriate Service Classification, from the Corporation. This rate applies to facilities with less than 500 kW of demand and located in the Genesee NYISO Region. Secondary Service at 120, 120/208, 120/240, 208, 240, 240/416, 277/480, or 480 Volts. Service Charge $ 34.96 Contract Demand Charge2 $ 1.91 per kW of contract demand Energy Charges1 $ per total kWh Hourly Electric Charges See Figure 9
1 – Variable Energy Charges are the hourly Location Based Marginal Price (LBMP) from February 2005 – January 2006 as available at the NYISO website.
2 - The Contract Demand is the Maximum demand import from the utility expected for the customer. Filenames: NYSEG_SC10_Sec_wDem_Genesee.CSV_Oct05-Sept06, nyseg_genesee_region_Oct05-
Sept06.dat
NYISO LBMP for Genesee Region from Oct05-Sept06
Jan Feb Mar Apr May Jun Jul Aug Sep Oct Nov Dec0.00
0.05
0.10
0.15
0.20
Hou
rly E
lect
ric R
ates
($/k
Wh)
Figure 9 Hourly Location Based Marginal Pricing for the Genesee Region from Oct 05 - Sept 06

NYSERDA DG/CHP Integrated Database System Utility Rate Details
CDH Energy Corporation 112 September 25, 2008
New York State Electric & Gas
Service Classification 10 – Cogeneration – Secondary (Contract Demand less than 500 kW) – Genesee Region – June 2007 to May 2008 All customers with qualifying (or non-qualifying, as applicable) cogeneration or small power production facilities, with or without the requirement for supplemental service, back-up service, or maintenance service who choose to sell all or any excess energy to the Corporation whether or not engaging in simultaneous purchase, under the appropriate Service Classification, from the Corporation. This rate applies to facilities with less than 500 kW of demand and located in the Genesee NYISO Region. Secondary Service at 120, 120/208, 120/240, 208, 240, 240/416, 277/480, or 480 Volts. Service Charge $ 34.96 Contract Demand Charge2 $ 1.91 per kW of contract demand Energy Charges1 $ per total kWh Hourly Electric Charges See Figure 10
1 – Variable Energy Charges are the hourly Location Based Marginal Price (LBMP) from June 2007 – May 2008 as available at the NYISO website.
2 - The Contract Demand is the Maximum demand import from the utility expected for the customer. Filenames: NYSEG_SC10_Sec_wDem_Genesee.CSV_Jun07-May08, nyseg_genesee_region_Jun07-May08.dat
Figure 10 Hourly Location Based Marginal Pricing for the Genesee Region from Jun 07 – May 08

NYSERDA DG/CHP Integrated Database System Utility Rate Details
CDH Energy Corporation 113 September 25, 2008
New York State Electric & Gas
Service Classification 10 – Cogeneration – Secondary (Contract Demand larger than 500 kW) – Genesee Region – February 2005 to January 2006 All customers with qualifying (or non-qualifying, as applicable) cogeneration or small power production facilities, with or without the requirement for supplemental service, back-up service, or maintenance service who choose to sell all or any excess energy to the Corporation whether or not engaging in simultaneous purchase, under the appropriate Service Classification, from the Corporation. This rate applies to facilities with a contract demand greater than 500 kW and located in the Genesee NYISO Region. Secondary Service at 120, 120/208, 120/240, 208, 240, 240/416, 277/480, or 480 Volts. Service Charge $ 38.97 Contract Demand Charge2 $ 1.91 per kW of contract demand Energy Charges1 $ per total kWh Hourly Electric Charges See Figure 8
1 – Variable Energy Charges are the hourly Location Based Marginal Price (LBMP) from February 2005 – January 2006 as available at the NYISO website.
2 - The Contract Demand is the Maximum demand import from the utility expected for the customer. Filenames: NYSEG_SC10_Sec_wDem_gt500_Genesee_Feb05-Jan06.CSV, nyseg_genesee_region_Feb05-Jan06.dat
New York State Electric & Gas
Service Classification 10 – Cogeneration – Secondary (Contract Demand larger than 500 kW) – Genesee Region – October 2005 to September 2006 All customers with qualifying (or non-qualifying, as applicable) cogeneration or small power production facilities, with or without the requirement for supplemental service, back-up service, or maintenance service who choose to sell all or any excess energy to the Corporation whether or not engaging in simultaneous purchase, under the appropriate Service Classification, from the Corporation. This rate applies to facilities with a contract demand greater than 500 kW and located in the Genesee NYISO Region. Secondary Service at 120, 120/208, 120/240, 208, 240, 240/416, 277/480, or 480 Volts. Service Charge $ 38.97 Contract Demand Charge2 $ 1.91 per kW of contract demand Energy Charges1 $ per total kWh Hourly Electric Charges See Figure 9
1 – Variable Energy Charges are the hourly Location Based Marginal Price (LBMP) from February 2005 – January 2006 as available at the NYISO website.
2 - The Contract Demand is the Maximum demand import from the utility expected for the customer. Filenames: NYSEG_SC10_Sec_wDem_gt500_Genesee_Oct05-Sept06.CSV, nyseg_genesee_region_Oct05-Sept06.dat

NYSERDA DG/CHP Integrated Database System Utility Rate Details
CDH Energy Corporation 114 September 25, 2008
New York State Electric & Gas
Service Classification 10 – Cogeneration – Secondary (Contract Demand larger than 500 kW) – Genesee Region – June 2007 to May 2008 All customers with qualifying (or non-qualifying, as applicable) cogeneration or small power production facilities, with or without the requirement for supplemental service, back-up service, or maintenance service who choose to sell all or any excess energy to the Corporation whether or not engaging in simultaneous purchase, under the appropriate Service Classification, from the Corporation. This rate applies to facilities with a contract demand greater than 500 kW and located in the Genesee NYISO Region. Secondary Service at 120, 120/208, 120/240, 208, 240, 240/416, 277/480, or 480 Volts. Service Charge $ 38.97 Contract Demand Charge2 $ 1.91 per kW of contract demand Energy Charges1 $ per total kWh Hourly Electric Charges See Figure 10
1 – Variable Energy Charges are the hourly Location Based Marginal Price (LBMP) from June 2007 – May 2008 as available at the NYISO website.
2 - The Contract Demand is the Maximum demand import from the utility expected for the customer. Filenames: NYSEG_SC10_Sec_wDem_gt500_Genesee_Jun07-May08.CSV, nyseg_genesee_region_Jun07-May08.dat
New York State Electric & Gas
Service Classification 10 – Cogeneration – Primary – Genesee Region – February 2005 to January 2006 All customers with qualifying (or non-qualifying, as applicable) cogeneration or small power production facilities, with or without the requirement for supplemental service, back-up service, or maintenance service who choose to sell all or any excess energy to the Corporation whether or not engaging in simultaneous purchase, under the appropriate Service Classification, from the Corporation. This rate applies to facilities with a contract demand greater than 500 kW and located in the Genesee NYISO Region. Primary (Distribution) Service at 2,400, 4,160, 4,800, 7,200, 8,320, 12,000, 12,470, 13,200, or 34,500 (Regulated) Volts. Service Charge $ 50.18 Contract Demand Charge2 $ 1.51 per kW of contract demand Energy Charges1 $ per total kWh Hourly Electric Charges See Figure 8
1 – Variable Energy Charges are the hourly Location Based Marginal Price (LBMP) from February 2005 – January 2006 as available at the NYISO website.
2 - The Contract Demand is the Maximum demand import from the utility expected for the customer. Filenames: NYSEG_SC10_Sec_wDem_gt500_Genesee_Feb05-Jan06.CSV, nyseg_genesee_region_Feb05-Jan06.dat
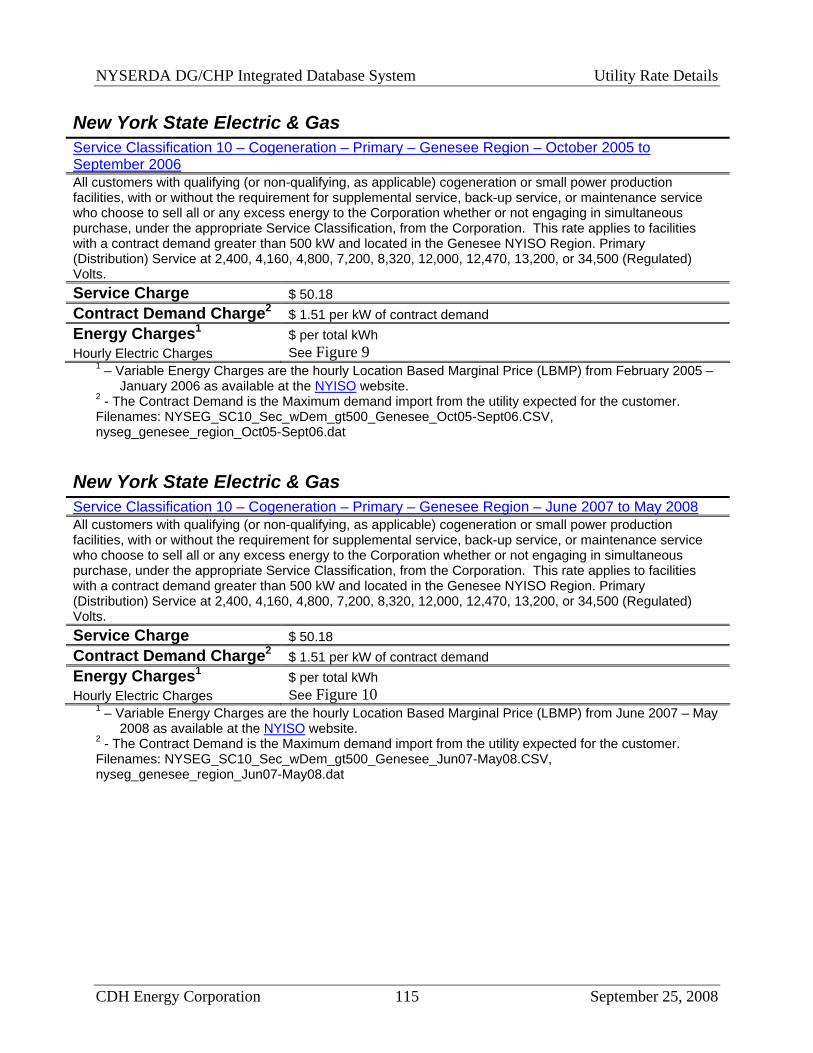
NYSERDA DG/CHP Integrated Database System Utility Rate Details
CDH Energy Corporation 115 September 25, 2008
New York State Electric & Gas
Service Classification 10 – Cogeneration – Primary – Genesee Region – October 2005 to September 2006 All customers with qualifying (or non-qualifying, as applicable) cogeneration or small power production facilities, with or without the requirement for supplemental service, back-up service, or maintenance service who choose to sell all or any excess energy to the Corporation whether or not engaging in simultaneous purchase, under the appropriate Service Classification, from the Corporation. This rate applies to facilities with a contract demand greater than 500 kW and located in the Genesee NYISO Region. Primary (Distribution) Service at 2,400, 4,160, 4,800, 7,200, 8,320, 12,000, 12,470, 13,200, or 34,500 (Regulated) Volts. Service Charge $ 50.18 Contract Demand Charge2 $ 1.51 per kW of contract demand Energy Charges1 $ per total kWh Hourly Electric Charges See Figure 9
1 – Variable Energy Charges are the hourly Location Based Marginal Price (LBMP) from February 2005 – January 2006 as available at the NYISO website.
2 - The Contract Demand is the Maximum demand import from the utility expected for the customer. Filenames: NYSEG_SC10_Sec_wDem_gt500_Genesee_Oct05-Sept06.CSV, nyseg_genesee_region_Oct05-Sept06.dat
New York State Electric & Gas
Service Classification 10 – Cogeneration – Primary – Genesee Region – June 2007 to May 2008 All customers with qualifying (or non-qualifying, as applicable) cogeneration or small power production facilities, with or without the requirement for supplemental service, back-up service, or maintenance service who choose to sell all or any excess energy to the Corporation whether or not engaging in simultaneous purchase, under the appropriate Service Classification, from the Corporation. This rate applies to facilities with a contract demand greater than 500 kW and located in the Genesee NYISO Region. Primary (Distribution) Service at 2,400, 4,160, 4,800, 7,200, 8,320, 12,000, 12,470, 13,200, or 34,500 (Regulated) Volts. Service Charge $ 50.18 Contract Demand Charge2 $ 1.51 per kW of contract demand Energy Charges1 $ per total kWh Hourly Electric Charges See Figure 10
1 – Variable Energy Charges are the hourly Location Based Marginal Price (LBMP) from June 2007 – May 2008 as available at the NYISO website.
2 - The Contract Demand is the Maximum demand import from the utility expected for the customer. Filenames: NYSEG_SC10_Sec_wDem_gt500_Genesee_Jun07-May08.CSV, nyseg_genesee_region_Jun07-May08.dat

NYSERDA DG/CHP Integrated Database System Utility Rate Details
CDH Energy Corporation 116 September 25, 2008
New York State Electric & Gas
Service Classification 10 – Cogeneration – Secondary (Contract Demand less than 500 kW) – Hudson Valley Region – February 2005 to January 2006 All customers with qualifying (or non-qualifying, as applicable) cogeneration or small power production facilities, with or without the requirement for supplemental service, back-up service, or maintenance service who choose to sell all or any excess energy to the Corporation whether or not engaging in simultaneous purchase, under the appropriate Service Classification, from the Corporation. This rate applies to facilities with less than 500 kW of demand and located in the Hudson Valley NYISO Region. Secondary Service at 120, 120/208, 120/240, 208, 240, 240/416, 277/480, or 480 Volts. Service Charge $ 34.96 Contract Demand Charge2 $ 1.91 per kW of contract demand Energy Charges1 $ per total kWh Hourly Electric Charges See Figure 11
1 – Variable Energy Charges are the hourly Location Based Marginal Price (LBMP) from February 2005 – January 2006 as available at the NYISO website.
2 - The Contract Demand is the Maximum demand import from the utility expected for the customer. Filenames: NYSEG_SC10_Sec_wDem_Hudson_Feb05-Jan06.CSV,
nyseg_hudson_valley_region_Feb05-Jan06.dat
NYISO LBMP for Hudson Valley Region
Jan Feb Mar Apr May Jun Jul Aug Sep Oct Nov Dec0.00
0.05
0.10
0.15
0.20
0.25
0.30
Hou
rly E
lect
ric R
ates
($/k
Wh)
Figure 11 Hourly Location Based Marginal Pricing for the Hudson Valley Region from Feb 05 - Jan 06

NYSERDA DG/CHP Integrated Database System Utility Rate Details
CDH Energy Corporation 117 September 25, 2008
New York State Electric & Gas
Service Classification 10 – Cogeneration – Secondary (Contract Demand less than 500 kW) – Hudson Valley Region – October 2005 to September 2006 All customers with qualifying (or non-qualifying, as applicable) cogeneration or small power production facilities, with or without the requirement for supplemental service, back-up service, or maintenance service who choose to sell all or any excess energy to the Corporation whether or not engaging in simultaneous purchase, under the appropriate Service Classification, from the Corporation. This rate applies to facilities with less than 500 kW of demand and located in the Hudson Valley NYISO Region. Secondary Service at 120, 120/208, 120/240, 208, 240, 240/416, 277/480, or 480 Volts. Service Charge $ 34.96 Contract Demand Charge2 $ 1.91 per kW of contract demand Energy Charges1 $ per total kWh Hourly Electric Charges See Figure 12
1 – Variable Energy Charges are the hourly Location Based Marginal Price (LBMP) from February 2005 – January 2006 as available at the NYISO website.
2 - The Contract Demand is the Maximum demand import from the utility expected for the customer. Filenames: NYSEG_SC10_Sec_wDem_Hudson_Oct05-Sept06.CSV,
nyseg_hudson_valley_region_Oct05-Sept06.dat
NYISO LBMP for Hudson Valley Region from Oct05-Sept06
Oct Nov Dec Jan Feb Mar Apr May Jun Jul Aug Sep0.00
0.10
0.20
0.30
0.40
0.50
Hou
rly E
lect
ric R
ates
($/k
Wh)
Figure 12 Hourly Location Based Marginal Pricing for the Hudson Valley Region from Oct 05 - Sept 06

NYSERDA DG/CHP Integrated Database System Utility Rate Details
CDH Energy Corporation 118 September 25, 2008
New York State Electric & Gas
Service Classification 10 – Cogeneration – Secondary (Contract Demand less than 500 kW) – Hudson Valley Region – June 2007 to May 2008 All customers with qualifying (or non-qualifying, as applicable) cogeneration or small power production facilities, with or without the requirement for supplemental service, back-up service, or maintenance service who choose to sell all or any excess energy to the Corporation whether or not engaging in simultaneous purchase, under the appropriate Service Classification, from the Corporation. This rate applies to facilities with less than 500 kW of demand and located in the Hudson Valley NYISO Region. Secondary Service at 120, 120/208, 120/240, 208, 240, 240/416, 277/480, or 480 Volts. Service Charge $ 34.96 Contract Demand Charge2 $ 1.91 per kW of contract demand Energy Charges1 $ per total kWh Hourly Electric Charges See Figure 13
1 – Variable Energy Charges are the hourly Location Based Marginal Price (LBMP) from June 2007 – May 2008 as available at the NYISO website.
2 - The Contract Demand is the Maximum demand import from the utility expected for the customer. Filenames: NYSEG_SC10_Sec_wDem_Hudson_Jun07-May08.CSV, nyseg_hudson_valley_region_Jun07-May08.dat
Figure 13 Hourly Location Based Marginal Pricing for the Hudson Valley Region from Jun 07 – May 08

NYSERDA DG/CHP Integrated Database System Utility Rate Details
CDH Energy Corporation 119 September 25, 2008
New York State Electric & Gas
Service Classification 10 – Cogeneration – Secondary (Contract Demand larger than 500 kW) – Hudson Valley Region – February 2005 to January 2006 All customers with qualifying (or non-qualifying, as applicable) cogeneration or small power production facilities, with or without the requirement for supplemental service, back-up service, or maintenance service who choose to sell all or any excess energy to the Corporation whether or not engaging in simultaneous purchase, under the appropriate Service Classification, from the Corporation. This rate applies to facilities with a contract demand greater than 500 kW and located in the Hudson Valley NYISO Region. Secondary Service at 120, 120/208, 120/240, 208, 240, 240/416, 277/480, or 480 Volts. Service Charge $ 38.97 Contract Demand Charge2 $ 1.91 per kW of contract demand Energy Charges1 $ per total kWh Hourly Electric Charges See Figure 11
1 – Variable Energy Charges are the hourly Location Based Marginal Price (LBMP) from February 2005 – January 2006 as available at the NYISO website.
2 - The Contract Demand is the Maximum demand import from the utility expected for the customer. Filenames: NYSEG_SC10_Sec_wDem_gt500_Hudson_Feb05-Jan06.CSV, nyseg_hudson_valley_region_Feb05-Jan06.dat
New York State Electric & Gas
Service Classification 10 – Cogeneration – Secondary (Contract Demand larger than 500 kW) – Hudson Valley Region – October 2005 to September 2006 All customers with qualifying (or non-qualifying, as applicable) cogeneration or small power production facilities, with or without the requirement for supplemental service, back-up service, or maintenance service who choose to sell all or any excess energy to the Corporation whether or not engaging in simultaneous purchase, under the appropriate Service Classification, from the Corporation. This rate applies to facilities with a contract demand greater than 500 kW and located in the Hudson Valley NYISO Region. Secondary Service at 120, 120/208, 120/240, 208, 240, 240/416, 277/480, or 480 Volts. Service Charge $ 38.97 Contract Demand Charge2 $ 1.91 per kW of contract demand Energy Charges1 $ per total kWh Hourly Electric Charges See Figure 12
1 – Variable Energy Charges are the hourly Location Based Marginal Price (LBMP) from February 2005 – January 2006 as available at the NYISO website.
2 - The Contract Demand is the Maximum demand import from the utility expected for the customer. Filenames: NYSEG_SC10_Sec_wDem_gt500_Hudson_Oct05-Sept06.CSV, nyseg_hudson_valley_region_Oct05-Sept06.dat

NYSERDA DG/CHP Integrated Database System Utility Rate Details
CDH Energy Corporation 120 September 25, 2008
New York State Electric & Gas
Service Classification 10 – Cogeneration – Secondary (Contract Demand larger than 500 kW) – Hudson Valley Region – June 2007 to May 2008 All customers with qualifying (or non-qualifying, as applicable) cogeneration or small power production facilities, with or without the requirement for supplemental service, back-up service, or maintenance service who choose to sell all or any excess energy to the Corporation whether or not engaging in simultaneous purchase, under the appropriate Service Classification, from the Corporation. This rate applies to facilities with a contract demand greater than 500 kW and located in the Hudson Valley NYISO Region. Secondary Service at 120, 120/208, 120/240, 208, 240, 240/416, 277/480, or 480 Volts. Service Charge $ 38.97 Contract Demand Charge2 $ 1.91 per kW of contract demand Energy Charges1 $ per total kWh Hourly Electric Charges See Figure 13
1 – Variable Energy Charges are the hourly Location Based Marginal Price (LBMP) from June 2007 – May 2008 as available at the NYISO website.
2 - The Contract Demand is the Maximum demand import from the utility expected for the customer. Filenames: NYSEG_SC10_Sec_wDem_gt500_Hudson_Jun07-May08.CSV, nyseg_hudson_valley_region_Jun07-May08.dat
New York State Electric & Gas
Service Classification 10 – Cogeneration – Primary – Hudson Valley Region – February 2005 to January 2006 All customers with qualifying (or non-qualifying, as applicable) cogeneration or small power production facilities, with or without the requirement for supplemental service, back-up service, or maintenance service who choose to sell all or any excess energy to the Corporation whether or not engaging in simultaneous purchase, under the appropriate Service Classification, from the Corporation. This rate applies to facilities with a contract demand greater than 500 kW and located in the Hudson Valley NYISO Region. Primary (Distribution) Service at 2,400, 4,160, 4,800, 7,200, 8,320, 12,000, 12,470, 13,200, or 34,500 (Regulated) Volts. Service Charge $ 50.18 Contract Demand Charge2 $ 1.51 per kW of contract demand Energy Charges1 $ per total kWh Hourly Electric Charges See Figure 11
1 – Variable Energy Charges are the hourly Location Based Marginal Price (LBMP) from February 2005 – January 2006 as available at the NYISO website.
2 - The Contract Demand is the Maximum demand import from the utility expected for the customer. Filenames: NYSEG_SC10_Sec_wDem_gt500_Hudson_Feb05-Jan06.CSV, nyseg_hudson_valley_region_Feb05-Jan06.dat

NYSERDA DG/CHP Integrated Database System Utility Rate Details
CDH Energy Corporation 121 September 25, 2008
New York State Electric & Gas
Service Classification 10 – Cogeneration – Primary – Hudson Valley Region – October 2005 to September 2006 All customers with qualifying (or non-qualifying, as applicable) cogeneration or small power production facilities, with or without the requirement for supplemental service, back-up service, or maintenance service who choose to sell all or any excess energy to the Corporation whether or not engaging in simultaneous purchase, under the appropriate Service Classification, from the Corporation. This rate applies to facilities with a contract demand greater than 500 kW and located in the Hudson Valley NYISO Region. Primary (Distribution) Service at 2,400, 4,160, 4,800, 7,200, 8,320, 12,000, 12,470, 13,200, or 34,500 (Regulated) Volts. Service Charge $ 50.18 Contract Demand Charge2 $ 1.51 per kW of contract demand Energy Charges1 $ per total kWh Hourly Electric Charges See Figure 12
1 – Variable Energy Charges are the hourly Location Based Marginal Price (LBMP) from February 2005 – January 2006 as available at the NYISO website.
2 - The Contract Demand is the Maximum demand import from the utility expected for the customer. Filenames: NYSEG_SC10_Sec_wDem_gt500_Hudson_Oct05-Sept06.CSV, nyseg_hudson_valley_region_Oct05-Sept06.dat
New York State Electric & Gas
Service Classification 10 – Cogeneration – Primary – Hudson Valley Region – June 2007 to May 2008 All customers with qualifying (or non-qualifying, as applicable) cogeneration or small power production facilities, with or without the requirement for supplemental service, back-up service, or maintenance service who choose to sell all or any excess energy to the Corporation whether or not engaging in simultaneous purchase, under the appropriate Service Classification, from the Corporation. This rate applies to facilities with a contract demand greater than 500 kW and located in the Hudson Valley NYISO Region. Primary (Distribution) Service at 2,400, 4,160, 4,800, 7,200, 8,320, 12,000, 12,470, 13,200, or 34,500 (Regulated) Volts. Service Charge $ 50.18 Contract Demand Charge2 $ 1.51 per kW of contract demand Energy Charges1 $ per total kWh Hourly Electric Charges See Figure 13
1 – Variable Energy Charges are the hourly Location Based Marginal Price (LBMP) June 2007 – May 2008 as available at the NYISO website.
2 - The Contract Demand is the Maximum demand import from the utility expected for the customer. Filenames: NYSEG_SC10_Sec_wDem_gt500_Hudson_Jun07-May08.CSV, nyseg_hudson_valley_region_Jun07-May08.dat

NYSERDA DG/CHP Integrated Database System Utility Rate Details
CDH Energy Corporation 122 September 25, 2008
New York State Electric & Gas
Service Classification 10 – Cogeneration – Secondary (Contract Demand less than 500 kW) – Mohawk Valley Region – February 2005 to January 2006 All customers with qualifying (or non-qualifying, as applicable) cogeneration or small power production facilities, with or without the requirement for supplemental service, back-up service, or maintenance service who choose to sell all or any excess energy to the Corporation whether or not engaging in simultaneous purchase, under the appropriate Service Classification, from the Corporation. This rate applies to facilities with less than 500 kW of demand and located in the Mohawk Valley NYISO Region. Secondary Service at 120, 120/208, 120/240, 208, 240, 240/416, 277/480, or 480 Volts. Service Charge $ 34.96 Contract Demand Charge2 $ 1.91 per kW of contract demand Energy Charges1 $ per total kWh Hourly Electric Charges See Figure 14
1 – Variable Energy Charges are the hourly Location Based Marginal Price (LBMP) from February 2005 – January 2006 as available at the NYISO website.
2 - The Contract Demand is the Maximum demand import from the utility expected for the customer. Filenames: NYSEG_SC10_Sec_wDem_Mohawk_Feb05-Jan06.CSV,
nyseg_mohawk_valley_region_Feb05-Jan06.dat
NYISO LBMP for Mohawk Valley Region
Jan Feb Mar Apr May Jun Jul Aug Sep Oct Nov Dec0.00
0.05
0.10
0.15
0.20
Hou
rly E
lect
ric R
ates
($/k
Wh)
Figure 14 Hourly Location Based Marginal Pricing for the Mohawk Valley Region from Feb 05 - Jan 06

NYSERDA DG/CHP Integrated Database System Utility Rate Details
CDH Energy Corporation 123 September 25, 2008
New York State Electric & Gas
Service Classification 10 – Cogeneration – Secondary (Contract Demand less than 500 kW) – Mohawk Valley Region – October 2005 to September 2006 All customers with qualifying (or non-qualifying, as applicable) cogeneration or small power production facilities, with or without the requirement for supplemental service, back-up service, or maintenance service who choose to sell all or any excess energy to the Corporation whether or not engaging in simultaneous purchase, under the appropriate Service Classification, from the Corporation. This rate applies to facilities with less than 500 kW of demand and located in the Mohawk Valley NYISO Region. Secondary Service at 120, 120/208, 120/240, 208, 240, 240/416, 277/480, or 480 Volts. Service Charge $ 34.96 Contract Demand Charge2 $ 1.91 per kW of contract demand Energy Charges1 $ per total kWh Hourly Electric Charges See Figure 15
1 – Variable Energy Charges are the hourly Location Based Marginal Price (LBMP) from February 2005 – January 2006 as available at the NYISO website.
2 - The Contract Demand is the Maximum demand import from the utility expected for the customer. Filenames: NYSEG_SC10_Sec_wDem_Mohawk_Oct05-Sept06.CSV,
nyseg_mohawk_valley_region_Oct05-Sept06.dat
NYISO LBMP for Mohawk Valley Region from Oct05-Sept06
Jan Feb Mar Apr May Jun Jul Aug Sep Oct Nov Dec0.00
0.05
0.10
0.15
0.20
Hou
rly E
lect
ric R
ates
($/k
Wh)
Figure 15 Hourly Location Based Marginal Pricing for the Mohawk Valley Region from Oct 05 - Sept 06

NYSERDA DG/CHP Integrated Database System Utility Rate Details
CDH Energy Corporation 124 September 25, 2008
New York State Electric & Gas
Service Classification 10 – Cogeneration – Secondary (Contract Demand less than 500 kW) – Mohawk Valley Region – June 2007 to May 2008 All customers with qualifying (or non-qualifying, as applicable) cogeneration or small power production facilities, with or without the requirement for supplemental service, back-up service, or maintenance service who choose to sell all or any excess energy to the Corporation whether or not engaging in simultaneous purchase, under the appropriate Service Classification, from the Corporation. This rate applies to facilities with less than 500 kW of demand and located in the Mohawk Valley NYISO Region. Secondary Service at 120, 120/208, 120/240, 208, 240, 240/416, 277/480, or 480 Volts. Service Charge $ 34.96 Contract Demand Charge2 $ 1.91 per kW of contract demand Energy Charges1 $ per total kWh Hourly Electric Charges See Figure 16
1 – Variable Energy Charges are the hourly Location Based Marginal Price (LBMP) from June 2007 – May 2008 as available at the NYISO website.
2 - The Contract Demand is the Maximum demand import from the utility expected for the customer. Filenames: NYSEG_SC10_Sec_wDem_Mohawk_Jun07-May08.CSV, nyseg_mohawk_valley_region_Jun07-May08.dat
Figure 16 Hourly Location Based Marginal Pricing for the Mohawk Valley Region from Jun 07 – May 08

NYSERDA DG/CHP Integrated Database System Utility Rate Details
CDH Energy Corporation 125 September 25, 2008
New York State Electric & Gas
Service Classification 10 – Cogeneration – Secondary (Contract Demand larger than 500 kW) – Mohawk Valley Region – February 2005 to January 2006 All customers with qualifying (or non-qualifying, as applicable) cogeneration or small power production facilities, with or without the requirement for supplemental service, back-up service, or maintenance service who choose to sell all or any excess energy to the Corporation whether or not engaging in simultaneous purchase, under the appropriate Service Classification, from the Corporation. This rate applies to facilities with a contract demand greater than 500 kW and located in the Mohawk Valley NYISO Region. Secondary Service at 120, 120/208, 120/240, 208, 240, 240/416, 277/480, or 480 Volts. Service Charge $ 38.97 Contract Demand Charge2 $ 1.91 per kW of contract demand Energy Charges1 $ per total kWh Hourly Electric Charges See Figure 14
1 – Variable Energy Charges are the hourly Location Based Marginal Price (LBMP) from February 2005 – January 2006 as available at the NYISO website.
2 - The Contract Demand is the Maximum demand import from the utility expected for the customer. Filenames: NYSEG_SC10_Sec_wDem_gt500_Mohawk_Feb05-Jan06.CSV, nyseg_mohawk_valley_region_Feb05-Jan06.dat
New York State Electric & Gas
Service Classification 10 – Cogeneration – Secondary (Contract Demand larger than 500 kW) – Mohawk Valley Region – October 2005 to September 2006 All customers with qualifying (or non-qualifying, as applicable) cogeneration or small power production facilities, with or without the requirement for supplemental service, back-up service, or maintenance service who choose to sell all or any excess energy to the Corporation whether or not engaging in simultaneous purchase, under the appropriate Service Classification, from the Corporation. This rate applies to facilities with a contract demand greater than 500 kW and located in the Mohawk Valley NYISO Region. Secondary Service at 120, 120/208, 120/240, 208, 240, 240/416, 277/480, or 480 Volts. Service Charge $ 38.97 Contract Demand Charge2 $ 1.91 per kW of contract demand Energy Charges1 $ per total kWh Hourly Electric Charges See Figure 15
1 – Variable Energy Charges are the hourly Location Based Marginal Price (LBMP) from February 2005 – January 2006 as available at the NYISO website.
2 - The Contract Demand is the Maximum demand import from the utility expected for the customer. Filenames: NYSEG_SC10_Sec_wDem_gt500_Mohawk_Oct05-Sept06.CSV, nyseg_mohawk_valley_region_Oct05-Sept06.dat

NYSERDA DG/CHP Integrated Database System Utility Rate Details
CDH Energy Corporation 126 September 25, 2008
New York State Electric & Gas
Service Classification 10 – Cogeneration – Secondary (Contract Demand larger than 500 kW) – Mohawk Valley Region – June 2007 to May 2008 All customers with qualifying (or non-qualifying, as applicable) cogeneration or small power production facilities, with or without the requirement for supplemental service, back-up service, or maintenance service who choose to sell all or any excess energy to the Corporation whether or not engaging in simultaneous purchase, under the appropriate Service Classification, from the Corporation. This rate applies to facilities with a contract demand greater than 500 kW and located in the Mohawk Valley NYISO Region. Secondary Service at 120, 120/208, 120/240, 208, 240, 240/416, 277/480, or 480 Volts. Service Charge $ 38.97 Contract Demand Charge2 $ 1.91 per kW of contract demand Energy Charges1 $ per total kWh Hourly Electric Charges See Figure 16
1 – Variable Energy Charges are the hourly Location Based Marginal Price (LBMP) from June 2007 – May 2008 as available at the NYISO website.
2 - The Contract Demand is the Maximum demand import from the utility expected for the customer. Filenames: NYSEG_SC10_Sec_wDem_gt500_Mohawk_Jun07-May08.CSV, nyseg_mohawk_valley_region_Jun07-May08.dat
New York State Electric & Gas
Service Classification 10 – Cogeneration – Primary – Mohawk Valley Region – February 2005 to January 2006 All customers with qualifying (or non-qualifying, as applicable) cogeneration or small power production facilities, with or without the requirement for supplemental service, back-up service, or maintenance service who choose to sell all or any excess energy to the Corporation whether or not engaging in simultaneous purchase, under the appropriate Service Classification, from the Corporation. This rate applies to facilities with a contract demand greater than 500 kW and located in the Mohawk Valley NYISO Region. Primary (Distribution) Service at 2,400, 4,160, 4,800, 7,200, 8,320, 12,000, 12,470, 13,200, or 34,500 (Regulated) Volts. Service Charge $ 50.18 Contract Demand Charge2 $ 1.51 per kW of contract demand Energy Charges1 $ per total kWh Hourly Electric Charges See Figure 14
1 – Variable Energy Charges are the hourly Location Based Marginal Price (LBMP) from February 2005 – January 2006 as available at the NYISO website.
2 - The Contract Demand is the Maximum demand import from the utility expected for the customer. Filenames: NYSEG_SC10_Sec_wDem_gt500_Mohawk_Feb05-Jan06.CSV, nyseg_mohawk_valley_region_Feb05-Jan06.dat

NYSERDA DG/CHP Integrated Database System Utility Rate Details
CDH Energy Corporation 127 September 25, 2008
New York State Electric & Gas
Service Classification 10 – Cogeneration – Primary – Mohawk Valley Region – October 2005 to September 2006 All customers with qualifying (or non-qualifying, as applicable) cogeneration or small power production facilities, with or without the requirement for supplemental service, back-up service, or maintenance service who choose to sell all or any excess energy to the Corporation whether or not engaging in simultaneous purchase, under the appropriate Service Classification, from the Corporation. This rate applies to facilities with a contract demand greater than 500 kW and located in the Mohawk Valley NYISO Region. Primary (Distribution) Service at 2,400, 4,160, 4,800, 7,200, 8,320, 12,000, 12,470, 13,200, or 34,500 (Regulated) Volts. Service Charge $ 50.18 Contract Demand Charge2 $ 1.51 per kW of contract demand Energy Charges1 $ per total kWh Hourly Electric Charges See Figure 15
1 – Variable Energy Charges are the hourly Location Based Marginal Price (LBMP) from February 2005 – January 2006 as available at the NYISO website.
2 - The Contract Demand is the Maximum demand import from the utility expected for the customer. Filenames: NYSEG_SC10_Sec_wDem_gt500_Mohawk_Oct05-Sept06.CSV, nyseg_mohawk_valley_region_Oct05-Sept06.dat
New York State Electric & Gas
Service Classification 10 – Cogeneration – Primary – Mohawk Valley Region – June 2007 to May 2008 All customers with qualifying (or non-qualifying, as applicable) cogeneration or small power production facilities, with or without the requirement for supplemental service, back-up service, or maintenance service who choose to sell all or any excess energy to the Corporation whether or not engaging in simultaneous purchase, under the appropriate Service Classification, from the Corporation. This rate applies to facilities with a contract demand greater than 500 kW and located in the Mohawk Valley NYISO Region. Primary (Distribution) Service at 2,400, 4,160, 4,800, 7,200, 8,320, 12,000, 12,470, 13,200, or 34,500 (Regulated) Volts. Service Charge $ 50.18 Contract Demand Charge2 $ 1.51 per kW of contract demand Energy Charges1 $ per total kWh Hourly Electric Charges See Figure 16
1 – Variable Energy Charges are the hourly Location Based Marginal Price (LBMP) from June 2007 – May 2008 as available at the NYISO website.
2 - The Contract Demand is the Maximum demand import from the utility expected for the customer. Filenames: NYSEG_SC10_Sec_wDem_gt500_Mohawk_Jun07-May08.CSV, nyseg_mohawk_valley_region_Jun07-May08.dat

NYSERDA DG/CHP Integrated Database System Utility Rate Details
CDH Energy Corporation 128 September 25, 2008
New York State Electric & Gas
Service Classification 10 – Cogeneration – Secondary (Contract Demand less than 500 kW) – North Region – February 2005 to January 2006 All customers with qualifying (or non-qualifying, as applicable) cogeneration or small power production facilities, with or without the requirement for supplemental service, back-up service, or maintenance service who choose to sell all or any excess energy to the Corporation whether or not engaging in simultaneous purchase, under the appropriate Service Classification, from the Corporation. This rate applies to facilities with less than 500 kW of demand and located in the North NYISO Region. Secondary Service at 120, 120/208, 120/240, 208, 240, 240/416, 277/480, or 480 Volts. Service Charge $ 34.96 Contract Demand Charge2 $ 1.91 per kW of contract demand Energy Charges1 $ per total kWh Hourly Electric Charges See Figure 17
1 – Variable Energy Charges are the hourly Location Based Marginal Price (LBMP) from February 2005 – January 2006 as available at the NYISO website.
2 - The Contract Demand is the Maximum demand import from the utility expected for the customer. Filenames: NYSEG_SC10_Sec_wDem_North_Feb05-Jan06.CSV, nyseg_north_region_Feb05-Jan06.dat
NYISO LBMP for North Region
Jan Feb Mar Apr May Jun Jul Aug Sep Oct Nov Dec0.00
0.05
0.10
0.15
0.20
Hou
rly E
lect
ric R
ates
($/k
Wh)
Figure 17 Hourly Location Based Marginal Pricing for the North Region from Feb 05 - Jan 06

NYSERDA DG/CHP Integrated Database System Utility Rate Details
CDH Energy Corporation 129 September 25, 2008
New York State Electric & Gas
Service Classification 10 – Cogeneration – Secondary (Contract Demand less than 500 kW) – North Region – October 2005 to September 2006 All customers with qualifying (or non-qualifying, as applicable) cogeneration or small power production facilities, with or without the requirement for supplemental service, back-up service, or maintenance service who choose to sell all or any excess energy to the Corporation whether or not engaging in simultaneous purchase, under the appropriate Service Classification, from the Corporation. This rate applies to facilities with less than 500 kW of demand and located in the North NYISO Region. Secondary Service at 120, 120/208, 120/240, 208, 240, 240/416, 277/480, or 480 Volts. Service Charge $ 34.96 Contract Demand Charge2 $ 1.91 per kW of contract demand Energy Charges1 $ per total kWh Hourly Electric Charges See Figure 18
1 – Variable Energy Charges are the hourly Location Based Marginal Price (LBMP) from February 2005 – January 2006 as available at the NYISO website.
2 - The Contract Demand is the Maximum demand import from the utility expected for the customer. Filenames: NYSEG_SC10_Sec_wDem_North_Oct05-Sept06.CSV, nyseg_north_region_Oct05-
Sept06.dat
NYISO LBMP for North Region from Oct05-Sept06
Jan Feb Mar Apr May Jun Jul Aug Sep Oct Nov Dec0.00
0.05
0.10
0.15
0.20
Hou
rly E
lect
ric R
ates
($/k
Wh)
Figure 18 Hourly Location Based Marginal Pricing for the North Region from Oct 05 - Sept 06

NYSERDA DG/CHP Integrated Database System Utility Rate Details
CDH Energy Corporation 130 September 25, 2008
New York State Electric & Gas
Service Classification 10 – Cogeneration – Secondary (Contract Demand less than 500 kW) – North Region – June 2007 to May 2008 All customers with qualifying (or non-qualifying, as applicable) cogeneration or small power production facilities, with or without the requirement for supplemental service, back-up service, or maintenance service who choose to sell all or any excess energy to the Corporation whether or not engaging in simultaneous purchase, under the appropriate Service Classification, from the Corporation. This rate applies to facilities with less than 500 kW of demand and located in the North NYISO Region. Secondary Service at 120, 120/208, 120/240, 208, 240, 240/416, 277/480, or 480 Volts. Service Charge $ 34.96 Contract Demand Charge2 $ 1.91 per kW of contract demand Energy Charges1 $ per total kWh Hourly Electric Charges See Figure 19
1 – Variable Energy Charges are the hourly Location Based Marginal Price (LBMP) from June 2007 – May 2008 as available at the NYISO website.
2 - The Contract Demand is the Maximum demand import from the utility expected for the customer. Filenames: NYSEG_SC10_Sec_wDem_North_Jun07-May08.CSV, nyseg_north_region_Jun07-May08.dat
Figure 19 Hourly Location Based Marginal Pricing for the North Region from Jun 07 – May 08

NYSERDA DG/CHP Integrated Database System Utility Rate Details
CDH Energy Corporation 131 September 25, 2008
New York State Electric & Gas
Service Classification 10 – Cogeneration – Secondary (Contract Demand larger than 500 kW) – North Region – February 2005 to January 2006 All customers with qualifying (or non-qualifying, as applicable) cogeneration or small power production facilities, with or without the requirement for supplemental service, back-up service, or maintenance service who choose to sell all or any excess energy to the Corporation whether or not engaging in simultaneous purchase, under the appropriate Service Classification, from the Corporation. This rate applies to facilities with a contract demand greater than 500 kW and located in the North NYISO Region. Secondary Service at 120, 120/208, 120/240, 208, 240, 240/416, 277/480, or 480 Volts. Service Charge $ 38.97 Contract Demand Charge2 $ 1.91 per kW of contract demand Energy Charges1 $ per total kWh Hourly Electric Charges See Figure 17
1 – Variable Energy Charges are the hourly Location Based Marginal Price (LBMP) from February 2005 – January 2006 as available at the NYISO website.
2 - The Contract Demand is the Maximum demand import from the utility expected for the customer. Filenames: NYSEG_SC10_Sec_wDem_gt500_North_Feb05-Jan06.CSV, nyseg_north_region_Feb05-Jan06.dat
New York State Electric & Gas
Service Classification 10 – Cogeneration – Secondary (Contract Demand larger than 500 kW) – North Region – October 2005 to September 2006 All customers with qualifying (or non-qualifying, as applicable) cogeneration or small power production facilities, with or without the requirement for supplemental service, back-up service, or maintenance service who choose to sell all or any excess energy to the Corporation whether or not engaging in simultaneous purchase, under the appropriate Service Classification, from the Corporation. This rate applies to facilities with a contract demand greater than 500 kW and located in the North NYISO Region. Secondary Service at 120, 120/208, 120/240, 208, 240, 240/416, 277/480, or 480 Volts. Service Charge $ 38.97 Contract Demand Charge2 $ 1.91 per kW of contract demand Energy Charges1 $ per total kWh Hourly Electric Charges See Figure 18
1 – Variable Energy Charges are the hourly Location Based Marginal Price (LBMP) from February 2005 – January 2006 as available at the NYISO website.
2 - The Contract Demand is the Maximum demand import from the utility expected for the customer. Filenames: NYSEG_SC10_Sec_wDem_gt500_North_Oct05-Sept06.CSV, nyseg_north_region_Oct05-Sept06.dat

NYSERDA DG/CHP Integrated Database System Utility Rate Details
CDH Energy Corporation 132 September 25, 2008
New York State Electric & Gas
Service Classification 10 – Cogeneration – Secondary (Contract Demand larger than 500 kW) – North Region – June 2007 to May 2008 All customers with qualifying (or non-qualifying, as applicable) cogeneration or small power production facilities, with or without the requirement for supplemental service, back-up service, or maintenance service who choose to sell all or any excess energy to the Corporation whether or not engaging in simultaneous purchase, under the appropriate Service Classification, from the Corporation. This rate applies to facilities with a contract demand greater than 500 kW and located in the North NYISO Region. Secondary Service at 120, 120/208, 120/240, 208, 240, 240/416, 277/480, or 480 Volts. Service Charge $ 38.97 Contract Demand Charge2 $ 1.91 per kW of contract demand Energy Charges1 $ per total kWh Hourly Electric Charges See Figure 19
1 – Variable Energy Charges are the hourly Location Based Marginal Price (LBMP) from June 2007 – May 2008 as available at the NYISO website.
2 - The Contract Demand is the Maximum demand import from the utility expected for the customer. Filenames: NYSEG_SC10_Sec_wDem_gt500_North_Jun07-May08.CSV, nyseg_north_region_Jun07-May08.dat
New York State Electric & Gas
Service Classification 10 – Cogeneration – Primary – North Region – February 2005 to January 2006 All customers with qualifying (or non-qualifying, as applicable) cogeneration or small power production facilities, with or without the requirement for supplemental service, back-up service, or maintenance service who choose to sell all or any excess energy to the Corporation whether or not engaging in simultaneous purchase, under the appropriate Service Classification, from the Corporation. This rate applies to facilities with a contract demand greater than 500 kW and located in the North NYISO Region. Primary (Distribution) Service at 2,400, 4,160, 4,800, 7,200, 8,320, 12,000, 12,470, 13,200, or 34,500 (Regulated) Volts. Service Charge $ 50.18 Contract Demand Charge2 $ 1.51 per kW of contract demand Energy Charges1 $ per total kWh Hourly Electric Charges See Figure 17
1 – Variable Energy Charges are the hourly Location Based Marginal Price (LBMP) from February 2005 – January 2006 as available at the NYISO website.
2 - The Contract Demand is the Maximum demand import from the utility expected for the customer. Filenames: NYSEG_SC10_Sec_wDem_gt500_North_Feb05-Jan06.CSV, nyseg_north_region_Feb05-Jan06.dat

NYSERDA DG/CHP Integrated Database System Utility Rate Details
CDH Energy Corporation 133 September 25, 2008
New York State Electric & Gas
Service Classification 10 – Cogeneration – Primary – North Region – October 2005 to September 2006 All customers with qualifying (or non-qualifying, as applicable) cogeneration or small power production facilities, with or without the requirement for supplemental service, back-up service, or maintenance service who choose to sell all or any excess energy to the Corporation whether or not engaging in simultaneous purchase, under the appropriate Service Classification, from the Corporation. This rate applies to facilities with a contract demand greater than 500 kW and located in the North NYISO Region. Primary (Distribution) Service at 2,400, 4,160, 4,800, 7,200, 8,320, 12,000, 12,470, 13,200, or 34,500 (Regulated) Volts. Service Charge $ 50.18 Contract Demand Charge2 $ 1.51 per kW of contract demand Energy Charges1 $ per total kWh Hourly Electric Charges See Figure 18
1 – Variable Energy Charges are the hourly Location Based Marginal Price (LBMP) from February 2005 – January 2006 as available at the NYISO website.
2 - The Contract Demand is the Maximum demand import from the utility expected for the customer. Filenames: NYSEG_SC10_Sec_wDem_gt500_North_Oct05-Sept06.CSV, nyseg_north_region_Oct05-Sept06.dat
New York State Electric & Gas
Service Classification 10 – Cogeneration – Primary – North Region – June 2007 to May 2008 All customers with qualifying (or non-qualifying, as applicable) cogeneration or small power production facilities, with or without the requirement for supplemental service, back-up service, or maintenance service who choose to sell all or any excess energy to the Corporation whether or not engaging in simultaneous purchase, under the appropriate Service Classification, from the Corporation. This rate applies to facilities with a contract demand greater than 500 kW and located in the North NYISO Region. Primary (Distribution) Service at 2,400, 4,160, 4,800, 7,200, 8,320, 12,000, 12,470, 13,200, or 34,500 (Regulated) Volts. Service Charge $ 50.18 Contract Demand Charge2 $ 1.51 per kW of contract demand Energy Charges1 $ per total kWh Hourly Electric Charges See Figure 19
1 – Variable Energy Charges are the hourly Location Based Marginal Price (LBMP) from June 2007 – May 2008 as available at the NYISO website.
2 - The Contract Demand is the Maximum demand import from the utility expected for the customer. Filenames: NYSEG_SC10_Sec_wDem_gt500_North_Jun07-May08.CSV, nyseg_north_region_Jun07-May08.dat

NYSERDA DG/CHP Integrated Database System Utility Rate Details
CDH Energy Corporation 134 September 25, 2008
New York State Electric & Gas
Service Classification 10 – Cogeneration – Secondary (Contract Demand less than 500 kW) – West Region – February 2005 to January 2006 All customers with qualifying (or non-qualifying, as applicable) cogeneration or small power production facilities, with or without the requirement for supplemental service, back-up service, or maintenance service who choose to sell all or any excess energy to the Corporation whether or not engaging in simultaneous purchase, under the appropriate Service Classification, from the Corporation. This rate applies to facilities with less than 500 kW of demand and located in the West NYISO Region. Secondary Service at 120, 120/208, 120/240, 208, 240, 240/416, 277/480, or 480 Volts. Service Charge $ 34.96 Contract Demand Charge2 $ 1.91 per kW of contract demand Energy Charges1 $ per total kWh Hourly Electric Charges See Figure 20
1 – Variable Energy Charges are the hourly Location Based Marginal Price (LBMP) from February 2005 – January 2006 as available at the NYISO website.
2 - The Contract Demand is the Maximum demand import from the utility expected for the customer. Filenames: NYSEG_SC10_Sec_wDem_West_Feb05-Jan06.CSV, nyseg_west_region_Feb05-Jan06.dat
NYISO LBMP for West Region
Jan Feb Mar Apr May Jun Jul Aug Sep Oct Nov Dec0.00
0.05
0.10
0.15
0.20
Hou
rly E
lect
ric R
ates
($/k
Wh)
Figure 20 Hourly Location Based Marginal Pricing for the West Region from Feb 05 - Jan 06

NYSERDA DG/CHP Integrated Database System Utility Rate Details
CDH Energy Corporation 135 September 25, 2008
New York State Electric & Gas
Service Classification 10 – Cogeneration – Secondary (Contract Demand less than 500 kW) – West Region – October 2005 to September 2006 All customers with qualifying (or non-qualifying, as applicable) cogeneration or small power production facilities, with or without the requirement for supplemental service, back-up service, or maintenance service who choose to sell all or any excess energy to the Corporation whether or not engaging in simultaneous purchase, under the appropriate Service Classification, from the Corporation. This rate applies to facilities with less than 500 kW of demand and located in the West NYISO Region. Secondary Service at 120, 120/208, 120/240, 208, 240, 240/416, 277/480, or 480 Volts. Service Charge $ 34.96 Contract Demand Charge2 $ 1.91 per kW of contract demand Energy Charges1 $ per total kWh Hourly Electric Charges See Figure 21
1 – Variable Energy Charges are the hourly Location Based Marginal Price (LBMP) from February 2005 – January 2006 as available at the NYISO website.
2 - The Contract Demand is the Maximum demand import from the utility expected for the customer. Filenames: NYSEG_SC10_Sec_wDem_West_Oct05-Sept06.CSV, nyseg_west_region_Oct05-
Sept06.dat
NYISO LBMP for West Region from Oct05-Sept06
Jan Feb Mar Apr May Jun Jul Aug Sep Oct Nov Dec0.00
0.05
0.10
0.15
0.20
Hou
rly E
lect
ric R
ates
($/k
Wh)
Figure 21 Hourly Location Based Marginal Pricing for the West Region from Oct 05 - Sept 06

NYSERDA DG/CHP Integrated Database System Utility Rate Details
CDH Energy Corporation 136 September 25, 2008
New York State Electric & Gas
Service Classification 10 – Cogeneration – Secondary (Contract Demand less than 500 kW) – West Region – June 2007 to May 2008 All customers with qualifying (or non-qualifying, as applicable) cogeneration or small power production facilities, with or without the requirement for supplemental service, back-up service, or maintenance service who choose to sell all or any excess energy to the Corporation whether or not engaging in simultaneous purchase, under the appropriate Service Classification, from the Corporation. This rate applies to facilities with less than 500 kW of demand and located in the West NYISO Region. Secondary Service at 120, 120/208, 120/240, 208, 240, 240/416, 277/480, or 480 Volts. Service Charge $ 34.96 Contract Demand Charge2 $ 1.91 per kW of contract demand Energy Charges1 $ per total kWh Hourly Electric Charges See Figure 22
1 – Variable Energy Charges are the hourly Location Based Marginal Price (LBMP) from June 2007 – May 2008 as available at the NYISO website.
2 - The Contract Demand is the Maximum demand import from the utility expected for the customer. Filenames: NYSEG_SC10_Sec_wDem_West_Jun07-May08.CSV, nyseg_west_region_June07-May08.dat
Figure 22 Hourly Location Based Marginal Pricing for the West Region from Jun 07 – May 08

NYSERDA DG/CHP Integrated Database System Utility Rate Details
CDH Energy Corporation 137 September 25, 2008
New York State Electric & Gas
Service Classification 10 – Cogeneration – Secondary (Contract Demand larger than 500 kW) – West Region – February 2005 to January 2006 All customers with qualifying (or non-qualifying, as applicable) cogeneration or small power production facilities, with or without the requirement for supplemental service, back-up service, or maintenance service who choose to sell all or any excess energy to the Corporation whether or not engaging in simultaneous purchase, under the appropriate Service Classification, from the Corporation. This rate applies to facilities with a contract demand greater than 500 kW and located in the West NYISO Region. Secondary Service at 120, 120/208, 120/240, 208, 240, 240/416, 277/480, or 480 Volts. Service Charge $ 38.97 Contract Demand Charge2 $ 1.91 per kW of contract demand Energy Charges1 $ per total kWh Hourly Electric Charges See Figure 20
1 – Variable Energy Charges are the hourly Location Based Marginal Price (LBMP) from February 2005 – January 2006 as available at the NYISO website.
2 - The Contract Demand is the Maximum demand import from the utility expected for the customer. Filenames: NYSEG_SC10_Sec_wDem_gt500_West_Feb05-Jan06.CSV, nyseg_west_region_Feb05-Jan06.dat
New York State Electric & Gas
Service Classification 10 – Cogeneration – Secondary (Contract Demand larger than 500 kW) – West Region – October 2005 to September 2006 All customers with qualifying (or non-qualifying, as applicable) cogeneration or small power production facilities, with or without the requirement for supplemental service, back-up service, or maintenance service who choose to sell all or any excess energy to the Corporation whether or not engaging in simultaneous purchase, under the appropriate Service Classification, from the Corporation. This rate applies to facilities with a contract demand greater than 500 kW and located in the West NYISO Region. Secondary Service at 120, 120/208, 120/240, 208, 240, 240/416, 277/480, or 480 Volts. Service Charge $ 38.97 Contract Demand Charge2 $ 1.91 per kW of contract demand Energy Charges1 $ per total kWh Hourly Electric Charges See Figure 21
1 – Variable Energy Charges are the hourly Location Based Marginal Price (LBMP) from February 2005 – January 2006 as available at the NYISO website.
2 - The Contract Demand is the Maximum demand import from the utility expected for the customer. Filenames: NYSEG_SC10_Sec_wDem_gt500_West_Oct05-Sept06.CSV, nyseg_west_region_Oct05-Sept06.dat

NYSERDA DG/CHP Integrated Database System Utility Rate Details
CDH Energy Corporation 138 September 25, 2008
New York State Electric & Gas
Service Classification 10 – Cogeneration – Secondary (Contract Demand larger than 500 kW) – West Region – June 2007 to May 2008 All customers with qualifying (or non-qualifying, as applicable) cogeneration or small power production facilities, with or without the requirement for supplemental service, back-up service, or maintenance service who choose to sell all or any excess energy to the Corporation whether or not engaging in simultaneous purchase, under the appropriate Service Classification, from the Corporation. This rate applies to facilities with a contract demand greater than 500 kW and located in the West NYISO Region. Secondary Service at 120, 120/208, 120/240, 208, 240, 240/416, 277/480, or 480 Volts. Service Charge $ 38.97 Contract Demand Charge2 $ 1.91 per kW of contract demand Energy Charges1 $ per total kWh Hourly Electric Charges See Figure 22
1 – Variable Energy Charges are the hourly Location Based Marginal Price (LBMP) from June 2007 – May 2008 as available at the NYISO website.
2 - The Contract Demand is the Maximum demand import from the utility expected for the customer. Filenames: NYSEG_SC10_Sec_wDem_gt500_West_Jun07-May08.CSV, nyseg_west_region_Jun07-May08.dat
New York State Electric & Gas
Service Classification 10 – Cogeneration – Primary – West Region – February 2005 to January 2006 All customers with qualifying (or non-qualifying, as applicable) cogeneration or small power production facilities, with or without the requirement for supplemental service, back-up service, or maintenance service who choose to sell all or any excess energy to the Corporation whether or not engaging in simultaneous purchase, under the appropriate Service Classification, from the Corporation. This rate applies to facilities with a contract demand greater than 500 kW and located in the West NYISO Region. Primary (Distribution) Service at 2,400, 4,160, 4,800, 7,200, 8,320, 12,000, 12,470, 13,200, or 34,500 (Regulated) Volts. Service Charge $ 50.18 Contract Demand Charge2 $ 1.51 per kW of contract demand Energy Charges1 $ per total kWh Hourly Electric Charges See Figure 20
1 – Variable Energy Charges are the hourly Location Based Marginal Price (LBMP) from February 2005 – January 2006 as available at the NYISO website.
2 - The Contract Demand is the Maximum demand import from the utility expected for the customer. Filenames: NYSEG_SC10_Sec_wDem_gt500_West_Feb05-Jan06.CSV, nyseg_west_region_Feb05-Jan06.dat

NYSERDA DG/CHP Integrated Database System Utility Rate Details
CDH Energy Corporation 139 September 25, 2008
New York State Electric & Gas
Service Classification 10 – Cogeneration – Primary – West Region – October 2005 to September 2006 All customers with qualifying (or non-qualifying, as applicable) cogeneration or small power production facilities, with or without the requirement for supplemental service, back-up service, or maintenance service who choose to sell all or any excess energy to the Corporation whether or not engaging in simultaneous purchase, under the appropriate Service Classification, from the Corporation. This rate applies to facilities with a contract demand greater than 500 kW and located in the West NYISO Region. Primary (Distribution) Service at 2,400, 4,160, 4,800, 7,200, 8,320, 12,000, 12,470, 13,200, or 34,500 (Regulated) Volts. Service Charge $ 50.18 Contract Demand Charge2 $ 1.51 per kW of contract demand Energy Charges1 $ per total kWh Hourly Electric Charges See Figure 21
1 – Variable Energy Charges are the hourly Location Based Marginal Price (LBMP) from February 2005 – January 2006 as available at the NYISO website.
2 - The Contract Demand is the Maximum demand import from the utility expected for the customer. Filenames: NYSEG_SC10_Sec_wDem_gt500_West_Oct05-Sept06.CSV, nyseg_west_region_Oct05-Sept06.dat
New York State Electric & Gas
Service Classification 10 – Cogeneration – Primary – West Region – June 2007 to May 2008 All customers with qualifying (or non-qualifying, as applicable) cogeneration or small power production facilities, with or without the requirement for supplemental service, back-up service, or maintenance service who choose to sell all or any excess energy to the Corporation whether or not engaging in simultaneous purchase, under the appropriate Service Classification, from the Corporation. This rate applies to facilities with a contract demand greater than 500 kW and located in the West NYISO Region. Primary (Distribution) Service at 2,400, 4,160, 4,800, 7,200, 8,320, 12,000, 12,470, 13,200, or 34,500 (Regulated) Volts. Service Charge $ 50.18 Contract Demand Charge2 $ 1.51 per kW of contract demand Energy Charges1 $ per total kWh Hourly Electric Charges See Figure 22
1 – Variable Energy Charges are the hourly Location Based Marginal Price (LBMP) from June 2007 – May 2008as available at the NYISO website.
2 - The Contract Demand is the Maximum demand import from the utility expected for the customer. Filenames: NYSEG_SC10_Sec_wDem_gt500_West_Jun07-May08.CSV, nyseg_west_region_Jun07-
May08.dat

NYSERDA DG/CHP Integrated Database System Utility Rate Details
CDH Energy Corporation 140 September 25, 2008
New York State Electric & Gas
Service Classification 11 – Standby – Based on SC2 Variable Pricing Option – Capital Region – February 2005 to January 2006 Delivery of standby service for any customer where all or a portion of a customer's electricity is supplied from On-Site Generating facilities (“OSG”) without using the Company’s delivery system (defined as the distribution and/or transmission system, regardless of voltage or functional classification). An OSG, whether owned by the customer or a third party, can produce electricity primarily to serve the customer’s native load, to sell in the wholesale market or to carry out a combination thereof. Such OSG may be connected with the Company’s delivery system for parallel operation, or operate under the control of a single pull, double-throw switch (or similar device). For customers with multiple electrical services, this tariff applies to each of the customer’s electrical services that are not electrically isolated from the OSG. All separately metered electricity supply and/or delivery service not otherwise served by the OSG (e.g., separate delivery service to the facility’s guardhouse or other facilities electrically isolated from the OSG) will be provided under the Otherwise Applicable Service Classification (“OASC”). This rate applies to facilities located in the Capital NYISO Region. Service Charge $ 45.79 (Delivery and Transition Charges) Contract Demand Charge2 $ 5.38 per kW of contract demand (Delivery and Transition Charges) Reactive Energy Charge $ 0.000950 / RkVAh in excess of 33% total energy in kWh Demand Charges $ 0.20642 per daily peak kW (Delivery and Transition Charges) Energy Charges $ per total kWh System Benefits and Renewable Portfolio Charge $ 0.00160 per kWh Hourly Electric Charges See Figure 2
1 – Variable Energy Charges are the hourly Location Based Marginal Price (LBMP) from February 2005 – January 2006 as available at the NYISO website.
2 - The Contract Demand is the Maximum demand import from the utility expected for the customer. Filenames: NYSEG_SC11_SC2_VRO_Capital_Feb05-Jan06.CSV, nyseg_capital_region_Feb05-
Jan06.dat

NYSERDA DG/CHP Integrated Database System Utility Rate Details
CDH Energy Corporation 141 September 25, 2008
New York State Electric & Gas
Service Classification 11 – Standby – Based on SC2 Variable Pricing Option – Capital Region – October 2005 to September 2006 Delivery of standby service for any customer where all or a portion of a customer's electricity is supplied from On-Site Generating facilities (“OSG”) without using the Company’s delivery system (defined as the distribution and/or transmission system, regardless of voltage or functional classification). An OSG, whether owned by the customer or a third party, can produce electricity primarily to serve the customer’s native load, to sell in the wholesale market or to carry out a combination thereof. Such OSG may be connected with the Company’s delivery system for parallel operation, or operate under the control of a single pull, double-throw switch (or similar device). For customers with multiple electrical services, this tariff applies to each of the customer’s electrical services that are not electrically isolated from the OSG. All separately metered electricity supply and/or delivery service not otherwise served by the OSG (e.g., separate delivery service to the facility’s guardhouse or other facilities electrically isolated from the OSG) will be provided under the Otherwise Applicable Service Classification (“OASC”). This rate applies to facilities located in the Capital NYISO Region. Service Charge $ 45.79 (Delivery and Transition Charges) Contract Demand Charge2 $ 5.38 per kW of contract demand (Delivery and Transition Charges) Reactive Energy Charge $ 0.000950 / RkVAh in excess of 33% total energy in kWh Demand Charges $ 0.20642 per daily peak kW (Delivery and Transition Charges) Energy Charges $ per total kWh System Benefits and Renewable Portfolio Charge $ 0.00160 per kWh Hourly Electric Charges See Figure 3
1 – Variable Energy Charges are the hourly Location Based Marginal Price (LBMP) from February 2005 – January 2006 as available at the NYISO website.
2 - The Contract Demand is the Maximum demand import from the utility expected for the customer. Filenames: NYSEG_SC11_SC2_VRO_Capital_Oct05-Sept06.CSV, nyseg_capital_region_Oct05-
Sept06.dat

NYSERDA DG/CHP Integrated Database System Utility Rate Details
CDH Energy Corporation 142 September 25, 2008
New York State Electric & Gas
Service Classification 11 – Standby – Based on SC2 Variable Pricing Option – Capital Region – July 2007 to June 2008 Delivery of standby service for any customer where all or a portion of a customer's electricity is supplied from On-Site Generating facilities (“OSG”) without using the Company’s delivery system (defined as the distribution and/or transmission system, regardless of voltage or functional classification). An OSG, whether owned by the customer or a third party, can produce electricity primarily to serve the customer’s native load, to sell in the wholesale market or to carry out a combination thereof. Such OSG may be connected with the Company’s delivery system for parallel operation, or operate under the control of a single pull, double-throw switch (or similar device). For customers with multiple electrical services, this tariff applies to each of the customer’s electrical services that are not electrically isolated from the OSG. All separately metered electricity supply and/or delivery service not otherwise served by the OSG (e.g., separate delivery service to the facility’s guardhouse or other facilities electrically isolated from the OSG) will be provided under the Otherwise Applicable Service Classification (“OASC”). This rate applies to facilities located in the Capital NYISO Region. Service Charge $ 22.95 (Delivery and Transition Charges) Contract Demand Charge2 $ 4.79 per kW of contract demand (Delivery and Transition Charges) Reactive Energy Charge $ 0.000950 / RkVAh in excess of 33% total energy in kWh Demand Charges $ 0.2188 per daily peak kW (Delivery and Transition Charges) Energy Charges $ per total kWh System Benefits and Renewable Portfolio Charge $ 0.00200 per kWh Hourly Electric Charges See Figure 4
1 – Variable Energy Charges are the hourly Location Based Marginal Price (LBMP) from February 2005 – January 2006 as available at the NYISO website.
2 - The Contract Demand is the Maximum demand import from the utility expected for the customer. Filenames: NYSEG_SC11_SC2_VRO_Capital_Jul07-Jun08.CSV, nyseg_capital_region_Oct05-
Sept06.dat

NYSERDA DG/CHP Integrated Database System Utility Rate Details
CDH Energy Corporation 143 September 25, 2008
New York State Electric & Gas
Service Classification 11 – Standby – Based on SC2 Variable Pricing Option – Central Region – February 2005 to January 2006 Delivery of standby service for any customer where all or a portion of a customer's electricity is supplied from On-Site Generating facilities (“OSG”) without using the Company’s delivery system (defined as the distribution and/or transmission system, regardless of voltage or functional classification). An OSG, whether owned by the customer or a third party, can produce electricity primarily to serve the customer’s native load, to sell in the wholesale market or to carry out a combination thereof. Such OSG may be connected with the Company’s delivery system for parallel operation, or operate under the control of a single pull, double-throw switch (or similar device). For customers with multiple electrical services, this tariff applies to each of the customer’s electrical services that are not electrically isolated from the OSG. All separately metered electricity supply and/or delivery service not otherwise served by the OSG (e.g., separate delivery service to the facility’s guardhouse or other facilities electrically isolated from the OSG) will be provided under the Otherwise Applicable Service Classification (“OASC”). This rate applies to facilities located in the Central NYISO Region. Service Charge $ 45.79 (Delivery and Transition Charges) Contract Demand Charge2 $ 5.38 per kW of contract demand (Delivery and Transition Charges) Reactive Energy Charge $ 0.000950 / RkVAh in excess of 33% total energy in kWh Demand Charges $ 0.20642 per daily peak kW (Delivery and Transition Charges) Energy Charges $ per total kWh System Benefits and Renewable Portfolio Charge $ 0.00160 per kWh Hourly Electric Charges See Figure 5
1 – Variable Energy Charges are the hourly Location Based Marginal Price (LBMP) from February 2005 – January 2006 as available at the NYISO website.
2 - The Contract Demand is the Maximum demand import from the utility expected for the customer. Filenames: NYSEG_SC11_SC2_VRO_Central_Feb05-Jan06.CSV, nyseg_central_region_Feb05-
Jan06.dat

NYSERDA DG/CHP Integrated Database System Utility Rate Details
CDH Energy Corporation 144 September 25, 2008
New York State Electric & Gas
Service Classification 11 – Standby – Based on SC2 Variable Pricing Option – Central Region – October 2005 to September 2006 Delivery of standby service for any customer where all or a portion of a customer's electricity is supplied from On-Site Generating facilities (“OSG”) without using the Company’s delivery system (defined as the distribution and/or transmission system, regardless of voltage or functional classification). An OSG, whether owned by the customer or a third party, can produce electricity primarily to serve the customer’s native load, to sell in the wholesale market or to carry out a combination thereof. Such OSG may be connected with the Company’s delivery system for parallel operation, or operate under the control of a single pull, double-throw switch (or similar device). For customers with multiple electrical services, this tariff applies to each of the customer’s electrical services that are not electrically isolated from the OSG. All separately metered electricity supply and/or delivery service not otherwise served by the OSG (e.g., separate delivery service to the facility’s guardhouse or other facilities electrically isolated from the OSG) will be provided under the Otherwise Applicable Service Classification (“OASC”). This rate applies to facilities located in the Central NYISO Region. Service Charge $ 45.79 (Delivery and Transition Charges) Contract Demand Charge2 $ 5.38 per kW of contract demand (Delivery and Transition Charges) Reactive Energy Charge $ 0.000950 / RkVAh in excess of 33% total energy in kWh Demand Charges $ 0.20642 per daily peak kW (Delivery and Transition Charges) Energy Charges $ per total kWh System Benefits and Renewable Portfolio Charge $ 0.00160 per kWh Hourly Electric Charges See Figure 6
1 – Variable Energy Charges are the hourly Location Based Marginal Price (LBMP) from February 2005 – January 2006 as available at the NYISO website.
2 - The Contract Demand is the Maximum demand import from the utility expected for the customer. Filenames: NYSEG_SC11_SC2_VRO_Central_Oct05-Sept06.CSV, nyseg_central_region_Oct05-
Sept06.dat

NYSERDA DG/CHP Integrated Database System Utility Rate Details
CDH Energy Corporation 145 September 25, 2008
New York State Electric & Gas
Service Classification 11 – Standby – Based on SC2 Variable Pricing Option – Central Region – July 2007 to June 2008 Delivery of standby service for any customer where all or a portion of a customer's electricity is supplied from On-Site Generating facilities (“OSG”) without using the Company’s delivery system (defined as the distribution and/or transmission system, regardless of voltage or functional classification). An OSG, whether owned by the customer or a third party, can produce electricity primarily to serve the customer’s native load, to sell in the wholesale market or to carry out a combination thereof. Such OSG may be connected with the Company’s delivery system for parallel operation, or operate under the control of a single pull, double-throw switch (or similar device). For customers with multiple electrical services, this tariff applies to each of the customer’s electrical services that are not electrically isolated from the OSG. All separately metered electricity supply and/or delivery service not otherwise served by the OSG (e.g., separate delivery service to the facility’s guardhouse or other facilities electrically isolated from the OSG) will be provided under the Otherwise Applicable Service Classification (“OASC”). This rate applies to facilities located in the Central NYISO Region. Service Charge $ 22.95 (Delivery and Transition Charges) Contract Demand Charge2 $ 4.79 per kW of contract demand (Delivery and Transition Charges) Reactive Energy Charge $ 0.000950 / RkVAh in excess of 33% total energy in kWh Demand Charges $ 0.21880 per daily peak kW (Delivery and Transition Charges) Energy Charges $ per total kWh System Benefits and Renewable Portfolio Charge $ 0.00200 per kWh Hourly Electric Charges See Figure 7
1 – Variable Energy Charges are the hourly Location Based Marginal Price (LBMP) from February 2005 – January 2006 as available at the NYISO website.
2 - The Contract Demand is the Maximum demand import from the utility expected for the customer. Filenames: NYSEG_SC11_SC2_VRO_Central_Jul07-Jun08.CSV, nyseg_central_region_Oct05-
Sept06.dat

NYSERDA DG/CHP Integrated Database System Utility Rate Details
CDH Energy Corporation 146 September 25, 2008
New York State Electric & Gas
Service Classification 11 – Standby – Based on SC2 Variable Pricing Option – Genesee Region – February 2005 to January 2006 Delivery of standby service for any customer where all or a portion of a customer's electricity is supplied from On-Site Generating facilities (“OSG”) without using the Company’s delivery system (defined as the distribution and/or transmission system, regardless of voltage or functional classification). An OSG, whether owned by the customer or a third party, can produce electricity primarily to serve the customer’s native load, to sell in the wholesale market or to carry out a combination thereof. Such OSG may be connected with the Company’s delivery system for parallel operation, or operate under the control of a single pull, double-throw switch (or similar device). For customers with multiple electrical services, this tariff applies to each of the customer’s electrical services that are not electrically isolated from the OSG. All separately metered electricity supply and/or delivery service not otherwise served by the OSG (e.g., separate delivery service to the facility’s guardhouse or other facilities electrically isolated from the OSG) will be provided under the Otherwise Applicable Service Classification (“OASC”). This rate applies to facilities located in the Genesee NYISO Region. Service Charge $ 45.79 (Delivery and Transition Charges) Contract Demand Charge2 $ 5.38 per kW of contract demand (Delivery and Transition Charges) Reactive Energy Charge $ 0.000950 / RkVAh in excess of 33% total energy in kWh Demand Charges $ 0.20642 per daily peak kW (Delivery and Transition Charges) Energy Charges $ per total kWh System Benefits and Renewable Portfolio Charge $ 0.00160 per kWh Hourly Electric Charges See Figure 8
1 – Variable Energy Charges are the hourly Location Based Marginal Price (LBMP) from February 2005 – January 2006 as available at the NYISO website.
2 - The Contract Demand is the Maximum demand import from the utility expected for the customer. Filenames: NYSEG_SC11_SC2_VRO_Genesee_Feb05-Jan06.CSV, nyseg_genesee_region_Feb05-
Jan06.dat

NYSERDA DG/CHP Integrated Database System Utility Rate Details
CDH Energy Corporation 147 September 25, 2008
New York State Electric & Gas
Service Classification 11 – Standby – Based on SC2 Variable Pricing Option – Genesee Region – October 2005 to September 2006 Delivery of standby service for any customer where all or a portion of a customer's electricity is supplied from On-Site Generating facilities (“OSG”) without using the Company’s delivery system (defined as the distribution and/or transmission system, regardless of voltage or functional classification). An OSG, whether owned by the customer or a third party, can produce electricity primarily to serve the customer’s native load, to sell in the wholesale market or to carry out a combination thereof. Such OSG may be connected with the Company’s delivery system for parallel operation, or operate under the control of a single pull, double-throw switch (or similar device). For customers with multiple electrical services, this tariff applies to each of the customer’s electrical services that are not electrically isolated from the OSG. All separately metered electricity supply and/or delivery service not otherwise served by the OSG (e.g., separate delivery service to the facility’s guardhouse or other facilities electrically isolated from the OSG) will be provided under the Otherwise Applicable Service Classification (“OASC”). This rate applies to facilities located in the Genesee NYISO Region. Service Charge $ 45.79 (Delivery and Transition Charges) Contract Demand Charge2 $ 5.38 per kW of contract demand (Delivery and Transition Charges) Reactive Energy Charge $ 0.000950 / RkVAh in excess of 33% total energy in kWh Demand Charges $ 0.20642 per daily peak kW (Delivery and Transition Charges) Energy Charges $ per total kWh System Benefits and Renewable Portfolio Charge $ 0.00160 per kWh Hourly Electric Charges See Figure 9
1 – Variable Energy Charges are the hourly Location Based Marginal Price (LBMP) from February 2005 – January 2006 as available at the NYISO website.
2 - The Contract Demand is the Maximum demand import from the utility expected for the customer. Filenames: NYSEG_SC11_SC2_VRO_Genesee_Oct05-Sept06.CSV, nyseg_genesee_region_Oct05-
Sept06.dat

NYSERDA DG/CHP Integrated Database System Utility Rate Details
CDH Energy Corporation 148 September 25, 2008
New York State Electric & Gas
Service Classification 11 – Standby – Based on SC2 Variable Pricing Option – Genesee Region – July 2007 to June 2008 Delivery of standby service for any customer where all or a portion of a customer's electricity is supplied from On-Site Generating facilities (“OSG”) without using the Company’s delivery system (defined as the distribution and/or transmission system, regardless of voltage or functional classification). An OSG, whether owned by the customer or a third party, can produce electricity primarily to serve the customer’s native load, to sell in the wholesale market or to carry out a combination thereof. Such OSG may be connected with the Company’s delivery system for parallel operation, or operate under the control of a single pull, double-throw switch (or similar device). For customers with multiple electrical services, this tariff applies to each of the customer’s electrical services that are not electrically isolated from the OSG. All separately metered electricity supply and/or delivery service not otherwise served by the OSG (e.g., separate delivery service to the facility’s guardhouse or other facilities electrically isolated from the OSG) will be provided under the Otherwise Applicable Service Classification (“OASC”). This rate applies to facilities located in the Genesee NYISO Region. Service Charge $ 22.95 (Delivery and Transition Charges) Contract Demand Charge2 $ 4.79 per kW of contract demand (Delivery and Transition Charges) Reactive Energy Charge $ 0.000950 / RkVAh in excess of 33% total energy in kWh Demand Charges $ 0.2188 per daily peak kW (Delivery and Transition Charges) Energy Charges $ per total kWh System Benefits and Renewable Portfolio Charge $ 0.00200 per kWh Hourly Electric Charges See Figure 10
1 – Variable Energy Charges are the hourly Location Based Marginal Price (LBMP) from February 2005 – January 2006 as available at the NYISO website.
2 - The Contract Demand is the Maximum demand import from the utility expected for the customer. Filenames: NYSEG_SC11_SC2_VRO_Genesee_Jul07-Jun08.CSV, nyseg_genesee_region_Oct05-
Sept06.dat

NYSERDA DG/CHP Integrated Database System Utility Rate Details
CDH Energy Corporation 149 September 25, 2008
New York State Electric & Gas
Service Classification 11 – Standby – Based on SC2 Variable Pricing Option – Hudson Region – February 2005 to January 2006 Delivery of standby service for any customer where all or a portion of a customer's electricity is supplied from On-Site Generating facilities (“OSG”) without using the Company’s delivery system (defined as the distribution and/or transmission system, regardless of voltage or functional classification). An OSG, whether owned by the customer or a third party, can produce electricity primarily to serve the customer’s native load, to sell in the wholesale market or to carry out a combination thereof. Such OSG may be connected with the Company’s delivery system for parallel operation, or operate under the control of a single pull, double-throw switch (or similar device). For customers with multiple electrical services, this tariff applies to each of the customer’s electrical services that are not electrically isolated from the OSG. All separately metered electricity supply and/or delivery service not otherwise served by the OSG (e.g., separate delivery service to the facility’s guardhouse or other facilities electrically isolated from the OSG) will be provided under the Otherwise Applicable Service Classification (“OASC”). This rate applies to facilities located in the Hudson Valley NYISO Region. Service Charge $ 45.79 (Delivery and Transition Charges) Contract Demand Charge2 $ 5.38 per kW of contract demand (Delivery and Transition Charges) Reactive Energy Charge $ 0.000950 / RkVAh in excess of 33% total energy in kWh Demand Charges $ 0.20642 per daily peak kW (Delivery and Transition Charges) Energy Charges $ per total kWh System Benefits and Renewable Portfolio Charge $ 0.00160 per kWh Hourly Electric Charges See Figure 11
1 – Variable Energy Charges are the hourly Location Based Marginal Price (LBMP) from February 2005 – January 2006 as available at the NYISO website.
2 - The Contract Demand is the Maximum demand import from the utility expected for the customer. Filenames: NYSEG_SC11_SC2_VRO_Hudson_Feb05-Jan06.CSV,
nyseg_hudson_valley_region_Feb05-Jan06.dat

NYSERDA DG/CHP Integrated Database System Utility Rate Details
CDH Energy Corporation 150 September 25, 2008
New York State Electric & Gas
Service Classification 11 – Standby – Based on SC2 Variable Pricing Option – Hudson Region – October 2005 to September 2006 Delivery of standby service for any customer where all or a portion of a customer's electricity is supplied from On-Site Generating facilities (“OSG”) without using the Company’s delivery system (defined as the distribution and/or transmission system, regardless of voltage or functional classification). An OSG, whether owned by the customer or a third party, can produce electricity primarily to serve the customer’s native load, to sell in the wholesale market or to carry out a combination thereof. Such OSG may be connected with the Company’s delivery system for parallel operation, or operate under the control of a single pull, double-throw switch (or similar device). For customers with multiple electrical services, this tariff applies to each of the customer’s electrical services that are not electrically isolated from the OSG. All separately metered electricity supply and/or delivery service not otherwise served by the OSG (e.g., separate delivery service to the facility’s guardhouse or other facilities electrically isolated from the OSG) will be provided under the Otherwise Applicable Service Classification (“OASC”). This rate applies to facilities located in the Hudson Valley NYISO Region. Service Charge $ 45.79 (Delivery and Transition Charges) Contract Demand Charge2 $ 5.38 per kW of contract demand (Delivery and Transition Charges) Reactive Energy Charge $ 0.000950 / RkVAh in excess of 33% total energy in kWh Demand Charges $ 0.20642 per daily peak kW (Delivery and Transition Charges) Energy Charges $ per total kWh System Benefits and Renewable Portfolio Charge $ 0.00160 per kWh Hourly Electric Charges See Figure 12
1 – Variable Energy Charges are the hourly Location Based Marginal Price (LBMP) from February 2005 – January 2006 as available at the NYISO website.
2 - The Contract Demand is the Maximum demand import from the utility expected for the customer. Filenames: NYSEG_SC11_SC2_VRO_Hudson_Oct05-Sept06.CSV,
nyseg_hudson_valley_region_Oct05-Sept06.dat

NYSERDA DG/CHP Integrated Database System Utility Rate Details
CDH Energy Corporation 151 September 25, 2008
New York State Electric & Gas
Service Classification 11 – Standby – Based on SC2 Variable Pricing Option – Hudson Region – July 2007 to June 2008 Delivery of standby service for any customer where all or a portion of a customer's electricity is supplied from On-Site Generating facilities (“OSG”) without using the Company’s delivery system (defined as the distribution and/or transmission system, regardless of voltage or functional classification). An OSG, whether owned by the customer or a third party, can produce electricity primarily to serve the customer’s native load, to sell in the wholesale market or to carry out a combination thereof. Such OSG may be connected with the Company’s delivery system for parallel operation, or operate under the control of a single pull, double-throw switch (or similar device). For customers with multiple electrical services, this tariff applies to each of the customer’s electrical services that are not electrically isolated from the OSG. All separately metered electricity supply and/or delivery service not otherwise served by the OSG (e.g., separate delivery service to the facility’s guardhouse or other facilities electrically isolated from the OSG) will be provided under the Otherwise Applicable Service Classification (“OASC”). This rate applies to facilities located in the Hudson Valley NYISO Region. Service Charge $ 22.95 (Delivery and Transition Charges) Contract Demand Charge2 $ 4.79 per kW of contract demand (Delivery and Transition Charges) Reactive Energy Charge $ 0.000950 / RkVAh in excess of 33% total energy in kWh Demand Charges $ 0.2188 per daily peak kW (Delivery and Transition Charges) Energy Charges $ per total kWh System Benefits and Renewable Portfolio Charge $ 0.00200 per kWh Hourly Electric Charges See Figure 13
1 – Variable Energy Charges are the hourly Location Based Marginal Price (LBMP) from February 2005 – January 2006 as available at the NYISO website.
2 - The Contract Demand is the Maximum demand import from the utility expected for the customer. Filenames: NYSEG_SC11_SC2_VRO_Hudson_Jul07-Jun08.CSV, nyseg_hudson_valley_region_Oct05-
Sept06.dat

NYSERDA DG/CHP Integrated Database System Utility Rate Details
CDH Energy Corporation 152 September 25, 2008
New York State Electric & Gas
Service Classification 11 – Standby – Based on SC2 Variable Pricing Option – Mohawk Region – February 2005 to January 2006 Delivery of standby service for any customer where all or a portion of a customer's electricity is supplied from On-Site Generating facilities (“OSG”) without using the Company’s delivery system (defined as the distribution and/or transmission system, regardless of voltage or functional classification). An OSG, whether owned by the customer or a third party, can produce electricity primarily to serve the customer’s native load, to sell in the wholesale market or to carry out a combination thereof. Such OSG may be connected with the Company’s delivery system for parallel operation, or operate under the control of a single pull, double-throw switch (or similar device). For customers with multiple electrical services, this tariff applies to each of the customer’s electrical services that are not electrically isolated from the OSG. All separately metered electricity supply and/or delivery service not otherwise served by the OSG (e.g., separate delivery service to the facility’s guardhouse or other facilities electrically isolated from the OSG) will be provided under the Otherwise Applicable Service Classification (“OASC”). This rate applies to facilities located in the Mohawk Valley NYISO Region. Service Charge $ 45.79 (Delivery and Transition Charges) Contract Demand Charge2 $ 5.38 per kW of contract demand (Delivery and Transition Charges) Reactive Energy Charge $ 0.000950 / RkVAh in excess of 33% total energy in kWh Demand Charges $ 0.20642 per daily peak kW (Delivery and Transition Charges) Energy Charges $ per total kWh System Benefits and Renewable Portfolio Charge $ 0.00160 per kWh Hourly Electric Charges See Figure 14
1 – Variable Energy Charges are the hourly Location Based Marginal Price (LBMP) from February 2005 – January 2006 as available at the NYISO website.
2 - The Contract Demand is the Maximum demand import from the utility expected for the customer. Filenames: NYSEG_SC11_SC2_VRO_Mohawk_Feb05-Jan06.CSV,
nyseg_mohawk_valley_region_Feb05-Jan06.dat

NYSERDA DG/CHP Integrated Database System Utility Rate Details
CDH Energy Corporation 153 September 25, 2008
New York State Electric & Gas
Service Classification 11 – Standby – Based on SC2 Variable Pricing Option – Mohawk Region – October 2005 to September 2006 Delivery of standby service for any customer where all or a portion of a customer's electricity is supplied from On-Site Generating facilities (“OSG”) without using the Company’s delivery system (defined as the distribution and/or transmission system, regardless of voltage or functional classification). An OSG, whether owned by the customer or a third party, can produce electricity primarily to serve the customer’s native load, to sell in the wholesale market or to carry out a combination thereof. Such OSG may be connected with the Company’s delivery system for parallel operation, or operate under the control of a single pull, double-throw switch (or similar device). For customers with multiple electrical services, this tariff applies to each of the customer’s electrical services that are not electrically isolated from the OSG. All separately metered electricity supply and/or delivery service not otherwise served by the OSG (e.g., separate delivery service to the facility’s guardhouse or other facilities electrically isolated from the OSG) will be provided under the Otherwise Applicable Service Classification (“OASC”). This rate applies to facilities located in the Mohawk Valley NYISO Region. Service Charge $ 45.79 (Delivery and Transition Charges) Contract Demand Charge2 $ 5.38 per kW of contract demand (Delivery and Transition Charges) Reactive Energy Charge $ 0.000950 / RkVAh in excess of 33% total energy in kWh Demand Charges $ 0.20642 per daily peak kW (Delivery and Transition Charges) Energy Charges $ per total kWh System Benefits and Renewable Portfolio Charge $ 0.00160 per kWh Hourly Electric Charges See Figure 15
1 – Variable Energy Charges are the hourly Location Based Marginal Price (LBMP) from February 2005 – January 2006 as available at the NYISO website.
2 - The Contract Demand is the Maximum demand import from the utility expected for the customer. Filenames: NYSEG_SC11_SC2_VRO_Mohawk_Oct05-Sept06.CSV,
nyseg_mohawk_valley_region_Oct05-Sept06.dat

NYSERDA DG/CHP Integrated Database System Utility Rate Details
CDH Energy Corporation 154 September 25, 2008
New York State Electric & Gas
Service Classification 11 – Standby – Based on SC2 Variable Pricing Option – Mohawk Region – July 2007 to June 2008 Delivery of standby service for any customer where all or a portion of a customer's electricity is supplied from On-Site Generating facilities (“OSG”) without using the Company’s delivery system (defined as the distribution and/or transmission system, regardless of voltage or functional classification). An OSG, whether owned by the customer or a third party, can produce electricity primarily to serve the customer’s native load, to sell in the wholesale market or to carry out a combination thereof. Such OSG may be connected with the Company’s delivery system for parallel operation, or operate under the control of a single pull, double-throw switch (or similar device). For customers with multiple electrical services, this tariff applies to each of the customer’s electrical services that are not electrically isolated from the OSG. All separately metered electricity supply and/or delivery service not otherwise served by the OSG (e.g., separate delivery service to the facility’s guardhouse or other facilities electrically isolated from the OSG) will be provided under the Otherwise Applicable Service Classification (“OASC”). This rate applies to facilities located in the Mohawk Valley NYISO Region. Service Charge $ 22.95 (Delivery and Transition Charges) Contract Demand Charge2 $ 4.79 per kW of contract demand (Delivery and Transition Charges) Reactive Energy Charge $ 0.000950 / RkVAh in excess of 33% total energy in kWh Demand Charges $ 0.2188 per daily peak kW (Delivery and Transition Charges) Energy Charges $ per total kWh System Benefits and Renewable Portfolio Charge $ 0.00200 per kWh Hourly Electric Charges See Figure 16
1 – Variable Energy Charges are the hourly Location Based Marginal Price (LBMP) from February 2005 – January 2006 as available at the NYISO website.
2 - The Contract Demand is the Maximum demand import from the utility expected for the customer. Filenames: NYSEG_SC11_SC2_VRO_Mohawk_Jul07-Jun08.CSV,
nyseg_mohawk_valley_region_Oct05-Sept06.dat

NYSERDA DG/CHP Integrated Database System Utility Rate Details
CDH Energy Corporation 155 September 25, 2008
New York State Electric & Gas
Service Classification 11 – Standby – Based on SC2 Variable Pricing Option – North Region – February 2005 to January 2006 Delivery of standby service for any customer where all or a portion of a customer's electricity is supplied from On-Site Generating facilities (“OSG”) without using the Company’s delivery system (defined as the distribution and/or transmission system, regardless of voltage or functional classification). An OSG, whether owned by the customer or a third party, can produce electricity primarily to serve the customer’s native load, to sell in the wholesale market or to carry out a combination thereof. Such OSG may be connected with the Company’s delivery system for parallel operation, or operate under the control of a single pull, double-throw switch (or similar device). For customers with multiple electrical services, this tariff applies to each of the customer’s electrical services that are not electrically isolated from the OSG. All separately metered electricity supply and/or delivery service not otherwise served by the OSG (e.g., separate delivery service to the facility’s guardhouse or other facilities electrically isolated from the OSG) will be provided under the Otherwise Applicable Service Classification (“OASC”). This rate applies to facilities located in the North NYISO Region. Service Charge $ 45.79 (Delivery and Transition Charges) Contract Demand Charge2 $ 5.38 per kW of contract demand (Delivery and Transition Charges) Reactive Energy Charge $ 0.000950 / RkVAh in excess of 33% total energy in kWh Demand Charges $ 0.20642 per daily peak kW (Delivery and Transition Charges) Energy Charges $ per total kWh System Benefits and Renewable Portfolio Charge $ 0.00160 per kWh Hourly Electric Charges See Figure 17
1 – Variable Energy Charges are the hourly Location Based Marginal Price (LBMP) from February 2005 – January 2006 as available at the NYISO website.
2 - The Contract Demand is the Maximum demand import from the utility expected for the customer. Filenames: NYSEG_SC11_SC2_VRO_North_Feb05-Jan06.CSV, nyseg_north_region_Feb05-Jan06.dat

NYSERDA DG/CHP Integrated Database System Utility Rate Details
CDH Energy Corporation 156 September 25, 2008
New York State Electric & Gas
Service Classification 11 – Standby – Based on SC2 Variable Pricing Option – North Region – October 2005 to September 2006 Delivery of standby service for any customer where all or a portion of a customer's electricity is supplied from On-Site Generating facilities (“OSG”) without using the Company’s delivery system (defined as the distribution and/or transmission system, regardless of voltage or functional classification). An OSG, whether owned by the customer or a third party, can produce electricity primarily to serve the customer’s native load, to sell in the wholesale market or to carry out a combination thereof. Such OSG may be connected with the Company’s delivery system for parallel operation, or operate under the control of a single pull, double-throw switch (or similar device). For customers with multiple electrical services, this tariff applies to each of the customer’s electrical services that are not electrically isolated from the OSG. All separately metered electricity supply and/or delivery service not otherwise served by the OSG (e.g., separate delivery service to the facility’s guardhouse or other facilities electrically isolated from the OSG) will be provided under the Otherwise Applicable Service Classification (“OASC”). This rate applies to facilities located in the North NYISO Region. Service Charge $ 45.79 (Delivery and Transition Charges) Contract Demand Charge2 $ 5.38 per kW of contract demand (Delivery and Transition Charges) Reactive Energy Charge $ 0.000950 / RkVAh in excess of 33% total energy in kWh Demand Charges $ 0.20642 per daily peak kW (Delivery and Transition Charges) Energy Charges $ per total kWh System Benefits and Renewable Portfolio Charge $ 0.00160 per kWh Hourly Electric Charges See Figure 18
1 – Variable Energy Charges are the hourly Location Based Marginal Price (LBMP) from February 2005 – January 2006 as available at the NYISO website.
2 - The Contract Demand is the Maximum demand import from the utility expected for the customer. Filenames: NYSEG_SC11_SC2_VRO_North_Oct05-Sept06.CSV, nyseg_north_region_Oct05-
Sept06.dat

NYSERDA DG/CHP Integrated Database System Utility Rate Details
CDH Energy Corporation 157 September 25, 2008
New York State Electric & Gas
Service Classification 11 – Standby – Based on SC2 Variable Pricing Option – North Region –July 2007 to June 2008 Delivery of standby service for any customer where all or a portion of a customer's electricity is supplied from On-Site Generating facilities (“OSG”) without using the Company’s delivery system (defined as the distribution and/or transmission system, regardless of voltage or functional classification). An OSG, whether owned by the customer or a third party, can produce electricity primarily to serve the customer’s native load, to sell in the wholesale market or to carry out a combination thereof. Such OSG may be connected with the Company’s delivery system for parallel operation, or operate under the control of a single pull, double-throw switch (or similar device). For customers with multiple electrical services, this tariff applies to each of the customer’s electrical services that are not electrically isolated from the OSG. All separately metered electricity supply and/or delivery service not otherwise served by the OSG (e.g., separate delivery service to the facility’s guardhouse or other facilities electrically isolated from the OSG) will be provided under the Otherwise Applicable Service Classification (“OASC”). This rate applies to facilities located in the North NYISO Region. Service Charge $ 22.95 (Delivery and Transition Charges) Contract Demand Charge2 $ 4.79 per kW of contract demand (Delivery and Transition Charges) Reactive Energy Charge $ 0.000950 / RkVAh in excess of 33% total energy in kWh Demand Charges $ 0.2188 per daily peak kW (Delivery and Transition Charges) Energy Charges $ per total kWh System Benefits and Renewable Portfolio Charge $ 0.00200 per kWh Hourly Electric Charges See Figure 19
1 – Variable Energy Charges are the hourly Location Based Marginal Price (LBMP) from February 2005 – January 2006 as available at the NYISO website.
2 - The Contract Demand is the Maximum demand import from the utility expected for the customer. Filenames: NYSEG_SC11_SC2_VRO_North_Jul07-Jun08.CSV, nyseg_north_region_Oct05-Sept06.dat

NYSERDA DG/CHP Integrated Database System Utility Rate Details
CDH Energy Corporation 158 September 25, 2008
New York State Electric & Gas
Service Classification 11 – Standby – Based on SC2 Variable Pricing Option – West Region – February 2005 to January 2006 Delivery of standby service for any customer where all or a portion of a customer's electricity is supplied from On-Site Generating facilities (“OSG”) without using the Company’s delivery system (defined as the distribution and/or transmission system, regardless of voltage or functional classification). An OSG, whether owned by the customer or a third party, can produce electricity primarily to serve the customer’s native load, to sell in the wholesale market or to carry out a combination thereof. Such OSG may be connected with the Company’s delivery system for parallel operation, or operate under the control of a single pull, double-throw switch (or similar device). For customers with multiple electrical services, this tariff applies to each of the customer’s electrical services that are not electrically isolated from the OSG. All separately metered electricity supply and/or delivery service not otherwise served by the OSG (e.g., separate delivery service to the facility’s guardhouse or other facilities electrically isolated from the OSG) will be provided under the Otherwise Applicable Service Classification (“OASC”). This rate applies to facilities located in the West NYISO Region. Service Charge $ 45.79 (Delivery and Transition Charges) Contract Demand Charge2 $ 5.38 per kW of contract demand (Delivery and Transition Charges) Reactive Energy Charge $ 0.000950 / RkVAh in excess of 33% total energy in kWh Demand Charges $ 0.20642 per daily peak kW (Delivery and Transition Charges) Energy Charges $ per total kWh System Benefits and Renewable Portfolio Charge $ 0.00160 per kWh Hourly Electric Charges See Figure 20
1 – Variable Energy Charges are the hourly Location Based Marginal Price (LBMP) from February 2005 – January 2006 as available at the NYISO website.
2 - The Contract Demand is the Maximum demand import from the utility expected for the customer. Filenames: NYSEG_SC11_SC2_VRO_West_Feb05-Jan06.CSV, nyseg_west_region_Feb05-Jan06.dat

NYSERDA DG/CHP Integrated Database System Utility Rate Details
CDH Energy Corporation 159 September 25, 2008
New York State Electric & Gas
Service Classification 11 – Standby – Based on SC2 Variable Pricing Option – West Region – October 2005 to September 2006 Delivery of standby service for any customer where all or a portion of a customer's electricity is supplied from On-Site Generating facilities (“OSG”) without using the Company’s delivery system (defined as the distribution and/or transmission system, regardless of voltage or functional classification). An OSG, whether owned by the customer or a third party, can produce electricity primarily to serve the customer’s native load, to sell in the wholesale market or to carry out a combination thereof. Such OSG may be connected with the Company’s delivery system for parallel operation, or operate under the control of a single pull, double-throw switch (or similar device). For customers with multiple electrical services, this tariff applies to each of the customer’s electrical services that are not electrically isolated from the OSG. All separately metered electricity supply and/or delivery service not otherwise served by the OSG (e.g., separate delivery service to the facility’s guardhouse or other facilities electrically isolated from the OSG) will be provided under the Otherwise Applicable Service Classification (“OASC”). This rate applies to facilities located in the West NYISO Region. Service Charge $ 45.79 (Delivery and Transition Charges) Contract Demand Charge2 $ 5.38 per kW of contract demand (Delivery and Transition Charges) Reactive Energy Charge $ 0.000950 / RkVAh in excess of 33% total energy in kWh Demand Charges $ 0.20642 per daily peak kW (Delivery and Transition Charges) Energy Charges $ per total kWh System Benefits and Renewable Portfolio Charge $ 0.00160 per kWh Hourly Electric Charges See Figure 21
1 – Variable Energy Charges are the hourly Location Based Marginal Price (LBMP) from February 2005 – January 2006 as available at the NYISO website.
2 - The Contract Demand is the Maximum demand import from the utility expected for the customer. Filenames: NYSEG_SC11_SC2_VRO_West_Oct05-Sept06.CSV, nyseg_west_region_Oct05-Sept06.dat

NYSERDA DG/CHP Integrated Database System Utility Rate Details
CDH Energy Corporation 160 September 25, 2008
New York State Electric & Gas
Service Classification 11 – Standby – Based on SC2 Variable Pricing Option – West Region – July 2007 to June 2008 Delivery of standby service for any customer where all or a portion of a customer's electricity is supplied from On-Site Generating facilities (“OSG”) without using the Company’s delivery system (defined as the distribution and/or transmission system, regardless of voltage or functional classification). An OSG, whether owned by the customer or a third party, can produce electricity primarily to serve the customer’s native load, to sell in the wholesale market or to carry out a combination thereof. Such OSG may be connected with the Company’s delivery system for parallel operation, or operate under the control of a single pull, double-throw switch (or similar device). For customers with multiple electrical services, this tariff applies to each of the customer’s electrical services that are not electrically isolated from the OSG. All separately metered electricity supply and/or delivery service not otherwise served by the OSG (e.g., separate delivery service to the facility’s guardhouse or other facilities electrically isolated from the OSG) will be provided under the Otherwise Applicable Service Classification (“OASC”). This rate applies to facilities located in the West NYISO Region. Service Charge $ 22.95 (Delivery and Transition Charges) Contract Demand Charge2 $ 4.79 per kW of contract demand (Delivery and Transition Charges) Reactive Energy Charge $ 0.000950 / RkVAh in excess of 33% total energy in kWh Demand Charges $ 0.2188 per daily peak kW (Delivery and Transition Charges) Energy Charges $ per total kWh System Benefits and Renewable Portfolio Charge $ 0.00200 per kWh Hourly Electric Charges See Figure 22
1 – Variable Energy Charges are the hourly Location Based Marginal Price (LBMP) from February 2005 – January 2006 as available at the NYISO website.
2 - The Contract Demand is the Maximum demand import from the utility expected for the customer. Filenames: NYSEG_SC11_SC2_VRO_West_Jul07-Jun08.CSV, nyseg_west_region_Oct05-Sept06.dat

NYSERDA DG/CHP Integrated Database System Utility Rate Details
CDH Energy Corporation 161 September 25, 2008
Complete National Grid New York Electric Tariff The National Grid New York rates are up-to-date as of June 2008. This utility is formerly known as Niagara Mohawk.
Niagara Mohawk
Service Classification 1 – Standard Residential (Frontier Region) – February 2005 to January 2006 This is our standard electric rate for the majority of our residential customers, as other rates require special conditions. Service is also available for church and farm customers. This rate is for facilities located in the Frontier Region. Service Charge $ 14.92
Energy Charges1 $ per total kWh Delivery Charge: $ 0.03174 / kWh Hydropower Benefits Charge: $ -0.001091 / kWh System Benefits Charge: $ 0.001453 / kWh Renewable Portfolio Surcharge: $ 0.000276 / kWh Transmission Revenue Adjustment $ per kWh Jan Feb Mar Apr May Jun Jul Aug Sep Oct Nov Dec $0.00136 $0.00210 $0.00099 $0.00080 $0.00144 $0.00186 $0.00177 $0.00138 $0.00002 $0.00104 $0.00163 $0.00188
Electric Supply Cost, Delivery Charge Adjustment1 See Figure 23 1 – Variable Energy Charges are from February 2005 – January 2006 as available at the Niagara Mohawk
website. Filenames: NIMO_SC1_FRONTIER_feb05-jan06.CSV, nimo_sc1_Sec_Frontier.dat
Nimo - SC1 Residential for Frontier Region
Jan Feb Mar Apr May Jun Jul Aug Sep Oct Nov Dec0.00
0.02
0.04
0.06
0.08
0.10
Ele
ctric
Sup
ply
plus
Del
iver
y C
harg
e A
djus
tmen
t ($/
kWh)
Figure 23 Daily Electric Charges for SC1 from February 2005 through January 2006 for Frontier Region

NYSERDA DG/CHP Integrated Database System Utility Rate Details
CDH Energy Corporation 162 September 25, 2008
Niagara Mohawk
Service Classification 1 – Standard Residential (Frontier Region) – October 2005 to September 2006 This is our standard electric rate for the majority of our residential customers, as other rates require special conditions. Service is also available for church and farm customers. This rate is for facilities located in the Frontier Region. Service Charge $ 16.04
Energy Charges1 $ per total kWh Delivery Charge: $ 0.03601 / kWh Hydropower Benefits Charge: $ -0.000191 / kWh System Benefits Charge: $ 0.001619 / kWh Renewable Portfolio Surcharge: $ 0.000491 / kWh Transmission Revenue Adjustment $ per kWh Jan Feb Mar Apr May Jun Jul Aug Sep Oct Nov Dec $0.00210 $0.00211 $0.00200 ($0.00104) $0.00186 $0.00152 $0.00099 $0.00160 $0.00142 $0.00163 $0.00188 $0.00136
Electric Supply Cost, Delivery Charge Adjustment1 See Figure 24 1 – Variable Energy Charges are from October 2005 – September 2006 as available at the Niagara
Mohawk website. Filenames: NIMO_SC1_FRONTIER_oct05-sep06.CSV, nimo_sc1_Sec_Frontier_oct05-sep06.dat
sc1 Residential for Frontier Region
Jan Feb Mar Apr May Jun Jul Aug Sep Oct Nov Dec0.00
0.02
0.04
0.06
0.08
0.10
Ele
ctric
Sup
ply
plus
Del
iver
y C
harg
e A
djus
tmen
t ($/
kWh)
Figure 24 Daily Electric Charges for SC1 from October 2005 through September 2006 for Frontier Region

NYSERDA DG/CHP Integrated Database System Utility Rate Details
CDH Energy Corporation 163 September 25, 2008
Niagara Mohawk
Service Classification 1 – Standard Residential (Frontier Region) – February 2006 to January 2007 This is our standard electric rate for the majority of our residential customers, as other rates require special conditions. Service is also available for church and farm customers. This rate is for facilities located in the Frontier Region. Service Charge $ 16.21
Energy Charges1 $ per total kWh Delivery Charge: $ 0.03882 / kWh Hydropower Benefits Charge: $ -0.000191 / kWh System Benefits Charge: $ 0.001627 / kWh Renewable Portfolio Surcharge: $ 0.000491 / kWh Transmission Revenue Adjustment $ per kWh Jan Feb Mar Apr May Jun Jul Aug Sep Oct Nov Dec $0.00210 $0.00211 $0.00200 ($0.00104) $0.00186 $0.00152 $0.00099 $0.00160 $0.00142 ($0.00041) ($0.00031) ($0.00032)
Electric Supply Cost, Delivery Charge Adjustment1 See Figure 25 1 – Variable Energy Charges are from February 2006 – January 2007 as available at the Niagara Mohawk
website. Filenames: NIMO_SC1_FRONTIER_feb06-jan07.CSV, nimo_sc1_Sec_Frontier_feb06-jan07.dat
sc1 residential for Frontier Region
Jan Feb Mar Apr May Jun Jul Aug Sep Oct Nov Dec0.00
0.02
0.04
0.06
0.08
0.10
Ele
ctric
Sup
ply
plus
Del
iver
y C
harg
e A
djus
tmen
t ($/
kWh)
Figure 25 Daily Electric Charges for SC1 from February 2006 through January 2007 for Frontier Region

NYSERDA DG/CHP Integrated Database System Utility Rate Details
CDH Energy Corporation 164 September 25, 2008
Niagara Mohawk
Service Classification 1 – Standard Residential (Frontier Region) – July 2007 to June 2008 This is our standard electric rate for the majority of our residential customers, as other rates require special conditions. Service is also available for church and farm customers. This rate is for facilities located in the Frontier Region. Service Charge $ 16.21
Energy Charges1 $ per total kWh Delivery Charge: $ 0.04471 / kWh Hydropower Benefits Charge: $ -0.00096 / kWh System Benefits Charge: $ 0.001640 / kWh Renewable Portfolio Surcharge: $ 0.000623 / kWh Transmission Revenue Adjustment $ per kWh Jan Feb Mar Apr May Jun Jul Aug Sep Oct Nov Dec $(0.00050) $(0.00072) $(0.00053) $0.00137 $0.00086 $0.00179 $0.00017 $0.00118 $0.00142 $0.00005 $(0.00001) $0.00055
Electric Supply Cost, Delivery Charge Adjustment1 See Figure 26 1 – Variable Energy Charges are from July 2007 to June 2008 as available at the Niagara Mohawk
website. Filenames: NIMO_SC1_FRONTIER_Jul07-Jun08.CSV, nimo_sc1_Sec_Frontier_Jun07-May08.dat
Figure 26 Daily Electric Charges for SC1 from June 2007 through May 2008 for Frontier Region

NYSERDA DG/CHP Integrated Database System Utility Rate Details
CDH Energy Corporation 165 September 25, 2008
Niagara Mohawk
Service Classification 1 – Standard Residential (Capital Region) – February 2006 to January 2007 This is our standard electric rate for the majority of our residential customers, as other rates require special conditions. Service is also available for church and farm customers. This rate is for facilities located in the Capital Region. Service Charge $ 16.21
Energy Charges1 $ per total kWh Delivery Charge: $ 0.03882 / kWh Hydropower Benefits Charge: $ -0.000191 / kWh System Benefits Charge: $ 0.001627 / kWh Renewable Portfolio Surcharge: $ 0.000491 / kWh Transmission Revenue Adjustment $ per kWh Jan Feb Mar Apr May Jun Jul Aug Sep Oct Nov Dec $0.00210 $0.00211 $0.00200 ($0.00104) $0.00186 $0.00152 $0.00099 $0.00160 $0.00142 ($0.00041) ($0.00031) ($0.00032)
Electric Supply Cost, Delivery Charge Adjustment1 See Figure 27 1 – Variable Energy Charges are from February 2006 – January 2007 as available at the Niagara Mohawk
website. Filenames: NIMO_SC1_CAPITAL_feb06-jan07.CSV, nimo_sc1_Sec_Capital_feb06-jan07.dat
sc1 residential for Capital Region
Jan Feb Mar Apr May Jun Jul Aug Sep Oct Nov Dec0.00
0.02
0.04
0.06
0.08
0.10
Ele
ctric
Sup
ply
plus
Del
iver
y C
harg
e A
djus
tmen
t ($/
kWh)
Figure 27 Daily Electric Charges for SC1 from February 2006 through January 2007 for Capital Region

NYSERDA DG/CHP Integrated Database System Utility Rate Details
CDH Energy Corporation 166 September 25, 2008
Niagara Mohawk
Service Classification 1 – Standard Residential (Capital Region) – July 2007 to June 2008 This is our standard electric rate for the majority of our residential customers, as other rates require special conditions. Service is also available for church and farm customers. This rate is for facilities located in the Capital Region. Service Charge $ 16.21
Energy Charges1 $ per total kWh Delivery Charge: $ 0.04471 / kWh Hydropower Benefits Charge: $ -0.006294 / kWh System Benefits Charge: $ 0.001640 / kWh Renewable Portfolio Surcharge: $ 0.000623 / kWh Transmission Revenue Adjustment $ per kWh Jan Feb Mar Apr May Jun Jul Aug Sep Oct Nov Dec ($0.0005) ($0.00072) ($0.00053) $0.00137 $0.00086 $0.00179 ($0.00017) $0.00118 $0.00062 $0.00005 ($0.00001) $0.00055
Electric Supply Cost, Delivery Charge Adjustment1 See Figure 28 1 – Variable Energy Charges are from July 2007 – June 2008as available at the Niagara Mohawk website. Filenames: NIMO_SC1_CAPITAL_Jul07-Jun08.CSV, nimo_sc1_Sec_Capital_Jun07-May08.dat
Figure 28 Daily Electric Charges for SC1 from June 2007 to May 2008 for Capital Region

NYSERDA DG/CHP Integrated Database System Utility Rate Details
CDH Energy Corporation 167 September 25, 2008
Niagara Mohawk
Service Classification 2ND – Small General Non-Demand (Genesee Region) – February 2005 to January 2006 This service is for commercial or industrial customers whose monthly measured demand is less than 100kW. Customers can be served under the non-demand or demand pricing schedules. A business that uses greater than 2,000 kWh in each month for four consecutive months would be classified as a demand customer and not be eligible for this rate. This rate is for facilities located in the Genesee Region. Service Charge $ 19.13
Energy Charges $ per total kWh for all hours Systems Benefit, Delivery and Renewable Portfolio Charge $ 0.059719 / kWh Transmission Revenue Adjustment $ / kWh Jan Feb Mar Apr May Jun Jul Aug Sep Oct Nov Dec $0.00218 $0.00314 $0.00129 $0.00110 $0.00190 $0.00246 $0.00245 $0.00200 $0.00003 $0.00136 $0.00218 $0.00268
Electric Supply Cost, Delivery Charge Adjustment1 See Figure 29 1 – Variable Energy Charges are from February 2005 – January 2006 as available at the 1Niagara Mohawk
website. Filenames: NIMO_SC2ND_GENESEE_feb05-jan06.CSV, nimo_sc2nd_Sec_Genesee.dat
Nimo - SC2 Small General Non Demand for Genesee Region
Jan Feb Mar Apr May Jun Jul Aug Sep Oct Nov Dec0.00
0.02
0.04
0.06
0.08
0.10
Ele
ctric
Sup
ply
plus
Del
iver
y C
harg
e A
djus
tmen
t ($/
kWh)
Figure 29 Daily Electric Charges for SC2ND from February 2005 through January 2006 for Genesee Region

NYSERDA DG/CHP Integrated Database System Utility Rate Details
CDH Energy Corporation 168 September 25, 2008
Niagara Mohawk
Service Classification 2ND – Small General Non-Demand (Genesee Region) – October 2005 to September 2006 This service is for commercial or industrial customers whose monthly measured demand is less than 100kW. Customers can be served under the non-demand or demand pricing schedules. A business that uses greater than 2,000 kWh in each month for four consecutive months would be classified as a demand customer and not be eligible for this rate. This rate is for facilities located in the Genesee Region. Service Charge $ 20.90
Energy Charges $ per total kWh for all hours Systems Benefit, Delivery and Renewable Portfolio Charge $ 0.064850 / kWh Transmission Revenue Adjustment $ / kWh Jan Feb Mar Apr May Jun Jul Aug Sep Oct Nov Dec $0.00314 $0.00318 $0.00309 ($0.00152) $0.00295 $0.00229 $0.00145 $0.00228 $0.00214 $0.00218 $0.00268 $0.00218
Electric Supply Cost, Delivery Charge Adjustment1 See Figure 30 1 – Variable Energy Charges are from October 2005 – September 2006 as available at the 1Niagara
Mohawk website. Filenames: NIMO_SC2ND_GENESEE_oct05-sep06.CSV, nimo_sc2nd_Sec_Genesee_oct05-sep06.dat
SC 2 Small General Non Demand for Genesee Region
Jan Feb Mar Apr May Jun Jul Aug Sep Oct Nov Dec0.00
0.02
0.04
0.06
0.08
0.10
Ele
ctric
Sup
ply
plus
Del
iver
y C
harg
e A
djus
tmen
t ($/
kWh)
Figure 30 Daily Electric Charges for SC2ND from October 2005 through September 2006 for Genesee Region

NYSERDA DG/CHP Integrated Database System Utility Rate Details
CDH Energy Corporation 169 September 25, 2008
Niagara Mohawk
Service Classification 2ND – Small General Non-Demand (Genesee Region) – July 2007 to June 2008 This service is for commercial or industrial customers whose monthly measured demand is less than 100kW. Customers can be served under the non-demand or demand pricing schedules. A business that uses greater than 2,000 kWh in each month for four consecutive months would be classified as a demand customer and not be eligible for this rate. This rate is for facilities located in the Genesee Region. Service Charge $ 21.02
Energy Charges $ per total kWh for all hours Systems Benefit, Delivery and Renewable Portfolio Charge $ 0.063953 / kWh Transmission Revenue Adjustment $ / kWh Jan Feb Mar Apr May Jun Jul Aug Sep Oct Nov Dec ($0.00087) ($0.00120) ($0.00085) $0.00218 $0.00138 $0.00283 ($0.00026) $0.00176 $0.00088 $0.00007 ($0.00002) $0.00089
Electric Supply Cost, Delivery Charge Adjustment1 See Figure 31 1 – Variable Energy Charges are from July 2007 – June 2008 as available at the 1Niagara Mohawk
website. Filenames: NIMO_SC2ND_GENESEE_Jul07-Jun08.CSV, nimo_sc2nd_Sec_Genesee_Jun07-May08.dat
Figure 31 Daily Electric Charges for SC2ND from June 2007 through May 2008 for Genesee Region

NYSERDA DG/CHP Integrated Database System Utility Rate Details
CDH Energy Corporation 170 September 25, 2008
Niagara Mohawk
Service Classification 2ND – Small General Non-Demand (Central Region) – February 2005 to January 2006 This service is for commercial or industrial customers whose monthly measured demand is less than 100kW. Customers can be served under the non-demand or demand pricing schedules. A business that uses greater than 2,000 kWh in each month for four consecutive months would be classified as a demand customer and not be eligible for this rate. This rate is for facilities located in the Central Region. Service Charge $ 19.13
Energy Charges $ per total kWh for all hours Systems Benefit, Delivery and Renewable Portfolio Charge $ 0.058529 / kWh Transmission Revenue Adjustment $ / kWh Jan Feb Mar Apr May Jun Jul Aug Sep Oct Nov Dec $0.00218 $0.00314 $0.00129 $0.00110 $0.00190 $0.00246 $0.00245 $0.00200 $0.00003 $0.00136 $0.00218 $0.00268
Electric Supply Cost, Delivery Charge Adjustment1 See Figure 32 1 – Variable Energy Charges are from February 2005 – January 2006 as available at the 1Niagara Mohawk
website. Filenames: NIMO_SC2ND_CENTRAL_feb05-jan06.CSV, nimo_sc2nd_Sec_Central.dat
Nimo - SC2 Small General Non Demand for Central Region
Jan Feb Mar Apr May Jun Jul Aug Sep Oct Nov Dec0.00
0.02
0.04
0.06
0.08
0.10
0.12
Ele
ctric
Sup
ply
plus
Del
iver
y C
harg
e A
djus
tmen
t ($/
kWh)
Figure 32 Daily Electric Charges for SC2ND from February 2005 through January 2006 for Central Region

NYSERDA DG/CHP Integrated Database System Utility Rate Details
CDH Energy Corporation 171 September 25, 2008
Niagara Mohawk
Service Classification 2ND – Small General Non-Demand (Central Region) – October 2005 to September 2006 This service is for commercial or industrial customers whose monthly measured demand is less than 100kW. Customers can be served under the non-demand or demand pricing schedules. A business that uses greater than 2,000 kWh in each month for four consecutive months would be classified as a demand customer and not be eligible for this rate. This rate is for facilities located in the Central Region. Service Charge $ 20.90
Energy Charges $ per total kWh for all hours Systems Benefit, Delivery and Renewable Portfolio Charge $ 0.063660 / kWh Transmission Revenue Adjustment $ / kWh Jan Feb Mar Apr May Jun Jul Aug Sep Oct Nov Dec $0.00314 $0.00318 $0.00309 ($0.00152) $0.00295 $0.00229 $0.00145 $0.00228 $0.00214 $0.00218 $0.00268 $0.00218
Electric Supply Cost, Delivery Charge Adjustment1 See Figure 33 1 – Variable Energy Charges are from October 2005 – September 2006 as available at the 1Niagara
Mohawk website. Filenames: NIMO_SC2ND_CENTRAL_oct05-sep06.CSV, nimo_sc2nd_Sec_Central_oct05-sep06.dat
SC 2 Small General Non Demand for Central Region
Jan Feb Mar Apr May Jun Jul Aug Sep Oct Nov Dec0.00
0.02
0.04
0.06
0.08
0.10
0.12
Ele
ctric
Sup
ply
plus
Del
iver
y C
harg
e A
djus
tmen
t ($/
kWh)
Figure 33 Daily Electric Charges for SC2ND from October 2005 through September 2006 for Central Region

NYSERDA DG/CHP Integrated Database System Utility Rate Details
CDH Energy Corporation 172 September 25, 2008
Niagara Mohawk
Service Classification 2ND – Small General Non-Demand (Central Region) – July 2007 to June 2008 This service is for commercial or industrial customers whose monthly measured demand is less than 100kW. Customers can be served under the non-demand or demand pricing schedules. A business that uses greater than 2,000 kWh in each month for four consecutive months would be classified as a demand customer and not be eligible for this rate. This rate is for facilities located in the Central Region. Service Charge $ 21.02
Energy Charges $ per total kWh for all hours Systems Benefit, Delivery and Renewable Portfolio Charge $ 0.063953 / kWh Transmission Revenue Adjustment $ / kWh Jan Feb Mar Apr May Jun Jul Aug Sep Oct Nov Dec ($0.00087) ($0.00120) ($0.00085) $0.00218 $0.00138 $0.00283 ($0.00026) $0.00176 $0.00088 $0.00007 ($0.00002) $0.00089
Electric Supply Cost, Delivery Charge Adjustment1 See Figure 34 1 – Variable Energy Charges are from July 2007 – June 2008as available at the 1Niagara Mohawk website. Filenames: NIMO_SC2ND_CENTRAL_Jul07-Jun08.CSV, nimo_sc2nd_Sec_Central_Jun07-May08.dat
Figure 34 Daily Electric Charges for SC2ND from June 2007 through May 2008 for Central Region

NYSERDA DG/CHP Integrated Database System Utility Rate Details
CDH Energy Corporation 173 September 25, 2008
Niagara Mohawk
Service Classification 2ND – Small General Non-Demand (Adirondack Region) – February 2005 to January 2006 This service is for commercial or industrial customers whose monthly measured demand is less than 100kW. Customers can be served under the non-demand or demand pricing schedules. A business that uses greater than 2,000 kWh in each month for four consecutive months would be classified as a demand customer and not be eligible for this rate. This rate is for facilities located in the Adirondack Region. Service Charge $ 19.13
Energy Charges $ per total kWh for all hours Systems Benefit, Delivery and Renewable Portfolio Charge $ 0.058529 / kWh Transmission Revenue Adjustment $ / kWh Jan Feb Mar Apr May Jun Jul Aug Sep Oct Nov Dec $0.00218 $0.00314 $0.00129 $0.00110 $0.00190 $0.00246 $0.00245 $0.00200 $0.00003 $0.00136 $0.00218 $0.00268
Electric Supply Cost, Delivery Charge Adjustment1 See Figure 35 1 – Variable Energy Charges are from February 2005 – January 2006 as available at the 1Niagara Mohawk
website. Filenames: NIMO_SC2ND_ADIRONDACK_feb05-jan06.CSV, nimo_sc2nd_Sec_Adirondack.dat
Nimo - SC2 Small General Non Demand for Adirondack Region
Jan Feb Mar Apr May Jun Jul Aug Sep Oct Nov Dec0.00
0.02
0.04
0.06
0.08
0.10
Ele
ctric
Sup
ply
plus
Del
iver
y C
harg
e A
djus
tmen
t ($/
kWh)
Figure 35 Daily Electric Charges for SC2ND from February 2005 through January 2006 for Adirondack Region

NYSERDA DG/CHP Integrated Database System Utility Rate Details
CDH Energy Corporation 174 September 25, 2008
Niagara Mohawk
Service Classification 2ND – Small General Non-Demand (Adirondack Region) – October 2005 to September 2006 This service is for commercial or industrial customers whose monthly measured demand is less than 100kW. Customers can be served under the non-demand or demand pricing schedules. A business that uses greater than 2,000 kWh in each month for four consecutive months would be classified as a demand customer and not be eligible for this rate. This rate is for facilities located in the Adirondack Region. Service Charge $ 20.90
Energy Charges $ per total kWh for all hours Systems Benefit, Delivery and Renewable Portfolio Charge $ 0.063660 / kWh Transmission Revenue Adjustment $ / kWh Jan Feb Mar Apr May Jun Jul Aug Sep Oct Nov Dec $0.00314 $0.00318 $0.00309 ($0.00152) $0.00295 $0.00229 $0.00145 $0.00228 $0.00214 $0.00218 $0.00268 $0.00218
Electric Supply Cost, Delivery Charge Adjustment1 See Figure 36 1 – Variable Energy Charges are from October 2005 – September 2006 as available at the 1Niagara
Mohawk website. Filenames: NIMO_SC2ND_ADIRONDACK_oct05-sep06.CSV, nimo_sc2nd_Sec_Adirondack_oct05-
sep06.dat
SC 2 Small General Non Demand for Adirondack Region
Jan Feb Mar Apr May Jun Jul Aug Sep Oct Nov Dec0.00
0.02
0.04
0.06
0.08
0.10
Ele
ctric
Sup
ply
plus
Del
iver
y C
harg
e A
djus
tmen
t ($/
kWh)
Figure 36 Daily Electric Charges for SC2ND from October 2005 through September 2006 for Adirondack Region

NYSERDA DG/CHP Integrated Database System Utility Rate Details
CDH Energy Corporation 175 September 25, 2008
Niagara Mohawk
Service Classification 2ND – Small General Non-Demand (Adirondack Region) – July 2007 to June 2008 This service is for commercial or industrial customers whose monthly measured demand is less than 100kW. Customers can be served under the non-demand or demand pricing schedules. A business that uses greater than 2,000 kWh in each month for four consecutive months would be classified as a demand customer and not be eligible for this rate. This rate is for facilities located in the Adirondack Region. Service Charge $ 21.02
Energy Charges $ per total kWh for all hours Systems Benefit, Delivery and Renewable Portfolio Charge $ 0.063953 / kWh Transmission Revenue Adjustment $ / kWh Jan Feb Mar Apr May Jun Jul Aug Sep Oct Nov Dec ($0.00087) ($0.00120) ($0.00085) $0.00218 $0.00138 $0.00283 ($0.00026) $0.00176 $0.00088 $0.00007 ($0.00002) $0.00089
Electric Supply Cost, Delivery Charge Adjustment1 See Figure 37 1 – Variable Energy Charges are from July 2007- June 2008 as available at the 1Niagara Mohawk website. Filenames: NIMO_SC2ND_ADIRONDACK_Jul07-Jun08.CSV, nimo_sc2nd_Sec_Adirondack_Jun07-May08.dat
Figure 37 Daily Electric Charges for SC2ND from June 2007 through May 2008 for Adirondack Region

NYSERDA DG/CHP Integrated Database System Utility Rate Details
CDH Energy Corporation 176 September 25, 2008
Niagara Mohawk
Service Classification 2ND – Small General Non-Demand (Utica Region) – February 2005 to January 2006 This service is for commercial or industrial customers whose monthly measured demand is less than 100kW. Customers can be served under the non-demand or demand pricing schedules. A business that uses greater than 2,000 kWh in each month for four consecutive months would be classified as a demand customer and not be eligible for this rate. This rate is for facilities located in the Utica Region. Service Charge $ 19.13
Energy Charges $ per total kWh for all hours Systems Benefit, Delivery and Renewable Portfolio Charge $ 0.058529 / kWh Transmission Revenue Adjustment $ / kWh Jan Feb Mar Apr May Jun Jul Aug Sep Oct Nov Dec $0.00218 $0.00314 $0.00129 $0.00110 $0.00190 $0.00246 $0.00245 $0.00200 $0.00003 $0.00136 $0.00218 $0.00268
Electric Supply Cost, Delivery Charge Adjustment1 See Figure 38 1 – Variable Energy Charges are from February 2005 – January 2006 as available at the 1Niagara Mohawk
website. Filenames: NIMO_SC2ND_UTICA_feb05-jan06.CSV, nimo_sc2nd_Sec_Utica.dat
Nimo - SC2 Small General Non Demand for Utica Region
Jan Feb Mar Apr May Jun Jul Aug Sep Oct Nov Dec0.00
0.02
0.04
0.06
0.08
0.10
Ele
ctric
Sup
ply
plus
Del
iver
y C
harg
e A
djus
tmen
t ($/
kWh)
Figure 38 Daily Electric Charges for SC2ND from February 2005 through January 2006 for Utica Region

NYSERDA DG/CHP Integrated Database System Utility Rate Details
CDH Energy Corporation 177 September 25, 2008
Niagara Mohawk
Service Classification 2ND – Small General Non-Demand (Utica Region) – October 2005 to September 2006 This service is for commercial or industrial customers whose monthly measured demand is less than 100kW. Customers can be served under the non-demand or demand pricing schedules. A business that uses greater than 2,000 kWh in each month for four consecutive months would be classified as a demand customer and not be eligible for this rate. This rate is for facilities located in the Utica Region. Service Charge $ 20.90
Energy Charges $ per total kWh for all hours Systems Benefit, Delivery and Renewable Portfolio Charge $ 0.063660 / kWh Transmission Revenue Adjustment $ / kWh Jan Feb Mar Apr May Jun Jul Aug Sep Oct Nov Dec $0.00314 $0.00318 $0.00309 ($0.00152) $0.00295 $0.00229 $0.00145 $0.00228 $0.00214 $0.00218 $0.00268 $0.00218
Electric Supply Cost, Delivery Charge Adjustment1 See Figure 39 1 – Variable Energy Charges are from October 2005 – September 2006 as available at the 1Niagara
Mohawk website. Filenames: NIMO_SC2ND_UTICA_oct05-sep06.CSV, nimo_sc2nd_Sec_Utica_oct05-sep06.dat
SC 2 Small General Non Demand for Utica Region
Jan Feb Mar Apr May Jun Jul Aug Sep Oct Nov Dec0.00
0.02
0.04
0.06
0.08
0.10
Ele
ctric
Sup
ply
plus
Del
iver
y C
harg
e A
djus
tmen
t ($/
kWh)
Figure 39 Daily Electric Charges for SC2ND from October 2005 through September 2006 for Utica Region

NYSERDA DG/CHP Integrated Database System Utility Rate Details
CDH Energy Corporation 178 September 25, 2008
Niagara Mohawk
Service Classification 2ND – Small General Non-Demand (Utica Region) – July 2007 to June 2008 This service is for commercial or industrial customers whose monthly measured demand is less than 100kW. Customers can be served under the non-demand or demand pricing schedules. A business that uses greater than 2,000 kWh in each month for four consecutive months would be classified as a demand customer and not be eligible for this rate. This rate is for facilities located in the Utica Region. Service Charge $ 21.02
Energy Charges $ per total kWh for all hours Systems Benefit, Delivery and Renewable Portfolio Charge $ 0.063953 / kWh Transmission Revenue Adjustment $ / kWh Jan Feb Mar Apr May Jun Jul Aug Sep Oct Nov Dec ($0.00087) ($0.00120) ($0.00085) $0.00218 $0.00138 $0.00283 ($0.00026) $0.00176 $0.00088 $0.00007 ($0.00002) $0.00089
Electric Supply Cost, Delivery Charge Adjustment1 See Figure 40 1 – Variable Energy Charges are from July 2007 – June 2008 as available at the 1Niagara Mohawk
website. Filenames: NIMO_SC2ND_UTICA_Jul07-Jun08.CSV, nimo_sc2nd_Sec_Utica_Jun07-May08.dat
Figure 40 Daily Electric Charges for SC2ND from June 2007 through May 2008 for Utica Region

NYSERDA DG/CHP Integrated Database System Utility Rate Details
CDH Energy Corporation 179 September 25, 2008
Niagara Mohawk
Service Classification 2ND – Small General Non-Demand (Capital Region) – February 2005 to January 2006 This service is for commercial or industrial customers whose monthly measured demand is less than 100kW. Customers can be served under the non-demand or demand pricing schedules. A business that uses greater than 2,000 kWh in each month for four consecutive months would be classified as a demand customer and not be eligible for this rate. This rate is for facilities located in the Capital Region. Service Charge $ 19.13
Energy Charges $ per total kWh for all hours Systems Benefit, Delivery and Renewable Portfolio Charge $ 0.058529 / kWh Transmission Revenue Adjustment $ / kWh Jan Feb Mar Apr May Jun Jul Aug Sep Oct Nov Dec $0.00218 $0.00314 $0.00129 $0.00110 $0.00190 $0.00246 $0.00245 $0.00200 $0.00003 $0.00136 $0.00218 $0.00268
Electric Supply Cost, Delivery Charge Adjustment1 See Figure 41 1 – Variable Energy Charges are from February 2005 – January 2006 as available at the 1Niagara Mohawk
website. Filenames: NIMO_SC2ND_CAPITAL_feb05-jan06.CSV, nimo_sc2nd_Sec_Capital.dat
Nimo - SC2 Small General Non Demand for Capital Region
Jan Feb Mar Apr May Jun Jul Aug Sep Oct Nov Dec0.00
0.02
0.04
0.06
0.08
0.10
0.12
Ele
ctric
Sup
ply
plus
Del
iver
y C
harg
e A
djus
tmen
t ($/
kWh)
Figure 41 Daily Electric Charges for SC2ND from February 2005 through January 2006 for Capital Region

NYSERDA DG/CHP Integrated Database System Utility Rate Details
CDH Energy Corporation 180 September 25, 2008
Niagara Mohawk
Service Classification 2ND – Small General Non-Demand (Capital Region) – October 2005 to September 2006 This service is for commercial or industrial customers whose monthly measured demand is less than 100kW. Customers can be served under the non-demand or demand pricing schedules. A business that uses greater than 2,000 kWh in each month for four consecutive months would be classified as a demand customer and not be eligible for this rate. This rate is for facilities located in the Capital Region. Service Charge $ 20.90
Energy Charges $ per total kWh for all hours Systems Benefit, Delivery and Renewable Portfolio Charge $ 0.061490 / kWh Transmission Revenue Adjustment $ / kWh Jan Feb Mar Apr May Jun Jul Aug Sep Oct Nov Dec $0.00314 $0.00318 $0.00309 ($0.00152) $0.00295 $0.00229 $0.00145 $0.00228 $0.00214 $0.00218 $0.00268 $0.00218
Electric Supply Cost, Delivery Charge Adjustment1 See Figure 42 1 – Variable Energy Charges are from October 2005 – September 2006 as available at the 1Niagara
Mohawk website. Filenames: NIMO_SC2ND_CAPITAL_oct05-sep06.CSV, nimo_sc2nd_Sec_Capital_oct05-sep06.dat
SC 2 Small General Non Demand for Capital Region
Jan Feb Mar Apr May Jun Jul Aug Sep Oct Nov Dec0.00
0.02
0.04
0.06
0.08
0.10
0.12
Ele
ctric
Sup
ply
plus
Del
iver
y C
harg
e A
djus
tmen
t ($/
kWh)
Figure 42 Daily Electric Charges for SC2ND from October 2005 through September 2006 for Capital Region
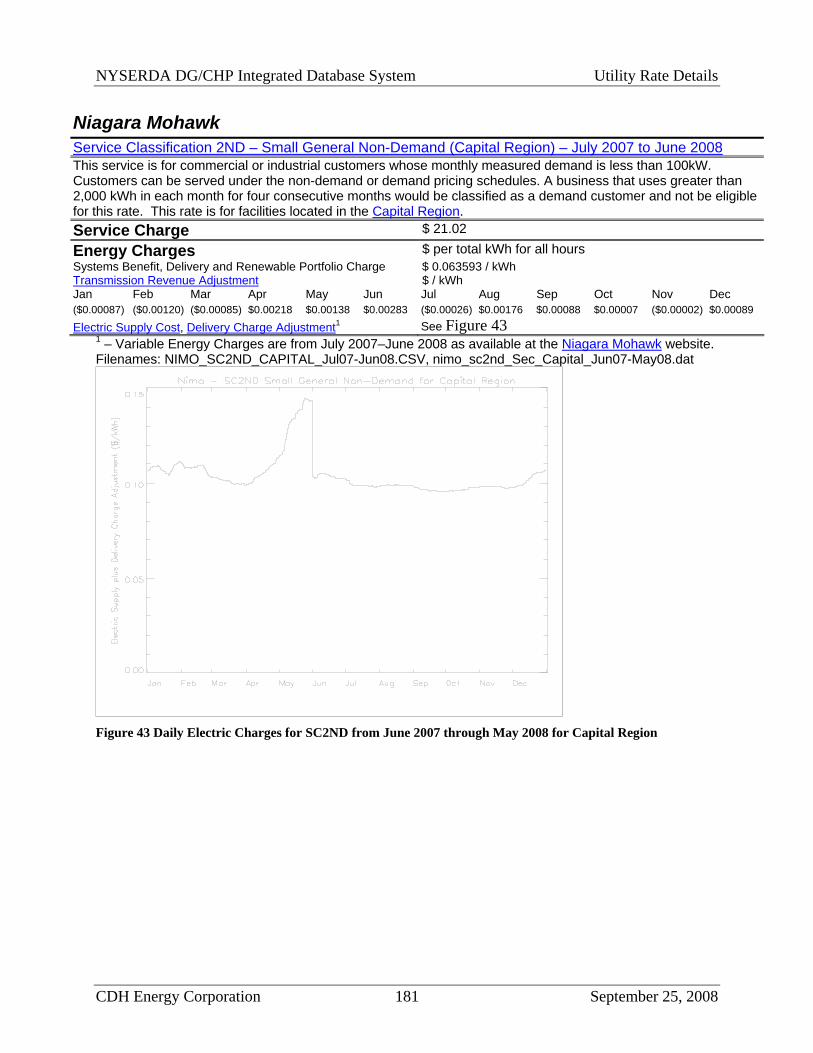
NYSERDA DG/CHP Integrated Database System Utility Rate Details
CDH Energy Corporation 181 September 25, 2008
Niagara Mohawk
Service Classification 2ND – Small General Non-Demand (Capital Region) – July 2007 to June 2008 This service is for commercial or industrial customers whose monthly measured demand is less than 100kW. Customers can be served under the non-demand or demand pricing schedules. A business that uses greater than 2,000 kWh in each month for four consecutive months would be classified as a demand customer and not be eligible for this rate. This rate is for facilities located in the Capital Region. Service Charge $ 21.02
Energy Charges $ per total kWh for all hours Systems Benefit, Delivery and Renewable Portfolio Charge $ 0.063593 / kWh Transmission Revenue Adjustment $ / kWh Jan Feb Mar Apr May Jun Jul Aug Sep Oct Nov Dec ($0.00087) ($0.00120) ($0.00085) $0.00218 $0.00138 $0.00283 ($0.00026) $0.00176 $0.00088 $0.00007 ($0.00002) $0.00089
Electric Supply Cost, Delivery Charge Adjustment1 See Figure 43 1 – Variable Energy Charges are from July 2007–June 2008 as available at the 1Niagara Mohawk website. Filenames: NIMO_SC2ND_CAPITAL_Jul07-Jun08.CSV, nimo_sc2nd_Sec_Capital_Jun07-May08.dat
Figure 43 Daily Electric Charges for SC2ND from June 2007 through May 2008 for Capital Region

NYSERDA DG/CHP Integrated Database System Utility Rate Details
CDH Energy Corporation 182 September 25, 2008
Niagara Mohawk
Service Classification 2D – Small General Demand (Frontier Region) – February 2005 to January 2006 This service is for commercial or industrial customers whose monthly measured demand is less than 100kW. Customers can be served under the non-demand or demand pricing schedules. A business that uses greater than 2,000 kWh in each month for four consecutive months would be classified as a demand customer. This rate is for facilities located in the Frontier Region. Service Charge $ 47.25
Demand Charges $ 8.32 / peak kW for all hours
Energy Charges $ per total kWh for all hours Systems Benefit, Delivery and Renewable Portfolio Charge $ 0.021809 / kWh Transmission Revenue Adjustment $ / kWh Jan Feb Mar Apr May Jun Jul Aug Sep Oct Nov Dec $0.00213 $0.00001 $0.00134 $0.00109 $0.00179 $0.00229 $0.00219 $0.00174 $0.00002 $0.00127 $0.00211 $0.00275
Electric Supply Cost, Delivery Charge Adjustment1 See Figure 44 1 – Variable Energy Charges are from February 2005 – January 2006 as available at the 1Niagara Mohawk
website. Filenames: NIMO_SC2D_FRONTIER_feb05-jan06.CSV, nimo_sc2d_Sec_Frontier.dat
Nimo - SC2 Small General Demand for Frontier Region
Jan Feb Mar Apr May Jun Jul Aug Sep Oct Nov Dec0.00
0.02
0.04
0.06
0.08
0.10
Ele
ctric
Sup
ply
plus
Del
iver
y C
harg
e A
djus
tmen
t ($/
kWh)
Figure 44 Daily Electric Charges for SC2D from February 2005 through January 2006 for Frontier Region

NYSERDA DG/CHP Integrated Database System Utility Rate Details
CDH Energy Corporation 183 September 25, 2008
Niagara Mohawk
Service Classification 2D – Small General Demand (Frontier Region) – October 2005 to September 2006 This service is for commercial or industrial customers whose monthly measured demand is less than 100kW. Customers can be served under the non-demand or demand pricing schedules. A business that uses greater than 2,000 kWh in each month for four consecutive months would be classified as a demand customer. This rate is for facilities located in the Frontier Region. Service Charge $ 51.60
Demand Charges $ 9.48 / peak kW for all hours
Energy Charges $ per total kWh for all hours Systems Benefit, Delivery and Renewable Portfolio Charge $ 0.022430 / kWh Transmission Revenue Adjustment $ / kWh Jan Feb Mar Apr May Jun Jul Aug Sep Oct Nov Dec $0.00313 $0.00302 $0.00281 ($0.00131) $0.00231 $0.00192 $0.00124 $0.00194 $0.00181 $0.00211 $0.00275 $0.00213
Electric Supply Cost, Delivery Charge Adjustment1 See Figure 45 1 – Variable Energy Charges are from October 2005 – September 2006 as available at the 1Niagara
Mohawk website. Filenames: NIMO_SC2D_FRONTIER_oct05-sep06.CSV, nimo_sc2d_Sec_Frontier_oct05-sep06.dat
SC 2 Small General Demand for Frontier Region
Jan Feb Mar Apr May Jun Jul Aug Sep Oct Nov Dec0.00
0.02
0.04
0.06
0.08
0.10
Ele
ctric
Sup
ply
plus
Del
iver
y C
harg
e A
djus
tmen
t ($/
kWh)
Figure 45 Daily Electric Charges for SC2D from October 2005 through September 2006 for Frontier Region

NYSERDA DG/CHP Integrated Database System Utility Rate Details
CDH Energy Corporation 184 September 25, 2008
Niagara Mohawk
Service Classification 2D – Small General Demand (Frontier Region) – July 2007 to June 2008 This service is for commercial or industrial customers whose monthly measured demand is less than 100kW. Customers can be served under the non-demand or demand pricing schedules. A business that uses greater than 2,000 kWh in each month for four consecutive months would be classified as a demand customer. This rate is for facilities located in the Frontier Region. Service Charge $ 52.52
Demand Charges $ 10.10 / peak kW for all hours
Energy Charges $ per total kWh for all hours Systems Benefit, Delivery and Renewable Portfolio Charge $ 0.01973 / kWh Transmission Revenue Adjustment $ / kWh Jan Feb Mar Apr May Jun Jul Aug Sep Oct Nov Dec ($0.00077) ($0.00106) ($0.00074) $0.00288 $0.00106 $0.00205 ($0.00022) $0.00146 $0.00073 $0.00006 ($0.00002) $0.0078
Electric Supply Cost, Delivery Charge Adjustment1 See Figure 46 1 – Variable Energy Charges are from July 2007 – June 2008 as available at the 1Niagara Mohawk
website. Filenames: NIMO_SC2D_FRONTIER_Jul07-Jun08.CSV, nimo_sc2d_Sec_Frontier_Jun07-May08.dat
Figure 46 Daily Electric Charges for SC2D from June 2007 through May 2008 for Frontier Region

NYSERDA DG/CHP Integrated Database System Utility Rate Details
CDH Energy Corporation 185 September 25, 2008
Niagara Mohawk
Service Classification 2D – Small General Demand (Genesee Region) – February 2005 to January 2006 This service is for commercial or industrial customers whose monthly measured demand is less than 100kW. Customers can be served under the non-demand or demand pricing schedules. A business that uses greater than 2,000 kWh in each month for four consecutive months would be classified as a demand customer. This rate is for facilities located in the Genesee Region. Service Charge $ 47.25
Demand Charges $ 8.32 / peak kW for all hours
Energy Charges $ per total kWh for all hours Systems Benefit, Delivery and Renewable Portfolio Charge $ 0.021809 / kWh Transmission Revenue Adjustment $ / kWh Jan Feb Mar Apr May Jun Jul Aug Sep Oct Nov Dec $0.00213 $0.00001 $0.00134 $0.00109 $0.00179 $0.00229 $0.00219 $0.00174 $0.00002 $0.00127 $0.00211 $0.00275
Electric Supply Cost, Delivery Charge Adjustment1 See Figure 47 1 – Variable Energy Charges are from February 2005 – January 2006 as available at the 1Niagara Mohawk
website. Filenames: NIMO_SC2D_GENESEE_feb05-jan06.CSV, nimo_sc2d_Sec_Genesee.dat
Nimo - SC2 Small General Demand for Genesee Region
Jan Feb Mar Apr May Jun Jul Aug Sep Oct Nov Dec0.00
0.02
0.04
0.06
0.08
0.10
Ele
ctric
Sup
ply
plus
Del
iver
y C
harg
e A
djus
tmen
t ($/
kWh)
Figure 47 Daily Electric Charges for SC2D from February 2005 through January 2006 for Genesee Region
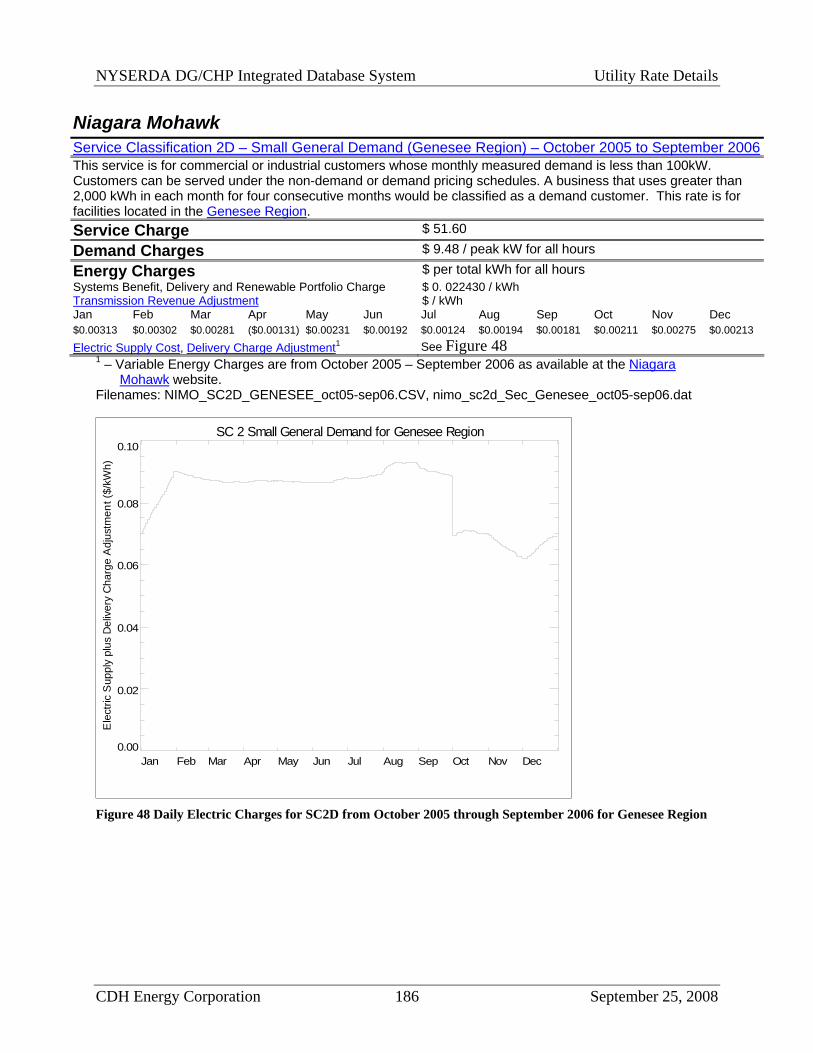
NYSERDA DG/CHP Integrated Database System Utility Rate Details
CDH Energy Corporation 186 September 25, 2008
Niagara Mohawk
Service Classification 2D – Small General Demand (Genesee Region) – October 2005 to September 2006This service is for commercial or industrial customers whose monthly measured demand is less than 100kW. Customers can be served under the non-demand or demand pricing schedules. A business that uses greater than 2,000 kWh in each month for four consecutive months would be classified as a demand customer. This rate is for facilities located in the Genesee Region. Service Charge $ 51.60
Demand Charges $ 9.48 / peak kW for all hours
Energy Charges $ per total kWh for all hours Systems Benefit, Delivery and Renewable Portfolio Charge $ 0. 022430 / kWh Transmission Revenue Adjustment $ / kWh Jan Feb Mar Apr May Jun Jul Aug Sep Oct Nov Dec $0.00313 $0.00302 $0.00281 ($0.00131) $0.00231 $0.00192 $0.00124 $0.00194 $0.00181 $0.00211 $0.00275 $0.00213
Electric Supply Cost, Delivery Charge Adjustment1 See Figure 48 1 – Variable Energy Charges are from October 2005 – September 2006 as available at the 1Niagara
Mohawk website. Filenames: NIMO_SC2D_GENESEE_oct05-sep06.CSV, nimo_sc2d_Sec_Genesee_oct05-sep06.dat
SC 2 Small General Demand for Genesee Region
Jan Feb Mar Apr May Jun Jul Aug Sep Oct Nov Dec0.00
0.02
0.04
0.06
0.08
0.10
Ele
ctric
Sup
ply
plus
Del
iver
y C
harg
e A
djus
tmen
t ($/
kWh)
Figure 48 Daily Electric Charges for SC2D from October 2005 through September 2006 for Genesee Region

NYSERDA DG/CHP Integrated Database System Utility Rate Details
CDH Energy Corporation 187 September 25, 2008
Niagara Mohawk
Service Classification 2D – Small General Demand (Genesee Region) – July 2007 to June 2008 This service is for commercial or industrial customers whose monthly measured demand is less than 100kW. Customers can be served under the non-demand or demand pricing schedules. A business that uses greater than 2,000 kWh in each month for four consecutive months would be classified as a demand customer. This rate is for facilities located in the Genesee Region. Service Charge $ 52.52
Demand Charges $ 10.10 / peak kW for all hours
Energy Charges $ per total kWh for all hours Systems Benefit, Delivery and Renewable Portfolio Charge $ 0. 019733 / kWh Transmission Revenue Adjustment $ / kWh Jan Feb Mar Apr May Jun Jul Aug Sep Oct Nov Dec ($0.00077) ($0.00106) ($0.00074) $0.00288 $0.00106 $0.00205 ($0.00022) $0.00146 $0.00073 $0.00006 ($0.00002) $0.0078
Electric Supply Cost, Delivery Charge Adjustment1 See Figure 49 1 – Variable Energy Charges are from July 2007 – June 2008 as available at the 1Niagara Mohawk
website. Filenames: NIMO_SC2D_GENESEE_Jul07-Jun08.CSV, nimo_sc2d_Sec_Genesee_jun07-may08.dat
Figure 49 Daily Electric Charges for SC2D from June 2007 through May 2008 for Genesee Region

NYSERDA DG/CHP Integrated Database System Utility Rate Details
CDH Energy Corporation 188 September 25, 2008
Niagara Mohawk
Service Classification 2D – Small General Demand (Central Region) – February 2005 to January 2006 This service is for commercial or industrial customers whose monthly measured demand is less than 100kW. Customers can be served under the non-demand or demand pricing schedules. A business that uses greater than 2,000 kWh in each month for four consecutive months would be classified as a demand customer. This rate is for facilities located in the Central Region. Service Charge $ 47.25
Demand Charges $ 8.32 / peak kW for all hours
Energy Charges $ per total kWh for all hours Systems Benefit, Delivery and Renewable Portfolio Charge $ 0.020769 / kWh Transmission Revenue Adjustment $ / kWh Jan Feb Mar Apr May Jun Jul Aug Sep Oct Nov Dec $0.00213 $0.00001 $0.00134 $0.00109 $0.00179 $0.00229 $0.00219 $0.00174 $0.00002 $0.00127 $0.00211 $0.00275
Electric Supply Cost, Delivery Charge Adjustment1 See Figure 50 1 – Variable Energy Charges are from February 2005 – January 2006 as available at the 1Niagara Mohawk
website. Filenames: NIMO_SC2D_CENTRAL_feb05-jan06.CSV, nimo_sc2d_Sec_Central.dat
Nimo - SC2 Small General Demand for Central Region
Jan Feb Mar Apr May Jun Jul Aug Sep Oct Nov Dec0.00
0.02
0.04
0.06
0.08
0.10
Ele
ctric
Sup
ply
plus
Del
iver
y C
harg
e A
djus
tmen
t ($/
kWh)
Figure 50 Daily Electric Charges for SC2D from February 2005 through January 2006 for Central Region

NYSERDA DG/CHP Integrated Database System Utility Rate Details
CDH Energy Corporation 189 September 25, 2008
Niagara Mohawk
Service Classification 2D – Small General Demand (Central Region) – October 2005 to September 2006 This service is for commercial or industrial customers whose monthly measured demand is less than 100kW. Customers can be served under the non-demand or demand pricing schedules. A business that uses greater than 2,000 kWh in each month for four consecutive months would be classified as a demand customer. This rate is for facilities located in the Central Region. Service Charge $ 51.60
Demand Charges $ 9.48 / peak kW for all hours
Energy Charges $ per total kWh for all hours Systems Benefit, Delivery and Renewable Portfolio Charge $ 0.021390 / kWh Transmission Revenue Adjustment $ / kWh Jan Feb Mar Apr May Jun Jul Aug Sep Oct Nov Dec $0.00313 $0.00302 $0.00281 ($0.00131) $0.00231 $0.00192 $0.00124 $0.00194 $0.00181 $0.00211 $0.00275 $0.00213
Electric Supply Cost, Delivery Charge Adjustment1 See Figure 51 1 – Variable Energy Charges are from October 2005 – September 2006 as available at the 1Niagara
Mohawk website. Filenames: NIMO_SC2D_CENTRAL_oct05-sep06.CSV, nimo_sc2d_Sec_Central_oct05-sep06.dat
SC 2 Small General Demand for Central Region
Jan Feb Mar Apr May Jun Jul Aug Sep Oct Nov Dec0.00
0.02
0.04
0.06
0.08
0.10
0.12
Ele
ctric
Sup
ply
plus
Del
iver
y C
harg
e A
djus
tmen
t ($/
kWh)
Figure 51 Daily Electric Charges for SC2D from October 2005 through September 2006 for Central Region

NYSERDA DG/CHP Integrated Database System Utility Rate Details
CDH Energy Corporation 190 September 25, 2008
Niagara Mohawk
Service Classification 2D – Small General Demand (Central Region) – July 2007 to June 2008 This service is for commercial or industrial customers whose monthly measured demand is less than 100kW. Customers can be served under the non-demand or demand pricing schedules. A business that uses greater than 2,000 kWh in each month for four consecutive months would be classified as a demand customer. This rate is for facilities located in the Central Region. Service Charge $ 52.52
Demand Charges $ 10.10 / peak kW for all hours
Energy Charges $ per total kWh for all hours Systems Benefit, Delivery and Renewable Portfolio Charge $ 0.019733 / kWh Transmission Revenue Adjustment $ / kWh Jan Feb Mar Apr May Jun Jul Aug Sep Oct Nov Dec ($0.00077) ($0.00106) ($0.00074) $0.00288 $0.00106 $0.00205 ($0.00022) $0.00146 $0.00073 $0.00006 ($0.00002) $0.0078
Electric Supply Cost, Delivery Charge Adjustment1 See Figure 52 1 – Variable Energy Charges are from July 2007 – June 2008 as available at the 1Niagara Mohawk
website. Filenames: NIMO_SC2D_CENTRAL_Jul07-Jun08.CSV, nimo_sc2d_Sec_Central_jun07may08.dat
Figure 52 Daily Electric Charges for SC2D from June 2007 through May 2008 for Central Region

NYSERDA DG/CHP Integrated Database System Utility Rate Details
CDH Energy Corporation 191 September 25, 2008
Niagara Mohawk
Service Classification 2D – Small General Demand (Adirondack Region) – February 2005 to January 2006This service is for commercial or industrial customers whose monthly measured demand is less than 100kW. Customers can be served under the non-demand or demand pricing schedules. A business that uses greater than 2,000 kWh in each month for four consecutive months would be classified as a demand customer. This rate is for facilities located in the Adirondack Region. Service Charge $ 47.25
Demand Charges $ 8.32 / peak kW for all hours
Energy Charges $ per total kWh for all hours Systems Benefit, Delivery and Renewable Portfolio Charge $ 0.020769 / kWh Transmission Revenue Adjustment $ / kWh Jan Feb Mar Apr May Jun Jul Aug Sep Oct Nov Dec $0.00213 $0.00001 $0.00134 $0.00109 $0.00179 $0.00229 $0.00219 $0.00174 $0.00002 $0.00127 $0.00211 $0.00275
Electric Supply Cost, Delivery Charge Adjustment1 See Figure 53 1 – Variable Energy Charges are from February 2005 – January 2006 as available at the 1Niagara Mohawk
website. Filenames: NIMO_SC2D_ADIRONDACK_feb05-jan06.CSV, nimo_sc2d_Sec_Adirondack.dat
Nimo - SC2 Small General Demand for Adirondack Region
Jan Feb Mar Apr May Jun Jul Aug Sep Oct Nov Dec0.00
0.02
0.04
0.06
0.08
0.10
Ele
ctric
Sup
ply
plus
Del
iver
y C
harg
e A
djus
tmen
t ($/
kWh)
Figure 53 Daily Electric Charges for SC2D from February 2005 through January 2006 for Adirondack Region

NYSERDA DG/CHP Integrated Database System Utility Rate Details
CDH Energy Corporation 192 September 25, 2008
Niagara Mohawk
Service Classification 2D – Small General Demand (Adirondack Region) – October 2005 to September 2006 This service is for commercial or industrial customers whose monthly measured demand is less than 100kW. Customers can be served under the non-demand or demand pricing schedules. A business that uses greater than 2,000 kWh in each month for four consecutive months would be classified as a demand customer. This rate is for facilities located in the Adirondack Region. Service Charge $ 51.60
Demand Charges $ 9.48 / peak kW for all hours
Energy Charges $ per total kWh for all hours Systems Benefit, Delivery and Renewable Portfolio Charge $ 0.021390 / kWh Transmission Revenue Adjustment $ / kWh Jan Feb Mar Apr May Jun Jul Aug Sep Oct Nov Dec $0.00313 $0.00302 $0.00281 ($0.00131) $0.00231 $0.00192 $0.00124 $0.00194 $0.00181 $0.00211 $0.00275 $0.00213
Electric Supply Cost, Delivery Charge Adjustment1 See Figure 54 1 – Variable Energy Charges are from October 2005 – September 2006 as available at the 1Niagara
Mohawk website. Filenames: NIMO_SC2D_ADIRONDACK_oct05-sep06.CSV, nimo_sc2d_Sec_Adirondack_oct05-
sep06.dat
SC 2 Small General Demand for Adirondack Region
Jan Feb Mar Apr May Jun Jul Aug Sep Oct Nov Dec0.00
0.02
0.04
0.06
0.08
0.10
Ele
ctric
Sup
ply
plus
Del
iver
y C
harg
e A
djus
tmen
t ($/
kWh)
Figure 54 Daily Electric Charges for SC2D from October 2005 through September 2006 for Adirondack Region

NYSERDA DG/CHP Integrated Database System Utility Rate Details
CDH Energy Corporation 193 September 25, 2008
Niagara Mohawk
Service Classification 2D – Small General Demand (Adirondack Region) – July 2007 to June 2008 This service is for commercial or industrial customers whose monthly measured demand is less than 100kW. Customers can be served under the non-demand or demand pricing schedules. A business that uses greater than 2,000 kWh in each month for four consecutive months would be classified as a demand customer. This rate is for facilities located in the Adirondack Region. Service Charge $ 52.52
Demand Charges $ 10.10 / peak kW for all hours
Energy Charges $ per total kWh for all hours Systems Benefit, Delivery and Renewable Portfolio Charge $ 0.019733 / kWh Transmission Revenue Adjustment $ / kWh Jan Feb Mar Apr May Jun Jul Aug Sep Oct Nov Dec ($0.00077) ($0.00106) ($0.00074) $0.00288 $0.00106 $0.00205 ($0.00022) $0.00146 $0.00073 $0.00006 ($0.00002) $0.0078
Electric Supply Cost, Delivery Charge Adjustment1 See Figure 55 1 – Variable Energy Charges are from July 2007 – June 2008 as available at the 1Niagara Mohawk
website. Filenames: NIMO_SC2D_ADIRONDACK_Jul07-Jun08.CSV, nimo_sc2d_Sec_Adirondack_jun07-may08.dat
Figure 55 Daily Electric Charges for SC2D from June 2007 through May 2008 for Adirondack Region

NYSERDA DG/CHP Integrated Database System Utility Rate Details
CDH Energy Corporation 194 September 25, 2008
Niagara Mohawk
Service Classification 2D – Small General Demand (Utica Region) – February 2005 to January 2006 This service is for commercial or industrial customers whose monthly measured demand is less than 100kW. Customers can be served under the non-demand or demand pricing schedules. A business that uses greater than 2,000 kWh in each month for four consecutive months would be classified as a demand customer. This rate is for facilities located in the Utica Region. Service Charge $ 47.25
Demand Charges $ 8.32 / peak kW for all hours
Energy Charges $ per total kWh for all hours Systems Benefit, Delivery and Renewable Portfolio Charge $ 0.020769 / kWh Transmission Revenue Adjustment $ / kWh Jan Feb Mar Apr May Jun Jul Aug Sep Oct Nov Dec $0.00213 $0.00001 $0.00134 $0.00109 $0.00179 $0.00229 $0.00219 $0.00174 $0.00002 $0.00127 $0.00211 $0.00275
Electric Supply Cost, Delivery Charge Adjustment1 See Figure 56 1 – Variable Energy Charges are from February 2005 – January 2006 as available at the 1Niagara Mohawk
website. Filenames: NIMO_SC2D_UTICA_feb05-jan06.CSV, nimo_sc2d_Sec_Utica.dat
Nimo - SC2 Small General Demand for Utica Region
Jan Feb Mar Apr May Jun Jul Aug Sep Oct Nov Dec0.00
0.02
0.04
0.06
0.08
0.10
Ele
ctric
Sup
ply
plus
Del
iver
y C
harg
e A
djus
tmen
t ($/
kWh)
Figure 56 Daily Electric Charges for SC2D from February 2005 through January 2006 for Utica Region

NYSERDA DG/CHP Integrated Database System Utility Rate Details
CDH Energy Corporation 195 September 25, 2008
Niagara Mohawk
Service Classification 2D – Small General Demand (Utica Region) – October 2005 to September 2006 This service is for commercial or industrial customers whose monthly measured demand is less than 100kW. Customers can be served under the non-demand or demand pricing schedules. A business that uses greater than 2,000 kWh in each month for four consecutive months would be classified as a demand customer. This rate is for facilities located in the Utica Region. Service Charge $ 51.60
Demand Charges $ 9.48 / peak kW for all hours
Energy Charges $ per total kWh for all hours Systems Benefit, Delivery and Renewable Portfolio Charge $ 0.021390 / kWh Transmission Revenue Adjustment $ / kWh Jan Feb Mar Apr May Jun Jul Aug Sep Oct Nov Dec $0.00313 $0.00302 $0.00281 ($0.00131) $0.00231 $0.00192 $0.00124 $0.00194 $0.00181 $0.00211 $0.00275 $0.00213
Electric Supply Cost, Delivery Charge Adjustment1 See Figure 57 1 – Variable Energy Charges are from October 2005 – September 2006 as available at the 1Niagara
Mohawk website. Filenames: NIMO_SC2D_UTICA_oct05-sep06.CSV, nimo_sc2d_Sec_Utica_oct05-sep06.dat
SC 2 Small General Demand for Utica Region
Jan Feb Mar Apr May Jun Jul Aug Sep Oct Nov Dec0.00
0.02
0.04
0.06
0.08
0.10
0.12
Ele
ctric
Sup
ply
plus
Del
iver
y C
harg
e A
djus
tmen
t ($/
kWh)
Figure 57 Daily Electric Charges for SC2D from October 2005 through September 2006 for Utica Region

NYSERDA DG/CHP Integrated Database System Utility Rate Details
CDH Energy Corporation 196 September 25, 2008
Niagara Mohawk
Service Classification 2D – Small General Demand (Utica Region) – July 2007 to June 2008 This service is for commercial or industrial customers whose monthly measured demand is less than 100kW. Customers can be served under the non-demand or demand pricing schedules. A business that uses greater than 2,000 kWh in each month for four consecutive months would be classified as a demand customer. This rate is for facilities located in the Utica Region. Service Charge $ 52.52
Demand Charges $ 10.10 / peak kW for all hours
Energy Charges $ per total kWh for all hours Systems Benefit, Delivery and Renewable Portfolio Charge $ 0.019733 / kWh Transmission Revenue Adjustment $ / kWh Jan Feb Mar Apr May Jun Jul Aug Sep Oct Nov Dec ($0.00077) ($0.00106) ($0.00074) $0.00288 $0.00106 $0.00205 ($0.00022) $0.00146 $0.00073 $0.00006 ($0.00002) $0.0078
Electric Supply Cost, Delivery Charge Adjustment1 See Figure 58 1 – Variable Energy Charges are from Jul7 2007 – June 2008 as available at the 1Niagara Mohawk
website. Filenames: NIMO_SC2D_UTICA_Jul07-Jun08.CSV, nimo_sc2d_Sec_Utica_jun07-may08.dat
Figure 58 Daily Electric Charges for SC2D from June 2007 through May 2008 for Utica Region

NYSERDA DG/CHP Integrated Database System Utility Rate Details
CDH Energy Corporation 197 September 25, 2008
Niagara Mohawk
Service Classification 2D – Small General Demand (Capital Region) – February 2005 to January 2006 This service is for commercial or industrial customers whose monthly measured demand is less than 100kW. Customers can be served under the non-demand or demand pricing schedules. A business that uses greater than 2,000 kWh in each month for four consecutive months would be classified as a demand customer. This rate is for facilities located in the Capital Region. Service Charge $ 47.25
Demand Charges $ 8.32 / peak kW for all hours
Energy Charges $ per total kWh for all hours Systems Benefit, Delivery and Renewable Portfolio Charge $ 0.020769 / kWh Transmission Revenue Adjustment $ / kWh Jan Feb Mar Apr May Jun Jul Aug Sep Oct Nov Dec $0.00213 $0.00001 $0.00134 $0.00109 $0.00179 $0.00229 $0.00219 $0.00174 $0.00002 $0.00127 $0.00211 $0.00275
Electric Supply Cost, Delivery Charge Adjustment1 See Figure 59 1 – Variable Energy Charges are from February 2005 – January 2006 as available at the 1Niagara Mohawk
website. Filenames: NIMO_SC2D_CAPITAL_feb05-jan06.CSV, nimo_sc2d_Sec_Capital.dat
Nimo - SC2 Small General Demand for Capital Region
Jan Feb Mar Apr May Jun Jul Aug Sep Oct Nov Dec0.00
0.02
0.04
0.06
0.08
0.10
Ele
ctric
Sup
ply
plus
Del
iver
y C
harg
e A
djus
tmen
t ($/
kWh)
Figure 59 Daily Electric Charges for SC2D from February 2005 through January 2006 for Capital Region

NYSERDA DG/CHP Integrated Database System Utility Rate Details
CDH Energy Corporation 198 September 25, 2008
Niagara Mohawk
Service Classification 2D – Small General Demand (Capital Region) – October 2005 to September 2006 This service is for commercial or industrial customers whose monthly measured demand is less than 100kW. Customers can be served under the non-demand or demand pricing schedules. A business that uses greater than 2,000 kWh in each month for four consecutive months would be classified as a demand customer. This rate is for facilities located in the Capital Region. Service Charge $ 51.60
Demand Charges $ 9.48 / peak kW for all hours
Energy Charges $ per total kWh for all hours Systems Benefit, Delivery and Renewable Portfolio Charge $ 0.019430 / kWh Transmission Revenue Adjustment $ / kWh Jan Feb Mar Apr May Jun Jul Aug Sep Oct Nov Dec $0.00313 $0.00302 $0.00281 ($0.00131) $0.00231 $0.00192 $0.00124 $0.00194 $0.00181 $0.00211 $0.00275 $0.00213
Electric Supply Cost, Delivery Charge Adjustment1 See Figure 60 1 – Variable Energy Charges are from October 2005 – September 2006 as available at the 1Niagara
Mohawk website. Filenames: NIMO_SC2D_CAPITAL_oct05-sep06.CSV, nimo_sc2d_Sec_Capital_oct05-sep06.dat
SC 2 Small General Demand for Capital Region
Jan Feb Mar Apr May Jun Jul Aug Sep Oct Nov Dec0.00
0.02
0.04
0.06
0.08
0.10
0.12
Ele
ctric
Sup
ply
plus
Del
iver
y C
harg
e A
djus
tmen
t ($/
kWh)
Figure 60 Daily Electric Charges for SC2D from October 2005 through September 2006 for Capital Region

NYSERDA DG/CHP Integrated Database System Utility Rate Details
CDH Energy Corporation 199 September 25, 2008
Niagara Mohawk
Service Classification 2D – Small General Demand (Capital Region) – July 2007 to June 2008 This service is for commercial or industrial customers whose monthly measured demand is less than 100kW. Customers can be served under the non-demand or demand pricing schedules. A business that uses greater than 2,000 kWh in each month for four consecutive months would be classified as a demand customer. This rate is for facilities located in the Capital Region. Service Charge $ 52.52
Demand Charges $ 10.10 / peak kW for all hours
Energy Charges $ per total kWh for all hours Systems Benefit, Delivery and Renewable Portfolio Charge $ 0.019733 / kWh Transmission Revenue Adjustment $ / kWh Jan Feb Mar Apr May Jun Jul Aug Sep Oct Nov Dec ($0.00077) ($0.00106) ($0.00074) $0.00288 $0.00106 $0.00205 ($0.00022) $0.00146 $0.00073 $0.00006 ($0.00002) $0.0078
Electric Supply Cost, Delivery Charge Adjustment1 See Figure 61 1 – Variable Energy Charges are from July 2007 – June 2008 as available at the 1Niagara Mohawk
website. Filenames: NIMO_SC2D_CAPITAL_Jul07-Jun08.CSV, nimo_sc2d_Sec_Capital_jun07-may08.dat
Figure 61 Daily Electric Charges for SC2D from June 2007 through May 2008 for Capital Region

NYSERDA DG/CHP Integrated Database System Utility Rate Details
CDH Energy Corporation 200 September 25, 2008
Niagara Mohawk
Service Classification 3 – Large General - Secondary (Frontier Region) – February 2005 to January 2006 This service is for commercial or industrial customers whose monthly measured demand exceeds 100kW in each of the previous 12 consecutive months. When the monthly demand has exceeded 2,000 kW in any two consecutive months of the previous twelve months the facility must be billed under SC-3a. This rate is for facilities located in the Frontier Region. Service Charge $ 260.15
Reactive Demand Charge $ 0.85 / RkVA in excess of 1/3 peak demand in kW Demand Charges $ per peak kW within the defined block Block Charges 0-40 kW Above 40 kW Charge $598.80 $14.97 / kW Energy Charges $ per total kWh within defined period Systems Benefit and Renewable Portfolio Charge $ 0.001729 / kWh Transmission Revenue Adjustment $ per total kWh Jan Feb Mar Apr May Jun Jul Aug Sep Oct Nov Dec $0.00222 $0.00312 $0.00140 $0.00114 $0.00182 $0.00234 $0.00240 $0.00193 $0.00003 $0.00135 $0.00223 $0.00299 Delivery Charge $ per kWh within defined block 0-450 hrs of peak kW Above 450 hrs of peak kW Charge $0.01128 / kWh $0.00475 / kWh Electric Supply Cost, Delivery Charge Adjustment1 See Figure 62
1 – Variable Energy Charges are from February 2005 – January 2006 as available at the 1Niagara Mohawk website.
Filenames: NIMO_SC3_Sec_FRONTIER_feb05-jan06.CSV, nimo_sc3_Sec_Frontier.dat
Nimo - SC3 Large General Secondary for Frontier Region
Jan Feb Mar Apr May Jun Jul Aug Sep Oct Nov Dec0.00
0.02
0.04
0.06
0.08
0.10
0.12
Ele
ctric
Sup
ply
plus
Del
iver
y C
harg
e A
djus
tmen
t ($/
kWh)
Figure 62 Daily Electric Charges for SC3 from February 2005 through January 2006 for Frontier Region

NYSERDA DG/CHP Integrated Database System Utility Rate Details
CDH Energy Corporation 201 September 25, 2008
Niagara Mohawk
Service Classification 3 – Large General - Secondary (Frontier Region) – October 2005 to September 2006 This service is for commercial or industrial customers whose monthly measured demand exceeds 100kW in each of the previous 12 consecutive months. When the monthly demand has exceeded 2,000 kW in any two consecutive months of the previous twelve months the facility must be billed under SC-3a. This rate is for facilities located in the Frontier Region. Service Charge $ 260.15
Reactive Demand Charge $ 0.85 / RkVA in excess of 1/3 peak demand in kW Demand Charges $ per peak kW within the defined block Block Charges 0-40 kW Above 40 kW Charge $664.40 $16.61 / kW Energy Charges $ per total kWh within defined period Systems Benefit and Renewable Portfolio Charge $ 0.002110 / kWh Transmission Revenue Adjustment $ per total kWh Jan Feb Mar Apr May Jun Jul Aug Sep Oct Nov Dec $0.00312 $0.00303 $0.00269 ($0.00126) $0.00233 $0.00205 $0.00130 $0.00206 $0.00175 $0.00223 $0.00299 $0.00222 Delivery Charge $ per kWh within defined block 0-450 hrs of peak kW Above 450 hrs of peak kW Charge $0.01128 / kWh $0.00475 / kWh Electric Supply Cost, Delivery Charge Adjustment1 See Figure 63
1 – Variable Energy Charges are from October 2005 – September 2006 as available at the 1Niagara Mohawk website.
Filenames: NIMO_SC3_Sec_FRONTIER_oct05-sep06.CSV, nimo_sc3_Sec_Frontier_oct05-sep06.dat
SC 3 Large General Secondary for Frontier Region
Jan Feb Mar Apr May Jun Jul Aug Sep Oct Nov Dec0.00
0.02
0.04
0.06
0.08
0.10
0.12
Ele
ctric
Sup
ply
plus
Del
iver
y C
harg
e A
djus
tmen
t ($/
kWh)
Figure 63 Daily Electric Charges for SC3 from October 2005 through September 2006 for Frontier Region

NYSERDA DG/CHP Integrated Database System Utility Rate Details
CDH Energy Corporation 202 September 25, 2008
Niagara Mohawk
Service Classification 3 – Large General - Secondary (Frontier Region) – July 2007 to June 2008 This service is for commercial or industrial customers whose monthly measured demand exceeds 100kW in each of the previous 12 consecutive months. When the monthly demand has exceeded 2,000 kW in any two consecutive months of the previous twelve months the facility must be billed under SC-3a. This rate is for facilities located in the Frontier Region. Service Charge $ 260.15
Reactive Demand Charge $ 0.85 / RkVA in excess of 1/3 peak demand in kW Demand Charges $ per peak kW within the defined block Block Charges 0-40 kW Above 40 kW Charge $666.00 $16.65 / kW Energy Charges $ per total kWh within defined period Systems Benefit and Renewable Portfolio Charge $ 0.002263 / kWh Transmission Revenue Adjustment $ per total kWh Jan Feb Mar Apr May Jun Jul Aug Sep Oct Nov Dec ($0.00074) ($0.00098) ($0.00068) $0.00166 $0.00097 $0.00196 ($0.00023) $0.00152 $0.00078 $0.00006 ($0.00002) $0.00078 Delivery Charge $ per kWh within defined block 0-450 hrs of peak kW Above 450 hrs of peak kW Charge $0.01135 / kWh $0.00384 / kWh Electric Supply Cost, Delivery Charge Adjustment1 See Figure 64
1 – Variable Energy Charges are from July 2007 – June 2008 as available at the 1Niagara Mohawk website.
Filenames: NIMO_SC3_Sec_FRONTIER_Jul07-Jun08.CSV, nimo_sc3_Sec_Frontier_jun07-may08.dat
Figure 64 Daily Electric Charges for SC3 from June 2007 through May 2008 for Frontier Region

NYSERDA DG/CHP Integrated Database System Utility Rate Details
CDH Energy Corporation 203 September 25, 2008
Niagara Mohawk
Service Classification 3 – Large General - Secondary (Genesee Region) – February 2005 to January 2006This service is for commercial or industrial customers whose monthly measured demand exceeds 100kW in each of the previous 12 consecutive months. When the monthly demand has exceeded 2,000 kW in any two consecutive months of the previous twelve months the facility must be billed under SC-3a. This rate is for facilities located in the Genesee Region. Service Charge $ 260.15
Reactive Demand Charge $ 0.85 / RkVA in excess of 1/3 peak demand in kW Demand Charges $ per peak kW within the defined block Block Charges 0-40 kW Above 40 kW Charge $598.80 $14.97 / kW Energy Charges $ per total kWh within defined period Systems Benefit and Renewable Portfolio Charge $ 0.001729 / kWh Transmission Revenue Adjustment $ per total kWh Jan Feb Mar Apr May Jun Jul Aug Sep Oct Nov Dec $0.00222 $0.00312 $0.00140 $0.00114 $0.00182 $0.00234 $0.00240 $0.00193 $0.00003 $0.00135 $0.00223 $0.00299 Delivery Charge $ per kWh within defined block 0-450 hrs of peak kW Above 450 hrs of peak kW Charge $0.01128 / kWh $0.00475 / kWh Electric Supply Cost, Delivery Charge Adjustment1 See Figure 65
1 – Variable Energy Charges are from February 2005 – January 2006 as available at the 1Niagara Mohawk website.
Filenames: NIMO_SC3_Sec_GENESEE_feb05-jan06.CSV, nimo_sc3_Sec_Genesee.dat
Nimo - SC3 Large General Secondary for Genesee Region
Jan Feb Mar Apr May Jun Jul Aug Sep Oct Nov Dec0.00
0.02
0.04
0.06
0.08
0.10
0.12
Ele
ctric
Sup
ply
plus
Del
iver
y C
harg
e A
djus
tmen
t ($/
kWh)
Figure 65 Daily Electric Charges for SC3 from February 2005 through January 2006 for Genesee Region

NYSERDA DG/CHP Integrated Database System Utility Rate Details
CDH Energy Corporation 204 September 25, 2008
Niagara Mohawk
Service Classification 3 – Large General - Secondary (Genesee Region) – October 2005 to September 2006 This service is for commercial or industrial customers whose monthly measured demand exceeds 100kW in each of the previous 12 consecutive months. When the monthly demand has exceeded 2,000 kW in any two consecutive months of the previous twelve months the facility must be billed under SC-3a. This rate is for facilities located in the Genesee Region. Service Charge $ 260.15
Reactive Demand Charge $ 0.85 / RkVA in excess of 1/3 peak demand in kW Demand Charges $ per peak kW within the defined block Block Charges 0-40 kW Above 40 kW Charge $664.40 $16.61 / kW Energy Charges $ per total kWh within defined period Systems Benefit and Renewable Portfolio Charge $ 0.002110 / kWh Transmission Revenue Adjustment $ per total kWh Jan Feb Mar Apr May Jun Jul Aug Sep Oct Nov Dec $0.00312 $0.00303 $0.00269 ($0.00126) $0.00233 $0.00205 $0.00130 $0.00206 $0.00175 $0.00223 $0.00299 $0.00222 Delivery Charge $ per kWh within defined block 0-450 hrs of peak kW Above 450 hrs of peak kW Charge $0.01128 / kWh $0.00475 / kWh Electric Supply Cost, Delivery Charge Adjustment1 See Figure 66
1 – Variable Energy Charges are from October 2005 – September 2006 as available at the 1Niagara Mohawk website.
Filenames: NIMO_SC3_Sec_GENESEE_oct05-sep06.CSV, nimo_sc3_Sec_Genesee_oct05-sep06.dat
SC 3 Large General Secondary for Genesee Region
Jan Feb Mar Apr May Jun Jul Aug Sep Oct Nov Dec0.00
0.02
0.04
0.06
0.08
0.10
0.12
Ele
ctric
Sup
ply
plus
Del
iver
y C
harg
e A
djus
tmen
t ($/
kWh)
Figure 66 Daily Electric Charges for SC3 from October 2005 through September 2006 for Genesee Region

NYSERDA DG/CHP Integrated Database System Utility Rate Details
CDH Energy Corporation 205 September 25, 2008
Niagara Mohawk
Service Classification 3 – Large General - Secondary (Genesee Region) – July 2007 to June 2008 This service is for commercial or industrial customers whose monthly measured demand exceeds 100kW in each of the previous 12 consecutive months. When the monthly demand has exceeded 2,000 kW in any two consecutive months of the previous twelve months the facility must be billed under SC-3a. This rate is for facilities located in the Genesee Region. Service Charge $ 260.15
Reactive Demand Charge $ 0.85 / RkVA in excess of 1/3 peak demand in kW Demand Charges $ per peak kW within the defined block Block Charges 0-40 kW Above 40 kW Charge $666.00 $16.65 / kW Energy Charges $ per total kWh within defined period Systems Benefit and Renewable Portfolio Charge $ 0.002263 / kWh Transmission Revenue Adjustment $ per total kWh Jan Feb Mar Apr May Jun Jul Aug Sep Oct Nov Dec ($0.00074) ($0.00098) ($0.00068) $0.00166 $0.00097 $0.00196 ($0.00023) $0.00152 $0.00078 $0.00006 ($0.00002) $0.00078 Delivery Charge $ per kWh within defined block 0-450 hrs of peak kW Above 450 hrs of peak kW Charge $0.01135 / kWh $0.00384 / kWh Electric Supply Cost, Delivery Charge Adjustment1 See Figure 67
1 – Variable Energy Charges are from July 2007 – June 2008 as available at the 1Niagara Mohawk website.
Filenames: NIMO_SC3_Sec_GENESEE_Jul07-Jun08.CSV, nimo_sc3_Sec_Genesee_jun07-may08.dat
Figure 67 Daily Electric Charges for SC3 from June 2007 through May 2008 for Genesee Region

NYSERDA DG/CHP Integrated Database System Utility Rate Details
CDH Energy Corporation 206 September 25, 2008
Niagara Mohawk
Service Classification 3 – Large General - Secondary (Central Region) – February 2005 to January 2006 This service is for commercial or industrial customers whose monthly measured demand exceeds 100kW in each of the previous 12 consecutive months. When the monthly demand has exceeded 2,000 kW in any two consecutive months of the previous twelve months the facility must be billed under SC-3a. This rate is for facilities located in the Central Region. Service Charge $ 260.15
Reactive Demand Charge $ 0.85 / RkVA in excess of 1/3 peak demand in kW Demand Charges $ per peak kW within the defined block Block Charges 0-40 kW Above 40 kW Charge $598.80 $14.97 / kW Energy Charges $ per total kWh within defined period Systems Benefit and Renewable Portfolio Charge $ 0.001729 / kWh Transmission Revenue Adjustment $ per total kWh Jan Feb Mar Apr May Jun Jul Aug Sep Oct Nov Dec $0.00222 $0.00312 $0.00140 $0.00114 $0.00182 $0.00234 $0.00240 $0.00193 $0.00003 $0.00135 $0.00223 $0.00299 Delivery Charge $ per kWh within defined block 0-450 hrs of peak kW Above 450 hrs of peak kW Charge $0.01039 / kWh $0.00380 / kWh Electric Supply Cost, Delivery Charge Adjustment1 See Figure 68
1 – Variable Energy Charges are from February 2005 – January 2006 as available at the 1Niagara Mohawk website.
Filenames: NIMO_SC3_Sec_CENTRAL_feb05-jan06.CSV, nimo_sc3_Sec_Central.dat
Nimo - SC3 Large General Secondary for Central Region
Jan Feb Mar Apr May Jun Jul Aug Sep Oct Nov Dec0.00
0.05
0.10
0.15
Ele
ctric
Sup
ply
plus
Del
iver
y C
harg
e A
djus
tmen
t ($/
kWh)
Figure 68 Daily Electric Charges for SC3 from February 2005 through January 2006 for Central Region

NYSERDA DG/CHP Integrated Database System Utility Rate Details
CDH Energy Corporation 207 September 25, 2008
Niagara Mohawk
Service Classification 3 – Large General - Secondary (Central Region) – October 2005 to September 2006 This service is for commercial or industrial customers whose monthly measured demand exceeds 100kW in each of the previous 12 consecutive months. When the monthly demand has exceeded 2,000 kW in any two consecutive months of the previous twelve months the facility must be billed under SC-3a. This rate is for facilities located in the Central Region. Service Charge $ 260.15
Reactive Demand Charge $ 0.85 / RkVA in excess of 1/3 peak demand in kW Demand Charges $ per peak kW within the defined block Block Charges 0-40 kW Above 40 kW Charge $664.40 $16.61 / kW Energy Charges $ per total kWh within defined period Systems Benefit and Renewable Portfolio Charge $ 0.002110 / kWh Transmission Revenue Adjustment $ per total kWh Jan Feb Mar Apr May Jun Jul Aug Sep Oct Nov Dec $0.00312 $0.00303 $0.00269 ($0.00126) $0.00233 $0.00205 $0.00130 $0.00206 $0.00175 $0.00223 $0.00299 $0.00222 Delivery Charge $ per kWh within defined block 0-450 hrs of peak kW Above 450 hrs of peak kW Charge $0.01039 / kWh $0.00380 / kWh Electric Supply Cost, Delivery Charge Adjustment1 See Figure 69
1 – Variable Energy Charges are from October 2005 – September 2006 as available at the 1Niagara Mohawk website.
Filenames: NIMO_SC3_Sec_CENTRAL_Oct05-Sep06.CSV, nimo_sc3_Sec_Central_oct05-sep06.dat
SC 3 Large General Secondary for Central Region
Jan Feb Mar Apr May Jun Jul Aug Sep Oct Nov Dec0.00
0.05
0.10
0.15
Ele
ctric
Sup
ply
plus
Del
iver
y C
harg
e A
djus
tmen
t ($/
kWh)
Figure 69 Daily Electric Charges for SC3 from October 2005 through September 2006 for Central Region

NYSERDA DG/CHP Integrated Database System Utility Rate Details
CDH Energy Corporation 208 September 25, 2008
Niagara Mohawk
Service Classification 3 – Large General - Secondary (Central Region) – July 2007 to June 2008 This service is for commercial or industrial customers whose monthly measured demand exceeds 100kW in each of the previous 12 consecutive months. When the monthly demand has exceeded 2,000 kW in any two consecutive months of the previous twelve months the facility must be billed under SC-3a. This rate is for facilities located in the Central Region. Service Charge $ 260.15
Reactive Demand Charge $ 0.85 / RkVA in excess of 1/3 peak demand in kW Demand Charges $ per peak kW within the defined block Block Charges 0-40 kW Above 40 kW Charge $666.00 $16.65 / kW Energy Charges $ per total kWh within defined period Systems Benefit and Renewable Portfolio Charge $ 0.002263 / kWh Transmission Revenue Adjustment $ per total kWh Jan Feb Mar Apr May Jun Jul Aug Sep Oct Nov Dec ($0.00074) ($0.00098) ($0.00068) $0.00166 $0.00097 $0.00196 ($0.00023) $0.00152 $0.00078 $0.00006 ($0.00002) $0.00078 Delivery Charge $ per kWh within defined block 0-450 hrs of peak kW Above 450 hrs of peak kW Charge $0.00135 / kWh $0.00384 / kWh Electric Supply Cost, Delivery Charge Adjustment1 See Figure 70
1 – Variable Energy Charges are from July 2007 – June 2008 as available at the 1Niagara Mohawk website.
Filenames: NIMO_SC3_Sec_CENTRAL_Jul07-Jun08.CSV, nimo_sc3_Sec_Central_jun07-may08.dat
Figure 70 Daily Electric Charges for SC3 from June 2007 through May 2008 for Central Region

NYSERDA DG/CHP Integrated Database System Utility Rate Details
CDH Energy Corporation 209 September 25, 2008
Niagara Mohawk
Service Classification 3 – Large General - Secondary (Adirondack Region) – February 2005 to January 2006 This service is for commercial or industrial customers whose monthly measured demand exceeds 100kW in each of the previous 12 consecutive months. When the monthly demand has exceeded 2,000 kW in any two consecutive months of the previous twelve months the facility must be billed under SC-3a. This rate is for facilities located in the Adirondack Region. Service Charge $ 260.15
Reactive Demand Charge $ 0.85 / RkVA in excess of 1/3 peak demand in kW Demand Charges $ per peak kW within the defined block Block Charges 0-40 kW Above 40 kW Charge $598.80 $14.97 / kW Energy Charges $ per total kWh within defined period Systems Benefit and Renewable Portfolio Charge $ 0.001729 / kWh Transmission Revenue Adjustment $ per total kWh Jan Feb Mar Apr May Jun Jul Aug Sep Oct Nov Dec $0.00222 $0.00312 $0.00140 $0.00114 $0.00182 $0.00234 $0.00240 $0.00193 $0.00003 $0.00135 $0.00223 $0.00299 Delivery Charge $ per kWh within defined block 0-450 hrs of peak kW Above 450 hrs of peak kW Charge $0.01039 / kWh $0.00380 / kWh Electric Supply Cost, Delivery Charge Adjustment1 See Figure 71
1 – Variable Energy Charges are from February 2005 – January 2006 as available at the 1Niagara Mohawk website.
Filenames: NIMO_SC3_Sec_ADIRONDACK_feb05-jan06.CSV, nimo_sc3_Sec_Adirondack.dat
Nimo - SC3 Large General Secondary for Adirondack Region
Jan Feb Mar Apr May Jun Jul Aug Sep Oct Nov Dec0.00
0.02
0.04
0.06
0.08
0.10
0.12
0.14
Ele
ctric
Sup
ply
plus
Del
iver
y C
harg
e A
djus
tmen
t ($/
kWh)
Figure 71 Daily Electric Charges for SC3 from February 2005 through January 2006 for Adirondack Region

NYSERDA DG/CHP Integrated Database System Utility Rate Details
CDH Energy Corporation 210 September 25, 2008
Niagara Mohawk
Service Classification 3 – Large General - Secondary (Adirondack Region) – October 2005 to September 2006 This service is for commercial or industrial customers whose monthly measured demand exceeds 100kW in each of the previous 12 consecutive months. When the monthly demand has exceeded 2,000 kW in any two consecutive months of the previous twelve months the facility must be billed under SC-3a. This rate is for facilities located in the Adirondack Region. Service Charge $ 260.15
Reactive Demand Charge $ 0.85 / RkVA in excess of 1/3 peak demand in kW Demand Charges $ per peak kW within the defined block Block Charges 0-40 kW Above 40 kW Charge $664.40 $16.61 / kW Energy Charges $ per total kWh within defined period Systems Benefit and Renewable Portfolio Charge $ 0.002110 / kWh Transmission Revenue Adjustment $ per total kWh Jan Feb Mar Apr May Jun Jul Aug Sep Oct Nov Dec $0.00312 $0.00303 $0.00269 ($0.00126) $0.00233 $0.00205 $0.00130 $0.00206 $0.00175 $0.00223 $0.00299 $0.00222 Delivery Charge $ per kWh within defined block 0-450 hrs of peak kW Above 450 hrs of peak kW Charge $0.01039 / kWh $0.00380 / kWh Electric Supply Cost, Delivery Charge Adjustment1 See Figure 72
1 – Variable Energy Charges are from October 2005 – September 2006 as available at the 1Niagara Mohawk website.
Filenames: NIMO_SC3_Sec_ADIRONDACK_oct05-sep06.CSV, nimo_sc3_Sec_Adirondack_oct05-sep06.dat
SC 3 Large General Secondary for Adirondack Region
Jan Feb Mar Apr May Jun Jul Aug Sep Oct Nov Dec0.00
0.02
0.04
0.06
0.08
0.10
0.12
0.14
Ele
ctric
Sup
ply
plus
Del
iver
y C
harg
e A
djus
tmen
t ($/
kWh)
Figure 72 Daily Electric Charges for SC3 from October 2005 through September 2006 for Adirondack Region

NYSERDA DG/CHP Integrated Database System Utility Rate Details
CDH Energy Corporation 211 September 25, 2008
Niagara Mohawk
Service Classification 3 – Large General - Secondary (Adirondack Region) – July 2007 to June 2008 This service is for commercial or industrial customers whose monthly measured demand exceeds 100kW in each of the previous 12 consecutive months. When the monthly demand has exceeded 2,000 kW in any two consecutive months of the previous twelve months the facility must be billed under SC-3a. This rate is for facilities located in the Adirondack Region. Service Charge $ 260.15
Reactive Demand Charge $ 0.85 / RkVA in excess of 1/3 peak demand in kW Demand Charges $ per peak kW within the defined block Block Charges 0-40 kW Above 40 kW Charge $666.00 $16.65 / kW Energy Charges $ per total kWh within defined period Systems Benefit and Renewable Portfolio Charge $ 0.002263 / kWh Transmission Revenue Adjustment $ per total kWh Jan Feb Mar Apr May Jun Jul Aug Sep Oct Nov Dec ($0.00074) ($0.00098) ($0.00068) $0.00166 $0.00097 $0.00196 ($0.00023) $0.00152 $0.00078 $0.00006 ($0.00002) $0.00078 Delivery Charge $ per kWh within defined block 0-450 hrs of peak kW Above 450 hrs of peak kW Charge $0.01135 / kWh $0.00384 / kWh Electric Supply Cost, Delivery Charge Adjustment1 See Figure 73
1 – Variable Energy Charges are from July 2007 – June 2008 as available at the 1Niagara Mohawk website.
Filenames: NIMO_SC3_Sec_ADIRONDACK_Jul07-Jun08.CSV, nimo_sc3_Sec_Adirondack_jun07-may08.dat
Figure 73 Daily Electric Charges for SC3 from June 2007 through May 2008 for Adirondack Region

NYSERDA DG/CHP Integrated Database System Utility Rate Details
CDH Energy Corporation 212 September 25, 2008
Niagara Mohawk
Service Classification 3 – Large General - Secondary (Utica Region) – February 2005 to January 2006 This service is for commercial or industrial customers whose monthly measured demand exceeds 100kW in each of the previous 12 consecutive months. When the monthly demand has exceeded 2,000 kW in any two consecutive months of the previous twelve months the facility must be billed under SC-3a. This rate is for facilities located in the Utica Region. Service Charge $ 260.15
Reactive Demand Charge $ 0.85 / RkVA in excess of 1/3 peak demand in kW Demand Charges $ per peak kW within the defined block Block Charges 0-40 kW Above 40 kW Charge $598.80 $14.97 / kW Energy Charges $ per total kWh within defined period Systems Benefit and Renewable Portfolio Charge $ 0.001729 / kWh Transmission Revenue Adjustment $ per total kWh Jan Feb Mar Apr May Jun Jul Aug Sep Oct Nov Dec $0.00222 $0.00312 $0.00140 $0.00114 $0.00182 $0.00234 $0.00240 $0.00193 $0.00003 $0.00135 $0.00223 $0.00299 Delivery Charge $ per kWh within defined block 0-450 hrs of peak kW Above 450 hrs of peak kW Charge $0.01039 / kWh $0.00380 / kWh Electric Supply Cost, Delivery Charge Adjustment1 See Figure 74
1 – Variable Energy Charges are from February 2005 – January 2006 as available at the 1Niagara Mohawk website.
Filenames: NIMO_SC3_Sec_UTICA_feb05-jan06.CSV, nimo_sc3_Sec_Utica.dat
Nimo - SC3 Large General Secondary for Utica Region
Jan Feb Mar Apr May Jun Jul Aug Sep Oct Nov Dec0.00
0.02
0.04
0.06
0.08
0.10
0.12
Ele
ctric
Sup
ply
plus
Del
iver
y C
harg
e A
djus
tmen
t ($/
kWh)
Figure 74 Daily Electric Charges for SC3 from February 2005 through January 2006 for Utica Region

NYSERDA DG/CHP Integrated Database System Utility Rate Details
CDH Energy Corporation 213 September 25, 2008
Niagara Mohawk
Service Classification 3 – Large General - Secondary (Utica Region) – October 2005 to September 2006 This service is for commercial or industrial customers whose monthly measured demand exceeds 100kW in each of the previous 12 consecutive months. When the monthly demand has exceeded 2,000 kW in any two consecutive months of the previous twelve months the facility must be billed under SC-3a. This rate is for facilities located in the Utica Region. Service Charge $ 260.15
Reactive Demand Charge $ 0.85 / RkVA in excess of 1/3 peak demand in kW Demand Charges $ per peak kW within the defined block Block Charges 0-40 kW Above 40 kW Charge $664.40 $16.61 / kW Energy Charges $ per total kWh within defined period Systems Benefit and Renewable Portfolio Charge $ 0.002110 / kWh Transmission Revenue Adjustment $ per total kWh Jan Feb Mar Apr May Jun Jul Aug Sep Oct Nov Dec $0.00312 $0.00303 $0.00269 ($0.00126) $0.00233 $0.00205 $0.00130 $0.00206 $0.00175 $0.00223 $0.00299 $0.00222 Delivery Charge $ per kWh within defined block 0-450 hrs of peak kW Above 450 hrs of peak kW Charge $0.01039 / kWh $0.00380 / kWh Electric Supply Cost, Delivery Charge Adjustment1 See Figure 75
1 – Variable Energy Charges are from October 2005 – September 2006 as available at the 1Niagara Mohawk website.
Filenames: NIMO_SC3_Sec_UTICA_oct05-sep06.CSV, nimo_sc3_Sec_Utica_oct05-sep06.dat
SC 3 Large General Secondary for Utica Region
Jan Feb Mar Apr May Jun Jul Aug Sep Oct Nov Dec0.00
0.02
0.04
0.06
0.08
0.10
0.12
Ele
ctric
Sup
ply
plus
Del
iver
y C
harg
e A
djus
tmen
t ($/
kWh)
Figure 75 Daily Electric Charges for SC3 from October 2005 through September 2006 for Utica Region

NYSERDA DG/CHP Integrated Database System Utility Rate Details
CDH Energy Corporation 214 September 25, 2008
Niagara Mohawk
Service Classification 3 – Large General - Secondary (Utica Region) – July 2007 to June 2008 This service is for commercial or industrial customers whose monthly measured demand exceeds 100kW in each of the previous 12 consecutive months. When the monthly demand has exceeded 2,000 kW in any two consecutive months of the previous twelve months the facility must be billed under SC-3a. This rate is for facilities located in the Utica Region. Service Charge $ 260.15
Reactive Demand Charge $ 0.85 / RkVA in excess of 1/3 peak demand in kW Demand Charges $ per peak kW within the defined block Block Charges 0-40 kW Above 40 kW Charge $666.00 $16.65 / kW Energy Charges $ per total kWh within defined period Systems Benefit and Renewable Portfolio Charge $ 0.002263 / kWh Transmission Revenue Adjustment $ per total kWh Jan Feb Mar Apr May Jun Jul Aug Sep Oct Nov Dec ($0.00074) ($0.00098) ($0.00068) $0.00166 $0.00097 $0.00196 ($0.00023) $0.00152 $0.00078 $0.00006 ($0.00002) $0.00078 Delivery Charge $ per kWh within defined block 0-450 hrs of peak kW Above 450 hrs of peak kW Charge $0.01135 / kWh $0.00384 / kWh Electric Supply Cost, Delivery Charge Adjustment1 See Figure 76
1 – Variable Energy Charges are from July 2007 – June 2008 as available at the 1Niagara Mohawk website.
Filenames: NIMO_SC3_Sec_UTICA_Jul07-Jun08.CSV, nimo_sc3_Sec_Utica_ju07-may08.dat
Figure 76 Daily Electric Charges for SC3 from June 2007 through May 2008 for Utica Region

NYSERDA DG/CHP Integrated Database System Utility Rate Details
CDH Energy Corporation 215 September 25, 2008
Niagara Mohawk
Service Classification 3 – Large General - Secondary (Capital Region) – February 2005 to January 2006 This service is for commercial or industrial customers whose monthly measured demand exceeds 100kW in each of the previous 12 consecutive months. When the monthly demand has exceeded 2,000 kW in any two consecutive months of the previous twelve months the facility must be billed under SC-3a. This rate is for facilities located in the Capital Region. Service Charge $ 260.15
Reactive Demand Charge $ 0.85 / RkVA in excess of 1/3 peak demand in kW Demand Charges $ per peak kW within the defined block Block Charges 0-40 kW Above 40 kW Charge $598.80 $14.97 / kW Energy Charges $ per total kWh within defined period Systems Benefit and Renewable Portfolio Charge $ 0.001729 / kWh Transmission Revenue Adjustment $ per total kWh Jan Feb Mar Apr May Jun Jul Aug Sep Oct Nov Dec $0.00222 $0.00312 $0.00140 $0.00114 $0.00182 $0.00234 $0.00240 $0.00193 $0.00003 $0.00135 $0.00223 $0.00299 Delivery Charge $ per kWh within defined block 0-450 hrs of peak kW Above 450 hrs of peak kW Charge $0.00873 / kWh $0.00203 / kWh Electric Supply Cost, Delivery Charge Adjustment1 See Figure 77
1 – Variable Energy Charges are from February 2005 – January 2006 as available at the 1Niagara Mohawk website.
Filenames: NIMO_SC3_Sec_CAPITAL_feb05-jan06.CSV, nimo_sc3_Sec_Capital.dat
Nimo - SC3 Large General Secondary for Capital Region
Jan Feb Mar Apr May Jun Jul Aug Sep Oct Nov Dec0.00
0.05
0.10
0.15
Ele
ctric
Sup
ply
plus
Del
iver
y C
harg
e A
djus
tmen
t ($/
kWh)
Figure 77 Daily Electric Charges for SC3 from February 2005 through January 2006 for Capital Region

NYSERDA DG/CHP Integrated Database System Utility Rate Details
CDH Energy Corporation 216 September 25, 2008
Niagara Mohawk
Service Classification 3 – Large General - Secondary (Capital Region) – October 2005 to September 2006This service is for commercial or industrial customers whose monthly measured demand exceeds 100kW in each of the previous 12 consecutive months. When the monthly demand has exceeded 2,000 kW in any two consecutive months of the previous twelve months the facility must be billed under SC-3a. This rate is for facilities located in the Capital Region. Service Charge $ 260.15
Reactive Demand Charge $ 0.85 / RkVA in excess of 1/3 peak demand in kW Demand Charges $ per peak kW within the defined block Block Charges 0-40 kW Above 40 kW Charge $664.40 $16.61 / kW Energy Charges $ per total kWh within defined period Systems Benefit and Renewable Portfolio Charge $ 0.002110 / kWh Transmission Revenue Adjustment $ per total kWh Jan Feb Mar Apr May Jun Jul Aug Sep Oct Nov Dec $0.00222 $0.00312 $0.00140 $0.00114 $0.00182 $0.00234 $0.00240 $0.00193 $0.00003 $0.00135 $0.00223 $0.00299 Delivery Charge $ per kWh within defined block 0-450 hrs of peak kW Above 450 hrs of peak kW Charge $0.00873 / kWh $0.00203 / kWh Electric Supply Cost, Delivery Charge Adjustment1 See Figure 78
1 – Variable Energy Charges are from October 2005 – September 2006 as available at the 1Niagara Mohawk website.
Filenames: NIMO_SC3_Sec_CAPITAL_oct05-sep06.CSV, nimo_sc3_Sec_Capital_oct05-sep06.dat
SC 3 Large General Secondary for Capital Region
Jan Feb Mar Apr May Jun Jul Aug Sep Oct Nov Dec0.00
0.05
0.10
0.15
Ele
ctric
Sup
ply
plus
Del
iver
y C
harg
e A
djus
tmen
t ($/
kWh)
Figure 78 Daily Electric Charges for SC3 from October 2005 through September 2006 for Capital Region

NYSERDA DG/CHP Integrated Database System Utility Rate Details
CDH Energy Corporation 217 September 25, 2008
Niagara Mohawk
Service Classification 3 – Large General - Secondary (Capital Region) – July 2007 to June 2008 This service is for commercial or industrial customers whose monthly measured demand exceeds 100kW in each of the previous 12 consecutive months. When the monthly demand has exceeded 2,000 kW in any two consecutive months of the previous twelve months the facility must be billed under SC-3a. This rate is for facilities located in the Capital Region. Service Charge $ 260.15
Reactive Demand Charge $ 0.85 / RkVA in excess of 1/3 peak demand in kW Demand Charges $ per peak kW within the defined block Block Charges 0-40 kW Above 40 kW Charge $666.00 $16.65 / kW Energy Charges $ per total kWh within defined period Systems Benefit and Renewable Portfolio Charge $ 0.002263 / kWh Transmission Revenue Adjustment $ per total kWh Jan Feb Mar Apr May Jun Jul Aug Sep Oct Nov Dec ($0.00074) ($0.00098) ($0.00068) $0.00166 $0.00097 $0.00196 ($0.00023) $0.00152 $0.00078 $0.00006 ($0.00002) $0.00078 Delivery Charge $ per kWh within defined block 0-450 hrs of peak kW Above 450 hrs of peak kW Charge $0.01135 / kWh $0.00384 / kWh Electric Supply Cost, Delivery Charge Adjustment1 See Figure 79
1 – Variable Energy Charges are from July 2007 – June 2008 as available at the 1Niagara Mohawk website.
Filenames: NIMO_SC3_Sec_CAPITAL_Jul07-Jun08.CSV, nimo_sc3_Sec_Capital_jun07-may08.dat
Figure 79 Daily Electric Charges for SC3 from June 2007 through May 2008 for Capital Region

NYSERDA DG/CHP Integrated Database System Utility Rate Details
CDH Energy Corporation 218 September 25, 2008
Niagara Mohawk
Service Classification 3 – Large General – Primary (Frontier Region) – February 2005 to January 2006 This service is for commercial or industrial customers whose monthly measured demand exceeds 100kW in each of the previous 12 consecutive months. When the monthly demand has exceeded 2,000 kW in any two consecutive months of the previous twelve months the facility must be billed under SC-3a. Primary customers are served at voltage levels between 2.2 and 15 kV. This rate is for facilities located in the Frontier Region. Service Charge $ 436.70
Reactive Demand Charge $ 0.85 / RkVA in excess of 1/3 peak demand in kW Demand Charges $ per peak kW within the defined block Block Charges 0-40 kW Above 40 kW Charge $507.60 $12.69 / kW Energy Charges $ per total kWh within defined period Systems Benefit and Renewable Portfolio Charge $ 0.001729 / kWh Transmission Revenue Adjustment $ per total kWh Jan Feb Mar Apr May Jun Jul Aug Sep Oct Nov Dec $0.00213 $0.00298 $0.00132 $0.00106 $0.00168 $0.00229 $0.00242 $0.00193 $0.00003 $0.00128 $0.00217 $0.00272 Delivery Charge $ per kWh within defined block 0-450 hrs of peak kW Above 450 hrs of peak kW Charge $0.01303 / kWh $0.00585 / kWh Electric Supply Cost, Delivery Charge Adjustment1 See Figure 80
1 – Variable Energy Charges are from February 2005 – January 2006 as available at the 1Niagara Mohawk website.
Filenames: NIMO_SC3_Pri_FRONTIER_feb05-jan06.CSV, nimo_sc3_Pri_Frontier.dat
Nimo - SC3 Large General Primary for Frontier Region
Jan Feb Mar Apr May Jun Jul Aug Sep Oct Nov Dec0.00
0.02
0.04
0.06
0.08
0.10
0.12
Ele
ctric
Sup
ply
plus
Del
iver
y C
harg
e A
djus
tmen
t ($/
kWh)
Figure 80 Daily Electric Charges for SC3 from February 2005 through January 2006 for Frontier Region

NYSERDA DG/CHP Integrated Database System Utility Rate Details
CDH Energy Corporation 219 September 25, 2008
Niagara Mohawk
Service Classification 3 – Large General – Primary (Frontier Region) – October 2005 to September 2006 This service is for commercial or industrial customers whose monthly measured demand exceeds 100kW in each of the previous 12 consecutive months. When the monthly demand has exceeded 2,000 kW in any two consecutive months of the previous twelve months the facility must be billed under SC-3a. Primary customers are served at voltage levels between 2.2 and 15 kV. This rate is for facilities located in the Frontier Region. Service Charge $ 436.70
Reactive Demand Charge $ 0.85 / RkVA in excess of 1/3 peak demand in kW Demand Charges $ per peak kW within the defined block Block Charges 0-40 kW Above 40 kW Charge $609.20 $15.23 / kW Energy Charges $ per total kWh within defined period Systems Benefit and Renewable Portfolio Charge $ 0.002110 / kWh Transmission Revenue Adjustment $ per total kWh Jan Feb Mar Apr May Jun Jul Aug Sep Oct Nov Dec $0.00298 $0.00293 $0.00258 ($0.00120) $0.00224 $0.00195 $0.00124 $0.00196 $0.00167 $0.00217 $0.00272 $0.00213 Delivery Charge $ per kWh within defined block 0-450 hrs of peak kW Above 450 hrs of peak kW Charge $0.01303 / kWh $0.00585 / kWh Electric Supply Cost, Delivery Charge Adjustment1 See Figure 81
1 – Variable Energy Charges are from October 2005 – September 2006 as available at the 1Niagara Mohawk website.
Filenames: NIMO_SC3_Pri_FRONTIER_oct05-sep06.CSV, nimo_sc3_Pri_Frontier_oct05-sep06.dat
SC 3 Large General Primary for Frontier Region
Jan Feb Mar Apr May Jun Jul Aug Sep Oct Nov Dec0.00
0.02
0.04
0.06
0.08
0.10
0.12
Ele
ctric
Sup
ply
plus
Del
iver
y C
harg
e A
djus
tmen
t ($/
kWh)
Figure 81 Daily Electric Charges for SC3 from October 2005 through September 2006 for Frontier Region

NYSERDA DG/CHP Integrated Database System Utility Rate Details
CDH Energy Corporation 220 September 25, 2008
Niagara Mohawk
Service Classification 3 – Large General – Primary (Frontier Region) – July 2007 to June 2008 This service is for commercial or industrial customers whose monthly measured demand exceeds 100kW in each of the previous 12 consecutive months. When the monthly demand has exceeded 2,000 kW in any two consecutive months of the previous twelve months the facility must be billed under SC-3a. Primary customers are served at voltage levels between 2.2 and 15 kV. This rate is for facilities located in the Frontier Region. Service Charge $ 436.70
Reactive Demand Charge $ 0.85 / RkVA in excess of 1/3 peak demand in kW Demand Charges $ per peak kW within the defined block Block Charges 0-40 kW Above 40 kW Charge $568.00 $14.20 / kW Energy Charges $ per total kWh within defined period Systems Benefit and Renewable Portfolio Charge $ 0.002263/ kWh Transmission Revenue Adjustment $ per total kWh Jan Feb Mar Apr May Jun Jul Aug Sep Oct Nov Dec ($0.0009) ($0.0012) ($0.00083) $0.00204 $0.00118 $0.0024 ($0.00022) $0.00145 $0.00074 $0.00006 ($0.00002) $0.00075 Delivery Charge $ per kWh within defined block 0-450 hrs of peak kW Above 450 hrs of peak kW Charge $0.01351 / kWh $0.00521 / kWh Electric Supply Cost, Delivery Charge Adjustment1 See Figure 82
1 – Variable Energy Charges are from July 2007 – June 2008 as available at the 1Niagara Mohawk website. Filenames: NIMO_SC3_Pri_FRONTIER_Jul07-Jun08.CSV, nimo_sc3_Pri_Frontier_jun07-may08.dat
Figure 82 Daily Electric Charges for SC3 from June 2007 through May 2008 for Frontier Region

NYSERDA DG/CHP Integrated Database System Utility Rate Details
CDH Energy Corporation 221 September 25, 2008
Niagara Mohawk
Service Classification 3 – Large General – Primary (Genesee Region) – February 2005 to January 2006 This service is for commercial or industrial customers whose monthly measured demand exceeds 100kW in each of the previous 12 consecutive months. When the monthly demand has exceeded 2,000 kW in any two consecutive months of the previous twelve months the facility must be billed under SC-3a. Primary customers are served at voltage levels between 2.2 and 15 kV. This rate is for facilities located in the Genesee Region. Service Charge $ 436.70
Reactive Demand Charge $ 0.85 / RkVA in excess of 1/3 peak demand in kW Demand Charges $ per peak kW within the defined block Block Charges 0-40 kW Above 40 kW Charge $507.60 $12.69 / kW Energy Charges $ per total kWh within defined period Systems Benefit and Renewable Portfolio Charge $ 0.001729 / kWh Transmission Revenue Adjustment $ per total kWh Jan Feb Mar Apr May Jun Jul Aug Sep Oct Nov Dec $0.00213 $0.00298 $0.00132 $0.00106 $0.00168 $0.00229 $0.00242 $0.00193 $0.00003 $0.00128 $0.00217 $0.00272 Delivery Charge $ per kWh within defined block 0-450 hrs of peak kW Above 450 hrs of peak kW Charge $0.01303 / kWh $0.00585 / kWh Electric Supply Cost, Delivery Charge Adjustment1 See Figure 83
1 – Variable Energy Charges are from February 2005 – January 2006 as available at the 1Niagara Mohawk website.
Filenames: NIMO_SC3_Pri_GENESEE_feb05-jan06.CSV, nimo_sc3_Pri_Genesee.dat
Nimo - SC3 Large General Primary for Genesee Region
Jan Feb Mar Apr May Jun Jul Aug Sep Oct Nov Dec0.00
0.02
0.04
0.06
0.08
0.10
0.12
Ele
ctric
Sup
ply
plus
Del
iver
y C
harg
e A
djus
tmen
t ($/
kWh)
Figure 83 Daily Electric Charges for SC3 from February 2005 through January 2006 for Genesee Region

NYSERDA DG/CHP Integrated Database System Utility Rate Details
CDH Energy Corporation 222 September 25, 2008
Niagara Mohawk
Service Classification 3 – Large General – Primary (Genesee Region) – October 2005 to September 2006This service is for commercial or industrial customers whose monthly measured demand exceeds 100kW in each of the previous 12 consecutive months. When the monthly demand has exceeded 2,000 kW in any two consecutive months of the previous twelve months the facility must be billed under SC-3a. Primary customers are served at voltage levels between 2.2 and 15 kV. This rate is for facilities located in the Genesee Region. Service Charge $ 436.70
Reactive Demand Charge $ 0.85 / RkVA in excess of 1/3 peak demand in kW Demand Charges $ per peak kW within the defined block Block Charges 0-40 kW Above 40 kW Charge $609.20 $15.23 / kW Energy Charges $ per total kWh within defined period Systems Benefit and Renewable Portfolio Charge $ 0.002110 / kWh Transmission Revenue Adjustment $ per total kWh Jan Feb Mar Apr May Jun Jul Aug Sep Oct Nov Dec $0.00298 $0.00293 $0.00258 ($0.00120) $0.00224 $0.00195 $0.00124 $0.00196 $0.00167 $0.00217 $0.00272 $0.00213 Delivery Charge $ per kWh within defined block 0-450 hrs of peak kW Above 450 hrs of peak kW Charge $0.01303 / kWh $0.00585 / kWh Electric Supply Cost, Delivery Charge Adjustment1 See Figure 84
1 – Variable Energy Charges are from October 2005 – September 2006 as available at the 1Niagara Mohawk website.
Filenames: NIMO_SC3_Pri_GENESEE_oct05-sep06.CSV, nimo_sc3_Pri_Genesee_oct05-sep06.dat SC 3 Large General Primary for Genesee Region
Jan Feb Mar Apr May Jun Jul Aug Sep Oct Nov Dec0.00
0.02
0.04
0.06
0.08
0.10
0.12
Ele
ctric
Sup
ply
plus
Del
iver
y C
harg
e A
djus
tmen
t ($/
kWh)
Figure 84 Daily Electric Charges for SC3 from October 2005 through September 2006 for Genesee Region

NYSERDA DG/CHP Integrated Database System Utility Rate Details
CDH Energy Corporation 223 September 25, 2008
Niagara Mohawk
Service Classification 3 – Large General – Primary (Genesee Region) – July 2007 to June 2008 This service is for commercial or industrial customers whose monthly measured demand exceeds 100kW in each of the previous 12 consecutive months. When the monthly demand has exceeded 2,000 kW in any two consecutive months of the previous twelve months the facility must be billed under SC-3a. Primary customers are served at voltage levels between 2.2 and 15 kV. This rate is for facilities located in the Genesee Region. Service Charge $ 436.70
Reactive Demand Charge $ 0.85 / RkVA in excess of 1/3 peak demand in kW Demand Charges $ per peak kW within the defined block Block Charges 0-40 kW Above 40 kW Charge $568.00 $14.20 / kW Energy Charges $ per total kWh within defined period Systems Benefit and Renewable Portfolio Charge $ 0.002263 / kWh Transmission Revenue Adjustment $ per total kWh Jan Feb Mar Apr May Jun Jul Aug Sep Oct Nov Dec ($0.0009) ($0.0012) ($0.00083) $0.00204 $0.00118 $0.0024 ($0.00022) $0.00145 $0.00074 $0.00006 ($0.00002) $0.00075 Delivery Charge $ per kWh within defined block 0-450 hrs of peak kW Above 450 hrs of peak kW Charge $0.01351 / kWh $0.00521 / kWh Electric Supply Cost, Delivery Charge Adjustment1 See Figure 85
1 – Variable Energy Charges are from July 2007 – June 2008 as available at the 1Niagara Mohawk website.
Filenames: NIMO_SC3_Pri_GENESEE_Jul07-Jun08.CSV, nimo_sc3_Pri_Genesee_jun07-may08.dat
Figure 85 Daily Electric Charges for SC3 from June 2007 through May 2008 for Genesee Region

NYSERDA DG/CHP Integrated Database System Utility Rate Details
CDH Energy Corporation 224 September 25, 2008
Niagara Mohawk
Service Classification 3 – Large General – Primary (Central Region) – February 2005 to January 2006 This service is for commercial or industrial customers whose monthly measured demand exceeds 100kW in each of the previous 12 consecutive months. When the monthly demand has exceeded 2,000 kW in any two consecutive months of the previous twelve months the facility must be billed under SC-3a. Primary customers are served at voltage levels between 2.2 and 15 kV. This rate is for facilities located in the Central Region. Service Charge $ 436.70
Reactive Demand Charge $ 0.85 / RkVA in excess of 1/3 peak demand in kW Demand Charges $ per peak kW within the defined block Block Charges 0-40 kW Above 40 kW Charge $507.60 $12.69 / kW Energy Charges $ per total kWh within defined period Systems Benefit and Renewable Portfolio Charge $ 0.001729 / kWh Transmission Revenue Adjustment $ per total kWh Jan Feb Mar Apr May Jun Jul Aug Sep Oct Nov Dec $0.00213 $0.00298 $0.00132 $0.00106 $0.00168 $0.00229 $0.00242 $0.00193 $0.00003 $0.00128 $0.00217 $0.00272 Delivery Charge $ per kWh within defined block 0-450 hrs of peak kW Above 450 hrs of peak kW Charge $0.01210 / kWh $0.00487 / kWh Electric Supply Cost, Delivery Charge Adjustment1 See Figure 86
1 – Variable Energy Charges are from February 2005 – January 2006 as available at the 1Niagara Mohawk website.
Filenames: NIMO_SC3_Pri_CENTRAL_feb05-jan06.CSV, nimo_sc3_Pri_Central.dat
Nimo - SC3 Large General Primary for Central Region
Jan Feb Mar Apr May Jun Jul Aug Sep Oct Nov Dec0.00
0.02
0.04
0.06
0.08
0.10
0.12
0.14
Ele
ctric
Sup
ply
plus
Del
iver
y C
harg
e A
djus
tmen
t ($/
kWh)
Figure 86 Daily Electric Charges for SC3 from February 2005 through January 2006 for Central Region

NYSERDA DG/CHP Integrated Database System Utility Rate Details
CDH Energy Corporation 225 September 25, 2008
Niagara Mohawk
Service Classification 3 – Large General – Primary (Central Region) – October 2005 to September 2006 This service is for commercial or industrial customers whose monthly measured demand exceeds 100kW in each of the previous 12 consecutive months. When the monthly demand has exceeded 2,000 kW in any two consecutive months of the previous twelve months the facility must be billed under SC-3a. Primary customers are served at voltage levels between 2.2 and 15 kV. This rate is for facilities located in the Central Region. Service Charge $ 436.70
Reactive Demand Charge $ 0.85 / RkVA in excess of 1/3 peak demand in kW Demand Charges $ per peak kW within the defined block Block Charges 0-40 kW Above 40 kW Charge $609.20 $15.23 / kW Energy Charges $ per total kWh within defined period Systems Benefit and Renewable Portfolio Charge $ 0.002110 / kWh Transmission Revenue Adjustment $ per total kWh Jan Feb Mar Apr May Jun Jul Aug Sep Oct Nov Dec $0.00298 $0.00293 $0.00258 ($0.00120) $0.00224 $0.00195 $0.00124 $0.00196 $0.00167 $0.00217 $0.00272 $0.00213 Delivery Charge $ per kWh within defined block 0-450 hrs of peak kW Above 450 hrs of peak kW Charge $0.01210 / kWh $0.00487 / kWh Electric Supply Cost, Delivery Charge Adjustment1 See Figure 87
1 – Variable Energy Charges are from October 2005 – September 2006 as available at the 1Niagara Mohawk website.
Filenames: NIMO_SC3_Pri_CENTRAL_oct05-sep06.CSV, nimo_sc3_Pri_Central_oct05-sep06.dat
SC 3 Large General Primary for Central Region
Jan Feb Mar Apr May Jun Jul Aug Sep Oct Nov Dec0.00
0.02
0.04
0.06
0.08
0.10
0.12
0.14
Ele
ctric
Sup
ply
plus
Del
iver
y C
harg
e A
djus
tmen
t ($/
kWh)
Figure 87 Daily Electric Charges for SC3 from October 2005 through September 2006 for Central Region

NYSERDA DG/CHP Integrated Database System Utility Rate Details
CDH Energy Corporation 226 September 25, 2008
Niagara Mohawk
Service Classification 3 – Large General – Primary (Central Region) – July 2007 to June 2008 This service is for commercial or industrial customers whose monthly measured demand exceeds 100kW in each of the previous 12 consecutive months. When the monthly demand has exceeded 2,000 kW in any two consecutive months of the previous twelve months the facility must be billed under SC-3a. Primary customers are served at voltage levels between 2.2 and 15 kV. This rate is for facilities located in the Central Region. Service Charge $ 436.70
Reactive Demand Charge $ 0.85 / RkVA in excess of 1/3 peak demand in kW Demand Charges $ per peak kW within the defined block Block Charges 0-40 kW Above 40 kW Charge $568.00 $14.20 / kW Energy Charges $ per total kWh within defined period Systems Benefit and Renewable Portfolio Charge $ 0.002263 / kWh Transmission Revenue Adjustment $ per total kWh Jan Feb Mar Apr May Jun Jul Aug Sep Oct Nov Dec ($0.0009) ($0.0012) ($0.00083) $0.00204 $0.00118 $0.0024 ($0.00022) $0.00145 $0.00074 $0.00006 ($0.00002) $0.00075 Delivery Charge $ per kWh within defined block 0-450 hrs of peak kW Above 450 hrs of peak kW Charge $0.01351 / kWh $0.00521/ kWh Electric Supply Cost, Delivery Charge Adjustment1 See Figure 88
1 – Variable Energy Charges are from July 2007 – June 2008 as available at the 1Niagara Mohawk website.
Filenames: NIMO_SC3_Pri_CENTRAL_Jul07-Jun08.CSV, nimo_sc3_Pri_Central_jun07-may08.dat
Figure 88 Daily Electric Charges for SC3 from June 2007 through May 2008 for Central Region

NYSERDA DG/CHP Integrated Database System Utility Rate Details
CDH Energy Corporation 227 September 25, 2008
Niagara Mohawk
Service Classification 3 – Large General – Primary (Adirondack Region) – February 2005 to January 2006This service is for commercial or industrial customers whose monthly measured demand exceeds 100kW in each of the previous 12 consecutive months. When the monthly demand has exceeded 2,000 kW in any two consecutive months of the previous twelve months the facility must be billed under SC-3a. Primary customers are served at voltage levels between 2.2 and 15 kV. This rate is for facilities located in the Adirondack Region. Service Charge $ 436.70
Reactive Demand Charge $ 0.85 / RkVA in excess of 1/3 peak demand in kW Demand Charges $ per peak kW within the defined block Block Charges 0-40 kW Above 40 kW Charge $507.60 $12.69 / kW Energy Charges $ per total kWh within defined period Systems Benefit and Renewable Portfolio Charge $ 0.001729 / kWh Transmission Revenue Adjustment $ per total kWh Jan Feb Mar Apr May Jun Jul Aug Sep Oct Nov Dec $0.00213 $0.00298 $0.00132 $0.00106 $0.00168 $0.00229 $0.00242 $0.00193 $0.00003 $0.00128 $0.00217 $0.00272 Delivery Charge $ per kWh within defined block 0-450 hrs of peak kW Above 450 hrs of peak kW Charge $0.01210 / kWh $0.00487 / kWh Electric Supply Cost, Delivery Charge Adjustment1 See Figure 89
1 – Variable Energy Charges are from February 2005 – January 2006 as available at the 1Niagara Mohawk website.
Filenames: NIMO_SC3_Pri_ADIRONDACK_feb05-jan06.CSV, nimo_sc3_Pri_Adirondack.dat
Nimo - SC3 Large General Primary for Adirondack Region
Jan Feb Mar Apr May Jun Jul Aug Sep Oct Nov Dec0.00
0.02
0.04
0.06
0.08
0.10
0.12
Ele
ctric
Sup
ply
plus
Del
iver
y C
harg
e A
djus
tmen
t ($/
kWh)
Figure 89 Daily Electric Charges for SC3 from February 2005 through January 2006 for Adirondack Region

NYSERDA DG/CHP Integrated Database System Utility Rate Details
CDH Energy Corporation 228 September 25, 2008
Niagara Mohawk
Service Classification 3 – Large General – Primary (Adirondack Region) – October 2005 to September 2006 This service is for commercial or industrial customers whose monthly measured demand exceeds 100kW in each of the previous 12 consecutive months. When the monthly demand has exceeded 2,000 kW in any two consecutive months of the previous twelve months the facility must be billed under SC-3a. Primary customers are served at voltage levels between 2.2 and 15 kV. This rate is for facilities located in the Adirondack Region. Service Charge $ 436.70
Reactive Demand Charge $ 0.85 / RkVA in excess of 1/3 peak demand in kW Demand Charges $ per peak kW within the defined block Block Charges 0-40 kW Above 40 kW Charge $609.20 $15.23 / kW Energy Charges $ per total kWh within defined period Systems Benefit and Renewable Portfolio Charge $ 0.002110 / kWh Transmission Revenue Adjustment $ per total kWh Jan Feb Mar Apr May Jun Jul Aug Sep Oct Nov Dec $0.00298 $0.00293 $0.00258 ($0.00120) $0.00224 $0.00195 $0.00124 $0.00196 $0.00167 $0.00217 $0.00272 $0.00213 Delivery Charge $ per kWh within defined block 0-450 hrs of peak kW Above 450 hrs of peak kW Charge $0.01210 / kWh $0.00487 / kWh Electric Supply Cost, Delivery Charge Adjustment1 See Figure 90
1 – Variable Energy Charges are from October 2005 – September 2006 as available at the 1Niagara Mohawk website.
Filenames: NIMO_SC3_Pri_ADIRONDACK_oct05-sep06.CSV, nimo_sc3_Pri_Adirondack_oct05-sep06.dat
SC 3 Large General Primary for Adirondack Region
Jan Feb Mar Apr May Jun Jul Aug Sep Oct Nov Dec0.00
0.02
0.04
0.06
0.08
0.10
0.12
Ele
ctric
Sup
ply
plus
Del
iver
y C
harg
e A
djus
tmen
t ($/
kWh)
Figure 90 Daily Electric Charges for SC3 from October 2005 through September 2006 for Adirondack Region

NYSERDA DG/CHP Integrated Database System Utility Rate Details
CDH Energy Corporation 229 September 25, 2008
Niagara Mohawk
Service Classification 3 – Large General – Primary (Adirondack Region) – July 2007 to June 2008 This service is for commercial or industrial customers whose monthly measured demand exceeds 100kW in each of the previous 12 consecutive months. When the monthly demand has exceeded 2,000 kW in any two consecutive months of the previous twelve months the facility must be billed under SC-3a. Primary customers are served at voltage levels between 2.2 and 15 kV. This rate is for facilities located in the Adirondack Region. Service Charge $ 436.70
Reactive Demand Charge $ 0.85 / RkVA in excess of 1/3 peak demand in kW Demand Charges $ per peak kW within the defined block Block Charges 0-40 kW Above 40 kW Charge $568.00 $14.20 / kW Energy Charges $ per total kWh within defined period Systems Benefit and Renewable Portfolio Charge $ 0.002263 / kWh Transmission Revenue Adjustment $ per total kWh Jan Feb Mar Apr May Jun Jul Aug Sep Oct Nov Dec ($0.0009) ($0.0012) ($0.00083) $0.00204 $0.00118 $0.0024 ($0.00022) $0.00145 $0.00074 $0.00006 ($0.00002) $0.00075 Delivery Charge $ per kWh within defined block 0-450 hrs of peak kW Above 450 hrs of peak kW Charge $0.01351 / kWh $0.00521 / kWh Electric Supply Cost, Delivery Charge Adjustment1 See Figure 91
1 – Variable Energy Charges are from July 2007 – June 2008 as available at the 1Niagara Mohawk website.
Filenames: NIMO_SC3_Pri_ADIRONDACK_Jul07-Jun08.CSV, nimo_sc3_Pri_Adirondack_jun07-may08.dat
Figure 91 Daily Electric Charges for SC3 from June 2007 through May 2008 for Adirondack Region

NYSERDA DG/CHP Integrated Database System Utility Rate Details
CDH Energy Corporation 230 September 25, 2008
Niagara Mohawk
Service Classification 3 – Large General – Primary (Utica Region) – February 2005 to January 2006 This service is for commercial or industrial customers whose monthly measured demand exceeds 100kW in each of the previous 12 consecutive months. When the monthly demand has exceeded 2,000 kW in any two consecutive months of the previous twelve months the facility must be billed under SC-3a. Primary customers are served at voltage levels between 2.2 and 15 kV. This rate is for facilities located in the Utica Region. Service Charge $ 436.70
Reactive Demand Charge $ 0.85 / RkVA in excess of 1/3 peak demand in kW Demand Charges $ per peak kW within the defined block Block Charges 0-40 kW Above 40 kW Charge $507.60 $12.69 / kW Energy Charges $ per total kWh within defined period Systems Benefit and Renewable Portfolio Charge $ 0.001729 / kWh Transmission Revenue Adjustment $ per total kWh Jan Feb Mar Apr May Jun Jul Aug Sep Oct Nov Dec $0.00213 $0.00298 $0.00132 $0.00106 $0.00168 $0.00229 $0.00242 $0.00193 $0.00003 $0.00128 $0.00217 $0.00272 Delivery Charge $ per kWh within defined block 0-450 hrs of peak kW Above 450 hrs of peak kW Charge $0.01210 / kWh $0.00487 / kWh Electric Supply Cost, Delivery Charge Adjustment1 See Figure 92
1 – Variable Energy Charges are from February 2005 – January 2006 as available at the 1Niagara Mohawk website.
Filenames: NIMO_SC3_Pri_UTICA_feb05-jan06.CSV, nimo_sc3_Pri_Utica.dat
Nimo - SC3 Large General Primary for Utica Region
Jan Feb Mar Apr May Jun Jul Aug Sep Oct Nov Dec0.00
0.02
0.04
0.06
0.08
0.10
0.12
Ele
ctric
Sup
ply
plus
Del
iver
y C
harg
e A
djus
tmen
t ($/
kWh)
Figure 92 Daily Electric Charges for SC3 from February 2005 through January 2006 for Utica Region

NYSERDA DG/CHP Integrated Database System Utility Rate Details
CDH Energy Corporation 231 September 25, 2008
Niagara Mohawk
Service Classification 3 – Large General – Primary (Utica Region) – October 2005 to September 2006 This service is for commercial or industrial customers whose monthly measured demand exceeds 100kW in each of the previous 12 consecutive months. When the monthly demand has exceeded 2,000 kW in any two consecutive months of the previous twelve months the facility must be billed under SC-3a. Primary customers are served at voltage levels between 2.2 and 15 kV. This rate is for facilities located in the Utica Region. Service Charge $ 436.70
Reactive Demand Charge $ 0.85 / RkVA in excess of 1/3 peak demand in kW Demand Charges $ per peak kW within the defined block Block Charges 0-40 kW Above 40 kW Charge $609.20 $15.23 / kW Energy Charges $ per total kWh within defined period Systems Benefit and Renewable Portfolio Charge $ 0.002110 / kWh Transmission Revenue Adjustment $ per total kWh Jan Feb Mar Apr May Jun Jul Aug Sep Oct Nov Dec $0.00298 $0.00293 $0.00258 ($0.00120) $0.00224 $0.00195 $0.00124 $0.00196 $0.00167 $0.00217 $0.00272 $0.00213 Delivery Charge $ per kWh within defined block 0-450 hrs of peak kW Above 450 hrs of peak kW Charge $0.01210 / kWh $0.00487 / kWh Electric Supply Cost, Delivery Charge Adjustment1 See Figure 93
1 – Variable Energy Charges are from October 2005 – September 2006 as available at the 1Niagara Mohawk website.
Filenames: NIMO_SC3_Pri_UTICA_oct05-sep06.CSV, nimo_sc3_Pri_Utica_oct05-sep06.dat
SC 3 Large General Primary for Utica Region
Jan Feb Mar Apr May Jun Jul Aug Sep Oct Nov Dec0.00
0.02
0.04
0.06
0.08
0.10
0.12
Ele
ctric
Sup
ply
plus
Del
iver
y C
harg
e A
djus
tmen
t ($/
kWh)
Figure 93 Daily Electric Charges for SC3 from October 2005 through September 2006 for Utica Region

NYSERDA DG/CHP Integrated Database System Utility Rate Details
CDH Energy Corporation 232 September 25, 2008
Niagara Mohawk
Service Classification 3 – Large General – Primary (Utica Region) – July 2007 to June 2008 This service is for commercial or industrial customers whose monthly measured demand exceeds 100kW in each of the previous 12 consecutive months. When the monthly demand has exceeded 2,000 kW in any two consecutive months of the previous twelve months the facility must be billed under SC-3a. Primary customers are served at voltage levels between 2.2 and 15 kV. This rate is for facilities located in the Utica Region. Service Charge $ 436.70
Reactive Demand Charge $ 0.85 / RkVA in excess of 1/3 peak demand in kW Demand Charges $ per peak kW within the defined block Block Charges 0-40 kW Above 40 kW Charge $568.00 $14.20 / kW Energy Charges $ per total kWh within defined period Systems Benefit and Renewable Portfolio Charge $ 0.002263 / kWh Transmission Revenue Adjustment $ per total kWh Jan Feb Mar Apr May Jun Jul Aug Sep Oct Nov Dec ($0.0009) ($0.0012) ($0.00083) $0.00204 $0.00118 $0.0024 ($0.00022) $0.00145 $0.00074 $0.00006 ($0.00002) $0.00075 Delivery Charge $ per kWh within defined block 0-450 hrs of peak kW Above 450 hrs of peak kW Charge $0.01351 / kWh $0.00521 / kWh Electric Supply Cost, Delivery Charge Adjustment1 See Figure 94
1 – Variable Energy Charges are from July 2007 – June 2008 as available at the 1Niagara Mohawk website.
Filenames: NIMO_SC3_Pri_UTICA_Jul07-Jun08.CSV, nimo_sc3_Pri_Utica_jun07-may08.dat
Figure 94 Daily Electric Charges for SC3 from June 2007 through May 2008 for Utica Region

NYSERDA DG/CHP Integrated Database System Utility Rate Details
CDH Energy Corporation 233 September 25, 2008
Niagara Mohawk
Service Classification 3 – Large General – Primary (Capital Region) – February 2005 to January 2006 This service is for commercial or industrial customers whose monthly measured demand exceeds 100kW in each of the previous 12 consecutive months. When the monthly demand has exceeded 2,000 kW in any two consecutive months of the previous twelve months the facility must be billed under SC-3a. Primary customers are served at voltage levels between 2.2 and 15 kV. This rate is for facilities located in the Capital Region. Service Charge $ 436.70
Reactive Demand Charge $ 0.85 / RkVA in excess of 1/3 peak demand in kW Demand Charges $ per peak kW within the defined block Block Charges 0-40 kW Above 40 kW Charge $507.60 $12.69 / kW Energy Charges $ per total kWh within defined period Systems Benefit and Renewable Portfolio Charge $ 0.001729 / kWh Transmission Revenue Adjustment $ per total kWh Jan Feb Mar Apr May Jun Jul Aug Sep Oct Nov Dec $0.00213 $0.00298 $0.00132 $0.00106 $0.00168 $0.00229 $0.00242 $0.00193 $0.00003 $0.00128 $0.00217 $0.00272 Delivery Charge $ per kWh within defined block 0-450 hrs of peak kW Above 450 hrs of peak kW Charge $0.01040 / kWh $0.00309 / kWh Electric Supply Cost, Delivery Charge Adjustment1 See Figure 95
1 – Variable Energy Charges are from February 2005 – January 2006 as available at the 1Niagara Mohawk website.
Filenames: NIMO_SC3_Pri_CAPITAL_feb05-jan06.CSV, nimo_sc3_Pri_Capital.dat
Nimo - SC3 Large General Primary for Capital Region
Jan Feb Mar Apr May Jun Jul Aug Sep Oct Nov Dec0.00
0.02
0.04
0.06
0.08
0.10
0.12
0.14
Ele
ctric
Sup
ply
plus
Del
iver
y C
harg
e A
djus
tmen
t ($/
kWh)
Figure 95 Daily Electric Charges for SC3 from February 2005 through January 2006 for Capital Region

NYSERDA DG/CHP Integrated Database System Utility Rate Details
CDH Energy Corporation 234 September 25, 2008
Niagara Mohawk
Service Classification 3 – Large General – Primary (Capital Region) – October 2005 to September 2006 This service is for commercial or industrial customers whose monthly measured demand exceeds 100kW in each of the previous 12 consecutive months. When the monthly demand has exceeded 2,000 kW in any two consecutive months of the previous twelve months the facility must be billed under SC-3a. Primary customers are served at voltage levels between 2.2 and 15 kV. This rate is for facilities located in the Capital Region. Service Charge $ 436.70
Reactive Demand Charge $ 0.85 / RkVA in excess of 1/3 peak demand in kW Demand Charges $ per peak kW within the defined block Block Charges 0-40 kW Above 40 kW Charge $609.20 $15.23 / kW Energy Charges $ per total kWh within defined period Systems Benefit and Renewable Portfolio Charge $ 0.002110 / kWh Transmission Revenue Adjustment $ per total kWh Jan Feb Mar Apr May Jun Jul Aug Sep Oct Nov Dec $0.00298 $0.00293 $0.00258 ($0.00120) $0.00224 $0.00195 $0.00124 $0.00196 $0.00167 $0.00217 $0.00272 $0.00213 Delivery Charge $ per kWh within defined block 0-450 hrs of peak kW Above 450 hrs of peak kW Charge $0.01040 / kWh $0.00309 / kWh Electric Supply Cost, Delivery Charge Adjustment1 See Figure 96
1 – Variable Energy Charges are from October 2005 – September 2006 as available at the 1Niagara Mohawk website.
Filenames: NIMO_SC3_Pri_CAPITAL_oct05-sep06.CSV, nimo_sc3_Pri_Capital_oct05-sep06.dat
SC 3 Large General Primary for Capital Region
Jan Feb Mar Apr May Jun Jul Aug Sep Oct Nov Dec0.00
0.02
0.04
0.06
0.08
0.10
0.12
0.14
Ele
ctric
Sup
ply
plus
Del
iver
y C
harg
e A
djus
tmen
t ($/
kWh)
Figure 96 Daily Electric Charges for SC3 from October 2005 through September 2006 for Capital Region

NYSERDA DG/CHP Integrated Database System Utility Rate Details
CDH Energy Corporation 235 September 25, 2008
Niagara Mohawk
Service Classification 3 – Large General – Primary (Capital Region) – July 2007 to June 2008 This service is for commercial or industrial customers whose monthly measured demand exceeds 100kW in each of the previous 12 consecutive months. When the monthly demand has exceeded 2,000 kW in any two consecutive months of the previous twelve months the facility must be billed under SC-3a. Primary customers are served at voltage levels between 2.2 and 15 kV. This rate is for facilities located in the Capital Region. Service Charge $ 436.70
Reactive Demand Charge $ 0.85 / RkVA in excess of 1/3 peak demand in kW Demand Charges $ per peak kW within the defined block Block Charges 0-40 kW Above 40 kW Charge $568.00 $14.20 / kW Energy Charges $ per total kWh within defined period Systems Benefit and Renewable Portfolio Charge $ 0.002263 / kWh Transmission Revenue Adjustment $ per total kWh Jan Feb Mar Apr May Jun Jul Aug Sep Oct Nov Dec ($0.0009) ($0.0012) ($0.00083) $0.00204 $0.00118 $0.0024 ($0.00022) $0.00145 $0.00074 $0.00006 ($0.00002) $0.00075 Delivery Charge $ per kWh within defined block 0-450 hrs of peak kW Above 450 hrs of peak kW Charge $0.01351 / kWh $0.00521 / kWh Electric Supply Cost, Delivery Charge Adjustment1 See Figure 97
1 – Variable Energy Charges are from July 2007 – June 2008 as available at the 1Niagara Mohawk website.
Filenames: NIMO_SC3_Pri_CAPITAL_Jul07-Jun08.CSV, nimo_sc3_Pri_Capital_oct05-sep06.dat
Figure 97 Daily Electric Charges for SC3 from June 2007 through May 2008 for Capital Region
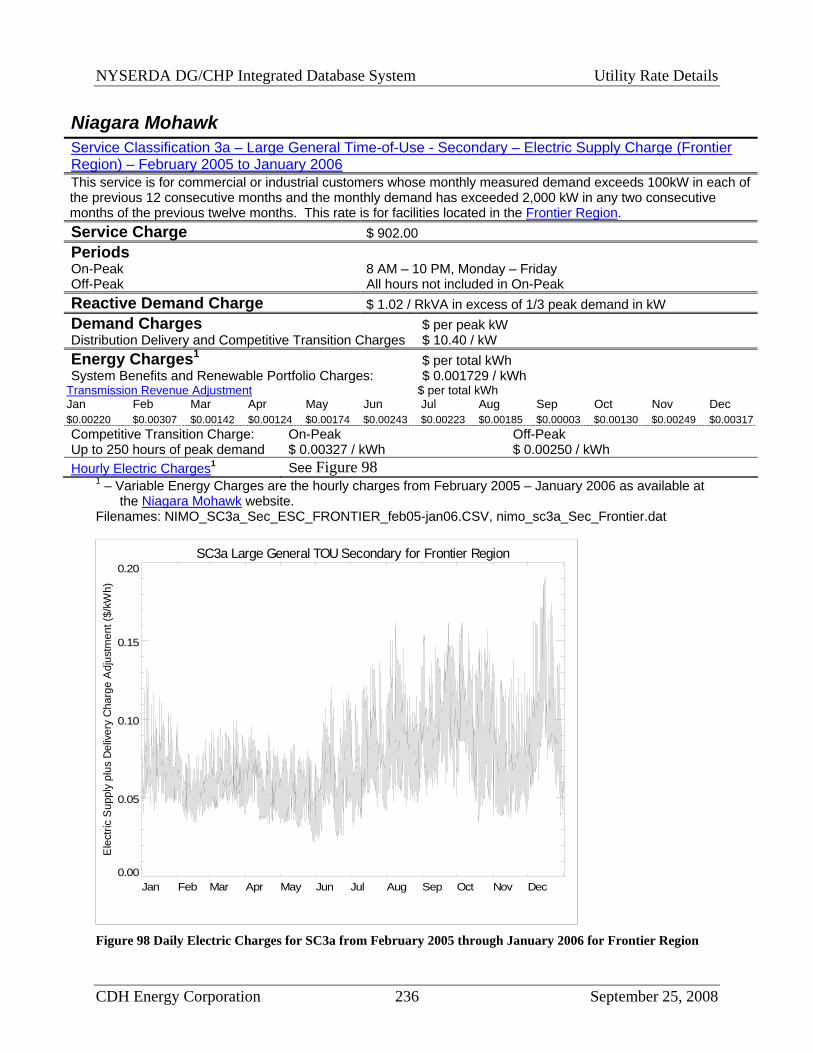
NYSERDA DG/CHP Integrated Database System Utility Rate Details
CDH Energy Corporation 236 September 25, 2008
Niagara Mohawk
Service Classification 3a – Large General Time-of-Use - Secondary – Electric Supply Charge (Frontier Region) – February 2005 to January 2006 This service is for commercial or industrial customers whose monthly measured demand exceeds 100kW in each of the previous 12 consecutive months and the monthly demand has exceeded 2,000 kW in any two consecutive months of the previous twelve months. This rate is for facilities located in the Frontier Region. Service Charge $ 902.00 Periods On-Peak 8 AM – 10 PM, Monday – Friday Off-Peak All hours not included in On-Peak Reactive Demand Charge $ 1.02 / RkVA in excess of 1/3 peak demand in kW Demand Charges $ per peak kW Distribution Delivery and Competitive Transition Charges $ 10.40 / kW Energy Charges1 $ per total kWh System Benefits and Renewable Portfolio Charges: $ 0.001729 / kWh
Transmission Revenue Adjustment $ per total kWh Jan Feb Mar Apr May Jun Jul Aug Sep Oct Nov Dec $0.00220 $0.00307 $0.00142 $0.00124 $0.00174 $0.00243 $0.00223 $0.00185 $0.00003 $0.00130 $0.00249 $0.00317Competitive Transition Charge: On-Peak Off-Peak Up to 250 hours of peak demand $ 0.00327 / kWh $ 0.00250 / kWh Hourly Electric Charges1 See Figure 98
1 – Variable Energy Charges are the hourly charges from February 2005 – January 2006 as available at the Niagara Mohawk website.
Filenames: NIMO_SC3a_Sec_ESC_FRONTIER_feb05-jan06.CSV, nimo_sc3a_Sec_Frontier.dat
SC3a Large General TOU Secondary for Frontier Region
Jan Feb Mar Apr May Jun Jul Aug Sep Oct Nov Dec0.00
0.05
0.10
0.15
0.20
Ele
ctric
Sup
ply
plus
Del
iver
y C
harg
e A
djus
tmen
t ($/
kWh)
Figure 98 Daily Electric Charges for SC3a from February 2005 through January 2006 for Frontier Region

NYSERDA DG/CHP Integrated Database System Utility Rate Details
CDH Energy Corporation 237 September 25, 2008
Niagara Mohawk
Service Classification 3a – Large General Time-of-Use - Secondary – Electric Supply Charge (Frontier Region) – October 2005 to September 2006 This service is for commercial or industrial customers whose monthly measured demand exceeds 100kW in each of the previous 12 consecutive months and the monthly demand has exceeded 2,000 kW in any two consecutive months of the previous twelve months. This rate is for facilities located in the Frontier Region. Service Charge $ 902.00 Periods On-Peak 8 AM – 10 PM, Monday – Friday Off-Peak All hours not included in On-Peak Reactive Demand Charge $ 1.02 / RkVA in excess of 1/3 peak demand in kW Demand Charges $ per peak kW Distribution Delivery and Competitive Transition Charges $ 12.02 / kW Energy Charges1 $ per total kWh System Benefits and Renewable Portfolio Charges: $ 0.002110 / kWh
Transmission Revenue Adjustment $ per total kWh Jan Feb Mar Apr May Jun Jul Aug Sep Oct Nov Dec $0.00307 $0.00296 $0.00253 ($0.00113) $0.00204 $0.00174 $0.00115 $0.00191 $0.00163 $0.00249 $0.00317 $0.00220Competitive Transition Charge: On-Peak Off-Peak Up to 250 hours of peak demand $ 0.00327 / kWh $ 0.00250 / kWh Hourly Electric Charges1 See Figure 99
1 – Variable Energy Charges are the hourly charges from October 2005 – September 2006 as available at the Niagara Mohawk website.
Filenames: NIMO_SC3a_Sec_ESC_FRONTIER_oct05-sep06.CSV, nimo_sc3a_Sec_Frontier_oct05-sep06.dat
SC 3a Large General TOU Secondary for Frontier Region
Jan Feb Mar Apr May Jun Jul Aug Sep Oct Nov Dec0.00
0.05
0.10
0.15
0.20
Ele
ctric
Sup
ply
plus
Del
iver
y C
harg
e A
djus
tmen
t ($/
kWh)
Figure 99 Daily Electric Charges for SC3a from October 2005 through September 2006 for Frontier Region

NYSERDA DG/CHP Integrated Database System Utility Rate Details
CDH Energy Corporation 238 September 25, 2008
Niagara Mohawk
Service Classification 3a – Large General Time-of-Use - Secondary – Electric Supply Charge (Frontier Region) – July 2007 to June 2008 This service is for commercial or industrial customers whose monthly measured demand exceeds 100kW in each of the previous 12 consecutive months and the monthly demand has exceeded 2,000 kW in any two consecutive months of the previous twelve months. This rate is for facilities located in the Frontier Region. Service Charge $ 902.00 Periods On-Peak 8 AM – 10 PM, Monday – Friday Off-Peak All hours not included in On-Peak Reactive Demand Charge $ 1.02 / RkVA in excess of 1/3 peak demand in kW Demand Charges $ per peak kW Distribution Delivery and Competitive Transition Charges $ 11.35 / kW Energy Charges1 $ per total kWh System Benefits and Renewable Portfolio Charges: $ 0.002263 / kWh
Transmission Revenue Adjustment $ per total kWh Jan Feb Mar Apr May Jun Jul Aug Sep Oct Nov Dec ($0.00075) ($0.00096) ($0.00065) $0.00162 $0.00083 $0.00194 ($0.0002) $0.00135 $0.00074 $0.00006 ($0.00002) $0.00077Competitive Transition Charge: On-Peak Off-Peak Up to 250 hours of peak demand $ 0.0040 / kWh $ 0.00292 / kWh Hourly Electric Charges1 See Figure 100
1 – Variable Energy Charges are the hourly charges from July 2007 – June 2008 as available at the Niagara Mohawk website.
Filenames: NIMO_SC3a_Sec_ESC_FRONTIER_Jul07-Jun08.CSV, nimo_sc3a_Sec_Frontier_jun07-may08.dat
Figure 100 Daily Electric Charges for SC3a from June 2007 through May 2008 for Frontier Region

NYSERDA DG/CHP Integrated Database System Utility Rate Details
CDH Energy Corporation 239 September 25, 2008
Niagara Mohawk
Service Classification 3a – Large General Time-of-Use - Secondary – Electric Supply Charge (Genesee Region) – February 2005 to January 2006 This service is for commercial or industrial customers whose monthly measured demand exceeds 100kW in each of the previous 12 consecutive months and the monthly demand has exceeded 2,000 kW in any two consecutive months of the previous twelve months. This rate is for facilities located in the Genesee Region. Service Charge $ 902.00 Periods On-Peak 8 AM – 10 PM, Monday – Friday Off-Peak All hours not included in On-Peak Reactive Demand Charge $ 1.02 / RkVA in excess of 1/3 peak demand in kW Demand Charges $ per peak kW Distribution Delivery and Competitive Transition Charges $ 10.40 / kW Energy Charges1 $ per total kWh System Benefits and Renewable Portfolio Charges: $ 0.001729 / kWh
Transmission Revenue Adjustment $ per total kWh Jan Feb Mar Apr May Jun Jul Aug Sep Oct Nov Dec $0.00220 $0.00307 $0.00142 $0.00124 $0.00174 $0.00243 $0.00223 $0.00185 $0.00003 $0.00130 $0.00249 $0.00317Competitive Transition Charge: On-Peak Off-Peak Up to 250 hours of peak demand $ 0.00327 / kWh $ 0.00250 / kWh Hourly Electric Charges1 See Figure 101
1 – Variable Energy Charges are the hourly charges from February 2005 – January 2006 as available at the Niagara Mohawk website.
Filenames: NIMO_SC3a_Sec_ESC_GENESEE_feb05-jan06.CSV, nimo_sc3a_Sec_Genesee.dat
SC3a Large General TOU Secondary for Genesee Region
Jan Feb Mar Apr May Jun Jul Aug Sep Oct Nov Dec0.00
0.05
0.10
0.15
0.20
0.25
Ele
ctric
Sup
ply
plus
Del
iver
y C
harg
e A
djus
tmen
t ($/
kWh)
Figure 101 Daily Electric Charges for SC3a from February 2005 through January 2006 for Genesee Region

NYSERDA DG/CHP Integrated Database System Utility Rate Details
CDH Energy Corporation 240 September 25, 2008

NYSERDA DG/CHP Integrated Database System Utility Rate Details
CDH Energy Corporation 241 September 25, 2008
Niagara Mohawk
Service Classification 3a – Large General Time-of-Use - Secondary – Electric Supply Charge (Genesee Region) – October 2005 to September 2006 This service is for commercial or industrial customers whose monthly measured demand exceeds 100kW in each of the previous 12 consecutive months and the monthly demand has exceeded 2,000 kW in any two consecutive months of the previous twelve months. This rate is for facilities located in the Genesee Region. Service Charge $ 902.00 Periods On-Peak 8 AM – 10 PM, Monday – Friday Off-Peak All hours not included in On-Peak Reactive Demand Charge $ 1.02 / RkVA in excess of 1/3 peak demand in kW Demand Charges $ per peak kW Distribution Delivery and Competitive Transition Charges $ 12.02 / kW Energy Charges1 $ per total kWh System Benefits and Renewable Portfolio Charges: $ 0.002110 / kWh
Transmission Revenue Adjustment $ per total kWh Jan Feb Mar Apr May Jun Jul Aug Sep Oct Nov Dec $0.00307 $0.00296 $0.00253 ($0.00113) $0.00204 $0.00174 $0.00115 $0.00191 $0.00163 $0.00249 $0.00317 $0.00220Competitive Transition Charge: On-Peak Off-Peak Up to 250 hours of peak demand $ 0.00327 / kWh $ 0.00250 / kWh Hourly Electric Charges1 See Figure 102
1 – Variable Energy Charges are the hourly charges from October 2005 – September 2006 as available at the Niagara Mohawk website.
Filenames: NIMO_SC3a_Sec_ESC_GENESEE_oct05-sep06.CSV, nimo_sc3a_Sec_Genesee_oct05-sep06.dat
SC 3a Large General TOU Secondary for Genesee Region
Jan Feb Mar Apr May Jun Jul Aug Sep Oct Nov Dec0.00
0.05
0.10
0.15
0.20
0.25
Ele
ctric
Sup
ply
plus
Del
iver
y C
harg
e A
djus
tmen
t ($/
kWh)
Figure 102 Daily Electric Charges for SC3a from October 2005 through September 2006 for Genesee Region

NYSERDA DG/CHP Integrated Database System Utility Rate Details
CDH Energy Corporation 242 September 25, 2008
Niagara Mohawk
Service Classification 3a – Large General Time-of-Use - Secondary – Electric Supply Charge (Genesee Region) – July 2007 to June 2008 This service is for commercial or industrial customers whose monthly measured demand exceeds 100kW in each of the previous 12 consecutive months and the monthly demand has exceeded 2,000 kW in any two consecutive months of the previous twelve months. This rate is for facilities located in the Genesee Region. Service Charge $ 902.00 Periods On-Peak 8 AM – 10 PM, Monday – Friday Off-Peak All hours not included in On-Peak Reactive Demand Charge $ 1.02 / RkVA in excess of 1/3 peak demand in kW Demand Charges $ per peak kW Distribution Delivery and Competitive Transition Charges $ 11.35 / kW Energy Charges1 $ per total kWh System Benefits and Renewable Portfolio Charges: $ 0.002263 / kWh
Transmission Revenue Adjustment $ per total kWh Jan Feb Mar Apr May Jun Jul Aug Sep Oct Nov Dec ($0.00075) ($0.00096) ($0.00065) $0.00162 $0.00083 $0.00194 ($0.0002) $0.00135 $0.00074 $0.00006 ($0.00002) $0.00077Competitive Transition Charge: On-Peak Off-Peak Up to 250 hours of peak demand $ 0.0040/ kWh $ 0.00292 kWh Hourly Electric Charges1 See Figure 103
1 – Variable Energy Charges are the hourly charges from July 2007 – June 2008 as available at the Niagara Mohawk website.
Filenames: NIMO_SC3a_Sec_ESC_GENESEE_Jul07-Jun08.CSV, nimo_sc3a_Sec_Genesee_jun07-may08.dat
Figure 103 Daily Electric Charges for SC3a from June 2007 through May 2008 for Genesee

NYSERDA DG/CHP Integrated Database System Utility Rate Details
CDH Energy Corporation 243 September 25, 2008
Niagara Mohawk
Service Classification 3a – Large General Time-of-Use - Secondary – Electric Supply Charge (Central Region) – February 2005 to January 2006 This service is for commercial or industrial customers whose monthly measured demand exceeds 100kW in each of the previous 12 consecutive months and the monthly demand has exceeded 2,000 kW in any two consecutive months of the previous twelve months. This rate is for facilities located in the Central Region. Service Charge $ 902.00 Periods On-Peak 8 AM – 10 PM, Monday – Friday Off-Peak All hours not included in On-Peak Reactive Demand Charge $ 1.02 / RkVA in excess of 1/3 peak demand in kW Demand Charges $ per peak kW Distribution Delivery and Competitive Transition Charges $ 10.40 / kW Energy Charges1 $ per total kWh System Benefits and Renewable Portfolio Charges: $ 0.001729 / kWh
Transmission Revenue Adjustment $ per total kWh Jan Feb Mar Apr May Jun Jul Aug Sep Oct Nov Dec $0.00220 $0.00307 $0.00142 $0.00124 $0.00174 $0.00243 $0.00223 $0.00185 $0.00003 $0.00130 $0.00249 $0.00317Competitive Transition Charge: On-Peak Off-Peak Up to 250 hours of peak demand $ 0.00307 / kWh $ 0.00222 / kWh Hourly Electric Charges1 See Figure 104
1 – Variable Energy Charges are the hourly charges from February 2005 – January 2006 as available at the Niagara Mohawk website.
Filenames: NIMO_SC3a_Sec_ESC_CENTRAL_feb05-jan06.CSV, nimo_sc3a_Sec_Central.dat
SC3a Large General TOU Secondary for Central Region
Jan Feb Mar Apr May Jun Jul Aug Sep Oct Nov Dec0.00
0.05
0.10
0.15
0.20
0.25
Ele
ctric
Sup
ply
plus
Del
iver
y C
harg
e A
djus
tmen
t ($/
kWh)
Figure 104 Daily Electric Charges for SC3a from February 2005 through January 2006 for Central Region

NYSERDA DG/CHP Integrated Database System Utility Rate Details
CDH Energy Corporation 244 September 25, 2008

NYSERDA DG/CHP Integrated Database System Utility Rate Details
CDH Energy Corporation 245 September 25, 2008
Niagara Mohawk
Service Classification 3a – Large General Time-of-Use - Secondary – Electric Supply Charge (Central Region) – October 2005 to September 2006 This service is for commercial or industrial customers whose monthly measured demand exceeds 100kW in each of the previous 12 consecutive months and the monthly demand has exceeded 2,000 kW in any two consecutive months of the previous twelve months. This rate is for facilities located in the Central Region. Service Charge $ 902.00 Periods On-Peak 8 AM – 10 PM, Monday – Friday Off-Peak All hours not included in On-Peak Reactive Demand Charge $ 1.02 / RkVA in excess of 1/3 peak demand in kW Demand Charges $ per peak kW Distribution Delivery and Competitive Transition Charges $ 12.02 / kW Energy Charges1 $ per total kWh System Benefits and Renewable Portfolio Charges: $ 0.002110 / kWh
Transmission Revenue Adjustment $ per total kWh Jan Feb Mar Apr May Jun Jul Aug Sep Oct Nov Dec $0.00307 $0.00296 $0.00253 ($0.00113) $0.00204 $0.00174 $0.00115 $0.00191 $0.00163 $0.00249 $0.00317 $0.00220Competitive Transition Charge: On-Peak Off-Peak Up to 250 hours of peak demand $ 0.00307 / kWh $ 0.00222 / kWh Hourly Electric Charges1 See Figure 105
1 – Variable Energy Charges are the hourly charges from October 2005 – September 2006 as available at the Niagara Mohawk website.
Filenames: NIMO_SC3a_Sec_ESC_CENTRAL_oct05-sep06.CSV, nimo_sc3a_Sec_Central_oct05-sep06.dat
SC 3a Large General TOU Secondary for Central Region
Jan Feb Mar Apr May Jun Jul Aug Sep Oct Nov Dec0.00
0.05
0.10
0.15
0.20
0.25
Ele
ctric
Sup
ply
plus
Del
iver
y C
harg
e A
djus
tmen
t ($/
kWh)
Figure 105 Daily Electric Charges for SC3a from October 2005 through September 2006 for Central Region

NYSERDA DG/CHP Integrated Database System Utility Rate Details
CDH Energy Corporation 246 September 25, 2008
Niagara Mohawk
Service Classification 3a – Large General Time-of-Use - Secondary – Electric Supply Charge (Central Region) – July 2007 to June 2008 This service is for commercial or industrial customers whose monthly measured demand exceeds 100kW in each of the previous 12 consecutive months and the monthly demand has exceeded 2,000 kW in any two consecutive months of the previous twelve months. This rate is for facilities located in the Central Region. Service Charge $ 902.00 Periods On-Peak 8 AM – 10 PM, Monday – Friday Off-Peak All hours not included in On-Peak Reactive Demand Charge $ 1.02 / RkVA in excess of 1/3 peak demand in kW Demand Charges $ per peak kW Distribution Delivery and Competitive Transition Charges $ 11.35 / kW Energy Charges1 $ per total kWh System Benefits and Renewable Portfolio Charges: $ 0.002263 / kWh
Transmission Revenue Adjustment $ per total kWh Jan Feb Mar Apr May Jun Jul Aug Sep Oct Nov Dec ($0.00075) ($0.00096) ($0.00065) $0.00162 $0.00083 $0.00194 ($0.0002) $0.00135 $0.00074 $0.00006 ($0.00002) $0.00077Competitive Transition Charge: On-Peak Off-Peak Up to 250 hours of peak demand $ 0.0040 / kWh $ 0.00292 / kWh Hourly Electric Charges1 See Figure 106
1 – Variable Energy Charges are the hourly charges from July 2007 – June 2008 as available at the Niagara Mohawk website.
Filenames: NIMO_SC3a_Sec_ESC_CENTRAL_Jul07-Jun08.CSV, nimo_sc3a_Sec_Central_jun07-may08.dat
Figure 106 Daily Electric Charges for SC3a from June 2007 through May 2008 for Central Region

NYSERDA DG/CHP Integrated Database System Utility Rate Details
CDH Energy Corporation 247 September 25, 2008
Niagara Mohawk
Service Classification 3a – Large General Time-of-Use - Secondary – Electric Supply Charge (Adirondack Region) – February 2005 to January 2006 This service is for commercial or industrial customers whose monthly measured demand exceeds 100kW in each of the previous 12 consecutive months and the monthly demand has exceeded 2,000 kW in any two consecutive months of the previous twelve months. This rate is for facilities located in the Adirondack Region. Service Charge $ 902.00 Periods On-Peak 8 AM – 10 PM, Monday – Friday Off-Peak All hours not included in On-Peak Reactive Demand Charge $ 1.02 / RkVA in excess of 1/3 peak demand in kW Demand Charges $ per peak kW Distribution Delivery and Competitive Transition Charges $ 10.40 / kW Energy Charges1 $ per total kWh System Benefits and Renewable Portfolio Charges: $ 0.001729 / kWh
Transmission Revenue Adjustment $ per total kWh Jan Feb Mar Apr May Jun Jul Aug Sep Oct Nov Dec $0.00220 $0.00307 $0.00142 $0.00124 $0.00174 $0.00243 $0.00223 $0.00185 $0.00003 $0.00130 $0.00249 $0.00317Competitive Transition Charge: On-Peak Off-Peak Up to 250 hours of peak demand $ 0.00307 / kWh $ 0.00222 / kWh Hourly Electric Charges1 See Figure 107
1 – Variable Energy Charges are the hourly charges from February 2005 – January 2006 as available at the Niagara Mohawk website.
Filenames: NIMO_SC3a_Sec_ESC_ADIRONDACK_feb05-jan06.CSV, nimo_sc3a_Sec_Adirondack.dat SC3a Large General TOU Secondary for Adirondack Region
Jan Feb Mar Apr May Jun Jul Aug Sep Oct Nov Dec0.00
0.05
0.10
0.15
0.20
0.25
Ele
ctric
Sup
ply
plus
Del
iver
y C
harg
e A
djus
tmen
t ($/
kWh)
Figure 107 Daily Electric Charges for SC3a from February 2005 through January 2006 for Adirondack Region

NYSERDA DG/CHP Integrated Database System Utility Rate Details
CDH Energy Corporation 248 September 25, 2008
Niagara Mohawk
Service Classification 3a – Large General Time-of-Use - Secondary – Electric Supply Charge (Adirondack Region) – October 2005 to September 2006 This service is for commercial or industrial customers whose monthly measured demand exceeds 100kW in each of the previous 12 consecutive months and the monthly demand has exceeded 2,000 kW in any two consecutive months of the previous twelve months. This rate is for facilities located in the Adirondack Region. Service Charge $ 902.00 Periods On-Peak 8 AM – 10 PM, Monday – Friday Off-Peak All hours not included in On-Peak Reactive Demand Charge $ 1.02 / RkVA in excess of 1/3 peak demand in kW Demand Charges $ per peak kW Distribution Delivery and Competitive Transition Charges $ 12.02 / kW Energy Charges1 $ per total kWh System Benefits and Renewable Portfolio Charges: $ 0.002110 / kWh
Transmission Revenue Adjustment $ per total kWh Jan Feb Mar Apr May Jun Jul Aug Sep Oct Nov Dec $0.00307 $0.00296 $0.00253 ($0.00113) $0.00204 $0.00174 $0.00115 $0.00191 $0.00163 $0.00249 $0.00317 $0.00220Competitive Transition Charge: On-Peak Off-Peak Up to 250 hours of peak demand $ 0.00307 / kWh $ 0.00222 / kWh Hourly Electric Charges1 See Figure 108
1 – Variable Energy Charges are the hourly charges from October 2005 – September 2006 as available at the Niagara Mohawk website.
Filenames: NIMO_SC3a_Sec_ESC_ADIRONDACK_oct05-sep06.CSV, nimo_sc3a_Sec_Adirondack_oct05-sep06.dat
SC 3a Large General TOU Secondary for Adirondack Region
Jan Feb Mar Apr May Jun Jul Aug Sep Oct Nov Dec0.00
0.05
0.10
0.15
0.20
0.25
Ele
ctric
Sup
ply
plus
Del
iver
y C
harg
e A
djus
tmen
t ($/
kWh)
Figure 108 Daily Electric Charges for SC3a from October 2005 through September 2006 for Adirondack Region

NYSERDA DG/CHP Integrated Database System Utility Rate Details
CDH Energy Corporation 249 September 25, 2008
Niagara Mohawk
Service Classification 3a – Large General Time-of-Use - Secondary – Electric Supply Charge (Adirondack Region) – July 2007 to June 2008 This service is for commercial or industrial customers whose monthly measured demand exceeds 100kW in each of the previous 12 consecutive months and the monthly demand has exceeded 2,000 kW in any two consecutive months of the previous twelve months. This rate is for facilities located in the Adirondack Region. Service Charge $ 902.00 Periods On-Peak 8 AM – 10 PM, Monday – Friday Off-Peak All hours not included in On-Peak Reactive Demand Charge $ 1.02 / RkVA in excess of 1/3 peak demand in kW Demand Charges $ per peak kW Distribution Delivery and Competitive Transition Charges $ 11.35 / kW Energy Charges1 $ per total kWh System Benefits and Renewable Portfolio Charges: $ 0.002263 / kWh
Transmission Revenue Adjustment $ per total kWh Jan Feb Mar Apr May Jun Jul Aug Sep Oct Nov Dec ($0.00075) ($0.00096) ($0.00065) $0.00162 $0.00083 $0.00194 ($0.0002) $0.00135 $0.00074 $0.00006 ($0.00002) $0.00077Competitive Transition Charge: On-Peak Off-Peak Up to 250 hours of peak demand $ 0.004 / kWh $ 0.00292 / kWh Hourly Electric Charges1 See Figure 109
1 – Variable Energy Charges are the hourly charges from July 2007 – June 2008 as available at the Niagara Mohawk website.
Filenames: NIMO_SC3a_Sec_ESC_ADIRONDACK_Jul07-Jun08.CSV, nimo_sc3a_Sec_Adirondack_jun07-may08.dat
Figure 109 Daily Electric Charges for SC3a from June 2007 through May 2008 for Adirondack Region

NYSERDA DG/CHP Integrated Database System Utility Rate Details
CDH Energy Corporation 250 September 25, 2008
Niagara Mohawk
Service Classification 3a – Large General Time-of-Use - Secondary – Electric Supply Charge (Utica Region) – February 2005 to January 2006 This service is for commercial or industrial customers whose monthly measured demand exceeds 100kW in each of the previous 12 consecutive months and the monthly demand has exceeded 2,000 kW in any two consecutive months of the previous twelve months. This rate is for facilities located in the Utica Region. Service Charge $ 902.00 Periods On-Peak 8 AM – 10 PM, Monday – Friday Off-Peak All hours not included in On-Peak Reactive Demand Charge $ 1.02 / RkVA in excess of 1/3 peak demand in kW Demand Charges $ per peak kW Distribution Delivery and Competitive Transition Charges $ 10.40 / kW Energy Charges1 $ per total kWh System Benefits and Renewable Portfolio Charges: $ 0.001729 / kWh
Transmission Revenue Adjustment $ per total kWh Jan Feb Mar Apr May Jun Jul Aug Sep Oct Nov Dec $0.00220 $0.00307 $0.00142 $0.00124 $0.00174 $0.00243 $0.00223 $0.00185 $0.00003 $0.00130 $0.00249 $0.00317Competitive Transition Charge: On-Peak Off-Peak Up to 250 hours of peak demand $ 0.00307 / kWh $ 0.00222 / kWh Hourly Electric Charges1 See Figure 110
1 – Variable Energy Charges are the hourly charges from February 2005 – January 2006 as available at the Niagara Mohawk website.
Filenames: NIMO_SC3a_Sec_ESC_UTICA_feb05-jan06.CSV, nimo_sc3a_Sec_Utica.dat
SC3a Large General TOU Secondary for Utica Region
Jan Feb Mar Apr May Jun Jul Aug Sep Oct Nov Dec0.00
0.05
0.10
0.15
0.20
0.25
Ele
ctric
Sup
ply
plus
Del
iver
y C
harg
e A
djus
tmen
t ($/
kWh)
Figure 110 Daily Electric Charges for SC3a from February 2005 through January 2006 for Utica Region

NYSERDA DG/CHP Integrated Database System Utility Rate Details
CDH Energy Corporation 251 September 25, 2008
Niagara Mohawk
Service Classification 3a – Large General Time-of-Use - Secondary – Electric Supply Charge (Utica Region) – October 2005 to September 2006 This service is for commercial or industrial customers whose monthly measured demand exceeds 100kW in each of the previous 12 consecutive months and the monthly demand has exceeded 2,000 kW in any two consecutive months of the previous twelve months. This rate is for facilities located in the Utica Region. Service Charge $ 902.00 Periods On-Peak 8 AM – 10 PM, Monday – Friday Off-Peak All hours not included in On-Peak Reactive Demand Charge $ 1.02 / RkVA in excess of 1/3 peak demand in kW Demand Charges $ per peak kW Distribution Delivery and Competitive Transition Charges $ 12.02 / kW Energy Charges1 $ per total kWh System Benefits and Renewable Portfolio Charges: $ 0.002110 / kWh
Transmission Revenue Adjustment $ per total kWh Jan Feb Mar Apr May Jun Jul Aug Sep Oct Nov Dec $0.00307 $0.00296 $0.00253 ($0.00113) $0.00204 $0.00174 $0.00115 $0.00191 $0.00163 $0.00249 $0.00317 $0.00220Competitive Transition Charge: On-Peak Off-Peak Up to 250 hours of peak demand $ 0.00307 / kWh $ 0.00222 / kWh Hourly Electric Charges1 See Figure 111
1 – Variable Energy Charges are the hourly charges from October 2005 – September 2006 as available at the Niagara Mohawk website.
Filenames: NIMO_SC3a_Sec_ESC_UTICA_oct05-sep06.CSV, nimo_sc3a_Sec_Utica_oct05-sep06.dat
SC 3a Large General TOU Secondary for Utica Region
Jan Feb Mar Apr May Jun Jul Aug Sep Oct Nov Dec0.00
0.05
0.10
0.15
0.20
0.25
Ele
ctric
Sup
ply
plus
Del
iver
y C
harg
e A
djus
tmen
t ($/
kWh)
Figure 111 Daily Electric Charges for SC3a from October 2005 through September 2006 for Utica Region

NYSERDA DG/CHP Integrated Database System Utility Rate Details
CDH Energy Corporation 252 September 25, 2008
Niagara Mohawk
Service Classification 3a – Large General Time-of-Use - Secondary – Electric Supply Charge (Utica Region) – July 2007 to June 2008 This service is for commercial or industrial customers whose monthly measured demand exceeds 100kW in each of the previous 12 consecutive months and the monthly demand has exceeded 2,000 kW in any two consecutive months of the previous twelve months. This rate is for facilities located in the Utica Region. Service Charge $ 902.00 Periods On-Peak 8 AM – 10 PM, Monday – Friday Off-Peak All hours not included in On-Peak Reactive Demand Charge $ 1.02 / RkVA in excess of 1/3 peak demand in kW Demand Charges $ per peak kW Distribution Delivery and Competitive Transition Charges $ 11.35 / kW Energy Charges1 $ per total kWh System Benefits and Renewable Portfolio Charges: $ 0.002263 / kWh
Transmission Revenue Adjustment $ per total kWh Jan Feb Mar Apr May Jun Jul Aug Sep Oct Nov Dec ($0.00075) ($0.00096) ($0.00065) $0.00162 $0.00083 $0.00194 ($0.0002) $0.00135 $0.00074 $0.00006 ($0.00002) $0.00077Competitive Transition Charge: On-Peak Off-Peak Up to 250 hours of peak demand $ 0.004 / kWh $ 0.00292 / kWh Hourly Electric Charges1 See Figure 112
1 – Variable Energy Charges are the hourly charges from July 2007 – June 2008 as available at the Niagara Mohawk website.
Filenames: NIMO_SC3a_Sec_ESC_UTICA_Jul07-Jun08.CSV, nimo_sc3a_Sec_Utica_Jun07-May08.dat
Figure 112 Daily Electric Charges for SC3a from June 2007 through May 2008 for Utica Region

NYSERDA DG/CHP Integrated Database System Utility Rate Details
CDH Energy Corporation 253 September 25, 2008
Niagara Mohawk
Service Classification 3a – Large General Time-of-Use - Secondary – Electric Supply Charge (Capital Region) – February 2005 to January 2006 This service is for commercial or industrial customers whose monthly measured demand exceeds 100kW in each of the previous 12 consecutive months and the monthly demand has exceeded 2,000 kW in any two consecutive months of the previous twelve months. This rate is for facilities located in the Capital Region. Service Charge $ 902.00 Periods On-Peak 8 AM – 10 PM, Monday – Friday Off-Peak All hours not included in On-Peak Reactive Demand Charge $ 1.02 / RkVA in excess of 1/3 peak demand in kW Demand Charges $ per peak kW Distribution Delivery and Competitive Transition Charges $ 10.40 / kW Energy Charges1 $ per total kWh System Benefits and Renewable Portfolio Charges: $ 0.001729 / kWh
Transmission Revenue Adjustment $ per total kWh Jan Feb Mar Apr May Jun Jul Aug Sep Oct Nov Dec $0.00220 $0.00307 $0.00142 $0.00124 $0.00174 $0.00243 $0.00223 $0.00185 $0.00003 $0.00130 $0.00249 $0.00317Competitive Transition Charge: On-Peak Off-Peak Up to 250 hours of peak demand $ 0.00258 / kWh $ 0.00182 / kWh Hourly Electric Charges1 See Figure 113
1 – Variable Energy Charges are the hourly charges from February 2005 – January 2006 as available at the Niagara Mohawk website.
Filenames: NIMO_SC3a_Sec_ESC_CAPITAL_feb05-jan06.CSV, nimo_sc3a_Sec_Capital.dat
SC3a Large General TOU Secondary for Capital Region
Jan Feb Mar Apr May Jun Jul Aug Sep Oct Nov Dec0.00
0.05
0.10
0.15
0.20
0.25
Ele
ctric
Sup
ply
plus
Del
iver
y C
harg
e A
djus
tmen
t ($/
kWh)
Figure 113 Daily Electric Charges for SC3a from February 2005 through January 2006 for Capital Region

NYSERDA DG/CHP Integrated Database System Utility Rate Details
CDH Energy Corporation 254 September 25, 2008
Niagara Mohawk
Service Classification 3a – Large General Time-of-Use - Secondary – Electric Supply Charge (Capital Region) – October 2005 to September 2006 This service is for commercial or industrial customers whose monthly measured demand exceeds 100kW in each of the previous 12 consecutive months and the monthly demand has exceeded 2,000 kW in any two consecutive months of the previous twelve months. This rate is for facilities located in the Capital Region. Service Charge $ 902.00 Periods On-Peak 8 AM – 10 PM, Monday – Friday Off-Peak All hours not included in On-Peak Reactive Demand Charge $ 1.02 / RkVA in excess of 1/3 peak demand in kW Demand Charges $ per peak kW Distribution Delivery and Competitive Transition Charges $ 12.02 / kW Energy Charges1 $ per total kWh System Benefits and Renewable Portfolio Charges: $ 0.002110 / kWh
Transmission Revenue Adjustment $ per total kWh Jan Feb Mar Apr May Jun Jul Aug Sep Oct Nov Dec $0.00307 $0.00296 $0.00253 ($0.00113) $0.00204 $0.00174 $0.00115 $0.00191 $0.00163 $0.00249 $0.00317 $0.00220Competitive Transition Charge: On-Peak Off-Peak Up to 250 hours of peak demand $ 0.00258 / kWh $ 0.00182 / kWh Hourly Electric Charges1 See Figure 114
1 – Variable Energy Charges are the hourly charges from October 2005 – September 2006 as available at the Niagara Mohawk website.
Filenames: NIMO_SC3a_Sec_ESC_CAPITAL_oct05-sep06.CSV, nimo_sc3a_Sec_Capital_oct05-sep06.dat
SC 3a Large General TOU Secondary for Capital Region
Jan Feb Mar Apr May Jun Jul Aug Sep Oct Nov Dec0.00
0.05
0.10
0.15
0.20
0.25
Ele
ctric
Sup
ply
plus
Del
iver
y C
harg
e A
djus
tmen
t ($/
kWh)
Figure 114 Daily Electric Charges for SC3a from October 2005 through September 2006 for Capital Region

NYSERDA DG/CHP Integrated Database System Utility Rate Details
CDH Energy Corporation 255 September 25, 2008
Niagara Mohawk
Service Classification 3a – Large General Time-of-Use - Secondary – Electric Supply Charge (Capital Region) – July 2007 to June 2008 This service is for commercial or industrial customers whose monthly measured demand exceeds 100kW in each of the previous 12 consecutive months and the monthly demand has exceeded 2,000 kW in any two consecutive months of the previous twelve months. This rate is for facilities located in the Capital Region. Service Charge $ 902.00 Periods On-Peak 8 AM – 10 PM, Monday – Friday Off-Peak All hours not included in On-Peak Reactive Demand Charge $ 1.02 / RkVA in excess of 1/3 peak demand in kW Demand Charges $ per peak kW Distribution Delivery and Competitive Transition Charges $ 11.35 / kW Energy Charges1 $ per total kWh System Benefits and Renewable Portfolio Charges: $ 0.002263 / kWh
Transmission Revenue Adjustment $ per total kWh Jan Feb Mar Apr May Jun Jul Aug Sep Oct Nov Dec ($0.00075) ($0.00096) ($0.00065) $0.00162 $0.00083 $0.00194 ($0.0002) $0.00135 $0.00074 $0.00006 ($0.00002) $0.00077Competitive Transition Charge: On-Peak Off-Peak Up to 250 hours of peak demand $ 0.004 / kWh $ 0.00292 / kWh Hourly Electric Charges1 See Figure 115
1 – Variable Energy Charges are the hourly charges from July 2007 – June 2008 as available at the Niagara Mohawk website.
Filenames: NIMO_SC3a_Sec_ESC_CAPITAL_Jul07-Jun08.CSV, nimo_sc3a_Sec_Capital_jun07-may08.dat
Figure 115 Daily Electric Charges for SC3a from June 2007 through May 2008 for Capital Region

NYSERDA DG/CHP Integrated Database System Utility Rate Details
CDH Energy Corporation 256 September 25, 2008
Niagara Mohawk
Service Classification 3a – Large General Time-of-Use - Primary – Electric Supply Charge (Frontier Region) – February 2005 to January 2006 This service is for commercial or industrial customers whose monthly measured demand exceeds 100kW in each of the previous 12 consecutive months and the monthly demand has exceeded 2,000 kW in any two consecutive months of the previous twelve months. Primary customers are served at voltage levels between 2.2 and 15 kV. This rate is for facilities located in the Frontier Region. Service Charge $ 902.00 Periods On-Peak 8 AM – 10 PM, Monday – Friday Off-Peak All hours not included in On-Peak Reactive Demand Charge $ 1.02 / RkVA in excess of 1/3 peak demand in kW Demand Charges $ per peak kW Distribution Delivery and Competitive Transition Charges $ 8.86 / kW Energy Charges1 $ per total kWh System Benefits, Distribution Delivery and Renewable Portfolio Charges: $ 0.003889 / kWh
Transmission Revenue Adjustment $ per total kWh Jan Feb Mar Apr May Jun Jul Aug Sep Oct Nov Dec $0.00221 $0.00312 $0.00105 $0.00091 $0.00132 $0.00183 $0.00173 $0.00143 $0.00002 $0.00096 $0.00160 $0.00212Competitive Transition Charge: On-Peak Off-Peak Up to 250 hours of peak demand $ 0.00777 / kWh $ 0.00619 / kWh Hourly Electric Charges1 See Figure 116
1 – Variable Energy Charges are the hourly charges from February 2005 – January 2006 as available at the Niagara Mohawk website.
Filenames: NIMO_SC3a_Pri_ESC_FRONTIER_feb05-jan06.CSV, nimo_sc3a_Pri_Frontier.dat SC3a Large General TOU Primary for Frontier Region
Jan Feb Mar Apr May Jun Jul Aug Sep Oct Nov Dec0.00
0.05
0.10
0.15
0.20
Ele
ctric
Sup
ply
plus
Del
iver
y C
harg
e A
djus
tmen
t ($/
kWh)
Figure 116 Daily Electric Charges for SC3a from February 2005 through January 2006 for Frontier Region

NYSERDA DG/CHP Integrated Database System Utility Rate Details
CDH Energy Corporation 257 September 25, 2008
Niagara Mohawk
Service Classification 3a – Large General Time-of-Use - Primary – Electric Supply Charge (Frontier Region) – October 2005 to September 2006 This service is for commercial or industrial customers whose monthly measured demand exceeds 100kW in each of the previous 12 consecutive months and the monthly demand has exceeded 2,000 kW in any two consecutive months of the previous twelve months. Primary customers are served at voltage levels between 2.2 and 15 kV. This rate is for facilities located in the Frontier Region. Service Charge $ 902.00 Periods On-Peak 8 AM – 10 PM, Monday – Friday Off-Peak All hours not included in On-Peak Reactive Demand Charge $ 1.02 / RkVA in excess of 1/3 peak demand in kW Demand Charges $ per peak kW Distribution Delivery and Competitive Transition Charges $ 9.67 / kW Energy Charges1 $ per total kWh System Benefits, Distribution Delivery and Renewable Portfolio Charges: $ 0.004480 / kWh
Transmission Revenue Adjustment $ per total kWh Jan Feb Mar Apr May Jun Jul Aug Sep Oct Nov Dec $0.00312 $0.00300 $0.00260 ($0.00116) $0.00208 $0.00177 $0.00117 $0.00196 $0.00167 $0.00160 $0.00212 $0.00221Competitive Transition Charge: On-Peak Off-Peak Up to 250 hours of peak demand $ 0.00777 / kWh $ 0.00619 / kWh Hourly Electric Charges1 See Figure 117
1 – Variable Energy Charges are the hourly charges from October 2005 – September 2006 as available at the Niagara Mohawk website.
Filenames: NIMO_SC3a_Pri_ESC_FRONTIER_oct05-sep06.CSV, nimo_sc3a_Pri_Frontier_oct05-sep06.dat
SC 3a Large General TOU Primary for Frontier Region
Jan Feb Mar Apr May Jun Jul Aug Sep Oct Nov Dec0.00
0.05
0.10
0.15
0.20
Ele
ctric
Sup
ply
plus
Del
iver
y C
harg
e A
djus
tmen
t ($/
kWh)
Figure 117 Daily Electric Charges for SC3a from October 2005 through September 2006 for Frontier Region

NYSERDA DG/CHP Integrated Database System Utility Rate Details
CDH Energy Corporation 258 September 25, 2008
Niagara Mohawk
Service Classification 3a – Large General Time-of-Use - Primary – Electric Supply Charge (Frontier Region) – July 2007 to June 2008 This service is for commercial or industrial customers whose monthly measured demand exceeds 100kW in each of the previous 12 consecutive months and the monthly demand has exceeded 2,000 kW in any two consecutive months of the previous twelve months. Primary customers are served at voltage levels between 2.2 and 15 kV. This rate is for facilities located in the Frontier Region. Service Charge $ 902.00 Periods On-Peak 8 AM – 10 PM, Monday – Friday Off-Peak All hours not included in On-Peak Reactive Demand Charge $ 1.02 / RkVA in excess of 1/3 peak demand in kW Demand Charges $ per peak kW Distribution Delivery and Competitive Transition Charges $ 9.96 / kW Energy Charges1 $ per total kWh System Benefits, Distribution Delivery and Renewable Portfolio Charges: $ 0.002263 / kWh
Transmission Revenue Adjustment $ per total kWh Jan Feb Mar Apr May Jun Jul Aug Sep Oct Nov Dec ($0.00101) ($0.00130) ($0.00089) $0.00217 $0.00110 $0.00258 ($0.0002) $0.0014 $0.00074 $0.00006 ($0.00002) $0.00081Competitive Transition Charge: On-Peak Off-Peak Up to 250 hours of peak demand $ 0.00512 / kWh $ 0.00387 / kWh Hourly Electric Charges1 See Figure 118
1 – Variable Energy Charges are the hourly charges from July 2007 – June 2008 as available at the Niagara Mohawk website.
Filenames: NIMO_SC3a_Pri_ESC_FRONTIER_Jul07-Jun08.CSV, nimo_sc3a_Pri_Frontier_jun07-may08.dat
Figure 118 Daily Electric Charges for SC3a from June 2007 through May 2008 for Frontier Region

NYSERDA DG/CHP Integrated Database System Utility Rate Details
CDH Energy Corporation 259 September 25, 2008
Niagara Mohawk
Service Classification 3a – Large General Time-of-Use - Primary – Electric Supply Charge (Genesee Region) – February 2005 to January 2006 This service is for commercial or industrial customers whose monthly measured demand exceeds 100kW in each of the previous 12 consecutive months and the monthly demand has exceeded 2,000 kW in any two consecutive months of the previous twelve months. Primary customers are served at voltage levels between 2.2 and 15 kV. This rate is for facilities located in the Genesee Region. Service Charge $ 902.00 Periods On-Peak 8 AM – 10 PM, Monday – Friday Off-Peak All hours not included in On-Peak Reactive Demand Charge $ 1.02 / RkVA in excess of 1/3 peak demand in kW Demand Charges $ per peak kW Distribution Delivery and Competitive Transition Charges $ 8.86 / kW Energy Charges1 $ per total kWh System Benefits, Distribution Delivery and Renewable Portfolio Charges: $ 0.003889 / kWh
Transmission Revenue Adjustment $ per total kWh Jan Feb Mar Apr May Jun Jul Aug Sep Oct Nov Dec $0.00221 $0.00312 $0.00105 $0.00091 $0.00132 $0.00183 $0.00173 $0.00143 $0.00002 $0.00096 $0.00160 $0.00212Competitive Transition Charge: On-Peak Off-Peak Up to 250 hours of peak demand $ 0.00777 / kWh $ 0.00619 / kWh Hourly Electric Charges1 See Figure 119
1 – Variable Energy Charges are the hourly charges from February 2005 – January 2006 as available at the Niagara Mohawk website.
Filenames: NIMO_SC3a_Pri_ESC_GENESEE_feb05-jan06.CSV, nimo_sc3a_Pri_Genesee.dat SC3a Large General TOU Primary for Genesee Region
Jan Feb Mar Apr May Jun Jul Aug Sep Oct Nov Dec0.00
0.05
0.10
0.15
0.20
Ele
ctric
Sup
ply
plus
Del
iver
y C
harg
e A
djus
tmen
t ($/
kWh)
Figure 119 Daily Electric Charges for SC3a from February 2005 through January 2006 for Genesee Region

NYSERDA DG/CHP Integrated Database System Utility Rate Details
CDH Energy Corporation 260 September 25, 2008
Niagara Mohawk
Service Classification 3a – Large General Time-of-Use - Primary – Electric Supply Charge (Genesee Region) – October 2005 to September 2006 This service is for commercial or industrial customers whose monthly measured demand exceeds 100kW in each of the previous 12 consecutive months and the monthly demand has exceeded 2,000 kW in any two consecutive months of the previous twelve months. Primary customers are served at voltage levels between 2.2 and 15 kV. This rate is for facilities located in the Genesee Region. Service Charge $ 902.00 Periods On-Peak 8 AM – 10 PM, Monday – Friday Off-Peak All hours not included in On-Peak Reactive Demand Charge $ 1.02 / RkVA in excess of 1/3 peak demand in kW Demand Charges $ per peak kW Distribution Delivery and Competitive Transition Charges $ 9.67 / kW Energy Charges1 $ per total kWh System Benefits, Distribution Delivery and Renewable Portfolio Charges: $ 0.004480 / kWh
Transmission Revenue Adjustment $ per total kWh Jan Feb Mar Apr May Jun Jul Aug Sep Oct Nov Dec $0.00312 $0.00300 $0.00260 ($0.00116) $0.00208 $0.00177 $0.00117 $0.00196 $0.00167 $0.00160 $0.00212 $0.00221Competitive Transition Charge: On-Peak Off-Peak Up to 250 hours of peak demand $ 0.00777 / kWh $ 0.00619 / kWh Hourly Electric Charges1 See Figure 120
1 – Variable Energy Charges are the hourly charges from October 2005 – September 2006 as available at the Niagara Mohawk website.
Filenames: NIMO_SC3a_Pri_ESC_GENESEE_oct05-sep06.CSV, nimo_sc3a_Pri_Genesee_oct05-sep06.dat
SC 3a Large General TOU Primary for Genesee Region
Jan Feb Mar Apr May Jun Jul Aug Sep Oct Nov Dec0.00
0.05
0.10
0.15
0.20
Ele
ctric
Sup
ply
plus
Del
iver
y C
harg
e A
djus
tmen
t ($/
kWh)
Figure 120 Daily Electric Charges for SC3a from October 2005 through September 2006 for Genesee Region

NYSERDA DG/CHP Integrated Database System Utility Rate Details
CDH Energy Corporation 261 September 25, 2008
Niagara Mohawk
Service Classification 3a – Large General Time-of-Use - Primary – Electric Supply Charge (Genesee Region) –July 2007 to June 2008 This service is for commercial or industrial customers whose monthly measured demand exceeds 100kW in each of the previous 12 consecutive months and the monthly demand has exceeded 2,000 kW in any two consecutive months of the previous twelve months. Primary customers are served at voltage levels between 2.2 and 15 kV. This rate is for facilities located in the Genesee Region. Service Charge $ 902.00 Periods On-Peak 8 AM – 10 PM, Monday – Friday Off-Peak All hours not included in On-Peak Reactive Demand Charge $ 1.02 / RkVA in excess of 1/3 peak demand in kW Demand Charges $ per peak kW Distribution Delivery and Competitive Transition Charges $ 9.96 / kW Energy Charges1 $ per total kWh System Benefits, Distribution Delivery and Renewable Portfolio Charges: $ 0.002263 / kWh
Transmission Revenue Adjustment $ per total kWh Jan Feb Mar Apr May Jun Jul Aug Sep Oct Nov Dec ($0.00101) ($0.00130) ($0.00089) $0.00217 $0.00110 $0.00258 ($0.0002) $0.0014 $0.00074 $0.00006 ($0.00002) $0.00081Competitive Transition Charge: On-Peak Off-Peak Up to 250 hours of peak demand $ 0.00512 / kWh $ 0.00387 / kWh Hourly Electric Charges1 See Figure 121
1 – Variable Energy Charges are the hourly charges from July 2007 – June 2008 as available at the Niagara Mohawk website.
Filenames: NIMO_SC3a_Pri_ESC_GENESEE_Jul07-Jun08.CSV, nimo_sc3a_Pri_Genesee_jun07-may08.dat
Figure 121 Daily Electric Charges for SC3a from June 2007 through May 2008 for Genesee Region

NYSERDA DG/CHP Integrated Database System Utility Rate Details
CDH Energy Corporation 262 September 25, 2008
Niagara Mohawk
Service Classification 3a – Large General Time-of-Use - Primary – Electric Supply Charge (Central Region) – February 2005 to January 2006 This service is for commercial or industrial customers whose monthly measured demand exceeds 100kW in each of the previous 12 consecutive months and the monthly demand has exceeded 2,000 kW in any two consecutive months of the previous twelve months. Primary customers are served at voltage levels between 2.2 and 15 kV. This rate is for facilities located in the Central Region. Service Charge $ 902.00 Periods On-Peak 8 AM – 10 PM, Monday – Friday Off-Peak All hours not included in On-Peak Reactive Demand Charge $ 1.02 / RkVA in excess of 1/3 peak demand in kW Demand Charges $ per peak kW Distribution Delivery and Competitive Transition Charges $ 8.86 / kW Energy Charges1 $ per total kWh System Benefits, Distribution Delivery and Renewable Portfolio Charges: $ 0.003889 / kWh
Transmission Revenue Adjustment $ per total kWh Jan Feb Mar Apr May Jun Jul Aug Sep Oct Nov Dec $0.00221 $0.00312 $0.00105 $0.00091 $0.00132 $0.00183 $0.00173 $0.00143 $0.00002 $0.00096 $0.00160 $0.00212Competitive Transition Charge: On-Peak Off-Peak Up to 250 hours of peak demand $ 0.00777 / kWh $ 0.00619 / kWh Hourly Electric Charges1 See Figure 122
1 – Variable Energy Charges are the hourly charges from February 2005 – January 2006 as available at the Niagara Mohawk website.
Filenames: NIMO_SC3a_Pri_ESC_CENTRAL_feb05-jan06.CSV, nimo_sc3a_Pri_Central.dat SC3a Large General TOU Primary for Central Region
Jan Feb Mar Apr May Jun Jul Aug Sep Oct Nov Dec0.00
0.05
0.10
0.15
0.20
0.25
Ele
ctric
Sup
ply
plus
Del
iver
y C
harg
e A
djus
tmen
t ($/
kWh)
Figure 122 Daily Electric Charges for SC3a from February 2005 through January 2006 for Central Region

NYSERDA DG/CHP Integrated Database System Utility Rate Details
CDH Energy Corporation 263 September 25, 2008
Niagara Mohawk
Service Classification 3a – Large General Time-of-Use - Primary – Electric Supply Charge (Central Region) – October 2005 to September 2006 This service is for commercial or industrial customers whose monthly measured demand exceeds 100kW in each of the previous 12 consecutive months and the monthly demand has exceeded 2,000 kW in any two consecutive months of the previous twelve months. Primary customers are served at voltage levels between 2.2 and 15 kV. This rate is for facilities located in the Central Region. Service Charge $ 902.00 Periods On-Peak 8 AM – 10 PM, Monday – Friday Off-Peak All hours not included in On-Peak Reactive Demand Charge $ 1.02 / RkVA in excess of 1/3 peak demand in kW Demand Charges $ per peak kW Distribution Delivery and Competitive Transition Charges $ 9.67 / kW Energy Charges1 $ per total kWh System Benefits, Distribution Delivery and Renewable Portfolio Charges: $ 0.004480 / kWh
Transmission Revenue Adjustment $ per total kWh Jan Feb Mar Apr May Jun Jul Aug Sep Oct Nov Dec $0.00312 $0.00300 $0.00260 ($0.00116) $0.00208 $0.00177 $0.00117 $0.00196 $0.00167 $0.00160 $0.00212 $0.00221Competitive Transition Charge: On-Peak Off-Peak Up to 250 hours of peak demand $ 0.00733 / kWh $ 0.00564 / kWh Hourly Electric Charges1 See Figure 123
1 – Variable Energy Charges are the hourly charges from October 2005 – September 2006 as available at the Niagara Mohawk website.
Filenames: NIMO_SC3a_Pri_ESC_CENTRAL_oct05-sep06.CSV, nimo_sc3a_Pri_Central_oct05-sep06.dat
SC 3a Large General TOU Primary for Central Region
Jan Feb Mar Apr May Jun Jul Aug Sep Oct Nov Dec0.00
0.05
0.10
0.15
0.20
0.25
Ele
ctric
Sup
ply
plus
Del
iver
y C
harg
e A
djus
tmen
t ($/
kWh)
Figure 123 Daily Electric Charges for SC3a from October 2005 through September 2006 for Central Region

NYSERDA DG/CHP Integrated Database System Utility Rate Details
CDH Energy Corporation 264 September 25, 2008
Niagara Mohawk
Service Classification 3a – Large General Time-of-Use - Primary – Electric Supply Charge (Central Region) – December 2006 to November 2007 This service is for commercial or industrial customers whose monthly measured demand exceeds 100kW in each of the previous 12 consecutive months and the monthly demand has exceeded 2,000 kW in any two consecutive months of the previous twelve months. Primary customers are served at voltage levels between 2.2 and 15 kV. This rate is for facilities located in the Central Region. Service Charge $ 902.00 Periods On-Peak 8 AM – 10 PM, Monday – Friday Off-Peak All hours not included in On-Peak Reactive Demand Charge $ 1.02 / RkVA in excess of 1/3 peak demand in kW Demand Charges $ per peak kW Distribution Delivery and Competitive Transition Charges $ 10.07 / kW Energy Charges1 $ per total kWh System Benefits, Distribution Delivery and Renewable Portfolio Charges: $ 0.00473 / kWh
Transmission Revenue Adjustment $ per total kWh Jan Feb Mar Apr May Jun Jul Aug Sep Oct Nov Dec $0.00194 $0.00203 $0.00214 $0.00269 $0.00253 ($0.00020) $0.00140 $0.00074 $0.00006 ($0.00002) $0.00081 ($0.00050)Competitive Transition Charge: On-Peak Off-Peak Up to 250 hours of peak demand $ 0.00646 / kWh $ 0.00497 / kWh Hourly Electric Charges1 See Figure 124
1 – Variable Energy Charges are the hourly charges from December 2006 – November 2007 as available at the Niagara Mohawk website.
Filenames: NIMO_SC3a_Pri_ESC_CENTRAL_dec06-nov07.CSV, nimo_sc3a_Pri_Central_dec06-nov07.dat
SC 3a Large General TOU Primary for Central Region
Jan Feb Mar Apr May Jun Jul Aug Sep Oct Nov Dec0.00
0.05
0.10
0.15
0.20
Ele
ctric
Sup
ply
plus
Del
iver
y C
harg
e A
djus
tmen
t ($/
kWh)
Figure 124 Daily Electric Charges for SC3a from October 2005 through September 2006 for Central Region

NYSERDA DG/CHP Integrated Database System Utility Rate Details
CDH Energy Corporation 265 September 25, 2008
Niagara Mohawk
Service Classification 3a – Large General Time-of-Use - Primary – Electric Supply Charge (Central Region) – July 2007 to June 2008 This service is for commercial or industrial customers whose monthly measured demand exceeds 100kW in each of the previous 12 consecutive months and the monthly demand has exceeded 2,000 kW in any two consecutive months of the previous twelve months. Primary customers are served at voltage levels between 2.2 and 15 kV. This rate is for facilities located in the Central Region. Service Charge $ 902.00 Periods On-Peak 8 AM – 10 PM, Monday – Friday Off-Peak All hours not included in On-Peak Reactive Demand Charge $ 1.02 / RkVA in excess of 1/3 peak demand in kW Demand Charges $ per peak kW Distribution Delivery and Competitive Transition Charges $ 9.96 / kW Energy Charges1 $ per total kWh System Benefits, Distribution Delivery and Renewable Portfolio Charges: $ 0.002263 / kWh
Transmission Revenue Adjustment $ per total kWh Jan Feb Mar Apr May Jun Jul Aug Sep Oct Nov Dec ($0.00101) ($0.00130) ($0.00089) $0.00217 $0.00110 $0.00258 ($0.0002) $0.0014 $0.00074 $0.00006 ($0.00002) $0.00081Competitive Transition Charge: On-Peak Off-Peak Up to 250 hours of peak demand $ 0.00512 / kWh $ 0.00387 / kWh Hourly Electric Charges1 See Figure 125
1 – Variable Energy Charges are the hourly charges from July 2007 – June 2008 as available at the Niagara Mohawk website.
Filenames: NIMO_SC3a_Pri_ESC_CENTRAL_Jul07-Jun08.CSV, nimo_sc3a_Pri_Central_jun07-may08.dat
Figure 125 Daily Electric Charges for SC3a from June 2007 through May 2008 for Central Region

NYSERDA DG/CHP Integrated Database System Utility Rate Details
CDH Energy Corporation 266 September 25, 2008
Niagara Mohawk
Service Classification 3a – Large General Time-of-Use - Primary – Electric Supply Charge (Adirondack Region) – February 2005 to January 2006 This service is for commercial or industrial customers whose monthly measured demand exceeds 100kW in each of the previous 12 consecutive months and the monthly demand has exceeded 2,000 kW in any two consecutive months of the previous twelve months. Primary customers are served at voltage levels between 2.2 and 15 kV. This rate is for facilities located in the Adirondack Region. Service Charge $ 902.00 Periods On-Peak 8 AM – 10 PM, Monday – Friday Off-Peak All hours not included in On-Peak Reactive Demand Charge $ 1.02 / RkVA in excess of 1/3 peak demand in kW Demand Charges $ per peak kW Distribution Delivery and Competitive Transition Charges $ 8.86 / kW Energy Charges1 $ per total kWh System Benefits, Distribution Delivery and Renewable Portfolio Charges: $ 0.003889 / kWh
Transmission Revenue Adjustment $ per total kWh Jan Feb Mar Apr May Jun Jul Aug Sep Oct Nov Dec $0.00221 $0.00312 $0.00105 $0.00091 $0.00132 $0.00183 $0.00173 $0.00143 $0.00002 $0.00096 $0.00160 $0.00212Competitive Transition Charge: On-Peak Off-Peak Up to 250 hours of peak demand $ 0.00777 / kWh $ 0.00619 / kWh Hourly Electric Charges1 See Figure 126
1 – Variable Energy Charges are the hourly charges from February 2005 – January 2006 as available at the Niagara Mohawk website.
Filenames: NIMO_SC3a_Pri_ESC_ADIRONDACK_feb05-jan06.CSV, nimo_sc3a_Pri_Adirondack.dat SC3a Large General TOU Primary for Adirondack Region
Jan Feb Mar Apr May Jun Jul Aug Sep Oct Nov Dec0.00
0.05
0.10
0.15
0.20
0.25
Ele
ctric
Sup
ply
plus
Del
iver
y C
harg
e A
djus
tmen
t ($/
kWh)
Figure 126 Daily Electric Charges for SC3a from February 2005 through January 2006 for Adirondack Region

NYSERDA DG/CHP Integrated Database System Utility Rate Details
CDH Energy Corporation 267 September 25, 2008
Niagara Mohawk
Service Classification 3a – Large General Time-of-Use - Primary – Electric Supply Charge (Adirondack Region) – October 2005 to September 2006 This service is for commercial or industrial customers whose monthly measured demand exceeds 100kW in each of the previous 12 consecutive months and the monthly demand has exceeded 2,000 kW in any two consecutive months of the previous twelve months. Primary customers are served at voltage levels between 2.2 and 15 kV. This rate is for facilities located in the Adirondack Region. Service Charge $ 902.00 Periods On-Peak 8 AM – 10 PM, Monday – Friday Off-Peak All hours not included in On-Peak Reactive Demand Charge $ 1.02 / RkVA in excess of 1/3 peak demand in kW Demand Charges $ per peak kW Distribution Delivery and Competitive Transition Charges $ 9.67 / kW Energy Charges1 $ per total kWh System Benefits, Distribution Delivery and Renewable Portfolio Charges: $ 0.004480 / kWh
Transmission Revenue Adjustment $ per total kWh Jan Feb Mar Apr May Jun Jul Aug Sep Oct Nov Dec $0.00312 $0.00300 $0.00260 ($0.00116) $0.00208 $0.00177 $0.00117 $0.00196 $0.00167 $0.00160 $0.00212 $0.00221Competitive Transition Charge: On-Peak Off-Peak Up to 250 hours of peak demand $ 0.00733 / kWh $ 0.00564 / kWh Hourly Electric Charges1 See Figure 127
1 – Variable Energy Charges are the hourly charges from October 2005 – September 2006 as available at the Niagara Mohawk website.
Filenames: NIMO_SC3a_Pri_ESC_ADIRONDACK_oct05-sep06.CSV, nimo_sc3a_Pri_Adirondack_oct05-sep06.dat
SC 3a Large General TOU Primary for Adirondack Region
Jan Feb Mar Apr May Jun Jul Aug Sep Oct Nov Dec0.00
0.05
0.10
0.15
0.20
0.25
Ele
ctric
Sup
ply
plus
Del
iver
y C
harg
e A
djus
tmen
t ($/
kWh)
Figure 127 Daily Electric Charges for SC3a from October 2005 through September 2006 for Adirondack Region
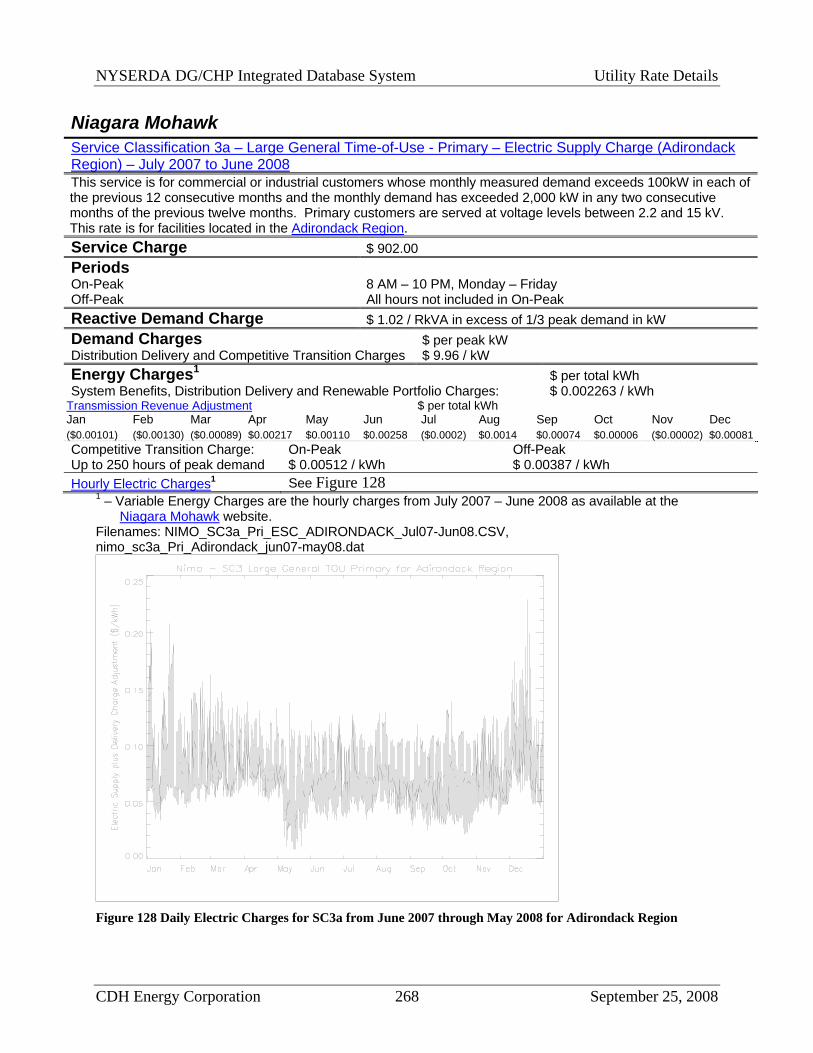
NYSERDA DG/CHP Integrated Database System Utility Rate Details
CDH Energy Corporation 268 September 25, 2008
Niagara Mohawk
Service Classification 3a – Large General Time-of-Use - Primary – Electric Supply Charge (Adirondack Region) – July 2007 to June 2008 This service is for commercial or industrial customers whose monthly measured demand exceeds 100kW in each of the previous 12 consecutive months and the monthly demand has exceeded 2,000 kW in any two consecutive months of the previous twelve months. Primary customers are served at voltage levels between 2.2 and 15 kV. This rate is for facilities located in the Adirondack Region. Service Charge $ 902.00 Periods On-Peak 8 AM – 10 PM, Monday – Friday Off-Peak All hours not included in On-Peak Reactive Demand Charge $ 1.02 / RkVA in excess of 1/3 peak demand in kW Demand Charges $ per peak kW Distribution Delivery and Competitive Transition Charges $ 9.96 / kW Energy Charges1 $ per total kWh System Benefits, Distribution Delivery and Renewable Portfolio Charges: $ 0.002263 / kWh
Transmission Revenue Adjustment $ per total kWh Jan Feb Mar Apr May Jun Jul Aug Sep Oct Nov Dec ($0.00101) ($0.00130) ($0.00089) $0.00217 $0.00110 $0.00258 ($0.0002) $0.0014 $0.00074 $0.00006 ($0.00002) $0.00081Competitive Transition Charge: On-Peak Off-Peak Up to 250 hours of peak demand $ 0.00512 / kWh $ 0.00387 / kWh Hourly Electric Charges1 See Figure 128
1 – Variable Energy Charges are the hourly charges from July 2007 – June 2008 as available at the Niagara Mohawk website.
Filenames: NIMO_SC3a_Pri_ESC_ADIRONDACK_Jul07-Jun08.CSV, nimo_sc3a_Pri_Adirondack_jun07-may08.dat
Figure 128 Daily Electric Charges for SC3a from June 2007 through May 2008 for Adirondack Region

NYSERDA DG/CHP Integrated Database System Utility Rate Details
CDH Energy Corporation 269 September 25, 2008
Niagara Mohawk
Service Classification 3a – Large General Time-of-Use - Primary – Electric Supply Charge (Utica Region) – February 2005 to January 2006 This service is for commercial or industrial customers whose monthly measured demand exceeds 100kW in each of the previous 12 consecutive months and the monthly demand has exceeded 2,000 kW in any two consecutive months of the previous twelve months. Primary customers are served at voltage levels between 2.2 and 15 kV. This rate is for facilities located in the Utica Region. Service Charge $ 902.00 Periods On-Peak 8 AM – 10 PM, Monday – Friday Off-Peak All hours not included in On-Peak Reactive Demand Charge $ 1.02 / RkVA in excess of 1/3 peak demand in kW Demand Charges $ per peak kW Distribution Delivery and Competitive Transition Charges $ 8.86 / kW Energy Charges1 $ per total kWh System Benefits, Distribution Delivery and Renewable Portfolio Charges: $ 0.003889 / kWh
Transmission Revenue Adjustment $ per total kWh Jan Feb Mar Apr May Jun Jul Aug Sep Oct Nov Dec $0.00221 $0.00312 $0.00105 $0.00091 $0.00132 $0.00183 $0.00173 $0.00143 $0.00002 $0.00096 $0.00160 $0.00212Competitive Transition Charge: On-Peak Off-Peak Up to 250 hours of peak demand $ 0.00777 / kWh $ 0.00619 / kWh Hourly Electric Charges1 See Figure 129
1 – Variable Energy Charges are the hourly charges from February 2005 – January 2006 as available at the Niagara Mohawk website.
Filenames: NIMO_SC3a_Pri_ESC_UTICA_feb05-jan06.CSV, nimo_sc3a_Pri_Utica.dat SC3a Large General TOU Primary for Utica Region
Jan Feb Mar Apr May Jun Jul Aug Sep Oct Nov Dec0.00
0.05
0.10
0.15
0.20
0.25
Ele
ctric
Sup
ply
plus
Del
iver
y C
harg
e A
djus
tmen
t ($/
kWh)
Figure 129 Daily Electric Charges for SC3a from February 2005 through January 2006 for Utica Region

NYSERDA DG/CHP Integrated Database System Utility Rate Details
CDH Energy Corporation 270 September 25, 2008
Niagara Mohawk
Service Classification 3a – Large General Time-of-Use - Primary – Electric Supply Charge (Utica Region) – October 2005 to September 2006 This service is for commercial or industrial customers whose monthly measured demand exceeds 100kW in each of the previous 12 consecutive months and the monthly demand has exceeded 2,000 kW in any two consecutive months of the previous twelve months. Primary customers are served at voltage levels between 2.2 and 15 kV. This rate is for facilities located in the Utica Region. Service Charge $ 902.00 Periods On-Peak 8 AM – 10 PM, Monday – Friday Off-Peak All hours not included in On-Peak Reactive Demand Charge $ 1.02 / RkVA in excess of 1/3 peak demand in kW Demand Charges $ per peak kW Distribution Delivery and Competitive Transition Charges $ 9.67 / kW Energy Charges1 $ per total kWh System Benefits, Distribution Delivery and Renewable Portfolio Charges: $ 0.004480 / kWh
Transmission Revenue Adjustment $ per total kWh Jan Feb Mar Apr May Jun Jul Aug Sep Oct Nov Dec $0.00312 $0.00300 $0.00260 ($0.00116) $0.00208 $0.00177 $0.00117 $0.00196 $0.00167 $0.00160 $0.00212 $0.00221Competitive Transition Charge: On-Peak Off-Peak Up to 250 hours of peak demand $ 0.00733 / kWh $ 0.00564 / kWh Hourly Electric Charges1 See Figure 130
1 – Variable Energy Charges are the hourly charges from October 2005 – September 2006 as available at the Niagara Mohawk website.
Filenames: NIMO_SC3a_Pri_ESC_UTICA_oct05-sep06.CSV, nimo_sc3a_Pri_Utica_oct05-sep06.dat SC 3a Large General TOU Primary for Utica Region
Jan Feb Mar Apr May Jun Jul Aug Sep Oct Nov Dec0.00
0.05
0.10
0.15
0.20
0.25
Ele
ctric
Sup
ply
plus
Del
iver
y C
harg
e A
djus
tmen
t ($/
kWh)
Figure 130 Daily Electric Charges for SC3a from October 2005 through September 2006 for Utica Region

NYSERDA DG/CHP Integrated Database System Utility Rate Details
CDH Energy Corporation 271 September 25, 2008
Niagara Mohawk
Service Classification 3a – Large General Time-of-Use - Primary – Electric Supply Charge (Utica Region) – July 2007 to June 2008 This service is for commercial or industrial customers whose monthly measured demand exceeds 100kW in each of the previous 12 consecutive months and the monthly demand has exceeded 2,000 kW in any two consecutive months of the previous twelve months. Primary customers are served at voltage levels between 2.2 and 15 kV. This rate is for facilities located in the Utica Region. Service Charge $ 902.00 Periods On-Peak 8 AM – 10 PM, Monday – Friday Off-Peak All hours not included in On-Peak Reactive Demand Charge $ 1.02 / RkVA in excess of 1/3 peak demand in kW Demand Charges $ per peak kW Distribution Delivery and Competitive Transition Charges $ 9.96 / kW Energy Charges1 $ per total kWh System Benefits, Distribution Delivery and Renewable Portfolio Charges: $ 0.002263 / kWh
Transmission Revenue Adjustment $ per total kWh Jan Feb Mar Apr May Jun Jul Aug Sep Oct Nov Dec ($0.00101) ($0.00130) ($0.00089) $0.00217 $0.00110 $0.00258 ($0.0002) $0.0014 $0.00074 $0.00006 ($0.00002) $0.00081Competitive Transition Charge: On-Peak Off-Peak Up to 250 hours of peak demand $ 0.00512 / kWh $ 0.00387 / kWh Hourly Electric Charges1 See Figure 131
1 – Variable Energy Charges are the hourly charges from July 2007 – June 2008 as available at the Niagara Mohawk website.
Filenames: NIMO_SC3a_Pri_ESC_UTICA_Jul07-Jun08.CSV, nimo_sc3a_Pri_Utica_jun07-may08.dat
Figure 131 Daily Electric Charges for SC3a from June 2007 through May 2008 for Utica Region

NYSERDA DG/CHP Integrated Database System Utility Rate Details
CDH Energy Corporation 272 September 25, 2008
Niagara Mohawk
Service Classification 3a – Large General Time-of-Use - Primary – Electric Supply Charge (Capital Region) – February 2005 to January 2006 This service is for commercial or industrial customers whose monthly measured demand exceeds 100kW in each of the previous 12 consecutive months and the monthly demand has exceeded 2,000 kW in any two consecutive months of the previous twelve months. Primary customers are served at voltage levels between 2.2 and 15 kV. This rate is for facilities located in the Capital Region. Service Charge $ 902.00 Periods On-Peak 8 AM – 10 PM, Monday – Friday Off-Peak All hours not included in On-Peak Reactive Demand Charge $ 1.02 / RkVA in excess of 1/3 peak demand in kW Demand Charges $ per peak kW Distribution Delivery and Competitive Transition Charges $ 8.86 / kW Energy Charges1 $ per total kWh System Benefits, Distribution Delivery and Renewable Portfolio Charges: $ 0.003889 / kWh
Transmission Revenue Adjustment $ per total kWh Jan Feb Mar Apr May Jun Jul Aug Sep Oct Nov Dec $0.00221 $0.00312 $0.00105 $0.00091 $0.00132 $0.00183 $0.00173 $0.00143 $0.00002 $0.00096 $0.00160 $0.00212Competitive Transition Charge: On-Peak Off-Peak Up to 250 hours of peak demand $ 0.00777 / kWh $ 0.00619 / kWh Hourly Electric Charges1 See Figure 132
1 – Variable Energy Charges are the hourly charges from February 2005 – January 2006 as available at the Niagara Mohawk website.
Filenames: NIMO_SC3a_Pri_ESC_CAPITAL_feb05-jan06.CSV, nimo_sc3a_Pri_Capital.dat SC3a Large General TOU Primary for Capital Region
Jan Feb Mar Apr May Jun Jul Aug Sep Oct Nov Dec0.00
0.05
0.10
0.15
0.20
0.25
Ele
ctric
Sup
ply
plus
Del
iver
y C
harg
e A
djus
tmen
t ($/
kWh)
Figure 132 Daily Electric Charges for SC3a from February 2005 through January 2006 for Capital Region

NYSERDA DG/CHP Integrated Database System Utility Rate Details
CDH Energy Corporation 273 September 25, 2008
Niagara Mohawk
Service Classification 3a – Large General Time-of-Use - Primary – Electric Supply Charge (Capital Region) – October 2005 to September 2006 This service is for commercial or industrial customers whose monthly measured demand exceeds 100kW in each of the previous 12 consecutive months and the monthly demand has exceeded 2,000 kW in any two consecutive months of the previous twelve months. Primary customers are served at voltage levels between 2.2 and 15 kV. This rate is for facilities located in the Capital Region. Service Charge $ 902.00 Periods On-Peak 8 AM – 10 PM, Monday – Friday Off-Peak All hours not included in On-Peak Reactive Demand Charge $ 1.02 / RkVA in excess of 1/3 peak demand in kW Demand Charges $ per peak kW Distribution Delivery and Competitive Transition Charges $ 9.67 / kW Energy Charges1 $ per total kWh System Benefits, Distribution Delivery and Renewable Portfolio Charges: $ 0.004480 / kWh
Transmission Revenue Adjustment $ per total kWh Jan Feb Mar Apr May Jun Jul Aug Sep Oct Nov Dec $0.00312 $0.00300 $0.00260 ($0.00116) $0.00208 $0.00177 $0.00117 $0.00196 $0.00167 $0.00160 $0.00212 $0.00221Competitive Transition Charge: On-Peak Off-Peak Up to 250 hours of peak demand $ 0.00635 / kWh $ 0.00483 / kWh Hourly Electric Charges1 See Figure 133
1 – Variable Energy Charges are the hourly charges from October 2005 – September 2006 as available at the Niagara Mohawk website.
Filenames: NIMO_SC3a_Pri_ESC_CAPITAL_oct05-sep06.CSV, nimo_sc3a_Pri_Capital_oct05-sep06.dat
SC 3a Large General TOU Primary for Capital Region
Jan Feb Mar Apr May Jun Jul Aug Sep Oct Nov Dec0.00
0.05
0.10
0.15
0.20
0.25
Ele
ctric
Sup
ply
plus
Del
iver
y C
harg
e A
djus
tmen
t ($/
kWh)
Figure 133 Daily Electric Charges for SC3a from October 2005 through September 2006 for Capital Region

NYSERDA DG/CHP Integrated Database System Utility Rate Details
CDH Energy Corporation 274 September 25, 2008
Niagara Mohawk
Service Classification 3a – Large General Time-of-Use - Primary – Electric Supply Charge (Capital Region) – July 2007 to June 2008 This service is for commercial or industrial customers whose monthly measured demand exceeds 100kW in each of the previous 12 consecutive months and the monthly demand has exceeded 2,000 kW in any two consecutive months of the previous twelve months. Primary customers are served at voltage levels between 2.2 and 15 kV. This rate is for facilities located in the Capital Region. Service Charge $ 902.00 Periods On-Peak 8 AM – 10 PM, Monday – Friday Off-Peak All hours not included in On-Peak Reactive Demand Charge $ 1.02 / RkVA in excess of 1/3 peak demand in kW Demand Charges $ per peak kW Distribution Delivery and Competitive Transition Charges $ 9.96 / kW Energy Charges1 $ per total kWh System Benefits, Distribution Delivery and Renewable Portfolio Charges: $ 0.002263 / kWh
Transmission Revenue Adjustment $ per total kWh Jan Feb Mar Apr May Jun Jul Aug Sep Oct Nov Dec ($0.00101) ($0.00130) ($0.00089) $0.00217 $0.00110 $0.00258 ($0.0002) $0.0014 $0.00074 $0.00006 ($0.00002) $0.00081Competitive Transition Charge: On-Peak Off-Peak Up to 250 hours of peak demand $ 0.00512 / kWh $ 0.00387 / kWh Hourly Electric Charges1 See Figure 134
1 – Variable Energy Charges are the hourly charges from July 2007 – June 2008 as available at the Niagara Mohawk website.
Filenames: NIMO_SC3a_Pri_ESC_CAPITAL_Jul07-Jun08.CSV, nimo_sc3a_Pri_Capital_jun07-may08.dat
Figure 134 Daily Electric Charges for SC3a from June 2007 through May 2008 for Capital Region

NYSERDA DG/CHP Integrated Database System Utility Rate Details
CDH Energy Corporation 275 September 25, 2008
Niagara Mohawk
Service Classification 7 – Standby – Based on SC1 Residential (Frontier Region) – February 2005 to January 2006 Standby service rates shall apply to: (a.) customers with on-site generation serving load that is not isolated from the grid in accordance with Rule 1.48; (b.) Wholesale Generators that rely on the electric utility to serve electric loads that would otherwise be served by the generator such as station power used for the heating, lighting, air-conditioning, and office equipment needs of the buildings housing the generator and associated support facilities located on a generating facility's site, and/or to facilitate the re-starting of the generator following an outage. Standby rates will also apply to Wholesale Generators that take station service through the same bus bar as they supply the wholesale grid. This rate is for facilities located in the Frontier Region. Service Charge $ 13.72 includes Customer Charge and Competitive Transition Charges Contract Customer Charge2 $ 13.50 includes Distribution Delivery and Competitive Transition Charges Energy Charges1 $ per total kWh for All Hours System Benefits, Delivery, Competitive Transition and Renewable Portfolio Charges $ 0.011139 / kWh Transmission Revenue Adjustment $ per kWh Jan Feb Mar Apr May Jun Jul Aug Sep Oct Nov Dec $0.00136 $0.00210 $0.00099 $0.00080 $0.00144 $0.00186 $0.00177 $0.00138 $0.00002 $0.00104 $0.00163 $0.00188
Electric Supply Cost, Delivery Charge Adjustment1 See Figure 23 1 – Variable Energy Charges are from February 2005 – January 2006 as available at the Niagara Mohawk
website. 2 – The Contract Customer Charge is a reservation charge for the use of the Company's local distribution
system. Filename: NIMO_SC7_SC1_FRONTIER_feb05-jan06.CSV, nimo_sc1_Sec_Frontier_feb05-jan06.dat
Niagara Mohawk
Service Classification 7 – Standby – Based on SC1 Residential (Frontier Region) – October 2005 to September 2006 Standby service rates shall apply to: (a.) customers with on-site generation serving load that is not isolated from the grid in accordance with Rule 1.48; (b.) Wholesale Generators that rely on the electric utility to serve electric loads that would otherwise be served by the generator such as station power used for the heating, lighting, air-conditioning, and office equipment needs of the buildings housing the generator and associated support facilities located on a generating facility's site, and/or to facilitate the re-starting of the generator following an outage. Standby rates will also apply to Wholesale Generators that take station service through the same bus bar as they supply the wholesale grid. This rate is for facilities located in the Frontier Region. Service Charge $ 14.86 includes Customer Charge and Competitive Transition Charges Contract Customer Charge2 $ 15.09 includes Distribution Delivery and Competitive Transition Charges Energy Charges1 $ per total kWh for All Hours System Benefits, Delivery, Competitive Transition and Renewable Portfolio Charges $ 0.012460 / kWh Transmission Revenue Adjustment $ per kWh Jan Feb Mar Apr May Jun Jul Aug Sep Oct Nov Dec $0.00210 $0.00211 $0.00200 ($0.00104) $0.00186 $0.00152 $0.00099 $0.00160 $0.00142 $0.00163 $0.00188 $0.00136
Electric Supply Cost, Delivery Charge Adjustment1 See Figure 24 1 – Variable Energy Charges are from October 2005 – September 2006 as available at the Niagara
Mohawk website. 2 – The Contract Customer Charge is a reservation charge for the use of the Company's local distribution
system. Filename: NIMO_SC7_SC1_FRONTIER_oct05-sep06.CSV, nimo_sc1_Sec_Frontier_oct05-jan06.dat

NYSERDA DG/CHP Integrated Database System Utility Rate Details
CDH Energy Corporation 276 September 25, 2008
Niagara Mohawk
Service Classification 7 – Standby – Based on SC1 Residential (Frontier Region) – February 2006 to January 2007 Standby service rates shall apply to: (a.) customers with on-site generation serving load that is not isolated from the grid in accordance with Rule 1.48; (b.) Wholesale Generators that rely on the electric utility to serve electric loads that would otherwise be served by the generator such as station power used for the heating, lighting, air-conditioning, and office equipment needs of the buildings housing the generator and associated support facilities located on a generating facility's site, and/or to facilitate the re-starting of the generator following an outage. Standby rates will also apply to Wholesale Generators that take station service through the same bus bar as they supply the wholesale grid. This rate is for facilities located in the Frontier Region. Service Charge $ 15.08 includes Customer Charge and Competitive Transition Charges Contract Customer Charge2 $ 16.51 includes Distribution Delivery and Competitive Transition Charges Energy Charges1 $ per total kWh for All Hours System Benefits, Delivery, Competitive Transition and Renewable Portfolio Charges $ 0.013038 / kWh Transmission Revenue Adjustment $ per kWh Jan Feb Mar Apr May Jun Jul Aug Sep Oct Nov Dec $0.00210 $0.00211 $0.00200 ($0.00104) $0.00186 $0.00152 $0.00099 $0.00160 $0.00142 ($0.00041) ($0.00031) ($0.00032)
Electric Supply Cost, Delivery Charge Adjustment1 See Figure 25 1 – Variable Energy Charges are from February 2006 – January 2007 as available at the Niagara Mohawk
website. 2 – The Contract Customer Charge is a reservation charge for the use of the Company's local distribution
system. Filename: NIMO_SC7_SC1_FRONTIER_feb06-jan07.CSV, nimo_sc1_Sec_Frontier_feb06-jan07.dat
Niagara Mohawk
Service Classification 7 – Standby – Based on SC1 Residential (Frontier Region) –July 2007 to June 2008Standby service rates shall apply to: (a.) customers with on-site generation serving load that is not isolated from the grid in accordance with Rule 1.48; (b.) Wholesale Generators that rely on the electric utility to serve electric loads that would otherwise be served by the generator such as station power used for the heating, lighting, air-conditioning, and office equipment needs of the buildings housing the generator and associated support facilities located on a generating facility's site, and/or to facilitate the re-starting of the generator following an outage. Standby rates will also apply to Wholesale Generators that take station service through the same bus bar as they supply the wholesale grid. This rate is for facilities located in the Frontier Region. Service Charge $ 17.01 includes Customer Charge and Competitive Transition Charges Contract Customer Charge2 $ 17.31 includes Distribution Delivery and Competitive Transition Charges Energy Charges1 $ per total kWh for All Hours System Benefits, Delivery, Competitive Transition and Renewable Portfolio Charges $ 0.014123 / kWh Transmission Revenue Adjustment $ per kWh Jan Feb Mar Apr May Jun Jul Aug Sep Oct Nov Dec $(0.00050) $(0.00072) $(0.00053) $0.00137 $0.00086 $0.00179 $0.00017 $0.00118 $0.00142 $0.00005 $(0.00001) $0.00055
Electric Supply Cost, Delivery Charge Adjustment1 See Figure 26 1 – Variable Energy Charges are from July 2007 – June 2008 as available at the Niagara Mohawk
website. 2 – The Contract Customer Charge is a reservation charge for the use of the Company's local distribution
system. Filename: NIMO_SC7_SC1_FRONTIER_Jul07-Jun08.CSV, nimo_sc1_Sec_Frontier_jun07-may08.dat

NYSERDA DG/CHP Integrated Database System Utility Rate Details
CDH Energy Corporation 277 September 25, 2008
Niagara Mohawk
Service Classification 7 – Standby – Based on SC1 Residential (Capital Region) – February 2006 to January 2007 Standby service rates shall apply to: (a.) customers with on-site generation serving load that is not isolated from the grid in accordance with Rule 1.48; (b.) Wholesale Generators that rely on the electric utility to serve electric loads that would otherwise be served by the generator such as station power used for the heating, lighting, air-conditioning, and office equipment needs of the buildings housing the generator and associated support facilities located on a generating facility's site, and/or to facilitate the re-starting of the generator following an outage. Standby rates will also apply to Wholesale Generators that take station service through the same bus bar as they supply the wholesale grid. This rate is for facilities located in the Capital Region. Service Charge $ 15.08 includes Customer Charge and Competitive Transition Charges Contract Customer Charge2 $ 16.51 includes Distribution Delivery and Competitive Transition Charges Energy Charges1 $ per total kWh for All Hours System Benefits, Delivery, Competitive Transition and Renewable Portfolio Charges $ 0.013038 / kWh Transmission Revenue Adjustment $ per kWh Jan Feb Mar Apr May Jun Jul Aug Sep Oct Nov Dec $0.00210 $0.00211 $0.00200 ($0.00104) $0.00186 $0.00152 $0.00099 $0.00160 $0.00142 ($0.00041) ($0.00031) ($0.00032)
Electric Supply Cost, Delivery Charge Adjustment1 See Figure 27 1 – Variable Energy Charges are from February 2006 – January 2007 as available at the Niagara Mohawk
website. 2 – The Contract Customer Charge is a reservation charge for the use of the Company's local distribution
system. Filename: NIMO_SC7_SC1_CAPITAL_feb06-jan07.CSV, nimo_sc1_Sec_Capital_feb06-jan07.dat
Niagara Mohawk
Service Classification 7 – Standby – Based on SC1 Residential (Capital Region) –July 2007 to June 2008 Standby service rates shall apply to: (a.) customers with on-site generation serving load that is not isolated from the grid in accordance with Rule 1.48; (b.) Wholesale Generators that rely on the electric utility to serve electric loads that would otherwise be served by the generator such as station power used for the heating, lighting, air-conditioning, and office equipment needs of the buildings housing the generator and associated support facilities located on a generating facility's site, and/or to facilitate the re-starting of the generator following an outage. Standby rates will also apply to Wholesale Generators that take station service through the same bus bar as they supply the wholesale grid. This rate is for facilities located in the Capital Region. Service Charge $ 17.01 includes Customer Charge and Competitive Transition Charges Contract Customer Charge2 $ 17.31 includes Distribution Delivery and Competitive Transition Charges Energy Charges1 $ per total kWh for All Hours System Benefits, Delivery, Competitive Transition and Renewable Portfolio Charges $ 0.014123 / kWh Transmission Revenue Adjustment $ per kWh Jan Feb Mar Apr May Jun Jul Aug Sep Oct Nov Dec ($0.0005) ($0.00072) ($0.00053) $0.00137 $0.00086 $0.00179 ($0.00017) $0.00118 $0.00062 $0.00005 ($0.00001) $0.00055
Electric Supply Cost, Delivery Charge Adjustment1 See Figure 28 1 – Variable Energy Charges are from July 2007 – June 2008 as available at the Niagara Mohawk
website. 2 – The Contract Customer Charge is a reservation charge for the use of the Company's local distribution
system. Filename: NIMO_SC7_SC1_CAPITAL_Jul07-Jun08.CSV, nimo_sc1_Sec_Capital_jun07-may08.dat

NYSERDA DG/CHP Integrated Database System Utility Rate Details
CDH Energy Corporation 278 September 25, 2008
Niagara Mohawk
Service Classification 7 – Standby – Based on SC3 Secondary (Frontier Region) – February 2005 to January 2006 Standby service rates shall apply to: (a.) customers with on-site generation serving load that is not isolated from the grid in accordance with Rule 1.48; (b.) Wholesale Generators that rely on the electric utility to serve electric loads that would otherwise be served by the generator such as station power used for the heating, lighting, air-conditioning, and office equipment needs of the buildings housing the generator and associated support facilities located on a generating facility's site, and/or to facilitate the re-starting of the generator following an outage. Standby rates will also apply to Wholesale Generators that take station service through the same bus bar as they supply the wholesale grid. This rate is for facilities located in the Frontier Region. Service Charge $ 558.92 for Distribution Delivery and Competitive Transition Charges Contract Demand Charge2 $ 8.57 / kW for Distribution Delivery and Competitive Transition Charges Reactive Demand Charge $ 0.85 / RkVA in excess of 1/3 peak demand in kW Demand Charges $ 0.4714 per daily peak kW for Distribution Delivery and Competitive Transition
Charges Energy Charges $ per total kWh System Benefits and Renewable Portfolio Charges $ 0.001729 / kWh Transmission Revenue Adjustment $ per total kWh Jan Feb Mar Apr May Jun Jul Aug Sep Oct Nov Dec $0.00222 $0.00312 $0.00140 $0.00114 $0.00182 $0.00234 $0.00240 $0.00193 $0.00003 $0.00135 $0.00223 $0.00299
Electric Supply Cost, Delivery Charge Adjustment1 See Figure 62 1 – Variable Energy Charges are from February 2005 – January 2006 as available at the Niagara Mohawk
website. 2 - Standby Contract Demand shall be the maximum anticipated demand of the customer. Filename: NIMO_SC7_SC3_Sec_FRONTIER_feb05-jan06.CSV, nimo_sc3_Sec_Frontier_feb05-jan06.dat

NYSERDA DG/CHP Integrated Database System Utility Rate Details
CDH Energy Corporation 279 September 25, 2008
Niagara Mohawk
Service Classification 7 – Standby – Based on SC3 Secondary (Frontier Region) – October 2005 to September 2006 Standby service rates shall apply to: (a.) customers with on-site generation serving load that is not isolated from the grid in accordance with Rule 1.48; (b.) Wholesale Generators that rely on the electric utility to serve electric loads that would otherwise be served by the generator such as station power used for the heating, lighting, air-conditioning, and office equipment needs of the buildings housing the generator and associated support facilities located on a generating facility's site, and/or to facilitate the re-starting of the generator following an outage. Standby rates will also apply to Wholesale Generators that take station service through the same bus bar as they supply the wholesale grid. This rate is for facilities located in the Frontier Region. Service Charge $ 513.41 for Distribution Delivery and Competitive Transition Charges Contract Demand Charge2 $ 9.52 / kW for Distribution Delivery and Competitive Transition Charges Reactive Demand Charge $ 0.85 / RkVA in excess of 1/3 peak demand in kW Demand Charges $ 0.5104 per daily peak kW for Distribution Delivery and Competitive Transition
Charges Energy Charges $ per total kWh System Benefits and Renewable Portfolio Charges $ 0.002110 / kWh Transmission Revenue Adjustment $ per total kWh Jan Feb Mar Apr May Jun Jul Aug Sep Oct Nov Dec
$0.00312 $0.00303 $0.00269 ($0.00126) $0.00233 $0.00205 $0.00130 $0.00206 $0.00175 $0.00223 $0.00299 $0.00222
Electric Supply Cost, Delivery Charge Adjustment1 See Figure 63 1 – Variable Energy Charges are from October 2005 – September 2006 as available at the Niagara
Mohawk website. 2 - Standby Contract Demand shall be the maximum anticipated demand of the customer. Filename: NIMO_SC7_SC3_Sec_FRONTIER_oct05-sep06.CSV, nimo_sc3_Sec_Frontier_oct05-sep06.dat

NYSERDA DG/CHP Integrated Database System Utility Rate Details
CDH Energy Corporation 280 September 25, 2008
Niagara Mohawk
Service Classification 7 – Standby – Based on SC3 Secondary (Frontier Region) – July 2007 to June 2008 Standby service rates shall apply to: (a.) customers with on-site generation serving load that is not isolated from the grid in accordance with Rule 1.48; (b.) Wholesale Generators that rely on the electric utility to serve electric loads that would otherwise be served by the generator such as station power used for the heating, lighting, air-conditioning, and office equipment needs of the buildings housing the generator and associated support facilities located on a generating facility's site, and/or to facilitate the re-starting of the generator following an outage. Standby rates will also apply to Wholesale Generators that take station service through the same bus bar as they supply the wholesale grid. This rate is for facilities located in the Frontier Region. Service Charge $ 505.31 for Distribution Delivery and Competitive Transition Charges Contract Demand Charge2 $ 9.57 / kW for Distribution Delivery and Competitive Transition Charges Reactive Demand Charge $ 0.85 / RkVA in excess of 1/3 peak demand in kW Demand Charges $ 0.5116 per daily peak kW for Distribution Delivery and Competitive Transition
Charges Energy Charges $ per total kWh System Benefits and Renewable Portfolio Charges $ 0.002023 / kWh Transmission Revenue Adjustment $ per total kWh Jan Feb Mar Apr May Jun Jul Aug Sep Oct Nov Dec ($0.00074) ($0.00098) ($0.00068) $0.00166 $0.00097 $0.00196 ($0.00023) $0.00152 $0.00078 $0.00006 ($0.00002) $0.00078
Electric Supply Cost, Delivery Charge Adjustment1 See Figure 64 1 – Variable Energy Charges are from July 2007 – June 2008 as available at the Niagara Mohawk
website. 2 - Standby Contract Demand shall be the maximum anticipated demand of the customer. Filename: NIMO_SC7_SC3_Sec_FRONTIER_Jul07-Jun08.CSV, nimo_sc3_Sec_Frontier_jun07-may08.dat

NYSERDA DG/CHP Integrated Database System Utility Rate Details
CDH Energy Corporation 281 September 25, 2008
Niagara Mohawk
Service Classification 7 – Standby – Based on SC3 Secondary (Genesee Region) – February 2005 to January 2006 Standby service rates shall apply to: (a.) customers with on-site generation serving load that is not isolated from the grid in accordance with Rule 1.48; (b.) Wholesale Generators that rely on the electric utility to serve electric loads that would otherwise be served by the generator such as station power used for the heating, lighting, air-conditioning, and office equipment needs of the buildings housing the generator and associated support facilities located on a generating facility's site, and/or to facilitate the re-starting of the generator following an outage. Standby rates will also apply to Wholesale Generators that take station service through the same bus bar as they supply the wholesale grid. This rate is for facilities located in the Genesee Region. Service Charge $ 558.92 for Distribution Delivery and Competitive Transition Charges Contract Demand Charge2 $ 8.57 / kW for Distribution Delivery and Competitive Transition Charges Reactive Demand Charge $ 0.85 / RkVA in excess of 1/3 peak demand in kW Demand Charges $ 0.4714 per daily peak kW for Distribution Delivery and Competitive Transition
Charges Energy Charges $ per total kWh System Benefits and Renewable Portfolio Charges $ 0.001729 / kWh Transmission Revenue Adjustment $ per total kWh Jan Feb Mar Apr May Jun Jul Aug Sep Oct Nov Dec $0.00222 $0.00312 $0.00140 $0.00114 $0.00182 $0.00234 $0.00240 $0.00193 $0.00003 $0.00135 $0.00223 $0.00299
Electric Supply Cost, Delivery Charge Adjustment1 See Figure 65 1 – Variable Energy Charges are from February 2005 – January 2006 as available at the Niagara Mohawk
website. 2 - Standby Contract Demand shall be the maximum anticipated demand of the customer. Filename: NIMO_SC7_SC3_Sec_GENESEE_feb05-jan06.CSV, nimo_sc3_Sec_Genesee_feb05-jan06.dat

NYSERDA DG/CHP Integrated Database System Utility Rate Details
CDH Energy Corporation 282 September 25, 2008
Niagara Mohawk
Service Classification 7 – Standby – Based on SC3 Secondary (Genesee Region) – October 2005 to September 2006 Standby service rates shall apply to: (a.) customers with on-site generation serving load that is not isolated from the grid in accordance with Rule 1.48; (b.) Wholesale Generators that rely on the electric utility to serve electric loads that would otherwise be served by the generator such as station power used for the heating, lighting, air-conditioning, and office equipment needs of the buildings housing the generator and associated support facilities located on a generating facility's site, and/or to facilitate the re-starting of the generator following an outage. Standby rates will also apply to Wholesale Generators that take station service through the same bus bar as they supply the wholesale grid. This rate is for facilities located in the Genesee Region. Service Charge $ 513.41 for Distribution Delivery and Competitive Transition Charges Contract Demand Charge2 $ 9.52 / kW for Distribution Delivery and Competitive Transition Charges Reactive Demand Charge $ 0.85 / RkVA in excess of 1/3 peak demand in kW Demand Charges $ 0.5104 per daily peak kW for Distribution Delivery and Competitive Transition
Charges Energy Charges $ per total kWh System Benefits and Renewable Portfolio Charges $ 0.002110 / kWh Transmission Revenue Adjustment $ per total kWh Jan Feb Mar Apr May Jun Jul Aug Sep Oct Nov Dec
$0.00312 $0.00303 $0.00269 ($0.00126) $0.00233 $0.00205 $0.00130 $0.00206 $0.00175 $0.00223 $0.00299 $0.00222
Electric Supply Cost, Delivery Charge Adjustment1 See Figure 66 1 – Variable Energy Charges are from October 2005 – September 2006 as available at the Niagara
Mohawk website. 2 - Standby Contract Demand shall be the maximum anticipated demand of the customer. Filename: NIMO_SC7_SC3_Sec_GENESEE_oct05-sep06.CSV, nimo_sc3_Sec_Genesee_oct05-sep06.dat

NYSERDA DG/CHP Integrated Database System Utility Rate Details
CDH Energy Corporation 283 September 25, 2008
Niagara Mohawk
Service Classification 7 – Standby – Based on SC3 Secondary (Genesee Region) – July 2007 to June 2008 Standby service rates shall apply to: (a.) customers with on-site generation serving load that is not isolated from the grid in accordance with Rule 1.48; (b.) Wholesale Generators that rely on the electric utility to serve electric loads that would otherwise be served by the generator such as station power used for the heating, lighting, air-conditioning, and office equipment needs of the buildings housing the generator and associated support facilities located on a generating facility's site, and/or to facilitate the re-starting of the generator following an outage. Standby rates will also apply to Wholesale Generators that take station service through the same bus bar as they supply the wholesale grid. This rate is for facilities located in the Genesee Region. Service Charge $ 505.31 for Distribution Delivery and Competitive Transition Charges Contract Demand Charge2 $ 9.57 / kW for Distribution Delivery and Competitive Transition Charges Reactive Demand Charge $ 0.85/ RkVA in excess of 1/3 peak demand in kW Demand Charges $ 0.05116per daily peak kW for Distribution Delivery and Competitive Transition
Charges Energy Charges $ per total kWh System Benefits and Renewable Portfolio Charges $ 0.002023 / kWh Transmission Revenue Adjustment $ per total kWh Jan Feb Mar Apr May Jun Jul Aug Sep Oct Nov Dec ($0.00074) ($0.00098) ($0.00068) $0.00166 $0.00097 $0.00196 ($0.00023) $0.00152 $0.00078 $0.00006 ($0.00002) $0.00078
Electric Supply Cost, Delivery Charge Adjustment1 See Figure 67 1 – Variable Energy Charges are from July 2007 – June 2008 as available at the Niagara Mohawk
website. 2 - Standby Contract Demand shall be the maximum anticipated demand of the customer. Filename: NIMO_SC7_SC3_Sec_GENESEE_Jul07-Jun08.CSV, nimo_sc3_Sec_Genesee_jun07-may08.dat

NYSERDA DG/CHP Integrated Database System Utility Rate Details
CDH Energy Corporation 284 September 25, 2008
Niagara Mohawk
Service Classification 7 – Standby – Based on SC3 Secondary (Central Region) – February 2005 to January 2006 Standby service rates shall apply to: (a.) customers with on-site generation serving load that is not isolated from the grid in accordance with Rule 1.48; (b.) Wholesale Generators that rely on the electric utility to serve electric loads that would otherwise be served by the generator such as station power used for the heating, lighting, air-conditioning, and office equipment needs of the buildings housing the generator and associated support facilities located on a generating facility's site, and/or to facilitate the re-starting of the generator following an outage. Standby rates will also apply to Wholesale Generators that take station service through the same bus bar as they supply the wholesale grid. This rate is for facilities located in the Central Region. Service Charge $ 550.43 for Distribution Delivery and Competitive Transition Charges Contract Demand Charge2 $ 8.44 / kW for Distribution Delivery and Competitive Transition Charges Reactive Demand Charge $ 0.85 / RkVA in excess of 1/3 peak demand in kW Demand Charges $ 0.4643 per daily peak kW for Distribution Delivery and Competitive Transition
Charges Energy Charges $ per total kWh System Benefits and Renewable Portfolio Charges $ 0.001729 / kWh Transmission Revenue Adjustment $ per total kWh Jan Feb Mar Apr May Jun Jul Aug Sep Oct Nov Dec $0.00222 $0.00312 $0.00140 $0.00114 $0.00182 $0.00234 $0.00240 $0.00193 $0.00003 $0.00135 $0.00223 $0.00299
Electric Supply Cost, Delivery Charge Adjustment1 See Figure 68 1 – Variable Energy Charges are from February 2005 – January 2006 as available at the Niagara Mohawk
website. 2 - Standby Contract Demand shall be the maximum anticipated demand of the customer. Filename: NIMO_SC7_SC3_Sec_CENTRAL_feb05-jan06.CSV, nimo_sc3_Sec_Central_feb05-jan06.dat

NYSERDA DG/CHP Integrated Database System Utility Rate Details
CDH Energy Corporation 285 September 25, 2008
Niagara Mohawk
Service Classification 7 – Standby – Based on SC3 Secondary (Central Region) – October 2005 to September 2006 Standby service rates shall apply to: (a.) customers with on-site generation serving load that is not isolated from the grid in accordance with Rule 1.48; (b.) Wholesale Generators that rely on the electric utility to serve electric loads that would otherwise be served by the generator such as station power used for the heating, lighting, air-conditioning, and office equipment needs of the buildings housing the generator and associated support facilities located on a generating facility's site, and/or to facilitate the re-starting of the generator following an outage. Standby rates will also apply to Wholesale Generators that take station service through the same bus bar as they supply the wholesale grid. This rate is for facilities located in the Central Region. Service Charge $ 506.20 for Distribution Delivery and Competitive Transition Charges Contract Demand Charge2 $ 9.38 / kW for Distribution Delivery and Competitive Transition Charges Reactive Demand Charge $ 0.85 / RkVA in excess of 1/3 peak demand in kW Demand Charges $ 0.5032 per daily peak kW for Distribution Delivery and Competitive Transition
Charges Energy Charges $ per total kWh System Benefits and Renewable Portfolio Charges $ 0.002110 / kWh Transmission Revenue Adjustment $ per total kWh Jan Feb Mar Apr May Jun Jul Aug Sep Oct Nov Dec
$0.00312 $0.00303 $0.00269 ($0.00126) $0.00233 $0.00205 $0.00130 $0.00206 $0.00175 $0.00223 $0.00299 $0.00222
Electric Supply Cost, Delivery Charge Adjustment1 See Figure 69 1 – Variable Energy Charges are from October 2005 – September 2006 as available at the Niagara
Mohawk website. 2 - Standby Contract Demand shall be the maximum anticipated demand of the customer. Filename: NIMO_SC7_SC3_Sec_CENTRAL_oct05-sep06.CSV, nimo_sc3_Sec_Central_oct05-sep06.dat

NYSERDA DG/CHP Integrated Database System Utility Rate Details
CDH Energy Corporation 286 September 25, 2008
Niagara Mohawk
Service Classification 7 – Standby – Based on SC3 Secondary (Central Region) – July 2007 to June 2008 Standby service rates shall apply to: (a.) customers with on-site generation serving load that is not isolated from the grid in accordance with Rule 1.48; (b.) Wholesale Generators that rely on the electric utility to serve electric loads that would otherwise be served by the generator such as station power used for the heating, lighting, air-conditioning, and office equipment needs of the buildings housing the generator and associated support facilities located on a generating facility's site, and/or to facilitate the re-starting of the generator following an outage. Standby rates will also apply to Wholesale Generators that take station service through the same bus bar as they supply the wholesale grid. This rate is for facilities located in the Central Region. Service Charge $ 505.31 for Distribution Delivery and Competitive Transition Charges Contract Demand Charge2 $ 9.57 / kW for Distribution Delivery and Competitive Transition Charges Reactive Demand Charge $ 0.85 / RkVA in excess of 1/3 peak demand in kW Demand Charges $ 0.5116per daily peak kW for Distribution Delivery and Competitive Transition
Charges Energy Charges $ per total kWh System Benefits and Renewable Portfolio Charges $ 0.002023 / kWh Transmission Revenue Adjustment $ per total kWh Jan Feb Mar Apr May Jun Jul Aug Sep Oct Nov Dec ($0.00074) ($0.00098) ($0.00068) $0.00166 $0.00097 $0.00196 ($0.00023) $0.00152 $0.00078 $0.00006 ($0.00002) $0.00078
Electric Supply Cost, Delivery Charge Adjustment1 See Figure 70 1 – Variable Energy Charges are from July 2007 – June 2008 as available at the Niagara Mohawk
website. 2 - Standby Contract Demand shall be the maximum anticipated demand of the customer. Filename: NIMO_SC7_SC3_Sec_CENTRAL_Jul07-Jun08.CSV, nimo_sc3_Sec_Central_jun07-may08.dat

NYSERDA DG/CHP Integrated Database System Utility Rate Details
CDH Energy Corporation 287 September 25, 2008
Niagara Mohawk
Service Classification 7 – Standby – Based on SC3 Secondary (Adirondack Region) – February 2005 to January 2006 Standby service rates shall apply to: (a.) customers with on-site generation serving load that is not isolated from the grid in accordance with Rule 1.48; (b.) Wholesale Generators that rely on the electric utility to serve electric loads that would otherwise be served by the generator such as station power used for the heating, lighting, air-conditioning, and office equipment needs of the buildings housing the generator and associated support facilities located on a generating facility's site, and/or to facilitate the re-starting of the generator following an outage. Standby rates will also apply to Wholesale Generators that take station service through the same bus bar as they supply the wholesale grid. This rate is for facilities located in the Adirondack Region. Service Charge $ 550.43 for Distribution Delivery and Competitive Transition Charges Contract Demand Charge2 $ 8.44 / kW for Distribution Delivery and Competitive Transition Charges Reactive Demand Charge $ 0.85 / RkVA in excess of 1/3 peak demand in kW Demand Charges $ 0.4643 per daily peak kW for Distribution Delivery and Competitive Transition
Charges Energy Charges $ per total kWh System Benefits and Renewable Portfolio Charges $ 0.001729 / kWh Transmission Revenue Adjustment $ per total kWh Jan Feb Mar Apr May Jun Jul Aug Sep Oct Nov Dec $0.00222 $0.00312 $0.00140 $0.00114 $0.00182 $0.00234 $0.00240 $0.00193 $0.00003 $0.00135 $0.00223 $0.00299
Electric Supply Cost, Delivery Charge Adjustment1 See Figure 71 1 – Variable Energy Charges are from February 2005 – January 2006 as available at the Niagara Mohawk
website. 2 - Standby Contract Demand shall be the maximum anticipated demand of the customer. Filename: NIMO_SC7_SC3_Sec_ADIRONDACK_feb05-jan06.CSV, nimo_sc3_Sec_Adirondack_feb05-jan06.dat

NYSERDA DG/CHP Integrated Database System Utility Rate Details
CDH Energy Corporation 288 September 25, 2008
Niagara Mohawk
Service Classification 7 – Standby – Based on SC3 Secondary (Adirondack Region) – October 2005 to September 2006 Standby service rates shall apply to: (a.) customers with on-site generation serving load that is not isolated from the grid in accordance with Rule 1.48; (b.) Wholesale Generators that rely on the electric utility to serve electric loads that would otherwise be served by the generator such as station power used for the heating, lighting, air-conditioning, and office equipment needs of the buildings housing the generator and associated support facilities located on a generating facility's site, and/or to facilitate the re-starting of the generator following an outage. Standby rates will also apply to Wholesale Generators that take station service through the same bus bar as they supply the wholesale grid. This rate is for facilities located in the Adirondack Region. Service Charge $ 506.20 for Distribution Delivery and Competitive Transition Charges Contract Demand Charge2 $ 9.38 / kW for Distribution Delivery and Competitive Transition Charges Reactive Demand Charge $ 0.85 / RkVA in excess of 1/3 peak demand in kW Demand Charges $ 0.5032 per daily peak kW for Distribution Delivery and Competitive Transition
Charges Energy Charges $ per total kWh System Benefits and Renewable Portfolio Charges $ 0.002110 / kWh Transmission Revenue Adjustment $ per total kWh Jan Feb Mar Apr May Jun Jul Aug Sep Oct Nov Dec $0.00312 $0.00303 $0.00269 ($0.00126) $0.00233 $0.00205 $0.00130 $0.00206 $0.00175 $0.00223 $0.00299 $0.00222
Electric Supply Cost, Delivery Charge Adjustment1 See Figure 72 1 – Variable Energy Charges are from October 2005 – September 2006 as available at the Niagara
Mohawk website. 2 - Standby Contract Demand shall be the maximum anticipated demand of the customer. Filename: NIMO_SC7_SC3_Sec_ADIRONDACK_oct05-sep06.CSV, nimo_sc3_Sec_Adirondack_oct05-sep06.dat

NYSERDA DG/CHP Integrated Database System Utility Rate Details
CDH Energy Corporation 289 September 25, 2008
Niagara Mohawk
Service Classification 7 – Standby – Based on SC3 Secondary (Adirondack Region) – July 2007 to June 2008 Standby service rates shall apply to: (a.) customers with on-site generation serving load that is not isolated from the grid in accordance with Rule 1.48; (b.) Wholesale Generators that rely on the electric utility to serve electric loads that would otherwise be served by the generator such as station power used for the heating, lighting, air-conditioning, and office equipment needs of the buildings housing the generator and associated support facilities located on a generating facility's site, and/or to facilitate the re-starting of the generator following an outage. Standby rates will also apply to Wholesale Generators that take station service through the same bus bar as they supply the wholesale grid. This rate is for facilities located in the Adirondack Region. Service Charge $ 505.30 for Distribution Delivery and Competitive Transition Charges Contract Demand Charge2 $ 9.57 / kW for Distribution Delivery and Competitive Transition Charges Reactive Demand Charge $ 0.85 / RkVA in excess of 1/3 peak demand in kW Demand Charges $ 0.5116 per daily peak kW for Distribution Delivery and Competitive Transition
Charges Energy Charges $ per total kWh System Benefits and Renewable Portfolio Charges $ 0.002023 / kWh Transmission Revenue Adjustment $ per total kWh Jan Feb Mar Apr May Jun Jul Aug Sep Oct Nov Dec ($0.00074) ($0.00098) ($0.00068) $0.00166 $0.00097 $0.00196 ($0.00023) $0.00152 $0.00078 $0.00006 ($0.00002) $0.00078
Electric Supply Cost, Delivery Charge Adjustment1 See Figure 73 1 – Variable Energy Charges are from July 2007 – June 2008 as available at the Niagara Mohawk
website. 2 - Standby Contract Demand shall be the maximum anticipated demand of the customer. Filename: NIMO_SC7_SC3_Sec_ADIRONDACK_Jul07-Jun08.CSV, nimo_sc3_Sec_Adirondack_jun07-may08.dat

NYSERDA DG/CHP Integrated Database System Utility Rate Details
CDH Energy Corporation 290 September 25, 2008
Niagara Mohawk
Service Classification 7 – Standby – Based on SC3 Secondary (Utica Region) – February 2005 to January 2006 Standby service rates shall apply to: (a.) customers with on-site generation serving load that is not isolated from the grid in accordance with Rule 1.48; (b.) Wholesale Generators that rely on the electric utility to serve electric loads that would otherwise be served by the generator such as station power used for the heating, lighting, air-conditioning, and office equipment needs of the buildings housing the generator and associated support facilities located on a generating facility's site, and/or to facilitate the re-starting of the generator following an outage. Standby rates will also apply to Wholesale Generators that take station service through the same bus bar as they supply the wholesale grid. This rate is for facilities located in the Utica Region. Service Charge $ 550.43 for Distribution Delivery and Competitive Transition Charges Contract Demand Charge2 $ 8.44 / kW for Distribution Delivery and Competitive Transition Charges Reactive Demand Charge $ 0.85 / RkVA in excess of 1/3 peak demand in kW Demand Charges $ 0.4643 per daily peak kW for Distribution Delivery and Competitive Transition
Charges Energy Charges $ per total kWh System Benefits and Renewable Portfolio Charges $ 0.001729 / kWh Transmission Revenue Adjustment $ per total kWh Jan Feb Mar Apr May Jun Jul Aug Sep Oct Nov Dec $0.00222 $0.00312 $0.00140 $0.00114 $0.00182 $0.00234 $0.00240 $0.00193 $0.00003 $0.00135 $0.00223 $0.00299
Electric Supply Cost, Delivery Charge Adjustment1 See Figure 74 1 – Variable Energy Charges are from February 2005 – January 2006 as available at the Niagara Mohawk
website. 2 - Standby Contract Demand shall be the maximum anticipated demand of the customer. Filename: NIMO_SC7_SC3_Sec_UTICA_feb05-jan06.CSV, nimo_sc3_Sec_Utica_feb05-jan06.dat

NYSERDA DG/CHP Integrated Database System Utility Rate Details
CDH Energy Corporation 291 September 25, 2008
Niagara Mohawk
Service Classification 7 – Standby – Based on SC3 Secondary (Utica Region) – October 2005 to September 2006 Standby service rates shall apply to: (a.) customers with on-site generation serving load that is not isolated from the grid in accordance with Rule 1.48; (b.) Wholesale Generators that rely on the electric utility to serve electric loads that would otherwise be served by the generator such as station power used for the heating, lighting, air-conditioning, and office equipment needs of the buildings housing the generator and associated support facilities located on a generating facility's site, and/or to facilitate the re-starting of the generator following an outage. Standby rates will also apply to Wholesale Generators that take station service through the same bus bar as they supply the wholesale grid. This rate is for facilities located in the Utica Region. Service Charge $ 506.20 for Distribution Delivery and Competitive Transition Charges Contract Demand Charge2 $ 9.38 / kW for Distribution Delivery and Competitive Transition Charges Reactive Demand Charge $ 0.85 / RkVA in excess of 1/3 peak demand in kW Demand Charges $ 0.5032 per daily peak kW for Distribution Delivery and Competitive Transition
Charges Energy Charges $ per total kWh System Benefits and Renewable Portfolio Charges $ 0.002110 / kWh Transmission Revenue Adjustment $ per total kWh Jan Feb Mar Apr May Jun Jul Aug Sep Oct Nov Dec
$0.00312 $0.00303 $0.00269 ($0.00126) $0.00233 $0.00205 $0.00130 $0.00206 $0.00175 $0.00223 $0.00299 $0.00222
Electric Supply Cost, Delivery Charge Adjustment1 See Figure 75 1 – Variable Energy Charges are from October 2005 – September 2006 as available at the Niagara
Mohawk website. 2 - Standby Contract Demand shall be the maximum anticipated demand of the customer. Filename: NIMO_SC7_SC3_Sec_UTICA_oct05-sep06.CSV, nimo_sc3_Sec_Utica_oct05-sep06.dat

NYSERDA DG/CHP Integrated Database System Utility Rate Details
CDH Energy Corporation 292 September 25, 2008
Niagara Mohawk
Service Classification 7 – Standby – Based on SC3 Secondary (Utica Region) – July 2007 to June 2008 Standby service rates shall apply to: (a.) customers with on-site generation serving load that is not isolated from the grid in accordance with Rule 1.48; (b.) Wholesale Generators that rely on the electric utility to serve electric loads that would otherwise be served by the generator such as station power used for the heating, lighting, air-conditioning, and office equipment needs of the buildings housing the generator and associated support facilities located on a generating facility's site, and/or to facilitate the re-starting of the generator following an outage. Standby rates will also apply to Wholesale Generators that take station service through the same bus bar as they supply the wholesale grid. This rate is for facilities located in the Utica Region. Service Charge $ 505.30 for Distribution Delivery and Competitive Transition Charges Contract Demand Charge2 $ 9.57 / kW for Distribution Delivery and Competitive Transition Charges Reactive Demand Charge $ 0.85 / RkVA in excess of 1/3 peak demand in kW Demand Charges $ 0.5116 per daily peak kW for Distribution Delivery and Competitive Transition
Charges Energy Charges $ per total kWh System Benefits and Renewable Portfolio Charges $ 0.002023 / kWh Transmission Revenue Adjustment $ per total kWh Jan Feb Mar Apr May Jun Jul Aug Sep Oct Nov Dec ($0.00074) ($0.00098) ($0.00068) $0.00166 $0.00097 $0.00196 ($0.00023) $0.00152 $0.00078 $0.00006 ($0.00002) $0.00078
Electric Supply Cost, Delivery Charge Adjustment1 See Figure 76 1 – Variable Energy Charges are from July 2007 – June 2008 as available at the Niagara Mohawk
website. 2 - Standby Contract Demand shall be the maximum anticipated demand of the customer. Filename: NIMO_SC7_SC3_Sec_UTICA_Jul07-Jun08.CSV, nimo_sc3_Sec_Utica_jun07-may08.dat

NYSERDA DG/CHP Integrated Database System Utility Rate Details
CDH Energy Corporation 293 September 25, 2008
Niagara Mohawk
Service Classification 7 – Standby – Based on SC3 Secondary (Capital Region) – February 2005 to January 2006 Standby service rates shall apply to: (a.) customers with on-site generation serving load that is not isolated from the grid in accordance with Rule 1.48; (b.) Wholesale Generators that rely on the electric utility to serve electric loads that would otherwise be served by the generator such as station power used for the heating, lighting, air-conditioning, and office equipment needs of the buildings housing the generator and associated support facilities located on a generating facility's site, and/or to facilitate the re-starting of the generator following an outage. Standby rates will also apply to Wholesale Generators that take station service through the same bus bar as they supply the wholesale grid. This rate is for facilities located in the Capital Region. Service Charge $ 533.72 for Distribution Delivery and Competitive Transition Charges Contract Demand Charge2 $ 8.18 / kW for Distribution Delivery and Competitive Transition Charges Reactive Demand Charge $ 0.85 / RkVA in excess of 1/3 peak demand in kW Demand Charges $ 0.4502 per daily peak kW for Distribution Delivery and Competitive Transition
Charges Energy Charges $ per total kWh System Benefits and Renewable Portfolio Charges $ 0.001729 / kWh Transmission Revenue Adjustment $ per total kWh Jan Feb Mar Apr May Jun Jul Aug Sep Oct Nov Dec $0.00222 $0.00312 $0.00140 $0.00114 $0.00182 $0.00234 $0.00240 $0.00193 $0.00003 $0.00135 $0.00223 $0.00299
Electric Supply Cost, Delivery Charge Adjustment1 See Figure 77 1 – Variable Energy Charges are from February 2005 – January 2006 as available at the Niagara Mohawk
website. 2 - Standby Contract Demand shall be the maximum anticipated demand of the customer. Filename: NIMO_SC7_SC3_Sec_CAPITAL_feb05-jan06.CSV, nimo_sc3_Sec_Capital_feb05-jan06.dat

NYSERDA DG/CHP Integrated Database System Utility Rate Details
CDH Energy Corporation 294 September 25, 2008
Niagara Mohawk
Service Classification 7 – Standby – Based on SC3 Secondary (Capital Region) – October 2005 to September 2006 Standby service rates shall apply to: (a.) customers with on-site generation serving load that is not isolated from the grid in accordance with Rule 1.48; (b.) Wholesale Generators that rely on the electric utility to serve electric loads that would otherwise be served by the generator such as station power used for the heating, lighting, air-conditioning, and office equipment needs of the buildings housing the generator and associated support facilities located on a generating facility's site, and/or to facilitate the re-starting of the generator following an outage. Standby rates will also apply to Wholesale Generators that take station service through the same bus bar as they supply the wholesale grid. This rate is for facilities located in the Capital Region. Service Charge $ 492.05 for Distribution Delivery and Competitive Transition Charges Contract Demand Charge2 $ 9.12 / kW for Distribution Delivery and Competitive Transition Charges Reactive Demand Charge $ 0.85 / RkVA in excess of 1/3 peak demand in kW Demand Charges $ 0.4891 per daily peak kW for Distribution Delivery and Competitive Transition
Charges Energy Charges $ per total kWh System Benefits and Renewable Portfolio Charges $ 0.002110 / kWh Transmission Revenue Adjustment $ per total kWh Jan Feb Mar Apr May Jun Jul Aug Sep Oct Nov Dec
$0.00312 $0.00303 $0.00269 ($0.00126) $0.00233 $0.00205 $0.00130 $0.00206 $0.00175 $0.00223 $0.00299 $0.00222
Electric Supply Cost, Delivery Charge Adjustment1 See Figure 78 1 – Variable Energy Charges are from October 2005 – September 2006 as available at the Niagara
Mohawk website. 2 - Standby Contract Demand shall be the maximum anticipated demand of the customer. Filename: NIMO_SC7_SC3_Sec_CAPITAL_oct05-sep06.CSV, nimo_sc3_Sec_Capital_oct05-sep06.dat

NYSERDA DG/CHP Integrated Database System Utility Rate Details
CDH Energy Corporation 295 September 25, 2008
Niagara Mohawk
Service Classification 7 – Standby – Based on SC3 Secondary (Capital Region) – July 2007 to June 2008 Standby service rates shall apply to: (a.) customers with on-site generation serving load that is not isolated from the grid in accordance with Rule 1.48; (b.) Wholesale Generators that rely on the electric utility to serve electric loads that would otherwise be served by the generator such as station power used for the heating, lighting, air-conditioning, and office equipment needs of the buildings housing the generator and associated support facilities located on a generating facility's site, and/or to facilitate the re-starting of the generator following an outage. Standby rates will also apply to Wholesale Generators that take station service through the same bus bar as they supply the wholesale grid. This rate is for facilities located in the Capital Region. Service Charge $ 505.30 for Distribution Delivery and Competitive Transition Charges Contract Demand Charge2 $ 9.57 / kW for Distribution Delivery and Competitive Transition Charges Reactive Demand Charge $ 0.85 / RkVA in excess of 1/3 peak demand in kW Demand Charges $ 0.5116 per daily peak kW for Distribution Delivery and Competitive Transition
Charges Energy Charges $ per total kWh System Benefits and Renewable Portfolio Charges $ 0.002023/ kWh Transmission Revenue Adjustment $ per total kWh Jan Feb Mar Apr May Jun Jul Aug Sep Oct Nov Dec ($0.00074) ($0.00098) ($0.00068) $0.00166 $0.00097 $0.00196 ($0.00023) $0.00152 $0.00078 $0.00006 ($0.00002) $0.00078
Electric Supply Cost, Delivery Charge Adjustment1 See Figure 79 1 – Variable Energy Charges are from July 2007- June 2008 as available at the Niagara Mohawk website. 2 - Standby Contract Demand shall be the maximum anticipated demand of the customer. Filename: NIMO_SC7_SC3_Sec_CAPITAL_Jul07-Jun08.CSV, nimo_sc3_Sec_Capital_jun07-may08.dat

NYSERDA DG/CHP Integrated Database System Utility Rate Details
CDH Energy Corporation 296 September 25, 2008
Niagara Mohawk
Service Classification 7 – Standby – Based on SC3a Secondary (Frontier Region) – February 2005 to January 2006 Standby service rates shall apply to: (a.) customers with on-site generation serving load that is not isolated from the grid in accordance with Rule 1.48; (b.) Wholesale Generators that rely on the electric utility to serve electric loads that would otherwise be served by the generator such as station power used for the heating, lighting, air-conditioning, and office equipment needs of the buildings housing the generator and associated support facilities located on a generating facility's site, and/or to facilitate the re-starting of the generator following an outage. Standby rates will also apply to Wholesale Generators that take station service through the same bus bar as they supply the wholesale grid. This rate is for facilities located in the Frontier Region. Service Charge $ 1,503.22 for Distribution Delivery and Competitive Transition Charges Contract Demand Charge2 $ 5.03 / kW for Distribution Delivery and Competitive Transition Charges Reactive Demand Charge $ 1.02 / RkVA in excess of 1/3 peak demand in kW Demand Charges $ 0.2736 per daily peak kW for Distribution Delivery and Competitive Transition
Charges Energy Charges $ per total kWh System Benefits and Renewable Portfolio Charges $ 0.001729 / kWh Transmission Revenue Adjustment $ per total kWh Jan Feb Mar Apr May Jun Jul Aug Sep Oct Nov Dec $0.00220 $0.00307 $0.00142 $0.00124 $0.00174 $0.00243 $0.00223 $0.00185 $0.00003 $0.00130 $0.00249 $0.00317
Hourly Electric Charges1 See Figure 98 1 – Variable Energy Charges are the hourly charges from February 2005 – January 2006 as available at
the Niagara Mohawk website. 2 - Standby Contract Demand shall be the maximum anticipated demand of the customer. Filenames: NIMO_SC7_SC3a_Sec_ESC_FRONTIER_feb05-jan06.CSV, nimo_sc3a_Sec_Frontier_feb05-jan06.dat

NYSERDA DG/CHP Integrated Database System Utility Rate Details
CDH Energy Corporation 297 September 25, 2008
Niagara Mohawk
Service Classification 7 – Standby – Based on SC3a Secondary (Frontier Region) – October 2005 to September 2006 Standby service rates shall apply to: (a.) customers with on-site generation serving load that is not isolated from the grid in accordance with Rule 1.48; (b.) Wholesale Generators that rely on the electric utility to serve electric loads that would otherwise be served by the generator such as station power used for the heating, lighting, air-conditioning, and office equipment needs of the buildings housing the generator and associated support facilities located on a generating facility's site, and/or to facilitate the re-starting of the generator following an outage. Standby rates will also apply to Wholesale Generators that take station service through the same bus bar as they supply the wholesale grid. This rate is for facilities located in the Frontier Region. Service Charge $ 1,389.72 for Distribution Delivery and Competitive Transition Charges Contract Demand Charge2 $ 5.87 / kW for Distribution Delivery and Competitive Transition Charges Reactive Demand Charge $ 1.02 / RkVA in excess of 1/3 peak demand in kW Demand Charges $ 0.3103 per daily peak kW for Distribution Delivery and Competitive Transition
Charges Energy Charges $ per total kWh System Benefits and Renewable Portfolio Charges $ 0.002110 / kWh Transmission Revenue Adjustment $ per total kWh Jan Feb Mar Apr May Jun Jul Aug Sep Oct Nov Dec $0.00307 $0.00296 $0.00253 ($0.00113) $0.00204 $0.00174 $0.00115 $0.00191 $0.00163 $0.00249 $0.00317 $0.00220
Hourly Electric Charges1 See Figure 99 1 – Variable Energy Charges are the hourly charges from October 2005 – September 2006 as available at
the Niagara Mohawk website. 2 - Standby Contract Demand shall be the maximum anticipated demand of the customer. Filenames: NIMO_SC7_SC3a_Sec_ESC_FRONTIER_oct05-sep06.CSV, nimo_sc3a_Sec_Frontier_oct05-sep06.dat

NYSERDA DG/CHP Integrated Database System Utility Rate Details
CDH Energy Corporation 298 September 25, 2008
Niagara Mohawk
Service Classification 7 – Standby – Based on SC3a Secondary (Frontier Region) – July 2007 to June 2008 Standby service rates shall apply to: (a.) customers with on-site generation serving load that is not isolated from the grid in accordance with Rule 1.48; (b.) Wholesale Generators that rely on the electric utility to serve electric loads that would otherwise be served by the generator such as station power used for the heating, lighting, air-conditioning, and office equipment needs of the buildings housing the generator and associated support facilities located on a generating facility's site, and/or to facilitate the re-starting of the generator following an outage. Standby rates will also apply to Wholesale Generators that take station service through the same bus bar as they supply the wholesale grid. This rate is for facilities located in the Frontier Region. Service Charge $ 1,425.73 for Distribution Delivery and Competitive Transition Charges Contract Demand Charge2 $ 5.59 / kW for Distribution Delivery and Competitive Transition Charges Reactive Demand Charge $ 1.02 / RkVA in excess of 1/3 peak demand in kW Demand Charges $ 0.2982per daily peak kW for Distribution Delivery and Competitive Transition
Charges Energy Charges $ per total kWh System Benefits and Renewable Portfolio Charges $ 0.002023 / kWh Transmission Revenue Adjustment $ per total kWh Jan Feb Mar Apr May Jun Jul Aug Sep Oct Nov Dec ($0.00075) ($0.00096) ($0.00065) $0.00162 $0.00083 $0.00194 ($0.0002) $0.00135 $0.00074 $0.00006 ($0.00002) $0.00077
Hourly Electric Charges1 See Figure 100 1 – Variable Energy Charges are the hourly charges from July 2007 – June 2008as available at the
Niagara Mohawk website. 2 - Standby Contract Demand shall be the maximum anticipated demand of the customer. Filenames: NIMO_SC7_SC3a_Sec_ESC_FRONTIER_Jul07-Jun08.CSV, nimo_sc3a_Sec_Frontier_jun07-may08.dat

NYSERDA DG/CHP Integrated Database System Utility Rate Details
CDH Energy Corporation 299 September 25, 2008
Niagara Mohawk
Service Classification 7 – Standby – Based on SC3a Secondary (Genesee Region) – February 2005 to January 2006 Standby service rates shall apply to: (a.) customers with on-site generation serving load that is not isolated from the grid in accordance with Rule 1.48; (b.) Wholesale Generators that rely on the electric utility to serve electric loads that would otherwise be served by the generator such as station power used for the heating, lighting, air-conditioning, and office equipment needs of the buildings housing the generator and associated support facilities located on a generating facility's site, and/or to facilitate the re-starting of the generator following an outage. Standby rates will also apply to Wholesale Generators that take station service through the same bus bar as they supply the wholesale grid. This rate is for facilities located in the Genesee Region. Service Charge $ 1,503.22 for Distribution Delivery and Competitive Transition Charges Contract Demand Charge2 $ 5.03 / kW for Distribution Delivery and Competitive Transition Charges Reactive Demand Charge $ 1.02 / RkVA in excess of 1/3 peak demand in kW Demand Charges $ 0.2736 per daily peak kW for Distribution Delivery and Competitive Transition
Charges Energy Charges $ per total kWh System Benefits and Renewable Portfolio Charges $ 0.001729 / kWh Transmission Revenue Adjustment $ per total kWh Jan Feb Mar Apr May Jun Jul Aug Sep Oct Nov Dec $0.00220 $0.00307 $0.00142 $0.00124 $0.00174 $0.00243 $0.00223 $0.00185 $0.00003 $0.00130 $0.00249 $0.00317
Hourly Electric Charges1 See Figure 101 1 – Variable Energy Charges are the hourly charges from February 2005 – January 2006 as available at
the Niagara Mohawk website. 2 - Standby Contract Demand shall be the maximum anticipated demand of the customer. Filenames: NIMO_SC7_SC3a_Sec_ESC_GENESEE_feb05-jan06.CSV, nimo_sc3a_Sec_Genesee_feb05-jan06.dat

NYSERDA DG/CHP Integrated Database System Utility Rate Details
CDH Energy Corporation 300 September 25, 2008
Niagara Mohawk
Service Classification 7 – Standby – Based on SC3a Secondary (Genesee Region) – October 2005 to September 2006 Standby service rates shall apply to: (a.) customers with on-site generation serving load that is not isolated from the grid in accordance with Rule 1.48; (b.) Wholesale Generators that rely on the electric utility to serve electric loads that would otherwise be served by the generator such as station power used for the heating, lighting, air-conditioning, and office equipment needs of the buildings housing the generator and associated support facilities located on a generating facility's site, and/or to facilitate the re-starting of the generator following an outage. Standby rates will also apply to Wholesale Generators that take station service through the same bus bar as they supply the wholesale grid. This rate is for facilities located in the Genesee Region. Service Charge $ 1,389.72 for Distribution Delivery and Competitive Transition Charges Contract Demand Charge2 $ 5.87 / kW for Distribution Delivery and Competitive Transition Charges Reactive Demand Charge $ 1.02 / RkVA in excess of 1/3 peak demand in kW Demand Charges $ 0.3103 per daily peak kW for Distribution Delivery and Competitive Transition
Charges Energy Charges $ per total kWh System Benefits and Renewable Portfolio Charges $ 0.002110 / kWh Transmission Revenue Adjustment $ per total kWh Jan Feb Mar Apr May Jun Jul Aug Sep Oct Nov Dec $0.00307 $0.00296 $0.00253 ($0.00113) $0.00204 $0.00174 $0.00115 $0.00191 $0.00163 $0.00249 $0.00317 $0.00220
Hourly Electric Charges1 See Figure 102 1 – Variable Energy Charges are the hourly charges from October 2005 – September 2006 as available at
the Niagara Mohawk website. 2 - Standby Contract Demand shall be the maximum anticipated demand of the customer. Filenames: NIMO_SC7_SC3a_Sec_ESC_GENESEE_oct05-sep06.CSV, nimo_sc3a_Sec_Genesee_oct05-sep06.dat

NYSERDA DG/CHP Integrated Database System Utility Rate Details
CDH Energy Corporation 301 September 25, 2008
Niagara Mohawk
Service Classification 7 – Standby – Based on SC3a Secondary (Genesee Region) – July 2007 to June 2008 Standby service rates shall apply to: (a.) customers with on-site generation serving load that is not isolated from the grid in accordance with Rule 1.48; (b.) Wholesale Generators that rely on the electric utility to serve electric loads that would otherwise be served by the generator such as station power used for the heating, lighting, air-conditioning, and office equipment needs of the buildings housing the generator and associated support facilities located on a generating facility's site, and/or to facilitate the re-starting of the generator following an outage. Standby rates will also apply to Wholesale Generators that take station service through the same bus bar as they supply the wholesale grid. This rate is for facilities located in the Genesee Region. Service Charge $ 1,425.73 for Distribution Delivery and Competitive Transition Charges Contract Demand Charge2 $ 5.59 / kW for Distribution Delivery and Competitive Transition Charges Reactive Demand Charge $ 1.02 / RkVA in excess of 1/3 peak demand in kW Demand Charges $ 0.2982 per daily peak kW for Distribution Delivery and Competitive Transition
Charges Energy Charges $ per total kWh System Benefits and Renewable Portfolio Charges $ 0.002023/ kWh Transmission Revenue Adjustment $ per total kWh Jan Feb Mar Apr May Jun Jul Aug Sep Oct Nov Dec ($0.00075) ($0.00096) ($0.00065) $0.00162 $0.00083 $0.00194 ($0.0002) $0.00135 $0.00074 $0.00006 ($0.00002) $0.00077
Hourly Electric Charges1 See Figure 103 1 – Variable Energy Charges are the hourly charges from July 2007 – June 2008 as available at the
Niagara Mohawk website. 2 - Standby Contract Demand shall be the maximum anticipated demand of the customer. Filenames: NIMO_SC7_SC3a_Sec_ESC_GENESEE_Jul07-Jun08.CSV, nimo_sc3a_Sec_Genesee_jun07-may08.dat

NYSERDA DG/CHP Integrated Database System Utility Rate Details
CDH Energy Corporation 302 September 25, 2008
Niagara Mohawk
Service Classification 7 – Standby – Based on SC3a Secondary (Central Region) – February 2005 to January 2006 Standby service rates shall apply to: (a.) customers with on-site generation serving load that is not isolated from the grid in accordance with Rule 1.48; (b.) Wholesale Generators that rely on the electric utility to serve electric loads that would otherwise be served by the generator such as station power used for the heating, lighting, air-conditioning, and office equipment needs of the buildings housing the generator and associated support facilities located on a generating facility's site, and/or to facilitate the re-starting of the generator following an outage. Standby rates will also apply to Wholesale Generators that take station service through the same bus bar as they supply the wholesale grid. This rate is for facilities located in the Central Region. Service Charge $ 1,493.13 for Distribution Delivery and Competitive Transition Charges Contract Demand Charge2 $ 5.00 / kW for Distribution Delivery and Competitive Transition Charges Reactive Demand Charge $ 1.02 / RkVA in excess of 1/3 peak demand in kW Demand Charges $ 0.2718 per daily peak kW for Distribution Delivery and Competitive Transition
Charges Energy Charges $ per total kWh System Benefits and Renewable Portfolio Charges $ 0.001729 / kWh Transmission Revenue Adjustment $ per total kWh Jan Feb Mar Apr May Jun Jul Aug Sep Oct Nov Dec $0.00220 $0.00307 $0.00142 $0.00124 $0.00174 $0.00243 $0.00223 $0.00185 $0.00003 $0.00130 $0.00249 $0.00317
Hourly Electric Charges1 See Figure 104 1 – Variable Energy Charges are the hourly charges from February 2005 – January 2006 as available at
the Niagara Mohawk website. 2 - Standby Contract Demand shall be the maximum anticipated demand of the customer. Filenames: NIMO_SC7_SC3a_Sec_ESC_CENTRAL_feb05-jan06.CSV, nimo_sc3a_Sec_Central_feb05-jan06.dat

NYSERDA DG/CHP Integrated Database System Utility Rate Details
CDH Energy Corporation 303 September 25, 2008
Niagara Mohawk
Service Classification 7 – Standby – Based on SC3a Secondary (Central Region) – October 2005 to September 2006 Standby service rates shall apply to: (a.) customers with on-site generation serving load that is not isolated from the grid in accordance with Rule 1.48; (b.) Wholesale Generators that rely on the electric utility to serve electric loads that would otherwise be served by the generator such as station power used for the heating, lighting, air-conditioning, and office equipment needs of the buildings housing the generator and associated support facilities located on a generating facility's site, and/or to facilitate the re-starting of the generator following an outage. Standby rates will also apply to Wholesale Generators that take station service through the same bus bar as they supply the wholesale grid. This rate is for facilities located in the Central Region. Service Charge $ 1,381.68 for Distribution Delivery and Competitive Transition Charges Contract Demand Charge2 $ 5.83 / kW for Distribution Delivery and Competitive Transition Charges Reactive Demand Charge $ 1.02 / RkVA in excess of 1/3 peak demand in kW Demand Charges $ 0.3085 per daily peak kW for Distribution Delivery and Competitive Transition
Charges Energy Charges $ per total kWh System Benefits and Renewable Portfolio Charges $ 0.002110 / kWh Transmission Revenue Adjustment $ per total kWh Jan Feb Mar Apr May Jun Jul Aug Sep Oct Nov Dec $0.00307 $0.00296 $0.00253 ($0.00113) $0.00204 $0.00174 $0.00115 $0.00191 $0.00163 $0.00249 $0.00317 $0.00220
Hourly Electric Charges1 See Figure 105 1 – Variable Energy Charges are the hourly charges from October 2005 – September 2006 as available at
the Niagara Mohawk website. 2 - Standby Contract Demand shall be the maximum anticipated demand of the customer. Filenames: NIMO_SC7_SC3a_Sec_ESC_CENTRAL_oct05-sep06.CSV, nimo_sc3a_Sec_Central_oct05-sep06.dat

NYSERDA DG/CHP Integrated Database System Utility Rate Details
CDH Energy Corporation 304 September 25, 2008
Niagara Mohawk
Service Classification 7 – Standby – Based on SC3a Secondary (Central Region) – July 2007 to June 2008Standby service rates shall apply to: (a.) customers with on-site generation serving load that is not isolated from the grid in accordance with Rule 1.48; (b.) Wholesale Generators that rely on the electric utility to serve electric loads that would otherwise be served by the generator such as station power used for the heating, lighting, air-conditioning, and office equipment needs of the buildings housing the generator and associated support facilities located on a generating facility's site, and/or to facilitate the re-starting of the generator following an outage. Standby rates will also apply to Wholesale Generators that take station service through the same bus bar as they supply the wholesale grid. This rate is for facilities located in the Central Region. Service Charge $ 1,425.73 for Distribution Delivery and Competitive Transition Charges Contract Demand Charge2 $ 5.59 / kW for Distribution Delivery and Competitive Transition Charges Reactive Demand Charge $ 1.02 / RkVA in excess of 1/3 peak demand in kW Demand Charges $ 0.2982per daily peak kW for Distribution Delivery and Competitive Transition
Charges Energy Charges $ per total kWh System Benefits and Renewable Portfolio Charges $ 0.002023 / kWh Transmission Revenue Adjustment $ per total kWh Jan Feb Mar Apr May Jun Jul Aug Sep Oct Nov Dec ($0.00075) ($0.00096) ($0.00065) $0.00162 $0.00083 $0.00194 ($0.0002) $0.00135 $0.00074 $0.00006 ($0.00002) $0.00077
Hourly Electric Charges1 See Figure 106 1 – Variable Energy Charges are the hourly charges from July 2007 – June 2008 as available at the
Niagara Mohawk website. 2 - Standby Contract Demand shall be the maximum anticipated demand of the customer. Filenames: NIMO_SC7_SC3a_Sec_ESC_CENTRAL_Jul07-Jun08.CSV, nimo_sc3a_Sec_Central_jun07-may08.dat

NYSERDA DG/CHP Integrated Database System Utility Rate Details
CDH Energy Corporation 305 September 25, 2008
Niagara Mohawk
Service Classification 7 – Standby – Based on SC3a Secondary (Adirondack Region) – February 2005 to January 2006 Standby service rates shall apply to: (a.) customers with on-site generation serving load that is not isolated from the grid in accordance with Rule 1.48; (b.) Wholesale Generators that rely on the electric utility to serve electric loads that would otherwise be served by the generator such as station power used for the heating, lighting, air-conditioning, and office equipment needs of the buildings housing the generator and associated support facilities located on a generating facility's site, and/or to facilitate the re-starting of the generator following an outage. Standby rates will also apply to Wholesale Generators that take station service through the same bus bar as they supply the wholesale grid. This rate is for facilities located in the Adirondack Region. Service Charge $ 1,493.13 for Distribution Delivery and Competitive Transition Charges Contract Demand Charge2 $ 5.00 / kW for Distribution Delivery and Competitive Transition Charges Reactive Demand Charge $ 1.02 / RkVA in excess of 1/3 peak demand in kW Demand Charges $ 0.2718 per daily peak kW for Distribution Delivery and Competitive Transition
Charges Energy Charges $ per total kWh System Benefits and Renewable Portfolio Charges $ 0.001729 / kWh Transmission Revenue Adjustment $ per total kWh Jan Feb Mar Apr May Jun Jul Aug Sep Oct Nov Dec $0.00220 $0.00307 $0.00142 $0.00124 $0.00174 $0.00243 $0.00223 $0.00185 $0.00003 $0.00130 $0.00249 $0.00317
Hourly Electric Charges1 See Figure 107 1 – Variable Energy Charges are the hourly charges from February 2005 – January 2006 as available at
the Niagara Mohawk website. 2 - Standby Contract Demand shall be the maximum anticipated demand of the customer. Filenames: NIMO_SC7_SC3a_Sec_ESC_ADIRONDACK_feb05-jan06.CSV, nimo_sc3a_Sec_Adirondack_feb05-jan06.dat

NYSERDA DG/CHP Integrated Database System Utility Rate Details
CDH Energy Corporation 306 September 25, 2008
Niagara Mohawk
Service Classification 7 – Standby – Based on SC3a Secondary (Adirondack Region) – October 2005 to September 2005 Standby service rates shall apply to: (a.) customers with on-site generation serving load that is not isolated from the grid in accordance with Rule 1.48; (b.) Wholesale Generators that rely on the electric utility to serve electric loads that would otherwise be served by the generator such as station power used for the heating, lighting, air-conditioning, and office equipment needs of the buildings housing the generator and associated support facilities located on a generating facility's site, and/or to facilitate the re-starting of the generator following an outage. Standby rates will also apply to Wholesale Generators that take station service through the same bus bar as they supply the wholesale grid. This rate is for facilities located in the Adirondack Region. Service Charge $ 1,381.68 for Distribution Delivery and Competitive Transition Charges Contract Demand Charge2 $ 5.83 / kW for Distribution Delivery and Competitive Transition Charges Reactive Demand Charge $ 1.02 / RkVA in excess of 1/3 peak demand in kW Demand Charges $ 0.3085 per daily peak kW for Distribution Delivery and Competitive Transition
Charges Energy Charges $ per total kWh System Benefits and Renewable Portfolio Charges $ 0.002110 / kWh Transmission Revenue Adjustment $ per total kWh Jan Feb Mar Apr May Jun Jul Aug Sep Oct Nov Dec $0.00307 $0.00296 $0.00253 ($0.00113) $0.00204 $0.00174 $0.00115 $0.00191 $0.00163 $0.00249 $0.00317 $0.00220
Hourly Electric Charges1 See Figure 108 1 – Variable Energy Charges are the hourly charges from October 2005 – September 2006 as available at
the Niagara Mohawk website. 2 - Standby Contract Demand shall be the maximum anticipated demand of the customer. Filenames: NIMO_SC7_SC3a_Sec_ESC_ADIRONDACK_oct05-sep06.CSV, nimo_sc3a_Sec_Adirondack_oct05-sep06.dat

NYSERDA DG/CHP Integrated Database System Utility Rate Details
CDH Energy Corporation 307 September 25, 2008
Niagara Mohawk
Service Classification 7 – Standby – Based on SC3a Secondary (Adirondack Region) – July 2007 to June 2008 Standby service rates shall apply to: (a.) customers with on-site generation serving load that is not isolated from the grid in accordance with Rule 1.48; (b.) Wholesale Generators that rely on the electric utility to serve electric loads that would otherwise be served by the generator such as station power used for the heating, lighting, air-conditioning, and office equipment needs of the buildings housing the generator and associated support facilities located on a generating facility's site, and/or to facilitate the re-starting of the generator following an outage. Standby rates will also apply to Wholesale Generators that take station service through the same bus bar as they supply the wholesale grid. This rate is for facilities located in the Adirondack Region. Service Charge $ 1,425.73 for Distribution Delivery and Competitive Transition Charges Contract Demand Charge2 $ 5.59 / kW for Distribution Delivery and Competitive Transition Charges Reactive Demand Charge $ 1.02 / RkVA in excess of 1/3 peak demand in kW Demand Charges $ 0.2982 per daily peak kW for Distribution Delivery and Competitive Transition
Charges Energy Charges $ per total kWh System Benefits and Renewable Portfolio Charges $ 0.002023 / kWh Transmission Revenue Adjustment $ per total kWh Jan Feb Mar Apr May Jun Jul Aug Sep Oct Nov Dec ($0.00075) ($0.00096) ($0.00065) $0.00162 $0.00083 $0.00194 ($0.0002) $0.00135 $0.00074 $0.00006 ($0.00002) $0.00077
Hourly Electric Charges1 See Figure 109 1 – Variable Energy Charges are the hourly charges from July 2007 – June 2008 as available at the
Niagara Mohawk website. 2 - Standby Contract Demand shall be the maximum anticipated demand of the customer. Filenames: NIMO_SC7_SC3a_Sec_ESC_ADIRONDACK_Jul07-Jun08.CSV, nimo_sc3a_Sec_Adirondack_jun07-may08.dat

NYSERDA DG/CHP Integrated Database System Utility Rate Details
CDH Energy Corporation 308 September 25, 2008
Niagara Mohawk
Service Classification 7 – Standby – Based on SC3a Secondary (Utica Region) – February 2005 to January 2006 Standby service rates shall apply to: (a.) customers with on-site generation serving load that is not isolated from the grid in accordance with Rule 1.48; (b.) Wholesale Generators that rely on the electric utility to serve electric loads that would otherwise be served by the generator such as station power used for the heating, lighting, air-conditioning, and office equipment needs of the buildings housing the generator and associated support facilities located on a generating facility's site, and/or to facilitate the re-starting of the generator following an outage. Standby rates will also apply to Wholesale Generators that take station service through the same bus bar as they supply the wholesale grid. This rate is for facilities located in the Utica Region. Service Charge $ 1,493.13 for Distribution Delivery and Competitive Transition Charges Contract Demand Charge2 $ 5.00 / kW for Distribution Delivery and Competitive Transition Charges Reactive Demand Charge $ 1.02 / RkVA in excess of 1/3 peak demand in kW Demand Charges $ 0.2718 per daily peak kW for Distribution Delivery and Competitive Transition
Charges Energy Charges $ per total kWh System Benefits and Renewable Portfolio Charges $ 0.001729 / kWh Transmission Revenue Adjustment $ per total kWh Jan Feb Mar Apr May Jun Jul Aug Sep Oct Nov Dec $0.00220 $0.00307 $0.00142 $0.00124 $0.00174 $0.00243 $0.00223 $0.00185 $0.00003 $0.00130 $0.00249 $0.00317
Hourly Electric Charges1 See Figure 110 1 – Variable Energy Charges are the hourly charges from February 2005 – January 2006 as available at
the Niagara Mohawk website. 2 - Standby Contract Demand shall be the maximum anticipated demand of the customer. Filenames: NIMO_SC7_SC3a_Sec_ESC_UTICA_feb05-jan06.CSV, nimo_sc3a_Sec_Utica_feb05-jan06.dat

NYSERDA DG/CHP Integrated Database System Utility Rate Details
CDH Energy Corporation 309 September 25, 2008
Niagara Mohawk
Service Classification 7 – Standby – Based on SC3a Secondary (Utica Region) – October 2005 to September 2006 Standby service rates shall apply to: (a.) customers with on-site generation serving load that is not isolated from the grid in accordance with Rule 1.48; (b.) Wholesale Generators that rely on the electric utility to serve electric loads that would otherwise be served by the generator such as station power used for the heating, lighting, air-conditioning, and office equipment needs of the buildings housing the generator and associated support facilities located on a generating facility's site, and/or to facilitate the re-starting of the generator following an outage. Standby rates will also apply to Wholesale Generators that take station service through the same bus bar as they supply the wholesale grid. This rate is for facilities located in the Utica Region. Service Charge $ 1,381.68 for Distribution Delivery and Competitive Transition Charges Contract Demand Charge2 $ 5.83 / kW for Distribution Delivery and Competitive Transition Charges Reactive Demand Charge $ 1.02 / RkVA in excess of 1/3 peak demand in kW Demand Charges $ 0.3085 per daily peak kW for Distribution Delivery and Competitive Transition
Charges Energy Charges $ per total kWh System Benefits and Renewable Portfolio Charges $ 0.002110 / kWh Transmission Revenue Adjustment $ per total kWh Jan Feb Mar Apr May Jun Jul Aug Sep Oct Nov Dec $0.00307 $0.00296 $0.00253 ($0.00113) $0.00204 $0.00174 $0.00115 $0.00191 $0.00163 $0.00249 $0.00317 $0.00220
Hourly Electric Charges1 See Figure 111 1 – Variable Energy Charges are the hourly charges from October 2005 – September 2006 as available at
the Niagara Mohawk website. 2 - Standby Contract Demand shall be the maximum anticipated demand of the customer. Filenames: NIMO_SC7_SC3a_Sec_ESC_UTICA_oct05-sep06.CSV, nimo_sc3a_Sec_Utica_oct05-sep06.dat

NYSERDA DG/CHP Integrated Database System Utility Rate Details
CDH Energy Corporation 310 September 25, 2008
Niagara Mohawk
Service Classification 7 – Standby – Based on SC3a Secondary (Utica Region) – July 2007 to June 2008 Standby service rates shall apply to: (a.) customers with on-site generation serving load that is not isolated from the grid in accordance with Rule 1.48; (b.) Wholesale Generators that rely on the electric utility to serve electric loads that would otherwise be served by the generator such as station power used for the heating, lighting, air-conditioning, and office equipment needs of the buildings housing the generator and associated support facilities located on a generating facility's site, and/or to facilitate the re-starting of the generator following an outage. Standby rates will also apply to Wholesale Generators that take station service through the same bus bar as they supply the wholesale grid. This rate is for facilities located in the Utica Region. Service Charge $ 1,425.73 for Distribution Delivery and Competitive Transition Charges Contract Demand Charge2 $ 5.59 / kW for Distribution Delivery and Competitive Transition Charges Reactive Demand Charge $ 1.02 / RkVA in excess of 1/3 peak demand in kW Demand Charges $ 0.2982 per daily peak kW for Distribution Delivery and Competitive Transition
Charges Energy Charges $ per total kWh System Benefits and Renewable Portfolio Charges $ 0.002023 / kWh Transmission Revenue Adjustment $ per total kWh Jan Feb Mar Apr May Jun Jul Aug Sep Oct Nov Dec ($0.00075) ($0.00096) ($0.00065) $0.00162 $0.00083 $0.00194 ($0.0002) $0.00135 $0.00074 $0.00006 ($0.00002) $0.00077
Hourly Electric Charges1 See Figure 112 1 – Variable Energy Charges are the hourly charges from July 2007 – June 2008 as available at the
Niagara Mohawk website. 2 - Standby Contract Demand shall be the maximum anticipated demand of the customer. Filenames: NIMO_SC7_SC3a_Sec_ESC_UTICA_Jul07-Jun08.CSV, nimo_sc3a_Sec_Utica_jun07-may08.dat

NYSERDA DG/CHP Integrated Database System Utility Rate Details
CDH Energy Corporation 311 September 25, 2008
Niagara Mohawk
Service Classification 7 – Standby – Based on SC3a Secondary (Capital Region) – February 2005 to January 2006 Standby service rates shall apply to: (a.) customers with on-site generation serving load that is not isolated from the grid in accordance with Rule 1.48; (b.) Wholesale Generators that rely on the electric utility to serve electric loads that would otherwise be served by the generator such as station power used for the heating, lighting, air-conditioning, and office equipment needs of the buildings housing the generator and associated support facilities located on a generating facility's site, and/or to facilitate the re-starting of the generator following an outage. Standby rates will also apply to Wholesale Generators that take station service through the same bus bar as they supply the wholesale grid. This rate is for facilities located in the Capital Region. Service Charge $ 1,478.91 for Distribution Delivery and Competitive Transition Charges Contract Demand Charge2 $ 4.95 / kW for Distribution Delivery and Competitive Transition Charges Reactive Demand Charge $ 1.02 / RkVA in excess of 1/3 peak demand in kW Demand Charges $ 0.2692 per daily peak kW for Distribution Delivery and Competitive Transition
Charges Energy Charges $ per total kWh System Benefits and Renewable Portfolio Charges $ 0.001729 / kWh Transmission Revenue Adjustment $ per total kWh Jan Feb Mar Apr May Jun Jul Aug Sep Oct Nov Dec $0.00220 $0.00307 $0.00142 $0.00124 $0.00174 $0.00243 $0.00223 $0.00185 $0.00003 $0.00130 $0.00249 $0.00317
Hourly Electric Charges1 See Figure 113 1 – Variable Energy Charges are the hourly charges from February 2005 – January 2006 as available at
the Niagara Mohawk website. 2 - Standby Contract Demand shall be the maximum anticipated demand of the customer. Filenames: NIMO_SC7_SC3a_Sec_ESC_CAPITAL_feb05-jan06.CSV, nimo_sc3a_Sec_Capital_feb05-jan06.dat

NYSERDA DG/CHP Integrated Database System Utility Rate Details
CDH Energy Corporation 312 September 25, 2008
Niagara Mohawk
Service Classification 7 – Standby – Based on SC3a Secondary (Capital Region) – October 2005 to September 2006 Standby service rates shall apply to: (a.) customers with on-site generation serving load that is not isolated from the grid in accordance with Rule 1.48; (b.) Wholesale Generators that rely on the electric utility to serve electric loads that would otherwise be served by the generator such as station power used for the heating, lighting, air-conditioning, and office equipment needs of the buildings housing the generator and associated support facilities located on a generating facility's site, and/or to facilitate the re-starting of the generator following an outage. Standby rates will also apply to Wholesale Generators that take station service through the same bus bar as they supply the wholesale grid. This rate is for facilities located in the Capital Region. Service Charge $ 1,370.01 for Distribution Delivery and Competitive Transition Charges Contract Demand Charge2 $ 5.78 / kW for Distribution Delivery and Competitive Transition Charges Reactive Demand Charge $ 1.02 / RkVA in excess of 1/3 peak demand in kW Demand Charges $ 0.3059 per daily peak kW for Distribution Delivery and Competitive Transition
Charges Energy Charges $ per total kWh System Benefits and Renewable Portfolio Charges $ 0.002110 / kWh Transmission Revenue Adjustment $ per total kWh Jan Feb Mar Apr May Jun Jul Aug Sep Oct Nov Dec $0.00307 $0.00296 $0.00253 ($0.00113) $0.00204 $0.00174 $0.00115 $0.00191 $0.00163 $0.00249 $0.00317 $0.00220
Hourly Electric Charges1 See Figure 114 1 – Variable Energy Charges are the hourly charges from October 2005 – September 2006 as available at
the Niagara Mohawk website. 2 - Standby Contract Demand shall be the maximum anticipated demand of the customer. Filenames: NIMO_SC7_SC3a_Sec_ESC_CAPITAL_oct05-sep06.CSV, nimo_sc3a_Sec_Capital_oct05-sep06.dat

NYSERDA DG/CHP Integrated Database System Utility Rate Details
CDH Energy Corporation 313 September 25, 2008
Niagara Mohawk
Service Classification 7 – Standby – Based on SC3a Secondary (Capital Region) – July 2007 to June 2008Standby service rates shall apply to: (a.) customers with on-site generation serving load that is not isolated from the grid in accordance with Rule 1.48; (b.) Wholesale Generators that rely on the electric utility to serve electric loads that would otherwise be served by the generator such as station power used for the heating, lighting, air-conditioning, and office equipment needs of the buildings housing the generator and associated support facilities located on a generating facility's site, and/or to facilitate the re-starting of the generator following an outage. Standby rates will also apply to Wholesale Generators that take station service through the same bus bar as they supply the wholesale grid. This rate is for facilities located in the Capital Region. Service Charge $ 1,425.73 for Distribution Delivery and Competitive Transition Charges Contract Demand Charge2 $ 5.59 / kW for Distribution Delivery and Competitive Transition Charges Reactive Demand Charge $ 1.02 / RkVA in excess of 1/3 peak demand in kW Demand Charges $ 0.2982 per daily peak kW for Distribution Delivery and Competitive Transition
Charges Energy Charges $ per total kWh System Benefits and Renewable Portfolio Charges $ 0.002023 / kWh Transmission Revenue Adjustment $ per total kWh Jan Feb Mar Apr May Jun Jul Aug Sep Oct Nov Dec ($0.00075) ($0.00096) ($0.00065) $0.00162 $0.00083 $0.00194 ($0.0002) $0.00135 $0.00074 $0.00006 ($0.00002) $0.00077 Hourly Electric Charges1 See Figure 115
1 – Variable Energy Charges are the hourly charges from July 2007 – June 2008 as available at the Niagara Mohawk website.
2 - Standby Contract Demand shall be the maximum anticipated demand of the customer. Filenames: NIMO_SC7_SC3a_Sec_ESC_CAPITAL_Jul07-Jun08.CSV, nimo_sc3a_Sec_Capital_jun07-may08.dat

NYSERDA DG/CHP Integrated Database System Utility Rate Details
CDH Energy Corporation 314 September 25, 2008
Niagara Mohawk
Service Classification 7 – Standby – Based on SC3a Primary (Central Region) – December 2006 to November 2007 Standby service rates shall apply to: (a.) customers with on-site generation serving load that is not isolated from the grid in accordance with Rule 1.48; (b.) Wholesale Generators that rely on the electric utility to serve electric loads that would otherwise be served by the generator such as station power used for the heating, lighting, air-conditioning, and office equipment needs of the buildings housing the generator and associated support facilities located on a generating facility's site, and/or to facilitate the re-starting of the generator following an outage. Standby rates will also apply to Wholesale Generators that take station service through the same bus bar as they supply the wholesale grid. This rate is for facilities located in the Central Region. Service Charge $ 1,073.83 for Distribution Delivery and Competitive Transition Charges Contract Demand Charge2 $ 4.42 / kW for Distribution Delivery and Competitive Transition Charges Reactive Demand Charge $ 1.02 / RkVA in excess of 1/3 peak demand in kW Demand Charges $ 0.3732 per daily peak kW for Distribution Delivery and Competitive Transition
Charges Energy Charges $ per total kWh System Benefits and Renewable Portfolio Charges $ 0.002250 / kWh Transmission Revenue Adjustment $ per total kWh Jan Feb Mar Apr May Jun Jul Aug Sep Oct Nov Dec $0.00194 $0.00203 $0.00214 $0.00269 $0.00253 ($0.00020) $0.00140 $0.00074 $0.00006 ($0.00002) $0.00081 ($0.00050) Hourly Electric Charges1 See Figure 116
1 – Variable Energy Charges are the hourly charges from December 2006 – November 2007 as available at the Niagara Mohawk website.
2 - Standby Contract Demand shall be the maximum anticipated demand of the customer. Filenames: NIMO_SC7_SC3a_Pri_ESC_CENTRAL_dec06-nov07.CSV, nimo_sc3a_Pri_Central_dec06-nov07.dat

NYSERDA DG/CHP Integrated Database System Utility Rate Details
CDH Energy Corporation 315 September 25, 2008
Niagara Mohawk
Service Classification 3a – Large General Time-of-Use - Primary – Electric Supply Charge (Central Region) – May 2007 to April 2008 This service is for commercial or industrial customers whose monthly measured demand exceeds 100kW in each of the previous 12 consecutive months and the monthly demand has exceeded 2,000 kW in any two consecutive months of the previous twelve months. Primary customers are served at voltage levels between 2.2 and 15 kV. This rate is for facilities located in the Central Region. Service Charge $ 902.00 Periods On-Peak 8 AM – 10 PM, Monday – Friday Off-Peak All hours not included in On-Peak Reactive Demand Charge $ 1.02 / RkVA in excess of 1/3 peak demand in kW Demand Charges $ per peak kW Distribution Delivery and Competitive Transition Charges $ 9.96 / kW Energy Charges1 $ per total kWh System Benefits and Renewable Portfolio Charges: $ 0.002263 / kWh Competitive Transition Charge: On-Peak Off-Peak Up to 250 hours of peak demand $ 0.00512 / kWh $ 0.00387 / kWh
Transmission Revenue Adjustment $ per total kWh Jan Feb Mar Apr May Jun Jul Aug Sep Oct Nov Dec ($0.00101) ($0.00130) ($0.00089) $0.00217 $0.00111 $0.00253 ($0.00020) $0.00140 $0.00074 $0.00006 ($0.00002) $0.00081
Hourly Electric Charges1 See Figure 135 1 – Variable Energy Charges are the hourly charges from May 2007 – April 2008 as available at the
Niagara Mohawk website. Filenames: NG_NY_SC3a_Pri_ESC_CENTRAL_may07-apr08.csv, nimo_sc3a_pri_central_May07-
Apr08_Pri_Central.dat National Grid NY - SC3a Primary for Central Region (May 07 - Apr 08)
Jan Feb Mar Apr May Jun Jul Aug Sep Oct Nov Dec0.00
0.05
0.10
0.15
0.20
0.25
Ele
ctric
Sup
ply
plus
Del
iver
y C
harg
e A
djus
tmen
t ($/
kWh)
Figure 135 Daily Electric Charges for SC3a Primary from May 2007 through April 2008 for Central Region

NYSERDA DG/CHP Integrated Database System Utility Rate Details
CDH Energy Corporation 316 September 25, 2008
Niagara Mohawk
Service Classification 3a – Large General Time-of-Use – Subtransmission – Electric Supply Charge (Central Region) – May 2007 to April 2008 This service is for commercial or industrial customers whose monthly measured demand exceeds 100kW in each of the previous 12 consecutive months and the monthly demand has exceeded 2,000 kW in any two consecutive months of the previous twelve months. Primary customers are served at voltage levels between 22 and 50 kV. This rate is for facilities located in the Central Region. Service Charge $ 1,400.00 Periods On-Peak 8 AM – 10 PM, Monday – Friday Off-Peak All hours not included in On-Peak Reactive Demand Charge $ 1.02 / RkVA in excess of 1/3 peak demand in kW Demand Charges $ per peak kW Distribution Delivery and Competitive Transition Charges $ 7.31 / kW Energy Charges1 $ per total kWh System Benefits and Renewable Portfolio Charges: $ 0.002263 / kWh Competitive Transition Charge: On-Peak Off-Peak Up to 250 hours of peak demand $ 0.00562 / kWh $ 0.00429 / kWh
Transmission Revenue Adjustment $ per total kWh Jan Feb Mar Apr May Jun Jul Aug Sep Oct Nov Dec ($0.00065) ($0.00085) ($0.00057) $0.00140 $0.00072 $0.00157 ($0.00013) $0.00086 $0.00046 $0.00004 ($0.00001) $0.00048
Hourly Electric Charges1 See Figure 136 1 – Variable Energy Charges are the hourly charges from May 2007 – April 2008 as available at the
Niagara Mohawk website. Filenames: NG_NY_SC3a_Sub_ESC_CENTRAL_may07-apr08.csv, nimo_sc3a_sub_central_May07-
Apr08_Pri_Central.dat National Grid NY - SC3a Subtransmission for Central Region (May 07 - Apr 08)
Jan Feb Mar Apr May Jun Jul Aug Sep Oct Nov Dec0.00
0.05
0.10
0.15
0.20
0.25
Ele
ctric
Sup
ply
plus
Del
iver
y C
harg
e A
djus
tmen
t ($/
kWh)
Figure 136 Daily Electric Charges for SC3a Subtransmission from May 2007 through April 2008 for Central Region

NYSERDA DG/CHP Integrated Database System Utility Rate Details
CDH Energy Corporation 317 September 25, 2008
Niagara Mohawk
Service Classification 7 – Standby – Based on SC3a Primary (Central Region) – May 2007 to April 2008 Standby service rates shall apply to: (a.) customers with on-site generation serving load that is not isolated from the grid in accordance with Rule 1.48; (b.) Wholesale Generators that rely on the electric utility to serve electric loads that would otherwise be served by the generator such as station power used for the heating, lighting, air-conditioning, and office equipment needs of the buildings housing the generator and associated support facilities located on a generating facility's site, and/or to facilitate the re-starting of the generator following an outage. Standby rates will also apply to Wholesale Generators that take station service through the same bus bar as they supply the wholesale grid. This rate is for facilities located in the Central Region. Service Charge $ 1,053.66 for Distribution Delivery and Competitive Transition Charges Contract Demand Charge2 $ 4.01 / kW for Distribution Delivery and Competitive Transition Charges Reactive Demand Charge $ 1.02 / RkVA in excess of 1/3 peak demand in kW Demand Charges $ 0.3431 per daily peak kW for Distribution Delivery and Competitive Transition
Charges Energy Charges $ per total kWh System Benefits and Renewable Portfolio Charges $ 0.002263 / kWh Transmission Revenue Adjustment $ per total kWh Jan Feb Mar Apr May Jun Jul Aug Sep Oct Nov Dec ($0.00101) ($0.00130) ($0.00089) $0.00217 $0.00111 $0.00253 ($0.00020) $0.00140 $0.00074 $0.00006 ($0.00002) $0.00081 Hourly Electric Charges1 See Error! Reference source not found.
1 – Variable Energy Charges are the hourly charges from May 2007 – April 2008 as available at the Niagara Mohawk website.
2 - Standby Contract Demand shall be the maximum anticipated demand of the customer. Filenames: NG_NY_SC7_SC3a_Pri_ESC_CENTRAL_may07-apr08.csv, nimo_sc3a_pri_central_May07-Apr08_Pri_Central.dat

NYSERDA DG/CHP Integrated Database System Utility Rate Details
CDH Energy Corporation 318 September 25, 2008
Niagara Mohawk
Service Classification 7 – Standby – Based on SC3a Subtransmission (Central Region) – May 2007 to April 2008 Standby service rates shall apply to: (a.) customers with on-site generation serving load that is not isolated from the grid in accordance with Rule 1.48; (b.) Wholesale Generators that rely on the electric utility to serve electric loads that would otherwise be served by the generator such as station power used for the heating, lighting, air-conditioning, and office equipment needs of the buildings housing the generator and associated support facilities located on a generating facility's site, and/or to facilitate the re-starting of the generator following an outage. Standby rates will also apply to Wholesale Generators that take station service through the same bus bar as they supply the wholesale grid. This rate is for facilities located in the Central Region. Service Charge $ 2,844.88 for Distribution Delivery and Competitive Transition Charges Contract Demand Charge2 $ 1.60 / kW for Distribution Delivery and Competitive Transition Charges Reactive Demand Charge $ 1.02 / RkVA in excess of 1/3 peak demand in kW Demand Charges $ 0.3641 per daily peak kW for Distribution Delivery and Competitive Transition
Charges Energy Charges $ per total kWh System Benefits and Renewable Portfolio Charges $ 0.002263 / kWh Transmission Revenue Adjustment $ per total kWh Jan Feb Mar Apr May Jun Jul Aug Sep Oct Nov Dec ($0.00065) ($0.00085) ($0.00057) $0.00140 $0.00072 $0.00157 ($0.00013) $0.00086 $0.00046 $0.00004 ($0.00001) $0.00048 Hourly Electric Charges1 See Error! Reference source not found.
1 – Variable Energy Charges are the hourly charges from May 2007 – April 2008 as available at the Niagara Mohawk website.
2 - Standby Contract Demand shall be the maximum anticipated demand of the customer. Filenames: NG_NY_SC7_SC3a_Sub_ESC_CENTRAL_may07-apr08.csv, nimo_sc3a_sub_central_May07-Apr08_Sub_Central.dat

NYSERDA DG/CHP Integrated Database System Utility Rate Details
CDH Energy Corporation 319 September 25, 2008
Complete Orange & Rockland Utility Electric Tariff The Orange & Rockland rates are up-to-date as of June 2008.
Orange & Rockland Utility
Service Classification 2 – General – Secondary – March 2005 to February 2006 Sales and delivery of electric power supply provided by the Company or delivery of electric power supply provided by an Energy Service Company under the Company's Retail Access Program to general secondary or primary service customers. Secondary Service generally will be supplied single phase at 120/240 Volts, three wire, throughout the system. In limited areas three phase, four wire service will be recommended by the Company at 120/208, 120/240 or 277/480 Volts. Service Charge $ 9.42 Periods Summer June 1 – September 30 Other All hours not in the Summer Period Demand Charges $ per peak kW within the defined block Block Charges 0-5 kW Over 5 kW Summer Charges $ 0 $10.76 / kW Other Charges $ 0 $6.29 / kW Energy Charges System Benefits Charge, Energy Cost Adjustment and Renewable Portfolio Surcharge
$ (0.003980) per total kWh for all hours
Market Supply Charge and Adjustment1 $ per total kWh within defined period Jan Feb Mar Apr May Jun Jul Aug Sep Oct Nov Dec $0.09514 $0.08338 $0.06306 $0.06321 $0.07551 $0.06691 $0.07535 $0.11209 $0.10228 $0.12582 $0.12402 $0.09003Block Charges: Usage Charges 0-1,250 kWh 1,250 to the Greater of 30,000 kWh
and 300 hrs of peak kW Above the Greater of 30,000 kWh
and 300 hrs of peak kW Summer Charges $0.06398 / kWh $0.02127 / kWh $0.00328 / kWh Other Charges $0.04730 / kWh $0.02127 / kWh $0.00328 / kWh
1 – The Market Supply Charges are the historical charges from March 2005 – February 2006 as available at the Orange & Rockland Tariff webpage.
Filename: ORU_SC2_Sec_Mar05-Feb06.csv

NYSERDA DG/CHP Integrated Database System Utility Rate Details
CDH Energy Corporation 320 September 25, 2008
Orange & Rockland Utility
Service Classification 2 – General – Secondary – November 2005 to October 2006 Sales and delivery of electric power supply provided by the Company or delivery of electric power supply provided by an Energy Service Company under the Company's Retail Access Program to general secondary or primary service customers. Secondary Service generally will be supplied single phase at 120/240 Volts, three wire, throughout the system. In limited areas three phase, four wire service will be recommended by the Company at 120/208, 120/240 or 277/480 Volts. Service Charge $ 9.42 Periods Summer June 1 – September 30 Other All hours not in the Summer Period Demand Charges $ per peak kW within the defined block Block Charges 0-5 kW Over 5 kW Summer Charges $ 0 $10.76 / kW Other Charges $ 0 $6.29 / kW Energy Charges System Benefits Charge, Energy Cost Adjustment and Renewable Portfolio Surcharge
$ (0.002210) per total kWh for all hours
Market Supply Charge and Adjustment1 $ per total kWh within defined period Jan Feb Mar Apr May Jun Jul Aug Sep Oct Nov Dec $0.09514 $0.08338 $0.07357 $0.05608 $0.06691 $0.06436 $0.11148 $0.10869 $0.11051 $0.09933 $0.12402 $0.09003Block Charges: Usage Charges 0-1,250 kWh 1,250 to the Greater of 30,000 kWh
and 300 hrs of peak kW Above the Greater of 30,000 kWh
and 300 hrs of peak kW Summer Charges $0.06398 / kWh $0.02127 / kWh $0.00328 / kWh Other Charges $0.04730 / kWh $0.02127 / kWh $0.00328 / kWh
1 – The Market Supply Charges are the historical charges from March 2005 – February 2006 as available at the Orange & Rockland Tariff webpage.
Filename: ORU_SC2_Sec_Nov05-Oct06.csv

NYSERDA DG/CHP Integrated Database System Utility Rate Details
CDH Energy Corporation 321 September 25, 2008
Orange & Rockland Utility
Service Classification 2 – General – Secondary – July 2007 to June 2008 Sales and delivery of electric power supply provided by the Company or delivery of electric power supply provided by an Energy Service Company under the Company's Retail Access Program to general secondary or primary service customers. Secondary Service generally will be supplied single phase at 120/240 Volts, three wire, throughout the system. In limited areas three phase, four wire service will be recommended by the Company at 120/208, 120/240 or 277/480 Volts. Service Charge $ 9.42 Periods Summer June 1 – September 30 Other All hours not in the Summer Period Demand Charges $ per peak kW within the defined block Block Charges 0-5 kW Over 5 kW Summer Charges $ 0 $10.76 / kW Other Charges $ 0 $6.29 / kW Energy Charges System Benefits Charge, Energy Cost Adjustment and Renewable Portfolio Surcharge
$ 0.00265 per total kWh for all hours
Market Supply Charge and Adjustment1 $ per total kWh within defined period Jan Feb Mar Apr May Jun Jul Aug Sep Oct Nov Dec $0.10676 $0.11619 $0.107750 $0.10730 $0.11424 $0.12478 $0.106570 $0.10683 $0.08883 $0.22009 $0.81869 $0.10015Block Charges: Usage Charges 0-1,250 kWh 1,250 to the Greater of 30,000 kWh
and 300 hrs of peak kW Above the Greater of 30,000 kWh
and 300 hrs of peak kW Summer Charges $0.06398 / kWh $0.02127 / kWh $0.00328 / kWh Other Charges $0.04730 / kWh $0.02127 / kWh $0.00328 / kWh
1 – The Market Supply Charges are the historical charges from July 2007 to June 2008 as available at the Orange & Rockland Tariff webpage.
Filename: ORU_SC2_Sec_Jul07-Jun08.csv

NYSERDA DG/CHP Integrated Database System Utility Rate Details
CDH Energy Corporation 322 September 25, 2008
Orange & Rockland Utility
Service Classification 2 – General – Primary – March 2005 to February 2006 Sales and delivery of electric power supply provided by the Company or delivery of electric power supply provided by an Energy Service Company under the Company's Retail Access Program to general secondary or primary service customers. Primary Service at approximately 7620/13200 Volts, 19900/34500 Volts grounded Wye and, in limited areas, 2400/4160 Volts grounded Wye, 2400 Volts or 4800 Volts Delta. Service Charge $ 37.49 Periods Summer June 1 – September 30 Other All hours not in the Summer Period Demand Charges $ per peak kW within the defined block Block Charges 0-5 kW Over 5 kW Summer Charges $ 0 $10.76 / kW Other Charges $ 0 $6.29 / kW Energy Charges System Benefits Charge, Energy Cost Adjustment and Renewable Portfolio Surcharge
$ (0.003980) per total kWh for all hours
Market Supply Charge and Adjustment1 $ per total kWh within defined period Jan Feb Mar Apr May Jun Jul Aug Sep Oct Nov Dec $0.10220 $0.08957 $0.06774 $0.06790 $0.08111 $0.07188 $0.08095 $0.12042 $0.10988 $0.13512 $0.13322 $0.09672Block Charges: Usage Charges 0-1,250 kWh 1,250 to the Greater of 30,000 kWh
and 300 hrs of peak kW Above the Greater of 30,000 kWh
and 300 hrs of peak kW Summer Charges $0.06398 / kWh $0.02127 / kWh $0.00328 / kWh Other Charges $0.04730 / kWh $0.02127 / kWh $0.00328 / kWh
1 – The Market Supply Charges are the historical charges from March 2005 – February 2006 as available at the Orange & Rockland Tariff webpage.
Filename: ORU_SC2_Pri_Mar05-Feb06.csv

NYSERDA DG/CHP Integrated Database System Utility Rate Details
CDH Energy Corporation 323 September 25, 2008
Orange & Rockland Utility
Service Classification 2 – General – Primary – November 2005 to October 2006 Sales and delivery of electric power supply provided by the Company or delivery of electric power supply provided by an Energy Service Company under the Company's Retail Access Program to general secondary or primary service customers. Primary Service at approximately 7620/13200 Volts, 19900/34500 Volts grounded Wye and, in limited areas, 2400/4160 Volts grounded Wye, 2400 Volts or 4800 Volts Delta. Service Charge $ 9.42 Periods Summer June 1 – September 30 Other All hours not in the Summer Period Demand Charges $ per peak kW within the defined block Block Charges 0-5 kW Over 5 kW Summer Charges $ 0 $10.76 / kW Other Charges $ 0 $6.29 / kW Energy Charges System Benefits Charge, Energy Cost Adjustment and Renewable Portfolio Surcharge
$ (0.002210) per total kWh for all hours
Market Supply Charge and Adjustment1 $ per total kWh within defined period Jan Feb Mar Apr May Jun Jul Aug Sep Oct Nov Dec $0.10220 $0.08957 $0.07905 $0.06024 $0.07187 $0.06915 $0.11975 $0.11678 $0..11874 $0.10671 $0.13322 $0.09672Block Charges: Usage Charges 0-1,250 kWh 1,250 to the Greater of 30,000 kWh
and 300 hrs of peak kW Above the Greater of 30,000 kWh
and 300 hrs of peak kW Summer Charges $0.06398 / kWh $0.02127 / kWh $0.00328 / kWh Other Charges $0.04730 / kWh $0.02127 / kWh $0.00328 / kWh
1 – The Market Supply Charges are the historical charges from March 2005 – February 2006 as available at the Orange & Rockland Tariff webpage.
Filename: ORU_SC2_Pri_Nov05-Oct06.csv

NYSERDA DG/CHP Integrated Database System Utility Rate Details
CDH Energy Corporation 324 September 25, 2008
Orange & Rockland Utility
Service Classification 2 – General – Primary – July2007 to June 2008 Sales and delivery of electric power supply provided by the Company or delivery of electric power supply provided by an Energy Service Company under the Company's Retail Access Program to general secondary or primary service customers. Primary Service at approximately 7620/13200 Volts, 19900/34500 Volts grounded Wye and, in limited areas, 2400/4160 Volts grounded Wye, 2400 Volts or 4800 Volts Delta. Service Charge $ 9.42 Periods Summer June 1 – September 30 Other All hours not in the Summer Period Demand Charges $ per peak kW within the defined block Block Charges 0-5 kW Over 5 kW Summer Charges $ 0 $10.76 / kW Other Charges $ 0 $6.29 / kW Energy Charges System Benefits Charge, Energy Cost Adjustment and Renewable Portfolio Surcharge
$ 0.00265 per total kWh for all hours
Market Supply Charge and Adjustment1 $ per total kWh within defined period Jan Feb Mar Apr May Jun Jul Aug Sep Oct Nov Dec $0.10426 $0.1136 $0.10576 $0.10511 $0.11214 $0.12202 $0.10359 $0.10355 $0.08537 $0.09048 $0.08691 $0.09828Block Charges: Usage Charges 0-1,250 kWh 1,250 to the Greater of 30,000 kWh
and 300 hrs of peak kW Above the Greater of 30,000 kWh
and 300 hrs of peak kW Summer Charges $0.06398 / kWh $0.02127 / kWh $0.00328 / kWh Other Charges $0.04730 / kWh $0.02127 / kWh $0.00328 / kWh
1 – The Market Supply Charges are the historical charges from July 2007 – June 2008 as available at the Orange & Rockland Tariff webpage.
Filename: ORU_SC2_Pri_Jul07-Jun08.csv

NYSERDA DG/CHP Integrated Database System Utility Rate Details
CDH Energy Corporation 325 September 25, 2008
Orange & Rockland Utility
Service Classification 9 – General Large Commercial – Primary – March 2005 to February 2006 Sales and delivery of electric power supply provided by the Company under the Company's Retail Access Program to general primary service commercial customers who maintain a minimum demand of 1,000 kW during any two of the previous twelve months and provide all equipment required to take service at a primary voltage as designated by the Company. Primary Service at approximately 7620/13200 Volts, 19900/34500 Volts grounded Wye and, in limited areas, 2400/4160 Volts grounded Wye, 2400 Volts or 4800 Volts Delta. Service Charge $ 328.56 Periods Period A June 1 – September 30, Monday – Friday, 8 AM – 11 PM Period B October 1 – May 31, Monday – Friday, 8 AM – 11 PM Period C All hours not in Period A or Period B Demand Charges $ per peak kW within the defined block Period A Charges $ 9.20 / kW Period B Charges $ 4.32 / kW Energy Charges System Benefits Charge, Energy Cost Adjustment and Renewable Portfolio Surcharge
$ (0.003980) per total kWh for all hours
Market Supply Charge and Adjustment1 $ per total kWh within defined period Jan Feb Mar Apr May Jun Jul Aug Sep Oct Nov Dec $0.08960 $0.06885 $0.05204 $0.05218 $0.05921 $0.05287 $0.06473 $0.09396 $0.08616 $0.11310 $0.11356 $0.08082Usage Charges $ per kWh within defined period Period A Charges $ 0.01031 / kWh Period B Charges $ 0.01031 / kWh Period C Charges $ 0.00384 / kWh
1 – The Market Supply Charges are the historical charges from March 2005 – February 2006 as available at the Orange & Rockland Tariff webpage.
Filename: ORU_SC9_Pri_Mar05-Feb06.csv

NYSERDA DG/CHP Integrated Database System Utility Rate Details
CDH Energy Corporation 326 September 25, 2008
Orange & Rockland Utility
Service Classification 9 – General Large Commercial – Primary – November 2005 to October 2006 Sales and delivery of electric power supply provided by the Company under the Company's Retail Access Program to general primary service commercial customers who maintain a minimum demand of 1,000 kW during any two of the previous twelve months and provide all equipment required to take service at a primary voltage as designated by the Company. Primary Service at approximately 7620/13200 Volts, 19900/34500 Volts grounded Wye and, in limited areas, 2400/4160 Volts grounded Wye, 2400 Volts or 4800 Volts Delta. Service Charge $ 328.56 Periods Period A June 1 – September 30, Monday – Friday, 8 AM – 11 PM Period B October 1 – May 31, Monday – Friday, 8 AM – 11 PM Period C All hours not in Period A or Period B Demand Charges $ per peak kW within the defined block Period A Charges $ 9.20 / kW Period B Charges $ 4.32 / kW Energy Charges System Benefits Charge, Energy Cost Adjustment and Renewable Portfolio Surcharge
$ (0.002210) per total kWh for all hours
Market Supply Charge and Adjustment1 $ per total kWh within defined period Jan Feb Mar Apr May Jun Jul Aug Sep Oct Nov Dec $0.08960 $0.06885 $0.05625 $0.04041 $0.04866 $0.04711 $0.09450 $0.09311 $0.08894 $0.06912 $0.11356 $0.08082Usage Charges $ per kWh within defined period Period A Charges $ 0.01031 / kWh Period B Charges $ 0.01031 / kWh Period C Charges $ 0.00384 / kWh
1 – The Market Supply Charges are the historical charges from March 2005 – February 2006 as available at the Orange & Rockland Tariff webpage.
Filename: ORU_SC9_Pri_Nov05-Oct06.csv

NYSERDA DG/CHP Integrated Database System Utility Rate Details
CDH Energy Corporation 327 September 25, 2008
Orange & Rockland Utility
Service Classification 9 – General Large Commercial – Primary –July 2007 to June 2008 Sales and delivery of electric power supply provided by the Company under the Company's Retail Access Program to general primary service commercial customers who maintain a minimum demand of 1,000 kW during any two of the previous twelve months and provide all equipment required to take service at a primary voltage as designated by the Company. Primary Service at approximately 7620/13200 Volts, 19900/34500 Volts grounded Wye and, in limited areas, 2400/4160 Volts grounded Wye, 2400 Volts or 4800 Volts Delta. Service Charge $ 328.56 Periods Period A June 1 – September 30, Monday – Friday, 8 AM – 11 PM Period B October 1 – May 31, Monday – Friday, 8 AM – 11 PM Period C All hours not in Period A or Period B Demand Charges $ per peak kW within the defined block Period A Charges $ 9.20 / kW Period B Charges $ 4.32 / kW Energy Charges System Benefits Charge, Energy Cost Adjustment and Renewable Portfolio Surcharge
$ 0.002650 per total kWh for all hours
Market Supply Charge and Adjustment1 $ per total kWh within defined period Jan Feb Mar Apr May Jun Jul Aug Sep Oct Nov Dec $0.09720 $0.11793 $0.11420 $0.10431 $0.11247 $0.13033 $0.10018 $0.10171 $0.08058 $0.086480 $0.07400 $0.09013Usage Charges $ per kWh within defined period Period A Charges $ 0.01031 / kWh Period B Charges $ 0.01031 / kWh Period C Charges $ 0.00384 / kWh
1 – The Market Supply Charges are the historical charges from July 2007 – June 2008 as available at the Orange & Rockland Tariff webpage.
Filename: ORU_SC9_Pri_Jul07-Jun08.csv

NYSERDA DG/CHP Integrated Database System Utility Rate Details
CDH Energy Corporation 328 September 25, 2008
Orange & Rockland Utility
Service Classification 20 – General Time-of-Use – March 2005 to February 2006 Sales and delivery of electric power supply provided by the under the Company's Retail Access Program for general secondary service, at customer's option, to any customer who maintains a minimum demand level of 5 kW for at least two consecutive months during the previous twelve months. Service Charge $ 21.55 Periods Period I June 1 – September 30, Monday – Friday, 1 PM – 7 PM Period II October 1 – May 31, Monday – Friday, 10 AM – 9 PM Period III All hours not in Period I or Period II Demand Charges $ per peak kW within the defined block Period I Charges $ 15.17 / kW Period II Charges $ 6.56 / kW Energy Charges System Benefits Charge, Energy Cost Adjustment and Renewable Portfolio Surcharge
$ (0.003980) per total kWh for all hours
Market Supply Charge and Adjustment1 $ per total kWh within defined period Jan Feb Mar Apr May Jun Jul Aug Sep Oct Nov Dec $0.08226 $0.07210 $0.05453 $0.05466 $0.06529 $0.05785 $0.06516 $0.09692 $0.08844 $0.10878 $0.10725 $0.07784Usage Charges $ per kWh within defined period Period I Charges $ 0.06040 / kWh Period II Charges $ 0.01442 / kWh Period III Charges $ 0.00191 / kWh
1 – The Market Supply Charges are the historical charges from March 2005 – February 2006 as available at the Orange & Rockland Tariff webpage.
Filename: ORU_SC20_Mar05-Feb06.csv

NYSERDA DG/CHP Integrated Database System Utility Rate Details
CDH Energy Corporation 329 September 25, 2008
Orange & Rockland Utility
Service Classification 20 – General Time-of-Use – November 2005 to October 2006 Sales and delivery of electric power supply provided by the under the Company's Retail Access Program for general secondary service, at customer's option, to any customer who maintains a minimum demand level of 5 kW for at least two consecutive months during the previous twelve months. Service Charge $ 21.55 Periods Period I June 1 – September 30, Monday – Friday, 1 PM – 7 PM Period II October 1 – May 31, Monday – Friday, 10 AM – 9 PM Period III All hours not in Period I or Period II Demand Charges $ per peak kW within the defined block Period I Charges $ 15.17 / kW Period II Charges $ 6.56 / kW Energy Charges System Benefits Charge, Energy Cost Adjustment and Renewable Portfolio Surcharge
$ (0.002210) per total kWh for all hours
Market Supply Charge and Adjustment1 $ per total kWh within defined period Jan Feb Mar Apr May Jun Jul Aug Sep Oct Nov Dec $0.08226 $0.07210 $0.06362 $0.04849 $0.05786 $0.05565 $0.09640 $0.09399 $0.09557 $0.08589 $0.10725 $0.07784Usage Charges $ per kWh within defined period Period I Charges $ 0.06004 / kWh Period II Charges $ 0.01442 / kWh Period III Charges $ 0.00191 / kWh
1 – The Market Supply Charges are the historical charges from March 2005 – February 2006 as available at the Orange & Rockland Tariff webpage.
Filename: ORU_SC20_Nov05-Oct06.csv

NYSERDA DG/CHP Integrated Database System Utility Rate Details
CDH Energy Corporation 330 September 25, 2008
Orange & Rockland Utility
Service Classification 20 – General Time-of-Use – July 2007 to June 2008 Sales and delivery of electric power supply provided by the under the Company's Retail Access Program for general secondary service, at customer's option, to any customer who maintains a minimum demand level of 5 kW for at least two consecutive months during the previous twelve months. Service Charge $ 21.55 Periods Period I June 1 – September 30, Monday – Friday, 1 PM – 7 PM Period II October 1 – May 31, Monday – Friday, 10 AM – 9 PM Period III All hours not in Period I or Period II Demand Charges $ per peak kW within the defined block Period I Charges $ 15.17 / kW Period II Charges $ 6.56 / kW Energy Charges System Benefits Charge, Energy Cost Adjustment and Renewable Portfolio Surcharge
$ 0.002650 per total kWh for all hours
Market Supply Charge and Adjustment1 $ per total kWh within defined period Jan Feb Mar Apr May Jun Jul Aug Sep Oct Nov Dec $0.10676 $0.11619 $0.10775 $0.10744 $0.11424 $0.124780 $0.10709 $0.10550 $0.08883 $0.09229 $0.08924 $0.10015Usage Charges $ per kWh within defined period Period I Charges $ 0.06004 / kWh Period II Charges $ 0.01442 / kWh Period III Charges $ 0.00191 / kWh
1 – The Market Supply Charges are the historical charges from July 2007 – June 2008 as available at the Orange & Rockland Tariff webpage.
Filename: ORU_SC20_Jul07-Jun08.csv

NYSERDA DG/CHP Integrated Database System Utility Rate Details
CDH Energy Corporation 331 September 25, 2008
Orange & Rockland Utility
Service Classification 22 – General Large Manufacturing – Primary – March 2005 to February 2006 Sales and delivery of electric power supply provided by the Company or delivery of electric power supply provided by an Energy Service Company under the Company's Retail Access Program for general secondary service, at customer's option, to any customer who maintains a minimum demand level of 5 kW for at least two consecutive months during the previous twelve months. Service Charge $ 328.56 Periods Period A June 1 – September 30, Monday – Friday, 8 AM – 11 PM Period B October 1 – May 31, Monday – Friday, 8 AM – 11 PM Period C All hours not in Period A or Period B Demand Charges $ per peak kW within the defined block Period A Charges $ 7.54 / kW Period B Charges $ 4.32 / kW Energy Charges System Benefits Charge, Energy Cost Adjustment and Renewable Portfolio Surcharge
$ (0.003980) per total kWh for all hours
Market Supply Charge and Adjustment1 $ per total kWh within defined period Jan Feb Mar Apr May Jun Jul Aug Sep Oct Nov Dec $0.08960 $0.06885 $0.05204 $0.05218 $0.05921 $0.05287 $0.06473 $0.09396 $0.08616 $0.11310 $0.11356 $0.08082Usage Charges $ per kWh within defined period Period A Charges $ 0.0721 / kWh Period B Charges $ 0.0721 / kWh Period C Charges $ 0.0123 / kWh
1 – The Market Supply Charges are the historical charges from March 2005 – February 2006 as available at the Orange & Rockland Tariff webpage.
Filename: ORU_SC22_Pri_Mar05-Feb06.csv

NYSERDA DG/CHP Integrated Database System Utility Rate Details
CDH Energy Corporation 332 September 25, 2008
Orange & Rockland Utility
Service Classification 22 – General Large Manufacturing – Primary – November 2005 to October 2006 Sales and delivery of electric power supply provided by the Company or delivery of electric power supply provided by an Energy Service Company under the Company's Retail Access Program for general secondary service, at customer's option, to any customer who maintains a minimum demand level of 5 kW for at least two consecutive months during the previous twelve months. Service Charge $ 328.56 Periods Period A June 1 – September 30, Monday – Friday, 8 AM – 11 PM Period B October 1 – May 31, Monday – Friday, 8 AM – 11 PM Period C All hours not in Period A or Period B Demand Charges $ per peak kW within the defined block Period A Charges $ 7.54 / kW Period B Charges $ 4.32 / kW Energy Charges System Benefits Charge, Energy Cost Adjustment and Renewable Portfolio Surcharge
$ (0.002210) per total kWh for all hours
Market Supply Charge and Adjustment1 $ per total kWh within defined period Jan Feb Mar Apr May Jun Jul Aug Sep Oct Nov Dec $0.08960 $0.06885 $0.05625 $0.04041 $0.04866 $0.04711 $0.09450 $0.09311 $0.08894 $0.06912 $0.11356 $0.08082Usage Charges $ per kWh within defined period Period A Charges $ 0.0721 / kWh Period B Charges $ 0.0721 / kWh Period C Charges $ 0.0123 / kWh
1 – The Market Supply Charges are the historical charges from March 2005 – February 2006 as available at the Orange & Rockland Tariff webpage.
Filename: ORU_SC22_Pri_Nov05-Oct06.csv

NYSERDA DG/CHP Integrated Database System Utility Rate Details
CDH Energy Corporation 333 September 25, 2008
Orange & Rockland Utility
Service Classification 22 – General Large Manufacturing – Primary – July 2007 to June 2008 Sales and delivery of electric power supply provided by the Company or delivery of electric power supply provided by an Energy Service Company under the Company's Retail Access Program for general secondary service, at customer's option, to any customer who maintains a minimum demand level of 5 kW for at least two consecutive months during the previous twelve months. Service Charge $ 328.56 Periods Period A June 1 – September 30, Monday – Friday, 8 AM – 11 PM Period B October 1 – May 31, Monday – Friday, 8 AM – 11 PM Period C All hours not in Period A or Period B Demand Charges $ per peak kW within the defined block Period A Charges $ 7.54 / kW Period B Charges $ 4.32 / kW Energy Charges System Benefits Charge, Energy Cost Adjustment and Renewable Portfolio Surcharge
$ 0.00265 per total kWh for all hours
Market Supply Charge and Adjustment1 $ per total kWh within defined period Jan Feb Mar Apr May Jun Jul Aug Sep Oct Nov Dec $0.09720 $0.11793 $0.11420 $0.10431 $0.11247 $0.13033 $0.10018 $0.10171 $0.08058 $0.086480 $0.07400 $0.09013Usage Charges $ per kWh within defined period Period A Charges $ 0.0721 / kWh Period B Charges $ 0.0721 / kWh Period C Charges $ 0.0123 / kWh
1 – The Market Supply Charges are the historical charges from July 2007 - June 2008 as available at the Orange & Rockland Tariff webpage.
Filename: ORU_SC22_Pri_Jul07-Jun08.csv

NYSERDA DG/CHP Integrated Database System Utility Rate Details
CDH Energy Corporation 334 September 25, 2008
Orange & Rockland Utility
Service Classification 25 – Standby – Based on SC2 Secondary – March 2005 to February 2006 Sales and delivery of electric power supply provided by the Company under the Company’s Retail Access Program, for standby purposes subject to the Special Provisions of this Service Classification. More specifically, this service is available: (1) to replace and/or to supplement the power and energy ordinarily generated by a customer by means of a Private generating facility on their premises; or (2) for station use by a customer that is a wholesale generator. “Station Use” includes power and energy used by the customer at its premises in connection with its generating facility (a) during periods when such needs are not served by the generator and (b) to restart the generator after an outage. This service also applies to wholesale generators that require service when their own generating equipment is not sufficient to meet the station loads, provided that the service is not served under a separately-metered account. Service Charge $ 37.49 Contract Demand2 $ 3.94 of contract kW Periods Summer June 1 – September 30 Other All hours not in the Summer Period Demand Charges $ per daily peak kW within the defined block Summer Charges $ 0.3913 per daily peak kW Other Charges $ 0.2801 per daily peak kW Energy Charges System Benefits Charge, Energy Cost Adjustment and Renewable Portfolio Surcharge
$ (0.003980) per total kWh for all hours
Market Supply Charge and Adjustment1 $ per total kWh within defined period Jan Feb Mar Apr May Jun Jul Aug Sep Oct Nov Dec $0.09514 $0.08338 $0.06306 $0.06321 $0.07551 $0.06691 $0.07535 $0.11209 $0.10228 $0.12582 $0.12402 $0.09003
1 – The Market Supply Charges are the historical charges from March 2005 – February 2006 as available at the Orange & Rockland Tariff webpage.
2 – Contract demand for the purposes of this Service Classification shall mean the customer’s maximum potential demand.
Filename: ORU_SC25_SC2_Sec_Mar05-Feb06.csv

NYSERDA DG/CHP Integrated Database System Utility Rate Details
CDH Energy Corporation 335 September 25, 2008
Orange & Rockland Utility
Service Classification 25 – Standby – Based on SC2 Secondary – November 2005 to October 2006 Sales and delivery of electric power supply provided by the Company under the Company’s Retail Access Program, for standby purposes subject to the Special Provisions of this Service Classification. More specifically, this service is available: (1) to replace and/or to supplement the power and energy ordinarily generated by a customer by means of a Private generating facility on their premises; or (2) for station use by a customer that is a wholesale generator. “Station Use” includes power and energy used by the customer at its premises in connection with its generating facility (a) during periods when such needs are not served by the generator and (b) to restart the generator after an outage. This service also applies to wholesale generators that require service when their own generating equipment is not sufficient to meet the station loads, provided that the service is not served under a separately-metered account. Service Charge $ 37.49 Contract Demand2 $ 3.94 of contract kW Periods Summer June 1 – September 30 Other All hours not in the Summer Period Demand Charges $ per daily peak kW within the defined block Summer Charges $ 0.3913 per daily peak kW Other Charges $ 0.2801 per daily peak kW Energy Charges System Benefits Charge, Energy Cost Adjustment and Renewable Portfolio Surcharge
$ (0.002210) per total kWh for all hours
Market Supply Charge and Adjustment1 $ per total kWh within defined period Jan Feb Mar Apr May Jun Jul Aug Sep Oct Nov Dec $0.09514 $0.08338 $0.07357 $0.05608 $0.06691 $0.06436 $0.11148 $0.10869 $0.11051 $0.09933 $0.12402 $0.09003
1 – The Market Supply Charges are the historical charges from March 2005 – February 2006 as available at the Orange & Rockland Tariff webpage.
2 – Contract demand for the purposes of this Service Classification shall mean the customer’s maximum potential demand.
Filename: ORU_SC25_SC2_Sec_Nov05-Oct06.csv

NYSERDA DG/CHP Integrated Database System Utility Rate Details
CDH Energy Corporation 336 September 25, 2008
Orange & Rockland Utility
Service Classification 25 – Standby – Based on SC2 Secondary – July 2007 to June 2008 Sales and delivery of electric power supply provided by the Company under the Company’s Retail Access Program, for standby purposes subject to the Special Provisions of this Service Classification. More specifically, this service is available: (1) to replace and/or to supplement the power and energy ordinarily generated by a customer by means of a Private generating facility on their premises; or (2) for station use by a customer that is a wholesale generator. “Station Use” includes power and energy used by the customer at its premises in connection with its generating facility (a) during periods when such needs are not served by the generator and (b) to restart the generator after an outage. This service also applies to wholesale generators that require service when their own generating equipment is not sufficient to meet the station loads, provided that the service is not served under a separately-metered account. Service Charge $ 37.49 Contract Demand2 $ 3.94 of contract kW Periods Summer June 1 – September 30 Other All hours not in the Summer Period Demand Charges $ per daily peak kW within the defined block Summer Charges $ 0.3913 per daily peak kW Other Charges $ 0.2801 per daily peak kW Energy Charges System Benefits Charge, Energy Cost Adjustment and Renewable Portfolio Surcharge
$ 0.002650 per total kWh for all hours
Market Supply Charge and Adjustment1 $ per total kWh within defined period Jan Feb Mar Apr May Jun Jul Aug Sep Oct Nov Dec $0.10676 $0.11619 $0.107750 $0.10730 $0.11424 $0.12478 $0.106570 $0.10683 $0.08883 $0.22009 $0.81869 $0.10015
1 – The Market Supply Charges are the historical charges from July 2007 – June 2008 as available at the Orange & Rockland Tariff webpage.
2 – Contract demand for the purposes of this Service Classification shall mean the customer’s maximum potential demand.
Filename: ORU_SC25_SC2_Sec_Jul07-Jun08.csv

NYSERDA DG/CHP Integrated Database System Utility Rate Details
CDH Energy Corporation 337 September 25, 2008
Orange & Rockland Utility
Service Classification 25 – Standby – Based on SC2 Primary – March 2005 to February 2006 Sales and delivery of electric power supply provided by the Company under the Company’s Retail Access Program, for standby purposes subject to the Special Provisions of this Service Classification. More specifically, this service is available: (1) to replace and/or to supplement the power and energy ordinarily generated by a customer by means of a private generating facility on their premises; or (2) for station use by a customer that is a wholesale generator. “Station Use” includes power and energy used by the customer at its premises in connection with its generating facility (a) during periods when such needs are not served by the generator and (b) to restart the generator after an outage. This service also applies to wholesale generators that require service when their own generating equipment is not sufficient to meet the station loads, provided that the service is not served under a separately-metered account. Service Charge $ 37.49 Contract Demand2 $ 4.42 of contract kW Periods Summer June 1 – September 30 Other All hours not in the Summer Period Demand Charges $ per daily peak kW within the defined block Summer Charges $ 0.4714 per daily peak kW Other Charges $ 0.3542 per daily peak kW Energy Charges System Benefits Charge, Energy Cost Adjustment and Renewable Portfolio Surcharge
$ (0.003980) per total kWh for all hours
Market Supply Charge and Adjustment1 $ per total kWh within defined period Jan Feb Mar Apr May Jun Jul Aug Sep Oct Nov Dec $0.10220 $0.08957 $0.06774 $0.06790 $0.08111 $0.07188 $0.08095 $0.12042 $0.10988 $0.13512 $0.13322 $0.09672
1 – The Market Supply Charges are the historical charges from March 2005 – February 2006 as available at the Orange & Rockland Tariff webpage.
2 – Contract demand for the purposes of this Service Classification shall mean the customer’s maximum potential demand.
Filename: ORU_SC25_SC2_Pri_Mar05-Feb06.csv

NYSERDA DG/CHP Integrated Database System Utility Rate Details
CDH Energy Corporation 338 September 25, 2008
Orange & Rockland Utility
Service Classification 25 – Standby – Based on SC2 Primary – November 2005 to October 2006 Sales and delivery of electric power supply provided by the Company under the Company’s Retail Access Program, for standby purposes subject to the Special Provisions of this Service Classification. More specifically, this service is available: (1) to replace and/or to supplement the power and energy ordinarily generated by a customer by means of a private generating facility on their premises; or (2) for station use by a customer that is a wholesale generator. “Station Use” includes power and energy used by the customer at its premises in connection with its generating facility (a) during periods when such needs are not served by the generator and (b) to restart the generator after an outage. This service also applies to wholesale generators that require service when their own generating equipment is not sufficient to meet the station loads, provided that the service is not served under a separately-metered account. Service Charge $ 37.49 Contract Demand2 $ 4.42 of contract kW Periods Summer June 1 – September 30 Other All hours not in the Summer Period Demand Charges $ per daily peak kW within the defined block Summer Charges $ 0.4714 per daily peak kW Other Charges $ 0.3542 per daily peak kW Energy Charges System Benefits Charge, Energy Cost Adjustment and Renewable Portfolio Surcharge
$ (0.002210) per total kWh for all hours
Market Supply Charge and Adjustment1 $ per total kWh within defined period Jan Feb Mar Apr May Jun Jul Aug Sep Oct Nov Dec $0.10220 $0.08957 $0.07905 $0.06024 $0.07187 $0.06915 $0.11975 $0.11678 $0..11874 $0.10671 $0.13322 $0.09672
1 – The Market Supply Charges are the historical charges from March 2005 – February 2006 as available at the Orange & Rockland Tariff webpage.
2 – Contract demand for the purposes of this Service Classification shall mean the customer’s maximum potential demand.
Filename: ORU_SC25_SC2_Pri_Nov05-Oct06.csv

NYSERDA DG/CHP Integrated Database System Utility Rate Details
CDH Energy Corporation 339 September 25, 2008
Orange & Rockland Utility
Service Classification 25 – Standby – Based on SC2 Primary – July 2007 to June 2008 Sales and delivery of electric power supply provided by the Company under the Company’s Retail Access Program, for standby purposes subject to the Special Provisions of this Service Classification. More specifically, this service is available: (1) to replace and/or to supplement the power and energy ordinarily generated by a customer by means of a private generating facility on their premises; or (2) for station use by a customer that is a wholesale generator. “Station Use” includes power and energy used by the customer at its premises in connection with its generating facility (a) during periods when such needs are not served by the generator and (b) to restart the generator after an outage. This service also applies to wholesale generators that require service when their own generating equipment is not sufficient to meet the station loads, provided that the service is not served under a separately-metered account. Service Charge $ 37.49 Contract Demand2 $ 4.42 of contract kW Periods Summer June 1 – September 30 Other All hours not in the Summer Period Demand Charges $ per daily peak kW within the defined block Summer Charges $ 0.4714 per daily peak kW Other Charges $ 0.3542 per daily peak kW Energy Charges System Benefits Charge, Energy Cost Adjustment and Renewable Portfolio Surcharge
$ 0.002650 per total kWh for all hours
Market Supply Charge and Adjustment1 $ per total kWh within defined period Jan Feb Mar Apr May Jun Jul Aug Sep Oct Nov Dec $0.10426 $0.1136 $0.10576 $0.10511 $0.112140 $0.12202 $0.10359 $0.10355 $0.08537 $0.09048 $0.08691 $0.09828
1 – The Market Supply Charges are the historical charges from July 2007 – June 2008 as available at the Orange & Rockland Tariff webpage.
2 – Contract demand for the purposes of this Service Classification shall mean the customer’s maximum potential demand.
Filename: ORU_SC25_SC2_Pri_Jul07-Jun08.csv

NYSERDA DG/CHP Integrated Database System Utility Rate Details
CDH Energy Corporation 340 September 25, 2008
Complete National Grid – Massachusetts Electric Tariff
The National Grid Massachusetts Electric rates are up-to-date as of June 2008. This utility was
formerly known as Massachusetts Electric prior to being acquired by National Grid.
National Grid - Massachusetts
Service Classification R-1 – Residential Regular – Variable Option – November 2005 to October 2006 Electric delivery service under this rate is available for all domestic purposes in an individual private dwelling or an individual apartment and for church and farm purposes. Customers whose average monthly usage for the previous 12 months exceeds 2500 kWh per month may elect delivery service on rate R-4, subject to the availability of the appropriate metering equipment. Customer Charge $ 6.01
Energy Charges $ per total kWh for Distribution, Transmission, Transition, Demand Side Management and Renewables Charge
All Hours $ 0.04319 / kWh Variable Pricing Option1 $ per total kWh within defined period Jan Feb Mar Apr May Jun Jul Aug Sep Oct Nov Dec
$0.12786 $0.12576 $0.09999 $0.08581 $0.08745 $0.09284 $0.10654 $0.10700 $0.09142 $0.09177 $0.09382 $0.10106 1 – The Variable Pricing Option Charges are the historical charges from November 2005 – October 2006
as available at the Mass. Electric Tariff webpage. Filename: MASS_R1_ Var_Nov05-Oct06.csv
National Grid - Massachusetts
Service Classification R-1 – Residential Regular – Variable Option – May 2006 to April 2007 Electric delivery service under this rate is available for all domestic purposes in an individual private dwelling or an individual apartment and for church and farm purposes. Customers whose average monthly usage for the previous 12 months exceeds 2500 kWh per month may elect delivery service on rate R-4, subject to the availability of the appropriate metering equipment. Customer Charge $ 6.01
Energy Charges $ per total kWh for Distribution, Transmission, Transition, Demand Side Management and Renewables Charge
All Hours $ 0.04745 / kWh Variable Pricing Option1 $ per total kWh within defined period Jan Feb Mar Apr May Jun Jul Aug Sep Oct Nov Dec
$0.13669 $0.13526 $0.11650 $0.10360 $0.08745 $0.09284 $0.10654 $0.10700 $0.09142 $0.09177 $0.08744 $0.10827 1 – The Variable Pricing Option Charges are the historical charges from November 2005 – October 2006
as available at the Mass. Electric Tariff webpage. Filename: MASS_R1_ Var_May06-Apr07.csv

NYSERDA DG/CHP Integrated Database System Utility Rate Details
CDH Energy Corporation 341 September 25, 2008
National Grid - Massachusetts
Service Classification R-1 – Residential Regular – Variable Option – July 2007 to June 2008 Electric delivery service under this rate is available for all domestic purposes in an individual private dwelling or an individual apartment and for church and farm purposes. Customers whose average monthly usage for the previous 12 months exceeds 2500 kWh per month may elect delivery service on rate R-4, subject to the availability of the appropriate metering equipment. Customer Charge $ 6.21
Energy Charges $ per total kWh for Distribution, Transmission, Transition, Demand Side Management and Renewables Charge
All Hours $ 0.0423 / kWh Variable Pricing Option1 $ per total kWh within defined period Jan Feb Mar Apr May Jun Jul Aug Sep Oct Nov Dec
$0.12097 $0.12238 $0.10593 $0.10152 $0.1953 $0.11526 $0.10724 $0.10763 $0.09766 $0.10165 $0.09789 $0.10222 1 – The Variable Pricing Option Charges are the historical charges from July 2007 – June 2008 as
available at the Mass. Electric Tariff webpage. Filename: MASS_R1_ Var_Jul07-Jun08.csv
National Grid - Massachusetts
Service Classification R-1 – Residential Regular – Fixed Option – November 2005 to October 2006 Electric delivery service under this rate is available for all domestic purposes in an individual private dwelling or an individual apartment and for church and farm purposes. Customers whose average monthly usage for the previous 12 months exceeds 2500 kWh per month may elect delivery service on rate R-4, subject to the availability of the appropriate metering equipment. Customer Charge $ 6.01
Energy Charges $ per total kWh for Distribution, Transmission, Transition, Demand Side Management and Renewables Charge
All Hours $ 0.04319 / kWh Fixed Pricing Option $ 0.09693 / kWh
Filename: MASS_R1_ Fixed_Nov05-Oct06.csv
National Grid - Massachusetts
Service Classification R-1 – Residential Regular – Fixed Option – May 2006 to April 2007 Electric delivery service under this rate is available for all domestic purposes in an individual private dwelling or an individual apartment and for church and farm purposes. Customers whose average monthly usage for the previous 12 months exceeds 2500 kWh per month may elect delivery service on rate R-4, subject to the availability of the appropriate metering equipment. Customer Charge $ 6.01
Energy Charges $ per total kWh for Distribution, Transmission, Transition, Demand Side Management and Renewables Charge
All Hours $ 0. 04745 / kWh Fixed Pricing Option $ 0.11616 / kWh
Filename: MASS_R1_ Fixed_May06-Apr07.csv

NYSERDA DG/CHP Integrated Database System Utility Rate Details
CDH Energy Corporation 342 September 25, 2008
National Grid - Massachusetts
Service Classification R-1 – Residential Regular – Fixed Option – July 2007 to June 2008 Electric delivery service under this rate is available for all domestic purposes in an individual private dwelling or an individual apartment and for church and farm purposes. Customers whose average monthly usage for the previous 12 months exceeds 2500 kWh per month may elect delivery service on rate R-4, subject to the availability of the appropriate metering equipment. Customer Charge $ 6.21
Energy Charges $ per total kWh for Distribution, Transmission, Transition, Demand Side Management and Renewables Charge
All Hours $ 0. 0423 / kWh Fixed Pricing Option $ 0.1179 / kWh
Filename: MASS_R1_ Fixed_Jul07-Jun08.csv
National Grid - Massachusetts
Service Classification R-4 – Residential Regular – Variable Option – November 2005 to October 2006 Electric delivery service under this rate is available for all domestic purposes in an individual private dwelling or an individual apartment and for church and farm purposes. Any residential customer whose average usage exceeds 2,500 kWh/month for a 12 month period may elect delivery service under this rate effective with installation of appropriate metering. Customer Charge $ 19.87 Periods Peak 8AM – 9PM, Monday-Friday Off-Peak All Hours not in the Peak Period
Energy Charges $ per total kWh in Period: Distribution Energy, Transmission, Transition Energy, Demand Side Management and Renewables Charges
Peak Energy: $ 0.08699 / kWh Off-Peak Energy: $ 0.01387 / kWh Variable Pricing Option1 $ per total kWh within defined period Jan Feb Mar Apr May Jun Jul Aug Sep Oct Nov Dec
$0.12786 $0.12576 $0.09999 $0.08581 $0.08745 $0.09284 $0.10654 $0.10700 $0.09142 $0.09177 $0.09382 $0.10106 1 – The Variable Pricing Option Charges are the historical charges from November 2005 – October 2006
as available at the Mass. Electric Tariff webpage. Filename: MASS_R4_ Var_Nov05-Oct06.csv

NYSERDA DG/CHP Integrated Database System Utility Rate Details
CDH Energy Corporation 343 September 25, 2008
National Grid - Massachusetts
Service Classification R-4 – Residential Regular – Variable Option – May 2006 to April 2007 Electric delivery service under this rate is available for all domestic purposes in an individual private dwelling or an individual apartment and for church and farm purposes. Any residential customer whose average usage exceeds 2,500 kWh/month for a 12 month period may elect delivery service under this rate effective with installation of appropriate metering. Customer Charge $ 19.87 Periods Peak 8AM – 9PM, Monday-Friday Off-Peak All Hours not in the Peak Period
Energy Charges $ per total kWh in Period: Distribution Energy, Transmission, Transition Energy, Demand Side Management and Renewables Charges
Peak Energy: $ 0.09141 / kWh Off-Peak Energy: $ 0.01829 / kWh Variable Pricing Option1 $ per total kWh within defined period Jan Feb Mar Apr May Jun Jul Aug Sep Oct Nov Dec
$0.13669 $0.13526 $0.11650 $0.10360 $0.08745 $0.09284 $0.10654 $0.10700 $0.09142 $0.09177 $0.08744 $0.10827 1 – The Variable Pricing Option Charges are the historical charges from November 2005 – October 2006
as available at the Mass. Electric Tariff webpage. Filename: MASS_R4_ Var_May06-Apr07.csv
National Grid - Massachusetts
Service Classification R-4 – Residential Regular – Variable Option – July 2007-June 2008 Electric delivery service under this rate is available for all domestic purposes in an individual private dwelling or an individual apartment and for church and farm purposes. Any residential customer whose average usage exceeds 2,500 kWh/month for a 12 month period may elect delivery service under this rate effective with installation of appropriate metering. Customer Charge $ 20.56 Periods Peak 8AM – 9PM, Monday-Friday Off-Peak All Hours not in the Peak Period
Energy Charges $ per total kWh in Period: Distribution Energy, Transmission, Transition Energy, Demand Side Management and Renewables Charges
Peak Energy: $ 0.08216 / kWh Off-Peak Energy: $ 0.01466 / kWh Variable Pricing Option1 $ per total kWh within defined period Jan Feb Mar Apr May Jun Jul Aug Sep Oct Nov Dec
$0.12097 $0.12238 $0.10593 $0.10152 $0.10953 $0.11526 $0.10724 $0.10763 $0.09766 $0.10165 $0.09789 $0.10222 1 – The Variable Pricing Option Charges are the historical charges from July 2007 – June 2008 as
available at the Mass. Electric Tariff webpage. Filename: MASS_R4_ Var_Jul07-Jun08.csv

NYSERDA DG/CHP Integrated Database System Utility Rate Details
CDH Energy Corporation 344 September 25, 2008
National Grid - Massachusetts
Service Classification R-4 – Residential Regular – Fixed Option – November 2005 to October 2006 Electric delivery service under this rate is available for all domestic purposes in an individual private dwelling or an individual apartment and for church and farm purposes. Any residential customer whose average usage exceeds 2,500 kWh/month for a 12 month period may elect delivery service under this rate effective with installation of appropriate metering. Customer Charge $ 19.87 Periods Peak 8AM – 9PM, Monday-Friday Off-Peak All Hours not in the Peak Period
Energy Charges $ per total kWh in Period: Distribution Energy, Transmission, Transition Energy, Demand Side Management and Renewables Charges
Peak Energy: $ 0.08699 / kWh Off-Peak Energy: $ 0.01387 / kWh Fixed Pricing Option $ 0.09693 / kWh for All Hours
Filename: MASS_R4_ Fixed_Nov05-Oct06.csv
National Grid - Massachusetts
Service Classification R-4 – Residential Regular – Fixed Option – May 2006 to April 2007 Electric delivery service under this rate is available for all domestic purposes in an individual private dwelling or an individual apartment and for church and farm purposes. Any residential customer whose average usage exceeds 2,500 kWh/month for a 12 month period may elect delivery service under this rate effective with installation of appropriate metering. Customer Charge $ 19.87 Periods Peak 8AM – 9PM, Monday-Friday Off-Peak All Hours not in the Peak Period
Energy Charges $ per total kWh in Period: Distribution Energy, Transmission, Transition Energy, Demand Side Management and Renewables Charges
Peak Energy: $ 0.09141 / kWh Off-Peak Energy: $ 0.01829 / kWh Fixed Pricing Option $ 0. 11616/ kWh for All Hours
Filename: MASS_R4_ Fixed_May06-Apr07.csv

NYSERDA DG/CHP Integrated Database System Utility Rate Details
CDH Energy Corporation 345 September 25, 2008
National Grid - Massachusetts
Service Classification R-4 – Residential Regular – Fixed Option – July 2007 to June 2008 Electric delivery service under this rate is available for all domestic purposes in an individual private dwelling or an individual apartment and for church and farm purposes. Any residential customer whose average usage exceeds 2,500 kWh/month for a 12 month period may elect delivery service under this rate effective with installation of appropriate metering. Customer Charge $ 20.56 Periods Peak 8AM – 9PM, Monday-Friday Off-Peak All Hours not in the Peak Period
Energy Charges $ per total kWh in Period: Distribution Energy, Transmission, Transition Energy, Demand Side Management and Renewables Charges
Peak Energy: $ 0.08216 / kWh Off-Peak Energy: $ 0.01466 / kWh Fixed Pricing Option $ 0. 11790/ kWh for All Hours
Filename: MASS_R4_ Fixed_Jul07-Jun08.csv
National Grid - Massachusetts
Service Classification G-1 – General Service – Variable Option – November 2005 to October 2006 Electric delivery service under this rate is available for all purposes, subject to the provisions of this section. A new Customer will begin service on this rate if the Company estimates that its average use will not exceed 10,000 kWh/month or 200 kW of demand. Customer Charge $ 8.61 Location Service Charge $ 6.70
Energy Charges $ per total kWh in Period: Distribution Energy, Transmission, Transition Energy, Demand Side Management and Renewables Charges
All Hours $ 0.05622 / kWh Variable Pricing Option1 $ per total kWh within defined period Jan Feb Mar Apr May Jun Jul Aug Sep Oct Nov Dec
$0.12602 $0.12417 $0.09940 $0.08397 $0.08928 $0.09397 $0.10701 $0.10769 $0.09195 $0.09262 $0.09205 $0.09955 1 – The Variable Pricing Option Charges are the historical charges from November 2005 - October 2006
as available at the Mass. Electric Tariff webpage. Filename: MASS_G1_ Var_Nov05-Oct06.csv

NYSERDA DG/CHP Integrated Database System Utility Rate Details
CDH Energy Corporation 346 September 25, 2008
National Grid - Massachusetts
Service Classification G-1 – General Service – Variable Option – May 2006 to April 2007 Electric delivery service under this rate is available for all purposes, subject to the provisions of this section. A new Customer will begin service on this rate if the Company estimates that its average use will not exceed 10,000 kWh/month or 200 kW of demand. Customer Charge $ 8.61 Location Service Charge $ 6.70
Energy Charges $ per total kWh in Period: Distribution Energy, Transmission, Transition Energy, Demand Side Management and Renewables Charges
All Hours $ 0.06008 / kWh Variable Pricing Option1 $ per total kWh within defined period Jan Feb Mar Apr May Jun Jul Aug Sep Oct Nov Dec
$0.13462 $0.13297 $0.11455 $0.10234 $0.08928 $0.09397 $0.10701 $0.10769 $0.09195 $0.09262 $0.08683 $0.10579 1 – The Variable Pricing Option Charges are the historical charges from November 2005 - October 2006
as available at the Mass. Electric Tariff webpage. Filename: MASS_G1_ Var_May06-Apr07.csv
National Grid - Massachusetts
Service Classification G-1 – General Service – Variable Option – July 2007 to June 2008 Electric delivery service under this rate is available for all purposes, subject to the provisions of this section. A new Customer will begin service on this rate if the Company estimates that its average use will not exceed 10,000 kWh/month or 200 kW of demand. Customer Charge $ 8.90 Location Service Charge $ 6.92
Energy Charges $ per total kWh in Period: Distribution Energy, Transmission, Transition Energy, Demand Side Management and Renewables Charges
All Hours $ 0.05618 / kWh Variable Pricing Option1 $ per total kWh within defined period Jan Feb Mar Apr May Jun Jul Aug Sep Oct Nov Dec
$0.11852 $0.11941 $0.10587 $0.09723 $0.10626 $0.11278 $0.1083 $0.1099 $0.09896 $0.09943 $0.09574 $0.10670 1 – The Variable Pricing Option Charges are the historical charges from July 2007- June 2008 as
available at the Mass. Electric Tariff webpage. Filename: MASS_G1_ Var_Jul07-Jun08.csv
National Grid - Massachusetts
Service Classification G-1 – General Service – Fixed Option – November 2005 to October 2006 Electric delivery service under this rate is available for all purposes, subject to the provisions of this section. A new Customer will begin service on this rate if the Company estimates that its average use will not exceed 10,000 kWh/month or 200 kW of demand. Customer Charge $ 8.61 Location Service Charge $ 6.70
Energy Charges $ per total kWh in Period: Distribution Energy, Transmission, Transition Energy, Demand Side Management and Renewables Charges
All Hours $ 0.05622 / kWh Fixed Pricing Option $ 0.09763 / kWh
Filename: MASS_G1_ Fixed_Nov05-Oct06.csv

NYSERDA DG/CHP Integrated Database System Utility Rate Details
CDH Energy Corporation 347 September 25, 2008
National Grid - Massachusetts
Service Classification G-1 – General Service – Fixed Option – May 2006 to April 2007 Electric delivery service under this rate is available for all purposes, subject to the provisions of this section. A new Customer will begin service on this rate if the Company estimates that its average use will not exceed 10,000 kWh/month or 200 kW of demand. Customer Charge $ 8.61 Location Service Charge $ 6.70
Energy Charges $ per total kWh in Period: Distribution Energy, Transmission, Transition Energy, Demand Side Management and Renewables Charges
All Hours $ 0.06008/ kWh Fixed Pricing Option $ 0.11387 / kWh
Filename: MASS_G1_ Fixed_May06-Apr07.csv
National Grid - Massachusetts
Service Classification G-1 – General Service – Fixed Option – July 2007 to June 2008 Electric delivery service under this rate is available for all purposes, subject to the provisions of this section. A new Customer will begin service on this rate if the Company estimates that its average use will not exceed 10,000 kWh/month or 200 kW of demand. Customer Charge $ 8.90 Location Service Charge $ 6.92
Energy Charges $ per total kWh in Period: Distribution Energy, Transmission, Transition Energy, Demand Side Management and Renewables Charges
All Hours $ 0.05618/ kWh Fixed Pricing Option $ 0.11568 / kWh
Filename: MASS_G1_ Fixed_Jul07-Jun08.csv
National Grid - Massachusetts
Service Classification G-2 – General Service Demand – Southeastern Mass – Variable Option – November 2005 to October 2006 Electric delivery service under this rate is available for all purposes, subject to the provisions of this section. A new customer will begin delivery on this rate if the Company estimates that its average use will exceed 10,000 kWh/month, but not exceed 200 kW of Demand. This rate is for the Southeastern Massachusetts service area. Customer Charge $ 15.76 Demand Charges $ per peak kW Distribution and Transition Demand Charges: $ 6.65 / kW
Energy Charges $ per total kWh in Period: Distribution Energy, Transmission, Transition Energy, Demand Side Management and Renewables Charges
All Hours $ 0.01655 / kWh Variable Pricing Option1 $ per total kWh within defined period Jan Feb Mar Apr May Jun Jul Aug Sep Oct Nov Dec
$0.15776 $0.16580 $0.14981 $0.12342 $0.08511 $0.09170 $0.10302 $0.11023 $0.09759 $0.10273 $0.11170 $0.12175 1 – The Variable Pricing Option Charges are the historical charges from May 2005 – April 2006 as
available at the Mass. Electric Tariff webpage. Filename: MASS_G2_SEMA_Var_Nov05-Oct06.csv

NYSERDA DG/CHP Integrated Database System Utility Rate Details
CDH Energy Corporation 348 September 25, 2008
National Grid - Massachusetts
Service Classification G-2 – General Service Demand – Southeastern Mass – Variable Option – February 2006 to January 2007 Electric delivery service under this rate is available for all purposes, subject to the provisions of this section. A new customer will begin delivery on this rate if the Company estimates that its average use will exceed 10,000 kWh/month, but not exceed 200 kW of Demand. This rate is for the Southeastern Massachusetts service area. Customer Charge $ 15.76 Demand Charges $ per peak kW Distribution and Transition Demand Charges: $ 6.65 / kW
Energy Charges $ per total kWh in Period: Distribution Energy, Transmission, Transition Energy, Demand Side Management and Renewables Charges
All Hours $ 0.02124 / kWh Variable Pricing Option1 $ per total kWh within defined period Jan Feb Mar Apr May Jun Jul Aug Sep Oct Nov Dec
$0.13792 $0.16580 $0.14981 $0.12342 $0.08511 $0.09170 $0.10302 $0.11023 $0.09759 $0.10273 $0.08332 $0.10889 1 – The Variable Pricing Option Charges are the historical charges from May 2005 – April 2006 as
available at the Mass. Electric Tariff webpage. Filename: MASS_G2_SEMA_Var_Feb06-Jan07.csv
National Grid - Massachusetts
Service Classification G-2 – General Service Demand – Southeastern Mass – Variable Option –July 2007 to June 2008 Electric delivery service under this rate is available for all purposes, subject to the provisions of this section. A new customer will begin delivery on this rate if the Company estimates that its average use will exceed 10,000 kWh/month, but not exceed 200 kW of Demand. This rate is for the Southeastern Massachusetts service area. Customer Charge $ 16.31 Demand Charges $ per peak kW Distribution and Transition Demand Charges: $ 6.62 / kW
Energy Charges $ per total kWh in Period: Distribution Energy, Transmission, Transition Energy, Demand Side Management and Renewables Charges
All Hours $ 0.01649 / kWh Variable Pricing Option1 $ per total kWh within defined period Jan Feb Mar Apr May Jun Jul Aug Sep Oct Nov Dec
$0.11152 $0.11386 $0.10554 $0.0989 $0.12178 $0.12974 $0.10428 $0.11268 $0.10305 $0.10573 $0.0914 $0.09949 1 – The Variable Pricing Option Charges are the historical charges from July 2007 – June 2008 as
available at the Mass. Electric Tariff webpage. Filename: MASS_G2_SEMA_Var_Jul07-Jun08.csv

NYSERDA DG/CHP Integrated Database System Utility Rate Details
CDH Energy Corporation 349 September 25, 2008
National Grid - Massachusetts
Service Classification G-2 – General Service Demand – Southeastern Mass – Fixed Option – November 2005 to October 2006 Electric delivery service under this rate is available for all purposes, subject to the provisions of this section. A new customer will begin delivery on this rate if the Company estimates that its average use will exceed 10,000 kWh/month, but not exceed 200 kW of Demand. This rate is for the Southeastern Massachusetts service area. Customer Charge $ 15.76 Demand Charges $ per peak kW Distribution and Transition Demand Charges: $ 6.65 / kW
Energy Charges $ per total kWh in Period: Distribution Energy, Transmission, Transition Energy, Demand Side Management and Renewables Charges
All Hours $ 0.01655 / kWh Fixed Pricing Option $ 0.09358 / kWh
Filename: MASS_G2_SEMA_Fixed_Nov05-Oct06.csv
National Grid - Massachusetts
Service Classification G-2 – General Service Demand – Southeastern Mass – Fixed Option – February 2006 to January 2007 Electric delivery service under this rate is available for all purposes, subject to the provisions of this section. A new customer will begin delivery on this rate if the Company estimates that its average use will exceed 10,000 kWh/month, but not exceed 200 kW of Demand. This rate is for the Southeastern Massachusetts service area. Customer Charge $ 15.76 Demand Charges $ per peak kW Distribution and Transition Demand Charges: $ 6.65 / kW
Energy Charges $ per total kWh in Period: Distribution Energy, Transmission, Transition Energy, Demand Side Management and Renewables Charges
All Hours $ 0.02124 / kWh Fixed Pricing Option $ 0.11075 / kWh
Filename: MASS_G2_SEMA_Fixed_Feb06-Jan07.csv
National Grid - Massachusetts
Service Classification G-2 – General Service Demand – Southeastern Mass – Fixed Option – July 2007 to June 2008 Electric delivery service under this rate is available for all purposes, subject to the provisions of this section. A new customer will begin delivery on this rate if the Company estimates that its average use will exceed 10,000 kWh/month, but not exceed 200 kW of Demand. This rate is for the Southeastern Massachusetts service area. Customer Charge $ 16.31 Demand Charges $ per peak kW Distribution and Transition Demand Charges: $ 6.62 / kW
Energy Charges $ per total kWh in Period: Distribution Energy, Transmission, Transition Energy, Demand Side Management and Renewables Charges
All Hours $ 0.01649 / kWh Fixed Pricing Option $ 0.13189 / kWh
Filename: MASS_G2_SEMA_Fixed_Jul07-Jun08.csv

NYSERDA DG/CHP Integrated Database System Utility Rate Details
CDH Energy Corporation 350 September 25, 2008
National Grid - Massachusetts
Service Classification G-2 – General Service Demand – Western and Central Mass – Variable Option – November 2005 to October 2006 Electric delivery service under this rate is available for all purposes, subject to the provisions of this section. A new customer will begin delivery on this rate if the Company estimates that its average use will exceed 10,000 kWh/month, but not exceed 200 kW of Demand. This rate is for the Western and Central Massachusetts service area. Customer Charge $ 15.76 Demand Charges $ per peak kW Distribution and Transition Demand Charges: $ 6.65 / kW
Energy Charges $ per total kWh in Period: Distribution Energy, Transmission, Transition Energy, Demand Side Management and Renewables Charges
All Hours $ 0.01655 / kWh Variable Pricing Option1 $ per total kWh within defined period Jan Feb Mar Apr May Jun Jul Aug Sep Oct Nov Dec
$0.16124 $0.16895 $0.15286 $0.12612 $0.08722 $0.09229 $0.10257 $0.10082 $0.08867 $0.08926 $0.11492 $0.12475 1 – The Variable Pricing Option Charges are the historical charges from May 2005 – April 2006 as
available at the Mass. Electric Tariff webpage. Filename: MASS_G2_WCMA_Var_Nov05-Oct06.csv
National Grid - Massachusetts
Service Classification G-2 – General Service Demand – Western and Central Mass – Variable Option – February 2006 to January 2007 Electric delivery service under this rate is available for all purposes, subject to the provisions of this section. A new customer will begin delivery on this rate if the Company estimates that its average use will exceed 10,000 kWh/month, but not exceed 200 kW of Demand. This rate is for the Western and Central Massachusetts service area. Customer Charge $ 15.76 Demand Charges $ per peak kW Distribution and Transition Demand Charges: $ 6.65 / kW
Energy Charges $ per total kWh in Period: Distribution Energy, Transmission, Transition Energy, Demand Side Management and Renewables Charges
All Hours $ 0.02124 / kWh Variable Pricing Option1 $ per total kWh within defined period Jan Feb Mar Apr May Jun Jul Aug Sep Oct Nov Dec
$0.13544 $0.16895 $0.15286 $0.12612 $0.08722 $0.09229 $0.10257 $0.10082 $0.08867 $0.08926 $0.07852 $0.10594 1 – The Variable Pricing Option Charges are the historical charges from May 2005 – April 2006 as
available at the Mass. Electric Tariff webpage. Filename: MASS_G2_WCMA_Var_Feb06-Jan07.csv

NYSERDA DG/CHP Integrated Database System Utility Rate Details
CDH Energy Corporation 351 September 25, 2008
National Grid - Massachusetts
Service Classification G-2 – General Service Demand – Western and Central Mass – Variable Option – July 2007 to June 2008 Electric delivery service under this rate is available for all purposes, subject to the provisions of this section. A new customer will begin delivery on this rate if the Company estimates that its average use will exceed 10,000 kWh/month, but not exceed 200 kW of Demand. This rate is for the Western and Central Massachusetts service area. Customer Charge $ 16.31 Demand Charges $ per peak kW Distribution and Transition Demand Charges: $ 6.62 / kW
Energy Charges $ per total kWh in Period: Distribution Energy, Transmission, Transition Energy, Demand Side Management and Renewables Charges
All Hours $ 0.01649 / kWh Variable Pricing Option1 $ per total kWh within defined period Jan Feb Mar Apr May Jun Jul Aug Sep Oct Nov Dec
$0.11061 $0.10621 $0.09549 $0.09206 $0.11201 $0.11898 $0.10236 $0.10788 $0.09802 $0.10069 $0.08551 $0.09412 1 – The Variable Pricing Option Charges are the historical charges from July 2007 – June 2008 as
available at the Mass. Electric Tariff webpage. Filename: MASS_G2_WCMA_Var_Jul07-Jun08.csv
National Grid - Massachusetts
Service Classification G-2 – General Service Demand – Western and Central Mass – Fixed Option – November 2005 to October 2006 Electric delivery service under this rate is available for all purposes, subject to the provisions of this section. A new customer will begin delivery on this rate if the Company estimates that its average use will exceed 10,000 kWh/month, but not exceed 200 kW of Demand. This rate is for the Western and Central Massachusetts service area. Customer Charge $ 15.76 Demand Charges $ per peak kW Distribution and Transition Demand Charges: $ 6.65 / kW
Energy Charges $ per total kWh in Period: Distribution Energy, Transmission, Transition Energy, Demand Side Management and Renewables Charges
All Hours $ 0.01655 / kWh Fixed Pricing Option $ 0.09429 / kWh
Filename: MASS_G2_WCMA_Fixed_Nov05-Oct06.csv

NYSERDA DG/CHP Integrated Database System Utility Rate Details
CDH Energy Corporation 352 September 25, 2008
National Grid - Massachusetts
Service Classification G-2 – General Service Demand – Western and Central Mass – Fixed Option – February 2006 to January 2007 Electric delivery service under this rate is available for all purposes, subject to the provisions of this section. A new customer will begin delivery on this rate if the Company estimates that its average use will exceed 10,000 kWh/month, but not exceed 200 kW of Demand. This rate is for the Western and Central Massachusetts service area. Customer Charge $ 15.76 Demand Charges $ per peak kW Distribution and Transition Demand Charges: $ 6.65 / kW
Energy Charges $ per total kWh in Period: Distribution Energy, Transmission, Transition Energy, Demand Side Management and Renewables Charges
All Hours $ 0.02124 / kWh Fixed Pricing Option $ 0.10737 / kWh
Filename: MASS_G2_WCMA_Fixed_Feb06-Jan07.csv
National Grid - Massachusetts
Service Classification G-2 – General Service Demand – Western and Central Mass – Fixed Option –July 2007 to June 2008 Electric delivery service under this rate is available for all purposes, subject to the provisions of this section. A new customer will begin delivery on this rate if the Company estimates that its average use will exceed 10,000 kWh/month, but not exceed 200 kW of Demand. This rate is for the Western and Central Massachusetts service area. Customer Charge $ 16.31 Demand Charges $ per peak kW Distribution and Transition Demand Charges: $ 6.62 / kW
Energy Charges $ per total kWh in Period: Distribution Energy, Transmission, Transition Energy, Demand Side Management and Renewables Charges
All Hours $ 0.01649 / kWh Fixed Pricing Option $ 0.12088 / kWh
Filename: MASS_G2_WCMA_Fixed_Jul07-Jun08.csv

NYSERDA DG/CHP Integrated Database System Utility Rate Details
CDH Energy Corporation 353 September 25, 2008
National Grid - Massachusetts
Service Classification G-2 – General Service Demand – Northeastern Mass – Variable Option – November 2005 to October 2006 Electric delivery service under this rate is available for all purposes, subject to the provisions of this section. A new customer will begin delivery on this rate if the Company estimates that its average use will exceed 10,000 kWh/month, but not exceed 200 kW of Demand. This rate is for the Northeastern Massachusetts service area. Customer Charge $ 15.76 Demand Charges $ per peak kW Distribution and Transition Demand Charges: $ 6.65 / kW
Energy Charges $ per total kWh in Period: Distribution Energy, Transmission, Transition Energy, Demand Side Management and Renewables Charges
All Hours $ 0.01655 / kWh Variable Pricing Option1 $ per total kWh within defined period Jan Feb Mar Apr May Jun Jul Aug Sep Oct Nov Dec
$0.17010 $0.17234 $0.15679 $0.12730 $0.08780 $0.09571 $0.10740 $0.10935 $0.08963 $0.09199 $0.12413 $0.12876 1 – The Variable Pricing Option Charges are the historical charges from May 2005 – April 2006 as
available at the Mass. Electric Tariff webpage. Filename: MASS_G2_NEMA_Var_Nov05-Oct06.csv
National Grid - Massachusetts
Service Classification G-2 – General Service Demand – Northeastern Mass – Variable Option – February 2006 to January 2007 Electric delivery service under this rate is available for all purposes, subject to the provisions of this section. A new customer will begin delivery on this rate if the Company estimates that its average use will exceed 10,000 kWh/month, but not exceed 200 kW of Demand. This rate is for the Northeastern Massachusetts service area. Customer Charge $ 15.76 Demand Charges $ per peak kW Distribution and Transition Demand Charges: $ 6.65 / kW
Energy Charges $ per total kWh in Period: Distribution Energy, Transmission, Transition Energy, Demand Side Management and Renewables Charges
All Hours $ 0.02124 / kWh Variable Pricing Option1 $ per total kWh within defined period Jan Feb Mar Apr May Jun Jul Aug Sep Oct Nov Dec
$0.14079 $0.17234 $0.15679 $0.12730 $0.08780 $0.09571 $0.10740 $0.10935 $0.08963 $0.09199 $0.08373 $0.11089 1 – The Variable Pricing Option Charges are the historical charges from May 2005 – April 2006 as
available at the Mass. Electric Tariff webpage. Filename: MASS_G2_NEMA_Var_Feb06-Jan07.csv

NYSERDA DG/CHP Integrated Database System Utility Rate Details
CDH Energy Corporation 354 September 25, 2008
National Grid - Massachusetts
Service Classification G-2 – General Service Demand – Northeastern Mass – Variable Option – July 2007 to June 2008 Electric delivery service under this rate is available for all purposes, subject to the provisions of this section. A new customer will begin delivery on this rate if the Company estimates that its average use will exceed 10,000 kWh/month, but not exceed 200 kW of Demand. This rate is for the Northeastern Massachusetts service area. Customer Charge $ 16.31 Demand Charges $ per peak kW Distribution and Transition Demand Charges: $ 6.62 / kW
Energy Charges $ per total kWh in Period: Distribution Energy, Transmission, Transition Energy, Demand Side Management and Renewables Charges
All Hours $ 0.01649 / kWh Variable Pricing Option1 $ per total kWh within defined period Jan Feb Mar Apr May Jun Jul Aug Sep Oct Nov Dec
$0.11137 $0.10801 $0.09905 $0.09597 $0.11592 $0.12139 $0.10435 $0.10990 $0.10099 $0.10435 $0.08708 $0.09555 1 – The Variable Pricing Option Charges are the historical charges from July 2007 – June 2008 as
available at the Mass. Electric Tariff webpage. Filename: MASS_G2_NEMA_Var_Jul07-Jun08.csv
National Grid - Massachusetts
Service Classification G-2 – General Service Demand – Northeastern Mass – Fixed Option – November 2005 to October 2006 Electric delivery service under this rate is available for all purposes, subject to the provisions of this section. A new customer will begin delivery on this rate if the Company estimates that its average use will exceed 10,000 kWh/month, but not exceed 200 kW of Demand. This rate is for the Northeastern Massachusetts service area. Customer Charge $ 15.76 Demand Charges $ per peak kW Distribution and Transition Demand Charges: $ 6.65 / kW
Energy Charges $ per total kWh in Period: Distribution Energy, Transmission, Transition Energy, Demand Side Management and Renewables Charges
All Hours $ 0.01655 / kWh Fixed Pricing Option $ 0.09730 / kWh
Filename: MASS_G2_NEMA_Fixed_Nov05-Oct06.csv

NYSERDA DG/CHP Integrated Database System Utility Rate Details
CDH Energy Corporation 355 September 25, 2008
National Grid - Massachusetts
Service Classification G-2 – General Service Demand – Northeastern Mass – Fixed Option – February 2006 to January 2007 Electric delivery service under this rate is available for all purposes, subject to the provisions of this section. A new customer will begin delivery on this rate if the Company estimates that its average use will exceed 10,000 kWh/month, but not exceed 200 kW of Demand. This rate is for the Northeastern Massachusetts service area. Customer Charge $ 15.76 Demand Charges $ per peak kW Distribution and Transition Demand Charges: $ 6.65 / kW
Energy Charges $ per total kWh in Period: Distribution Energy, Transmission, Transition Energy, Demand Side Management and Renewables Charges
All Hours $ 0.02124 / kWh Fixed Pricing Option $ 0.11254 / kWh
Filename: MASS_G2_NEMA_Fixed_Feb06-Jan07.csv
National Grid - Massachusetts
Service Classification G-2 – General Service Demand – Northeastern Mass – Fixed Option – July 2007 to June 2008 Electric delivery service under this rate is available for all purposes, subject to the provisions of this section. A new customer will begin delivery on this rate if the Company estimates that its average use will exceed 10,000 kWh/month, but not exceed 200 kW of Demand. This rate is for the Northeastern Massachusetts service area. Customer Charge $ 16.31 Demand Charges $ per peak kW Distribution and Transition Demand Charges: $ 6.62 / kW
Energy Charges $ per total kWh in Period: Distribution Energy, Transmission, Transition Energy, Demand Side Management and Renewables Charges
All Hours $ 0.01649 / kWh Fixed Pricing Option $ 0.12380 / kWh
Filename: MASS_G2_NEMA_Fixed_Jul07-Jun08.csv

NYSERDA DG/CHP Integrated Database System Utility Rate Details
CDH Energy Corporation 356 September 25, 2008
National Grid - Massachusetts
Service Classification G-3 – General Service Time-of-Use – Southeastern Mass – Variable Option – November 2005 to October 2006 This service is primarily available for large commercial and industrial customers with demand greater than 200 kW. This rate is for the Southeastern Massachusetts service area. Customer Charge $ 69.62 Periods Peak 8AM – 9PM, Monday-Friday Off-Peak All Hours not in the Peak Period Demand Charges $ per peak kW Distribution and Transition Demand Charges: $ 4.65 / kW
Energy Charges $ per total kWh in Period: Distribution Energy, Transmission, Transition Energy, Demand Side Management and Renewables Charges
Peak Energy: $ 0.02557 / kWh Off-Peak Energy: $ 0.01351 / kWh Variable Pricing Option1 $ per total kWh within defined period Jan Feb Mar Apr May Jun Jul Aug Sep Oct Nov Dec
$0.15776 $0.16580 $0.14981 $0.12342 $0.07245 $0.07474 $0.08133 $0.08122 $0.07210 $0.07187 $0.11170 $0.12175 1 – The Variable Pricing Option Charges are the historical charges from May 2005 – April 2006 as
available at the Mass. Electric Tariff webpage. Filename: MASS_G3_SEMA_Var_Nov05-Oct06.csv
National Grid - Massachusetts
Service Classification G-3 – General Service Time-of-Use – Southeastern Mass – Variable Option – February 2006 to January 2007 This service is primarily available for large commercial and industrial customers with demand greater than 200 kW. This rate is for the Southeastern Massachusetts service area. Customer Charge $ 69.62 Periods Peak 8AM – 9PM, Monday-Friday Off-Peak All Hours not in the Peak Period Demand Charges $ per peak kW Distribution and Transition Demand Charges: $ 4.65 / kW
Energy Charges $ per total kWh in Period: Distribution Energy, Transmission, Transition Energy, Demand Side Management and Renewables Charges
Peak Energy: $ 0.02940 / kWh Off-Peak Energy: $ 0.01734 / kWh Variable Pricing Option1 $ per total kWh within defined period Jan Feb Mar Apr May Jun Jul Aug Sep Oct Nov Dec
$0.13792 $0.16580 $0.14981 $0.12342 $0.07245 $0.07474 $0.08133 $0.08122 $0.07210 $0.07187 $0.08332 $0.10889 1 – The Variable Pricing Option Charges are the historical charges from May 2005 – April 2006 as
available at the Mass. Electric Tariff webpage. Filename: MASS_G3_SEMA_Var_Feb06-Jan07.csv

NYSERDA DG/CHP Integrated Database System Utility Rate Details
CDH Energy Corporation 357 September 25, 2008
National Grid - Massachusetts
Service Classification G-3 – General Service Time-of-Use – Southeastern Mass – Variable Option – July 2007 to June 2008 This service is primarily available for large commercial and industrial customers with demand greater than 200 kW. This rate is for the Southeastern Massachusetts service area. Customer Charge $ 72.06 Periods Peak 8AM – 9PM, Monday-Friday Off-Peak All Hours not in the Peak Period Demand Charges $ per peak kW Distribution and Transition Demand Charges: $ 4.39 / kW
Energy Charges $ per total kWh in Period: Distribution Energy, Transmission, Transition Energy, Demand Side Management and Renewables Charges
Peak Energy: $ 0.02554 / kWh Off-Peak Energy: $ 0.01299 / kWh Variable Pricing Option1 $ per total kWh within defined period Jan Feb Mar Apr May Jun Jul Aug Sep Oct Nov Dec
$0.11152 $0.11386 $0.10554 $0.0989 $0.12178 $0.12974 $0.10428 $0.11268 $0.10305 $0.10573 $0.0914 $0.09949 1 – The Variable Pricing Option Charges are the historical charges from July 2007 to June 2008 as
available at the Mass. Electric Tariff webpage. Filename: MASS_G3_SEMA_Var_Jul07-Jun08.csv
National Grid - Massachusetts
Service Classification G-3 – General Service Time-of-Use – Southeastern Mass – Fixed Option – November 2005 to October 2006 This service is primarily available for large commercial and industrial customers with demand greater than 200 kW. This rate is for the Southeastern Massachusetts service area. Customer Charge $ 69.62 Periods Peak 8AM – 9PM, Monday-Friday Off-Peak All Hours not in the Peak Period Demand Charges $ per peak kW Distribution and Transition Demand Charges: $ 4.65 / kW
Energy Charges $ per total kWh in Period: Distribution Energy, Transmission, Transition Energy, Demand Side Management and Renewables Charges
Peak Energy: $ 0.02557 / kWh Off-Peak Energy: $ 0.01351 / kWh Fixed Pricing Option $ 0.09358 / kWh
Filename: MASS_G3_SEMA_Fixed_Nov05-Oct06.csv

NYSERDA DG/CHP Integrated Database System Utility Rate Details
CDH Energy Corporation 358 September 25, 2008
National Grid - Massachusetts
Service Classification G-3 – General Service Time-of-Use – Southeastern Mass – Fixed Option – February 2006 to January 2007 This service is primarily available for large commercial and industrial customers with demand greater than 200 kW. This rate is for the Southeastern Massachusetts service area. Customer Charge $ 69.62 Periods Peak 8AM – 9PM, Monday-Friday Off-Peak All Hours not in the Peak Period Demand Charges $ per peak kW Distribution and Transition Demand Charges: $ 4.65 / kW
Energy Charges $ per total kWh in Period: Distribution Energy, Transmission, Transition Energy, Demand Side Management and Renewables Charges
Peak Energy: $ 0.02940 / kWh Off-Peak Energy: $ 0.01734 / kWh Fixed Pricing Option $ 0.11075 / kWh
Filename: MASS_G3_SEMA_Fixed_Feb06-Jan07.csv
National Grid - Massachusetts
Service Classification G-3 – General Service Time-of-Use – Southeastern Mass – Fixed Option – July 2007 to June 2008 This service is primarily available for large commercial and industrial customers with demand greater than 200 kW. This rate is for the Southeastern Massachusetts service area. Customer Charge $ 72.06 Periods Peak 8AM – 9PM, Monday-Friday Off-Peak All Hours not in the Peak Period Demand Charges $ per peak kW Distribution and Transition Demand Charges: $ 4.39 / kW
Energy Charges $ per total kWh in Period: Distribution Energy, Transmission, Transition Energy, Demand Side Management and Renewables Charges
Peak Energy: $ 0.02554 / kWh Off-Peak Energy: $ 0.012990 / kWh Fixed Pricing Option $ 0.13189 / kWh
Filename: MASS_G3_SEMA_Fixed_Jul07-Jun08.csv

NYSERDA DG/CHP Integrated Database System Utility Rate Details
CDH Energy Corporation 359 September 25, 2008
National Grid - Massachusetts
Service Classification G-3 – General Service Time-of-Use – Western and Central Mass – Variable Option – November 2005 to October 2006 This service is primarily available for large commercial and industrial customers with demand greater than 200 kW. This rate is for the Western and Central Massachusetts service area. Customer Charge $ 69.62 Periods Peak 8AM – 9PM, Monday-Friday Off-Peak All Hours not in the Peak Period Demand Charges $ per peak kW Distribution and Transition Demand Charges: $ 4.65 / kW
Energy Charges $ per total kWh in Period: Distribution Energy, Transmission, Transition Energy, Demand Side Management and Renewables Charges
Peak Energy: $ 0.02557 / kWh Off-Peak Energy: $ 0.01351 / kWh Variable Pricing Option1 $ per total kWh within defined period Jan Feb Mar Apr May Jun Jul Aug Sep Oct Nov Dec
$0.16124 $0.16895 $0.15286 $0.12612 $0.07308 $0.07622 $0.08229 $0.08657 $0.07634 $0.07551 $0.11492 $0.12475 1 – The Variable Pricing Option Charges are the historical charges from May 2005 – April 2006 as
available at the Mass. Electric Tariff webpage. Filename: MASS_G3_WCMA_Var_Nov05-Oct06.csv
National Grid - Massachusetts
Service Classification G-3 – General Service Time-of-Use – Western and Central Mass – Variable Option – February 2006 to January 2007 This service is primarily available for large commercial and industrial customers with demand greater than 200 kW. This rate is for the Western and Central Massachusetts service area. Customer Charge $ 69.62 Periods Peak 8AM – 9PM, Monday-Friday Off-Peak All Hours not in the Peak Period Demand Charges $ per peak kW Distribution and Transition Demand Charges: $ 4.65 / kW
Energy Charges $ per total kWh in Period: Distribution Energy, Transmission, Transition Energy, Demand Side Management and Renewables Charges
Peak Energy: $ 0.02940 / kWh Off-Peak Energy: $ 0.01734 / kWh Variable Pricing Option1 $ per total kWh within defined period Jan Feb Mar Apr May Jun Jul Aug Sep Oct Nov Dec
$0.13544 $0.16895 $0.15286 $0.12612 $0.07308 $0.07622 $0.08229 $0.08657 $0.07634 $0.07551 $0.07852 $0.10594 1 – The Variable Pricing Option Charges are the historical charges from May 2005 – April 2006 as
available at the Mass. Electric Tariff webpage. Filename: MASS_G3_WCMA_Var_Feb06-Jan07.csv

NYSERDA DG/CHP Integrated Database System Utility Rate Details
CDH Energy Corporation 360 September 25, 2008
National Grid - Massachusetts
Service Classification G-3 – General Service Time-of-Use – Western and Central Mass – Variable Option – July 2007 to June 2008 This service is primarily available for large commercial and industrial customers with demand greater than 200 kW. This rate is for the Western and Central Massachusetts service area. Customer Charge $ 72.06 Periods Peak 8AM – 9PM, Monday-Friday Off-Peak All Hours not in the Peak Period Demand Charges $ per peak kW Distribution and Transition Demand Charges: $ 4.39 / kW
Energy Charges $ per total kWh in Period: Distribution Energy, Transmission, Transition Energy, Demand Side Management and Renewables Charges
Peak Energy: $ 0.02554 / kWh Off-Peak Energy: $ 0.01299 / kWh Variable Pricing Option1 $ per total kWh within defined period Jan Feb Mar Apr May Jun Jul Aug Sep Oct Nov Dec
$0.11061 $0.10621 $0.09549 $0.09206 $0.11201 $0.11898 $0.10236 $0.10788 $0.09802 $0.10069 $0.08551 $0.09412 1 – The Variable Pricing Option Charges are the historical charges from July 2007 – June 2008 as
available at the Mass. Electric Tariff webpage. Filename: MASS_G3_WCMA_Var_Jul07-Jun08.csv
National Grid - Massachusetts
Service Classification G-3 – General Service Time-of-Use – Western and Central Mass – Fixed Option – November 2005 to October 2006 This service is primarily available for large commercial and industrial customers with demand greater than 200 kW. This rate is for the Western and Central Massachusetts service area. Customer Charge $ 69.62 Periods Peak 8AM – 9PM, Monday-Friday Off-Peak All Hours not in the Peak Period Demand Charges $ per peak kW Distribution and Transition Demand Charges: $ 4.65 / kW
Energy Charges $ per total kWh in Period: Distribution Energy, Transmission, Transition Energy, Demand Side Management and Renewables Charges
Peak Energy: $ 0.02557 / kWh Off-Peak Energy: $ 0.01351 / kWh Fixed Pricing Option $ 0.09429 / kWh
Filename: MASS_G3_WCMA_Fixed_Nov05-Oct06.csv

NYSERDA DG/CHP Integrated Database System Utility Rate Details
CDH Energy Corporation 361 September 25, 2008
National Grid - Massachusetts
Service Classification G-3 – General Service Time-of-Use – Western and Central Mass – Fixed Option – February 2006 to January 2007 This service is primarily available for large commercial and industrial customers with demand greater than 200 kW. This rate is for the Western and Central Massachusetts service area. Customer Charge $ 69.62 Periods Peak 8AM – 9PM, Monday-Friday Off-Peak All Hours not in the Peak Period Demand Charges $ per peak kW Distribution and Transition Demand Charges: $ 4.65 / kW
Energy Charges $ per total kWh in Period: Distribution Energy, Transmission, Transition Energy, Demand Side Management and Renewables Charges
Peak Energy: $ 0.02940 / kWh Off-Peak Energy: $ 0.01734 / kWh Fixed Pricing Option $ 0.10737 / kWh
Filename: MASS_G3_WCMA_Fixed_Feb06-Jan07.csv
National Grid - Massachusetts
Service Classification G-3 – General Service Time-of-Use – Western and Central Mass – Fixed Option – July 2007 to June 2008 This service is primarily available for large commercial and industrial customers with demand greater than 200 kW. This rate is for the Western and Central Massachusetts service area. Customer Charge $ 72.06 Periods Peak 8AM – 9PM, Monday-Friday Off-Peak All Hours not in the Peak Period Demand Charges $ per peak kW Distribution and Transition Demand Charges: $ 4.39 / kW
Energy Charges $ per total kWh in Period: Distribution Energy, Transmission, Transition Energy, Demand Side Management and Renewables Charges
Peak Energy: $ 0.02554 / kWh Off-Peak Energy: $ 0.01299 / kWh Fixed Pricing Option $ 0.12088 / kWh
Filename: MASS_G3_WCMA_Fixed_Jul07-Jun08.csv

NYSERDA DG/CHP Integrated Database System Utility Rate Details
CDH Energy Corporation 362 September 25, 2008
National Grid - Massachusetts
Service Classification G-3 – General Service Time-of-Use – Northeastern Mass – Variable Option – November 2005 to October 2006 This service is primarily available for large commercial and industrial customers with demand greater than 200 kW. This rate is for the Northeastern Massachusetts service area. Customer Charge $ 69.62 Periods Peak 8AM – 9PM, Monday-Friday Off-Peak All Hours not in the Peak Period Demand Charges $ per peak kW Distribution and Transition Demand Charges: $ 4.65 / kW
Energy Charges $ per total kWh in Period: Distribution Energy, Transmission, Transition Energy, Demand Side Management and Renewables Charges
Peak Energy: $ 0.02557 / kWh Off-Peak Energy: $ 0.01351 / kWh Variable Pricing Option1 $ per total kWh within defined period Jan Feb Mar Apr May Jun Jul Aug Sep Oct Nov Dec
$0.17010 $0.17234 $0.15679 $0.12730 $0.07382 $0.07680 $0.08266 $0.08524 $0.07498 $0.07502 $0.12413 $0.12876 1 – The Variable Pricing Option Charges are the historical charges from May 2005 – April 2006 as
available at the Mass. Electric Tariff webpage. Filename: MASS_G3_NEMA_Var_Nov05-Oct06.csv
National Grid - Massachusetts
Service Classification G-3 – General Service Time-of-Use – Northeastern Mass – Variable Option – February 2006 to January 2007 This service is primarily available for large commercial and industrial customers with demand greater than 200 kW. This rate is for the Northeastern Massachusetts service area. Customer Charge $ 69.62 Periods Peak 8AM – 9PM, Monday-Friday Off-Peak All Hours not in the Peak Period Demand Charges $ per peak kW Distribution and Transition Demand Charges: $ 4.65 / kW
Energy Charges $ per total kWh in Period: Distribution Energy, Transmission, Transition Energy, Demand Side Management and Renewables Charges
Peak Energy: $ 0.02940 / kWh Off-Peak Energy: $ 0.01734 / kWh Variable Pricing Option1 $ per total kWh within defined period Jan Feb Mar Apr May Jun Jul Aug Sep Oct Nov Dec
$0.14079 $0.17234 $0.15679 $0.12730 $0.07382 $0.07680 $0.08266 $0.08524 $0.07498 $0.07502 $0.08373 $0.11089 1 – The Variable Pricing Option Charges are the historical charges from May 2005 – April 2006 as
available at the Mass. Electric Tariff webpage. Filename: MASS_G3_NEMA_Var_Feb06-Jan07.csv

NYSERDA DG/CHP Integrated Database System Utility Rate Details
CDH Energy Corporation 363 September 25, 2008
National Grid - Massachusetts
Service Classification G-3 – General Service Time-of-Use – Northeastern Mass – Variable Option – December 2006 to November 2007 This service is primarily available for large commercial and industrial customers with demand greater than 200 kW. This rate is for the Northeastern Massachusetts service area. Customer Charge $ 70.72 Periods
Peak
January 1 – March 10: 8AM – 9PM, Monday-Friday March 11 – March 31: 9AM – 10PM, Monday-Friday April 1 – October 27: 8AM – 9PM, Monday-Friday October 28 – November 3: 7AM – 8PM, Monday-Friday November 4 – December 31: 8AM – 9PM, Monday-Friday
Off-Peak All Hours not in the Peak Period Demand Charges $ per peak kW Distribution and Transition Demand Charges: $ 9.06 / kW
Energy Charges $ per total kWh in Period: Distribution Energy, Transmission, Transition Energy, Demand Side Management and Renewables Charges
Peak Energy: $ 0.04111 / kWh Off-Peak Energy: $ 0.02868 / kWh Variable Pricing Option1 $ per total kWh within defined period Jan Feb Mar Apr May Jun Jul Aug Sep Oct Nov Dec
$0.14107 $0.11804 $0.10803 $0.10406 $0.09403 $0.09878 $0.10435 $0.10990 $0.10099 $0.10435 $0.08718 $0.11117 1 – The Variable Pricing Option Charges are the historical charges from May 2005 – April 2006 as
available at the Mass. Electric Tariff webpage. Filename: MASS_G3_NEMA_Var_Dec06-Nov07.csv

NYSERDA DG/CHP Integrated Database System Utility Rate Details
CDH Energy Corporation 364 September 25, 2008
National Grid - Massachusetts
Service Classification G-3 – General Service Time-of-Use – Northeastern Mass – Variable Option – July 2007 to June 2008 This service is primarily available for large commercial and industrial customers with demand greater than 200 kW. This rate is for the Northeastern Massachusetts service area. Customer Charge $ 72.06 Periods
Peak
January 1 – March 10: 8AM – 9PM, Monday-Friday March 11 – March 31: 9AM – 10PM, Monday-Friday April 1 – October 27: 8AM – 9PM, Monday-Friday October 28 – November 3: 7AM – 8PM, Monday-Friday November 4 – December 31: 8AM – 9PM, Monday-Friday
Off-Peak All Hours not in the Peak Period Demand Charges $ per peak kW Distribution and Transition Demand Charges: $ 4.39 / kW
Energy Charges $ per total kWh in Period: Distribution Energy, Transmission, Transition Energy, Demand Side Management and Renewables Charges
Peak Energy: $ 0.02554 / kWh Off-Peak Energy: $ 0.01299 / kWh Variable Pricing Option1 $ per total kWh within defined period Jan Feb Mar Apr May Jun Jul Aug Sep Oct Nov Dec
$0.11137 $0.10801 $0.09905 $0.09597 $0.11592 $0.12139 $0.10435 $0.10990 $0.10099 $0.10435 $0.08718 $0.09555 1 – The Variable Pricing Option Charges are the historical charges from July 2007 – June 2008 as
available at the Mass. Electric Tariff webpage. Filename: MASS_G3_NEMA_Var_Jul07-Jun08.csv
National Grid - Massachusetts
Service Classification G-3 – General Service Time-of-Use – Northeastern Mass – Fixed Option – November 2005 to October 2006 This service is primarily available for large commercial and industrial customers with demand greater than 200 kW. This rate is for the Northeastern Massachusetts service area. Customer Charge $ 69.62 Periods Peak 8AM – 9PM, Monday-Friday Off-Peak All Hours not in the Peak Period Demand Charges $ per peak kW Distribution and Transition Demand Charges: $ 4.65 / kW
Energy Charges $ per total kWh in Period: Distribution Energy, Transmission, Transition Energy, Demand Side Management and Renewables Charges
Peak Energy: $ 0.02557 / kWh Off-Peak Energy: $ 0.01351 / kWh Fixed Pricing Option $ 0.09730 / kWh
Filename: MASS_G3_NEMA_Fixed_Nov05-Oct06.csv

NYSERDA DG/CHP Integrated Database System Utility Rate Details
CDH Energy Corporation 365 September 25, 2008
National Grid - Massachusetts
Service Classification G-3 – General Service Time-of-Use – Northeastern Mass – Fixed Option – February 2006 to January 2007 This service is primarily available for large commercial and industrial customers with demand greater than 200 kW. This rate is for the Northeastern Massachusetts service area. Customer Charge $ 69.62 Periods Peak 8AM – 9PM, Monday-Friday Off-Peak All Hours not in the Peak Period Demand Charges $ per peak kW Distribution and Transition Demand Charges: $ 4.65 / kW
Energy Charges $ per total kWh in Period: Distribution Energy, Transmission, Transition Energy, Demand Side Management and Renewables Charges
Peak Energy: $ 0.02940 / kWh Off-Peak Energy: $ 0.01734 / kWh Fixed Pricing Option $ 0.11254 / kWh
Filename: MASS_G3_NEMA_Fixed_Feb06-Jan07.csv
National Grid - Massachusetts
Service Classification G-3 – General Service Time-of-Use – Northeastern Mass – Fixed Option – July 2007 to June 2008 This service is primarily available for large commercial and industrial customers with demand greater than 200 kW. This rate is for the Northeastern Massachusetts service area. Customer Charge $ 72.06 Periods Peak 8AM – 9PM, Monday-Friday Off-Peak All Hours not in the Peak Period Demand Charges $ per peak kW Distribution and Transition Demand Charges: $ 4.39 / kW
Energy Charges $ per total kWh in Period: Distribution Energy, Transmission, Transition Energy, Demand Side Management and Renewables Charges
Peak Energy: $ 0.02554 / kWh Off-Peak Energy: $ 0.01299 / kWh Fixed Pricing Option $ 0.12380 / kWh
Filename: MASS_G3_NEMA_Fixed_Jul07-Jun08.csv

NYSERDA DG/CHP Integrated Database System Utility Rate Details
CDH Energy Corporation 366 September 25, 2008
Complete National Grid – Rhode Island Electric Tariff
The National Grid – Rhode Island rates are up-to-date as of June 2008.
National Grid – Rhode Island
Service Classification B-32 – C&I Supplemental – Standard Option – November 2005 to October 2006 This service shall apply to Customers who receive all or any portion of their electric supply from non-emergency generation unit(s) with a nameplate rating greater than 30 kW (“Generation Units”), where electricity received by the Customer from the Generation Units is not being delivered over Company-owned distribution facilities pursuant to an applicable retail delivery tariff. Demand Charges $ per peak kW Distribution and Transition Demand Charges: $ 6.42 / kW
Energy Charges $ per total kWh in Period: Distribution Energy, Transmission Adjustment, Transition Energy, C&LM Adjustment and Energy Supply Charges
Energy Charges: $ 0.12065 / kWh Filename: NARR_B32_Supp_Std_Nov05-Oct06.csv
National Grid – Rhode Island
Service Classification B-32 – C&I Supplemental – Standard Option – January 2007 This service shall apply to Customers who receive all or any portion of their electric supply from non-emergency generation unit(s) with a nameplate rating greater than 30 kW (“Generation Units”), where electricity received by the Customer from the Generation Units is not being delivered over Company-owned distribution facilities pursuant to an applicable retail delivery tariff. Demand Charges $ per peak kW Distribution and Transition Demand Charges: $ 6.40 / kW
Energy Charges $ per total kWh in Period: Distribution Energy, Transmission Adjustment, Transition Energy, C&LM Adjustment and Energy Supply Charges
Energy Charges: $ 0.11465 / kWh Filename: NARR_B32_Supp_Std_Jan07.csv
National Grid – Rhode Island
Service Classification B-32 – C&I Supplemental – Standard Option – June 2008 This service shall apply to Customers who receive all or any portion of their electric supply from non-emergency generation unit(s) with a nameplate rating greater than 30 kW (“Generation Units”), where electricity received by the Customer from the Generation Units is not being delivered over Company-owned distribution facilities pursuant to an applicable retail delivery tariff. Demand Charges $ per peak kW Distribution and Transition Demand Charges: $ 6.39 / kW
Energy Charges $ per total kWh in Period: Distribution Energy, Transmission Adjustment, Transition Energy, C&LM Adjustment and Energy Supply Charges
Energy Charges: $ 0.11382 / kWh Filename: NARR_B32_Supp_Std_Jun08.csv

NYSERDA DG/CHP Integrated Database System Utility Rate Details
CDH Energy Corporation 367 September 25, 2008
National Grid – Rhode Island
Service Classification B-62 – 3000 kW Supplemental – Standard Option – January 2006 Electric delivery service under this rate is applicable to those Customers who would otherwise be served under the Company’s 3,000 kW Demand Rate G-62 if the Generation Units were not supplying electricity to the Customer. Demand Charges $ per peak kW Distribution and Transition Demand Charges: $ 3.65 / kW
Energy Charges $ per total kWh in Period: Distribution Energy, Transmission, Transition Energy, Conservation and Energy Supply Charges
Energy Charges: $ 0.11176 / kWh Filename: NARR_G62_ Supp_Std_Jan06.csv
National Grid – Rhode Island
Service Classification B-62 – 3000 kW Supplemental – Standard Option – January 2007 Electric delivery service under this rate is applicable to those Customers who would otherwise be served under the Company’s 3,000 kW Demand Rate G-62 if the Generation Units were not supplying electricity to the Customer. Demand Charges $ per peak kW Distribution and Transition Demand Charges: $ 3.64 / kW
Energy Charges $ per total kWh in Period: Distribution Energy, Transmission, Transition Energy, Conservation and Energy Supply Charges
Energy Charges: $ 0.10576 / kWh Filename: NARR_G62_ Supp_Std_Jan07.csv
National Grid – Rhode Island
Service Classification B-62 – 3000 kW Supplemental – Standard Option – December 2007 Electric delivery service under this rate is applicable to those Customers who would otherwise be served under the Company’s 3,000 kW Demand Rate G-62 if the Generation Units were not supplying electricity to the Customer. Demand Charges $ per peak kW Distribution and Transition Demand Charges: $ 3.64 / kW
Energy Charges $ per total kWh in Period: Transmission Adjustment, Transition, Conservation, Energy Supply and Renewable Standard Energy Charges
Energy Charges: $ 0.09625 / kWh Filename: NARR_G62_ Supp_Std_Dec07.csv

NYSERDA DG/CHP Integrated Database System Utility Rate Details
CDH Energy Corporation 368 September 25, 2008
National Grid – Rhode Island
Service Classification B-62 – 3000 kW Supplemental – Standard Option – June 2008 Electric delivery service under this rate is applicable to those Customers who would otherwise be served under the Company’s 3,000 kW Demand Rate G-62 if the Generation Units were not supplying electricity to the Customer. Demand Charges $ per peak kW Distribution and Transition Demand Charges: $ 3.63 / kW
Energy Charges $ per total kWh in Period: Transmission Adjustment, Transition, Conservation, Energy Supply and Renewable Standard Energy Charges
Energy Charges: $ 0.09477/ kWh Filename: NARR_G62_ Supp_Std_Jun08.csv
National Grid – Rhode Island
Service Classification G-32 – 200 kW Demand – Standard Option – November 2005 to October 2006 This service is primarily available for large commercial and industrial customers with a 12-month average demand of 200 kW or greater. The standard offer service energy rate was last revised on January 1, 2006. Customer Charge $ 236.42 Demand Charges $ per peak kW Distribution and Transition Demand Charges: $ 3.29 / kW
Energy Charges $ per total kWh in Period: Distribution Energy, Transmission, Transition Energy, Conservation and Energy Supply Charges
Energy Charges: $ 0.12065 / kWh Filename: NARR_G32_Std_Nov05-Oct06.csv
National Grid – Rhode Island
Service Classification G-32 – 200 kW Demand – Standard Option – January 2007 This service is primarily available for large commercial and industrial customers with a 12-month average demand of 200 kW or greater. The standard offer service energy rate was last revised on January 1, 2006. Customer Charge $ 236.42 Demand Charges $ per peak kW Distribution and Transition Demand Charges: $ 3.28 / kW
Energy Charges $ per total kWh in Period: Distribution Energy, Transmission, Transition Energy, Conservation and Energy Supply Charges
Energy Charges: $ 0.11465 / kWh Filename: NARR_G32_Std_Jan07.csv

NYSERDA DG/CHP Integrated Database System Utility Rate Details
CDH Energy Corporation 369 September 25, 2008
National Grid – Rhode Island
Service Classification G-32 – 200 kW Demand – Standard Option – June 2008 This service is primarily available for large commercial and industrial customers with a 12-month average demand of 200 kW or greater. The standard offer service energy rate was last revised on January 1, 2007. Customer Charge $ 236.43 Demand Charges $ per peak kW Distribution and Transition Demand Charges: $ 3.27 / kW
Energy Charges $ per total kWh in Period: Distribution Energy, Transmission, Transition Energy, Conservation and Energy Supply Charges
Energy Charges: $ 0.11182 / kWh Filename: NARR_G32_Std_Jun08.csv
National Grid – Rhode Island
Service Classification G-62 – 3000 kW Demand – Standard Option – January 2006 This service is primarily available for large commercial and industrial customers with a 12-month maximum demand of 3,000 kW or greater. The standard offer service energy rate was last revised on January 1, 2006. Customer Charge $ 17,118.72 Demand Charges $ per peak kW Distribution and Transition Demand Charges: $ 3.65 / kW
Energy Charges $ per total kWh in Period: Distribution Energy, Transmission, Transition Energy, Conservation and Energy Supply Charges
Energy Charges: $ 0.11176 / kWh Filename: NARR_G62_Std_Jan06.csv
National Grid – Rhode Island
Service Classification G-62 – 3000 kW Demand – Standard Option – January 2007 This service is primarily available for large commercial and industrial customers with a 12-month maximum demand of 3,000 kW or greater. The standard offer service energy rate was last revised on January 1, 2006. Customer Charge $ 17,118.72 Demand Charges $ per peak kW Distribution and Transition Demand Charges: $ 3.64 / kW
Energy Charges $ per total kWh in Period: Distribution Energy, Transmission, Transition Energy, Conservation and Energy Supply Charges
Energy Charges: $ 0.10576 / kWh Filename: NARR_G62_Std_Jan07.csv

NYSERDA DG/CHP Integrated Database System Utility Rate Details
CDH Energy Corporation 370 September 25, 2008
National Grid – Rhode Island
Service Classification G-62 – 3000 kW Demand – Standard Option – December 2007 This service is primarily available for large commercial and industrial customers with a 12-month maximum demand of 3,000 kW or greater. The standard offer service energy rate was last revised on December 1, 2007. Customer Charge $ 17,118.72 Demand Charges $ per peak kW Distribution and Transition Demand Charges: $ 3.64 / kW
Energy Charges $ per total kWh in Period: Transmission Adjustment, Transition, Conservation, Energy Supply and Renewable Standard Energy Charges
Energy Charges: $ 0.09625 / kWh Filename: NARR_G62_Std_Dec07.csv
National Grid – Rhode Island
Service Classification G-62 – 3000 kW Demand – Standard Option – June 2008 This service is primarily available for large commercial and industrial customers with a 12-month maximum demand of 3,000 kW or greater. The standard offer service energy rate was last revised on January 1, 2007. Customer Charge $ 17,118.72 Demand Charges $ per peak kW Distribution and Transition Demand Charges: $ 3.63 / kW
Energy Charges $ per total kWh in Period: Transmission Adjustment, Transition, Conservation, Energy Supply and Renewable Standard Energy Charges
Energy Charges: $ 0.10293 / kWh Filename: NARR_G62_Std_Jun08.csv

NYSERDA DG/CHP Integrated Database System Utility Rate Details
CDH Energy Corporation 371 September 25, 2008
Complete Connecticut Light and Power Tariff
The Connecticut Light and Power rates are up-to-date as of June 2008.
Connecticut Light and Power
Rate 1 – Residential Electric Service – October 2006 Available for the entire electrical requirements of single-family residences, residential outbuildings, individual apartments (defined as a room or group of rooms with separate cooking facilities), and general service use in apartment buildings, where residential use constitutes over 50 percent of the metered energy, and also available to farm customers. Customer Charge $ 9.75 Energy Charges $ per total kWh Distribution, Transmission, Competitive Transition Assessment, Conservation, Renewable Energy, Supplier Service, FMCC Delivery, FMCC Generation and EAC Generation Charges: $ 0.16689 / kWh
Filename: CLP_R1_Oct06.csv
Connecticut Light and Power
Rate 1 – Residential Electric Service – June 2008 Available for the entire electrical requirements of single-family residences, residential outbuildings, individual apartments (defined as a room or group of rooms with separate cooking facilities), and general service use in apartment buildings, where residential use constitutes over 50 percent of the metered energy, and also available to farm customers. Customer Charge $ 15.00 Energy Charges $ per total kWh Distribution, Transmission, Competitive Transition Assessment, Conservation, Renewable Energy, Supplier Service, FMCC Delivery, FMCC Generation and EAC Generation Charges: $ 0.16238 / kWh
Filename: CLP_R1_Jun08.csv

NYSERDA DG/CHP Integrated Database System Utility Rate Details
CDH Energy Corporation 372 September 25, 2008
Connecticut Light and Power
Rate 5 – Residential Electric Heating Service – October 2006 Available for the entire electrical requirements of single-family residences, residential outbuildings, individual apartments (defined as a room or group of rooms with separate cooking facilities), and general service use in apartment buildings, where residential use constitutes over 50 percent of the metered energy, and also available to farm customers. Customer Charge $ 12.30 Energy Charges $ per total kWh Distribution, Transmission, Competitive Transition Assessment, Conservation, Renewable Energy, Supplier Service, FMCC Delivery, FMCC Generation and EAC Generation Charges: $ 0.15028 / kWh
Filename: CLP_R5_Oct06.csv
Connecticut Light and Power
Rate 5 – Residential Electric Heating Service – June 2008 Available for the entire electrical requirements of single-family residences, residential outbuildings, individual apartments (defined as a room or group of rooms with separate cooking facilities), and general service use in apartment buildings, where residential use constitutes over 50 percent of the metered energy, and also available to farm customers. Customer Charge $ 19.00 Energy Charges $ per total kWh Distribution, Transmission, Competitive Transition Assessment, Conservation, Renewable Energy, Supplier Service, FMCC Delivery, FMCC Generation and EAC Generation Charges: $ 0.16115 / kWh
Filename: CLP_R5_Jun08.csv
Connecticut Light and Power
Rate 7 – Residential Time-of-Day Electric Service – October 2006 Available for the entire electrical requirements of single-family residences, residential outbuildings, individual apartments (defined as a room or group of rooms with separate cooking facilities), and general service use in apartment buildings, where residential use constitutes over 50 percent of the metered energy, and also available to farm customers. Customer Charge $ 11.00 Periods On-Peak 8AM – 8PM, Monday-Friday Off-Peak All Hours not in the Peak Period
Energy Charges
$ per total kWh in Period: Distribution, Transmission, Competitive Transition Assessment, Conservation, Renewable Energy, Supplier Service, FMCC Delivery, FMCC Generation and EAC Generation Charges
On-Peak Energy: $ 0.14596 / kWh Off-Peak Energy: $ 0.18096 / kWh
Filename: CLP_R7_Oct06.csv

NYSERDA DG/CHP Integrated Database System Utility Rate Details
CDH Energy Corporation 373 September 25, 2008
Connecticut Light and Power
Rate 7 – Residential Time-of-Day Electric Service – June 2008 Available for the entire electrical requirements of single-family residences, residential outbuildings, individual apartments (defined as a room or group of rooms with separate cooking facilities), and general service use in apartment buildings, where residential use constitutes over 50 percent of the metered energy, and also available to farm customers. Customer Charge $ 15.00 Periods On-Peak 8AM – 8PM, Monday-Friday Off-Peak All Hours not in the Peak Period
Energy Charges
$ per total kWh in Period: Distribution, Transmission, Competitive Transition Assessment, Conservation, Renewable Energy, Supplier Service, FMCC Delivery, FMCC Generation and EAC Generation Charges
On-Peak Energy: $ 0.18863 / kWh Off-Peak Energy: $ 0.15363 / kWh
Filename: CLP_R7_Jun08.csv
Connecticut Light and Power
Rate 27 – Small Time-of-Day General Electric Service – October 2006 Available for the entire electrical requirements at a single service location measured through one metering installation where the customer’s maximum demand is less than 350 kW. Customer Charge $ 35.14 Periods On-Peak 7AM – 11PM, Monday-Friday Off-Peak All Hours not in the Peak Period Demand Charges $ per peak over 2 kW Distribution, Transmission and Competitive Transition Assessment Charges $ 7.31 / kW
Energy Charges
$ per total kWh in Period: Distribution, Competitive Transition Assessment, Conservation, Renewable Energy, Supplier Service, FMCC Delivery, FMCC Generation and EAC Generation Charges
On-Peak Energy: $ 0.16954 / kWh Off-Peak Energy: $ 0.14903 / kWh
Filename: CLP_R27_Oct06.csv

NYSERDA DG/CHP Integrated Database System Utility Rate Details
CDH Energy Corporation 374 September 25, 2008
Connecticut Light and Power
Rate 27 – Small Time-of-Day General Electric Service – June 2008 Available for the entire electrical requirements at a single service location measured through one metering installation where the customer’s maximum demand is less than 350 kW. Customer Charge $ 37.50 Periods On-Peak 7AM – 11PM, Monday-Friday Off-Peak All Hours not in the Peak Period Demand Charges $ per peak over 2 kW Distribution, Transmission and Competitive Transition Assessment Charges $ 9.13 / kW
Energy Charges
$ per total kWh in Period: Distribution, Competitive Transition Assessment, Conservation, Renewable Energy, Supplier Service, FMCC Delivery, FMCC Generation and EAC Generation Charges
On-Peak Energy: $ 0.18566 / kWh Off-Peak Energy: $ 0.13515 / kWh
Filename: CLP_R27_Jun08.csv
Connecticut Light and Power
Rate 30 – Small General Electric Service – October 2006 Available for the entire electrical requirements at a single service location measured through one metering installation where the customer’s maximum demand is less than 350 kW. Where the Company deems it impractical to deliver electricity through one service, or where more than one meter has been installed for billing under a withdrawn rate, then the measurement of electricity may be by two or more meters. Customer Charge $ 24.05 Demand Charges $ per peak over 2 kW Distribution, Transmission and Competitive Transition Assessment Charges $ 7.49 / kW
Energy Charges
$ per total kWh in Period: Distribution, Competitive Transition Assessment, Conservation, Renewable Energy, Supplier Service, FMCC Delivery, FMCC Generation and EAC Generation Charges
All Hours $ 0.13040 / kWh Filename: CLP_R30_Oct06.csv

NYSERDA DG/CHP Integrated Database System Utility Rate Details
CDH Energy Corporation 375 September 25, 2008
Connecticut Light and Power
Rate 30 – Small General Electric Service – June 2008 Available for the entire electrical requirements at a single service location measured through one metering installation where the customer’s maximum demand is less than 350 kW. Where the Company deems it impractical to deliver electricity through one service, or where more than one meter has been installed for billing under a withdrawn rate, then the measurement of electricity may be by two or more meters. Customer Charge $ 37.50 Demand Charges $ per peak over 2 kW Distribution, Transmission and Competitive Transition Assessment Charges $ 9.13 / kW
Energy Charges
$ per total kWh in Period: Distribution, Competitive Transition Assessment, Conservation, Renewable Energy, Supplier Service, FMCC Delivery, FMCC Generation and EAC Generation Charges
All Hours $ 0.12906 / kWh Filename: CLP_R30_Jun08.csv
Connecticut Light and Power
Rate 55 – Intermediate Time-of-Day – Manufacturers – October 2006 This rate is for customers who are manufacturers and whose demand equaled or exceeded in the last twelve months 350 kW but less than 1,000 kW. Customer Charge $ 361.29 Periods On-Peak 7AM – 11PM, Monday-Friday Off-Peak All Hours not in the Peak Period Demand Charges $ per peak kW Distribution, Production/Transmission, Transmission Service and Competitive Transition Demand Charges: $ 9.19 / kW
Energy Charges $ per total kWh in Period: Distribution, Competitive Transition, Transmission, Conservation, Renewable Energy and Supplier Service Charges
On-Peak Energy: $ 0.06543 / kWh Off-Peak Energy: $ 0.05096 / kWh
Note: The Reactive Demand Credit is ignored in application of this rate. In order to qualify for the credit, a facility’s power factor would have to exceed 0.97.
Filename: CLP_R55_Oct06.csv

NYSERDA DG/CHP Integrated Database System Utility Rate Details
CDH Energy Corporation 376 September 25, 2008
Connecticut Light and Power
Rate 55 – Intermediate Time-of-Day – Manufacturers – June 2008 This rate is for customers who are manufacturers and whose demand equaled or exceeded in the last twelve months 350 kW but less than 1,000 kW. Customer Charge $ 400.00 Periods On-Peak 7AM – 11PM, Monday-Friday Off-Peak All Hours not in the Peak Period Demand Charges $ per peak kW Distribution, Production/Transmission, Transmission Service and Competitive Transition Demand Charges: $ 10.82 / kW
Energy Charges $ per total kWh in Period: Distribution, Competitive Transition, Transmission, Conservation, Renewable Energy and Supplier Service Charges
On-Peak Energy: $ 0.14727/ kWh Off-Peak Energy: $ 0.11727 / kWh
Note: The Reactive Demand Credit is ignored in application of this rate. In order to qualify for the credit, a facility’s power factor would have to exceed 0.97.
Filename: CLP_R55_Jun08.csv
Connecticut Light and Power
Rate 56 – Intermediate Time-of-Day – Non-Manufacturers – October 2006 This rate is for customers who are not manufacturers and whose demand equaled or exceeded in the last twelve months 350 kW but less than 1,000 kW. Customer Charge $ 377.75 Periods On-Peak 7AM – 11PM, Monday-Friday Off-Peak All Hours not in the Peak Period Demand Charges $ per peak kW Distribution, Production/Transmission, Transmission Service and Competitive Transition Demand Charges: $ 9.52 / kW
Energy Charges $ per total kWh in Period: Distribution, Competitive Transition, Transmission, Conservation, Renewable Energy and Supplier Service Charges
On-Peak Energy: $ 0.06873 / kWh Off-Peak Energy: $ 0.05451 / kWh
Note: The Reactive Demand Credit is ignored in application of this rate. In order to qualify for the credit, a facility’s power factor would have to exceed 0.97.
Filename: CLP_R56_Oct06.csv

NYSERDA DG/CHP Integrated Database System Utility Rate Details
CDH Energy Corporation 377 September 25, 2008
Connecticut Light and Power
Rate 56 – Intermediate Time-of-Day – Non-Manufacturers – June 2008 This rate is for customers who are not manufacturers and whose demand equaled or exceeded in the last twelve months 350 kW but less than 1,000 kW. Customer Charge $ 420.00 Periods On-Peak 7AM – 11PM, Monday-Friday Off-Peak All Hours not in the Peak Period Demand Charges $ per peak kW Distribution, Production/Transmission, Transmission Service and Competitive Transition Demand Charges: $ 11.93 / kW
Energy Charges $ per total kWh in Period: Distribution, Competitive Transition, Transmission, Conservation, Renewable Energy and Supplier Service Charges
On-Peak Energy: $ 0.11724 / kWh Off-Peak Energy: $ 0.14743 / kWh
Note: The Reactive Demand Credit is ignored in application of this rate. In order to qualify for the credit, a facility’s power factor would have to exceed 0.97.
Filename: CLP_R56_Jun08.csv
Connecticut Light and Power
Rate 57 – Large Time-of-Day – Manufacturers – below 2000 kW – October 2006 This rate is for customers who are manufacturers and whose demand exceeded in the last twelve months 1,000 kW but less than 2,000 kW. Customer Charge $ 850.99 Periods On-Peak 7AM – 11PM, Monday-Friday Off-Peak All Hours not in the Peak Period Demand Charges $ per peak kVA Distribution, Transmission Service and Competitive Transition Demand Charges: $ 6.99 / kVA
Energy Charges $ per total kWh in Period: Distribution, Competitive Transition, Transmission, Conservation, Renewable Energy and Supplier Service Charges
On-Peak Energy: $ 0.06799 / kWh Off-Peak Energy: $ 0.04892 / kWh
Filename: CLP_R57_lt2000_Oct06.csv

NYSERDA DG/CHP Integrated Database System Utility Rate Details
CDH Energy Corporation 378 September 25, 2008
Connecticut Light and Power
Rate 57 – Large Time-of-Day – Manufacturers – below 2000 kW – June 2008 This rate is for customers who are manufacturers and whose demand exceeded in the last twelve months 1,000 kW but less than 2,000 kW. Customer Charge $ 950.00 Periods On-Peak 7AM – 11PM, Monday-Friday Off-Peak All Hours not in the Peak Period Demand Charges $ per peak kVA Distribution, Transmission Service and Competitive Transition Demand Charges: $ 8.73 / kVA
Energy Charges $ per total kWh in Period: Distribution, Competitive Transition, Transmission, Conservation, Renewable Energy and Supplier Service Charges
On-Peak Energy: $ 0.11044 / kWh Off-Peak Energy: $ 0.11044 / kWh
Filename: CLP_R57_lt2000_Jun08.csv
Connecticut Light and Power
Rate 57 – Large Time-of-Day – Manufacturers – 2000 to 5000 kW – October 2006 This rate is for customers who are manufacturers and whose demand exceeded in the last twelve months 2,000 kW but less than 5,000 kW. Customer Charge $ 1,808.07 Periods On-Peak 7AM – 11PM, Monday-Friday Off-Peak All Hours not in the Peak Period Demand Charges $ per peak kVA Distribution, Transmission Service and Competitive Transition Demand Charges: $ 6.99 / kVA
Energy Charges $ per total kWh in Period: Distribution, Competitive Transition, Transmission, Conservation, Renewable Energy and Supplier Service Charges
On-Peak Energy: $ 0.06799 / kWh Off-Peak Energy: $ 0.04892 / kWh
Filename: CLP_R57_2000to5000_Oct06.csv

NYSERDA DG/CHP Integrated Database System Utility Rate Details
CDH Energy Corporation 379 September 25, 2008
Connecticut Light and Power
Rate 57 – Large Time-of-Day – Manufacturers – 2000 to 5000 kW –June 2008 This rate is for customers who are manufacturers and whose demand exceeded in the last twelve months 2,000 kW but less than 5,000 kW. Customer Charge $ 2,000.00 Periods On-Peak 7AM – 11PM, Monday-Friday Off-Peak All Hours not in the Peak Period Demand Charges $ per peak kVA Distribution, Transmission Service and Competitive Transition Demand Charges: $ 8.73 / kVA
Energy Charges $ per total kWh in Period: Distribution, Competitive Transition, Transmission, Conservation, Renewable Energy and Supplier Service Charges
On-Peak Energy: $ 0.11044 / kWh Off-Peak Energy: $ 0.11044 / kWh
Filename: CLP_R57_2000to5000_Jun08.csv
Connecticut Light and Power
Rate 57 – Large Time-of-Day – Manufacturers – above 5000 kW – October 2006 This rate is for customers who are manufacturers and whose demand exceeded in the last twelve months 5,000 kW. Customer Charge $ 3,616.15 Periods On-Peak 7AM – 11PM, Monday-Friday Off-Peak All Hours not in the Peak Period Demand Charges $ per peak kVA Distribution, Transmission Service and Competitive Transition Demand Charges: $ 6.99 / kVA
Energy Charges $ per total kWh in Period: Distribution, Competitive Transition, Transmission, Conservation, Renewable Energy and Supplier Service Charges
On-Peak Energy: $ 0.06799 / kWh Off-Peak Energy: $ 0.04892 / kWh
Filename: CLP_R57_gt5000_Oct06.csv

NYSERDA DG/CHP Integrated Database System Utility Rate Details
CDH Energy Corporation 380 September 25, 2008
Connecticut Light and Power
Rate 57 – Large Time-of-Day – Manufacturers – above 5000 kW – June 2008 This rate is for customers who are manufacturers and whose demand exceeded in the last twelve months 5,000 kW. Customer Charge $ 4,000.00 Periods On-Peak 7AM – 11PM, Monday-Friday Off-Peak All Hours not in the Peak Period Demand Charges $ per peak kVA Distribution, Transmission Service and Competitive Transition Demand Charges: $ 8.73 / kVA
Energy Charges $ per total kWh in Period: Distribution, Competitive Transition, Transmission, Conservation, Renewable Energy and Supplier Service Charges
On-Peak Energy: $ 0.11094 / kWh Off-Peak Energy: $ 0.11094 / kWh
Filename: CLP_R57_gt5000_Jun08.csv
Connecticut Light and Power
Rate 58 – Large Time-of-Day – Non-Manufacturers – below 2000 kW – October 2006 This rate is for customers who are non-manufacturers and whose demand exceeded in the last twelve months 1,000 kW but less than 2,000 kW. Customer Charge $ 926.27 Periods On-Peak 7AM – 11PM, Monday-Friday Off-Peak All Hours not in the Peak Period Demand Charges $ per peak kVA Distribution, Prod/Tran. Demand, Transmission Service and Competitive Transition Demand Charges: $ 9.11 / kVA
Energy Charges
$ per total kWh in Period: Distribution, Competitive Transition, Transmission, Conservation, Renewable Energy, FMCC Delivery, Transmission Adjustment, EAC Generation and Supplier Service Charges
On-Peak Energy: $ 0.10714 / kWh Off-Peak Energy: $ 0.08803 / kWh
Filename: CLP_R58_lt2000_Oct06.csv

NYSERDA DG/CHP Integrated Database System Utility Rate Details
CDH Energy Corporation 381 September 25, 2008
Connecticut Light and Power
Rate 58 – Large Time-of-Day – Non-Manufacturers – below 2000 kW – June 2008 This rate is for customers who are non-manufacturers and whose demand exceeded in the last twelve months 1,000 kW but less than 2,000 kW. Customer Charge $ 1,025.00 Periods On-Peak 7AM – 11PM, Monday-Friday Off-Peak All Hours not in the Peak Period Demand Charges $ per peak kVA Distribution, Prod/Tran. Demand, Transmission Service and Competitive Transition Demand Charges: $ 10.52 / kVA
Energy Charges
$ per total kWh in Period: Distribution, Competitive Transition, Transmission, Conservation, Renewable Energy, FMCC Delivery, Transmission Adjustment, EAC Generation and Supplier Service Charges
On-Peak Energy: $ 0.11589 / kWh Off-Peak Energy: $ 0.11589 / kWh
Filename: CLP_R58_lt2000_Jun08.csv
Connecticut Light and Power
Rate 58– Large Time-of-Day – Non-Manufacturers – 2000 to 5000 kW – October 2006 This rate is for customers who are non-manufacturers and whose demand exceeded in the last twelve months 2,000 kW but less than 5,000 kW. Customer Charge $ 1,909.64 Periods On-Peak 7AM – 11PM, Monday-Friday Off-Peak All Hours not in the Peak Period Demand Charges $ per peak kVA Distribution, Prod/Tran. Demand, Transmission Service and Competitive Transition Demand Charges: $ 9.11 / kVA
Energy Charges $ per total kWh in Period: Distribution, Competitive Transition, Transmission, Conservation, Renewable Energy and Supplier Service Charges
On-Peak Energy: $ 0.06797 / kWh Off-Peak Energy: $ 0.04886 / kWh
Filename: CLP_R58_2000to5000_Oct06.csv

NYSERDA DG/CHP Integrated Database System Utility Rate Details
CDH Energy Corporation 382 September 25, 2008
Connecticut Light and Power
Rate 58– Large Time-of-Day – Non-Manufacturers – 2000 to 5000 kW – June 2008 This rate is for customers who are non-manufacturers and whose demand exceeded in the last twelve months 2,000 kW but less than 5,000 kW. Customer Charge $ 2,2125.00 Periods On-Peak 7AM – 11PM, Monday-Friday Off-Peak All Hours not in the Peak Period Demand Charges $ per peak kVA Distribution, Prod/Tran. Demand, Transmission Service and Competitive Transition Demand Charges: $ 10.52 / kVA
Energy Charges $ per total kWh in Period: Distribution, Competitive Transition, Transmission, Conservation, Renewable Energy and Supplier Service Charges
On-Peak Energy: $ 0.11018 / kWh Off-Peak Energy: $ 0.11018 / kWh
Filename: CLP_R58_2000to5000_Jun08.csv
Connecticut Light and Power
Rate 58 – Large Time-of-Day – Non-Manufacturers – above 5000 kW – October 2006 This rate is for customers who are non-manufacturers and whose demand exceeded in the last twelve months 5,000 kW. Customer Charge $ 3,775.83 Periods On-Peak 7AM – 11PM, Monday-Friday Off-Peak All Hours not in the Peak Period Demand Charges $ per peak kVA Distribution, Prod/Tran. Demand, Transmission Service and Competitive Transition Demand Charges: $ 9.11 / kVA
Energy Charges $ per total kWh in Period: Distribution, Competitive Transition, Transmission, Conservation, Renewable Energy and Supplier Service Charges
On-Peak Energy: $ 0.06797 / kWh Off-Peak Energy: $ 0.04886 / kWh
Filename: CLP_R58_gt5000_Oct06.csv

NYSERDA DG/CHP Integrated Database System Utility Rate Details
CDH Energy Corporation 383 September 25, 2008
Connecticut Light and Power
Rate 58 – Large Time-of-Day – Non-Manufacturers – above 5000 kW – June 2008 This rate is for customers who are non-manufacturers and whose demand exceeded in the last twelve months 5,000 kW. Customer Charge $ 4,200.00 Periods On-Peak 7AM – 11PM, Monday-Friday Off-Peak All Hours not in the Peak Period Demand Charges $ per peak kVA Distribution, Prod/Tran. Demand, Transmission Service and Competitive Transition Demand Charges: $ 10.52 / kVA
Energy Charges $ per total kWh in Period: Distribution, Competitive Transition, Transmission, Conservation, Renewable Energy and Supplier Service Charges
On-Peak Energy: $ 0.11018 / kWh Off-Peak Energy: $ 0.11018 / kWh
Filename: CLP_R58_gt5000_Jun08.csv
Connecticut Light and Power
Rate 984 Supplemental – based on Rate 55 – Intermediate Time-of-Day – Manufacturers – October 2006 Supplemental Power is intended to supplement the output of the customer's generation capacity where the customer's own generation capacity is less than the customer's maximum load. This rate is for customers who are manufacturers and whose demand equaled or exceeded in the last twelve months 350 kW but less than 1,000 kW. Customer Charge $ 361.29 Distribution Demand Charge $ 4.17 / contract kW1 Periods On-Peak 7AM – 11PM, Monday-Friday Off-Peak All Hours not in the Peak Period Demand Charges $ per peak kW Production/Transmission, Transmission Service and Competitive Transition Demand Charges: $ 5.02 / kW
Energy Charges $ per total kWh in Period: Distribution, Competitive Transition, Transmission, Conservation, Renewable Energy and Supplier Service Charges
On-Peak Energy: $ 0.06543 / kWh Off-Peak Energy: $ 0.05096 / kWh
Note: The Reactive Demand Credit is ignored in application of this rate. In order to qualify for the credit, a facility’s power factor would have to exceed 0.97.
1 - To obtain service under this schedule, the customer must specify in writing the maximum demand (Supplemental Contract Demand) which it plans to impose on the Company under this schedule.
Filename: CLP_R984_R55_Oct06.csv

NYSERDA DG/CHP Integrated Database System Utility Rate Details
CDH Energy Corporation 384 September 25, 2008
Connecticut Light and Power
Rate 984 Supplemental – based on Rate 55 – Intermediate Time-of-Day – Manufacturers – June 2008 Supplemental Power is intended to supplement the output of the customer's generation capacity where the customer's own generation capacity is less than the customer's maximum load. This rate is for customers who are manufacturers and whose demand equaled or exceeded in the last twelve months 350 kW but less than 1,000 kW. Customer Charge $ 400.00 Distribution Demand Charge $ 5.63 / contract kW1 Periods On-Peak 7AM – 11PM, Monday-Friday Off-Peak All Hours not in the Peak Period Demand Charges $ per peak kW Production/Transmission, Transmission Service and Competitive Transition Demand Charges: $ 5.19 / kW
Energy Charges $ per total kWh in Period: Distribution, Competitive Transition, Transmission, Conservation, Renewable Energy and Supplier Service Charges
On-Peak Energy: $ 0.14601/ kWh Off-Peak Energy: $ 0.11601 / kWh
Note: The Reactive Demand Credit is ignored in application of this rate. In order to qualify for the credit, a facility’s power factor would have to exceed 0.97.
1 - To obtain service under this schedule, the customer must specify in writing the maximum demand (Supplemental Contract Demand) which it plans to impose on the Company under this schedule.
Filename: CLP_R984_R55_Jun08.csv
Connecticut Light and Power
Rate 984 Supplemental – based on Rate 56 – Intermediate Time-of-Day – Non-Manufacturers – October 2006 Supplemental Power is intended to supplement the output of the customer's generation capacity where the customer's own generation capacity is less than the customer's maximum load. This rate is for customers who are not manufacturers and whose demand equaled or exceeded in the last twelve months 350 kW but less than 1,000 kW. Customer Charge $ 377.75 Distribution Demand Charge $ 4.26 / contract kW1 Periods On-Peak 7AM – 11PM, Monday-Friday Off-Peak All Hours not in the Peak Period Demand Charges $ per peak kW Production/Transmission, Transmission Service and Competitive Transition Demand Charges: $ 5.26 / kW
Energy Charges $ per total kWh in Period: Distribution, Competitive Transition, Transmission, Conservation, Renewable Energy and Supplier Service Charges
On-Peak Energy: $ 0.06873 / kWh Off-Peak Energy: $ 0.05451 / kWh
Note: The Reactive Demand Credit is ignored in application of this rate. In order to qualify for the credit, a facility’s power factor would have to exceed 0.97.
1 - To obtain service under this schedule, the customer must specify in writing the maximum demand (Supplemental Contract Demand) which it plans to impose on the Company under this schedule.
Filename: CLP_R984_R56_Oct06.csv

NYSERDA DG/CHP Integrated Database System Utility Rate Details
CDH Energy Corporation 385 September 25, 2008
Connecticut Light and Power
Rate 984 Supplemental – based on Rate 56 – Intermediate Time-of-Day – Non-Manufacturers – June 2008 Supplemental Power is intended to supplement the output of the customer's generation capacity where the customer's own generation capacity is less than the customer's maximum load. This rate is for customers who are not manufacturers and whose demand equaled or exceeded in the last twelve months 350 kW but less than 1,000 kW. Customer Charge $ 420.00 Distribution Demand Charge $ 5.99 / contract kW1 Periods On-Peak 7AM – 11PM, Monday-Friday Off-Peak All Hours not in the Peak Period Demand Charges $ per peak kW Production/Transmission, Transmission Service and Competitive Transition Demand Charges: $ 5.94 / kW
Energy Charges $ per total kWh in Period: Distribution, Competitive Transition, Transmission, Conservation, Renewable Energy and Supplier Service Charges
On-Peak Energy: $ 0.14743 / kWh Off-Peak Energy: $ 0.11724 / kWh
Note: The Reactive Demand Credit is ignored in application of this rate. In order to qualify for the credit, a facility’s power factor would have to exceed 0.97.
1 - To obtain service under this schedule, the customer must specify in writing the maximum demand (Supplemental Contract Demand) which it plans to impose on the Company under this schedule.
Filename: CLP_R984_R56_Jun08.csv
Connecticut Light and Power
Rate 984 Supplemental – based on Rate 57 – Large Time-of-Day – Manufacturers – below 2000 kW – October 2006 Supplemental Power is intended to supplement the output of the customer's generation capacity where the customer's own generation capacity is less than the customer's maximum load. This rate is for customers who are manufacturers and whose demand exceeded in the last twelve months 1,000 kW but less than 2,000 kW. Customer Charge $ 850.99 Distribution Demand Charge $ 2.94 / contract kW1 Periods On-Peak 7AM – 11PM, Monday-Friday Off-Peak All Hours not in the Peak Period Demand Charges $ per peak kVA Transmission Service and Competitive Transition Demand Charges: $ 4.05 / kVA
Energy Charges $ per total kWh in Period: Distribution, Competitive Transition, Transmission, Conservation, Renewable Energy and Supplier Service Charges
On-Peak Energy: $ 0.06799 / kWh Off-Peak Energy: $ 0.04892 / kWh
1 - To obtain service under this schedule, the customer must specify in writing the maximum demand (Supplemental Contract Demand) which it plans to impose on the Company under this schedule.
Filename: CLP_R984_R57_lt2000_Oct06.csv

NYSERDA DG/CHP Integrated Database System Utility Rate Details
CDH Energy Corporation 386 September 25, 2008
Connecticut Light and Power
Rate 984 Supplemental – based on Rate 57 – Large Time-of-Day – Manufacturers – below 2000 kW – June 2008 Supplemental Power is intended to supplement the output of the customer's generation capacity where the customer's own generation capacity is less than the customer's maximum load. This rate is for customers who are manufacturers and whose demand exceeded in the last twelve months 1,000 kW but less than 2,000 kW. Customer Charge $ 950.00 Distribution Demand Charge $ 3.78 / contract kW1 Periods On-Peak 7AM – 11PM, Monday-Friday Off-Peak All Hours not in the Peak Period Demand Charges $ per peak kVA Transmission Service and Competitive Transition Demand Charges: $ 4.95 / kVA
Energy Charges $ per total kWh in Period: Distribution, Competitive Transition, Transmission, Conservation, Renewable Energy and Supplier Service Charges
On-Peak Energy: $ 0.11044 / kWh Off-Peak Energy: $ 0..11044 / kWh
1 - To obtain service under this schedule, the customer must specify in writing the maximum demand (Supplemental Contract Demand) which it plans to impose on the Company under this schedule.
Filename: CLP_R984_R57_lt2000_Jun08.csv
Connecticut Light and Power
Rate 984 Supplemental – based on Rate 57 – Large Time-of-Day – Manufacturers – 2000 to 5000 kW – October 2006 Supplemental Power is intended to supplement the output of the customer's generation capacity where the customer's own generation capacity is less than the customer's maximum load. This rate is for customers who are manufacturers and whose demand exceeded in the last twelve months 2,000 kW but less than 5,000 kW. Customer Charge $ 1,808.07 Distribution Demand Charge $ 2.94 / contract kW1 Periods On-Peak 7AM – 11PM, Monday-Friday Off-Peak All Hours not in the Peak Period Demand Charges $ per peak kVA Transmission Service and Competitive Transition Demand Charges: $ 4.05 / kVA
Energy Charges $ per total kWh in Period: Distribution, Competitive Transition, Transmission, Conservation, Renewable Energy and Supplier Service Charges
On-Peak Energy: $ 0.06799 / kWh Off-Peak Energy: $ 0.04892 / kWh
1 - To obtain service under this schedule, the customer must specify in writing the maximum demand (Supplemental Contract Demand) which it plans to impose on the Company under this schedule.
Filename: CLP_R984_R57_2000to5000_Oct06.csv

NYSERDA DG/CHP Integrated Database System Utility Rate Details
CDH Energy Corporation 387 September 25, 2008
Connecticut Light and Power
Rate 984 Supplemental – based on Rate 57 – Large Time-of-Day – Manufacturers – 2000 to 5000 kW – June 2008 Supplemental Power is intended to supplement the output of the customer's generation capacity where the customer's own generation capacity is less than the customer's maximum load. This rate is for customers who are manufacturers and whose demand exceeded in the last twelve months 2,000 kW but less than 5,000 kW. Customer Charge $ 2,000.0 Distribution Demand Charge $ 3.78 / contract kW1 Periods On-Peak 7AM – 11PM, Monday-Friday Off-Peak All Hours not in the Peak Period Demand Charges $ per peak kVA Transmission Service and Competitive Transition Demand Charges: $ 4.95 / kVA
Energy Charges $ per total kWh in Period: Distribution, Competitive Transition, Transmission, Conservation, Renewable Energy and Supplier Service Charges
On-Peak Energy: $ 0.11044 / kWh Off-Peak Energy: $ 0.11044 / kWh
1 - To obtain service under this schedule, the customer must specify in writing the maximum demand (Supplemental Contract Demand) which it plans to impose on the Company under this schedule.
Filename: CLP_R984_R57_2000to5000_Jun08.csv
Connecticut Light and Power
Rate 984 Supplemental – based on Rate 57 – Large Time-of-Day – Manufacturers – above 5000 kW – October 2006 Supplemental Power is intended to supplement the output of the customer's generation capacity where the customer's own generation capacity is less than the customer's maximum load. This rate is for customers who are manufacturers and whose demand exceeded in the last twelve months 5,000 kW. Customer Charge $ 3,616.15 Distribution Demand Charge $ 2.94 / contract kW1 Periods On-Peak 7AM – 11PM, Monday-Friday Off-Peak All Hours not in the Peak Period Demand Charges $ per peak kVA Transmission Service and Competitive Transition Demand Charges: $ 4.05 / kVA
Energy Charges $ per total kWh in Period: Distribution, Competitive Transition, Transmission, Conservation, Renewable Energy and Supplier Service Charges
On-Peak Energy: $ 0.06799 / kWh Off-Peak Energy: $ 0.04892 / kWh
1 - To obtain service under this schedule, the customer must specify in writing the maximum demand (Supplemental Contract Demand) which it plans to impose on the Company under this schedule.
Filename: CLP_R984_R57_gt5000_Oct06.csv

NYSERDA DG/CHP Integrated Database System Utility Rate Details
CDH Energy Corporation 388 September 25, 2008
Connecticut Light and Power
Rate 984 Supplemental – based on Rate 57 – Large Time-of-Day – Manufacturers – above 5000 kW – June 2008 Supplemental Power is intended to supplement the output of the customer's generation capacity where the customer's own generation capacity is less than the customer's maximum load. This rate is for customers who are manufacturers and whose demand exceeded in the last twelve months 5,000 kW. Customer Charge $ 4,000.00 Distribution Demand Charge $ 3.78 / contract kW1 Periods On-Peak 7AM – 11PM, Monday-Friday Off-Peak All Hours not in the Peak Period Demand Charges $ per peak kVA Transmission Service and Competitive Transition Demand Charges: $ 4.95 / kVA
Energy Charges $ per total kWh in Period: Distribution, Competitive Transition, Transmission, Conservation, Renewable Energy and Supplier Service Charges
On-Peak Energy: $ 0.11044 / kWh Off-Peak Energy: $ 0.11044 / kWh
1 - To obtain service under this schedule, the customer must specify in writing the maximum demand (Supplemental Contract Demand) which it plans to impose on the Company under this schedule.
Filename: CLP_R984_R57_gt5000_Jun08.csv
Connecticut Light and Power
Rate 984 Supplemental – based on Rate 58 – Large Time-of-Day – Non-Manufacturers – below 2000 kW – October 2006 Supplemental Power is intended to supplement the output of the customer's generation capacity where the customer's own generation capacity is less than the customer's maximum load. This rate is for customers who are non-manufacturers and whose demand exceeded in the last twelve months 1,000 kW but less than 2,000 kW. Customer Charge $ 926.27 Distribution Demand Charge $ 3.72 / contract kW1 Periods On-Peak 7AM – 11PM, Monday-Friday Off-Peak All Hours not in the Peak Period Demand Charges $ per peak kVA Prod/Tran. Demand, Transmission Service and Competitive Transition Demand Charges: $ 5.39 / kVA
Energy Charges
$ per total kWh in Period: Distribution, Competitive Transition, Transmission, Conservation, Renewable Energy, FMCC Delivery, Transmission Adjustment, EAC Generation and Supplier Service Charges
On-Peak Energy: $ 0.10580 / kWh Off-Peak Energy: $ 0.08669 / kWh
1 - To obtain service under this schedule, the customer must specify in writing the maximum demand (Supplemental Contract Demand) which it plans to impose on the Company under this schedule.
Filename: CLP_R984_R58_lt2000_Oct06.csv

NYSERDA DG/CHP Integrated Database System Utility Rate Details
CDH Energy Corporation 389 September 25, 2008
Connecticut Light and Power
Rate 984 Supplemental – based on Rate 58 – Large Time-of-Day – Non-Manufacturers – below 2000 kW – June 2008 Supplemental Power is intended to supplement the output of the customer's generation capacity where the customer's own generation capacity is less than the customer's maximum load. This rate is for customers who are non-manufacturers and whose demand exceeded in the last twelve months 1,000 kW but less than 2,000 kW. Customer Charge $ 1,025.00 Distribution Demand Charge $ 5.23 / contract kW1 Periods On-Peak 7AM – 11PM, Monday-Friday Off-Peak All Hours not in the Peak Period Demand Charges $ per peak kVA Prod/Tran. Demand, Transmission Service and Competitive Transition Demand Charges: $ 5.29 / kVA
Energy Charges
$ per total kWh in Period: Distribution, Competitive Transition, Transmission, Conservation, Renewable Energy, FMCC Delivery, Transmission Adjustment, EAC Generation and Supplier Service Charges
On-Peak Energy: $ 0.11189 / kWh Off-Peak Energy: $ 0.11189 / kWh
1 - To obtain service under this schedule, the customer must specify in writing the maximum demand (Supplemental Contract Demand) which it plans to impose on the Company under this schedule.
Filename: CLP_R984_R58_lt2000_Jun08.csv
Connecticut Light and Power
Rate 984 Supplemental – based on Rate 58 – Large Time-of-Day – Non-Manufacturers –2000 to 5000 kW – October 2006 Supplemental Power is intended to supplement the output of the customer's generation capacity where the customer's own generation capacity is less than the customer's maximum load. This rate is for customers who are non-manufacturers and whose demand exceeded in the last twelve months 2,000 kW but less than 5,000 kW. Customer Charge $ 1,909.64 Distribution Demand Charge $ 3.72 / contract kW1 Periods On-Peak 7AM – 11PM, Monday-Friday Off-Peak All Hours not in the Peak Period Demand Charges $ per peak kVA Prod/Tran. Demand, Transmission Service and Competitive Transition Demand Charges: $ 5.39 / KVA
Energy Charges $ per total kWh in Period: Distribution, Competitive Transition, Transmission, Conservation, Renewable Energy and Supplier Service Charges
On-Peak Energy: $ 0.06797 / kWh Off-Peak Energy: $ 0.04886 / kWh
1 - To obtain service under this schedule, the customer must specify in writing the maximum demand (Supplemental Contract Demand) which it plans to impose on the Company under this schedule.
Filename: CLP_R984_R58_2000to5000_Oct06.csv

NYSERDA DG/CHP Integrated Database System Utility Rate Details
CDH Energy Corporation 390 September 25, 2008
Connecticut Light and Power
Rate 984 Supplemental – based on Rate 58 – Large Time-of-Day – Non-Manufacturers –2000 to 5000 kW – June 2008 Supplemental Power is intended to supplement the output of the customer's generation capacity where the customer's own generation capacity is less than the customer's maximum load. This rate is for customers who are non-manufacturers and whose demand exceeded in the last twelve months 2,000 kW but less than 5,000 kW. Customer Charge $ 2,125.00 Distribution Demand Charge $ 5.23 / contract kW1 Periods On-Peak 7AM – 11PM, Monday-Friday Off-Peak All Hours not in the Peak Period Demand Charges $ per peak kVA Prod/Tran. Demand, Transmission Service and Competitive Transition Demand Charges: $ 5.29 / KVA
Energy Charges $ per total kWh in Period: Distribution, Competitive Transition, Transmission, Conservation, Renewable Energy and Supplier Service Charges
On-Peak Energy: $ 0.11053 / kWh Off-Peak Energy: $ 0.11053 / kWh
1 - To obtain service under this schedule, the customer must specify in writing the maximum demand (Supplemental Contract Demand) which it plans to impose on the Company under this schedule.
Filename: CLP_R984_R58_2000to5000_Jun08.csv
Connecticut Light and Power
Rate 984 Supplemental – based on Rate 58 – Large Time-of-Day – Non-Manufacturers – above 5000 kW – October 2006 Supplemental Power is intended to supplement the output of the customer's generation capacity where the customer's own generation capacity is less than the customer's maximum load. This rate is for customers who are non-manufacturers and whose demand exceeded in the last twelve months 5,000 kW. Customer Charge $ 3,775.83 Distribution Demand Charge $ 3.72 / contract kW1 Periods On-Peak 7AM – 11PM, Monday-Friday Off-Peak All Hours not in the Peak Period Demand Charges $ per peak kVA Prod/Tran. Demand, Transmission Service and Competitive Transition Demand Charges: $ 5.39 / KVA
Energy Charges $ per total kWh in Period: Distribution, Competitive Transition, Transmission, Conservation, Renewable Energy and Supplier Service Charges
On-Peak Energy: $ 0.06797 / kWh Off-Peak Energy: $ 0.04886 / kWh
1 - To obtain service under this schedule, the customer must specify in writing the maximum demand (Supplemental Contract Demand) which it plans to impose on the Company under this schedule.
Filename: CLP_R984_R58_gt5000_Oct06.csv

NYSERDA DG/CHP Integrated Database System Utility Rate Details
CDH Energy Corporation 391 September 25, 2008
Connecticut Light and Power
Rate 984 Supplemental – based on Rate 58 – Large Time-of-Day – Non-Manufacturers – above 5000 kW – June 2008 Supplemental Power is intended to supplement the output of the customer's generation capacity where the customer's own generation capacity is less than the customer's maximum load. This rate is for customers who are non-manufacturers and whose demand exceeded in the last twelve months 5,000 kW. Customer Charge $ 4,200.00 Distribution Demand Charge $ 5.23 / contract kW1 Periods On-Peak 7AM – 11PM, Monday-Friday Off-Peak All Hours not in the Peak Period Demand Charges $ per peak kVA Prod/Tran. Demand, Transmission Service and Competitive Transition Demand Charges: $ 5.29 / KVA
Energy Charges $ per total kWh in Period: Distribution, Competitive Transition, Transmission, Conservation, Renewable Energy and Supplier Service Charges
On-Peak Energy: $ 0.11018 / kWh Off-Peak Energy: $ 0.11018 / kWh
1 - To obtain service under this schedule, the customer must specify in writing the maximum demand (Supplemental Contract Demand) which it plans to impose on the Company under this schedule.
Filename: CLP_R984_R58_gt5000_Jun08.csv

NYSERDA DG/CHP Integrated Database System Utility Rate Details
CDH Energy Corporation 392 September 25, 2008
Complete Western Massachusetts Electric Co. Tariff The Western Mass Electric rates are up-to-date as of June 23, 2008.
Western Massachusetts Electric
Rate T-2 - Large Primary Time-of-Use – Fixed Pricing Option – March 2006 Customers whose maximum demand equaled or exceeded 350 kW at any time in the most recent 12 months and new customers whose demand is reasonably anticipated to equal or exceed 350 kW within one year must take service under this rate. Customer Charge $ / month Less than 500 kW peak demand $ 2,224.34 500 to 650 kW peak demand $ 2,700.95 650 to 1,000 kW peak demand $ 3,124.61 1,000 to 1,500 kW peak demand $ 6,231.42 1,500 to 3,000 kW peak demand $ 9,779.55 Over 3,000 kW peak demand $ 13,504.19 Periods On-Peak 7AM – 11PM, Monday-Friday Off-Peak All Hours not in the Peak Period Demand Charges $ per peak kVA Distribution, Transition and Transmission Charges $ 3.62 / kW
Energy Charges $ per total kWh in Period: Distribution, Transition, Transmission and Default Service Charges
On-Peak Energy: $ 0.178590 / kWh Off-Peak Energy: $ 0.169310 / kWh
Filename: WMECO_T2_Fixed_Mar06.csv

NYSERDA DG/CHP Integrated Database System Utility Rate Details
CDH Energy Corporation 393 September 25, 2008
Western Massachusetts Electric
Rate T-2 - Large Primary Time-of-Use – Fixed Pricing Option – December 2006 Customers whose maximum demand equaled or exceeded 350 kW at any time in the most recent 12 months and new customers whose demand is reasonably anticipated to equal or exceed 350 kW within one year must take service under this rate. Customer Charge $ / month Less than 500 kW peak demand $ 2,224.34 500 to 650 kW peak demand $ 2,700.95 650 to 1,000 kW peak demand $ 3,124.61 1,000 to 1,500 kW peak demand $ 6,231.42 1,500 to 3,000 kW peak demand $ 9,779.55 Over 3,000 kW peak demand $ 13,504.19 Periods On-Peak 7AM – 11PM, Monday-Friday Off-Peak All Hours not in the Peak Period Demand Charges $ per peak kVA Distribution, Transition and Transmission Charges $ 3.62 / kW
Energy Charges $ per total kWh in Period: Distribution, Transition, Transmission and Default Service Charges
On-Peak Energy: $ 0.114080 / kWh Off-Peak Energy: $ 0.104800 / kWh
Filename: WMECO_T2_Fixed_Dec06.csv
Western Massachusetts Electric
Rate T-2 - Large Primary Time-of-Use – Fixed Pricing Option – June 2008 Customers whose maximum demand equaled or exceeded 350 kW at any time in the most recent 12 months and new customers whose demand is reasonably anticipated to equal or exceed 350 kW within one year must take service under this rate. Customer Charge $ / month Less than 500 kW peak demand $ 2,224.34 500 to 650 kW peak demand $ 2,700.95 650 to 1,000 kW peak demand $ 3,124.61 1,000 to 1,500 kW peak demand $ 6,231.42 1,500 to 3,000 kW peak demand $ 9,779.55 Over 3,000 kW peak demand $ 13,504.19 Periods On-Peak 7AM – 11PM, Monday-Friday Off-Peak All Hours not in the Peak Period Demand Charges $ per peak kVA Distribution, Transition and Transmission Charges $ 3.62 / kW
Energy Charges $ per total kWh in Period: Distribution, Transition, Transmission and Default Service Charges
On-Peak Energy: $ 0.12437 / kWh Off-Peak Energy: $ 0.11626 / kWh
Filename: WMECO_T2_Fixed_Jun08.csv

NYSERDA DG/CHP Integrated Database System Utility Rate Details
CDH Energy Corporation 394 September 25, 2008
Complete Rochester Gas & Electric Tariff The Rochester Gas & Electric rates are up-to-date as of June 23, 2008.
Rochester Gas & Electric
Service Classification 8 – Large General Time-of-Use – Fixed Pricing – Secondary – March 2006 All purposes, in Entire Territory, by any customer with a basic demand of not less than 300 kilowatts during any three of the previous 12 months, provided, however, that whenever the monthly basic demand has been 200 kW or less for 12 consecutive months, the customer thereafter will be billed under another appropriate service classification. This Non-Retail Access choice includes a fixed component for RG&E delivery service, a fixed Transition Charge and a fixed commodity charge for electricity supply. Customer Charge $ 500.00 / month Periods On-Peak 7AM – 11PM, Monday-Friday Off-Peak All Hours not in the Peak Period Demand Charges Delivery and Transition Charge $ 10.25 / kW
Energy Charges $ per total kWh in Period: Systems Benefit, Renewable Portfolio, Retail Access, Transition and Fixed Commodity Charges
On-Peak Energy: $ 0.105540 / kWh Off-Peak Energy: $ 0.056744 / kWh
Filename: RGE_SC8_Sec_Fixed_Mar06.csv
Rochester Gas & Electric
Service Classification 8 – Large General Time-of-Use – Fixed Pricing – Secondary – October 2006 All purposes, in Entire Territory, by any customer with a basic demand of not less than 300 kilowatts during any three of the previous 12 months, provided, however, that whenever the monthly basic demand has been 200 kW or less for 12 consecutive months, the customer thereafter will be billed under another appropriate service classification. This Non-Retail Access choice includes a fixed component for RG&E delivery service, a fixed Transition Charge and a fixed commodity charge for electricity supply. Customer Charge $ 484.78 / month Periods On-Peak 7AM – 11PM, Monday-Friday Off-Peak All Hours not in the Peak Period Demand Charges Delivery and Transition Charge $ 10.25 / kW
Energy Charges $ per total kWh in Period: Systems Benefit, Renewable Portfolio, Retail Access, Transition and Fixed Commodity Charges
On-Peak Energy: $ 0.101390 / kWh Off-Peak Energy: $ 0.057580 / kWh
Filename: RGE_SC8_Sec_Fixed_Oct06.csv

NYSERDA DG/CHP Integrated Database System Utility Rate Details
CDH Energy Corporation 395 September 25, 2008
Rochester Gas & Electric
Service Classification 8 – Large General Time-of-Use – Fixed Pricing – Secondary – June 2008 All purposes, in Entire Territory, by any customer with a basic demand of not less than 300 kilowatts during any three of the previous 12 months, provided, however, that whenever the monthly basic demand has been 200 kW or less for 12 consecutive months, the customer thereafter will be billed under another appropriate service classification. This Non-Retail Access choice includes a fixed component for RG&E delivery service, a fixed Transition Charge and a fixed commodity charge for electricity supply. Customer Charge $ 500.00 / month Periods On-Peak 7AM – 11PM, Monday-Friday Off-Peak All Hours not in the Peak Period Demand Charges Delivery and Transition Charge $ 10.25 / kW
Energy Charges $ per total kWh in Period: Systems Benefit, Renewable Portfolio, Retail Access, Transition and Fixed Commodity Charges
On-Peak Energy: $ 0.098425 / kWh Off-Peak Energy: $ 0.050791 / kWh
Filename: RGE_SC8_Sec_Fixed_Jun08.csv

NYSERDA DG/CHP Integrated Database System Utility Rate Details
CDH Energy Corporation 396 September 25, 2008
Summary of Alaska Light & Power Rates The Alaska Light & Power rates are up-to-date as of June 23, 2008.
Alaska Light & Power
Rate 10 – General Residential Customer Charge $ 8.88 Periods Peak November – May Off-Peak June – October Energy Charges $ per total kWh in Period Peak $ 0.0963 / kWh Off-Peak $ 0.0792 / kWh
Filename: ALP_10.csv
Alaska Light & Power
Rate 10 – General Residential - June 2008 Customer Charge $ 8.88 Periods Peak November – May Off-Peak June – October Energy Charges $ per total kWh in Period Peak $ 0.0963 / kWh Off-Peak $ 0.0792 / kWh
Filename: ALP_10_Jun08.csv
Alaska Light & Power
Rate 10-D –Residential with Demand Customer Charge $ 11.49 Periods Peak November – May Off-Peak June – October Demand Charges $ per peak kW in Period Peak $ 8.96 / kW Off-Peak $ 5.42 / kW Energy Charges $ per total kWh in Period Peak $ 0.0468 / kWh Off-Peak $ 0.0408 / kWh
Filename: ALP_10D.csv

NYSERDA DG/CHP Integrated Database System Utility Rate Details
CDH Energy Corporation 397 September 25, 2008
Alaska Light & Power
Rate 20 – Small Commercial Customer Charge $ 18.80 Periods Peak November – May Off-Peak June – October Energy Charges $ per total kWh in Period Peak $ 0.0933 / kWh Off-Peak $ 0.0742 / kWh
Filename: ALP_20.csv
Alaska Light & Power
Rate 20-D – Small Commercial with Demand Customer Charge $ 27.16 Periods Peak November – May Off-Peak June – October Demand Charges $ per peak kW in Period Peak $ 10.27 / kW Off-Peak $ 6.87 / kW Energy Charges $ per total kWh in Period Peak $ 0.0536 / kWh Off-Peak $ 0.0475 / kWh
Filename: ALP_20D.csv
Alaska Light & Power
Rate 24 – Large Commercial Customer Charge $ 99.24 Periods Peak November – May Off-Peak June – October Demand Charges $ per peak kW in Period Peak $ 11.53 / kW Off-Peak $ 7.35 / kW Energy Charges $ per total kWh in Period Peak $ 0.0493 / kWh Off-Peak $ 0.0462 / kWh
Filename: ALP_24.csv

NYSERDA DG/CHP Integrated Database System Utility Rate Details
CDH Energy Corporation 398 September 25, 2008
Alaska Light & Power
Rate 41 – Manufacturing Customer Charge $ 99.24 Periods Peak November – May Off-Peak June – October Demand Charges $ per peak kW in Period Peak $ 9.20 / kW Off-Peak $ 7.35 / kW Energy Charges $ per total kWh in Period Peak $ 0.0530 / kWh Off-Peak $ 0.0481 / kWh
Filename: ALP_41.csv

NYSERDA DG/CHP Integrated Database System Utility Rate Details
CDH Energy Corporation 399 September 25, 2008
Complete Pacific Gas & Electric Tariff The Pacific Gas & Electric rates are up-to-date as of July 17, 2008.
Pacific Gas & Electric
Rate Schedule E-1 – Residential Service – Baseline P – July 2006 This schedule is applicable to single-phase and polyphase residential service in single-family dwellings and in flats and apartments separately metered by PG&E; to single-phase and polyphase service in common areas in a multifamily complex; and to all single-phase and polyphase farm service on the premises operated by the person whose residence is supplied through the same meter. Customer Charge $ 0.14784 per day Periods Summer May – October Winter November – April Energy Charges $ per total kWh per day Block Charges1 0-15.9 kWh 15.9-20.7 kWh 20.7-31.8 kWh 31.8 – 47.7 kWh Over 47.7 kWh Summer $0.114300 / kWh $0.129890 / kWh $0.219810 / kWh $ 0.302920 / kWh $ 0.346480 / kWh Winter $0.117438 / kWh $0.208310 / kWh $0.267600 / kWh $ 0.329220 / kWh $ 0.346480 / kWh
1 – Block rates for the winter are the average rate for the winter block corresponding to the summer block Filename: PGE_E1_BaseP_July06.csv
Pacific Gas & Electric
Rate Schedule E-1 – Residential Service – Baseline P – October 2006 This schedule is applicable to single-phase and polyphase residential service in single-family dwellings and in flats and apartments separately metered by PG&E; to single-phase and polyphase service in common areas in a multifamily complex; and to all single-phase and polyphase farm service on the premises operated by the person whose residence is supplied through the same meter. Customer Charge $ 0.14784 per day Periods Summer May – October Winter November – April Energy Charges $ per total kWh per day Block Charges1 0-15.9 kWh 15.9-20.7 kWh 20.7-31.8 kWh 31.8 – 47.7 kWh Over 47.7 kWh Summer $0.114300 / kWh $0.129890 / kWh $0.229860 / kWh $ 0.322270 / kWh $ 0.370700 / kWh Winter $0.117438 / kWh $0.217076 / kWh $0.282998 / kWh $ 0.351511 / kWh $ 0.370700 / kWh
1 – Block rates for the winter are the average rate for the winter block corresponding to the summer block Filename: PGE_E1_BaseP_Oct06.csv

NYSERDA DG/CHP Integrated Database System Utility Rate Details
CDH Energy Corporation 400 September 25, 2008
Pacific Gas & Electric
Rate Schedule E-1 – Residential Service – Baseline P – January 2007 This schedule is applicable to single-phase and polyphase residential service in single-family dwellings and in flats and apartments separately metered by PG&E; to single-phase and polyphase service in common areas in a multifamily complex; and to all single-phase and polyphase farm service on the premises operated by the person whose residence is supplied through the same meter. Customer Charge $ 0.14784 per day Periods Summer May – October Winter November – April Energy Charges $ per total kWh per day Block Charges1 0-15.9 kWh 15.9-20.7 kWh 20.7-31.8 kWh 31.8 – 47.7 kWh Over 47.7 kWh Summer $0.114300 / kWh $0.129890 / kWh $0.229440 / kWh $ 0.321460 / kWh $ 0.369690 / kWh Winter $0.117438 / kWh $0.216709 / kWh $0.282354 / kWh $ 0.350580 / kWh $ 0.369690 / kWh
1 – Block rates for the winter are the average rate for the winter block corresponding to the summer block Filename: PGE_E1_BaseP_Jan07.csv
Pacific Gas & Electric
Rate Schedule E-1 – Residential Service – Baseline P – July 2008 This schedule is applicable to single-phase and polyphase residential service in single-family dwellings and in flats and apartments separately metered by PG&E; to single-phase and polyphase service in common areas in a multifamily complex; and to all single-phase and polyphase farm service on the premises operated by the person whose residence is supplied through the same meter. Customer Charge $ 0.14784 per day Periods Summer May – October Winter November – April Energy Charges $ per total kWh per day Block Charges1 0-15.9 kWh 15.9-20.7 kWh 20.7-31.8 kWh 31.8 – 47.7 kWh Over 47.7 kWh Summer $0.115900 / kWh $0.131420 / kWh $0.22800 / kWh $ 0.313040 / kWh $ 0.358760 / kWh Winter $0.115900 / kWh $0.131420 / kWh $0.22800 / kWh $ 0.313040 / kWh $ 0.358760 / kWh
1 – Block rates for the winter are the average rate for the winter block corresponding to the summer block Filename: PGE_E1_BaseP_Jul08.csv

NYSERDA DG/CHP Integrated Database System Utility Rate Details
CDH Energy Corporation 401 September 25, 2008
Pacific Gas & Electric
Rate Schedule E-7 – Residential Time-of-Use – Baseline P – July 2006 This voluntary schedule is available to customers for whom Schedule E-1 applies. Customer Charge $ 0.14784 per day Periods Summer Peak 12 - 6 PM, Monday-Friday from May – October Summer Off-Peak All Other Hours from May – October Winter Peak 12 - 6 PM, Monday-Friday from November – April Winter Off-Peak All Other Hours from November – April Energy Charges $ per total kWh per day Block Charges1 0-15.9 kWh 15.9-20.7 kWh 20.7-31.8 kWh 31.8 – 47.7 kWh Over 47.7 kWh Summer Peak $0.293720 / kWh $0.293720 / kWh $0.383640 / kWh $ 0.466750 / kWh $ 0.510310 / kWh Summer Off-Peak $0.086640 / kWh $0.086640 / kWh $0.176560 / kWh $ 0.259670 / kWh $ 0.303230 / kWh Winter Peak $0.114720 / kWh $0.193141 / kWh $0.252430 / kWh $ 0.314050 / kWh $ 0.331310 / kWh Winter Off-Peak $0.089660 / kWh $0.168081 / kWh $0.227370 / kWh $ 0.288990 / kWh $ 0.306250 / kWh
1 – Block rates for the winter are the average rate for the winter block corresponding to the summer block Filename: PGE_E7_BaseP_July06.csv
Pacific Gas & Electric
Rate Schedule E-7 – Residential Time-of-Use – Baseline P – October 2006 This voluntary schedule is available to customers for whom Schedule E-1 applies. Customer Charge $ 0.11532 per day Periods Summer Peak 12 - 6 PM, Monday-Friday from May – October Summer Off-Peak All Other Hours from May – October Winter Peak 12 - 6 PM, Monday-Friday from November – April Winter Off-Peak All Other Hours from November – April Energy Charges $ per total kWh per day Block Charges1 0-15.9 kWh 15.9-20.7 kWh 20.7-31.8 kWh 31.8 – 47.7 kWh Over 47.7 kWh Summer Peak $0.293720 / kWh $0.293720 / kWh $0.393690 / kWh $ 0.486100 / kWh $ 0.534530 / kWh Summer Off-Peak $0.086640 / kWh $0.086640 / kWh $0.186610 / kWh $ 0.279020 / kWh $ 0.327450 / kWh Winter Peak $0.114720 / kWh $0.114720 / kWh $0.214690 / kWh $ 0.307100 / kWh $ 0.355530 / kWh Winter Off-Peak $0.089660 / kWh $0.089660 / kWh $0.189630 / kWh $ 0.282040 / kWh $ 0.330470 / kWh
1 – Block rates for the winter are the average rate for the winter block corresponding to the summer block Filename: PGE_E7_BaseP_Oct06.csv

NYSERDA DG/CHP Integrated Database System Utility Rate Details
CDH Energy Corporation 402 September 25, 2008
Pacific Gas & Electric
Rate Schedule E-7 – Residential Time-of-Use – Baseline P – January 2007 This voluntary schedule is available to customers for whom Schedule E-1 applies. Customer Charge $ 0.11532 per day Periods Summer Peak 12 - 6 PM, Monday-Friday from May – October Summer Off-Peak All Other Hours from May – October Winter Peak 12 - 6 PM, Monday-Friday from November – April Winter Off-Peak All Other Hours from November – April Energy Charges $ per total kWh per day Block Charges1 0-15.9 kWh 15.9-20.7 kWh 20.7-31.8 kWh 31.8 – 47.7 kWh Over 47.7 kWh Summer Peak $0.293720 / kWh $0.293720 / kWh $0.393270 / kWh $ 0.485290 / kWh $ 0.533520 / kWh Summer Off-Peak $0.086640 / kWh $0.086640 / kWh $0.186190 / kWh $ 0.278210 / kWh $ 0.326440 / kWh Winter Peak $0.114720 / kWh $0.114720 / kWh $0.214270 / kWh $ 0.306290 / kWh $ 0.354520 / kWh Winter Off-Peak $0.089660 / kWh $0.089660 / kWh $0.189210 / kWh $ 0.281230 / kWh $ 0.329460 / kWh
1 – Block rates for the winter are the average rate for the winter block corresponding to the summer block Filename: PGE_E7_BaseP_Jan07.csv
Pacific Gas & Electric
Rate Schedule E-7 – Residential Time-of-Use – Baseline P – July 2008 This voluntary schedule is available to customers for whom Schedule E-1 applies. Customer Charge $ 0.11532 per day Periods Summer Peak 12 - 6 PM, Monday-Friday from May – October Summer Off-Peak All Other Hours from May – October Winter Peak 12 - 6 PM, Monday-Friday from November – April Winter Off-Peak All Other Hours from November – April Energy Charges $ per total kWh per day Block Charges1 0-15.9 kWh 15.9-20.7 kWh 20.7-31.8 kWh 31.8 – 47.7 kWh Over 47.7 kWh Summer Peak $0.29840 / kWh $0.29840 / kWh $0.394340 / kWh $ 0.483030 / kWh $ 0.529500 / kWh Summer Off-Peak $0.08763 / kWh $0.08763 / kWh $0.18357 / kWh $ 0.272250 / kWh $ 0.318730 / kWh Winter Peak $0.11621 / kWh $0.11621 / kWh $0.21215 / kWh $ 0.300840 / kWh $ 0.347310 / kWh Winter Off-Peak $0.09070 / kWh $0.09070 / kWh $0.18664 / kWh $ 0.275330 / kWh $ 0.321800 / kWh
1 – Block rates for the winter are the average rate for the winter block corresponding to the summer block Filename: PGE_E7_BaseP_Jul08.csv

NYSERDA DG/CHP Integrated Database System Utility Rate Details
CDH Energy Corporation 403 September 25, 2008
Pacific Gas & Electric
Rate Schedule ES – Multi-Family – Baseline P – January 2007 This schedule is applicable to service for residential single-phase and polyphase service supplied to multifamily accommodations in other than a mobile-home park through one meter on a single premises and submetered to all individual tenants in accordance with Rule 18. This rate schedule is closed to new installations as defined in Decision 05-05-026. A customer whose building was constructed prior to December 14, 1981, and was served as a master-meter customer shall be eligible to convert from its master-meter rate schedule to a submetered rate schedule. Buildings originally constructed for a nonresidential purpose that have converted to a residential use before December 1981 or without the need for a building permit on or after July 1, 1982, shall be eligible to convert from their master-meter rate schedule to a submetered rate schedule. Customer Charge $ 0.14784 per day Periods Summer May – October Winter November – April Energy Charges $ per total kWh per day Block Charges1 0-15.9 kWh 15.9-20.7 kWh 20.7-31.8 kWh 31.8 – 47.7 kWh Over 47.7 kWh Summer $0.114300 / kWh $0.129890 / kWh $0.229440 / kWh $ 0.321460 / kWh $ 0.369690 / kWh Winter $0.117438 / kWh $0.216709 / kWh $0.282354 / kWh $ 0.350580 / kWh $ 0.369690 / kWh
1 – Block rates for the winter are the average rate for the winter block corresponding to the summer block Filename: PGE_ES_BaseP_Jan07.csv
Pacific Gas & Electric
Rate Schedule ES – Multi-Family – Baseline P – July08 This schedule is applicable to service for residential single-phase and polyphase service supplied to multifamily accommodations in other than a mobile-home park through one meter on a single premises and submetered to all individual tenants in accordance with Rule 18. This rate schedule is closed to new installations as defined in Decision 05-05-026. A customer whose building was constructed prior to December 14, 1981, and was served as a master-meter customer shall be eligible to convert from its master-meter rate schedule to a submetered rate schedule. Buildings originally constructed for a nonresidential purpose that have converted to a residential use before December 1981 or without the need for a building permit on or after July 1, 1982, shall be eligible to convert from their master-meter rate schedule to a submetered rate schedule. Customer Charge $ 0.14784 per day Periods Summer May – October Winter November – April Energy Charges $ per total kWh per day Block Charges1 0-15.9 kWh 15.9-20.7 kWh 20.7-31.8 kWh 31.8 – 47.7 kWh Over 47.7 kWh Summer $0.115900 / kWh $0.131420 / kWh $0.22800 / kWh $ 0.313040 / kWh $ 0.358760 / kWh Winter $0.115900 / kWh $0.131420 / kWh $0.22800 / kWh $ 0.313040 / kWh $ 0.358760 / kWh
1 – Block rates for the winter are the average rate for the winter block corresponding to the summer block Filename: PGE_ES_BaseP_Jul08.csv

NYSERDA DG/CHP Integrated Database System Utility Rate Details
CDH Energy Corporation 404 September 25, 2008
Pacific Gas & Electric
Rate Schedule A-1 – Small General Service – Single-Phase – July 2006 This schedule is not available to residential or agricultural service for which a residential or agricultural schedule is applicable, except for single-phase and polyphase service in common areas in a multifamily complex (see Common-Area Accounts section). This schedule is also not available to customers whose meter indicates a maximum demand of 200 kW or greater for three consecutive months, except customers that are identified as load research sites. Customer Charge $ 0.26612 per day Periods Summer May – October Winter November – April Energy Charges $ per total kWh Summer $0.17917 / kWh Winter $0.13088 / kWh
Filename: PGE_A1_sp_July06.csv
Pacific Gas & Electric
Rate Schedule A-1 – Small General Service – Single-Phase – October 2006

NYSERDA DG/CHP Integrated Database System Utility Rate Details
CDH Energy Corporation 405 September 25, 2008
This schedule is not available to residential or agricultural service for which a residential or agricultural schedule is applicable, except for single-phase and polyphase service in common areas in a multifamily complex (see Common-Area Accounts section). This schedule is also not available to customers whose meter indicates a maximum demand of 200 kW or greater for three consecutive months, except customers that are identified as load research sites. Customer Charge $ 0.26612 per day Periods Summer May – October Winter November – April Energy Charges $ per total kWh Summer $0.18349 / kWh Winter $0.13456 / kWh
Filename: PGE_A1_sp_Oct06.csv
Pacific Gas & Electric
Rate Schedule A-1 – Small General Service – Single-Phase – July 2008 This schedule is not available to residential or agricultural service for which a residential or agricultural schedule is applicable, except for single-phase and polyphase service in common areas in a multifamily complex (see Common-Area Accounts section). This schedule is also not available to customers whose meter indicates a maximum demand of 200 kW or greater for three consecutive months, except customers that are identified as load research sites. Customer Charge $ 0.29569 per day Periods Summer May – October Winter November – April Energy Charges $ per total kWh Summer $0.18376 / kWh Winter $0.13024 / kWh
Filename: PGE_A1_sp_Jul08.csv
Pacific Gas & Electric
Rate Schedule A-1 – Small General Service – Poly-Phase – July 2006 This schedule is not available to residential or agricultural service for which a residential or agricultural schedule is applicable, except for single-phase and polyphase service in common areas in a multifamily complex (see Common-Area Accounts section). This schedule is also not available to customers whose meter indicates a maximum demand of 200 kW or greater for three consecutive months, except customers that are identified as load research sites. Customer Charge $ 0.39425 per day Periods Summer May – October Winter November – April Energy Charges $ per total kWh Summer $0.17917 / kWh Winter $0.13088 / kWh
Filename: PGE_A1_pp_July06.csv

NYSERDA DG/CHP Integrated Database System Utility Rate Details
CDH Energy Corporation 406 September 25, 2008
Pacific Gas & Electric
Rate Schedule A-1 – Small General Service – Poly-Phase – October 2006 This schedule is not available to residential or agricultural service for which a residential or agricultural schedule is applicable, except for single-phase and polyphase service in common areas in a multifamily complex (see Common-Area Accounts section). This schedule is also not available to customers whose meter indicates a maximum demand of 200 kW or greater for three consecutive months, except customers that are identified as load research sites. Customer Charge $ 0.39425 per day Periods Summer May – October Winter November – April Energy Charges $ per total kWh Summer $0.18349/ kWh Winter $0.13456/ kWh
Filename: PGE_A1_pp_Oct06.csv
Pacific Gas & Electric
Rate Schedule A-1 – Small General Service – Poly-Phase – July 2008 This schedule is not available to residential or agricultural service for which a residential or agricultural schedule is applicable, except for single-phase and polyphase service in common areas in a multifamily complex (see Common-Area Accounts section). This schedule is also not available to customers whose meter indicates a maximum demand of 200 kW or greater for three consecutive months, except customers that are identified as load research sites. Customer Charge $ 0.44353 per day Periods Summer May – October Winter November – April Energy Charges $ per total kWh Summer $0.18376/ kWh Winter $0.13024/ kWh
Filename: PGE_A1_pp_Jul08.csv

NYSERDA DG/CHP Integrated Database System Utility Rate Details
CDH Energy Corporation 407 September 25, 2008
Pacific Gas & Electric
Rate Schedule A-6 – Small General Time-of-Use – Single-Phase – July 2006 Customers with a maximum demand of 200 kW or greater for three consecutive months must have an interval data meter that can be read remotely by PG&E and be on this or other applicable time-of-use schedule. Customer Charge $ 0.26612 per day Meter Charge $ 0.20107 per meter per day Periods Summer Peak 12 - 6 PM, Monday – Friday from May – October Summer Partial-Peak 8:30 AM – 12 PM, Monday – Friday from May – October Summer Off-Peak All Other Hours from May – October Winter Partial-Peak 8:30 AM – 9:30 PM, Monday-Friday from November – April Winter Off-Peak All Other Hours from November – April Energy Charges $ per total kWh Summer Peak $ 0.311250 / kWh Summer Partial-Peak $ 0.153970 / kWh Summer Off-Peak $ 0.092210 / kWh Winter Partial-Peak $ 0.135920 / kWh Winter Off-Peak $ 0.100810 / kWh
Filename: PGE_A6_sp_July06.csv
Pacific Gas & Electric
Rate Schedule A-6 – Small General Time-of-Use – Single-Phase – October 2006 Customers with a maximum demand of 200 kW or greater for three consecutive months must have an interval data meter that can be read remotely by PG&E and be on this or other applicable time-of-use schedule. Customer Charge $ 0.26612 per day Meter Charge $ 0.20107 per meter per day Periods Summer Peak 12 - 6 PM, Monday – Friday from May – October Summer Partial-Peak 8:30 AM – 12 PM, Monday – Friday from May – October Summer Off-Peak All Other Hours from May – October Winter Partial-Peak 8:30 AM – 9:30 PM, Monday-Friday from November – April Winter Off-Peak All Other Hours from November – April Energy Charges $ per total kWh Summer Peak $ 0.316180 / kWh Summer Partial-Peak $ 0.157380 / kWh Summer Off-Peak $ 0.095110 / kWh Winter Partial-Peak $ 0.139150 / kWh Winter Off-Peak $ 0.10376 / kWh
Filename: PGE_A6_sp_Oct06.csv

NYSERDA DG/CHP Integrated Database System Utility Rate Details
CDH Energy Corporation 408 September 25, 2008
Pacific Gas & Electric
Rate Schedule A-6 – Small General Time-of-Use – Single-Phase – July 2008 Customers with a maximum demand of 200 kW or greater for three consecutive months must have an interval data meter that can be read remotely by PG&E and be on this or other applicable time-of-use schedule. Customer Charge $ 0.29569 per day Meter Charge $ 0.20107 per meter per day Periods Summer Peak 12 - 6 PM, Monday – Friday from May – October Summer Partial-Peak 8:30 AM – 12 PM, Monday – Friday from May – October Summer Off-Peak All Other Hours from May – October Winter Partial-Peak 8:30 AM – 9:30 PM, Monday-Friday from November – April Winter Off-Peak All Other Hours from November – April Energy Charges $ per total kWh Summer Peak $ 0.370080 / kWh Summer Partial-Peak $ 0.173210 / kWh Summer Off-Peak $ 0.110870 / kWh Winter Partial-Peak $ 0.133490 / kWh Winter Off-Peak $ 0.110150 / kWh
Filename: PGE_A6_sp_Jul08.csv
Pacific Gas & Electric
Rate Schedule A-6 – Small General Time-of-Use – Poly-Phase – July 2006 Customers with a maximum demand of 200 kW or greater for three consecutive months must have an interval data meter that can be read remotely by PG&E and be on this or other applicable time-of-use schedule. Customer Charge $ 0.39425 per day Meter Charge $ 0.20107 per meter per day Periods Summer Peak 12 - 6 PM, Monday – Friday from May – October Summer Partial-Peak 8:30 AM – 12 PM, Monday – Friday from May – October Summer Off-Peak All Other Hours from May – October Winter Partial-Peak 8:30 AM – 9:30 PM, Monday-Friday from November – April Winter Off-Peak All Other Hours from November – April Energy Charges $ per total kWh Summer Peak $ 0.311250 / kWh Summer Partial-Peak $ 0.153970 / kWh Summer Off-Peak $ 0.092210 / kWh Winter Partial-Peak $ 0.135920 / kWh Winter Off-Peak $ 0.100810 / kWh
Filename: PGE_A6_pp_July06.csv

NYSERDA DG/CHP Integrated Database System Utility Rate Details
CDH Energy Corporation 409 September 25, 2008
Pacific Gas & Electric
Rate Schedule A-6 – Small General Time-of-Use – Poly-Phase – October 2006 Customers with a maximum demand of 200 kW or greater for three consecutive months must have an interval data meter that can be read remotely by PG&E and be on this or other applicable time-of-use schedule. Customer Charge $ 0.39425 per day Meter Charge $ 0.20107 per meter per day Periods Summer Peak 12 - 6 PM, Monday – Friday from May – October Summer Partial-Peak 8:30 AM – 12 PM, Monday – Friday from May – October Summer Off-Peak All Other Hours from May – October Winter Partial-Peak 8:30 AM – 9:30 PM, Monday-Friday from November – April Winter Off-Peak All Other Hours from November – April Energy Charges $ per total kWh Summer Peak $ 0.316180 / kWh Summer Partial-Peak $ 0.157380 / kWh Summer Off-Peak $ 0.095110 / kWh Winter Partial-Peak $ 0.139150 / kWh Winter Off-Peak $ 0.10376 / kWh
Filename: PGE_A6_pp_Oct06.csv
Pacific Gas & Electric
Rate Schedule A-6 – Small General Time-of-Use – Poly-Phase – July 2008 Customers with a maximum demand of 200 kW or greater for three consecutive months must have an interval data meter that can be read remotely by PG&E and be on this or other applicable time-of-use schedule. Customer Charge $ 0.44353 per day Meter Charge $ 0.20107 per meter per day Periods Summer Peak 12 - 6 PM, Monday – Friday from May – October Summer Partial-Peak 8:30 AM – 12 PM, Monday – Friday from May – October Summer Off-Peak All Other Hours from May – October Winter Partial-Peak 8:30 AM – 9:30 PM, Monday-Friday from November – April Winter Off-Peak All Other Hours from November – April Energy Charges $ per total kWh Summer Peak $ 0.370080 / kWh Summer Partial-Peak $ 0.173210 / kWh Summer Off-Peak $ 0.110870 / kWh Winter Partial-Peak $ 0..133490 / kWh Winter Off-Peak $ 0.110150 / kWh
Filename: PGE_A6_pp_Jul08.csv

NYSERDA DG/CHP Integrated Database System Utility Rate Details
CDH Energy Corporation 410 September 25, 2008
Pacific Gas & Electric
Rate Schedule E-19 – Medium General Demand-Metered Time-of-Use – Secondary – July 2006 A customer must take service under Schedule E-19 if: (1) the customer's load does not meet the Schedule E-20 requirements, but, (2) the customer's maximum billing demand (as defined below) has exceeded 499 kilowatts for at least three consecutive months during the most recent 12-month period (referred to as Schedule E-19). Customer Charge $ 9.03491 per meter per day Periods Summer Peak 12 - 6 PM, Monday – Friday from May – October Summer Partial-Peak 8:30 AM – 12 PM, Monday – Friday from May – October Summer Off-Peak All Other Hours from May – October Winter Partial-Peak 8:30 AM – 9:30 PM, Monday-Friday from November – April Winter Off-Peak All Other Hours from November – April Demand Charges $ per peak kW Summer Peak $ 14.55 / kW Summer Partial-Peak $ 3.46 / kW All Hours $ 7.13 / kW Winter Partial-Peak $ 1.78 / kW Energy Charges $ per total kWh Summer Peak $ 0.14170 / kWh Summer Partial-Peak $ 0.10411 / kWh Summer Off-Peak $ 0.07500 / kWh Winter Partial-Peak $ 0.09579 / kWh Winter Off-Peak $ 0.07844 / kWh
Filename: PGE_E19_Sec_nFTA_July06.csv
Pacific Gas & Electric
Rate Schedule E-19 – Medium General Demand-Metered Time-of-Use – Secondary – October 2006 A customer must take service under Schedule E-19 if: (1) the customer's load does not meet the Schedule E-20 requirements, but, (2) the customer's maximum billing demand (as defined below) has exceeded 499 kilowatts for at least three consecutive months during the most recent 12-month period (referred to as Schedule E-19). Customer Charge $ 9.03491 per meter per day Periods Summer Peak 12 - 6 PM, Monday – Friday from May – October Summer Partial-Peak 8:30 AM – 12 PM, Monday – Friday from May – October Summer Off-Peak All Other Hours from May – October Winter Partial-Peak 8:30 AM – 9:30 PM, Monday-Friday from November – April Winter Off-Peak All Other Hours from November – April Demand Charges $ per peak kW Summer Peak $ 14.72 / kW Summer Partial-Peak $ 3.51 / kW All Hours $ 7.03 / kW Winter Partial-Peak $ 1.83 / kW Energy Charges $ per total kWh Summer Peak $ 0.13799 / kWh Summer Partial-Peak $ 0.10016 / kWh Summer Off-Peak $ 0.07097 / kWh Winter Partial-Peak $ 0.09182 / kWh Winter Off-Peak $ 0.07442 / kWh
Filename: PGE_E19_Sec_nFTA_Oct06.csv

NYSERDA DG/CHP Integrated Database System Utility Rate Details
CDH Energy Corporation 411 September 25, 2008
Pacific Gas & Electric
Rate Schedule E-19 – Medium General Demand-Metered Time-of-Use – Secondary – July 2008 A customer must take service under Schedule E-19 if: (1) the customer's load does not meet the Schedule E-20 requirements, but, (2) the customer's maximum billing demand (as defined below) has exceeded 499 kilowatts for at least three consecutive months during the most recent 12-month period (referred to as Schedule E-19). Customer Charge $ 13.55236 per meter per day Periods Summer Peak 12 - 6 PM, Monday – Friday from May – October Summer Partial-Peak 8:30 AM – 12 PM, Monday – Friday from May – October Summer Off-Peak All Other Hours from May – October Winter Partial-Peak 8:30 AM – 9:30 PM, Monday-Friday from November – April Winter Off-Peak All Other Hours from November – April Demand Charges $ per peak kW Summer Peak $ 11.59 / kW Summer Partial-Peak $ 2.65/ kW All Hours $ 7.03 / kW Winter Partial-Peak $ 1.00 / kW Energy Charges $ per total kWh Summer Peak $ 0.13458 / kWh Summer Partial-Peak $ 0.09257 / kWh Summer Off-Peak $ 0.07541 / kWh Winter Partial-Peak $ 0.08256 / kWh Winter Off-Peak $ 0.07286 / kWh
Filename: PGE_E19_Sec_nFTA_Jul08.csv
Pacific Gas & Electric
Rate Schedule E-19 – Medium General Demand-Metered Time-of-Use – Secondary - Fixed Transition – July 2006 A customer must take service under Schedule E-19 if: (1) the customer's load does not meet the Schedule E-20 requirements, but, (2) the customer's maximum billing demand (as defined below) has exceeded 499 kilowatts for at least three consecutive months during the most recent 12-month period (referred to as Schedule E-19). Customer Charge $ 9.03491 per meter per day Periods Summer Peak 12 - 6 PM, Monday – Friday from May – October Summer Partial-Peak 8:30 AM – 12 PM, Monday – Friday from May – October Summer Off-Peak All Other Hours from May – October Winter Partial-Peak 8:30 AM – 9:30 PM, Monday-Friday from November – April Winter Off-Peak All Other Hours from November – April Demand Charges $ per peak kW Summer Peak $ 14.55 / kW Summer Partial-Peak $ 3.46 / kW All Hours $ 7.13 / kW Winter Partial-Peak $ 1.78 / kW Energy Charges $ per total kWh Summer Peak $ 0.14659 / kWh Summer Partial-Peak $ 0.10900 / kWh Summer Off-Peak $ 0.07989 / kWh Winter Partial-Peak $ 0.10068 / kWh Winter Off-Peak $ 0.08333 / kWh
Filename: PGE_E19_Sec_FTA_July06.csv

NYSERDA DG/CHP Integrated Database System Utility Rate Details
CDH Energy Corporation 412 September 25, 2008
Pacific Gas & Electric
Rate Schedule E-19 – Medium General Demand-Metered Time-of-Use – Secondary - Fixed Transition – October 2006 A customer must take service under Schedule E-19 if: (1) the customer's load does not meet the Schedule E-20 requirements, but, (2) the customer's maximum billing demand (as defined below) has exceeded 499 kilowatts for at least three consecutive months during the most recent 12-month period (referred to as Schedule E-19). Customer Charge $ 9.03491 per meter per day Periods Summer Peak 12 - 6 PM, Monday – Friday from May – October Summer Partial-Peak 8:30 AM – 12 PM, Monday – Friday from May – October Summer Off-Peak All Other Hours from May – October Winter Partial-Peak 8:30 AM – 9:30 PM, Monday-Friday from November – April Winter Off-Peak All Other Hours from November – April Demand Charges $ per peak kW Summer Peak $ 14.72 / kW Summer Partial-Peak $ 3.51 / kW All Hours $ 7.03 / kW Winter Partial-Peak $ 1.83 / kW Energy Charges $ per total kWh Summer Peak $ 0.14288 / kWh Summer Partial-Peak $ 0.10505 / kWh Summer Off-Peak $ 0.07586 / kWh Winter Partial-Peak $ 0.09671 / kWh Winter Off-Peak $ 0.07931 / kWh
Filename: PGE_E19_Sec_FTA_Oct06.csv

NYSERDA DG/CHP Integrated Database System Utility Rate Details
CDH Energy Corporation 413 September 25, 2008
Pacific Gas & Electric
Rate Schedule E-19 – Medium General Demand-Metered Time-of-Use – Secondary - Fixed Transition – July 2008 A customer must take service under Schedule E-19 if: (1) the customer's load does not meet the Schedule E-20 requirements, but, (2) the customer's maximum billing demand (as defined below) has exceeded 499 kilowatts for at least three consecutive months during the most recent 12-month period (referred to as Schedule E-19). Customer Charge $ 13.55236 per meter per day Periods Summer Peak 12 - 6 PM, Monday – Friday from May – October Summer Partial-Peak 8:30 AM – 12 PM, Monday – Friday from May – October Summer Off-Peak All Other Hours from May – October Winter Partial-Peak 8:30 AM – 9:30 PM, Monday-Friday from November – April Winter Off-Peak All Other Hours from November – April Demand Charges $ per peak kW Summer Peak $ 11.59 / kW Summer Partial-Peak $ 2.65 / kW All Hours $ 6.89/ kW Winter Partial-Peak $ 1.00 / kW Energy Charges $ per total kWh Summer Peak $ 0.13289 / kWh Summer Partial-Peak $ 0.09088 / kWh Summer Off-Peak $ 0.07372 / kWh Winter Partial-Peak $ 0.08087 / kWh Winter Off-Peak $ 0.07117 / kWh
Filename: PGE_E19_Sec_FTA_Jul08.csv
Pacific Gas & Electric
Rate Schedule E-19 – Medium General Demand-Metered Time-of-Use – Primary – July 2006 A customer must take service under Schedule E-19 if: (1) the customer's load does not meet the Schedule E-20 requirements, but, (2) the customer's maximum billing demand (as defined below) has exceeded 499 kilowatts for at least three consecutive months during the most recent 12-month period (referred to as Schedule E-19). Customer Charge $ 13.14168 per meter per day Periods Summer Peak 12 - 6 PM, Monday – Friday from May – October Summer Partial-Peak 8:30 AM – 12 PM, Monday – Friday from May – October Summer Off-Peak All Other Hours from May – October Winter Partial-Peak 8:30 AM – 9:30 PM, Monday-Friday from November – April Winter Off-Peak All Other Hours from November – April Demand Charges $ per peak kW Summer Peak $ 10.31 / kW Summer Partial-Peak $ 2.36 / kW All Hours $ 5.25 / kW Winter Partial-Peak $ 0.73 / kW Energy Charges $ per total kWh Summer Peak $ 0.13793 / kWh Summer Partial-Peak $ 0.10545 / kWh Summer Off-Peak $ 0.07806 / kWh Winter Partial-Peak $ 0.09614 / kWh Winter Off-Peak $ 0.08124 / kWh
Filename: PGE_E19_Pri_nFTA_July06.csv

NYSERDA DG/CHP Integrated Database System Utility Rate Details
CDH Energy Corporation 414 September 25, 2008
Pacific Gas & Electric
Rate Schedule E-19 – Medium General Demand-Metered Time-of-Use – Primary – October 2006 A customer must take service under Schedule E-19 if: (1) the customer's load does not meet the Schedule E-20 requirements, but, (2) the customer's maximum billing demand (as defined below) has exceeded 499 kilowatts for at least three consecutive months during the most recent 12-month period (referred to as Schedule E-19). Customer Charge $ 13.14168 per meter per day Periods Summer Peak 12 - 6 PM, Monday – Friday from May – October Summer Partial-Peak 8:30 AM – 12 PM, Monday – Friday from May – October Summer Off-Peak All Other Hours from May – October Winter Partial-Peak 8:30 AM – 9:30 PM, Monday-Friday from November – April Winter Off-Peak All Other Hours from November – April Demand Charges $ per peak kW Summer Peak $ 10.38 / kW Summer Partial-Peak $ 2.38 / kW All Hours $ 5.10 / kW Winter Partial-Peak $ 0.75 / kW Energy Charges $ per total kWh Summer Peak $ 0.12912 / kWh Summer Partial-Peak $ 0.09652 / kWh Summer Off-Peak $ 0.06909 / kWh Winter Partial-Peak $ 0.08719 / kWh Winter Off-Peak $ 0.07228 / kWh
Filename: PGE_E19_Pri_nFTA_Oct06.csv
Pacific Gas & Electric
Rate Schedule E-19 – Medium General Demand-Metered Time-of-Use – Primary – July 2008 A customer must take service under Schedule E-19 if: (1) the customer's load does not meet the Schedule E-20 requirements, but, (2) the customer's maximum billing demand (as defined below) has exceeded 499 kilowatts for at least three consecutive months during the most recent 12-month period (referred to as Schedule E-19). Customer Charge $ 19.71253 per meter per day Periods Summer Peak 12 - 6 PM, Monday – Friday from May – October Summer Partial-Peak 8:30 AM – 12 PM, Monday – Friday from May – October Summer Off-Peak All Other Hours from May – October Winter Partial-Peak 8:30 AM – 9:30 PM, Monday-Friday from November – April Winter Off-Peak All Other Hours from November – April Demand Charges $ per peak kW Summer Peak $ 10.47 / kW Summer Partial-Peak $ 2.40 / kW All Hours $ 5.89 / kW Winter Partial-Peak $ 0.75 / kW Energy Charges $ per total kWh Summer Peak $ 0.13420 / kWh Summer Partial-Peak $ 0.09073 / kWh Summer Off-Peak $ 0.07198 / kWh Winter Partial-Peak $ 0.07813 / kWh Winter Off-Peak $ 0.06858 / kWh
Filename: PGE_E19_Pri_nFTA_Jul08.csv

NYSERDA DG/CHP Integrated Database System Utility Rate Details
CDH Energy Corporation 415 September 25, 2008
Pacific Gas & Electric
Rate Schedule E-19 – Medium General Demand-Metered Time-of-Use – Primary – Fixed Transition – July 2006 A customer must take service under Schedule E-19 if: (1) the customer's load does not meet the Schedule E-20 requirements, but, (2) the customer's maximum billing demand (as defined below) has exceeded 499 kilowatts for at least three consecutive months during the most recent 12-month period (referred to as Schedule E-19). Customer Charge $ 13.14168 per meter per day Periods Summer Peak 12 - 6 PM, Monday – Friday from May – October Summer Partial-Peak 8:30 AM – 12 PM, Monday – Friday from May – October Summer Off-Peak All Other Hours from May – October Winter Partial-Peak 8:30 AM – 9:30 PM, Monday-Friday from November – April Winter Off-Peak All Other Hours from November – April Demand Charges $ per peak kW Summer Peak $ 10.31 / kW Summer Partial-Peak $ 2.36 / kW All Hours $ 5.25 / kW Winter Partial-Peak $ 0.73 / kW Energy Charges $ per total kWh Summer Peak $ 0.13304 / kWh Summer Partial-Peak $ 0.10056 / kWh Summer Off-Peak $ 0.07317 / kWh Winter Partial-Peak $ 0.09125 / kWh Winter Off-Peak $ 0.07635 / kWh
Filename: PGE_E19_Pri_FTA_July06.csv

NYSERDA DG/CHP Integrated Database System Utility Rate Details
CDH Energy Corporation 416 September 25, 2008
Pacific Gas & Electric
Rate Schedule E-19 – Medium General Demand-Metered Time-of-Use – Primary – Fixed Transition – October 2006 A customer must take service under Schedule E-19 if: (1) the customer's load does not meet the Schedule E-20 requirements, but, (2) the customer's maximum billing demand (as defined below) has exceeded 499 kilowatts for at least three consecutive months during the most recent 12-month period (referred to as Schedule E-19). Customer Charge $ 13.14168 per meter per day Periods Summer Peak 12 - 6 PM, Monday – Friday from May – October Summer Partial-Peak 8:30 AM – 12 PM, Monday – Friday from May – October Summer Off-Peak All Other Hours from May – October Winter Partial-Peak 8:30 AM – 9:30 PM, Monday-Friday from November – April Winter Off-Peak All Other Hours from November – April Demand Charges $ per peak kW Summer Peak $ 10.38 / kW Summer Partial-Peak $ 2.38 / kW All Hours $ 5.10 / kW Winter Partial-Peak $ 0.75 / kW Energy Charges $ per total kWh Summer Peak $ 0.13401 / kWh Summer Partial-Peak $ 0.10141 / kWh Summer Off-Peak $ 0.07398 / kWh Winter Partial-Peak $ 0.09208 / kWh Winter Off-Peak $ 0.07717 / kWh
Filename: PGE_E19_Pri_FTA_Oct06.csv

NYSERDA DG/CHP Integrated Database System Utility Rate Details
CDH Energy Corporation 417 September 25, 2008
Pacific Gas & Electric
Rate Schedule E-19 – Medium General Demand-Metered Time-of-Use – Primary – Fixed Transition – July 2008 A customer must take service under Schedule E-19 if: (1) the customer's load does not meet the Schedule E-20 requirements, but, (2) the customer's maximum billing demand (as defined below) has exceeded 499 kilowatts for at least three consecutive months during the most recent 12-month period (referred to as Schedule E-19). Customer Charge $ 19.71253per meter per day Periods Summer Peak 12 - 6 PM, Monday – Friday from May – October Summer Partial-Peak 8:30 AM – 12 PM, Monday – Friday from May – October Summer Off-Peak All Other Hours from May – October Winter Partial-Peak 8:30 AM – 9:30 PM, Monday-Friday from November – April Winter Off-Peak All Other Hours from November – April Demand Charges $ per peak kW Summer Peak $ 10.47 / kW Summer Partial-Peak $ 2.40 / kW All Hours $ 5.89 / kW Winter Partial-Peak $ 0.75 / kW Energy Charges $ per total kWh Summer Peak $ 0.13251 / kWh Summer Partial-Peak $ 0.08904 / kWh Summer Off-Peak $ 0.07029 / kWh Winter Partial-Peak $ 0.07644 / kWh Winter Off-Peak $ 0.06689 / kWh
Filename: PGE_E19_Pri_FTA_Jul08.csv

NYSERDA DG/CHP Integrated Database System Utility Rate Details
CDH Energy Corporation 418 September 25, 2008
Complete Southern California Edison Tariff The Southern California Edison rates are up-to-date as of June 25, 2008.
Southern California Edison
Schedule D Domestic - Single-Family - Baseline 10 – Single Family Applicable to domestic service including lighting, heating, cooking, and power or combination thereof in a single-family accommodation; also to domestic farm service when supplied through the farm operator's domestic meter. Customer Charge $ 0.02900 per meter per day Periods Summer June – September Winter October – May Energy Charges $ per total kWh per day Block Charges 0-10.2 kWh 10.2-13.3 kWh 13.3-20.4 kWh Over 20.4 kWh Summer $0.10690 / kWh $0.13285 / kWh $0.24922 / kWh $ 0.37080 / kWh 0-10.1 kWh 10.1-13.1 kWh 13.1-20.2 kWh Over 20.2 kWh Winter $0.09217 / kWh $0.11591 / kWh $0.22879 / kWh $ 0.34711 / kWh
Filename: SCE_D_sf_base10.csv
Southern California Edison
Schedule D Domestic - Single-Family - Baseline 10 – Single Family – January 07 Applicable to domestic service including lighting, heating, cooking, and power or combination thereof in a single-family accommodation; also to domestic farm service when supplied through the farm operator's domestic meter. Customer Charge $ 0.02900 per meter per day Periods Summer June – September Winter October – May Energy Charges $ per total kWh per day Block Charges 0-10.2 kWh 10.2-13.3 kWh 13.3-20.4 kWh Over 20.4 kWh Summer $0.10195 / kWh $0.12861 / kWh $0.24609 / kWh $ 0.36870 / kWh 0-10.1 kWh 10.1-13.1 kWh 13.1-20.2 kWh Over 20.2 kWh Winter $0.10195 / kWh $0.12861 / kWh $0.24609 / kWh $ 0.36870 / kWh
Filename: SCE_D_sf_base10_jan07.csv

NYSERDA DG/CHP Integrated Database System Utility Rate Details
CDH Energy Corporation 419 September 25, 2008
Southern California Edison
Schedule D Domestic - Single-Family - Baseline 10 – Single Family – June 2008 Applicable to domestic service including lighting, heating, cooking, and power or combination thereof in a single-family accommodation; also to domestic farm service when supplied through the farm operator's domestic meter. Customer Charge $ 0.02900 per meter per day Periods Summer June – September Winter October – May Energy Charges $ per total kWh per day Block Charges 0-10.2 kWh 10.2-13.3 kWh 13.3-20.4 kWh 20.4-30kWh Over 30 kWh Summer $0.03038 / kWh $0.057170 / kWh $0.161930 / kWh $0.210440 / kWh $ 0.25895 / kWh 0-10.2 kWh 10.2-13.3 kWh 13.3-20.4 kWh 20.4-30kWh Over 30 kWh Winter $0.03038 / kWh $0.057170 / kWh $0.161930 / kWh $0.210440 / kWh $ 0.25895 / kWh
Filename: SCE_D_sf_base10_Jun08.csv
Southern California Edison
Schedule D Domestic - Multi-Family - Baseline 10 – Multi Family – January 07 Applicable to domestic service including lighting, heating, cooking, and power or combination thereof in a single-family accommodation; also to domestic farm service when supplied through the farm operator's domestic meter. Customer Charge $ 0.02200 per meter per day Periods Summer June – September Winter October – May
Energy Charges $ per total kWh per day Block Charges 0-10.2 kWh 10.2-13.3 kWh 13.3-20.4 kWh Over 20.4 kWh Summer $0.10195 / kWh $0.12861 / kWh $0.24609 / kWh $ 0.36870 / kWh 0-10.1 kWh 10.1-13.1 kWh 13.1-20.2 kWh Over 20.2 kWh Winter $0.10195 / kWh $0.12861 / kWh $0.24609 / kWh $ 0.36870 / kWh
Filename: SCE_D_mf_base10_jan07.csv
Southern California Edison
Schedule D Domestic - Multi-Family - Baseline 10 – Multi Family – June 2008 Applicable to domestic service including lighting, heating, cooking, and power or combination thereof in a single-family accommodation; also to domestic farm service when supplied through the farm operator's domestic meter. Customer Charge $ 0.02200 per meter per day Periods Summer June – September Winter October – May
Energy Charges $ per total kWh per day Block Charges 0-10.2 kWh 10.2-13.3 kWh 13.3-20.4 kWh 20.4-30kWh Over 30 kWh Summer $0.03038 / kWh $0.057170 / kWh $0.161930 / kWh $0.210440 / kWh $ 0.25895 / kWh 0-10.2 kWh 10.2-13.3 kWh 13.3-20.4 kWh 20.4-30kWh Over 30 kWh Winter $0.03038 / kWh $0.057170 / kWh $0.161930 / kWh $0.210440 / kWh $ 0.25895 / kWh
Filename: SCE_D_mf_base10_jan07.csv

NYSERDA DG/CHP Integrated Database System Utility Rate Details
CDH Energy Corporation 420 September 25, 2008
Southern California Edison
Schedule D Domestic - Single-Family - Baseline 10 – Single Family All Electric Applicable to domestic service including lighting, heating, cooking, and power or combination thereof in a single-family accommodation; also to domestic farm service when supplied through the farm operator's domestic meter. Customer Charge $ 0.02900 per meter per day Periods Summer June – September Winter October – May Energy Charges $ per total kWh per day Block Charges 0-10.0 kWh 10.0-13.0 kWh 13.0-20.0 kWh Over 20.0 kWh Summer $0.10690 / kWh $0.13285 / kWh $0.24922 / kWh $ 0.37080 / kWh 0-16.2 kWh 16.2-21.1 kWh 21.1-32.4 kWh Over 32.4 kWh Winter $0.09217 / kWh $0.11591 / kWh $0.22879 / kWh $ 0.34711 / kWh
Filename: SCE_D_sf_base10_AllEl.csv
Southern California Edison
Schedule D Domestic - Single-Family - Baseline 10 – Single Family All Electric – January 07 Applicable to domestic service including lighting, heating, cooking, and power or combination thereof in a single-family accommodation; also to domestic farm service when supplied through the farm operator's domestic meter. Customer Charge $ 0.02900 per meter per day Periods Summer June – September Winter October – May Energy Charges $ per total kWh per day Block Charges 0-10.0 kWh 10.0-13.0 kWh 13.0-20.0 kWh Over 20.0 kWh Summer $0.10195 / kWh $0.12861 / kWh $0.24609 / kWh $ 0.36870 / kWh 0-16.2 kWh 16.2-21.1 kWh 21.1-32.4 kWh Over 32.4 kWh Winter $0.10195 / kWh $0.12861 / kWh $0.24609 / kWh $ 0.36870 / kWh
Filename: SCE_D_sf_base10_AllEl_jan07.csv

NYSERDA DG/CHP Integrated Database System Utility Rate Details
CDH Energy Corporation 421 September 25, 2008
Southern California Edison
Schedule D Domestic - Single-Family - Baseline 10 – Single Family All Electric – June 2008 Applicable to domestic service including lighting, heating, cooking, and power or combination thereof in a single-family accommodation; also to domestic farm service when supplied through the farm operator's domestic meter. Customer Charge $ 0.02900 per meter per day Periods Summer June – September Winter October – May Energy Charges $ per total kWh per day Block Charges 0-10.2 kWh 10.2-13.3 kWh 13.3-20.4 kWh 20.4-30kWh Over 30 kWh Summer $0.03038 / kWh $0.057170 / kWh $0.161930 / kWh $0.210440 / kWh $ 0.25895 / kWh 0-10.2 kWh 10.2-13.3 kWh 13.3-20.4 kWh 20.4-30kWh Over 30 kWh Winter $0.03038 / kWh $0.057170 / kWh $0.161930 / kWh $0.210440 / kWh $ 0.25895 / kWh
Filename: SCE_D_sf_base10_AllEl_Jun08.csv
Southern California Edison
Schedule D Domestic - Multi-Family - Baseline 10 – Multi Family All Electric – January 07 Applicable to domestic service including lighting, heating, cooking, and power or combination thereof in a single-family accommodation; also to domestic farm service when supplied through the farm operator's domestic meter. Customer Charge $ 0.02200 per meter per day Periods Summer June – September Winter October – May Energy Charges $ per total kWh per day Block Charges 0-10.0 kWh 10.0-13.0 kWh 13.0-20.0 kWh Over 20.0 kWh Summer $0.10195 / kWh $0.12861 / kWh $0.24609 / kWh $ 0.36870 / kWh 0-16.2 kWh 16.2-21.1 kWh 21.1-32.4 kWh Over 32.4 kWh Winter $0.10195 / kWh $0.12861 / kWh $0.24609 / kWh $ 0.36870 / kWh
Filename: SCE_D_mf_base10_AllEl_jan07.csv

NYSERDA DG/CHP Integrated Database System Utility Rate Details
CDH Energy Corporation 422 September 25, 2008
Southern California Edison
Schedule D Domestic - Multi-Family - Baseline 10 – Multi Family All Electric – June 2008 Applicable to domestic service including lighting, heating, cooking, and power or combination thereof in a single-family accommodation; also to domestic farm service when supplied through the farm operator's domestic meter. Customer Charge $ 0.02200 per meter per day Periods Summer June – September Winter October – May Energy Charges $ per total kWh per day Block Charges 0-10.2 kWh 10.2-13.3 kWh 13.3-20.4 kWh 20.4-30kWh Over 30 kWh Summer $0.03038 / kWh $0.057170 / kWh $0.161930 / kWh $0.210440 / kWh $ 0.25895 / kWh 0-10.2 kWh 10.2-13.3 kWh 13.3-20.4 kWh 20.4-30kWh Over 30 kWh Winter $0.03038 / kWh $0.057170 / kWh $0.161930 / kWh $0.210440 / kWh $ 0.25895 / kWh
Filename: SCE_D_mf_base10_AllEl_Jun08.csv
Southern California Edison
Schedule D Domestic - Single-Family - Baseline 15 – Single Family Applicable to domestic service including lighting, heating, cooking, and power or combination thereof in a single-family accommodation; also to domestic farm service when supplied through the farm operator's domestic meter. Customer Charge $ 0.02900 per meter per day Periods Summer June – September Winter October – May Energy Charges $ per total kWh per day Block Charges 0-47.6 kWh 47.6-61.9 kWh 61.9-95.2 kWh Over 95.2 kWh Summer $0.10690 / kWh $0.13285 / kWh $0.24922 / kWh $ 0.37080 / kWh 0-9.8 kWh 9.8-12.7 kWh 12.7-19.6 kWh Over 19.6 kWh Winter $0.09217 / kWh $0.11591 / kWh $0.22879 / kWh $ 0.34711 / kWh
Filename: SCE_D_sf_base15.csv

NYSERDA DG/CHP Integrated Database System Utility Rate Details
CDH Energy Corporation 423 September 25, 2008
Southern California Edison
Schedule D Domestic - Single-Family - Baseline 15 – Single Family – January 07 Applicable to domestic service including lighting, heating, cooking, and power or combination thereof in a single-family accommodation; also to domestic farm service when supplied through the farm operator's domestic meter. Customer Charge $ 0.02900 per meter per day Periods Summer June – September Winter October – May Energy Charges $ per total kWh per day Block Charges 0-47.6 kWh 47.6-61.9 kWh 61.9-95.2 kWh Over 95.2 kWh Summer $0.10195 / kWh $0.12861 / kWh $0.24609 / kWh $ 0.36870 / kWh 0-9.8 kWh 9.8-12.7 kWh 12.7-19.6 kWh Over 19.6 kWh Winter $0.10195 / kWh $0.12861 / kWh $0.24609 / kWh $ 0.36870 / kWh
Filename: SCE_D_sf_base15_jan07.csv
Southern California Edison
Schedule D Domestic - Single-Family - Baseline 15 – Single Family – June 2008 Applicable to domestic service including lighting, heating, cooking, and power or combination thereof in a single-family accommodation; also to domestic farm service when supplied through the farm operator's domestic meter. Customer Charge $ 0.02900 per meter per day Periods Summer June – September Winter October – May Energy Charges $ per total kWh per day Block Charges 0-13 kWh 13-20 kWh 20-61.9 kWh 61.9-95.2 kWh Over 95.2 kWh Summer $0.03038 / kWh $0.05717 / kWh $0.16193 / kWh $ 0.21044 / kWh $ 0.25895 / kWh 0-9.8 kWh 9.8-12.7 kWh 12.7-19.6 kWh 19.6-24 kWh Over 24 kWh Winter $0.03038 / kWh $0.05717 / kWh $0.16193 / kWh $ 0.21044 / kWh $ 0.25895 / kWh
Filename: SCE_D_sf_base15_Jun08.csv

NYSERDA DG/CHP Integrated Database System Utility Rate Details
CDH Energy Corporation 424 September 25, 2008
Southern California Edison
Schedule D Domestic - Multi-Family - Baseline 15 – Multi Family – January 07 Applicable to domestic service including lighting, heating, cooking, and power or combination thereof in a single-family accommodation; also to domestic farm service when supplied through the farm operator's domestic meter. Customer Charge $ 0.02200 per meter per day Periods Summer June – September Winter October – May Energy Charges $ per total kWh per day Block Charges 0-47.6 kWh 47.6-61.9 kWh 61.9-95.2 kWh Over 95.2 kWh Summer $0.10195 / kWh $0.12861 / kWh $0.24609 / kWh $ 0.36870 / kWh 0-9.8 kWh 9.8-12.7 kWh 12.7-19.6 kWh Over 19.6 kWh Winter $0.10195 / kWh $0.12861 / kWh $0.24609 / kWh $ 0.36870 / kWh
Filename: SCE_D_mf_base15_jan07.csv
Southern California Edison
Schedule D Domestic - Multi-Family - Baseline 15 – Multi Family – June 2008 Applicable to domestic service including lighting, heating, cooking, and power or combination thereof in a single-family accommodation; also to domestic farm service when supplied through the farm operator's domestic meter. Customer Charge $ 0.02200 per meter per day Periods Summer June – September Winter October – May Energy Charges $ per total kWh per day Block Charges 0-13 kWh 13-20 kWh 20-61.9 kWh 61.9-95.2 kWh Over 95.2 kWh Summer $0.03038 / kWh $0.05717 / kWh $0.16193 / kWh $ 0.21044 / kWh $ 0.25895 / kWh 0-9.8 kWh 9.8-12.7 kWh 12.7-19.6 kWh 19.6-24 kWh Over 24 kWh Winter $0.03038 / kWh $0.05717 / kWh $0.16193 / kWh $ 0.21044 / kWh $ 0.25895 / kWh
Filename: SCE_D_mf_base15_Jun08.csv

NYSERDA DG/CHP Integrated Database System Utility Rate Details
CDH Energy Corporation 425 September 25, 2008
Southern California Edison
Schedule D Domestic - Single-Family - Baseline 15 – Single Family All Electric Applicable to domestic service including lighting, heating, cooking, and power or combination thereof in a single-family accommodation; also to domestic farm service when supplied through the farm operator's domestic meter. Customer Charge $ 0.02900 per meter per day Periods Summer June – September Winter October – May Energy Charges $ per total kWh per day Block Charges 0-42.7 kWh 42.7-55.5 kWh 55.5-85.4 kWh Over 85.4 kWh Summer $0.10690 / kWh $0.13285 / kWh $0.24922 / kWh $ 0.37080 / kWh 0-27.4 kWh 27.4-35.6 kWh 35.6-54.8 kWh Over 54.8 kWh Winter $0.09217 / kWh $0.11591 / kWh $0.22879 / kWh $ 0.34711 / kWh
Filename: SCE_D_sf_base15_AllEl.csv
Southern California Edison
Schedule D Domestic - Single-Family - Baseline 15 – Single Family All Electric – January 07 Applicable to domestic service including lighting, heating, cooking, and power or combination thereof in a single-family accommodation; also to domestic farm service when supplied through the farm operator's domestic meter. Customer Charge $ 0.02900 per meter per day Periods Summer June – September Winter October – May Energy Charges $ per total kWh per day Block Charges 0-42.7 kWh 42.7-55.5 kWh 55.5-85.4 kWh Over 85.4 kWh Summer $0.10195 / kWh $0.12861 / kWh $0.24609 / kWh $ 0.36870 / kWh 0-27.4 kWh 27.4-35.6 kWh 35.6-54.8 kWh Over 54.8 kWh Winter $0.10195 / kWh $0.12861 / kWh $0.24609 / kWh $ 0.36870 / kWh
Filename: SCE_D_sf_base15_AllEl_jan07.csv

NYSERDA DG/CHP Integrated Database System Utility Rate Details
CDH Energy Corporation 426 September 25, 2008
Southern California Edison
Schedule D Domestic - Single-Family - Baseline 15 – Single Family All Electric – June 2008 Applicable to domestic service including lighting, heating, cooking, and power or combination thereof in a single-family accommodation; also to domestic farm service when supplied through the farm operator's domestic meter. Customer Charge $ 0.02900 per meter per day Periods Summer June – September Winter October – May Energy Charges $ per total kWh per day Block Charges 0-13 kWh 13-20 kWh 20-61.9 kWh 61.9-95.2 kWh Over 95.2 kWh Summer $0.03038 / kWh $0.05717 / kWh $0.16193 / kWh $ 0.21044 / kWh $ 0.25895 / kWh 0-9.8 kWh 9.8-12.7 kWh 12.7-19.6 kWh 19.6-24 kWh Over 24 kWh Winter $0.03038 / kWh $0.05717 / kWh $0.16193 / kWh $ 0.21044 / kWh $ 0.25895 / kWh
Filename: SCE_D_sf_base15_AllEl_Jun08.csv
Southern California Edison
Schedule D Domestic - Multi-Family - Baseline 15 – Multi Family All Electric – January 07 Applicable to domestic service including lighting, heating, cooking, and power or combination thereof in a single-family accommodation; also to domestic farm service when supplied through the farm operator's domestic meter. Customer Charge $ 0.02200 per meter per day Periods Summer June – September Winter October – May Energy Charges $ per total kWh per day Block Charges 0-42.7 kWh 42.7-55.5 kWh 55.5-85.4 kWh Over 85.4 kWh Summer $0.10195 / kWh $0.12861 / kWh $0.24609 / kWh $ 0.36870 / kWh 0-27.4 kWh 27.4-35.6 kWh 35.6-54.8 kWh Over 54.8 kWh Winter $0.10195 / kWh $0.12861 / kWh $0.24609 / kWh $ 0.36870 / kWh
Filename: SCE_D_mf_base15_AllEl_jan07.csv

NYSERDA DG/CHP Integrated Database System Utility Rate Details
CDH Energy Corporation 427 September 25, 2008
Southern California Edison
Schedule D Domestic - Multi-Family - Baseline 15 – Multi Family All Electric – June 2008 Applicable to domestic service including lighting, heating, cooking, and power or combination thereof in a single-family accommodation; also to domestic farm service when supplied through the farm operator's domestic meter. Customer Charge $ 0.02200 per meter per day Periods Summer June – September Winter October – May Energy Charges $ per total kWh per day Block Charges 0-13 kWh 13-20 kWh 20-61.9 kWh 61.9-95.2 kWh Over 95.2 kWh Summer $0.03038 / kWh $0.05717 / kWh $0.16193 / kWh $ 0.21044 / kWh $ 0.25895 / kWh 0-9.8 kWh 9.8-12.7 kWh 12.7-19.6 kWh 19.6-24 kWh Over 24 kWh Winter $0.03038 / kWh $0.05717 / kWh $0.16193 / kWh $ 0.21044 / kWh $ 0.25895 / kWh
Filename: SCE_D_mf_base15_AllEl_Jun08.csv
Southern California Edison
Schedule GS-1 General Service Non-Demand – Secondary Single-Phase Applicable to single- and three-phase general service including lighting and power, except that the customer whose monthly maximum demand, in the opinion of SCE, is expected to exceed 20 kW or has exceeded 20 kW in any three months during the preceding 12 months is ineligible for service under this Schedule. Customer Charge $ 0.43000 per meter per day Periods Summer June – September Winter October – May Energy Charges $ per total kWh for Total Delivery and Generation Summer $0.21736 / kWh Winter $0.13609 / kWh
Filename: SCE_GS1_Sec_sp.csv
Southern California Edison
Schedule GS-1 General Service Non-Demand – Secondary Single-Phase June 2008 Applicable to single- and three-phase general service including lighting and power, except that the customer whose monthly maximum demand, in the opinion of SCE, is expected to exceed 20 kW or has exceeded 20 kW in any three months during the preceding 12 months is ineligible for service under this Schedule. Customer Charge $ 0.56500 per meter per day Periods Summer June – September Winter October – May Energy Charges $ per total kWh for Total Delivery and Generation Summer $0.15785 / kWh Winter $0.15316 / kWh
Filename: SCE_GS1_Sec_sp_Jun08.csv

NYSERDA DG/CHP Integrated Database System Utility Rate Details
CDH Energy Corporation 428 September 25, 2008
Southern California Edison
Schedule GS-1 General Service Non-Demand – Secondary Three-Phase Applicable to single- and three-phase general service including lighting and power, except that the customer whose monthly maximum demand, in the opinion of SCE, is expected to exceed 20 kW or has exceeded 20 kW in any three months during the preceding 12 months is ineligible for service under this Schedule. Customer Charge $ 0.43000 per meter per day Poly-Phase Charge $ 0.07300 per day Periods Summer June – September Winter October – May
Energy Charges $ per total kWh for Total Delivery and Generation and Voltage Discount
Summer $0.21736 / kWh Winter $0.13609 / kWh
Filename: SCE_GS1_Sec_tp.csv
Southern California Edison
Schedule GS-1 General Service Non-Demand – Secondary Three-Phase – June 2008 Applicable to single- and three-phase general service including lighting and power, except that the customer whose monthly maximum demand, in the opinion of SCE, is expected to exceed 20 kW or has exceeded 20 kW in any three months during the preceding 12 months is ineligible for service under this Schedule. Customer Charge $ 0.56500 per meter per day Poly-Phase Charge $ 0.13800 per day Periods Summer June – September Winter October – May
Energy Charges $ per total kWh for Total Delivery and Generation and Voltage Discount
Summer $0.15785 / kWh Winter $0.15316 / kWh
Filename: SCE_GS1_Sec_tp_Jun08.csv

NYSERDA DG/CHP Integrated Database System Utility Rate Details
CDH Energy Corporation 429 September 25, 2008
Southern California Edison
Schedule GS-1 General Service Non-Demand – Primary Applicable to single- and three-phase general service including lighting and power, except that the customer whose monthly maximum demand, in the opinion of SCE, is expected to exceed 20 kW or has exceeded 20 kW in any three months during the preceding 12 months is ineligible for service under this Schedule. Customer Charge $ 0.43000 per meter per day Poly-Phase Charge $ 0.07300 per day Periods Summer June – September Winter October – May
Energy Charges $ per total kWh for Total Delivery and Generation and Voltage Discount
Summer $0.21487 / kWh Winter $0.13360 / kWh
Filename: SCE_GS1_Pri.csv
Southern California Edison
Schedule GS-1 General Service Non-Demand – Primary – June 2008 Applicable to single- and three-phase general service including lighting and power, except that the customer whose monthly maximum demand, in the opinion of SCE, is expected to exceed 20 kW or has exceeded 20 kW in any three months during the preceding 12 months is ineligible for service under this Schedule. Customer Charge $ 0.56500 per meter per day Poly-Phase Charge $ 0.13800 per day Periods Summer June – September Winter October – May
Energy Charges $ per total kWh for Total Delivery and Generation and Voltage Discount
Summer $0.14903 / kWh Winter $0.14434 / kWh
Filename: SCE_GS1_Pri_Jun08.csv
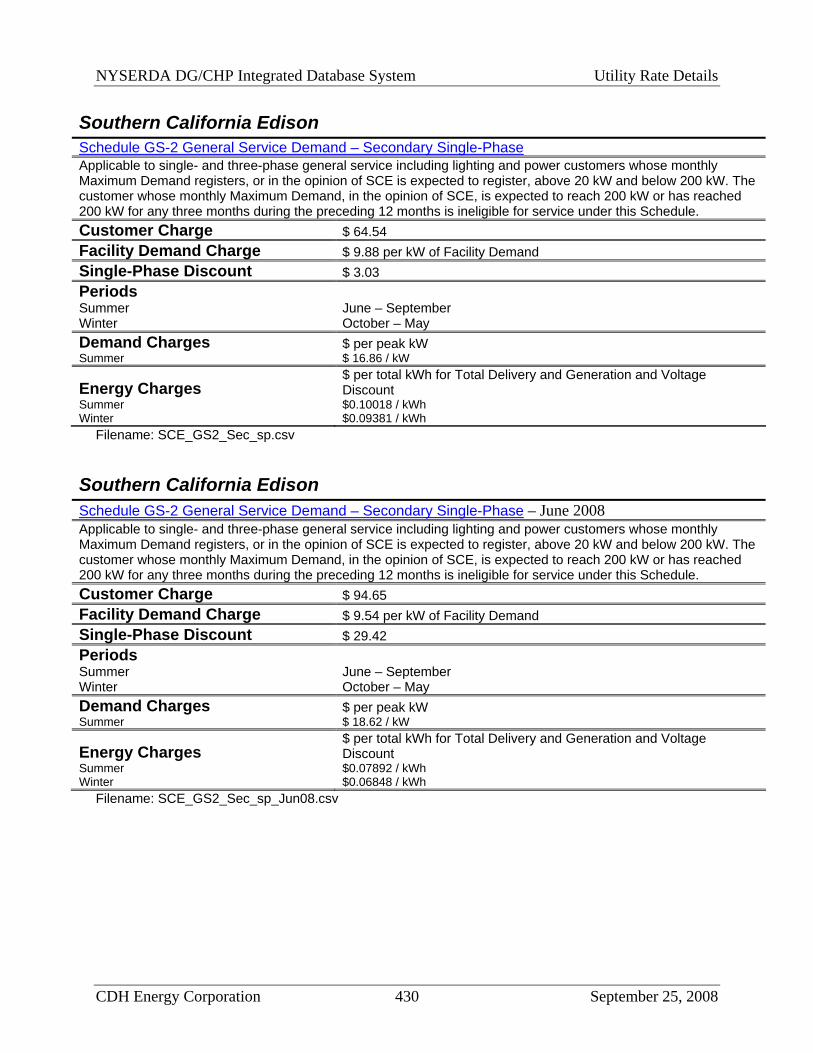
NYSERDA DG/CHP Integrated Database System Utility Rate Details
CDH Energy Corporation 430 September 25, 2008
Southern California Edison
Schedule GS-2 General Service Demand – Secondary Single-Phase Applicable to single- and three-phase general service including lighting and power customers whose monthly Maximum Demand registers, or in the opinion of SCE is expected to register, above 20 kW and below 200 kW. The customer whose monthly Maximum Demand, in the opinion of SCE, is expected to reach 200 kW or has reached 200 kW for any three months during the preceding 12 months is ineligible for service under this Schedule. Customer Charge $ 64.54 Facility Demand Charge $ 9.88 per kW of Facility Demand Single-Phase Discount $ 3.03 Periods Summer June – September Winter October – May Demand Charges $ per peak kW Summer $ 16.86 / kW
Energy Charges $ per total kWh for Total Delivery and Generation and Voltage Discount
Summer $0.10018 / kWh Winter $0.09381 / kWh
Filename: SCE_GS2_Sec_sp.csv
Southern California Edison
Schedule GS-2 General Service Demand – Secondary Single-Phase – June 2008 Applicable to single- and three-phase general service including lighting and power customers whose monthly Maximum Demand registers, or in the opinion of SCE is expected to register, above 20 kW and below 200 kW. The customer whose monthly Maximum Demand, in the opinion of SCE, is expected to reach 200 kW or has reached 200 kW for any three months during the preceding 12 months is ineligible for service under this Schedule. Customer Charge $ 94.65 Facility Demand Charge $ 9.54 per kW of Facility Demand Single-Phase Discount $ 29.42 Periods Summer June – September Winter October – May Demand Charges $ per peak kW Summer $ 18.62 / kW
Energy Charges $ per total kWh for Total Delivery and Generation and Voltage Discount
Summer $0.07892 / kWh Winter $0.06848 / kWh
Filename: SCE_GS2_Sec_sp_Jun08.csv

NYSERDA DG/CHP Integrated Database System Utility Rate Details
CDH Energy Corporation 431 September 25, 2008
Southern California Edison
Schedule GS-2 General Service Demand – Secondary Three-Phase Applicable to single- and three-phase general service including lighting and power customers whose monthly Maximum Demand registers, or in the opinion of SCE is expected to register, above 20 kW and below 200 kW. The customer whose monthly Maximum Demand, in the opinion of SCE, is expected to reach 200 kW or has reached 200 kW for any three months during the preceding 12 months is ineligible for service under this Schedule. Customer Charge $ 64.54 Facility Demand Charge $ 9.88 per kW of Facility Demand Periods Summer June – September Winter October – May Demand Charges $ per peak kW Summer $ 16.86 / kW
Energy Charges $ per total kWh for Total Delivery and Generation and Voltage Discount
Summer $0.10018 / kWh Winter $0.09381 / kWh
Filename: SCE_GS2_Sec_tp.csv
Southern California Edison
Schedule GS-2 General Service Demand – Secondary Three-Phase –June 2008 Applicable to single- and three-phase general service including lighting and power customers whose monthly Maximum Demand registers, or in the opinion of SCE is expected to register, above 20 kW and below 200 kW. The customer whose monthly Maximum Demand, in the opinion of SCE, is expected to reach 200 kW or has reached 200 kW for any three months during the preceding 12 months is ineligible for service under this Schedule. Customer Charge $ 94.65 Facility Demand Charge $ 9.54 per kW of Facility Demand Periods Summer June – September Winter October – May Demand Charges $ per peak kW Summer $ 18.62 / kW
Energy Charges $ per total kWh for Total Delivery and Generation and Voltage Discount
Summer $0.07892 / kWh Winter $0.06848 / kWh
Filename: SCE_GS2_Sec_tp_Jun08.csv

NYSERDA DG/CHP Integrated Database System Utility Rate Details
CDH Energy Corporation 432 September 25, 2008
Southern California Edison
Schedule GS-2 General Service Demand – Time-of-Use - Secondary Single-Phase Applicable to single- and three-phase general service including lighting and power customers whose monthly Maximum Demand registers, or in the opinion of SCE is expected to register, above 20 kW and below 200 kW. The customer whose monthly Maximum Demand, in the opinion of SCE, is expected to reach 200 kW or has reached 200 kW for any three months during the preceding 12 months is ineligible for service under this Schedule. Customer Charge $ 64.54 Facility Demand Charge $ 9.88 per kW of Facility Demand Single-Phase Discount $ 3.03 Periods Summer On-Peak 12 - 6 PM, Monday – Friday from May – October
Summer Mid-Peak 8 AM – 12 PM and 6 PM to 11 PM, Monday – Friday from May – October
Summer Off-Peak All Other Hours from May – October Winter Mid-Peak 8 AM – 9 PM, Monday-Friday from November – April Winter Off-Peak All Other Hours from November – April Demand Charges $ per peak kW All Summer Periods $ 16.86 / kW Energy Charges $ per total kWh Summer Peak $ 0.19715 / kWh Summer Mid-Peak $ 0.10107 / kWh Summer Off-Peak $ 0.04412 / kWh Winter Mid-Peak $ 0.13809 / kWh Winter Off-Peak $ 0.04436 / kWh
Filename: SCE_GS2_TOU_Sec_sp.csv

NYSERDA DG/CHP Integrated Database System Utility Rate Details
CDH Energy Corporation 433 September 25, 2008
Southern California Edison
Schedule GS-2 General Service Demand – Time-of-Use - Secondary Single-Phase – June 2008 Applicable to single- and three-phase general service including lighting and power customers whose monthly Maximum Demand registers, or in the opinion of SCE is expected to register, above 20 kW and below 200 kW. The customer whose monthly Maximum Demand, in the opinion of SCE, is expected to reach 200 kW or has reached 200 kW for any three months during the preceding 12 months is ineligible for service under this Schedule. Customer Charge $ 94.65 Facility Demand Charge $ 9.54 per kW of Facility Demand Single-Phase Discount $ 29.42 Periods Summer On-Peak 12 - 6 PM, Monday – Friday from May – October
Summer Mid-Peak 8 AM – 12 PM and 6 PM to 11 PM, Monday – Friday from May – October
Summer Off-Peak All Other Hours from May – October Winter Mid-Peak 8 AM – 9 PM, Monday-Friday from November – April Winter Off-Peak All Other Hours from November – April Demand Charges $ per peak kW All Summer Periods $ 18.62 / kW Energy Charges $ per total kWh Summer Peak $ 0.28613 / kWh Summer Mid-Peak $ 0.22490 / kWh Summer Off-Peak $ 0.04412 / kWh Winter Mid-Peak $ 0.04880 / kWh Winter Off-Peak $ 0.05372 / kWh
Filename: SCE_GS2_TOU_Sec_sp_Jun08.csv

NYSERDA DG/CHP Integrated Database System Utility Rate Details
CDH Energy Corporation 434 September 25, 2008
Southern California Edison
Schedule GS-2 General Service Demand – Time-of-Use - Secondary Three-Phase Applicable to single- and three-phase general service including lighting and power customers whose monthly Maximum Demand registers, or in the opinion of SCE is expected to register, above 20 kW and below 200 kW. The customer whose monthly Maximum Demand, in the opinion of SCE, is expected to reach 200 kW or has reached 200 kW for any three months during the preceding 12 months is ineligible for service under this Schedule. Customer Charge $ 64.54 Facility Demand Charge $ 9.88 per kW of Facility Demand Periods Summer On-Peak 12 - 6 PM, Monday – Friday from May – October
Summer Mid-Peak 8 AM – 12 PM and 6 PM to 11 PM, Monday – Friday from May – October
Summer Off-Peak All Other Hours from May – October Winter Mid-Peak 8 AM – 9 PM, Monday-Friday from November – April Winter Off-Peak All Other Hours from November – April Demand Charges $ per peak kW All Summer Periods $ 16.86 / kW Energy Charges $ per total kWh Summer Peak $ 0.19715 / kWh Summer Mid-Peak $ 0.10107 / kWh Summer Off-Peak $ 0.04412 / kWh Winter Mid-Peak $ 0.13809 / kWh Winter Off-Peak $ 0.04436 / kWh
Filename: SCE_GS2_TOU_Sec_tp.csv

NYSERDA DG/CHP Integrated Database System Utility Rate Details
CDH Energy Corporation 435 September 25, 2008
Southern California Edison
Schedule GS-2 General Service Demand – Time-of-Use - Secondary Three-Phase – June 2008 Applicable to single- and three-phase general service including lighting and power customers whose monthly Maximum Demand registers, or in the opinion of SCE is expected to register, above 20 kW and below 200 kW. The customer whose monthly Maximum Demand, in the opinion of SCE, is expected to reach 200 kW or has reached 200 kW for any three months during the preceding 12 months is ineligible for service under this Schedule. Customer Charge $ 94.65 Facility Demand Charge $ 9.54 per kW of Facility Demand Periods Summer On-Peak 12 - 6 PM, Monday – Friday from May – October
Summer Mid-Peak 8 AM – 12 PM and 6 PM to 11 PM, Monday – Friday from May – October
Summer Off-Peak All Other Hours from May – October Winter Mid-Peak 8 AM – 9 PM, Monday-Friday from November – April Winter Off-Peak All Other Hours from November – April Demand Charges $ per peak kW All Summer Periods $ 18.62 / kW Energy Charges $ per total kWh Summer Peak $ 0.28613 / kWh Summer Mid-Peak $ 0.22490 / kWh Summer Off-Peak $ 0.04412 / kWh Winter Mid-Peak $ 0.04880 / kWh Winter Off-Peak $ 0.05372 / kWh
Filename: SCE_GS2_TOU_Sec_tp_Jun08.csv

NYSERDA DG/CHP Integrated Database System Utility Rate Details
CDH Energy Corporation 436 September 25, 2008
Southern California Edison
Schedule TOU-8 – General Service - Large Applicable to general service including lighting and power, except agricultural water pumping accounts as described in Special Condition 12. This Schedule is applicable to and mandatory for all customers whose monthly maximum demand, in the opinion of SCE, is expected to exceed 500 kW or has exceeded 500 kW in any three months during the preceding 12 months, except that customers served on this Schedule may elect service under any applicable schedules optional hereto. Customer Charge $ 346.00 Facility Demand Charge $ 8.31 per kW of Facility Demand Periods Summer On-Peak 12 - 6 PM, Monday – Friday from May – October
Summer Mid-Peak 8 AM – 12 PM and 6 PM to 11 PM, Monday – Friday from May – October
Summer Off-Peak All Other Hours from May – October Winter Mid-Peak 8 AM – 9 PM, Monday-Friday from November – April Winter Off-Peak All Other Hours from November – April Demand Charges $ per peak kW Summer On-Peak $ 16.91 / kW Summer Mid-Peak $ 5.71 / kW Energy Charges $ per total kWh Summer Peak $ 0.12882 / kWh Summer Mid-Peak $ 0.09861 / kWh Summer Off-Peak $ 0.05900 / kWh Winter Mid-Peak $ 0.10165 / kWh Winter Off-Peak $ 0.06313 / kWh
Filename: SCE_TOU8.csv

NYSERDA DG/CHP Integrated Database System Utility Rate Details
CDH Energy Corporation 437 September 25, 2008
Southern California Edison
Schedule TOU-8 – General Service - Large – June 2008 Applicable to general service including lighting and power, except agricultural water pumping accounts as described in Special Condition 12. This Schedule is applicable to and mandatory for all customers whose monthly maximum demand, in the opinion of SCE, is expected to exceed 500 kW or has exceeded 500 kW in any three months during the preceding 12 months, except that customers served on this Schedule may elect service under any applicable schedules optional hereto. Customer Charge $ 458.04 Facility Demand Charge $ 10.77 per kW of Facility Demand Periods Summer On-Peak 12 - 6 PM, Monday – Friday from May – October
Summer Mid-Peak 8 AM – 12 PM and 6 PM to 11 PM, Monday – Friday from May – October
Summer Off-Peak All Other Hours from May – October Winter Mid-Peak 8 AM – 9 PM, Monday-Friday from November – April Winter Off-Peak All Other Hours from November – April Demand Charges $ per peak kW Summer On-Peak $ 15.23 / kW Summer Mid-Peak $ 5.14 / kW Energy Charges $ per total kWh Summer Peak $ 0.11346 / kWh Summer Mid-Peak $ 0.08623 / kWh Summer Off-Peak $ 0.05055 / kWh Winter Mid-Peak $ 0.08898 / kWh Winter Off-Peak $ 0.05429 / kWh
Filename: SCE_TOU8_Jun08.csv

NYSERDA DG/CHP Integrated Database System Utility Rate Details
CDH Energy Corporation 438 September 25, 2008
Southern California Edison
Schedule TOU-8 – General Service – Large – 2 kV through 50 kV – December 2007 Applicable to general service including lighting and power, except agricultural water pumping accounts as described in Special Condition 12. This Schedule is applicable to and mandatory for all customers whose monthly maximum demand, in the opinion of SCE, is expected to exceed 500 kW or has exceeded 500 kW in any three months during the preceding 12 months, except that customers served on this Schedule may elect service under any applicable schedules optional hereto. Customer Charge $ 249.77
Facility Demand Charge $ 9.20 per kW of Facility Demand: Transmission and Distribution Charges
Periods Summer On-Peak 12 - 6 PM, Monday – Friday from June – September
Summer Mid-Peak 8 AM – 12 PM and 6 PM to 11 PM, Monday – Friday from June – September
Summer Off-Peak All Other Hours from June – September Winter Mid-Peak 8 AM – 9 PM, Monday-Friday from October – May Winter Off-Peak All Other Hours from October – May Demand Charges $ per peak kW Summer On-Peak $ 15.62 / kW Summer Mid-Peak $ 5.29 / kW Energy Charges $ per total kWh Summer Peak $ 0.11538 / kWh Summer Mid-Peak $ 0.08754 / kWh Summer Off-Peak $ 0.05100 / kWh Winter Mid-Peak $ 0.09037 / kWh Winter Off-Peak $ 0.05485 / kWh
Filename: SCE_TOU8_2kVto50kV_Dec07.csv

NYSERDA DG/CHP Integrated Database System Utility Rate Details
CDH Energy Corporation 439 September 25, 2008
Southern California Edison
Schedule TOU-8 – General Service – Large – 2 kV through 50 kV – June 2008 Applicable to general service including lighting and power, except agricultural water pumping accounts as described in Special Condition 12. This Schedule is applicable to and mandatory for all customers whose monthly maximum demand, in the opinion of SCE, is expected to exceed 500 kW or has exceeded 500 kW in any three months during the preceding 12 months, except that customers served on this Schedule may elect service under any applicable schedules optional hereto. Customer Charge $ 275.69
Facility Demand Charge $ 10.21 per kW of Facility Demand: Transmission and Distribution Charges
Periods Summer On-Peak 12 - 6 PM, Monday – Friday from June – September
Summer Mid-Peak 8 AM – 12 PM and 6 PM to 11 PM, Monday – Friday from June – September
Summer Off-Peak All Other Hours from June – September Winter Mid-Peak 8 AM – 9 PM, Monday-Friday from October – May Winter Off-Peak All Other Hours from October – May Demand Charges $ per peak kW Summer On-Peak $ 15.48 / kW Summer Mid-Peak $ 5.24 / kW Energy Charges $ per total kWh Summer Peak $ 0.11487 / kWh Summer Mid-Peak $ 0.08728 / kWh Summer Off-Peak $ 0.05107 / kWh Winter Mid-Peak $ 0.09008 / kWh Winter Off-Peak $ 0.05488 / kWh
Filename: SCE_TOU8_2kVto50kV_Jun08.csv

NYSERDA DG/CHP Integrated Database System Utility Rate Details
CDH Energy Corporation 440 September 25, 2008
Complete Florida Light & Power Tariff The Florida Light & Power rates are up-to-date as of June 25, 2008.
Florida Light & Power
Rate Schedule RS-1 – Residential Service For service for all domestic purposes in individually metered dwelling units and in duplexes and triplexes, including the separately metered non-commercial facilities of a residential Customer (i.e., garages, water pumps, etc.). Customer Charge $ 5.17
Energy Charges $ per total kWh for Base, Conservation, Capacity Payment, Environmental and Fuel Charges
0 – 1,000 kWh Over 1,000 kWh Block Charges $ 0.09907 / kWh $ 0.11136 / kWh
Filename: FLP_RS1.csv
Florida Light & Power
Rate Schedule RS-1 – Residential Service – June 2008 For service for all domestic purposes in individually metered dwelling units and in duplexes and triplexes, including the separately metered non-commercial facilities of a residential Customer (i.e., garages, water pumps, etc.). Customer Charge $ 5.34
Energy Charges $ per total kWh for Base, Conservation, Capacity Payment, Environmental and Fuel Charges
0 – 1,000 kWh Over 1,000 kWh Block Charges $ 0.093 / kWh $ 0.119/ kWh
Filename: FLP_RS1_Jun08.csv
Florida Light & Power
Rate Schedule RST-1 – Residential Service - Time-of-Use For electric service required for commercial or industrial lighting, power and any other purpose with a demand of 20 kw or less. This is an optional rate available to General Service - Non Demand customers upon request subject to availability of meters. Customer Charge $ 8.20 Periods Summer On-Peak 12 – 9PM, Monday-Friday from April – October Winter On-Peak 6 – 10 AM and 6 – 10 PM, Monday-Friday from November – March Off-Peak All Hours not in the On-Peak Periods
Energy Charges $ per total kWh for Base, Conservation, Capacity Payment, Environmental and Fuel Charges
Summer On-Peak $ 0.14263 / kWh Winter On-Peak $ 0.14263 / kWh Off-Peak $ 0.08915 / kWh
Filename: FLP_RST1.csv

NYSERDA DG/CHP Integrated Database System Utility Rate Details
CDH Energy Corporation 441 September 25, 2008
Florida Light & Power
Rate Schedule RST-1 – Residential Service - Time-of-Use – June 2008 For electric service required for commercial or industrial lighting, power and any other purpose with a demand of 20 kw or less. This is an optional rate available to General Service - Non Demand customers upon request subject to availability of meters. Customer Charge $ 8.47 Periods Summer On-Peak 12 – 9PM, Monday-Friday from April – October Winter On-Peak 6 – 10 AM and 6 – 10 PM, Monday-Friday from November – March Off-Peak All Hours not in the On-Peak Periods
Energy Charges $ per total kWh for Base, Conservation, Capacity Payment, Environmental and Fuel Charges
Summer On-Peak $ 0.13895 / kWh Winter On-Peak $ 0.13895 / kWh Off-Peak $ 0.08288 / kWh
Filename: FLP_RST1_Jun08.csv
Florida Light & Power
Rate Schedule GS-1 – General Service Non-Demand For electric service required for commercial or industrial lighting, power and any other purpose with a demand of 20 kw or less. Customer Charge $ 8.24 Energy Charges $ per total kWh Base, Conservation, Capacity Payment, Environmental and Fuel Charge $ 0.10728 / kWh
Filename: FLP_GS1.csv
Florida Light & Power
Rate Schedule GS-1 – General Service Non-Demand – June 2008 For electric service required for commercial or industrial lighting, power and any other purpose with a demand of 20 kw or less. Customer Charge $ 8.51 Energy Charges $ per total kWh Base, Conservation, Capacity Payment, Environmental and Fuel Charge $ 0.10221 / kWh
Filename: FLP_GS1_Jun08.csv

NYSERDA DG/CHP Integrated Database System Utility Rate Details
CDH Energy Corporation 442 September 25, 2008
Florida Light & Power
Rate Schedule GST-1 – General Service Non-Demand Time-of-Use For electric service required for commercial or industrial lighting, power and any other purpose with a demand of 20 kw or less. This is an optional rate available to General Service - Non Demand customers upon request subject to availability of meters. Customer Charge $ 11.27 Periods Summer On-Peak 12 – 9PM, Monday-Friday from April – October Winter On-Peak 6 – 10 AM and 6 – 10 PM, Monday-Friday from November – March Off-Peak All Hours not in the On-Peak Periods
Energy Charges $ per total kWh for Base, Conservation, Capacity Payment, Environmental and Fuel Charges
Summer On-Peak $ 0.14744 / kWh Winter On-Peak $ 0.14744 / kWh Off-Peak $ 0.08899 / kWh
Filename: FLP_GST1.csv
Florida Light & Power
Rate Schedule GST-1 – General Service Non-Demand Time-of-Use - June 2008 For electric service required for commercial or industrial lighting, power and any other purpose with a demand of 20 kw or less. This is an optional rate available to General Service - Non Demand customers upon request subject to availability of meters. Customer Charge $ 11.64 Periods Summer On-Peak 12 – 9PM, Monday-Friday from April – October Winter On-Peak 6 – 10 AM and 6 – 10 PM, Monday-Friday from November – March Off-Peak All Hours not in the On-Peak Periods
Energy Charges $ per total kWh for Base, Conservation, Capacity Payment, Environmental and Fuel Charges
Summer On-Peak $ 0.14395 / kWh Winter On-Peak $ 0.14395/ kWh Off-Peak $ 0.08309 / kWh
Filename: FLP_GST1_Jun08.csv
Florida Light & Power
Rate Schedule GSD-1 – General Service Demand For electric service required for commercial or industrial lighting, power and any other purpose with a measured Demand in excess of 20 kw and less than 500 kw. Customers with a Demand of 20 kw or less may enter an agreement for service under this schedule based on a Demand Charge for a minimum of 21 kw. Customer Charge $ 32.05 Demand Charges $ per peak kW for Base Demand and Capacity Payment Charge All Hours $ 6.88 / kW
Energy Charges $ per total kWh for Base, Conservation, Environmental and Fuel Charges
All Hours $ 0.07692 / kWh Filename: FLP_GSD1.csv

NYSERDA DG/CHP Integrated Database System Utility Rate Details
CDH Energy Corporation 443 September 25, 2008
Florida Light & Power
Rate Schedule GSD-1 – General Service Demand - June 2008 For electric service required for commercial or industrial lighting, power and any other purpose with a measured Demand in excess of 20 kw and less than 500 kw. Customers with a Demand of 20 kw or less may enter an agreement for service under this schedule based on a Demand Charge for a minimum of 21 kw. Customer Charge $ 33.10 Demand Charges $ per peak kW for Base Demand and Capacity Payment Charge All Hours $ 6.73 / kW
Energy Charges $ per total kWh for Base, Conservation, Environmental and Fuel Charges
All Hours $ 0.07127 / kWh Filename: FLP_GSD1_Jun08.csv
Florida Light & Power
Rate Schedule GSDT-1 – General Service Demand – Time-of-Use For electric service required for commercial or industrial lighting, power and any other purpose with a measured Demand in excess of 20 kw and less than 500 kw. Customers with Demands of less than 21 kw may enter an agreement for service under this schedule based on a Demand Charge for a minimum of 21 kw. This is an optional rate available to General Service Demand customers upon request subject to availability of meters. Customer Charge $ 38.00 Periods Summer On-Peak 12 – 9PM, Monday-Friday from April – October Winter On-Peak 6 – 10 AM and 6 – 10 PM, Monday-Friday from November – March Off-Peak All Hours not in the On-Peak Periods Demand Charges $ per peak kW for Base Demand and Capacity Payment Charge Summer On-Peak $ 6.88 / kW Winter On-Peak $ 6.88 / kW
Energy Charges $ per total kWh for Base, Conservation, Environmental and Fuel Charges
Summer On-Peak $ 0.09876 / kWh Winter On-Peak $ 0.09876 / kWh Off-Peak $ 0.07038 / kWh
Filename: FLP_GSDT1.csv

NYSERDA DG/CHP Integrated Database System Utility Rate Details
CDH Energy Corporation 444 September 25, 2008
Florida Light & Power
Rate Schedule GSDT-1 – General Service Demand – Time-of-Use - June 2008 For electric service required for commercial or industrial lighting, power and any other purpose with a measured Demand in excess of 20 kw and less than 500 kw. Customers with Demands of less than 21 kw may enter an agreement for service under this schedule based on a Demand Charge for a minimum of 21 kw. This is an optional rate available to General Service Demand customers upon request subject to availability of meters. Customer Charge $ 39.24 Periods Summer On-Peak 12 – 9PM, Monday-Friday from April – October Winter On-Peak 6 – 10 AM and 6 – 10 PM, Monday-Friday from November – March Off-Peak All Hours not in the On-Peak Periods Demand Charges $ per peak kW for Base Demand and Capacity Payment Charge Summer On-Peak $ 6.73 / kW Winter On-Peak $ 6.73 / kW
Energy Charges $ per total kWh for Base, Conservation, Environmental and Fuel Charges
Summer On-Peak $ 0.09474 / kWh Winter On-Peak $ 0.09474 / kWh Off-Peak $ 0.06478 / kWh
Filename: FLP_GSDT1_Jun08.csv

NYSERDA DG/CHP Integrated Database System Utility Rate Details
CDH Energy Corporation 445 September 25, 2008
Complete Commonwealth Edison Company Tariff The Commonwealth Edison rates are up-to-date as of July 22, 2008.
Commonwealth Edison
Rate 1 - Residential Service This rate is available to any customer using the Company's electric service for residential purposes. Customer Charge $ 7.13 Periods Summer1 July – September Other All Hours not in the Summer Energy Charges $ per total kWh Block Charges: Energy Charge 0-400 kWh Over 400 kWh Summer $ 0.08275 / kWh $ 0.08275 / kWh Other $ 0.08275 / kWh $ 006208/ kWh
1 – From the tariff, the Summer begins on the first billing cycle after June 15th and lasts for three months; July 1st will be the average summer start date and is used for the rate definition.
Filename: ComEd_R1.csv
Commonwealth Edison
Rate 1 - Residential Service - July 2008 This rate is available to any customer using the Company's electric service for residential purposes. Customer Charge $ 7.13 Periods Summer1 July – September Other All Hours not in the Summer Energy Charges $ per total kWh Block Charges: Energy Charge 0-400 kWh Over 400 kWh Summer $ 0.08275 / kWh $ 0.08275 / kWh Other $ 0.08275 / kWh $ 006208/ kWh
1 – From the tariff, the Summer begins on the first billing cycle after June 15th and lasts for three months; July 1st will be the average summer start date and is used for the rate definition.
Filename: ComEd_R1_Jul08.csv

NYSERDA DG/CHP Integrated Database System Utility Rate Details
CDH Energy Corporation 446 September 25, 2008
Commonwealth Edison
Rate 1DR Residential Service – Time of Day This rate is available to any customer using the Company’s electric service for residential purposes. Customer Charge $ 8.83 Periods Summer Peak1 9 AM – 6PM, Monday – Friday from July – September Summer Off-Peak All Hours not in the Summer Peak from July – September Other Peak 9 AM – 6PM, Monday – Friday from November – June Other Off-Peak All Hours not in the Other Peak from November – June Energy Charges $ per total kWh 0-350 kWh Over 350 kWh Summer Peak $ 0.20912 / kWh $ 0.20912 / kWh Summer Off-Peak $ 0.06082 / kWh $ 0.03521 / kWh Other Peak $ 0.10690 / kWh $ 0.10690 / kWh Other Off-Peak $ 0.06082 / kWh $ 0.03521 / kWh
1 – From the tariff, the Summer begins on the first billing cycle after June 15th and lasts for three months; July 1st will be the average summer start date and is used for the rate definition.
Filename: ComEd_R1DR.csv
Commonwealth Edison
Rate 1DR Residential Service – Time of Day - July 2008 This rate is available to any customer using the Company’s electric service for residential purposes. Customer Charge $ 8.83 Periods Summer Peak1 9 AM – 6PM, Monday – Friday from July – September Summer Off-Peak All Hours not in the Summer Peak from July – September Other Peak 9 AM – 6PM, Monday – Friday from November – June Other Off-Peak All Hours not in the Other Peak from November – June Energy Charges $ per total kWh 0-350 kWh Over 350 kWh Summer Peak $ 0.20912 / kWh $ 0.20912 / kWh Summer Off-Peak $ 0.06082 / kWh $ 0.03521 / kWh Other Peak $ 0.10690 / kWh $ 0.10690 / kWh Other Off-Peak $ 0.06082 / kWh $ 0.03521 / kWh
1 – From the tariff, the Summer begins on the first billing cycle after June 15th and lasts for three months; July 1st will be the average summer start date and is used for the rate definition.
Filename: ComEd_R1DR_Jul08.csv

NYSERDA DG/CHP Integrated Database System Utility Rate Details
CDH Energy Corporation 447 September 25, 2008
Commonwealth Edison
Rate 14 - Residential Service – Space Heating This rate is available to any customer who uses the Company's electric service for residential purposes and whose entire space heating requirements are supplied under this rate through electric space heating facilities, the major portion of which is permanently installed. For purposes of this rate electric space heating facilities shall include only resistance heating devices and electrically operated heat pumps (except heat pumps which obtain heat from the use of any other fuel) or a combination of such facilities and solar energy collectors providing space heating through heat exchangers. Customer Charge $ 7.13 Periods Summer1 July – September Other All Hours not in the Summer Energy Charges $ per total kWh Block Charges: Energy Charge 0-400 kWh Over 400 kWh Summer $ 0.08275 / kWh $ 0.08275 / kWh Other $ 0.03734 / kWh $ 0.08275 / kWh
1 – From the tariff, the Summer begins on the first billing cycle after June 15th and lasts for three months; July 1st will be the average summer start date and is used for the rate definition.
Filename: ComEd_R14.csv
Commonwealth Edison
Rate 14 - Residential Service – Space Heating - July 2008 This rate is available to any customer who uses the Company's electric service for residential purposes and whose entire space heating requirements are supplied under this rate through electric space heating facilities, the major portion of which is permanently installed. For purposes of this rate electric space heating facilities shall include only resistance heating devices and electrically operated heat pumps (except heat pumps which obtain heat from the use of any other fuel) or a combination of such facilities and solar energy collectors providing space heating through heat exchangers. Customer Charge $ 7.13 Periods Summer1 July – September Other All Hours not in the Summer Energy Charges $ per total kWh Block Charges: Energy Charge 0-400 kWh Over 400 kWh Summer $ 0.08275 / kWh $ 0.08275 / kWh Other $ 0.03734 / kWh $ 0.08275 / kWh
1 – From the tariff, the Summer begins on the first billing cycle after June 15th and lasts for three months; July 1st will be the average summer start date and is used for the rate definition.
Filename: ComEd_R14_Jul08.csv

NYSERDA DG/CHP Integrated Database System Utility Rate Details
CDH Energy Corporation 448 September 25, 2008
Commonwealth Edison
Rate 6 – General Service – Non-Time of Day Except as provided in Rate 6L, this rate is applicable to any commercial, industrial, or governmental customer with a Maximum Demand of less than 1,000 kilowatts who uses the Company's electric service hereunder for all requirements. Customer Charge $ 8.83 Periods Summer1 July – September Other All Hours not in the Summer Demand Charges $ per peak kW Summer $ 14.24 / kW Other $ 11.13 / kW Energy Charges $ per total kWh 0-30,000 kWh 30,000-500,000 kWh Over 500,000 kWh Energy Charge $ 0.04247 / kWh $ 0.03167 / kWh $ 0.03118 / kWh
1 – From the tariff, the Summer begins on the first billing cycle after June 15th and lasts for three months; July 1st will be the average summer start date and is used for the rate definition.
Filename: ComEd_R6_nTOU.csv
Commonwealth Edison
Rate 6 – General Service – Non-Time of Day - July 2008 Except as provided in Rate 6L, this rate is applicable to any commercial, industrial, or governmental customer with a Maximum Demand of less than 1,000 kilowatts who uses the Company's electric service hereunder for all requirements. Customer Charge $ 8.83 Periods Summer1 July – September Other All Hours not in the Summer Demand Charges $ per peak kW Summer $ 14.24 / kW Other $ 11.13 / kW Energy Charges $ per total kWh 0-30,000 kWh 30,000-500,000 kWh Over 500,000 kWh Energy Charge $ 0.04247 / kWh $ 0.03167 / kWh $ 0.03118 / kWh
1 – From the tariff, the Summer begins on the first billing cycle after June 15th and lasts for three months; July 1st will be the average summer start date and is used for the rate definition.
Filename: ComEd_R6_nTOU_Jul08.csv

NYSERDA DG/CHP Integrated Database System Utility Rate Details
CDH Energy Corporation 449 September 25, 2008
Commonwealth Edison
Rate 6 – General Service – Time of Day Except as provided in Rate 6L, this rate is applicable to any commercial, industrial, or governmental customer with a Maximum Demand of less than 1,000 kilowatts who uses the Company's electric service hereunder for all requirements. Customer Charge $ 39.93 Periods Summer1 July – September Other All Hours not in the Summer Peak 9 AM – 10 PM, Monday-Friday Off-Peak All Hours not in the Peak Demand Charges $ per peak kW Summer $ 14.24 / kW Other $ 11.13 / kW Energy Charges $ per total kWh in defined period Peak $ 0.05599 / kWh Off-Peak $ 0.02341 / kWh
1 – From the tariff, the Summer begins on the first billing cycle after June 15th and lasts for three months; July 1st will be the average summer start date and is used for the rate definition.
Filename: ComEd_R6_TOU.csv
Commonwealth Edison
Rate 6 – General Service – Time of Day - July 2008 Except as provided in Rate 6L, this rate is applicable to any commercial, industrial, or governmental customer with a Maximum Demand of less than 1,000 kilowatts who uses the Company's electric service hereunder for all requirements. Customer Charge $ 39.93 Periods Summer1 July – September Other All Hours not in the Summer Peak 9 AM – 10 PM, Monday-Friday Off-Peak All Hours not in the Peak Demand Charges $ per peak kW Summer $ 14.24 / kW Other $ 11.13 / kW Energy Charges $ per total kWh in defined period Peak $ 0.05599 / kWh Off-Peak $ 0.02341 / kWh
1 – From the tariff, the Summer begins on the first billing cycle after June 15th and lasts for three months; July 1st will be the average summer start date and is used for the rate definition.
Filename: ComEd_R6_TOU_Jul08.csv

NYSERDA DG/CHP Integrated Database System Utility Rate Details
CDH Energy Corporation 450 September 25, 2008
Commonwealth Edison
Rate 6L – Large General Service – Time of Day – Less than 10,000 kW This rate is applicable to any commercial, industrial, or governmental customer with a maximum 30-minute demand of 1,000 kilowatts or more established during the Demand Peak Periods in three of the twelve months preceding the billing month. Customer Charge $ 524.61 Periods Summer1 July – September Other All Hours not in the Summer Peak 9 AM – 10 PM, Monday-Friday Off-Peak All Hours not in the Peak Demand Charges $ per peak kW Summer $ 16.41 / kW Other $ 12.85 / kW Energy Charges $ per total kWh in defined period Peak $ 0.05022 / kWh Off-Peak $ 0.02123 / kWh
1 – From the tariff, the Summer begins on the first billing cycle after June 15th and lasts for three months; July 1st will be the average summer start date and is used for the rate definition.
Filename: ComEd_R6L_TOU_lt10000.csv
Commonwealth Edison
Rate 6L – Large General Service – Time of Day – Less than 10,000 kW – December 2007 This rate is applicable to any commercial, industrial, or governmental customer with a maximum 30-minute demand of 1,000 kilowatts or more established during the Demand Peak Periods in three of the twelve months preceding the billing month. Customer Charge $ 246.39 Periods Summer1 July – September Nonsummer All Hours not in the Summer Peak 9 AM – 10 PM, Monday-Friday Off-Peak All Hours not in the Peak Demand Charges $ per peak kW Summer $ 16.41 / kW Nonsummer $ 12.85 / kW Energy Charges $ per total kWh in defined period Summer Peak $ 0.17761 / kWh Summer Off-Peak $ 0.09310 / kWh Nonsummer Peak $ 0.17295 / kWh Nonsummer Off-Peak $ 0.09540 / kWh
1 – From the tariff, the Summer begins on the first billing cycle after June 15th and lasts for three months; July 1st will be the average summer start date and is used for the rate definition.
Filename: ComEd_R6L_TOU_lt10000_Dec07.csv

NYSERDA DG/CHP Integrated Database System Utility Rate Details
CDH Energy Corporation 451 September 25, 2008
Commonwealth Edison
Rate 6L – Large General Service – Time of Day – Less than 10,000 kW – July 2008 This rate is applicable to any commercial, industrial, or governmental customer with a maximum 30-minute demand of 1,000 kilowatts or more established during the Demand Peak Periods in three of the twelve months preceding the billing month. Customer Charge $ 246.39 Periods Summer1 July – September Nonsummer All Hours not in the Summer Peak 9 AM – 10 PM, Monday-Friday Off-Peak All Hours not in the Peak Demand Charges $ per peak kW Summer $ 16.41 / kW Nonsummer $ 12.85 / kW Energy Charges $ per total kWh in defined period Summer Peak $ 0.17761 / kWh Summer Off-Peak $ 0.09310 / kWh Nonsummer Peak $ 0.17295 / kWh Nonsummer Off-Peak $ 0.09540 / kWh
1 – From the tariff, the Summer begins on the first billing cycle after June 15th and lasts for three months; July 1st will be the average summer start date and is used for the rate definition.
Filename: ComEd_R6L_TOU_lt10000_Jul08.csv

NYSERDA DG/CHP Integrated Database System Utility Rate Details
CDH Energy Corporation 452 September 25, 2008
Commonwealth Edison
Rate 18 Standby - Less than 500 kW Generation Except for customers that elect to take service under Rate HEP - Hourly Energy Pricing, this rate is applicable to any customer that (1) has installed its own electric generating facilities or is entitled to the output of electric generating facilities installed for its benefit but owned by a third party solely for financing or tax purposes (Customer's Own Electric Generating Facilities) used exclusively to produce all or a portion of the customer's electrical load requirements on a regular basis, and/or (2) uses another form of energy in the operation of its equipment, and desires to use the Company's electric service as a standby, auxiliary or reserve service. Customer Charge $ 106.83 Facilities Charge2 $ 2.99 / kW of Standby Capacity Periods Summer1 July – September Other All Hours not in the Summer Peak 9 AM – 10 PM, Monday-Friday Off-Peak All Hours not in the Peak Demand Charges $ per peak kW Summer $ 15.16 / kW Other $ 13.41 / kW Energy Charges $ per total kWh in defined period Peak $ 0.05022 / kWh Off-Peak $ 0.02123 / kWh
1 – From the tariff, the Summer begins on the first billing cycle after June 15th and lasts for three months; July 1st will be the average summer start date and is used for the rate definition.
2 – The customer shall elect a level of Standby Capacity which shall not exceed the sum of the Total Capability of the Customer's Own Electric Generating Facilities.
Filename: ComEd_R18_lt500.csv
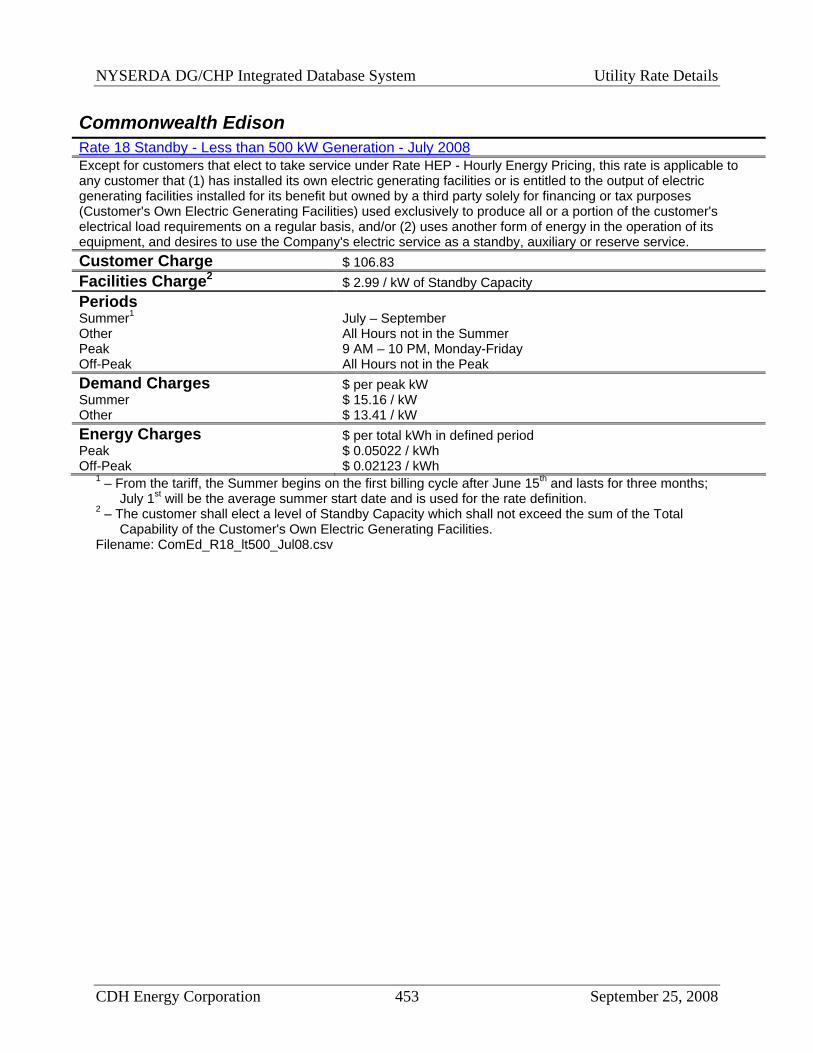
NYSERDA DG/CHP Integrated Database System Utility Rate Details
CDH Energy Corporation 453 September 25, 2008
Commonwealth Edison
Rate 18 Standby - Less than 500 kW Generation - July 2008 Except for customers that elect to take service under Rate HEP - Hourly Energy Pricing, this rate is applicable to any customer that (1) has installed its own electric generating facilities or is entitled to the output of electric generating facilities installed for its benefit but owned by a third party solely for financing or tax purposes (Customer's Own Electric Generating Facilities) used exclusively to produce all or a portion of the customer's electrical load requirements on a regular basis, and/or (2) uses another form of energy in the operation of its equipment, and desires to use the Company's electric service as a standby, auxiliary or reserve service. Customer Charge $ 106.83 Facilities Charge2 $ 2.99 / kW of Standby Capacity Periods Summer1 July – September Other All Hours not in the Summer Peak 9 AM – 10 PM, Monday-Friday Off-Peak All Hours not in the Peak Demand Charges $ per peak kW Summer $ 15.16 / kW Other $ 13.41 / kW Energy Charges $ per total kWh in defined period Peak $ 0.05022 / kWh Off-Peak $ 0.02123 / kWh
1 – From the tariff, the Summer begins on the first billing cycle after June 15th and lasts for three months; July 1st will be the average summer start date and is used for the rate definition.
2 – The customer shall elect a level of Standby Capacity which shall not exceed the sum of the Total Capability of the Customer's Own Electric Generating Facilities.
Filename: ComEd_R18_lt500_Jul08.csv

NYSERDA DG/CHP Integrated Database System Utility Rate Details
CDH Energy Corporation 454 September 25, 2008
Commonwealth Edison
Rate 18 Standby - 1000 kW to 10000 kW Generation – December 2007 Except for customers that elect to take service under Rate HEP - Hourly Energy Pricing, this rate is applicable to any customer that (1) has installed its own electric generating facilities or is entitled to the output of electric generating facilities installed for its benefit but owned by a third party solely for financing or tax purposes (Customer's Own Electric Generating Facilities) used exclusively to produce all or a portion of the customer's electrical load requirements on a regular basis, and/or (2) uses another form of energy in the operation of its equipment, and desires to use the Company's electric service as a standby, auxiliary or reserve service. Customer Charge $ 344.39 Facilities Charge2 $ 2.99 / kW of Standby Capacity Periods Summer1 July – September Nonsummer All Hours not in the Summer Peak 9 AM – 10 PM, Monday-Friday Off-Peak All Hours not in the Peak Demand Charges $ per peak kW Summer $ 15.16 / kW Nonsummer $ 13.41 / kW Energy Charges $ per total kWh in defined period Summer Peak $ 0.17761 / kWh Summer Off-Peak $ 0.09310 / kWh Nonsummer Peak $ 0.17295 / kWh Nonsummer Off-Peak $ 0.09540 / kWh
1 – From the tariff, the Summer begins on the first billing cycle after June 15th and lasts for three months; July 1st will be the average summer start date and is used for the rate definition.
2 – The customer shall elect a level of Standby Capacity which shall not exceed the sum of the Total Capability of the Customer's Own Electric Generating Facilities.
Filename: ComEd_R18_1000to10000_Dec07.csv

NYSERDA DG/CHP Integrated Database System Utility Rate Details
CDH Energy Corporation 455 September 25, 2008
Commonwealth Edison
Rate 18 Standby - 1000 kW to 10000 kW Generation – July 2008\ Except for customers that elect to take service under Rate HEP - Hourly Energy Pricing, this rate is applicable to any customer that (1) has installed its own electric generating facilities or is entitled to the output of electric generating facilities installed for its benefit but owned by a third party solely for financing or tax purposes (Customer's Own Electric Generating Facilities) used exclusively to produce all or a portion of the customer's electrical load requirements on a regular basis, and/or (2) uses another form of energy in the operation of its equipment, and desires to use the Company's electric service as a standby, auxiliary or reserve service. Customer Charge $ 344.39 Facilities Charge2 $ 2.99 / kW of Standby Capacity Periods Summer1 July – September Nonsummer All Hours not in the Summer Peak 9 AM – 10 PM, Monday-Friday Off-Peak All Hours not in the Peak Demand Charges $ per peak kW Summer $ 15.16 / kW Nonsummer $ 13.41 / kW Energy Charges $ per total kWh in defined period Summer Peak $ 0.17761 / kWh Summer Off-Peak $ 0.09310 / kWh Nonsummer Peak $ 0.17295 / kWh Nonsummer Off-Peak $ 0.09540 / kWh
1 – From the tariff, the Summer begins on the first billing cycle after June 15th and lasts for three months; July 1st will be the average summer start date and is used for the rate definition.
2 – The customer shall elect a level of Standby Capacity which shall not exceed the sum of the Total Capability of the Customer's Own Electric Generating Facilities.
Filename: ComEd_R18_1000to10000_Jul08.csv

NYSERDA DG/CHP Integrated Database System Utility Rate Details
CDH Energy Corporation 456 September 25, 2008
Complete Commonwealth Electric Tariff The Commonwealth Electric rates are up-to-date as of July 19, 2006.
Commonwealth Electric
Rate R-1 - Residential This rate is available for all domestic uses in a single private dwelling, in an individual apartment or in a residential condominium. Customer Charge $ 3.73 Energy Charges $ per total kWh Distribution, Transition, Transmission Charges $ 0.07990 / kWh Standard Offer Service $ 0.05100 / kWh
Filename: ComEl_R1.csv
Commonwealth Electric
Rate R-1 - Residential - July 2008 This rate is available for all domestic uses in a single private dwelling, in an individual apartment or in a residential condominium. Customer Charge $ 6.43 Energy Charges $ per total kWh Distribution, Transition, Transmission Charges $ 0.06506 / kWh Standard Offer Service $ 0.12574 / kWh
Filename: ComEl_R1_Jul08.csv
Commonwealth Electric
Rate R-3 – Residential Space Heating This rate is available for all domestic uses in a single private dwelling, in an individual apartment or in a residential condominium where the principal means of heating the premises is provided by permanently installed electric space heating equipment. Customer Charge $ 10.03 Energy Charges $ per total kWh Distribution, Transition, Transmission Charges $ 0.06025 / kWh Standard Offer Service $ 0.05100 / kWh
Filename: ComEl_R3.csv

NYSERDA DG/CHP Integrated Database System Utility Rate Details
CDH Energy Corporation 457 September 25, 2008
Commonwealth Electric
Rate R-3 – Residential Space Heating - July 2008 This rate is available for all domestic uses in a single private dwelling, in an individual apartment or in a residential condominium where the principal means of heating the premises is provided by permanently installed electric space heating equipment. Customer Charge $ 6.43 Energy Charges $ per total kWh Distribution, Transition, Transmission Charges $ 0.06547 / kWh Standard Offer Service $ 0.12574 / kWh
Filename: ComEl_R3_Jul08.csv
Commonwealth Electric
Rate R-6 – Residential Time-of-Use Upon written application, this rate is available for all domestic uses to Customers who take all of their electric service requirements hereunder in a single private dwelling, in an individual apartment or in a residential condominium. Customer Charge $ 7.33 Periods
Peak Load1 9 AM – 6 PM, Monday – Friday from October 5 – April 25 and 4 – 9 PM, Monday – Friday from April 26 – October 4
Low Load All Hours not in the Peak Load Energy Charges $ per total kWh in defined period Peak Load $ 0.23313 / kWh for Distribution, Transition, Transmission Charges Low Load $ 0.02422 / kWh for Distribution, Transition, Transmission Charges All Hours $ 0.05100 / kWh for Standard Offer Service
1 – The Peak Load period changes definition with the daylight savings change; The median dates for the changeover are used (April 26 and October 4).
Filename: ComEl_R6.csv
Commonwealth Electric
Rate R-5 – Residential Time-of-Use - July 2008 Upon written application, this rate is available for all domestic uses to Customers who take all of their electric service requirements hereunder in a single private dwelling, in an individual apartment or in a residential condominium. Customer Charge $ 9.99 Periods
Peak Load1 9 AM – 6 PM, Monday – Friday from October 5 – April 25 and 4 – 9 PM, Monday – Friday from April 26 – October 4
Low Load All Hours not in the Peak Load Energy Charges $ per total kWh in defined period Peak Load $ 0.21454 / kWh for Distribution, Transition, Transmission Charges Low Load $ 0.15908 / kWh for Distribution, Transition, Transmission Charges All Hours $ 0.12547 / kWh for Standard Offer Service
1 – The Peak Load period changes definition with the daylight savings change; The median dates for the changeover are used (April 26 and October 4).
Filename: ComEl_R5_Jul08.csv

NYSERDA DG/CHP Integrated Database System Utility Rate Details
CDH Energy Corporation 458 September 25, 2008
Commonwealth Electric
Rate G-1 – General Service This rate is available for all non-residential uses of electricity to all Customers except those customers whose load for billing purposes either exceeds or is estimated to exceed 100 kilowatts in each of 12 consecutive billing months. Customer Charge $ 5.53 Demand Charges $ per peak kW for Distribution Charges 0-10 kW Over 10 kW Block Charge $ 0.00 / kW $ 4.31 / kW Energy Charges $ per total kWh for Distribution, Transition, Transmission Charges 0-2,300 kWh Over 2,300 kWh Energy Charge $ 0.07170 / kWh $ 0.04243 / kWh All Hours $ 0.05100 / kWh for Standard Offer Service
Filename: ComEl_G1.csv
Commonwealth Electric
Rate G-1 – General Service - July 2008 This rate is available for all non-residential uses of electricity to all Customers except those customers whose load for billing purposes either exceeds or is estimated to exceed 100 kilowatts in each of 12 consecutive billing months. Customer Charge $ 12.09 Demand Charges $ per peak kW for Distribution Charges 0-10 kW Over 10 kW Block Charge $ 0.00 / kW $ 4.88 / kW Energy Charges $ per total kWh for Distribution, Transition, Transmission Charges 0-2,300 kWh Over 2,300 kWh Energy Charge $ 0.05915 / kWh $ 0.05367 / kWh All Hours $ 0.12846 / kWh for Standard Offer Service
Filename: ComEl_G1_Jul08.csv

NYSERDA DG/CHP Integrated Database System Utility Rate Details
CDH Energy Corporation 459 September 25, 2008
Commonwealth Electric
Rate G-2 – Medium General Time-of-Use This rate is available for all uses of electricity to Customers who establish demands in excess of 100 kilowatts but not greater than 500 kilowatts for at least 12 consecutive months. Customer Charge $ 360.13 Periods
Peak Load1 9 AM – 6 PM, Monday – Friday from October 5 – April 25 and 4 – 9 PM, Monday – Friday from April 26 – October 4
Low Load A All Hours not in Peak Load or Low Load B Low Load B 10 PM – 7 AM, Monday – Friday Demand Charges $ per peak kW All Hours $ 3.63 / kW for Distribution Charge Energy Charges $ per total kWh in defined period Peak Load $ 0.04256 / kWh for Distribution, Transition, Transmission Charges Low Load A $ 0.03973 / kWh for Distribution, Transition, Transmission Charges Low Load B $ 0.03446 / kWh for Distribution, Transition, Transmission Charges All Hours $ 0.05100 / kWh for Standard Offer Service
1 – The Peak Load period changes definition with the daylight savings change; The median dates for the changeover are used (April 26 and October 4).
Filename: ComEl_G2.csv
Commonwealth Electric
Rate SB-G2 – General Service Standby - Supplemental The Customer qualifies for service on Rate G-2 based upon its internal electric load requirements. The Customer (a) normally satisfies at least 30% of its maximum internal electric load from generation unit(s) with a combined nameplate rating greater than 250 kW (“Generation Units”), or (b) has installed generation unit(s) with a combined nameplate rating greater than 1,000 kW, where electricity provided by the Generation Units is not delivered over Company-owned facilities under an applicable retail delivery tariff. Periods
Peak Load1 9 AM – 6 PM, Monday – Friday from October 5 – April 25 and 4 – 9 PM, Monday – Friday from April 26 – October 4
Low Load A All Hours not in Peak Load or Low Load B Low Load B 10 PM – 7 AM, Monday – Friday Apparent Charges $ per peak kVA All Hours $ 5.39 / kVA for Distribution Charge Demand Charges $ per peak kW All Hours $ 2.10 / kW for Transmission Charge Energy Charges $ per total kWh in defined period Peak Load $ 0.04256 / kWh for Distribution, Transition, Transmission Charges Low Load A $ 0.03973 / kWh for Distribution, Transition, Transmission Charges Low Load B $ 0.03446 / kWh for Distribution, Transition, Transmission Charges All Hours $ 0.05100 / kWh for Standard Offer Service
1 – The Peak Load period changes definition with the daylight savings change; The median dates for the changeover are used (April 26 and October 4).
Filename: ComEl_SBG2_Sup.csv

NYSERDA DG/CHP Integrated Database System Utility Rate Details
CDH Energy Corporation 460 September 25, 2008
Average Hawaiian Electric Company Rates
The Hawaiian Electric Company rates are not publicly available on their webpage. Brochures of
the rates were requested and received. The rates are up-to-date as of July 27, 2006.
Hawaiian Electric Company
Schedule R – Residential Service – Single-Phase Service To residential lighting, heating, cooking, air conditioning, and powe rin a single-family dwelling unit metered and billed through a single meter. Customer Charge $ 7.00 Energy Charges $ per total kWh Non-Fuel Energy Charge $ 0.077814 / kWh Base fuel Energy Charge $ 0.03514 / kWh
Filename: HECO_R_sp.csv
Hawaiian Electric Company
Schedule R – Residential Service – Three-Phase Service To residential lighting, heating, cooking, air conditioning, and powe rin a single-family dwelling unit metered and billed through a single meter. Customer Charge $ 15.00 Energy Charges $ per total kWh Non-Fuel Energy Charge $ 0.077814 / kWh Base fuel Energy Charge $ 0.03514 / kWh
Filename: HECO_R_tp.csv
Hawaiian Electric Company
Schedule G – General Service Non-Demand – Single-Phase Service To general light and/or power loads less than or equal to 5000 kilowatt-hours (kWh) per month, or less than or equal to 25 kilowatts (kW), and supplied through a single meter. Customer Charge $ 20.00 Energy Charges $ per total kWh Energy Charge $ 0.111570 / kWh
Filename: HECO_G_sp.csv

NYSERDA DG/CHP Integrated Database System Utility Rate Details
CDH Energy Corporation 461 September 25, 2008
Hawaiian Electric Company
Schedule G – General Service Non-Demand – Secondary To general light and/or power loads less than or equal to 5000 kilowatt-hours (kWh) per month, or less than or equal to 25 kilowatts (kW), and supplied through a single meter. Customer Charge $ 45.00 Energy Charges $ per total kWh Energy Charge $ 0.111570 / kWh Voltage Discount - 0.7 % of Total Energy Charges
Filename: HECO_G_Sec.csv
Hawaiian Electric Company
Schedule G – General Service Non-Demand – Primary To general light and/or power loads less than or equal to 5000 kilowatt-hours (kWh) per month, or less than or equal to 25 kilowatts (kW), and supplied through a single meter. Customer Charge $ 45.00 Energy Charges $ per total kWh Energy Charge $ 0.111570 / kWh Voltage Discount - 1.9 % of Total Energy Charges
Filename: HECO_G_Pri.csv
Hawaiian Electric Company
Schedule J – General Service Demand – Secondary Single Phase To general light and/or power loads which exceed 5000 kilowatt-hours (kWh) per month three times in a twelve month period, or 25 kilowatts (kW), and supplied through a single meter. Customer Charge $ 35.00 Demand Charges $ per peak kW Demand Charge $ 5.75 / kW Energy Charges $ per total kWh in Hours of Billing Demand 0-200 Hours 200-400 Hours Over 400 Hours Energy Charge $ 0.086900 / kWh $ 0.075419 / kWh $ 0.065130 / kWh
Filename: HECO_J_Sec_sp.csv

NYSERDA DG/CHP Integrated Database System Utility Rate Details
CDH Energy Corporation 462 September 25, 2008
Hawaiian Electric Company
Schedule J – General Service Demand – Secondary Three Phase To general light and/or power loads which exceed 5000 kilowatt-hours (kWh) per month three times in a twelve month period, or 25 kilowatts (kW), and supplied through a single meter. Customer Charge $ 60.00 Demand Charges $ per peak kW Demand Charge $ 5.75 / kW Energy Charges $ per total kWh in Hours of Billing Demand 0-200 Hours 200-400 Hours Over 400 Hours Energy Charge $ 0.086900 / kWh $ 0.075419 / kWh $ 0.065130 / kWh
Filename: HECO_J_Sec_tp.csv
Hawaiian Electric Company
Schedule U – Time-of-Use Service To general light and/or power loads which exceed 3000 kilowatts per month and supplied and metered at a single voltage and delivery point. This schedule cannot be used in conjunction with load management Riders “M”, “T”, and “I” Customer Charge $ 215.00 Periods On-Peak 7 AM – 9 PM Off-Peak 9 PM – 7 AM Demand Charges $ per peak kW in defined period On-Peak $ 17.00 / kW Energy Charges $ per total kWh in defined period On-Peak $ 0.07823 / kWh Off-Peak $ 0.0300 / kWh
Filename: HECO_U.csv

NYSERDA DG/CHP Integrated Database System Utility Rate Details
CDH Energy Corporation 463 September 25, 2008
Complete PPL Electric Utilities Tariff The PPL Electric Utilities rates are up-to-date as of July 17, 2008.
PPL Electric Utilities
Rate Schedule RS – Residential Service This Rate Schedule is for single phase residential service in accordance with the APPLICATION PROVISIONS hereof. The Multiple Dwelling Unit Application is restricted to eight or less dwelling units for applications after August 26, 1976, and further to buildings converted to multiple dwelling units for applications after June 28, 1980. Separate Water Heating Service is available only to service locations served under this application on and continuously after April 26, 1985. Customer Charge $ 8.00 per month (Distribution Charge) Energy Charges $ per total kWh Transmission Charge $ 0.00605 / kWh Block Charges: Distribution Charge, Competitive Transition Charge, Intangible Transition Charge and Capacity and Energy Charge 0-200 kWh 200-600 kWh Over 600 kWh $ 0.09217 / kWh $ 0.08165 / kWh $0.07540 / kWh
Filename: PPL_RS.csv
PPL Electric Utilities
Rate Schedule RS – Residential Service - July 2008 This Rate Schedule is for single phase residential service in accordance with the APPLICATION PROVISIONS hereof. The Multiple Dwelling Unit Application is restricted to eight or less dwelling units for applications after August 26, 1976, and further to buildings converted to multiple dwelling units for applications after June 28, 1980. Separate Water Heating Service is available only to service locations served under this application on and continuously after April 26, 1985. Customer Charge $ 8.00 per month (Distribution Charge) Energy Charges $ per total kWh Transmission Charge $ 0.00730 / kWh Block Charges: Distribution Charge, Competitive Transition Charge, Intangible Transition Charge and Capacity and Energy Charge 0-200 kWh 200-600 kWh Over 600 kWh $ 0.09672 / kWh $ 0.08576 / kWh $0.08105 / kWh
Filename: PPL_RS_Jul08.csv

NYSERDA DG/CHP Integrated Database System Utility Rate Details
CDH Energy Corporation 464 September 25, 2008
PPL Electric Utilities
Rate Schedule RTD – Residential Service – Time-of-Day This Rate Schedule is for single phase residential service metered and billed to recognize timeof-day use in accordance with the APPLICATION PROVISIONS hereof. Customer Charge $ 15.52 per month (Distribution Charge) Periods On-Peak 8AM – 6PM, Monday-Friday Off-Peak All Hours not in the Peak Period Energy Charges $ per total kWh per period Transmission Charge, Distribution Charge, Competitive Transition Charge, Intangible Transition Charge and Capacity and Energy Charge On-Peak $ 0.17397 / kWh Off-Peak $ 0.05686 / kWh
Filename: PPL_RTD.csv
PPL Electric Utilities
Rate Schedule RTD – Residential Service – Time-of-Day - July 2008 This Rate Schedule is for single phase residential service metered and billed to recognize timeof-day use in accordance with the APPLICATION PROVISIONS hereof. Customer Charge $ 8.00 per month (Distribution Charge) Periods On-Peak 8AM – 6PM, Monday-Friday Off-Peak All Hours not in the Peak Period Energy Charges $ per total kWh per period Transmission Charge, Distribution Charge, Competitive Transition Charge, Intangible Transition Charge and Capacity and Energy Charge On-Peak $ 0.17074 / kWh Off-Peak $ 0.07532 / kWh
Filename: PPL_RTD_Jul08.csv

NYSERDA DG/CHP Integrated Database System Utility Rate Details
CDH Energy Corporation 465 September 25, 2008
PPL Electric Utilities
Rate Schedule GS-1 – Small General Service – Secondary Voltage This Rate Schedule is for small general service at secondary voltage. The billing demand is limited to 5 KW for accounts served under discontinued Rate Schedule FC as of June 28, 1980. New applications with voltage levels higher than the secondary voltage will not be accepted after January 1, 2005. Customer Charge $ 11.45 per month (Distribution Charge) Demand Charges Distribution Charge $ 2.36 / kW in excess of 5 kW Energy Charges $ per total kWh Transmission Charge $ 0.00605 / kWh Block Charges: Distribution Charge, Competitive Transition Charge, Intangible Transition Charge and Capacity and Energy Charge 0-150 kWh Over 150 kWh $ 0.10982 / kWh $ 0.07501 / kWh
Filename: PPL_GS1.csv
PPL Electric Utilities
Rate Schedule GS-1 – Small General Service – Secondary Voltage - July 2008 This Rate Schedule is for small general service at secondary voltage. The billing demand is limited to 5 KW for accounts served under discontinued Rate Schedule FC as of June 28, 1980. New applications with voltage levels higher than the secondary voltage will not be accepted after January 1, 2005. Customer Charge $ 11.32 per month (Distribution Charge) Demand Charges Distribution Charge $ 2.26 / kW in excess of 5 kW Energy Charges $ per total kWh Transmission Charge $ 0.00730 / kWh Block Charges: Distribution Charge, Competitive Transition Charge, Intangible Transition Charge and Capacity and Energy Charge 0-150 kWh Over 150 kWh $ 0.11039 / kWh $ 0.07665 / kWh
Filename: PPL_GS1_Jul08.csv

NYSERDA DG/CHP Integrated Database System Utility Rate Details
CDH Energy Corporation 466 September 25, 2008
PPL Electric Utilities
Rate Schedule GS-3 – Large General Service – Secondary Voltage This Rate Schedule is for large general service at secondary voltage. Where necessary, the Company furnishes and maintains one transformation from line voltage to a lower Company standard service voltage. New applications with voltage levels higher than the secondary voltage will not be accepted after January 1, 2005. Demand Charges Distribution Charge and Capacity and Energy Charge $ 8.927 / kW Energy Charges $ per total kWh Transmission Charge $ 0.00605 / kWh Block Charges: Distribution Charge, Competitive Transition Charge, Intangible Transition Charge and Capacity and Energy Charge 0-200 kWh 200-400 kWh Over 400 kWh $ 0.06328 / kWh $ 0.04822 / kWh $ 0.04603 / kWh
Filename: PPL_GS3.csv
PPL Electric Utilities
Rate Schedule GS-3 – Large General Service – Secondary Voltage or Higher – December 2007 This Rate Schedule is for large general service at secondary voltage. Where necessary, the Company furnishes and maintains one transformation from line voltage to a lower Company standard service voltage. New applications with voltage levels higher than the secondary voltage will not be accepted after January 1, 2005. Demand Charges Distribution Charge and Capacity and Energy Charge $ 8.654 / kW Energy Charges $ per total kWh Transmission Charge $ 0.00507 / kWh Block Charges: Distribution Charge, Competitive Transition Charge, Intangible Transition Charge and Capacity and Energy Charge 0-200 kWh 200-400 kWh Over 400 kWh $ 0.06322 / kWh $ 0.04842 / kWh $ 0.04624 / kWh
Filename: PPL_GS3_Dec07.csv
PPL Electric Utilities
Rate Schedule GS-3 – Large General Service – Secondary Voltage or Higher – July 2008 This Rate Schedule is for large general service at secondary voltage. Where necessary, the Company furnishes and maintains one transformation from line voltage to a lower Company standard service voltage. New applications with voltage levels higher than the secondary voltage will not be accepted after January 1, 2005. Demand Charges Distribution Charge and Capacity and Energy Charge $ 9.153 / kW Energy Charges $ per total kWh Transmission Charge $ 0.00507 / kWh Block Charges: Distribution Charge, Competitive Transition Charge, Intangible Transition Charge and Capacity and Energy Charge 0-200 kWh 200-400 kWh Over 400 kWh $ 0.06236 / kWh $ 0.04774 / kWh $ 0.04567 / kWh
Filename: PPL_GS3_Jul08.csv

NYSERDA DG/CHP Integrated Database System Utility Rate Details
CDH Energy Corporation 467 September 25, 2008
Complete San Diego Gas & Electric Tariff
The San Diego Gas & Electric Electric Utilities rates are up-to-date as of July 2008.
San Diego Gas & Electric
Rate Schedule DR – Residential Service – Inland Baseline – January 2007 This schedule is applicable to single-phase domestic service for lighting, heating, cooking, water heating, and power, or combination thereof, in single family dwellings, flats, and apartments, separately metered by the utility; to single-phase service used in common for residential purposes by tenants in multi-family dwellings under Special Condition 8; to any approved combination of residential and nonresidential service on the same meter; and to incidental farm service under Special Condition 7. Periods Summer May – October Winter November – April Energy Charges $ per total kWh per day Block Charges 0-11.8 kWh 11.8-15.34 kWh 15.34-23.6 kWh 23.6-35.4 kWh Over 35.4 kWh Summer $0.03790 / kWh $0.05807 / kWh $0.15328 / kWh $ 0.16235 / kWh $ 0.17818 / kWh 0-11.5 kWh 11.5-14.95 kWh 14.95-23 kWh 23-34.5 kWh Over 34.5 kWh Winter $0.06538 / kWh $0.09381 / kWh $0.16527 / kWh $ 0.17483 / kWh $ 0.19153 / kWh
Filename: SDGE_DR_inland_jan07.csv
San Diego Gas & Electric
Rate Schedule DR – Residential Service – Inland Baseline – July 2008 This schedule is applicable to single-phase domestic service for lighting, heating, cooking, water heating, and power, or combination thereof, in single family dwellings, flats, and apartments, separately metered by the utility; to single-phase service used in common for residential purposes by tenants in multi-family dwellings under Special Condition 8; to any approved combination of residential and nonresidential service on the same meter; and to incidental farm service under Special Condition 7. Periods Summer May – October Winter November – April Energy Charges $ per total kWh per day Block Charges 0-11.8 kWh 11.8-15.34 kWh 15.34-23.6 kWh Over 23.6 kWh Summer $0.02670 / kWh $0.04790 / kWh $0.11227 / kWh $ 0.136340 / kWh 0-11.5 kWh 11.5-14.95 kWh 14.95-23 kWh Over 23 kWh Winter $0.05228 / kWh $0.07348 / kWh $0.12229 / kWh $ 0.14611 / kWh
Filename: SDGE_DR_inland_Jul08.csv

NYSERDA DG/CHP Integrated Database System Utility Rate Details
CDH Energy Corporation 468 September 25, 2008
San Diego Gas & Electric
Rate Schedule DR – Residential Service – Inland Baseline – All Electric – January 2007 This schedule is applicable to single-phase domestic service for lighting, heating, cooking, water heating, and power, or combination thereof, in single family dwellings, flats, and apartments, separately metered by the utility; to single-phase service used in common for residential purposes by tenants in multi-family dwellings under Special Condition 8; to any approved combination of residential and nonresidential service on the same meter; and to incidental farm service under Special Condition 7. Periods Summer May – October Winter November – April Energy Charges $ per total kWh per day Block Charges 0-11.6 kWh 11.6-15.08 kWh 15.08-23.2 kWh 23.2-34.8 kWh Over 34.8 kWh Summer $0.04582 / kWh $0.22008 / kWh $0.16346 / kWh $ 0.18100 / kWh $ 0.17818 / kWh 0-19.1 kWh 19.1-24.83 kWh 24.83-38.2 kWh 38.2-57.3 kWh Over 57.3 kWh Winter $0.06487 / kWh $0.08504 / kWh $0.16463 / kWh $ 0.17345 / kWh $ 0.19153 / kWh
Filename: SDGE_DR_inland_allelec_jan07.csv
San Diego Gas & Electric
Rate Schedule DR – Residential Service – Inland Baseline – All Electric – July 2008 This schedule is applicable to single-phase domestic service for lighting, heating, cooking, water heating, and power, or combination thereof, in single family dwellings, flats, and apartments, separately metered by the utility; to single-phase service used in common for residential purposes by tenants in multi-family dwellings under Special Condition 8; to any approved combination of residential and nonresidential service on the same meter; and to incidental farm service under Special Condition 7. Periods Summer May – October Winter November – April Energy Charges $ per total kWh per day Block Charges 0-11.6 kWh 11.6-15.08 kWh 15.08-23.2 kWh Over 23.28 kWh Summer $0.02670 / kWh $0.04790 / kWh $0.11227 / kWh $ 0.136340 / kWh 0-19.1 kWh 19.1-24.83 kWh 24.83-38.2 kWh Over 38.2 kWh Winter $0.05228 / kWh $0.07348 / kWh $0.12229 / kWh $ 0.14611 / kWh
Filename: SDGE_DR_inland_allelec_Jul08.csv

NYSERDA DG/CHP Integrated Database System Utility Rate Details
CDH Energy Corporation 469 September 25, 2008
San Diego Gas & Electric
Rate Schedule DR – Residential Service - TOU – Inland Baseline – January 2007 This schedule is optionally available to single-phase domestic service for lighting, heating, cooking, water heating, and power, or combination thereof, in single-family dwellings, flats, and apartments where the customer is separately metered by the utility. The utility reserves the right to limit the number of customers receiving service under the terms of this schedule, as described in Special Condition 8. Periods Summer Peak 12 - 6 PM, Monday-Friday from May – October Summer Off-Peak All Other Hours from May – October Winter Peak 12 - 6 PM, Monday-Friday from November – April Winter Off-Peak All Other Hours from November – April Energy Charges $ per total kWh per day Block Charges1 0-11.8 kWh 11.8-15.34 kWh 15.34-23.6 kWh 23.6-35.4 kWh Over 35.4 kWh Summer Peak $0.00753 / kWh $0.00490 / kWh $0.09613 / kWh $ 0.16321 / kWh $ 0.17904 / kWh Summer Off-Peak $0.06593 / kWh $0.06330 / kWh $0.14740 / kWh $ 0.16157 / kWh $ 0.17740 / kWh 0-11.5 kWh 11.5-14.95 kWh 14.95-23 kWh 23-34.5 kWh Over 34.5 kWh Winter Peak $0.05835 / kWh $0.07106 / kWh $0.13645 / kWh $ 0.17424 / kWh $ 0.19094 / kWh Winter Off-Peak $0.06407 / kWh $0.07671 / kWh $0.14109 / kWh $ 0.17405 / kWh $ 0.19075 / kWh
Filename: SDGE_DR_TOU_inland_jan07.csv
San Diego Gas & Electric
Rate Schedule DR – Residential Service - TOU – Inland Baseline – July 2008 This schedule is optionally available to single-phase domestic service for lighting, heating, cooking, water heating, and power, or combination thereof, in single-family dwellings, flats, and apartments where the customer is separately metered by the utility. The utility reserves the right to limit the number of customers receiving service under the terms of this schedule, as described in Special Condition 8. Periods Summer Peak 12 - 6 PM, Monday-Friday from May – October Summer Off-Peak All Other Hours from May – October Winter Peak 12 - 6 PM, Monday-Friday from November – April Winter Off-Peak All Other Hours from November – April Energy Charges $ per total kWh per day Block Charges1 0-11.8 kWh 11.8-15.34 kWh 15.34-23.6 kWh Over 23.6kWh Summer Peak ($0.05177) / kWh ($0.04951) / kWh $0.00972 / kWh $ 0.13720 / kWh Summer Off-Peak $0.05735 / kWh $0.05961 / kWh $0.11542 / kWh $ 0.13556 / kWh 0-11.5 kWh 11.5-14.95 kWh 14.95-23 kWh Over 23kWh Winter Peak $0.05291 / kWh $0.05517 / kWh $0.09644 / kWh $ 0.14552 / kWh Winter Off-Peak $0.06174 / kWh $0.06400 / kWh $0.10500 / kWh $ 0.14533 / kWh
Filename: SDGE_DR_TOU_inland_Jul08.csv

NYSERDA DG/CHP Integrated Database System Utility Rate Details
CDH Energy Corporation 470 September 25, 2008
San Diego Gas & Electric
Rate Schedule DR – Residential Service - TOU – Inland Baseline – All Electric – January 2007 This schedule is optionally available to single-phase domestic service for lighting, heating, cooking, water heating, and power, or combination thereof, in single-family dwellings, flats, and apartments where the customer is separately metered by the utility. The utility reserves the right to limit the number of customers receiving service under the terms of this schedule, as described in Special Condition 8. Periods Summer Peak 12 - 6 PM, Monday-Friday from May – October Summer Off-Peak All Other Hours from May – October Winter Peak 12 - 6 PM, Monday-Friday from November – April Winter Off-Peak All Other Hours from November – April Energy Charges $ per total kWh per day Block Charges1 0-11.6 kWh 11.6-15.08 kWh 15.08-23.2 kWh 23.2-34.8 kWh Over 34.8 kWh Summer Peak $0.00650 / kWh $0.16013 / kWh $0.17139 / kWh $ 0.18186 / kWh $ 0.17904 / kWh Summer Off-Peak $0.06490 / kWh $0.20640 / kWh $0.16330 / kWh $ 0.18022 / kWh $ 0.17740 / kWh 0-19.1 kWh 19.1-24.83 kWh 24.83-38.2 kWh 38.2-57.3 kWh Over 57.3 kWh Winter Peak $0.05822 / kWh $0.06332 / kWh $0.13360 / kWh $ 0.17286 / kWh $ 0.19094 / kWh Winter Off-Peak $0.06394 / kWh $0.06904 / kWh $0.13862 / kWh $ 0.17267 / kWh $ 0.19075 / kWh
Filename: SDGE_DR_TOU_inland_allelec_jan07.csv
San Diego Gas & Electric
Rate Schedule DR – Residential Service - TOU – Inland Baseline – All Electric – July 2008 This schedule is optionally available to single-phase domestic service for lighting, heating, cooking, water heating, and power, or combination thereof, in single-family dwellings, flats, and apartments where the customer is separately metered by the utility. The utility reserves the right to limit the number of customers receiving service under the terms of this schedule, as described in Special Condition 8. Periods Summer Peak 12 - 6 PM, Monday-Friday from May – October Summer Off-Peak All Other Hours from May – October Winter Peak 12 - 6 PM, Monday-Friday from November – April Winter Off-Peak All Other Hours from November – April Energy Charges $ per total kWh per day Block Charges1 0-11.6 kWh 11.6-15.08 kWh 15.08-23.2 kWh Over 23.2 kWh Summer Peak ($0.05177) / kWh ($0.04951) / kWh $0.00972 / kWh $ 0.13720 / kWh Summer Off-Peak $0.05735 / kWh $0.05961 / kWh $0.11542 / kWh $ 0.13556 / kWh 0-19.1 kWh 19.1-24.83 kWh 24.83-38.2 kWh Over 38.2 kWh Winter Peak $0.05291 / kWh $0.05517 / kWh $0.09644 / kWh $ 0.14552 / kWh Winter Off-Peak $0.06174 / kWh $0.06400 / kWh $0.10500 / kWh $ 0.14533 / kWh
Filename: SDGE_DR_TOU_inland_allelec_Jul08.csv

NYSERDA DG/CHP Integrated Database System Utility Rate Details
CDH Energy Corporation 471 September 25, 2008
San Diego Gas & Electric
Rate Schedule DM – Multi-Family Service – Inland Baseline – January 2007 This schedule is applicable This schedule is applicable to service for domestic lighting, heating, cooking, water heating, and power service supplied to multi-family accommodations through one meter on a single premises in accordance with the provisions of Rule 19. This schedule was closed to new installations, except for residential hotels, on June 13, 1978. Multi-family accommodations built prior to June 13, 1978 and served under this Schedule may also be eligible for service under Schedule DS. If an eligible multi-family accommodation or residential hotel served under this Schedule converts to an applicable submetered tariff, the tenant rental charges shall be revised for the duration of the lease to reflect the removal of the energy related charges. Periods Summer May – October Winter November – April Energy Charges $ per total kWh per day Block Charges 0-7.1 kWh 7.1-9.23 kWh 9.23-14.2 kWh 14.2-21.3 kWh Over 21.3 kWh Summer $0.03790 / kWh $0.05807 / kWh $0.15328 / kWh $ 0.16235 / kWh $ 0.17818 / kWh 0-6.9 kWh 6.9-8.97 kWh 8.97-13.8 kWh 13.8-20.7 kWh Over 20.7 kWh Winter $0.06544 / kWh $0.09476 / kWh $0.16534 / kWh $ 0.17498 / kWh $ 0.19153 / kWh
Filename: SDGE_DM_inland_jan07.csv
San Diego Gas & Electric
Rate Schedule DM – Multi-Family Service – Inland Baseline – July 2008 This schedule is applicable This schedule is applicable to service for domestic lighting, heating, cooking, water heating, and power service supplied to multi-family accommodations through one meter on a single premises in accordance with the provisions of Rule 19. This schedule was closed to new installations, except for residential hotels, on June 13, 1978. Multi-family accommodations built prior to June 13, 1978 and served under this Schedule may also be eligible for service under Schedule DS. If an eligible multi-family accommodation or residential hotel served under this Schedule converts to an applicable submetered tariff, the tenant rental charges shall be revised for the duration of the lease to reflect the removal of the energy related charges. Periods Summer May – October Winter November – April Energy Charges $ per total kWh per day Block Charges 0-7.1 kWh 7.1-9.23 kWh 9.23-14.2 kWh Over 14.2kWh Summer $0.02670 / kWh $0.04790 / kWh $0.11227 / kWh $ 0.13634 / kWh 0-6.9 kWh 6.9-8.97 kWh 8.97-13.8 kWh Over 13.8kWh Winter $0.052280 / kWh $0.07348 / kWh $0.12229 / kWh $ 0.14611 / kWh
Filename: SDGE_DM_inland_Jul08.csv

NYSERDA DG/CHP Integrated Database System Utility Rate Details
CDH Energy Corporation 472 September 25, 2008
San Diego Gas & Electric
Rate Schedule DM – Multi-Family Service – Inland Baseline – All Electric – January 2007 This schedule is applicable This schedule is applicable to service for domestic lighting, heating, cooking, water heating, and power service supplied to multi-family accommodations through one meter on a single premises in accordance with the provisions of Rule 19. This schedule was closed to new installations, except for residential hotels, on June 13, 1978. Multi-family accommodations built prior to June 13, 1978 and served under this Schedule may also be eligible for service under Schedule DS. If an eligible multi-family accommodation or residential hotel served under this Schedule converts to an applicable submetered tariff, the tenant rental charges shall be revised for the duration of the lease to reflect the removal of the energy related charges. Periods Summer May – October Winter November – April Energy Charges $ per total kWh per day Block Charges 0-7.3 kWh 7.3-9.49 kWh 9.49-14.6 kWh 14.6-21.9 kWh Over 21.9 kWh Summer $0.04538 / kWh $0.21101 / kWh $0.16289 / kWh $ 0.17995 / kWh $ 0.17818 / kWh 0-11.6 kWh 11.6-15.08 kWh 15.08-23.2 kWh 23.2-34.8 kWh Over 34.8 kWh Winter $0.06487 / kWh $0.08504 / kWh $0.16463 / kWh $ 0.17345 / kWh $ 0.19153 / kWh
Filename: SDGE_DM_inland_allelec_jan07.csv
San Diego Gas & Electric
Rate Schedule DM – Multi-Family Service – Inland Baseline – All Electric – July 2008 This schedule is applicable This schedule is applicable to service for domestic lighting, heating, cooking, water heating, and power service supplied to multi-family accommodations through one meter on a single premises in accordance with the provisions of Rule 19. This schedule was closed to new installations, except for residential hotels, on June 13, 1978. Multi-family accommodations built prior to June 13, 1978 and served under this Schedule may also be eligible for service under Schedule DS. If an eligible multi-family accommodation or residential hotel served under this Schedule converts to an applicable submetered tariff, the tenant rental charges shall be revised for the duration of the lease to reflect the removal of the energy related charges. Periods Summer May – October Winter November – April Energy Charges $ per total kWh per day Block Charges 0-7.3 kWh 7.3-9.49 kWh 9.49-14.6 kWh Over 14.6 kWh Summer $0.02670 / kWh $0.04790 / kWh $0.11227 / kWh $ 0.13634 / kWh 0-11.6 kWh 11.6-15.08 kWh 15.08-23.2 kWh Over 23.2 kWh Winter $0.052280 / kWh $0.07348 / kWh $0.12229 / kWh $ 0.14611 / kWh
Filename: SDGE_DM_inland_allelec_Jul08.csv
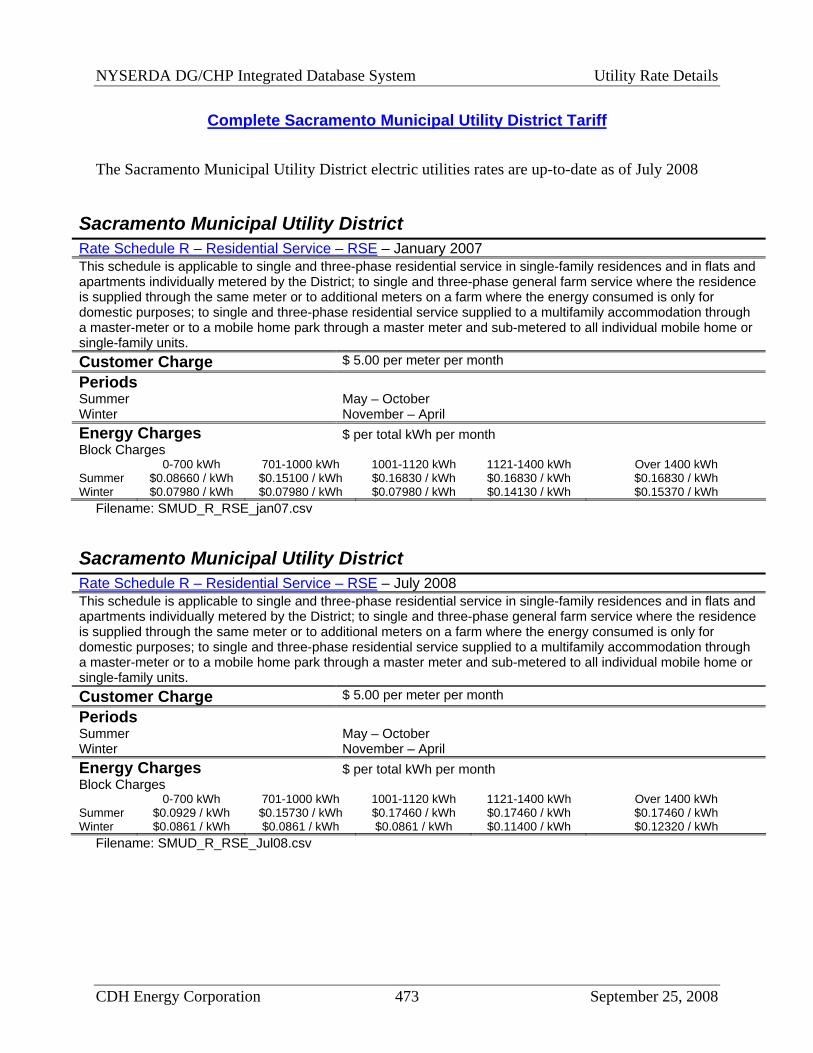
NYSERDA DG/CHP Integrated Database System Utility Rate Details
CDH Energy Corporation 473 September 25, 2008
Complete Sacramento Municipal Utility District Tariff
The Sacramento Municipal Utility District electric utilities rates are up-to-date as of July 2008
Sacramento Municipal Utility District
Rate Schedule R – Residential Service – RSE – January 2007 This schedule is applicable to single and three-phase residential service in single-family residences and in flats and apartments individually metered by the District; to single and three-phase general farm service where the residence is supplied through the same meter or to additional meters on a farm where the energy consumed is only for domestic purposes; to single and three-phase residential service supplied to a multifamily accommodation through a master-meter or to a mobile home park through a master meter and sub-metered to all individual mobile home or single-family units. Customer Charge $ 5.00 per meter per month
Periods Summer May – October Winter November – April Energy Charges $ per total kWh per month Block Charges 0-700 kWh 701-1000 kWh 1001-1120 kWh 1121-1400 kWh Over 1400 kWh Summer $0.08660 / kWh $0.15100 / kWh $0.16830 / kWh $0.16830 / kWh $0.16830 / kWh Winter $0.07980 / kWh $0.07980 / kWh $0.07980 / kWh $0.14130 / kWh $0.15370 / kWh
Filename: SMUD_R_RSE_jan07.csv
Sacramento Municipal Utility District
Rate Schedule R – Residential Service – RSE – July 2008 This schedule is applicable to single and three-phase residential service in single-family residences and in flats and apartments individually metered by the District; to single and three-phase general farm service where the residence is supplied through the same meter or to additional meters on a farm where the energy consumed is only for domestic purposes; to single and three-phase residential service supplied to a multifamily accommodation through a master-meter or to a mobile home park through a master meter and sub-metered to all individual mobile home or single-family units. Customer Charge $ 5.00 per meter per month
Periods Summer May – October Winter November – April Energy Charges $ per total kWh per month Block Charges 0-700 kWh 701-1000 kWh 1001-1120 kWh 1121-1400 kWh Over 1400 kWh Summer $0.0929 / kWh $0.15730 / kWh $0.17460 / kWh $0.17460 / kWh $0.17460 / kWh Winter $0.0861 / kWh $0.0861 / kWh $0.0861 / kWh $0.11400 / kWh $0.12320 / kWh
Filename: SMUD_R_RSE_Jul08.csv

NYSERDA DG/CHP Integrated Database System Utility Rate Details
CDH Energy Corporation 474 September 25, 2008
Sacramento Municipal Utility District
Rate Schedule R – Residential Service – RWE – January 2007 This schedule is applicable to single and three-phase residential service in single-family residences and in flats and apartments individually metered by the District; to single and three-phase general farm service where the residence is supplied through the same meter or to additional meters on a farm where the energy consumed is only for domestic purposes; to single and three-phase residential service supplied to a multifamily accommodation through a master-meter or to a mobile home park through a master meter and sub-metered to all individual mobile home or single-family units. Customer Charge $ 5.00 per meter per month
Periods Summer May – October Winter November – April Energy Charges $ per total kWh per month Block Charges 0-1000 kWh 1001-1300 kWh 1301-1420 kWh 1421-1700 kWh Over 1700 kWh Summer $0.08660 / kWh $0.15100 / kWh $0.16830 / kWh $0.16830 / kWh $0.16830 / kWh Winter $0.07980 / kWh $0.07980 / kWh $0.07980 / kWh $0.14130 / kWh $0.15370 / kWh
Filename: SMUD_R_RWE_jan07.csv
Sacramento Municipal Utility District
Rate Schedule R – Residential Service – RWE – July 2008 This schedule is applicable to single and three-phase residential service in single-family residences and in flats and apartments individually metered by the District; to single and three-phase general farm service where the residence is supplied through the same meter or to additional meters on a farm where the energy consumed is only for domestic purposes; to single and three-phase residential service supplied to a multifamily accommodation through a master-meter or to a mobile home park through a master meter and sub-metered to all individual mobile home or single-family units. Customer Charge $ 5.00 per meter per month
Periods Summer May – October Winter November – April Energy Charges $ per total kWh per month Block Charges 0-1000 kWh 1001-1300 kWh 1301-1420 kWh 1421-1700 kWh Over 1700 kWh Summer $0.0929 / kWh $0.15730 / kWh $0.17460 / kWh $0.17460 / kWh $0.17460 / kWh Winter $0.0861 / kWh $0.0861 / kWh $0.0861 / kWh $0.11400 / kWh $0.12320 / kWh
Filename: SMUD_R_RWE_Jul08.csv

NYSERDA DG/CHP Integrated Database System Utility Rate Details
CDH Energy Corporation 475 September 25, 2008
Sacramento Municipal Utility District
Rate Schedule R – Residential Service – TOU Option 1 - RTE – January 2007 This schedule is applicable to Residential customers shall be entitled to a 12-month trial period for option 1 in which the customer shall receive a credit (after 12 months of billing on the option at Time-of-Use Rates) for the accumulated difference, if applicable, between the Standard Rate and the Optional Time-of-Use, after which either the Standard Rate or the Optional Time-of-Use Rate must be selected. If the Optional Time-of-Use Rate is selected, customers subsequently requesting a transfer from the Optional Time-of-Use Rate to the Standard Rate may not return to the Optional Time-of-Use Rate for a 12-month period. Customer Charge $ 5.00 per meter per month
Periods Summer Peak May 1 – October 31: Weekdays 2PM – 8PM Summer Off-Peak May 1 – October 31: All other hours Winter Peak November 1 – April 30: Weekdays 7AM – 10AM and 5PM - 8PM Winter Off-Peak November 1 – April 30: All other hours Energy Charges $ per total kWh per month
Summer Peak Summer Off-Peak Winter Peak Winter Off-Peak $0.20390 / kWh $0.09110 / kWh $0.08930 / kWh $0.08090 / kWh Filename: SMUD_R_TOU1_RTE_jan07.csv
Sacramento Municipal Utility District
Rate Schedule R – Residential Service – TOU Option 1 - RTE – July 2008 This schedule is applicable to Residential customers shall be entitled to a 12-month trial period for option 1 in which the customer shall receive a credit (after 12 months of billing on the option at Time-of-Use Rates) for the accumulated difference, if applicable, between the Standard Rate and the Optional Time-of-Use, after which either the Standard Rate or the Optional Time-of-Use Rate must be selected. If the Optional Time-of-Use Rate is selected, customers subsequently requesting a transfer from the Optional Time-of-Use Rate to the Standard Rate may not return to the Optional Time-of-Use Rate for a 12-month period. Customer Charge $ 5.00 per meter per month
Periods Summer Peak May 1 – October 31: Weekdays 2PM – 8PM Summer Off-Peak May 1 – October 31: All other hours Winter Peak November 1 – April 30: Weekdays 7AM – 10AM and 5PM - 8PM Winter Off-Peak November 1 – April 30: All other hours Energy Charges $ per total kWh per month
Summer Peak Summer Off-Peak Winter Peak Winter Off-Peak $0.21020 / kWh $0.09740 / kWh $0.08720 / kWh $0.09560 / kWh Filename: SMUD_R_TOU1_RTE_Jul08.csv

NYSERDA DG/CHP Integrated Database System Utility Rate Details
CDH Energy Corporation 476 September 25, 2008
Sacramento Municipal Utility District
Rate Schedule R – Residential Service – TOU Option 2 – RTE5 – January 2007 This schedule is applicable to Residential customers shall be entitled to a 12-month trial period for option 1 in which the customer shall receive a credit (after 12 months of billing on the option at Time-of-Use Rates) for the accumulated difference, if applicable, between the Standard Rate and the Optional Time-of-Use, after which either the Standard Rate or the Optional Time-of-Use Rate must be selected. If the Optional Time-of-Use Rate is selected, customers subsequently requesting a transfer from the Optional Time-of-Use Rate to the Standard Rate may not return to the Optional Time-of-Use Rate for a 12-month period. Customer Charge $ 10.00 per meter per month
Periods Summer Peak June 1 – September 31: Weekdays 12PM – 2PM and 8PM – 10PM Summer Super-Peak June 1 – September 31: Weekdays 2PM – 8PM Summer Off-Peak May 1 – October 31: All other hours Winter Peak October 1 – May 31: Weekdays 12PM – 10PM Winter Off-Peak November 1 – April 30: All other hours Energy Charges $ per total kWh per month
Summer Peak Summer Super-Peak Summer Off-Peak Winter Peak Winter Off-Peak $0.13550 / kWh $0.20670 / kWh $0.08130 / kWh $0.09010 / kWh $0.08220 / kWh Filename: SMUD_R_TOU2_RTE5_jan07.csv
Sacramento Municipal Utility District
Rate Schedule R – Residential Service – TOU Option 2 – RTE5 – July 2008 This schedule is applicable to Residential customers shall be entitled to a 12-month trial period for option 1 in which the customer shall receive a credit (after 12 months of billing on the option at Time-of-Use Rates) for the accumulated difference, if applicable, between the Standard Rate and the Optional Time-of-Use, after which either the Standard Rate or the Optional Time-of-Use Rate must be selected. If the Optional Time-of-Use Rate is selected, customers subsequently requesting a transfer from the Optional Time-of-Use Rate to the Standard Rate may not return to the Optional Time-of-Use Rate for a 12-month period. Customer Charge $ 10.00 per meter per month
Periods Summer Peak June 1 – September 31: Weekdays 12PM – 2PM and 8PM – 10PM Summer Super-Peak June 1 – September 31: Weekdays 2PM – 8PM Summer Off-Peak May 1 – October 31: All other hours Winter Peak October 1 – May 31: Weekdays 12PM – 10PM Winter Off-Peak November 1 – April 30: All other hours Energy Charges $ per total kWh per month
Summer Peak Summer Super-Peak Summer Off-Peak Winter Peak Winter Off-Peak $0.14180 / kWh $0.21300 / kWh $0.08760 / kWh $0.09640 / kWh $0.08850 / kWh Filename: SMUD_R_TOU2_RTE5_Jul08.csv

NYSERDA DG/CHP Integrated Database System Utility Rate Details
CDH Energy Corporation 477 September 25, 2008
Complete Bangor Hydro-Electric Tariff
The Bangor Hydro-Electric rates are up-to-date as of December 2007.
Bangor Hydro-Electric Company
Class D-4 – Primary Power Large Rate – Time-of-Use Service under this rate is available to commercial or industrial customers where the customer agree to pay for service on the basis of 500 kW or more of demand, takes service at primary voltage and owns and maintains such transformers and other substation facilities as may be required to transform the available voltage to the voltage or voltages required by the customer. Customers taking service under this rate schedule are responsible for paying both Distribution Service and Stranded Cost. Customer Charge $ 39.50 / month
Periods Non-Winter March – October Winter November – February Peak Monday – Friday, 7:00AM-12:00PM and 4:00-8:00PM Shoulder Mon – Fri, 12:00PM-4:00PM and Sat – Sun, 7:00AM to 8:00PM Off-Peak 8:00PM-7:00AM Demand Charges $ per peak kW in defined period Distribution Service, Stranded Cost and Transmission Service Peak Shoulder Off-Peak Winter $ 8.95 / peak kW $ 3.33 / peak kW $ 0.26 / peak kW Non-Winter $ 6.61 / peak kW $ 1.89 / peak kW $ 0.26 / peak kW Energy Charges $ per total kWh per defined period Distribution Service, Stranded Cost, Transmission Service Peak Shoulder Off-Peak Winter $ 0.02246 / total kWh $ 0.02067 / total kWh $ 0.010724 / total kWh Non-Winter $ 0.02246 / total kWh $ 0.02067 / total kWh $ 0.010724 / total kWh Standard Offer Service1 Jan Feb Mar Apr May Jun Jul Aug Sep Oct Nov Dec
$0.09798 $0.09798 $0.10484 $0.09754 $0.10360 $0.10172 $0.10778 $0.10358 $0.09798 $0.09798 $0.09798 $0.09798 1 – Standard Offer Prices are from Sep 06-Aug 07 as listed on the Maine Public Utility Commission
website Filename: Bangor_D4_Pri.csv

NYSERDA DG/CHP Integrated Database System Utility Rate Details
CDH Energy Corporation 478 September 25, 2008
Bangor Hydro-Electric Company
Class SB-L5 – Standby Large General Service at Primary Voltage – 50% Generation Capacity Service under this rate is available to all commercial or industrial customers who receive all or any portion of their electric supply from Customer owned generation unit(s) with a nameplate rating equal to or greater than 500 kW. The nameplate rating of Generation Units must be greater than or equal to 50% of the Customer’s peak demand based upon the Customer’s most recent historical load. Generation Units must have operated at a capacity factor of 80% or greater in the previous calendar year. Customer Charge $ 900 / month
Periods Non-Winter March – October Winter November – February Peak Monday – Friday, 7:00AM-12:00PM and 4:00-8:00PM Shoulder Mon – Fri, 12:00PM-4:00PM and Sat – Sun, 7:00AM to 8:00PM Off-Peak 8:00PM-7:00AM Demand Charges $ per peak kW in defined period Distribution Service, Stranded Cost and Transmission Service Peak Shoulder Off-Peak Winter $ 7.29 / peak kW $ 2.36 / peak kW $ 0.13 / peak kW Non-Winter $ 6.12 / peak kW $ 1.64 / peak kW $ 0.13 / peak kW Energy Charges $ per total kWh per defined period Distribution Service, Stranded Cost, Transmission Service Peak Shoulder Off-Peak Winter $ 0.02246 / total kWh $ 0.02067 / total kWh $ 0.010724 / total kWh Non-Winter $ 0.02246 / total kWh $ 0.02067 / total kWh $ 0.010724 / total kWh Standard Offer Service1 Jan Feb Mar Apr May Jun Jul Aug Sep Oct Nov Dec
$0.09798 $0.09798 $0.10484 $0.09754 $0.10360 $0.10172 $0.10778 $0.10358 $0.09798 $0.09798 $0.09798 $0.09798 1 – Standard Offer Prices are from Sep 06-Aug 07 as listed on the Maine Public Utility Commission
website Filename: Bangor_SB-L5_Pri.csv