Embed Size (px)
Citation preview

University of New MexicoUNM Digital Repository
Water Resources Professional Project Reports Water Resources
9-17-2010
Utility response to drought : business of watermanagement practices and function in view ofdecreased consumptionLouis Martinez
Follow this and additional works at: https://digitalrepository.unm.edu/wr_sp
This Technical Report is brought to you for free and open access by the Water Resources at UNM Digital Repository. It has been accepted for inclusionin Water Resources Professional Project Reports by an authorized administrator of UNM Digital Repository. For more information, please [email protected].
Recommended CitationMartinez, Louis. "Utility response to drought : business of water management practices and function in view of decreasedconsumption." (2010). https://digitalrepository.unm.edu/wr_sp/90

1
Utility Response to Drought
Business of Water Management Practices and Function
In View of Decreased Consumption
by
Louis Martinez
Water Resources Program
The University of New Mexico
Albuquerque, New Mexico 87131
June 2009

2
Table of Contents Acknowledgements ......................................................................................................................... 4 Abstract ........................................................................................................................................... 5 Introduction ..................................................................................................................................... 6
Nature, Scope and Objectives of this Research ............................................................................ 12 Nature ........................................................................................................................................ 13 Scope ......................................................................................................................................... 13 Objectives of the Research ........................................................................................................ 14 Background ............................................................................................................................... 17
Research Methods - Construction of the Severe Drought and Business Case Development –
Implications and Impacts of Drought and Aging Infrastructure to Projected Utility Revenue
Shortfall......................................................................................................................................... 20 Construction of Severe Drought ............................................................................................... 20
Five year Drought Scenario- based on the Historic Record ................................................ 20 Ten year Severe Drought Scenario- The Tree Ring Record (TRR) ...................................... 21
Greater than 15 years – ‘the Perfect Drought’; Rearranged Severe Drought Scenario
(combination Global Climate Model/ TRR) .......................................................................... 22 Sustained Drought Conditions .............................................................................................. 25
Business Case Development – Implications and Impacts of Drought and Aging Infrastructure
to Projected Utility Revenue Shortfall ...................................................................................... 30
Current Drought Management Strategy (2003)-Voluntary/Mandatory
Conservation/Rationing ........................................................................................................ 31
Model Development---Integrating GIS Produced Pipeline Analysis into an Economic
Rehabilitation Model ............................................................................................................ 33
Infrastructure Planning with Nessi-curve ............................................................................. 38 Cash Requirements for the Future ........................................................................................ 40
Critical Policy Issues and Recommendations ............................................................................... 42
What are the options? To prepare / plan for impact due to drought ......................................... 44
Secure and Sustainable Water Supply and Water Resource Infrastructure in an Uncertain
Future ........................................................................................................................................ 44 Management Options-Asset Management and Legislation (Rate Structure Changes) ............. 45 Costs and Rate Implications...................................................................................................... 45 Recommendations ..................................................................................................................... 48
Conclusion ................................................................................................................................ 51
Glossary of Terms / Acronyms ..................................................................................................... 52
References ..................................................................................................................................... 53 Appendix A (see disc / back cover) .............................................................................................. 58 Appendix B (see disc / back cover) .............................................................................................. 58

3
List of Figures
Figure 1-Nessi Curve, a demographic echo .................................................................................... 8 Figure 2- Scenarios/ Solutions ...................................................................................................... 11
Figure 3- Water Authority Water Distribution System................................................................. 14 Figure 4- Multiple Scenario Water Planning/Cone of Uncertainty .............................................. 16 Figure 5- Rio Grande Flows, 2080 (projections); Dry, Middle and Wet Hydrographs ................ 18 Figure 6- Annual Streamflow, Otowi Bridge, NM, 1940-2005; source: Schmidt-Peterson, 2007
....................................................................................................................................................... 20 Figure 7-Annual Streamflow, Otowi Bridge, NM, 1997-2006/ Ten Year Drought Period; source:
USGS, 2009 .................................................................................................................................. 21 Figure 8- Total Length of 6-inch Steel Pipe by Years in Ground, <1932-1970; source: Authority,
2005............................................................................................................................................... 36 Figure 9-Backlog Replacement Costs for 6-inch Steel Pipe, 1932-1970; source: Authority, 2005
....................................................................................................................................................... 37
Figure 10- Fifteen Year Plan...Backlog Replacement Costs for 6-inch Steel Pipe, 2005-2020 ... 38 Figure 11- Stacked Nessi-Curves for all Material Pipe Types over 15 Years, 2005-2020 ........... 39 Figure 12-Cumulative Water Pipe Replacement Costs vs. Drought Revenue Deficit, 2005-2020
....................................................................................................................................................... 41
List of Tables
Table 1-- Authority Selected Water and Sewer Characteristics 2006 ............................................ 9 Table 2 - Authority Infrastructure Assets: Water & Sewer Inventory Replacement Cost (source:
Authority) ...................................................................................................................................... 10 Table 3- 15 Year Drought; Estimated Supply contraction Year 9- Year 15 ................................. 26
Table 4 -Cost to Replace Aging Infrastructure (sample model run data for 6-inch steel pipe) .... 34 Table 5- Look Up Table for Pipe by Diameter Size (x-axis) & Material Type (y-axis) .............. 35
Table 6- Look Up Table for Life Cycle: Material Type & Life Cycle ........................................ 35 Table 7- Sinking Fund Schedule to Recover 'Unrealized Income' Due to Drought ..................... 46

4
Acknowledgements
There are a number of professors, friends and family that have helped me with this paper and that
I owe „Special Thanks‟. First, I would like to thank Bruce Thomson, David Gutzler, and Heather
Himmelberger for their time serving on my committee. I would also like to express my appreciation to
Annamarie Cordova, UNM Water Resources Department, who has kept track of my academic progress
and helped me navigate the graduate school‟s administrative processes. Next, I would like to recognize
my wife Melissa and my children, Callan, Micah, and Taylor for their encouragement, support, and not
complaining, too much, about my research papers that have accumulated on every open table and desktop
in our home. During the preparation of this paper, I received data, information and concepts for this
project from my former supervisor Steve Bockemeier and appreciate all of his guidance, invaluable
contributions, editing and support for this project.
I would also like to thank a number of people associated with the Graduate and Professional
Student Association for their friendship, study groups, and encouragement to finish this project. In this
same light, I would also like to express my appreciation to UNM Professors Michael Campana and
Michelle Minnis for all their special efforts that made it possible for me and my classmates to go to
Honduras (2002) for our capstone Water Resources class. They made all the travel arrangements and
helped to find significant funding for our travel, meals, and other expenses. This trip to the Village of
Nueva Vida, Honduras may have been the highlight of my pursuit of my degree, having made lasting
connections with the many generous individuals Alex Uriel del Cid Vasquez, Rolando Lopez and his
son Guillermo, as well as, families that housed us, fed us and guided us safely through the jungle.
I would also like to thank, Charles Fledderman, Dean of the Office of Graduate Studies for
understanding the unusual and extenuating circumstances that graduate students are often confronted. I
appreciated his willingness to give me the time needed to work through those times, in order to achieve
the best outcome for both the students and UNM. In my case, he aided me through such a time, and
helped me accomplish a cherished goal to graduate.

5
Abstract
This paper uses parametric methods to construct 5 year, 10 year, and greater than 15 year
drought scenarios to calculate potential source water reduction for the Albuquerque Bernalillo
County Water Utility Authority‟s (Authority) service area. The drought scenarios are drawn
from literature of the Southwestern region‟s historical precipitation patterns, the tree-ring record
(TRR), and Global Climate Models (GCM). The cumulative surface water losses attributed to
prolonged drought conditions are between 20,000 and 25,000 Acre-Feet per year. Converting
the contracted supply, that would be unavailable for sale by the Authority, based on the
commodity charge, represents a considerable financial loss, with an estimated annual revenue
reduction of approximately $14 million. The estimated cumulative cost, unrealized income, for
the Authority of a 15 year drought is over $110 million. Asset Management tools, in particular
Nessi-curves, were used to graphically display the financial cost to replace aging water pipe
system wide. Integrating an in-house GIS Produced Pipeline Analysis Rehabilitation Model and
stacking the Nessi-curves, for the period 2005-2020, the amount needed to replace the aging pipe
is around $1 billion. Current capital programs would meet about 25% of this forecasted need.
The risk exposure to a prolonged drought and the potential unmet requirements to replace critical
aging pipe infrastructure over the next 15 to 20 years is around $1 billion. Management options
to address such a considerable revenue shortfall due to drought and infrastructure are limited.
Continued Asset Management is recommended to prioritize project replacement work and may
extend the life of the pipe asset base. This has the possibility to lessen the infrastructure cost of
ownership by as much as 30%. However, it is recommended to increase monthly average rates
by around $6, and place the funds in a reserve, sinking fund. This fund is estimated to grow to
over $110 million in 15 years in order to provide protection against a severe or prolonged
drought.

6
Introduction
Significant water problems exist in New Mexico and other parts of the Southwestern
United States, due to prolonged droughts, urban development, ground water depletion,
agricultural use, and population growth. In general, this region is characterized by low
precipitation, aridity and drought. Utilities must respond to the problem using planning and
education. The need to manage this problem is crucial to sustainability and our future (Thebaut,
2005).
Amid day to day challenges, sustainable public and private utilities are watching the five D‟s
below and may find it necessary to adjust the operational, financial and management strategy to
coincide with these regional realities, trends and drivers. These are:
Drinking water is scarce in the Southwest;
Demand is outpacing water supply due to population growth;
Drought scenarios suggest limited and vulnerable supply;
Declining utility revenue related to effective conservation, prolonged drought and climate
change;
Deterioration of water and sanitation infrastructure.
With these realities in mind, the following sections set out the approach and framework used
to satisfy the problem statement: How might prolonged drought exacerbate the consequences of
the Authority‟s ability to replace aging infrastructure, with its high cost, yet remain financially
sustainable? What are some of the feasible choices?
7
Utilizing the development of three plausible drought scenarios with a durations of 5 years, 10
years, and 15 years beginning with projected year of 2010 can integrate many of the current
behavioral strategies, along with quantifiable physical drought conditions (intensity, duration,
and frequency), past spatial / temporal patterns, as well as links to business vulnerabilities and
risk to „test‟ the ability of the utility to maintain the level of service. In order to establish a more
robust drought response, utilities must include an analysis of the natural climatic and hydrologic
variability pattern over the landscape encompassed by the Colorado River Basin, and climatic
processes that water resources of the Rio Grande above and below the utility service area. These
scenarios draw from a synthesis of both national and international drought management
literature.
Utility risk exposure has increased through water conservation. The fiscal effect of a water
conservation program means a declining base revenue stream resulting in lower per capita unit
sale of water and foregone revenue in the form of rebates/ incentives. The fiscal analysis and
long term impact from shrinking revenue is presented in revenue estimates. However, this
financial vulnerability will be revealed with deferred maintenance, rehabilitation, and
replacement of aging and critical infrastructure, and ultimately the performance and level of
utility service provided.
The project develops a Nessi curve (Figure 1), an Asset Management technical/financial tool,
to construct a cost estimate, to replace the backlog of aging water pipe in a service area with a
capital plan to ease the financial transition over future years. A Nessi curve is a reference to the
similar sinuous body shape of Scottland‟s legendary Loch Ness monster, affectionately known as
„Nessie‟.

8
Figure 1-Nessi Curve, a demographic echo
A number of Southwestern water/wastewater utilities, are utilizing Asset Management
Nessi-curve tools to prepare management and capital plans. “Asset management is a planning
process that ensures that you get the most value from each of your assets and have the financial
resources to rehabilitate and replace them when necessary. Asset management also includes
developing a plan to reduce costs while increasing the efficiency and the reliability of your
assets. Successful asset management depends on knowing about your system‟s assets and
regularly communicating with management and customers about your system‟s future needs”
(EPA, 2009).
Much of the asset work presented is based on the data compiled and summarized from
City of Albuquerque‟s (COA) Geographic Information System (GIS) Data Base (COA, 2005)
and characteristics of the Albuquerque Bernalillo County Water Utility Authority‟s (Authority)
with some updates related to the service population, since this impacts on this paper‟s forecasts
and estimated future cost .

9
The salient data for the Authority are presented in Table 1.
Table 1-- Authority Selected Water and Sewer Characteristics 2006
Many of the Authority‟s services are resource intensive. In order to provide its services
to customers, the Authority relies on a estimated $3 billion (capital replacement value) portfolio
of water wells, wastewater treatment plants, sewer lines, collection systems, distribution systems
and water storage systems and other infrastructure assets (see Table 2). The top rows in Table 2
pertain to the Water System. In 2004, the Authority‟s estimated total cost to replace Master Plan
Waterlines and Small Waterlines is shown as $823,314,437; so waterlines (distribution) are
roughly one-third the total asset portfolio value of the utility. The total pipe length is
approximately 2,266 miles and the replacement cost per foot of pipe is about $75.
Much of this infrastructure is aging, having been built since World War II. To maintain
these assets and ensure reliable services to customers, the Authority routinely considers a number
Authority Selected Water and Sewer System Characteristics 2006
Est. population (service area) 530,600
Number of meters billed 171,130
Est. persons per meter 3.10
Annual pumpage (1000 Gallons) 31,384
Annual water billed (1000 Gallons) 27,942,376
Average daily pumpage (Gallons) 85,983,561
Peak day pumpage (Gallons) 149,940,000
Average daily production per meter (Gallons) 502
Well pumped capacity (per 24 hour period) 294,000,000
Storage capacity (Gallons) 211,000,000
Water reclamation treatment capacity (Gallons)
Number of miles of lines
Water 2520
Sewer (wastewater) 1820
Wastewater Treated (millions gallons/day (MGD)) 55
Estimated infrastructure replacement costs (Billion $) 2.5 to 3.0

10
of large investment project proposals and must validate decisions to finance these choices using
Asset Management principles, such as a business case for a range of need, performance
requirements, and efficiency alternatives and the economics for the full cost of ownership.
Historically, the Capital Program annual spending level to repair, rehabilitate, and renew
assets has been about $30 million and the most recent Water and Water Reclamation Decade
Plan FY 2010-FY2019 is showing annual spending of approximately $48 million (Authority,
2009).
Infrastructure Assets Replacement Costs Total Units Cost/Unit
WATER SYSTEM
MASTER PLAN
WATERLINES
SMALL
WATERLINES
WELLS
PUMP/BOOSTER
STATIONS
STORAGE RESERVOIRS
SUBTOTAL
*ENR UPDATED 6-17-04
JUNE 2004 INVENTORY
SEWER SYSTEM
(WASTEWATER)
MASTER PLAN
SEWERLINES
SMALL SEWERLINES
LIFT STATIONS
ODOR CONTROL
STATIONS
TREATMENT PLANT
(w/SOIL AMENDMENT
FAC)
SUBTOTAL
NEW SURFACE WATER PLANT
& ANCILLARY FACILITIES
(2009 est.)
$355,783,204
$467,531,233
$164,831,655
$63,304,322
$147,495,612
$1,198,946,026
$215, 091,187
$531,059,153
$49,530,911
$1,310,359
$491,967,575
$1,288,959,185
$436,000,000*
*$500,000,000
estimated @
completion
3,481,331
LINEAR FEET
8,484,377
LINEAR FEET
89
EACH
33
EACH
49
EACH
1,724,425
LINEAR FEET
7,003,400
LINEAR FEET
31
EACH
11
EACH
76
MGD
48,200,000
ACRE/FEET
$102
$55
$1,852,041*
$1,918,313*
$3,010,115*
$125
$76
$1,597,771
$119,124
$6,473,258
$10,370
Table 2 - Authority Infrastructure Assets: Water & Sewer Inventory Replacement Cost (source: Authority)

11
Figure 2 is a diagram designed to present the framework and help identify the major
components of this paper. The blue boxes represent the interconnection between the effects of
drought, as contraction of water supply, and the conversion of the contracted water supply (total
reduction) now unavailable for sale by the Authority. As utility revenue decreases, the ability to
replace aging infrastructure decreases, represented by the red box. To determine the cost to
replace water pipe, the Authority first developed a spreadsheet model (See Appendix A) to
understand rehabilitation/ renewal costs. The model was also used to reduce the risk between the
infrastructure gap and funding requirements. Next, moving to the purple level boxes, the
combined effects from drought induced reduced supply, cash requirements to replace pipe are
inputted into a business case. The final components, green ovals, are three sustainable
management/policy sustainable solutions.
Figure 2- Scenarios/ Solutions

12
Nature, Scope and Objectives of this Research
This paper develops a robust drought management system with rationale to include the
worst case scenarios of 5 year, 10 year, and greater than 15 year drought durations. The
considerable fiscal impact of drought over time is then combined with the construction of Nessi-
curves for utility wide infrastructure assets to underscore the vulnerabilities and realities
presented by severe drought. The Nessi-curve graphically presents the funding requirements for
the Authority‟s aging water pipe.
Next, drought reserve projection calculations are analyzed and policy alternatives for
utility requirements are discussed in the context of the Authority‟s choice to return to pumping
ground water to avoid conflict between the local agricultural economy and environmental
pressures.
The Mid Region Council of Governments (MRCOG), Middle Rio Grande Regional
Water Plan 2000-2050 (MRCOG, 2001), references studies that demonstrate there is already a
great imbalance between the water supply and the demand in the region. Middle Rio Grande
consumers (comprised of Municipal, Industrial, Agricultural, Recreation and Riparian) share a
limited quantity of renewable surface water. In times of drought the net resulting consumptive
use may exceed the projected renewable supply. Extreme drought, for the region and reflected in
contracted water supply, has been recorded and reconstructed from tree ring research for
durations extending from about five years to over thirty years. These extreme conditions are
used to establish bounds for this study to analyze the potential effects of three severe drought
scenarios with durations extending 5 years, 10 years and over 15 years. When the 5 year, 10
year, and 15 year droughts might occur is unpredictable, however the certainty that they will
occur is accepted from the instrument record. The data provides an opportunity for prolonged

13
drought analysis and the opportunity to make recommendations to alleviate the potentially
devastating infrastructure related socio-economic effects of future droughts.
Nature
Water scarcity in the Authority service area (see Figure 3) is compounded by drought.
This analysis is intended to emphasize the need for the Authority to assess potential drought
impacts, develop contingency plans, and a robust response to plausible, extended drought
scenarios. Although, the scenarios established may not contain a precise value for water quantity,
they are within the bounds of credible historic occurrence.
The premise for extending the drought scenarios is supported in the following sections
with local and regional technical data such as the region‟s projected water budget (current, 2020
and 2060), historical precipitation/snow pack, river flow records, regional climate conditions and
climate models predicting significant changes for the greater region including the Colorado River
Basin and Upper Rio Grande watershed.
Scope
This paper sets the stage for the drought scenarios in the context of examining the loss of
drought reserve (aquifer and reservoirs), loss of surface flow, demand reduction, environmental
regulation as it relates to river conditions/flow, population growth (out years 2020 and 2060), as
well as loss of revenue/ increased capital cost to the Authority, and a warmer / drier climate as
predicted by Global Climate Modeling, concluding with a recommendation for a more forceful
Drought Management Plan for the Authority in order to maintain the utility‟s desired level of
service.

14
Figure 3- Water Authority Water Distribution System
Objectives of the Research
The objective of this research is to evaluate and analyze the economic impacts upon
Utility resources for three scenarios constructed from literature to simulate severe drought.
These scenarios reflect a drought of increasing duration and severity. Utility business risk
exposure has increased through unintended consequences of water conservation, namely

15
declining revenues from lower per capita unit sale of water and foregone revenue in the form of
rebates/incentives. Drought has a similar effect: when less is available to the users, less water
will be sold by the utility. The fiscal analysis and long term impact from shrinking revenue is
presented in revenue estimates. This financial vulnerability was achieved in part by deferred
maintenance, rehabilitation, and replacement of aging and critical infrastructure, and ultimately
the performance and level of utility service provided will be negatively impacted. With
conservation, the Utility has already experienced a drop in the revenue stream due to voluntary
and incentive-based conservation measures. Over 10 years of conservation implementation, the
Utility has reduced its usage by over 100 billion gallons of water (Authority, 2008). This is a
commendable achievement from a resource perspective. However, from a financial perspective
this represents a loss of revenue of approximately 13 million dollars from the Utility‟s operating
budgets. In times of severe drought, this shortfall will be compounded.
Revenue from customers is used to maintain the utility‟s critical infrastructure. The first
step to obtain a viable revenue figure for analysis is to calculate a projected water decrease and
therefore a revenue shortfall. Some of the shortfall may be made up with wastewater „reuse,‟
however „reuse‟ water is already accounted for by return flow credits to the Rio Grande. Return
flow is, “That amount of diverted water returned to the available water supply” (New Mexico
Administrative Code (NMAC, 2004)). In this case, it is ground water used by the Utility for
potable supply, which is treated and returned to the Rio Grande, to compensate for the aquifer
withdrawals. For the reclaimed water put back in the Rio Grande from the Southside Water
Reclamation Plant, water-rights credits have been approved for the portion of water originally
pumped from ABCWUA wells. In approving water rights permits for diversions of ground water,
the New Mexico Office of the State Engineer, NMOSE, has found that approximately 50% of the

16
water delivered to households and customers is discharged back into the wastewater collection
system and is the basis for the 50% Return Flow Credit to Authority.
This drought information and analysis related to shrinking available water supply, water
sale revenue decrease along with the estimated cost to sustain the Utility infrastructure allows for
the evaluation of future financial impact. The Utility may then use the snapshot of future
requirements from constructed Nessi-curves to strategically address operational, management,
financial and policy options to sustain the Utility‟s level of service.
The progression and data models in studies about the influence of climate change on
streamflows in the Colorado River Basin and Rio Grande Watersheds, which predict the amount
of water, should each be considered as having some range of value or accepted as having some
uncertainty in the final values. In addition, Nessi-curve values possess some of this same
uncertainty as they are averaged cost data from emergency on- call contracts, scheduled/actual
and indexed cost. Figure 4 is presented to graphically capture this uncertainty concept. As this
analyses moves further into the future, there is less and less certainty with each out year scenario,
represented by path line and end points A, B, C and D, and a decision point also may affect the
outcome of each scenario.
Figure 4- Multiple Scenario Water Planning/Cone of Uncertainty

17
The analysis points out a number of options available to make up this revenue shortfall
that may include deferred maintenance, having and/or forcing fund managers to substitute capital
resources, forcing a reduction in labor costs/ materials, reducing the level of service, reducing
debt, or debt refunding (refinancing of debt). However, the final recommendations focus on
preparation rather than traditional mitigation solution. The selected recommendations rely on
Authority Board price changes and safeguarded cash reserve protections related to markets
(scarcity of water/pricing) and customer rate schedules in what proves to be a very reasonable,
sustainable strategy sparing the utility from the consequences of significant water and revenue
shortages. Other consequences of diminished revenue, as the result of a drought, may be an
inability to meet future needs, increasing operating expenses, or impediments to meeting
regulatory requirements. Each of these options, Regulation and Rate Schedules, may be
considered separately, in conjunction with each other, or in total.
Background
The amount of water currently available for use by the populations in the Southwest and
the Authority is a combination of past conditions including reservoir storage collected from
regional watersheds, imported water from the Colorado River, and regional aquifer storage. The
ability to provide and deliver adequate water is a function of the combined land use sector
demands by: Urban, Agricultural, Industrial, Riparian, and Evapo-Transpiration (ET). Regional
population growth and population migration to the region continue to strain water supply. The
Intergovernmental Panel on Climate Change (IPCC) AR4- Fourth Assessment 2007 (IPCC,
2007), which assessed the scientific, technical and socio-economic information relevant for the
understanding of the risk of human-induced climate change, reports predict the Southwestern
United States with less snowpack, earlier runoff, higher annual temperature, less soil moisture

18
and increased variability in precipitation and stream flow. All of this indicates that Southwestern
reservoirs are likely to receive less water and not meet the growing demand. In the upcoming
years aquifers will continue to be drawn down and watersheds will be less likely to produce the
reliable and timely water supplies.
For the region encompassing the Authority‟s source supply, Gutzler et.al., report that the
impacts to the region are a microcosm of the climate impacts expressed by the IPCC. Gutzler
surmises, for the Middle Rio Grande and Southwestern NM that “warmer temperatures will lead
to higher rates of consumption, reduced snowpack, less and earlier spring runoff, more
evaporation from open water, and drier soil conditions.” Gutzler concludes with the caution that
predictions of precipitation trends carry more uncertainty, nonetheless, expects the climate to
become more variable. He also adds that, “The impacts of episodic droughts would be more
severe in a warmer climate, regardless of long-term trends.” Hurd et.al., (see Figure 5)
projections for a dry, middle and wet runoff compared against a baseline show a monthly shift
and lower summer flows in Rio Grande peak flow in the year 2080.
Figure 5- Rio Grande Flows, 2080 (projections); Dry, Middle and Wet Hydrographs

19
In addition, „Water Budgets‟ prepared by the Water Assembly, a local group of citizens
and water professionals, present estimated inflows and outflows to the region. The
representative „Water Budget” for the Middle Valley (Rio Grande/ Authority Service Area) relies
heavily on non-native water, that is either imported to the region via the San Juan/ Chama
diversion of the Colorado River, released from reservoir storage, and /or the „normal‟ rainfall/
precipitation in order to meet demand (Middle Rio Grande Water Assembly, 1999 and MRCOG,
2001). Any long term interruption, or change in these numbers will lessen the ability to meet
downstream Rio Grande Compact obligations that require delivery of water to Texas and
Mexico. Gaume attributes the New Mexico‟s Rio Grande Compact (Compact) cumulative
deficits of 500,000 AF to drought periods of the 1940‟s -1950‟s. Gaume further states that under
the Compact, New Mexico commits to pass a percentage on to stakeholders below Elephant
Butte, leaving 405,000 AF as the most Rio Grande water that can be used in the Middle Rio
Grande as well as tributary inflows between Otowi and Elephant Butte (Gaume, 1999).

20
Research Methods - Construction of the Severe Drought and Business
Case Development – Implications and Impacts of Drought and Aging
Infrastructure to Projected Utility Revenue Shortfall
Construction of Severe Drought
Five year Drought Scenario- based on the Historic Record
The 1895-1902, mid-1950‟s (see Figure 6), and 2000-2005 droughts of the Middle Rio
Grande were each considered as analogs for the 5 year severe drought scenario. The 1953-1957
period was selected as an appropriate representation of the 5 year drought even though the
severity of the drought was only the 4 year period 1953 – 1956 and then followed by a very wet
year in 1957. In order to obtain a full 5 year period, the river flow at Otowi Gauge, was
averaged and the mean was converted to an annual estimated range between 610,000 AF/ year to
620,000 AF/year. However, with reservoir storage and cooperative agency river management
this appears be enough water to meet estimated demand. Figure 6 provides and the annual river
flow collected for the past 65 years at the Otowi Gauge/Bridge on the Rio Grande northwest of
Santa Fe and East of Los Alamos.
Figure 6- Annual Streamflow, Otowi Bridge, NM, 1940-2005; source: Schmidt-Peterson, 2007
Otowi Index Supply
0
250
500
750
1,000
1,250
1,500
1,750
2,000
2,250
2,500
1940 1945 1950 1955 1960 1965 1970 1975 1980 1985 1990 1995 2000 2005
Year
Flow
(af x
1000
)

21
Ten year Severe Drought Scenario- The Tree Ring Record (TRR)
The ten year instrument record, 1997 - 2006 (see Figure 7), with the exception of a single
very wet year in 2006, would suffice as it closely approximates the doubling of the 5 year
drought, and very local conditions and river records. However, historical data as well as tree
ring paleo-record for late 15th
century also supports a more severe prolonged 10 year drought
scenario. This 10 year drought scenario represents significant deficits from the water that is
available from Colorado watersheds and New Mexico watersheds.
Figure 7-Annual Streamflow, Otowi Bridge, NM, 1997-2006/ Ten Year Drought Period; source: USGS, 2009
The ten year period in such a scenario might be likened to an extended La Nina, creating
dry conditions in the Western US. Further, for consistency with longer droughts and to observe
the compounding effects, the decreased water is now 22% to 30% less than the dry conditions
established by the most severe drought experienced in this century. Now the cumulative water
loss to the entire system begins to exceed the gains in storage and water stresses to the priority
system established by delivery agreements, increased population and by nature. Reservoir

22
storage is purposely established to address high and low water years and to smooth out delivery
to the water users/ customers. With a continued drought, the ability to manage the long term
delivery to its clientele/stakeholders is affected by lower and lower reservoir elevation levels.
Nonetheless, for this long term assessment water delivered to Otowi Gauge is 22 to 30 % less
than the normal reference year 1,100,000 AF (Daves, 1994).
Greater than 15 years – ‘the Perfect Drought’; Rearranged Severe Drought Scenario
(combination Global Climate Model/ TRR)
This scenario could easily be expanded to 38 years as that tree ring paleo-record supports
such extended drought for the period 1550- 1588. However for this paper, research by several
individuals is integrated into the termed rearranged severe drought scenario.
Current research by Niklas S. Cristensen, with the Land Surface Hydrology Research
Group, Civil and Environmental Engineering, University of Washington reflects the Colorado
River Basin (CRB) portion of the modeled prospective view of severe drought (resulting in
degraded stream system performance and reduced storage by 27% to 50%). In addition, warmer
winter temperatures projects peak flow runoff occurring earlier in the spring by nearly a month.
This current research uses the US DOE/ National Center for Atmospheric Research Parallel
Climate Model to assess the potential effects of climate change on the water supply for the CRB.
In Cristensen‟s study, three climate conditions modeled are „business as usual‟ (BAU), and
ensemble of three 105 year transient simulations global greenhouse emissions for „static 1995
concentrations and historic (1870- 2000) conditions.
The Grand Canyon Trust (GCT) sets up another format to evaluate Drought Scenarios for
the Colorado River based on historical records (1906- 2003) and deliveries to be made under the
apportionment of the Colorado River Compact (CRC), to each of the compact member states.

23
Annual flows at the time of the compact averaged about 18 Million Acre-Feet. The compact
allocated 15 MAF and later agreements called for an additional delivery of 1.5 MAF to Mexico.
However, in recent decades river production averaged between 13.5 and 15 MAF. Of significant
concern is in 2000- 2003 with the river‟s average annual flow at only 9.85 MAF and in 2002 the
river produced the 2nd
lowest since 1906, when the Bureau of Reclamation (BOR) began keeping
records, with a production around 6 MAF. In the GCT scenario, water available under various
flow scenarios for delivery from the upper basin to the lower basin uses four average flow
scenarios (GCT), A.) 16 MAF, B.) 13.5 MAF, C.) 10 MAF, and D.) 6 MAF. Each of these
flow scenarios is bounded by the CRC minimum obligations, which grants 8.25 MAF to
downstream lower basin users, in other words, the burden of the drought is upon the upper basin
states. Of importance to this analysis is New Mexico‟s 11.25 % compact corresponding
allocation for Colorado River flow for each of the four scenarios is: A.) 16 MAF is .84 MAF;
B.) 13.5 is .59 MAF, C.) 10 MAF is .19 MAF, and D.) 6 MAF is -.25 MAF (deficit).
University of Arizona‟s Laboratory of Tree Ring Research, utilizing paleo-tree ring data,
provides a look back at the Colorado River, near Lee‟s Ferry. The reconstructed records for the
past 2,200 years of precipitation and a 500 –year stream flow and graphs presenting the data
show severe droughts repeat every or every other century with several durations between 80-100
years and a reconstruction for the 2,000 year record for Northern New Mexico based on the tree
ring record shows that some droughts have lasted 200 years.
Young (1995) models multi-year Colorado River drought events with the risk for return
periods extending 22 years, 17-22 years, and 16 years for productions of 13.43 MAF, 10.47-
11.05 MAF and 9.57 MAF, respectively. The period for a severe drought – rearranged severe
drought, as described by Young, occurs between 2000 and 10,000 years, may appear extremely
24
rare or even unrealistic, however in the context of a water shortage it is certainly the most
interesting, as it is useful in discovering the vulnerabilities and reliabilities of the Colorado River
basin.
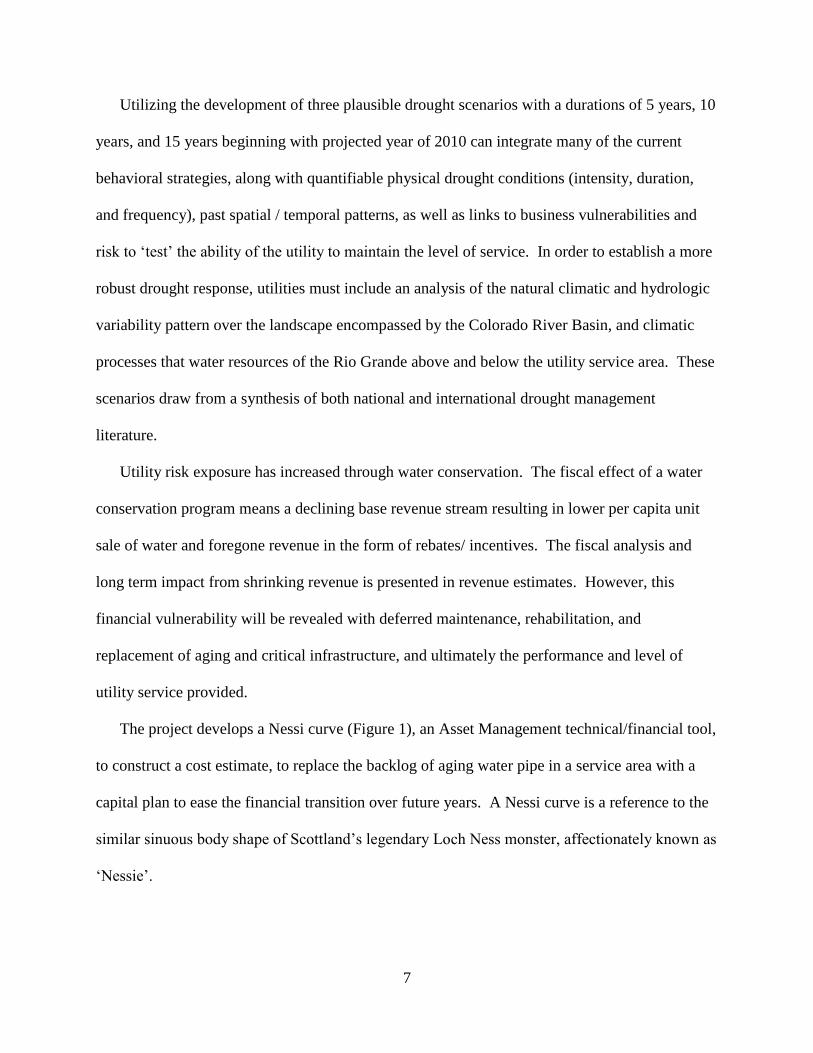
It is reasonable to assume a relative risk for a severe drought with an inflow into New
Mexico, under the conditions of a 15+ year drought with Colorado River Basin production
between the lowest annual production of 6 MAF and 10.5 MAF. Conservatively, this estimated
Colorado River flow represents approximately a 40% reduction from the allocation
authorizations set out in the CRC and consistent with global climate model runs performed by
Christensen and others, scenario assumptions established by the Grand Canyon Trust and „Tree-
Ring‟ studies. However, Meko, 2007, using tree-ring records, characterizes the most extreme
low-frequency feature of the new, covering A.D. 762-2005, is a hydrologic drought in the mid
1100‟s, for annual flows of the Colorado River at Lee Ferry. Meko further states this “drought is
characterized by a decrease of more than 15% in mean annual flow averaged over 25 years, and
by the absence of high annual flows over a longer period of about six decades.” Lewis, 2002, in
assessing paleo climate data for New Mexico‟s Middle Rio Grande indexed flow for the period
1947-1976 at 78% of the 1919-1998 average. With tree ring data pointing to -15% and- 22%
annual river deficits over 25 years and 29 years, respectively for the Colorado River and Rio
Grande. Stockton and Boggess, 1979, using temperature – precipitation relationships for
changes of +2C and -10% Precipitation resulted in a roughly 33% reduction in Lee Ferry Flow.
Rovelle and Waggoner, 1983, study for the Upper Colorado River Basin found the temperature-
precipitation relationship that the combination of a +2C and -10% precipitation resulted in a -
40% reduction in Lee Ferry Flow. However, the duration for such extremes might be conditions
that could be projected over a longer period of time, in the event we continue to see an increase

25
of temperature, but are only used to demonstrate the large uncertainty of future flow based on
current knowledge and ranges for supply are -30% to -40% over 2-7 years, however a drought of
approximately 25% reduction in the average annual flow over 15 years is an intermediate,
representative and plausible value for this analysis.
Sustained Drought Conditions
Table 3 presents the water supply effects of years 9-15 from the 15 year drought scenario.
The demand is projected by aggregated land use categories and adjusted for population
projection increases and water conservation projections.
The table shows three critical things that happen while experiencing a decade of drought.
First, the water the water stored from plentiful years (reservoir storage) is discharged/ applied in
water- deficit years to meet land use (urban, agricultural, riparian and upland) demand. Next, the
rate of replenishment is negative, and storage levels drop. Lastly, the Authority must return to
groundwater well production to augment the diminished supply. The BOR estimates land use
demand at 382,000 AF, for the year 2020 and 369,740 AF for the year 1993 (Brown, 1996).
However, lacking the intermediate values for years of interest 2005-2020, the higher number,
382,000 AF, was chosen to represent the period 2005-2020 for the aggregated total including
Bernalillo County, Sandoval County, Valencia County and Socorro County (4 County area)
which takes in the Authority service area. Most of the service area is contained in Bernalillo
County. Under drought conditions this supply drops to an annual average of 282,000 AF from
the modeled 15 year drought scenario, leaving an annual 100,000 AF water supply shortage.
Only years 9-15 are shown here and for the full table see Appendix C.

26
15 yr drought ( AF x 000's) Year 9 Year 10 Year 11 Year 12 Year 13 Year 14 Year 15
15 yr Total (AF)
2010 All Demand/ Land-Use (AF) 382 382 382 382 382 382 382 2,674
Supply during drought conditions (AF) 282 282 282 282 282 282 282 1,974
Shortage (AF x 000's) 100 100 100 100 100 100 100 700
15 yr Total
Split Shortage (50% each of 100 AF x 000's) year 9 year 10 year 11 year 12 year 13 year 14 year 15
(AF x 000's)
Reservoir Storage 252 102 dry dry dry dry dry
50-100% of
shortage 100 100
Ground Water year 9 year 10 year 11 year 12 year 13 year 14 year 15
GW Aquifer
(AF x 000's) 22,852 22,752 22,652 22,552 22,452 22,352 22,252
50% of shortage
+ reservoir
deficit (AF x
000's) 100 100 100 100 100 100 100 700000
22,752 22,652 22,552 22,452 22,352 22,252 22,152
Table 3- 15 Year Drought; Estimated Supply contraction Year 9- Year 15

27
The five year drought is certainly severe, and a 22% to 25% reduction in flow is
historically based, it is manageable, as the utility is able to compensate for river flow reduction
by aquifer pumping and water in reservoir storage. Certainly, the ten year duration begins to
strain the supply, again, it is manageable, in part due to interannual variability that give rise to
peak flow conditions that replenish the reservoirs and related conditions. The most interesting of
the three scenarios is the drought in excess of 15 years, even though the average annual flows
may hover at a lower percentage rates, it still proves to be the most interesting as its cumulative
impact on reduction to the water supply is the most severe. The case brought forward now in the
discussion is hypothetical drought with duration of 15 years and a generally consistent reduction
to the annual average water supply around 25%.
If the drought is prolonged, similar to conditions experienced in the 1950‟s and assuming
that reservoir release is used to compensate for 50% of the water demand shortage, and 50% of
the water supply shortage comes at the expense of each land use category. With the drawdown
due to meet continued demand during drought conditions and evaporation the reservoir storage
would be dangerously depleted by the 8th
year and the performance severely curtailed by the 10th
year. It is easy to roughly estimate two volume estimates corresponding to the first eight year
period and years 9 through 15 to represent the total loss by land use category. Continued
demand would outpace supply and reservoir storage would essentially be running at a 100,000
AF annual deficit for the remaining length of the drought. It is presumed that the Authority
would return to pumping groundwater out of more than 90 wells developed in the Santa Fe
Group within the Albuquerque basin aquifer to offset the drought losses. Since the basin and
aquifer are hydrologically connected, pumping will not only lower the water table, it will also
cause river water to infiltrate, thus recharging the aquifer. In fact, the productive zone is

28
smaller than originally estimated and the net effects of pumping will result in subsidence and
higher operating costs such as energy and infrastructure decay. The losses of water to the urban
land use category have been proportionately distributed over these two periods of time and
converted with the unit volume price of lost sales for the period 2010. Years 1 through 8 have a
water reduction of 400,000 AF, resulting from analogous, paleo droughts, however managed
reservoirs, return to aquifer pumping, under a safe yield, and contribution from reserves to meet
demand. For years 9 through 15, reservoirs, practically speaking are depleted, and the aquifer
has reached its safe yield. Consequently, with a 15 year drought, the region will experience
annual water deficits of 100,000 AF / year, or cumulatively, 700,000 AF for the last seven years
of the drought.
In the year 2005, the ratio of urban land water use (135,000 AF) to all categories of land
use (382,000 AF) for the four county area encompassing Bernalillo, Sandoval, Valencia and
Socorro is approximately 35% (Brown, 1996) and used to represent urban / municipal use. To
calculate the contracted annual supply, the proportionate coefficient for urban use is applied to
the available supply under drought the equation, which is 100,000 AF x 0.35 = 35,000 AF.
For the purpose of determining the revenue loss, it does not matter whether the supply
reduction is attributed to conservation, drought, and/or climate change. The supply reduction is
substantial and from the scenarios and the water deficit compounds in its impact. Converting
this four county contracted supply available is as follows:
35,000 AF per year x 326,000 Gallons/ AF= 11,410,000,000 Gallons/ yr.
Using the Utility commodity charge for water which is approximately $1.41/unit , a constant,
and where one unit equals 748 gallons, the calculated cost is derived by:

29
11,410,000,000 Gallons/year X 1 unit /748 gallons x $1.41/ unit =152,544,010 units x $1.41/ unit
= $21,508,155/yr.
This estimate was proportionately scaled down to exclude unincorporated/ non-service
2006 population for the Authority service area to come up with an Authority service area with a
population of 530,000 or about 86% of the population of Bernalillo County. The 2006 Four
County area population is roughly 817, 500. The total 4 county population, and represented by
the total water losses, approximated by the 35,000 AF minus the proportionate share attributed to
the Authority service area roughly 65% which converts to 22,750 AF or 7,416,500,000
Gallons/yr. The Authority‟s commodity charge estimate is:
7,416,500,000 Gallons x 1 unit/748 Gallons x $1.41/ unit = $13,980,300/yr.
This value is now used to demonstrate the business case impact of the contracted water supply.

30
Business Case Development – Implications and Impacts of Drought and Aging Infrastructure to Projected Utility Revenue Shortfall
With source water reductions either through conservation efforts or drought conditions,
the impact response on the utility is strikingly similar. With conservation comes the paradox.
Conservation saves water for future use that allows customers and the Authority to move towards
a sustainable future water supply, however, it also reduces utility revenue. This reduction occurs
because water revenues are commodity based, i.e. based on water sales to customers – less water
sold equals less revenue to the agency; significant conservation means significant revenue loss
unless user fees are increased. Similarly, reaction to climate change that may result in less
surface water entering the supply area (watershed) and/or common drought effects will force the
Authority to return to reliance on groundwater withdrawal from the existing well fields.
Moderate to long term drought or climate induced flow reductions, puts the utility on a path
which impacts both sustainability factors and revenue. When the system reaches a critical
withdrawal, customers will be asked or required to curtail water use. The reduced sale of water,
with respect to drought and conservation, leaves the Authority with less water revenue. This
reduction in Authority revenue is compounded by the length and severity of the drought and/or
drier climate, with reduced surface flows. Currently, no significant „fee‟ is recovered to offset
this loss, and it should be noted that the „conservation‟ charge on the Utility water bill is not
related to Authority (customer) conservation efforts and would be more correctly named State -
mandated water testing fee.

31
Current Drought Management Strategy (2003)-Voluntary/Mandatory
Conservation/Rationing
The City of Albuquerque (COA), Public Works Department (PWD), prepared the Drought
Management Strategy (February 2003), as directed under legislation, City Council Bill Number
R-137, Enactment Number 4-2001. This mandated called for the PWD to first prepare three
drafts and then through a citizen/ government task force develop the strategy and present it to
City Council for approval. The task force developed a four stage drought warning system and
enforcement system comprised of the following drought response measures to achieve target
demand reductions (COA, 2001):
Drought Advisory: 10,000 acre-feet/year; equivalent to 9 % of current production
(voluntary conservation)
Drought Warning - Stage I: 20,000 acre-feet/ year; equivalent to 17% of current
production (Mandatory Conservation)
Drought Warning - Stage II: 30,000 acre-feet/year; equivalent to 26% of current
production (Mandatory Conservation)
Drought Warning - Stage III: 40,000 acre-feet for one year, or 30,000 acre-feet;;/year for
more than one year; equivalent to 26% of current production. (Water Rationing)
The Drought Warning –Stage III level of 40,000 acre-ft/ year has a predicted frequency of
occurring in any given year of 2%. The document states this amount of excess demand is
expected to occur in consecutive years about once every 50 years. Some fee and surcharge
assessments are associated with Drought Emergency – Stage III; water rationing would be used
to alter economic behavior to achieve this demand reduction. Revenues may be generated from

32
some ratepayers/ customers paying a „Triple Surcharge‟ or, “Doubling the water waste fees‟
(COA, 2001), however, would have little financial impact. In fact, the data from this demand
reduction option supports the effect of drought impact on sales and corresponding revenue
shortfalls as mandatory water rationing/ curtailment would exceed 26% or 40,000 acre/ft /year.
In essence, this four stage drought response is not focused on the financial concerns and revenue
shortfall it is intended, primarily, to achieve the demand reduction appropriate for the amount of
supply available. The existing Drought Management Strategy does not discuss what will happen
in the event of a drought beyond immediate attempts to address the water shortage.
The immediate financial consequence of the long term severe drought conditions is reduced
annual revenue of approximately $14 million a year. Authority management will be faced with a
shortfall, under current drought conditions, to pay expenses or related bond debt service. Adding
in the conservation losses, could add another $1 million/year. In general, the customary
administrative response to reduced revenue includes: a cutback in activity (reduced customer
service), labor reductions, defer capital project work to a future time, operation changes or
increase revenue, such as rate increases to customers.
This paper now projects the revenue lost/shortfall by modeling the costs to repair/replace/
renew pipe (infrastructure), in order to develop policy options such as a rate increase or decrease
in the level of service provided to customers.
To evaluate the impact on level of service provided by the Authority with respect to
infrastructure and the capital spending necessary to sustain the utility, the study was limited to
horizontal assets or pipe in the distribution system. The data utilized in the model was retrieved
from the Authority‟s GIS database and integrated into a customized model.

33
Model Development---Integrating GIS Produced Pipeline Analysis into an Economic
Rehabilitation Model
An essential part of our Asset Management planning is a pipeline rehabilitation program.
The Water Engineering and Planning (WEP) Division has been working on creating decision
support tools to help with the long term renewal and replacement of aging infrastructure, and in
particular, underground pipe. This effort has led to the development of a model aimed to
estimate and graphically represent funding required to meet pipeline rehabilitation. The model
inputs are horizontal assets (pipe) and their attributes stored in the GIS database, as well as, Unit
Replacement Costs (estimates) and Asset Economic Life Expectancy by Material Type. The
management approach utilized to address this aspect related to the revenue shortfall is Asset
Management and a Nessi-curve model that has been customized and applied to the asset category
of pipes (ABCWUA, 2006).
The model allows the investigator to observe historical patterns of past expansions to the
collection and distribution system by providing numerical results of interactions between certain
variables. Currently, the utility industry is also working on new analysis presentations such as
„dashboards‟, „sensitivity dials‟, and dynamic graphs. A new program developed by the
Environmental Finance Center, Boise State University (EFC-BSU)is called “Financial
Dashboard” (EFC-BSU, 2008) which gives utilities a view of the current and future financial
status of their system using asset management and financial planning tools. Another EFC-BSU
software program called “Rate Checkup” has been designed to do rate-setting and a three year
financial planning and budgeting for small utilities. EPA Officials and State Agencies got a
preview of these new tools a Region 6 through 10 Capacity Development Workshop held in
Albuquerque on November 5, 2008.

34
From the GIS database, water distribution pipeline segments were extracted, by length,
size, material pipe type, and installation date for the entire system. These variables were then
placed in Excel spreadsheet arrays. Simply stated, the data in the arrays were then inputted into
replacement cost equations.
Certain assumptions were made to represent the asset condition, and more specifically the
remaining useful life, for each pipe type based on experience and industry standards. For
example, steel water pipe that was installed under normal field conditions is assumed to last for
up to 50 years, and if older, would have deteriorated to the point of replacement.
The data is extracted from a partial model run (<1931 -1935) and is presented in a filtered
form only showing attributes for 6-inch pipe (diameter), install date (year), pipe age, steel
(material type), pipe length (feet), and the summation of pipe segment (feet) by age (see Table
4). This attribute data begins with 6-inch steel pipe segments having no identified install date
(presumed to be before we have accurate records) followed by the years 1931 – 1935. However,
the category showing “Cumulative Replacement Value” (see Table 4) in the partial table reflects
the total value from the complete table for 6-inch diameter steel pipe found in Appendix A.
pipe type 2 STL (Steel)
pipe size 6
Evaluation yr= 2005
Life cycle yrs= 35
Replaced Pipe Length = 103,839
Unit Replacement Cost = $ 75.00
Cumulative Replacement Value = $ 7,787,925.00
Pipeline Inventory Data
Length Pipe Replace
Type Date New Material Type Diameter Size
(inches) 450,975 Age 103,839
(Truncate) 2 1931 STEEL 12 1259 74 0
2 1932 STEEL 6 77 73 77
2 1934 STEEL 6 2294 71 2294
2 1935 STEEL 6 85 70 0
2 1935 STEEL 6 6569 70 6569
Table 4 -Cost to Replace Aging Infrastructure (sample model run data for 6-inch steel pipe)

35
Next is a portion of the data contained in the “look up” tables (see Table 5) showing cost
per diameter form 4 inches to 24 inches and per foot to replace the pipe by the material type,
Diameter (inches)
Diameter (inches)
Diameter (inches)
Diameter (inches)
Diameter (inches)
Diameter (inches)
Diameter (inches)
Diameter (inches)
Diameter (inches)
Diameter (inches)
0
Material Type
(abbrev.) 4 6 8 10 12 15 16 18 21 24
1 RCP $0.00 $0.00 $80.00 $90.00 $94.00 $100.00 $110.00 $110.00 $116.00 $124.00
2 STL $72.00 $75.00 $80.00 $84.00 $88.00 $92.00 $108.00 $108.00 $112.00 $124.00
3 AC $0.00 $75.00 $80.00 $84.00 $88.00 $92.00 $106.00 $106.00 $112.00 $124.00
4 CIP $74.00 $76.00 $82.00 $88.00 $92.00 $98.00 $112.00 $112.00 $116.00 $126.00
5 DIP $74.00 $76.00 $82.00 $88.00 $92.00 $98.00 $112.00 $112.00 $116.00 $126.00
6 PVC $70.00 $74.00 $78.00 $84.00 $88.00 $92.00 $106.00 $106.00 $112.00 $122.00
7 CCYL $0.00 $80.00 $80.00 $90.00 $94.00 $100.00 $110.00 $110.00 $116.00 $124.00
8 CMP $74.00 $76.00 $82.00 $88.00 $92.00 $98.00 $112.00 $112.00 $116.00 $126.00
9 GSP $74.00 $76.00 $82.00 $88.00 $92.00 $98.00 $112.00 $112.00 $116.00 $126.00
10 LWS $74.00 $76.00 $82.00 $88.00 $92.00 $98.00 $112.00 $112.00 $116.00 $126.00
11 CPRLN $74.00 $76.00 $82.00 $88.00 $92.00 $98.00 $112.00 $112.00 $116.00 $126.00
Table 5- Look Up Table for Pipe by Diameter Size (x-axis) & Material Type (y-axis)
Table 6 presents the life cycle, time in number of years, the material is expected to
perform to its designed purpose. The life cycle value is used to subtract from the installation
date to calculate the remaining life. The example is to formulate a replacement plan totaled
through the next 15 years. Each same year segment is totaled and multiplied by the cost
corresponding to the diameter of pipe.
Life Cycle
Type No. Pipe Material Life Cycle- Years
1 RCP Concrete or RCP 35
2 STL Steel Pipe or STL 35
3 AC Asbestos Cement or AC 40
4 CI Cast Iron Pipe or CI 50
5 DIP Ductile Iron Pipe or DIP 60
6 PVC Polyvinyl Chloride or PVC 75
7 CCYL Concrete Cylinder 40
8 CMP Corrugated Metal Pipe 35
9 GSP Galvanized Steel Pipe 35
10 LWS Linear Wrapped Steel 35
11 CPRLN Copper Line 35
Table 6- Look Up Table for Life Cycle: Material Type & Life Cycle

36
Figure 8 presents the current in-ground, 6-inch diameter steel pipe segment length in a
time series, which represents a 50+year history from 2005 back to the 1930‟s when the pipe was
first installed. Of note is the amount of 6-inch steel pipe installed in the 1950‟s and 1960‟s.
Figure 8- Total Length of 6-inch Steel Pipe by Years in Ground, <1932-1970; source: Authority, 2005
Figure 9 presents the cost, by year, estimated to replace deteriorated 6-inch steel water
pipe. To calculate the cost to replace deteriorated pipe, the pipe segment length is multiplied by
the corresponding 6-inch steel pipe cost ($75/foot) found in the model‟s look-up tables (Life
Cycle).

37
Figure 9-Backlog Replacement Costs for 6-inch Steel Pipe, 1932-1970; source: Authority, 2005
Figure 10, is a 15 year replacement plan, for 2005 through 2020, assuming that all 6-inch
diameter steel pipe that has been in the ground more than 35 years is fully consumed and/or
deteriorated to the point of replacement. The backlog cost to replace all pipe of greater age than
the 35 year expected pipe life-cycle, 1931 through the year 2005 (the last year of full data), is
approximately $7 million and approximately $600 thousand for pipe that will be consumed in
each subsequent year until all pipe is replaced. The complete set of the model‟s tables can be
found in Appendix A, and the cumulative sum of each year through the life cycle of every
material type.

38
Figure 10- Fifteen Year Plan...Backlog Replacement Costs for 6-inch Steel Pipe, 2005-2020
In the following section, the data and model runs, extracted from Appendix A, are
graphically presented by 'stacking' the graphs/curves for each and every material pipe type, into
one graph, a view of total future replacement costs of these horizontal assets can be generated by
using the complete GIS Data base and presented in the same model graphics.
Infrastructure Planning with Nessi-curve
The Nessi-curve presented in this analysis for 6-inch steel pipe represents the
deteriorating infrastructure for just one pipe type (steel) and size (diameter in inches). However,
stacked Nessi-curves can also be employed to combine the total estimated pipe rehabilitation and
replacement requirements for all water pipe. Planning for these requirements is documented and
budgeted in the Authority‟s 2 year Capital Improvement Projects and the Decade Plan. In

39
summary, initial model runs demonstrate the need to continually replace deteriorated pipe
installed prior to the 1960's and 1970's. Figure 11 is a modified stacked Nessi-curve. The curve,
for our purposes, has been modified to show the total pipe replacement backlog, accumulated
replacement cost, because much of authority‟s water pipe infrastructure has already exceeded its
life cycle. Consequently, this customization of the curve alters the regular echo shape especially
for the replacement backlog. The estimated replacement backlog is the $120 million peak at the
year 2005. Future replacement needs approaching $900 million are shown in years 2006-2020.
The rehabilitation cost is enormous to keep up which will reach $1 billion over through the year
2020 (see Figure 8). The model is intended to both examine the backlog, consumed pipe, and
pipe from 2005 forward. For this reason the model, reflects the methodology and calculates all
pipe consumed before 2005 and then is reset to the zero, 2005, then future cash requirements are
calculated 2005 forward. Another low point in the graph around years 2013 and 2014 reflects
the life cycle of the material type and installation dates as well as a 15 year replacement plan.
Figure 11- Stacked Nessi-Curves for all Material Pipe Types over 15 Years, 2005-2020

40
Cash Requirements for the Future
To determine how much money the utility will need, the methodology utilized
generalized predictive models or Nessi-curves, incorporating consumption of existing assets
(pipelines), asset renewal needs and cash requirements. These were compiled into a stacked
graph estimating a number of relevant cost categories.
At this point, each infrastructure category or program can be reviewed to determine the
possible financial options, such as: reduce cost (if necessary) by reducing the level of service,
debt/ future debt comparison, dispose of under-utilized and under-performing assets, manage
demand for service (pricing, regulation), alter maintenance or operations, increase other income
sources (grant funds), accept higher residual risk, rationalize/ prioritize project work in order of
risk.
Figure 12, presents financial projections for the cumulative water pipe replacement costs
and the projected dollar equivalent to a drought induced 25% reduction in water supply as
discussed in previous sections above. The cumulative revenue effects (deficit) of a 15 year
drought estimated at over $100 million are plotted against the $1 billion projected cash flow
needed for pipe replacement. The combined effect is significant. Even if infrastructure is
maintained well and greatly exceeds the expected life the replacement costs are large the revenue
deficits brought about by the projected drought and mitigation and planning measures beyond
those now in place are needed.

41
Figure 12-Cumulative Water Pipe Replacement Costs vs. Drought Revenue Deficit, 2005-2020

42
Critical Policy Issues and Recommendations
So much more is possible, with respect to a long term view, with Nessi-curves, as is the
case here, with the potential drought revenue deficits, because future financial need can be
measured against other factors/circumstances. This research strongly suggests the need for the
Authority to prepare for the financial effects and impacts from a prolonged drought and its
ability to maintain sustainable asset infrastructure of the utility. In the event of a 25% shortfall
of water availability through its ownership share of water rights, it would be necessary to
consider both the current option to conserve more water and to resort to „Stage Four‟- a regulated
level of water use by all customers. This may be all that is needed to supply the most basic need-
drinking water for customers but little else for outside use and growth. The $110 million
shortfall related to the 15 year drought unless made up in some form would be devastating to the
operations of the Authority.
Perhaps, the easiest place to see the effect of this revenue drop is in the current annual
funding level of Capital Improvement Program varies between $30 and $50 million a year. With
a reduction in revenue, much of the required work would be deferred and much of the
infrastructure would fail prior to replacement. Critical infrastructure, if it failed, could cause
significant consequences, such as 6-inch inch steel pipe, which is needed for fire protection and
also customer water delivery. Generally, replacing or repairing critical infrastructure after it has
failed is more costly.
In addition, a very uncertain future is created due to spiraling costs for the Authority, as
other infrastructure continues to be strained and moves toward a condition of failure. The cost to
repair failed infrastructure is often higher than intervening before it wears out. Intervention at

43
the optimal point in time can substantially lower the full cost of ownership of assets and would
be a normal response if adequate funding is available.
New water rights are continually being purchased or leased by the Authority from sellers
in the area, however, this option also becomes more difficult as it is expected that the cost of
water rises in response to demand. But in reality, little water has been purchased over the past 20
years and it appears that water transfers are becoming more difficult as water concerns grow.
Water purchases from other sectors, such as agriculture, will drive demand further, and cost will
increase. It is already established that the transfer to urban use from agricultural use has not been
favorably accepted from certain segments of the valley population such as farmers,
environmental groups, and Native Americans. It is unclear as to the impact the Authority would
have if it attempts to make up water shortfall by major new purchases in the region, and it will
have to deal with the issue of less money for acquisition. Adverse impact on agricultural
production in the region and ecological imbalance has been cited by Water Assembly Workshops
and Surveys. With dwindling revenue and cash reserves, it does not appear feasible to make up
the shortfall with water purchases and leases even if water was available from other sectors. The
cost to purchase a perfected water right (one acre-foot of water) varies from $7,000 to $25,000
per acre-foot. Consequently, the annual cost to fully make up the 23,000 AF drought loss would
be about $230 million using a conservative price of $10,000 / AF.
Strategies to utilize wastewater and low quality industrial reuse water are already
implemented and there are plans to fully expand to capture this category of water. It is difficult
to calculate any of the net gains in order to compensate for drought as much of this water is
already credited to the water system through „return flow credits‟ when the treated wastewater is
discharged to the river.
44
What are the options? To prepare / plan for impact due to drought
Steve Reynolds, former NM State Engineer is often quoted for his axiom that „water runs
uphill to money.‟ The truth and simplicity in his words are that much can be done to overcome
the natural, economic, and financial obstacles to obtain legal rights to water with a „fat wallet‟.
This statement also challenges the concept that water should be analyzed as though it is a finite
resource, but rather suggests the importance of analysis to place the economy of the area/cost of
water in its relative importance to water supply and concludes that water suitable for any purpose
can be obtained (renewable supplies) and is only a function of cost. The premise that water can
always be obtained and this is only a function of the person‟s ability to pay for water should
seriously be considered as a desirable management and a policy option to combat drought. The
other factor that should also be remembered, in the cultural context, for this region‟s water
economy, is that it is dominated by a utility which operates as a monopoly and not in a „free
market‟ setting.
Secure and Sustainable Water Supply and Water Resource Infrastructure in an
Uncertain Future
The San Juan /Chama project in conjunction with ground water wells in the Albuquerque
Basin in the short term may be adequate to provide water to meet the projected demand. For a
short term drought event with the weak financial outlook presented, herein, limit the real options
available to respond to a contracted water supply. This situation only adds to the urgency to
prepare in advance for this adverse situation. Perhaps for 5 to 7 years following the
implementation of San Juan Chama water treatment plant and the return to ground water
exploitation, the impact of drought will become manageable. However, greater uncertainty
hinges when the severity of the compound effect of a release of water from storage reservoirs,

45
ground water withdrawal from the aquifer is strained beyond replenishment, land subsidence
impacts development and conservation reaches saturation effect due to prolonged drought.
Management Options-Asset Management and Legislation (Rate Structure
Changes)
The response options are combinations of aggressive and less aggressive options. The
main categories that require our attention are management, specifically, asset management,
financial and policy, followed by technical/operational elements. This list of options examined
for this paper is meant to be exclusive of programs and strategies already implemented and in
progress by the Authority such as Conservation and Aquifer Storage and Recovery. Efforts that
may include related but less developed programs, such as Water Banking, are incorporated to the
future options to respond to drought.
Costs and Rate Implications
The drought and pipe replacement scenarios outlined above imply a total cost of about
$110 million and $1 billion, respectively. Practically speaking, project phasing and the time
required to gain public support and political will mean that not all capital and funding needs will
or can be obtained immediately. This also makes it possible to gradually approach or phase in
rate increases. The rate increases proposed to make up for the drought deficits are minimal when
planned and applied across the entire customer base. This proposal calls for increasing rates by
approximately by $5.30/month for each of the 190,000 customers, over a period of ten years .
This is equivalent of increasing the typical monthly charge to that of two gallons of gasoline for
your car each month. Even with this new monthly charge the utility rates will remain
competitive with utilities in the neighboring areas and region. To meet the need to replace aging
infrastructure is discussed following sections.
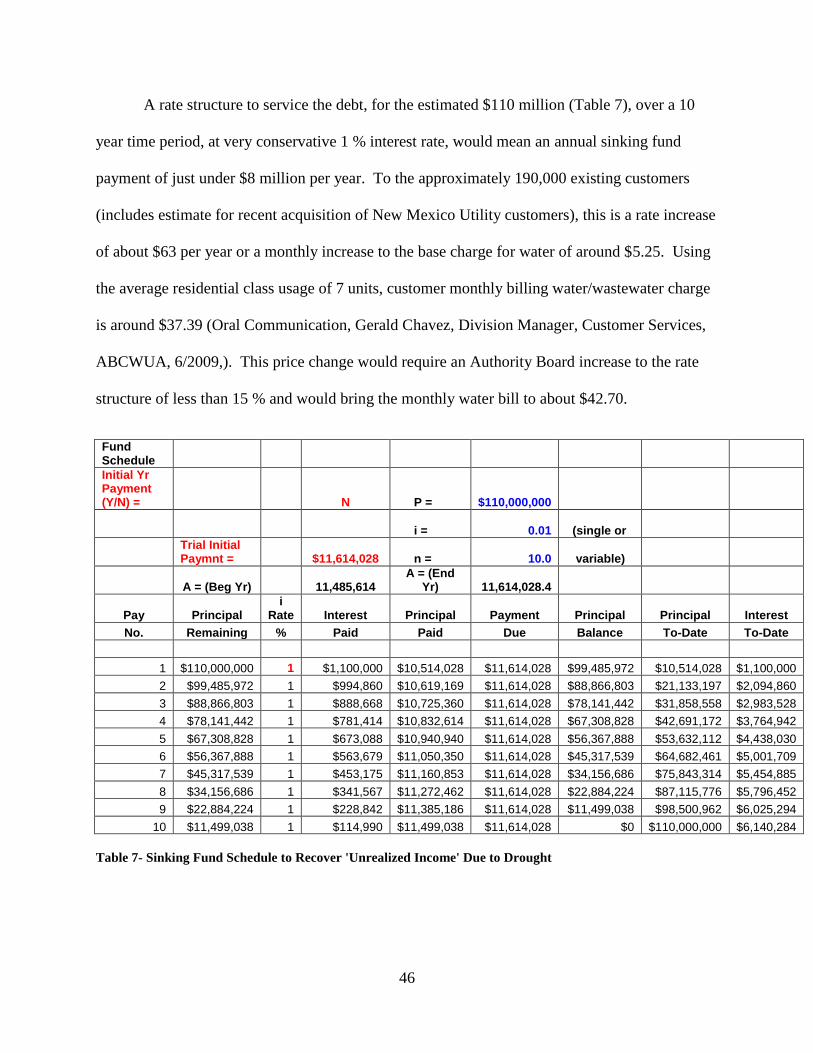
46
A rate structure to service the debt, for the estimated $110 million (Table 7), over a 10
year time period, at very conservative 1 % interest rate, would mean an annual sinking fund
payment of just under $8 million per year. To the approximately 190,000 existing customers
(includes estimate for recent acquisition of New Mexico Utility customers), this is a rate increase
of about $63 per year or a monthly increase to the base charge for water of around $5.25. Using
the average residential class usage of 7 units, customer monthly billing water/wastewater charge
is around $37.39 (Oral Communication, Gerald Chavez, Division Manager, Customer Services,
ABCWUA, 6/2009,). This price change would require an Authority Board increase to the rate
structure of less than 15 % and would bring the monthly water bill to about $42.70.
Fund Schedule
Initial Yr Payment (Y/N) = N P = $110,000,000
i = 0.01 (single or
Trial Initial Paymnt = $11,614,028 n = 10.0 variable)
A = (Beg Yr) 11,485,614 A = (End
Yr) 11,614,028.4
Pay Principal i
Rate Interest Principal Payment Principal Principal Interest
No. Remaining % Paid Paid Due Balance To-Date To-Date
1 $110,000,000 1 $1,100,000 $10,514,028 $11,614,028 $99,485,972 $10,514,028 $1,100,000
2 $99,485,972 1 $994,860 $10,619,169 $11,614,028 $88,866,803 $21,133,197 $2,094,860
3 $88,866,803 1 $888,668 $10,725,360 $11,614,028 $78,141,442 $31,858,558 $2,983,528
4 $78,141,442 1 $781,414 $10,832,614 $11,614,028 $67,308,828 $42,691,172 $3,764,942
5 $67,308,828 1 $673,088 $10,940,940 $11,614,028 $56,367,888 $53,632,112 $4,438,030
6 $56,367,888 1 $563,679 $11,050,350 $11,614,028 $45,317,539 $64,682,461 $5,001,709
7 $45,317,539 1 $453,175 $11,160,853 $11,614,028 $34,156,686 $75,843,314 $5,454,885
8 $34,156,686 1 $341,567 $11,272,462 $11,614,028 $22,884,224 $87,115,776 $5,796,452
9 $22,884,224 1 $228,842 $11,385,186 $11,614,028 $11,499,038 $98,500,962 $6,025,294
10 $11,499,038 1 $114,990 $11,499,038 $11,614,028 $0 $110,000,000 $6,140,284
Table 7- Sinking Fund Schedule to Recover 'Unrealized Income' Due to Drought

47
With cost to replace aging water pipe approaching $1 billion, the Authority is relying on
implementing to Asset Management best practices to lower the cost of ownership and capital
replacement in hopes of achieving 30-35 % savings. In addition, past operations have also used
various finance strategies to fund capital replacement programs such as reducing the debt
service, grants and loans as well as utility expansion charges/fees (UEC‟s) and general revenue.
The annual current capital spending level is around $48 million, but generally annual program
spending has averaged about $30 million for all capital including water, wastewater, IT and
customer services. For the Decade Plan (ABCWUA, 2009) the total for the next ten years is
around $480 million. The plan has programmed about $10 million a year to replace water lines
or about 10-20% of the backlog. It appears that a more detailed study is needed to identify all
funding sources in order to keep pace with the rate of decay of water pipe. At first glance, the
total programmed capital budget would meet less than 50% of the future cash requirement for
even water pipe. However, it is unclear as to any general revenue forecasted capital shortfall and
ability to acquire capital funds due to the number of funding sources available to the ABCWUA
Board and their authority to control spending levels. Asset Management is one of primary steps
the Authority is taking to address this problem. The other is to raise the annual level of capital
spending to pay for the backlog of aging pipe, which is the end result from the years of
underinvestment.
At the direction of the Authority, the Engineering and Planning Section, developed Goal
4- Objective 1, in accordance with the 2005 Business Objectives for the Comprehensive
Development Plan (see Appendix B) which was adopted by the ABCWUA. The plan, in part, is
set out below. The development of the plan is in various stages of implementation (and
appended to this report). The main recommendations for Asset Management:

48
o Manage Critical Assets for sustainability – Construct and Expand Nessi-Curves
for all critical Assets to predict financial needs minus shortfall needs.
o Identify Critical Assets to provided the desired level of service
o Collect data and evaluate remaining life of desired assets
o Determine Customer desired „level of service‟ and willingness to pay for services
o Evaluate and determine the Risk of the critical assets expressed as the intersection
of Probability of Failure and Consequence of Failure
o Prepare a strategy to finance the critical assets required to deliver
water/sanitary/wastewater/ reuse services. This is the culmination of Nessi –
curves developed for the critical assets stacked on the time series graphs for the
long term.
Recommendations
The region‟s population has increased which creates increased water demand. Historical
and tree- ring findings based reconstructions foreshadow more severe droughts and climate
models predict increased temperature. Conservation practices will extend water supplies, but
with limitation and paradoxical fiscal consequences, and the Authority‟s infrastructure is in need
of costly replacement. This paper has demonstrated that under severe drought conditions and the
aging infrastructure suggests considerable fiscal constraints and vulnerability - ranging from just
over $1 billion, to keep pace with critical infrastructure replacement costs, and another estimated
$110 million to cope with severe drought in coming years.
49
The Authority has established the Capital Planning process to address the annual
infrastructure need. However, with population increases, and the rate of decay of this
infrastructure, it remains a substantial challenge to keep up with the fiscal needs. Adding the
unpredictability, yet certainty, of a drought, with substantial cost implications appears to require
not only stronger commitment to fiscal capital planning, but additions to cash reserves in order to
withstand the impact of a significant contraction of the water supply.
As outlined here, it is evident that several activities in accordance with the Authority‟s
adopted Water Resources Strategy (Mayors Review Draft, 1997), must be continually be
updated, such as to define performance measures and guidelines for the establishment and
maintenance of the drought reserve. This paper proposes the further development of this concept
to include the financial equivalent of the physical reserve to include building a cash reserve.
Another activity must be to spare the ratepayer from the vulnerability to drought, as was also
stated in the Water Resources Management Strategy (WRMS), is “Conduct rate studies and
adopt new rate structure that fairly distributes the cost of providing a sustainable water supply”
(COA, 1997). It has become clear with the rate and cost analysis that a rate structure change
should be enacted to increase the average customer monthly rates by less than $6, which appears
to satisfy the fiscal need and the money is placed in a reserve fund. It is simple, doable and, in
accordance, with many of the community values of water and the cost of other basic needs.
The plan, as with capital planning, requires understanding of the consequences of drought
and cost to replace aging infrastructure, sensible planning, political desire and impetus to enable
legislative changes to the rate structure and a 15 year commitment to save and earmark the
money for this purpose.
50
Along with the rate increase option, there must be requirements such as legislation and rules
and regulations to protect the corpus of the sinking fund for its specific establishment and use to
alleviate the potential disastrous impact and vulnerability to prolonged drought conditions. To
insure the success of the long term savings and prohibit this money‟s use for other
„emergencies‟. The following measures are suggested:
Create Enabling Legislation to establish a $110 million Permanent Drought Fund
(FUND)/‟Rainless Day‟ Act that will permanently „lock‟ expenditures from Corpus of
Fund and establish conservative investment criteria.
Distribution/ withdrawals from FUND only from interest earned and only for times /
durations beyond 7 years and / or reservoir storage levels below 20% „dry‟ indexing
Permanent Fund distribution and withdrawal exceptions permitted with 2/3 rd approval of
rate payers and Governing Body
New supply purchases and infrastructure (desalination plants foreign and domestic,
storage, pipeline, water right acquisition) to bring supply to the Utility
Match to acquire federal, state funds for purchase of new supply
Prohibit withdrawals from FUND for purchases related to eminent domain and utility
mergers and acquisition
Enhance stability of FUND with one time appropriation injection from State of NM.
Earmark the cash reserve and trigger the opening of the account utilizing federal or state
drought monitoring agencies and index severity such as Palmer Index

51
Allow Third Party transfer of water to facilitate more efficient use; but do not do away
with impairment rules and protest hearings that are in place to protect small communities
and farmers. Continue to limit eminent domain actions outside service areas.
Continue to develop Aquifer Storage Opportunities in times of plentiful water supply
Conclusion
Under drought conditions a more robust drought management strategy is necessary to
ensure future water supply, and to meet the forecasted water demands and infrastructure needed
to deliver water. Southwestern drinking water supplies are scarce, growing populations are
fueling demand for water. The looming prolonged drought coupled with climate change has the
potential for a pronounced impact on the business side of utilities to generate revenue from the
sale of water service. Revenue loss limits management options to obtain quality water, provide
adequate infrastructure to deliver water, and rehabilitate and replace infrastructure to sustain the
desired level of service for a growing population. The expected revenue loss attributed to a
prolonged drought and cost to replace the Authority‟s aging infrastructure is estimated to be
$110 million and $1 billion, respectively. It is recommended that the option to address the fiscal
impacts of drought is creation of reserve fund. A rate increase of less than $6 to the monthly
average customer water bill, if saved, would amass more than $110 over a 15 year period, or
enough to match the revenue loss due to a prolonged drought. Nessi-curve construction for pipe
used in the delivery of water has revealed the considerable cost of the utility to replace the aging
pipe infrastructure. This infrastructure will also require substantial financial commitment and
Asset Management. Nonetheless, the Authority must show increased attention to the
possibilities of drought and account in the rate pricing structure to fully recover the cost of the

52
Utility‟s required levels of service to the customer and address the realities of the region‟s
limitations to reliably supply water.
Glossary of Terms / Acronyms
ABCWUA- Albuquerque Bernalillo County Water Utility Authority (Authority)
BAU- Business As Usual
COA- City of Albuquerque
CRB- Colorado River Basin
GCM- Global Climate Mode
GCT- Grand Canyon Trust
GIS- Geographic Information System
IPCC- Intergovernmental Panel on Climate Change
MRCOG- Mid Region Council of Governments
NMAC- New Mexico Administrative Code
NMOSE- New Mexico Office of the State Engineer
USBOR- United States Bureau of Reclamation
USDOE-United States Department of Energy
USDOI- United States Department of the Interior
USEPA- United States Environmental Protection Agency
USGS- United States Geological Survey
Acronyms
AF acre-feet
CFS cubic feet per second
G gallons
GPCD (gpcd) gallons per capita per day
GW ground water
MAF million acre-feet
MGD million gallons per day

53
References Action Committee of the Middle Rio Grande Water Assembly. (October 1999). Middle Rio
Grande Water Budget- Where water comes from, goes and how much; Averages for 1972-1997.
Albuquerque, New Mexico: Middle Rio Grande Water Assembly.
American Water Works Assoiciation (AWWA). (2006 Edition). Climate Change and Water
Resources: A Primer for Municipal Water Providers. American Water Works Association.
Booker, J. F. (1995, October). Hydrologic and Economic Impacts of Drouoght Under Alternative
Policy Responses. Water Resources Bulleting, American Water Resources Association, Volume
31, No. 5 , pp. 889-905.
Booker, James F., and Colby, Bonnie G. (1995, October). Competing Water Uses in the
Southwestern Ujnited States: Valuing Drought Damages. Water Resources Bulletin, American
Water Resources Association, Volume 31, No 5 , pp. 877-888.
Boxall, B. (Sunday, April 1, 2007, Section C). Region Braces for 'perfect drought'. Santa Fe,
New Mexico: Los Angeles Times / The Santa Fe New Mexican.
Brown, F. L., Nunn, S.C., Shomaker, J.W., and Woodward, G. (January 15, 1996). The Value of
Water. Albuquerque, NM: Prepared in Response to City of Albuquerque RFP-95-010-SV.
CH2M HILL and EJJ Communications. (2003). Drought Management Strategy. Albuquerque,
New Mexico: City of Albuqueruqe, Public Works Deparment, Water Resources (now known as
ABCWUA).
Chavez, G. (2009). Albuquerque Bernalillo County Water Utility Authority (ABCWUA)- Average
Customer Monthly Water Bill Charges. Albuquerque, New Mexico: ABCWUA, Personal
communication.
Christensen, Niklas S., and Lettenmaier, Dennis P. (1999). Imapacts of Climate Change on the
Hydrology of the Colorado River System. American Geophysical Union (pp. Poster Session
H41A-18). Seattle, Washington: Department of Civil and Environmental Engineering, University
of Washington.

54
City of Albuquerque, Public Works Department. (1989). Out of site-Out of Mind- A report on
Wate & Sewer Line Rehabilitation Needs. Albuquerque, New Mexico: City of Albuquerque.
Daves, Gary, City of Albuquerque, Public Works Department. (November 1994). The Water
Future of Albuquerque and Middle Rio Grande Basin. Albuquerque, New Mexico: New Mexico
Water Resources Research Institute.
Demint, A. (2005). Integrating a GIS-produced, Reach-based Hydrologic Analysis into a
Dynamic Surface Water Model of the Middle Rio Grande, New Mexico. Albuquerque, New
Mexico: Professional Project Submitted in Partial Fulfillment of University of NM, Master of
Water Resources .
Donald A. Wilhite. (2000). Drought, Volume I, A Global Assessment. Routledge, Hazards and
Disasters Series.
Fleck, J. (2006, August). Dry to Drenched, A Monsoon for the Ages...Winter drought of just luck
are two explanations given for wet summer. Retrieved from
http://epaper.abqjournal.com/APD26302/PrintArt.asp?SkinFolder+AlJournal
Fleck, J. (April 2007). New Mexico's Water Outlook-Short Term: Bad; Long Term: Worse. City
of Albuquerque: Albuquerque Journal.
Fleck, John and Soussan, Tania. (Augsut 2005). Warming to Raise Drouight Risk. Albuquerque,
New Mexico: Albuquerque, Journal, Section A.
Fleck, John. (February 2007). Colorado River May Not Be Stable Source. Albuquerque, New
Mexico: Albuquerque Journal.
Glieck, P. (2007). Worlds Water 2006-2007, The Biennial report on Freshwater Resources.
Island Press, Pacific Institute for Studies in Development , Environment and Security .
Gutzler, D. (September 2000). Covariability of spring snowpack and summer rainfall across the
southwest United States. Journal of Climate , 4018-4027.
Gutzler, D. S. (2008, June 5). 21st Century Climate Change in SW New Mexico: What's in Store
for the Gila? America's Most Endangered Rivers: 2008 Edition; RiverAlert: The Endangered
Gila River Needs Your Help . Silver City, New Mexico.
Gutzler, D. S. (2009, January). Climate change projections with observation-based interannual
variability. 21st Confernce on Climate Variability and Change, (Recorded/ audio presentation;
htttp://ams.confex.com/ams/89annual/techprogram/paper_146589.htm).
Gutzler, D. S. (2005, October 19). Climate Change: What's in store for New Mexico. New
Mexico Change Initiative Disucssion , 1-36. Albuquerque, New Mexico.
Gutzler, D. (September 2005). Water and Global Cimate Change. New Mexico Drought Summit,
(p. Power Point Presentation). Albuquerque, New Mexico.
55
Gutzler, D.S., Preston, J. W. (1997). Evidence for a relationship between spring snow cover in
North America and summer precipitation in New Mexico. American Geophycal Union,
Geophysical Research Letters 1997, vol. 24, no17 , pp. 2207-2210 (21 ref.).
Gutzler, David S., Nims, Joshua S. (2005). Interannual Variability of Water Demand and
Summer Climate in Albuquerque, New Mexico. Journal of Applied Meterorology , 1777-1787.
Gutzler, David S.; Williams, Lindsey N. (2005). NAME Climate Process Team. Retrieved 2009,
from A multi-model assessment of NorthAmerican Monsoon simulations:
http://www.joss.ucar.edu/name/namap2
Harding, B. (2007). Drought and Middle Rio Grande Wate Management Issues. Water Resources
of the Middle Rio Grande: Decision Makers Field Guide . Socorro, New Mexico.
Harding, B.L., Sangoyomi, T.B. and Payton, E.A. (1995, October). Impacts of A Severe
Sustained Drought on Colorado River Water Resources. Water Resources Bulletin, American
Water Resources Association, Vol 31, No. 5 , pp. 815-837.
Hardy, T. (1995, October). Assessing Environmental Effects of Severe Sustained Drought. Water
Resources Bulletin, American Water Resources Association, Vol. 31, No 5 , pp. 867-876.
Hathaway, D. L., & MacClune, K. (2007). The Middle Rio Grande Water Budget: A Debt
Deferred. Water Resources of the Middle Rio Grande: Decision Makers Field Guide . Socorro,
New Mexico.
Henderson, J.L. and Lord, W.B. (1995, Ocotober). A Gaming Evaluation o fColorado River
Drought Management Institutional Options. Water Resources Bulletin, American Water
Resources Association, Vol. 31, No. 5 , pp. 815-837.
Hu, Qi, and Feng, Song. (May 2002). Internannual Raninfall Variations in North American
Summer Monsoon Region: 1900-88. Americn Meteorological Society Journals Online , Volume
15, Issue 10,.
Jurrat, J. (2009, January). The Consequences of Being Overdrawn-Agriculture. Bringing
Accountability to Water Planning: Does it take a crisis. Albuquerque: Water Dialog.
Kaufman, M. (2007, April 6). Southwest May Get Even Hotter, Drier, Report on Warming
Warns of Droughts. Washington, District of Colombia, USA: Washington Post.
Kenney, D. (1995, October). Institutional Options For The Colorado River. Water Resources
Bulletin, American Water Resources Association, Vol. 31, No. 5 , pp. 837-850.
Knight, C.G., Raev, I., and Staneva, M.P. . (2004). Drought in Bulgaria, A Contemporary
Analog For Climate Change. Burlington, Vermont USA, Aldershot, England: Asgate Publishing
Co.

56
Krannich, R.S., Keenan, S.P., and Hardesty, D. L. (1995, October). Social Implications of Severe
Sustained Drought: Case Studies in California and Colorado. Water Resources Bulletin,
American Water Resources Association, Vol. 31, No. 5 , pp. 851-865.
Lawrence, David M., Webster, Peter J. . (2001). Interannual Variations of the Intraseasonal
Oscillation in the South Asian Summer Monsoon Region. Journal of Climate, American
Meterological Society, Journals Online Vol. 14 , 2910-2922.
Mid Region Council of Governments, Middle Rio Grande Water Assembly and NM Stream
Commission. (2001). Future Water Use Projections for the Middle Rio Grande Water Planning
Region, September 2001, a Final Draft. Albuquerque: Mid Region Council of Governments.
National Drought Mitigation Center. (2006). University of Nebraska, Lincoln, Drought
Mitigation, What is Drought. Retrieved June 12, 2009, from
http://drought.unl.edu/risk/impactvulnerability.htm
National Research Council, Committee on the Scientific Bases of Colorado River Basin Water
Management. (2007). Colorado River Basin Water Management: Evaluating and Adjusting to
Hdroclimatic Variability. Washington, DC: The National Academies Press.
Norveil, W.S., McClure, W.F., Carpenter, Delf, Scrugman, J.G., Davis, S.B., Caldwell, R.E.,
Emerson, F.C. (2009, June 12). Colorado River Compact. Retrieved June 12, 20009, from
Encyclopedia Britannica: http://www.britannica.com/EBchecked/topic/126522/Colorado-River-
Compact
Robert, L. (2007). A Killing "Cure"- Agricultural-to-Urban Water Transfers in the Middle Rio
Grande Basin. Water Resources of the Middle Rio Grande: Decision Makers Field Guide .
Socorro, New Mexico.
The National Ground Water Association. Ground Water Sustainability: A White Paper; Ground
Water: A Critical Component of the Nation's Water Resources.
Thebaut, J. (Director). (2005). The American Southwest: Are We Running Dry? [Motion Picture].
Titus, F. (2007). Water- Things to Do Now, and Do Better. Water Resources of the Middle Rio
Grande: Decision Makers Field Guide . Socorro, New Mexico.
U.S. Department of the Interior (USDOI), U.S. Bureau of Reclamation. (2004). Modeling of
Drought Management Scenarios- Briefing for Environmental Defense, et al, August 25, 2004.
Power Point Presentation . U.S. Bureau of Reclamation.
U.S. Department of the Interior, Bureau of Reclamation. (November 2004). Annual Operating
Plan for Colorado River Reservoirs, 2005. Washington: U.S. Department of the Interior.
U.S. Environmental Protection Agency (USEPA). (n.d.). Retrieved from Drought Planning and
Management Links, USEPA, Water Use Efficiency Program: http://www.epa.gov/owm/water-
efficiency/linkspg.htm

57
U.S. Environmental Protection Agency (USEPA). (n.d.). Drought Management. Retrieved from
http://www.epa.gov/owm/water-efficiency/drouhome.htm
U.S. Environmental Protection Agency (USEPA). (n.d.). Water & Wastewater Pricing.
Retrieved from http://www.epa.gov/water/infrastructure/pricing/index.htm
U.S. Geological Survey (USGS). (2004). Climatic Fluctuations, Drought, and Flow in the
Colorado River Basin, USGS Fact Sheet 2004-3062, Vversion 2, August 2004. Washington: U.S.
Geological Survey.
U.S. Geological Survey (USGS). (n.d.). Estimated Evaporative Losses Incurred by Conveyance
of City of Albuquerque San Juan-Chama Water: Jemez to Albuquerque. Retrieved from
http://nm.water.usgs.gov/Evaploss.htm
U.S. Geological Survey (USGS). (n.d.). Peak Streamflow for years 4/21/1895 through
5/10/2004, Rio Grande At Otowi Bridge, NM. Retrieved September 18, 2006, from USGS
08313000 RIO GRANDE AT OTOWI BRIDGE, NM:
http://waterdata.usgs.gov/nwis/nwisman/?site_no=08313000&agency_cd=USGS
Western Governor's Association. (June 2004). Water Needs and Strategies for a Sustainable
Future. Denver: Western Governor's Association.
Wilhite, D. A. (2000). Drought, Volume I, a Global Assessment. New York, London: Routledge
Haszrds and Disasters Series.
Wilhite, D. A. (2000). Drought, Volume II, a Global Assessment. New York, London: Routledge
Haszrds and Disasters.
Yanal, Brent and Leathers, Daniel. (December 1988). Relationships between Interdecadal and
Interannual Climatic Variations and Their Effect on Pennsylvania Climate. Annals of the
Association of American Geographers , 624-641.
Ye, H. (July 2001). Characteristics of Winter Precipttation Varioation over Northern Central
Eurasia and their Connections to Sea Surface Temperatures over the Atlantic and Pacific Oceans.
AMS Journals Online, American Meteorological Society, Vol. 14, Issue 14 , 3140- 3155.

58
Appendix A (see disc / back cover)
Appendix B (see disc / back cover)