Embed Size (px)
Citation preview
Tom Jenkins
Professor Emeritus
Animal & Veterinary Sciences
Clemson University
Utilization of Saturated
and Unsaturated Fatty
Acids by Dairy Cattle
Fat Terms
Total Lipid (ether extract)
Includes fatty acids
Non-lipid contaminants
Fatty acids
Basic unit of fats
Best predictor of animal performance
Saturated/Unsaturated
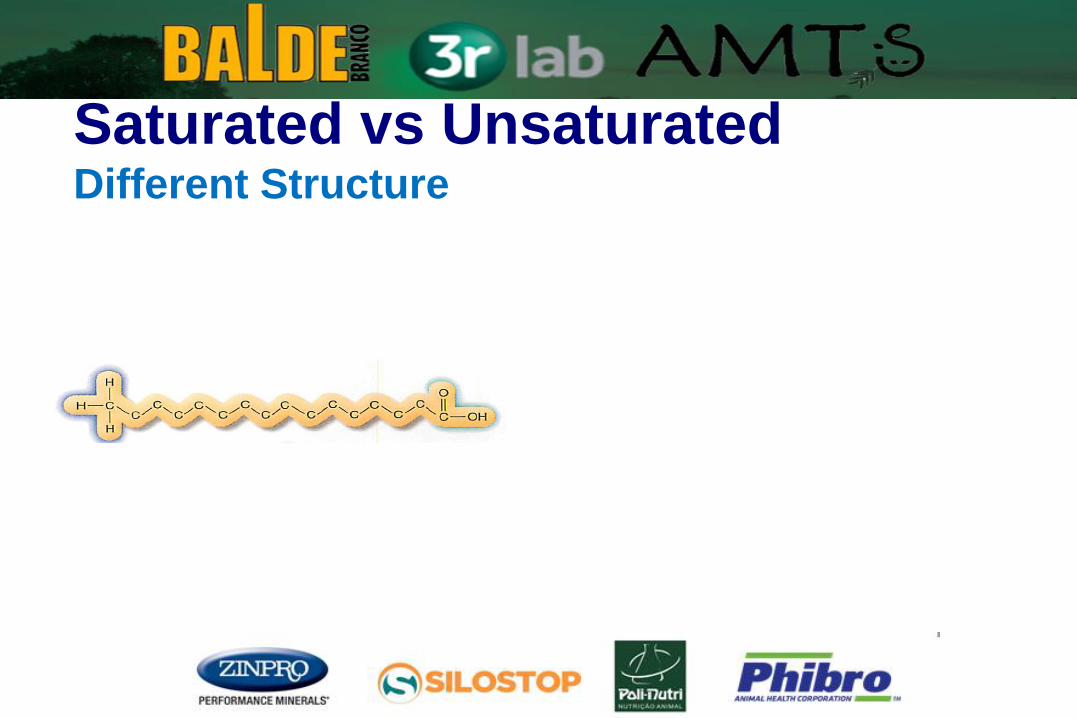
Saturated vs Unsaturated Different Structure
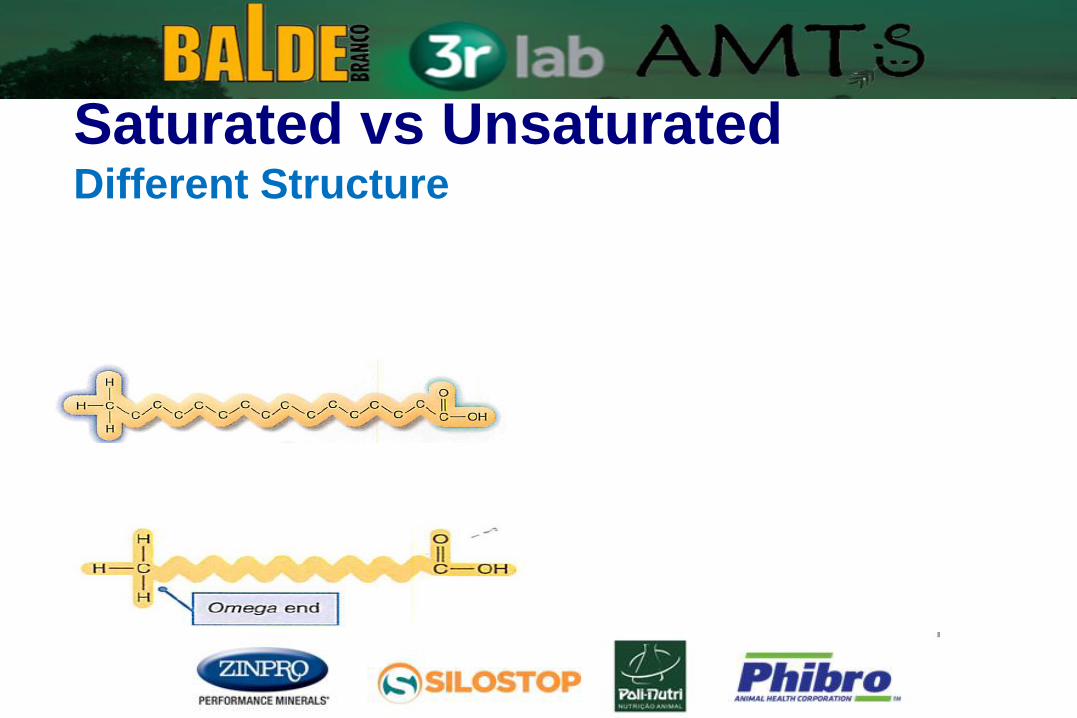
Saturated vs Unsaturated Different Structure
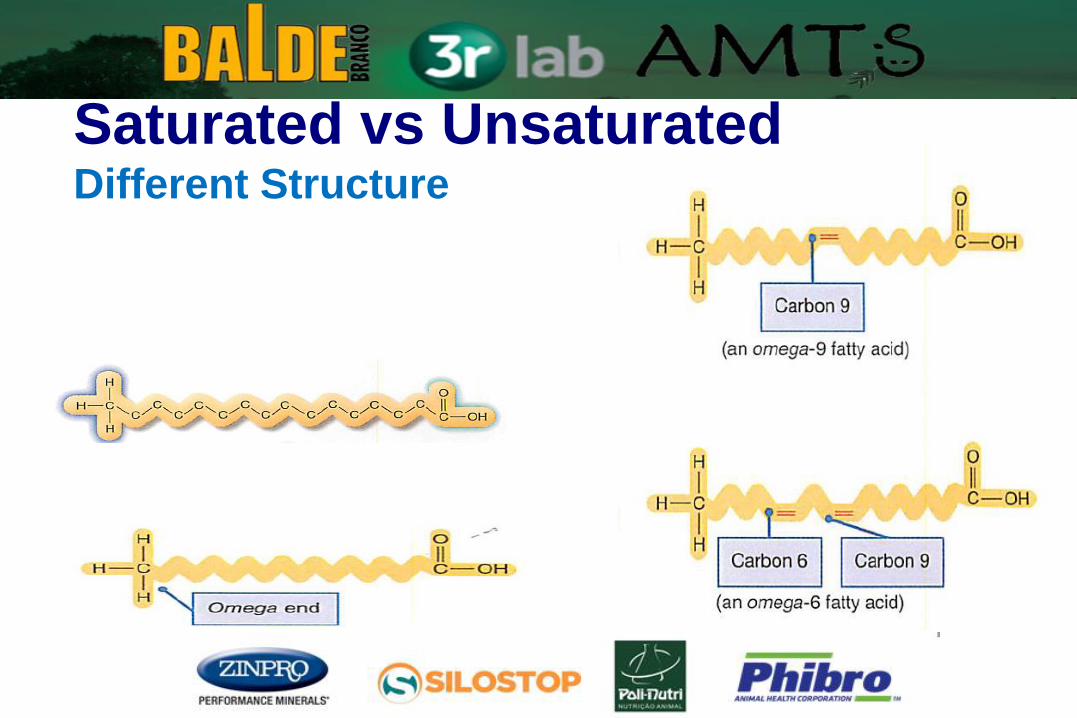
Saturated vs Unsaturated Different Structure
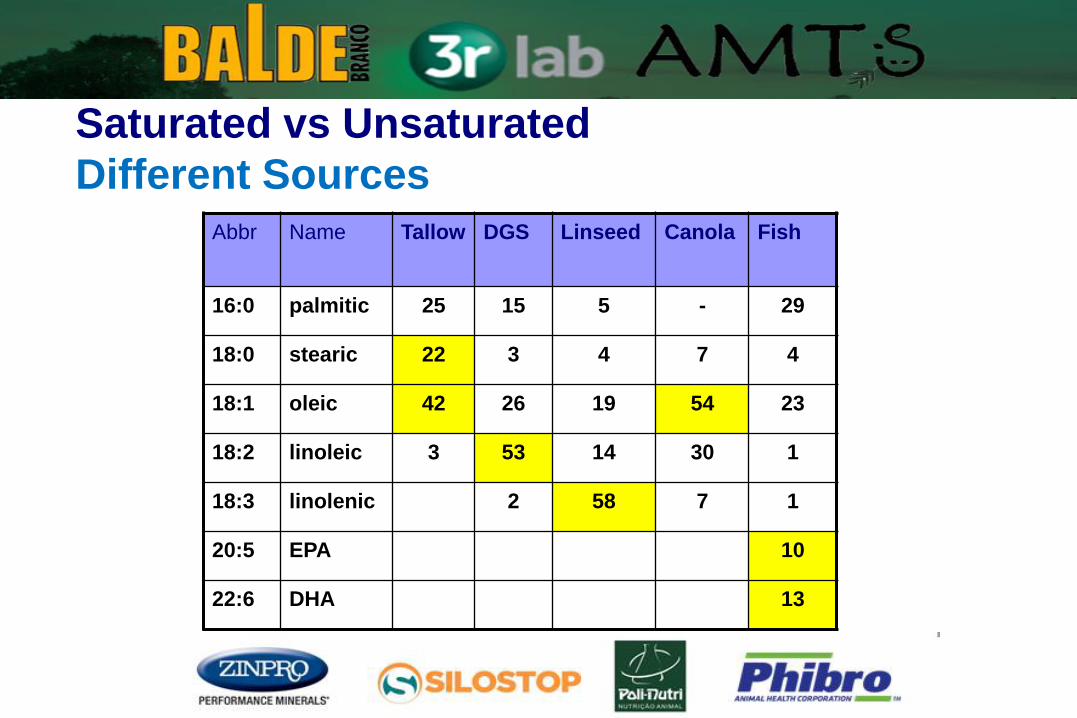
Saturated vs Unsaturated
Different Sources
Abbr Name Tallow DGS Linseed Canola Fish
16:0 palmitic 25 15 5 - 29
18:0 stearic 22 3 4 7 4
18:1 oleic 42 26 19 54 23
18:2 linoleic 3 53 14 30 1
18:3 linolenic 2 58 7 1
20:5 EPA 10
22:6 DHA 13
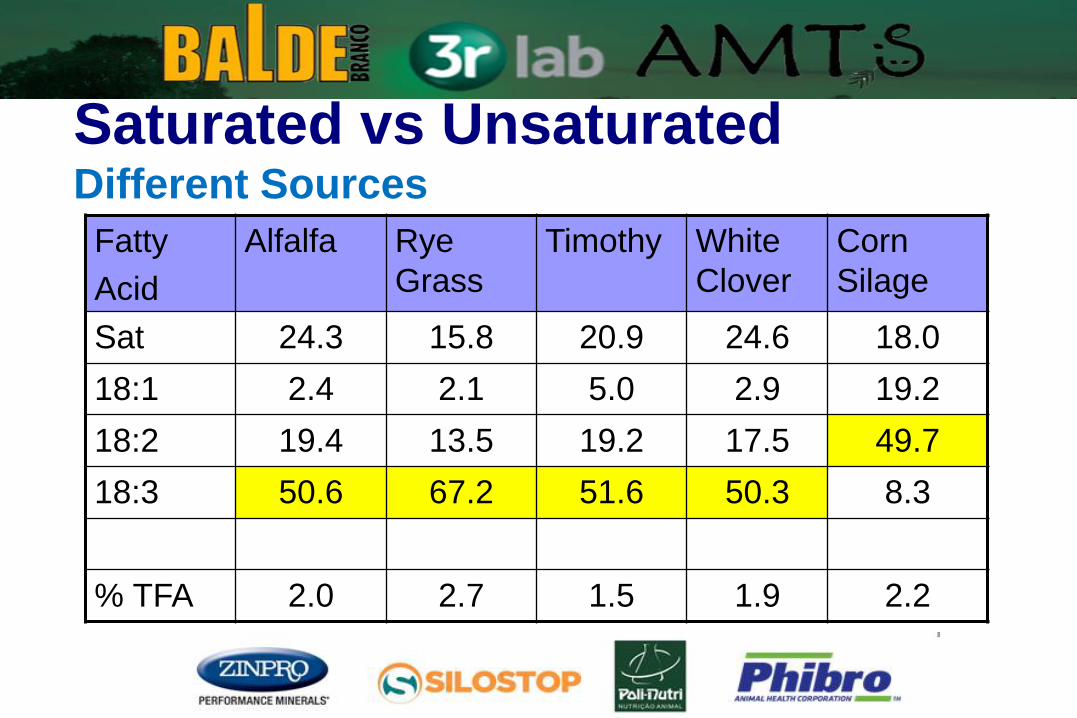
Saturated vs Unsaturated Different Sources
Fatty
Acid
Alfalfa Rye
Grass
Timothy White
Clover
Corn
Silage
Sat 24.3 15.8 20.9 24.6 18.0
18:1 2.4 2.1 5.0 2.9 19.2
18:2 19.4 13.5 19.2 17.5 49.7
18:3 50.6 67.2 51.6 50.3 8.3
% TFA 2.0 2.7 1.5 1.9 2.2
Saturated vs Unsaturated Commercial Sources
Commercial fats
Designed to avoid rumen problems
Dry fats for easy transport and mixing
Categories
Prilled fats mostly saturated (16:0 and 18:0)
Ca salts with some unsaturated fatty acids
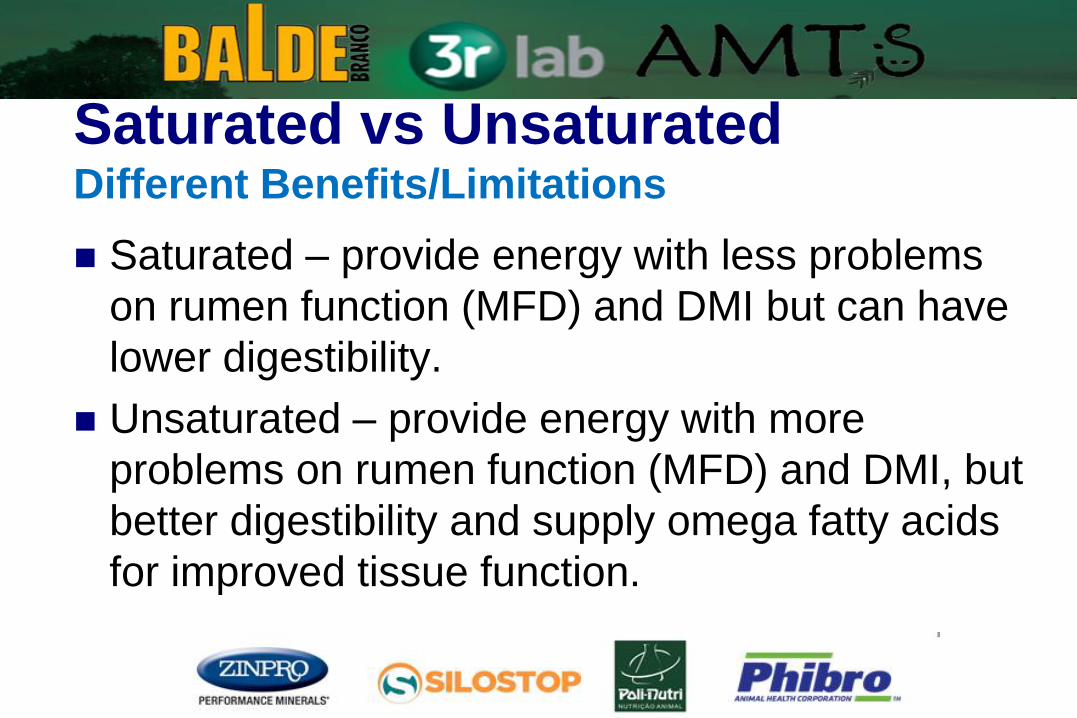
Saturated vs Unsaturated Different Benefits/Limitations
Saturated – provide energy with less problems
on rumen function (MFD) and DMI but can have
lower digestibility.
Unsaturated – provide energy with more
problems on rumen function (MFD) and DMI, but
better digestibility and supply omega fatty acids
for improved tissue function.
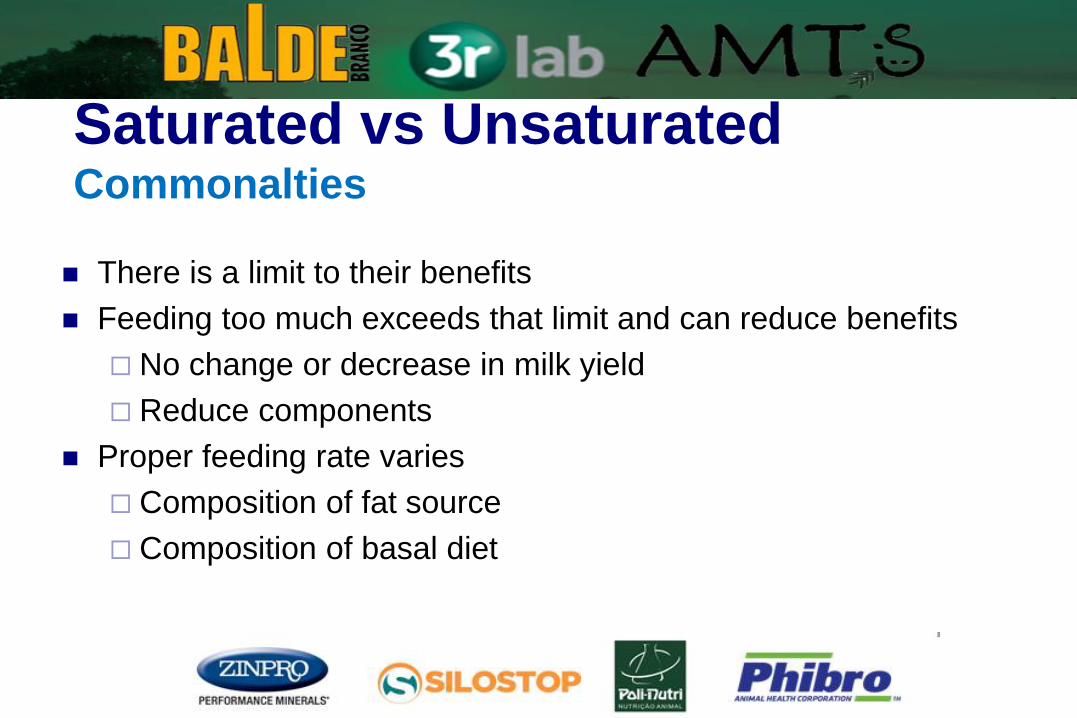
Saturated vs Unsaturated Commonalties
There is a limit to their benefits
Feeding too much exceeds that limit and can reduce benefits
No change or decrease in milk yield
Reduce components
Proper feeding rate varies
Composition of fat source
Composition of basal diet
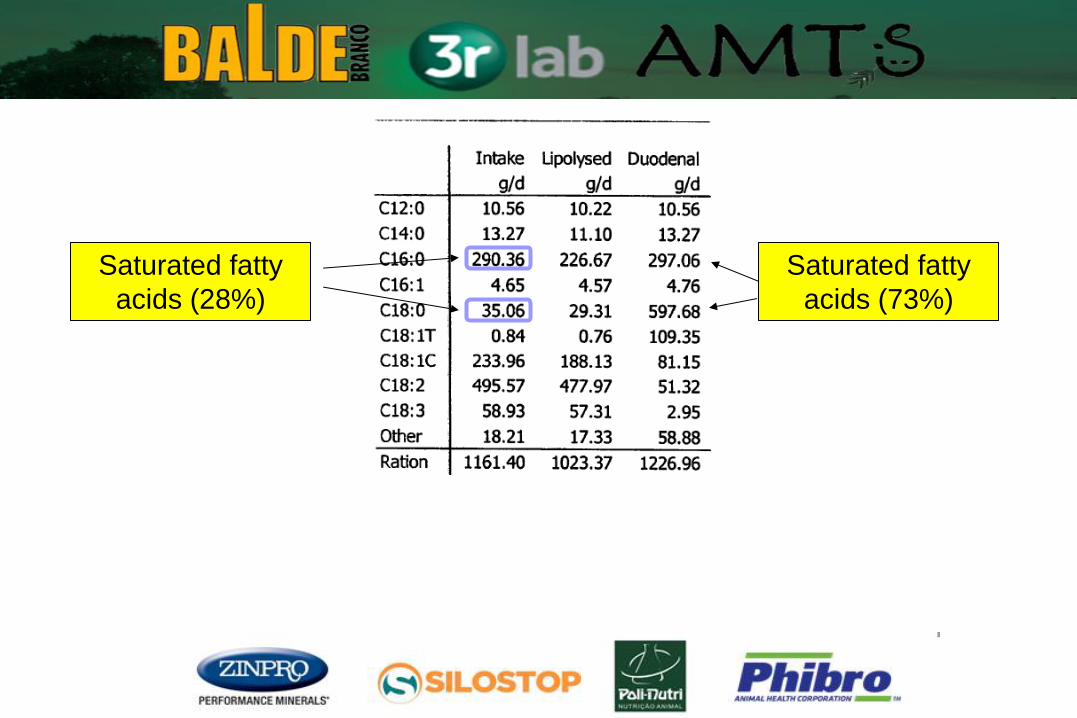
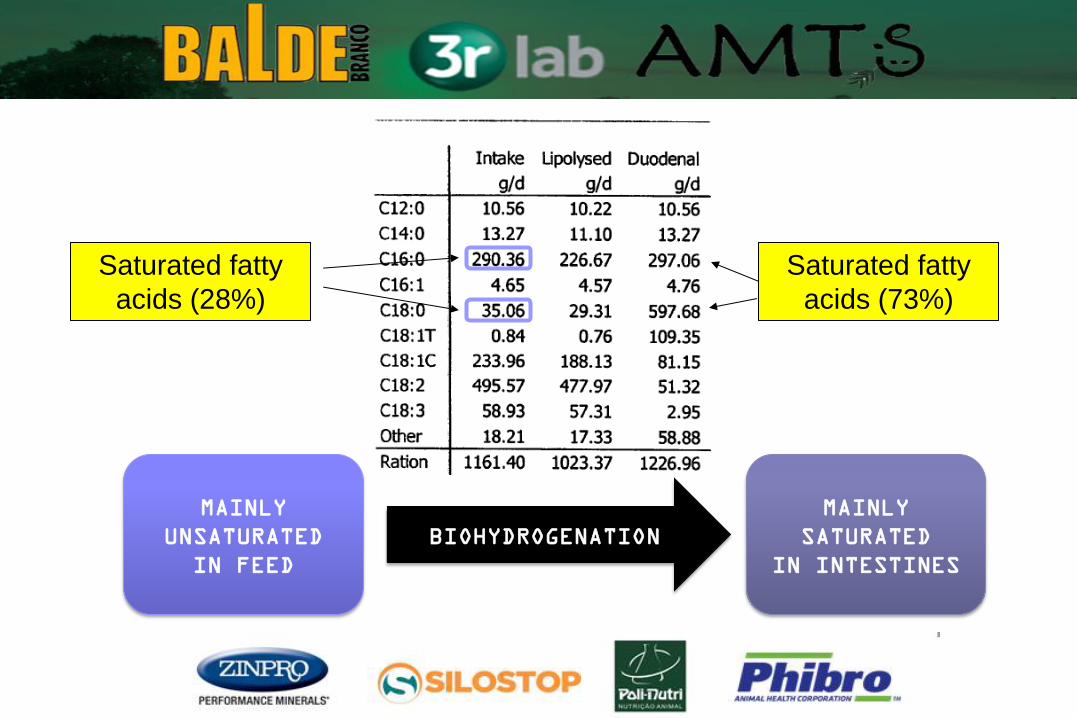
Saturated fatty
acids (28%)
Saturated fatty
acids (73%)
Saturated fatty
acids (28%)
Saturated fatty
acids (73%)
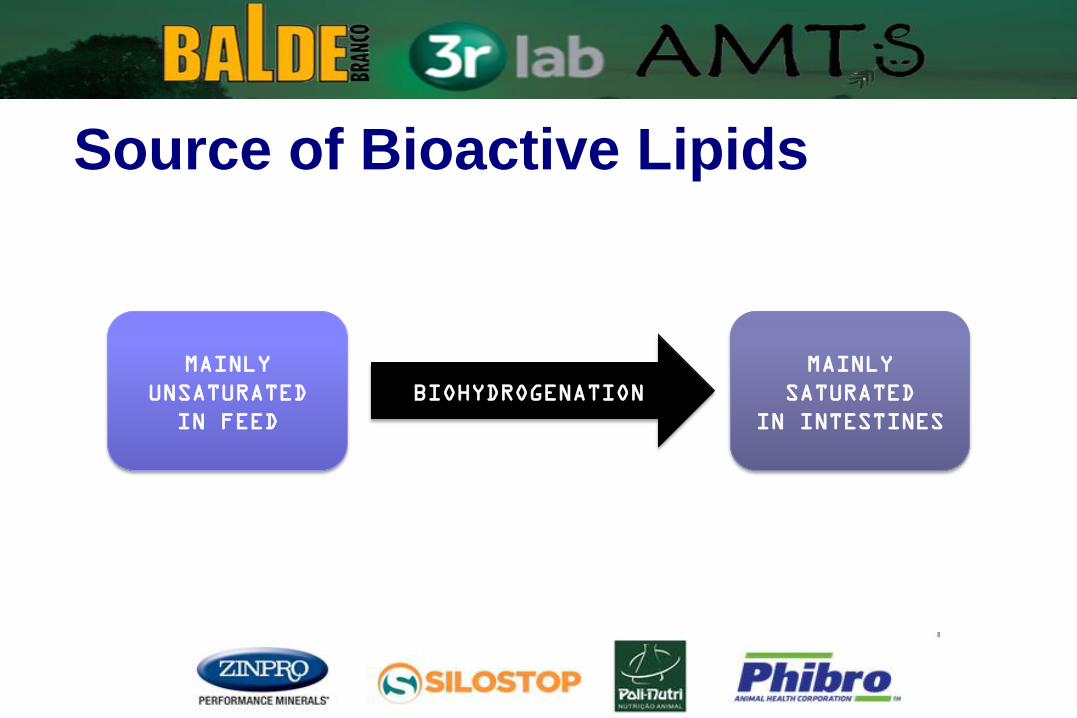
MAINLY
UNSATURATED
IN FEED
MAINLY
SATURATED
IN INTESTINES
BIOHYDROGENATION
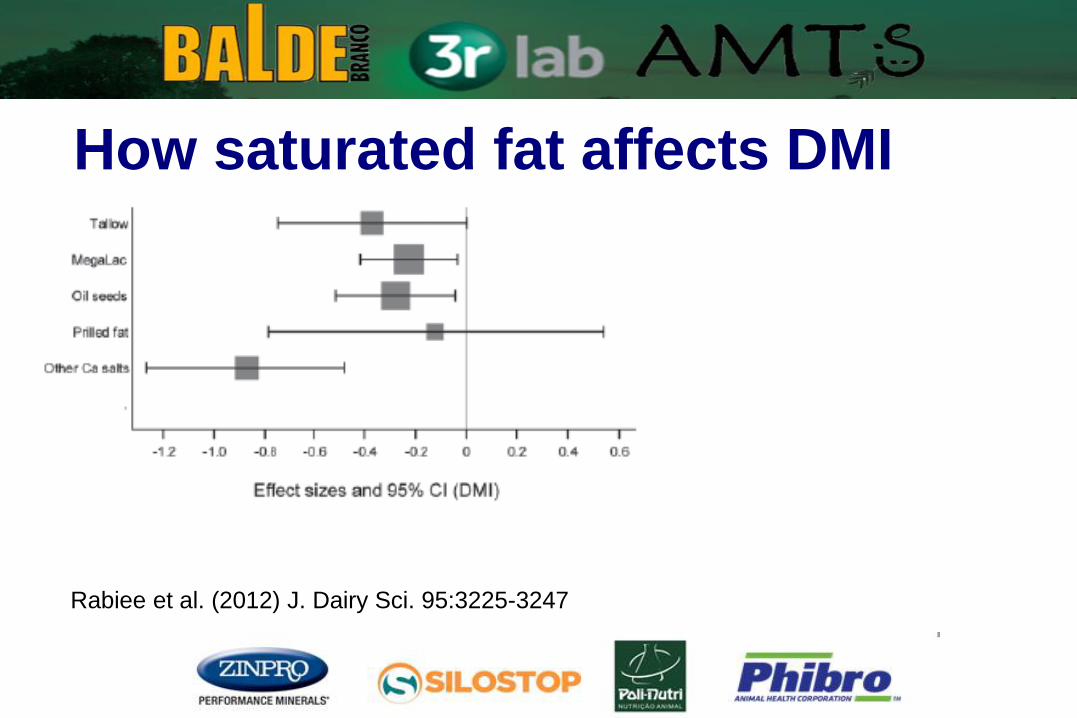
How saturated fat affects DMI
Rabiee et al. (2012) J. Dairy Sci. 95:3225-3247
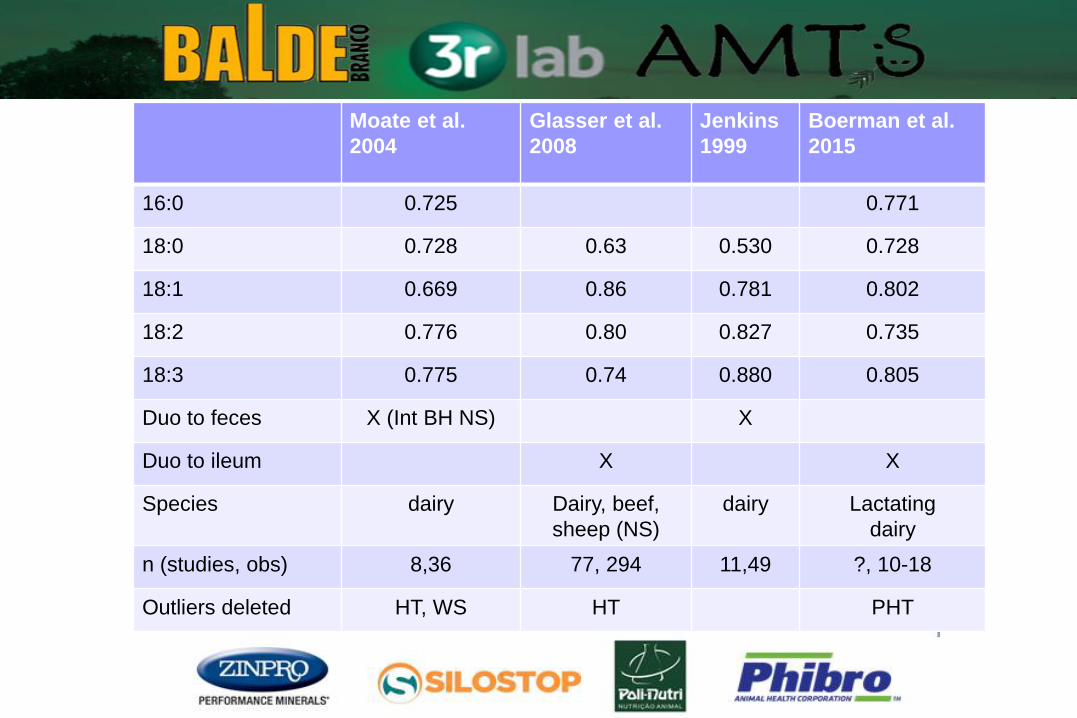
Moate et al.
2004
Glasser et al.
2008
Jenkins
1999
Boerman et al.
2015
16:0 0.725 0.771
18:0 0.728 0.63 0.530 0.728
18:1 0.669 0.86 0.781 0.802
18:2 0.776 0.80 0.827 0.735
18:3 0.775 0.74 0.880 0.805
Duo to feces X (Int BH NS) X
Duo to ileum X X
Species dairy Dairy, beef,
sheep (NS)
dairy Lactating
dairy
n (studies, obs) 8,36 77, 294 11,49 ?, 10-18
Outliers deleted HT, WS HT PHT
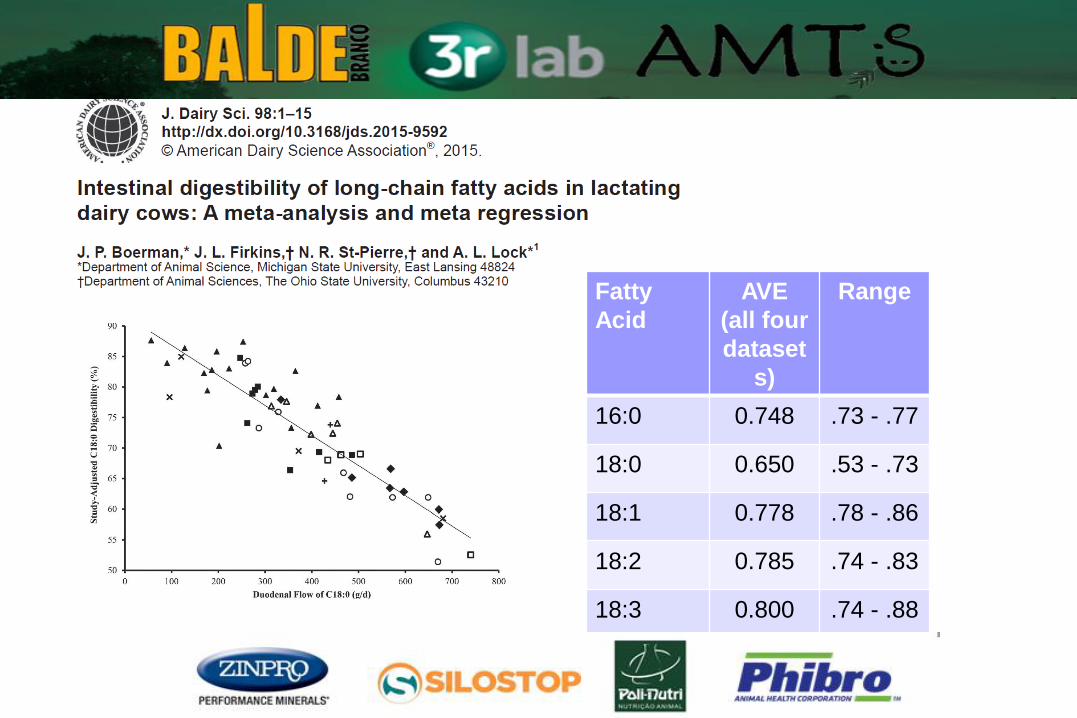
Fatty
Acid
AVE
(all four
dataset
s)
Range
16:0 0.748 .73 - .77
18:0 0.650 .53 - .73
18:1 0.778 .78 - .86
18:2 0.785 .74 - .83
18:3 0.800 .74 - .88
Possible factors affecting
digestibility of stearic Fat particle size and its reduction by mixing,
mastication, and rumination (Grummer and Rabelo, 1998).
Basal stearic acid vs stearic acid supplements.
Increased Ca salt formation at higher stearic
acid concentration (Jenkins and Palmquist, 1982).
Lysolecithin limiting at higher concentrations (Boerman et al., 2015).
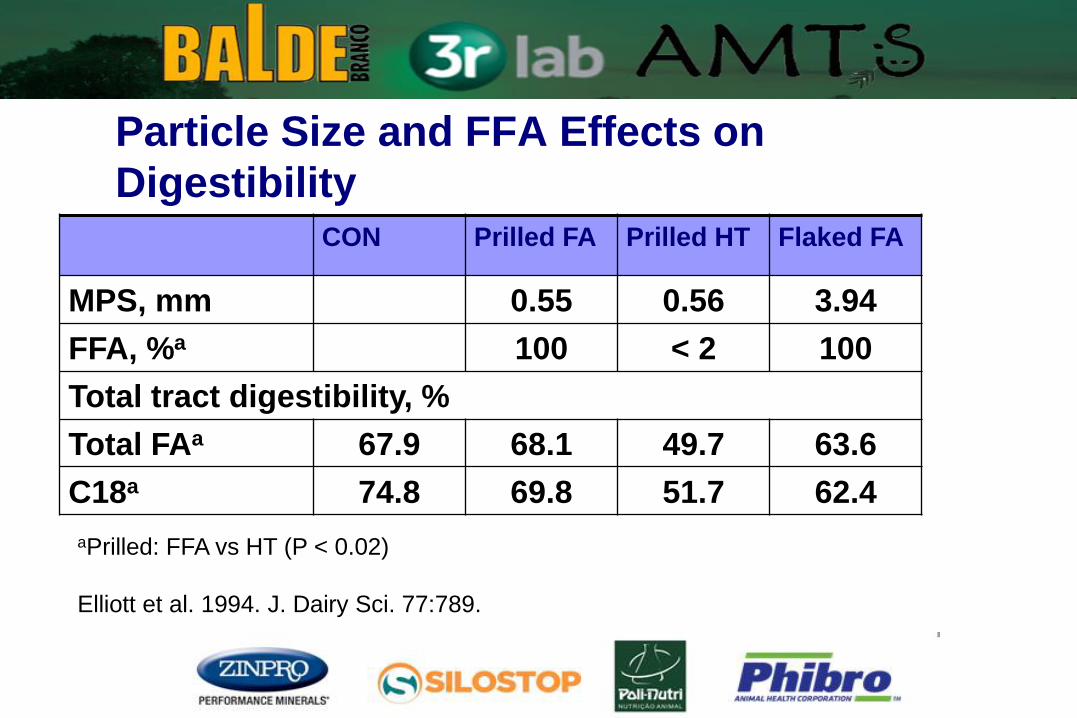
Particle Size and FFA Effects on
Digestibility CON Prilled FA Prilled HT Flaked FA
MPS, mm 0.55 0.56 3.94
FFA, %a 100 < 2 100
Total tract digestibility, %
Total FAa 67.9 68.1 49.7 63.6
C18a 74.8 69.8 51.7 62.4
aPrilled: FFA vs HT (P < 0.02)
Elliott et al. 1994. J. Dairy Sci. 77:789.
Unsaturated Fatty Acids and the
Risk of Milk Fat Depression
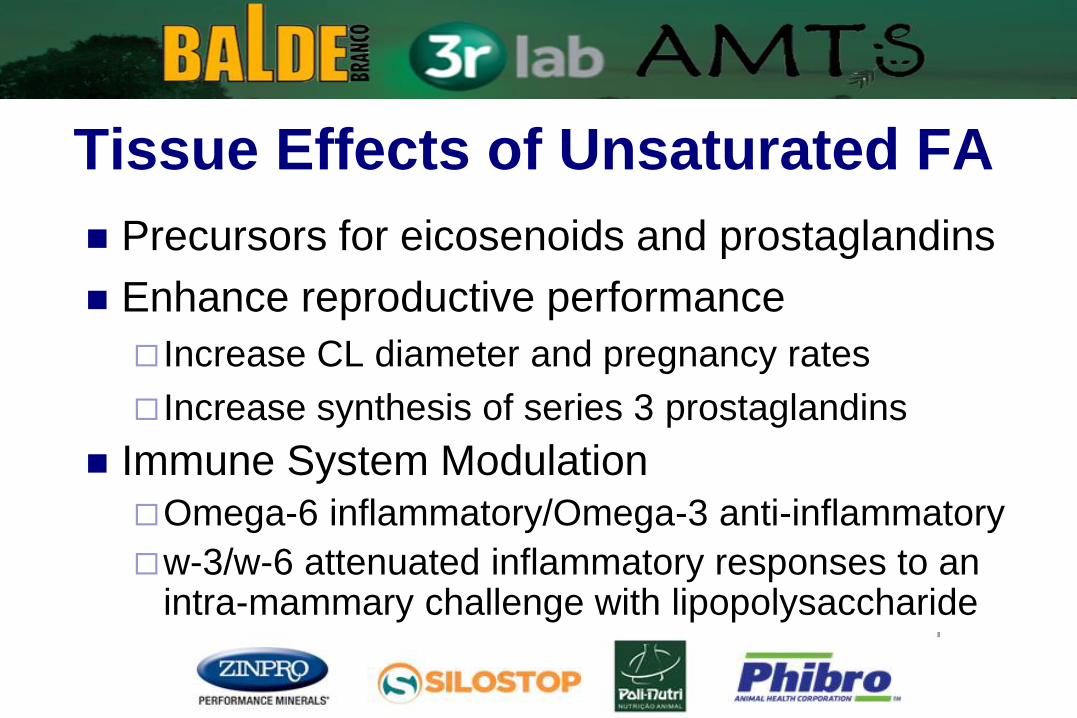
Tissue Effects of Unsaturated FA
Precursors for eicosenoids and prostaglandins
Enhance reproductive performance
Increase CL diameter and pregnancy rates
Increase synthesis of series 3 prostaglandins
Immune System Modulation
Omega-6 inflammatory/Omega-3 anti-inflammatory
w-3/w-6 attenuated inflammatory responses to an intra-mammary challenge with lipopolysaccharide
(Greco et al. (2015) J. Dairy Sci. 98:602)
MAINLY
UNSATURATED
IN FEED
MAINLY
SATURATED
IN INTESTINES
BIOHYDROGENATION
Source of Bioactive Lipids
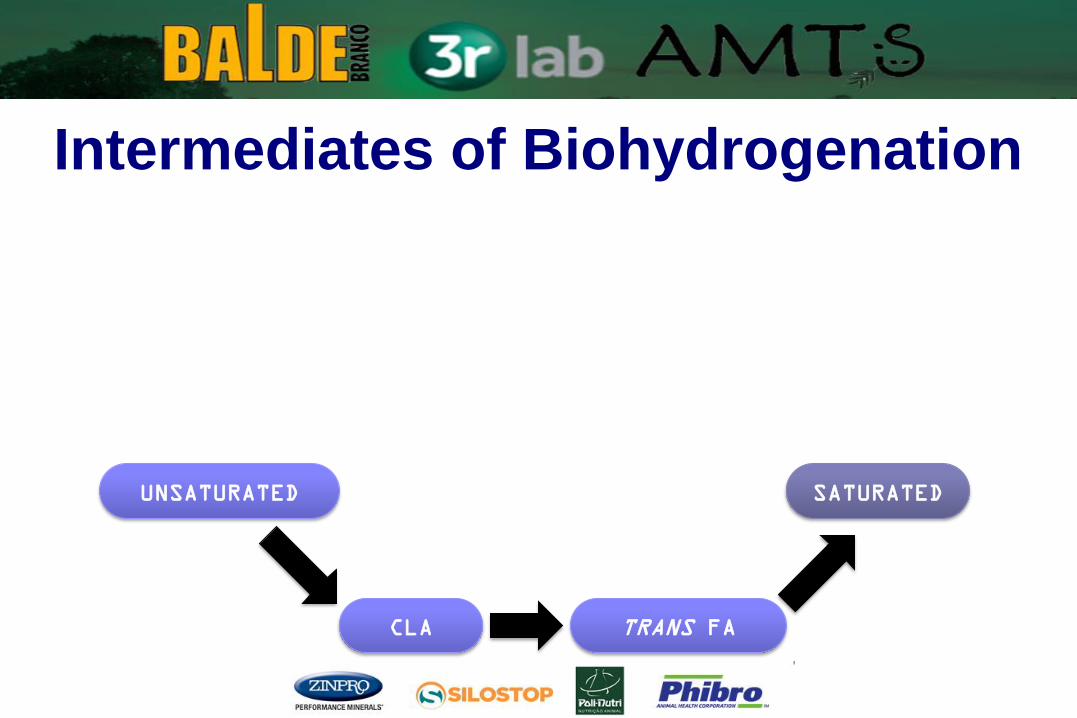
UNSATURATED
CLA TRANS FA
SATURATED
Intermediates of Biohydrogenation
CLA = conjugated linoleic acid
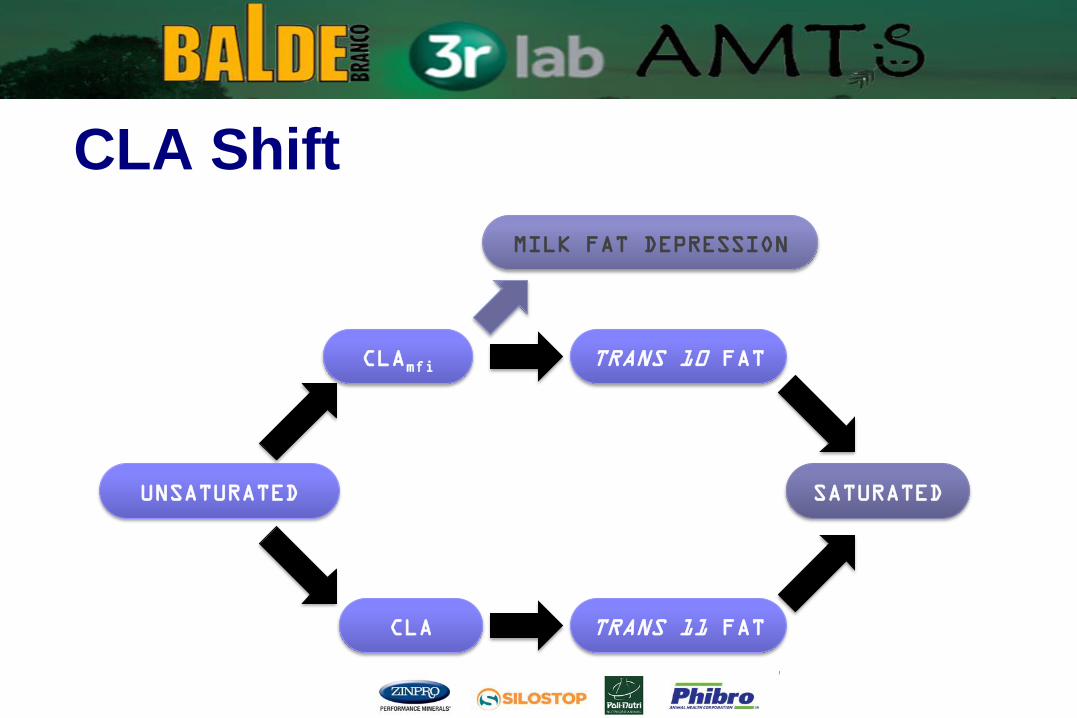
UNSATURATED
CLAmfi
CLA
TRANS 10 FAT
TRANS 11 FAT
SATURATED
MILK FAT DEPRESSION
CLA Shift
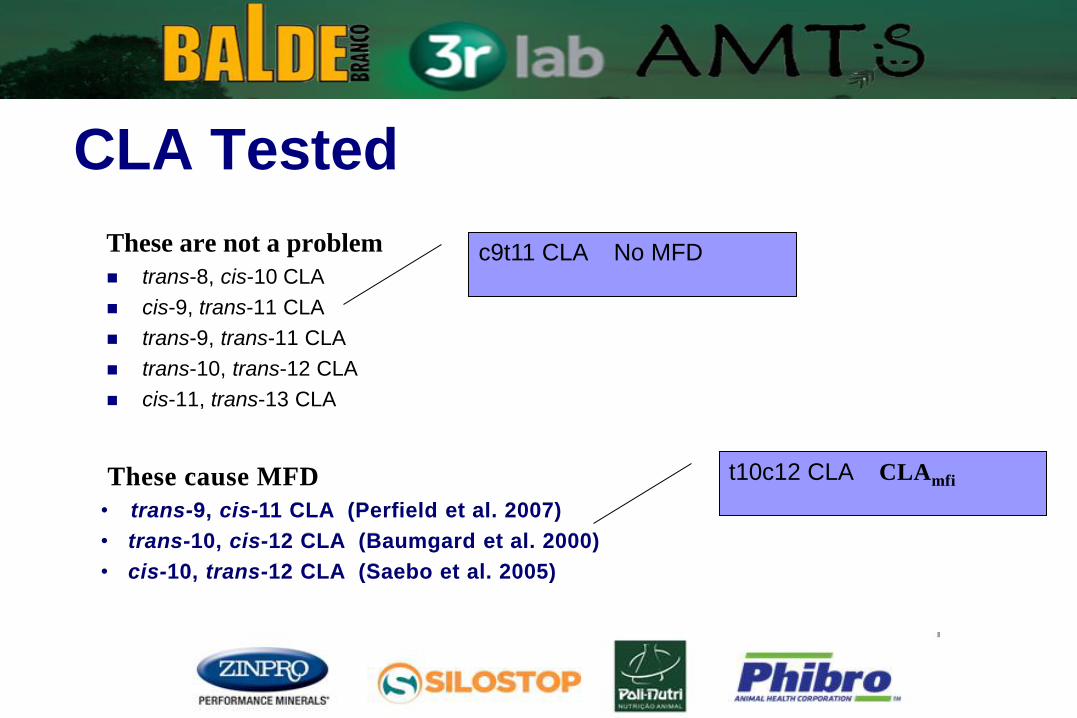
CLA Tested
These are not a problem
trans-8, cis-10 CLA
cis-9, trans-11 CLA
trans-9, trans-11 CLA
trans-10, trans-12 CLA
cis-11, trans-13 CLA
These cause MFD
• trans-9, cis-11 CLA (Perfield et al. 2007)
• trans-10, cis-12 CLA (Baumgard et al. 2000)
• cis-10, trans-12 CLA (Saebo et al. 2005)
c9t11 CLA No MFD
t10c12 CLA CLAmfi
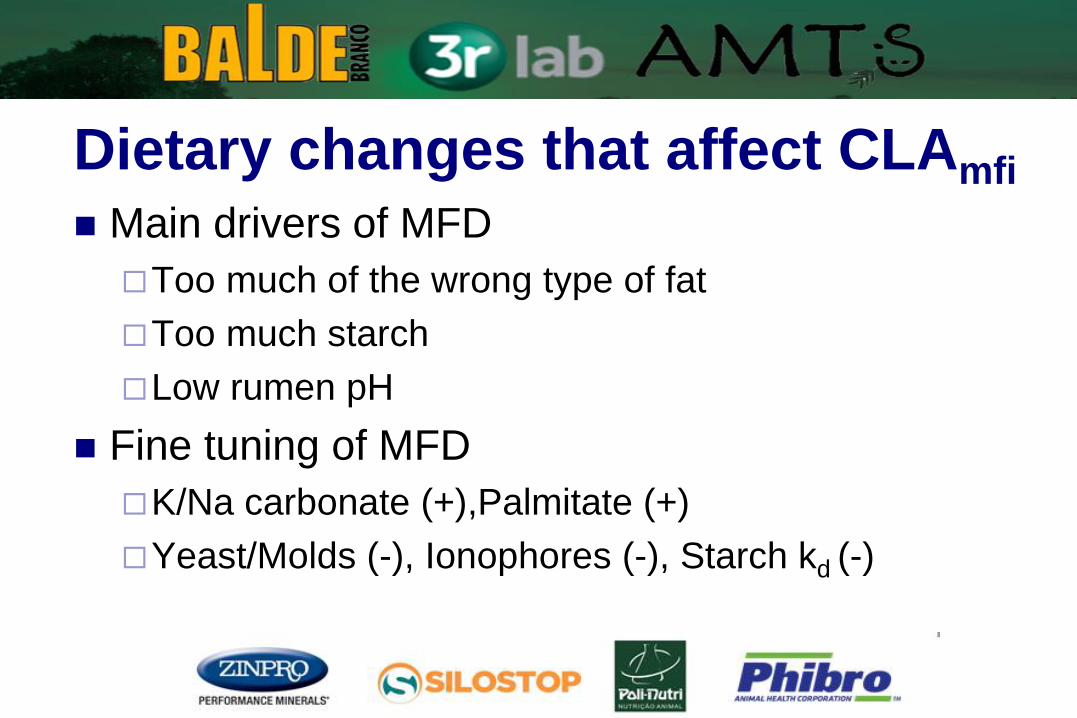
Dietary changes that affect CLAmfi Main drivers of MFD
Too much of the wrong type of fat
Too much starch
Low rumen pH
Fine tuning of MFD
K/Na carbonate (+),Palmitate (+)
Yeast/Molds (-), Ionophores (-), Starch kd (-)
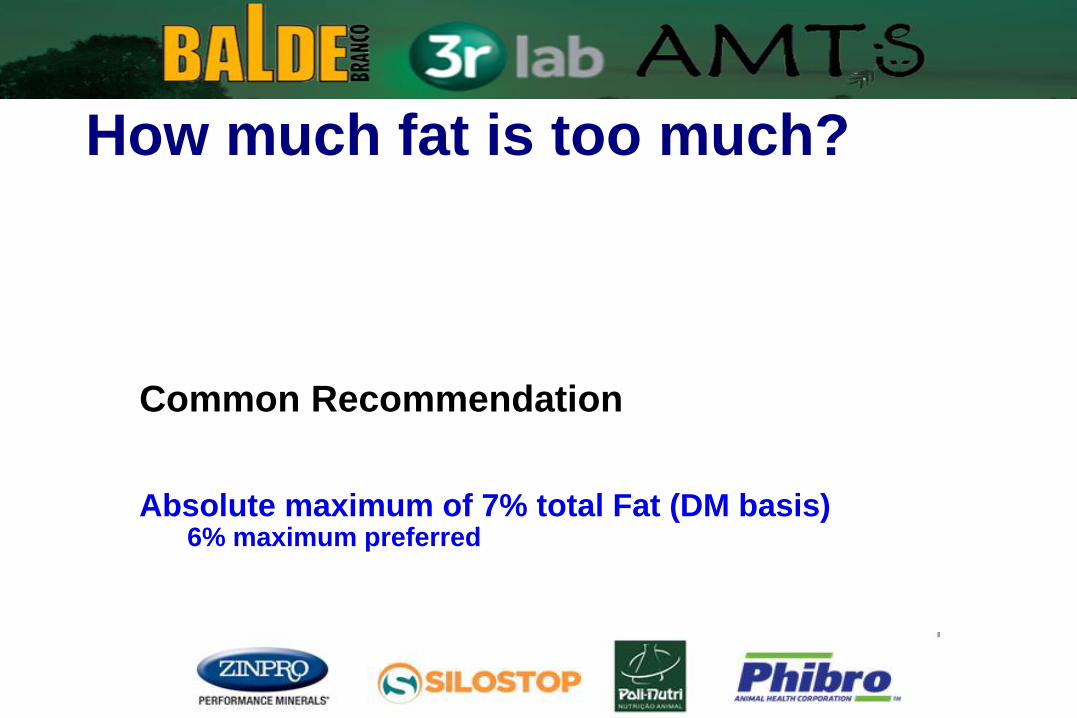
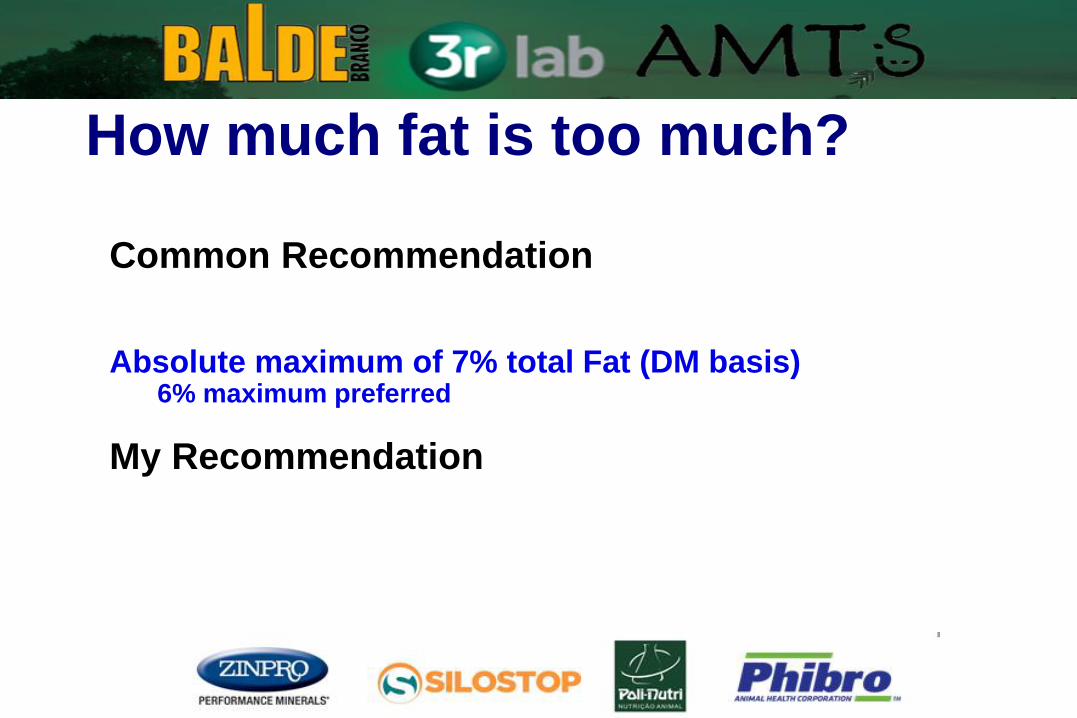
How much fat is too much?
Common Recommendation Absolute maximum of 7% total Fat (DM basis)
6% maximum preferred
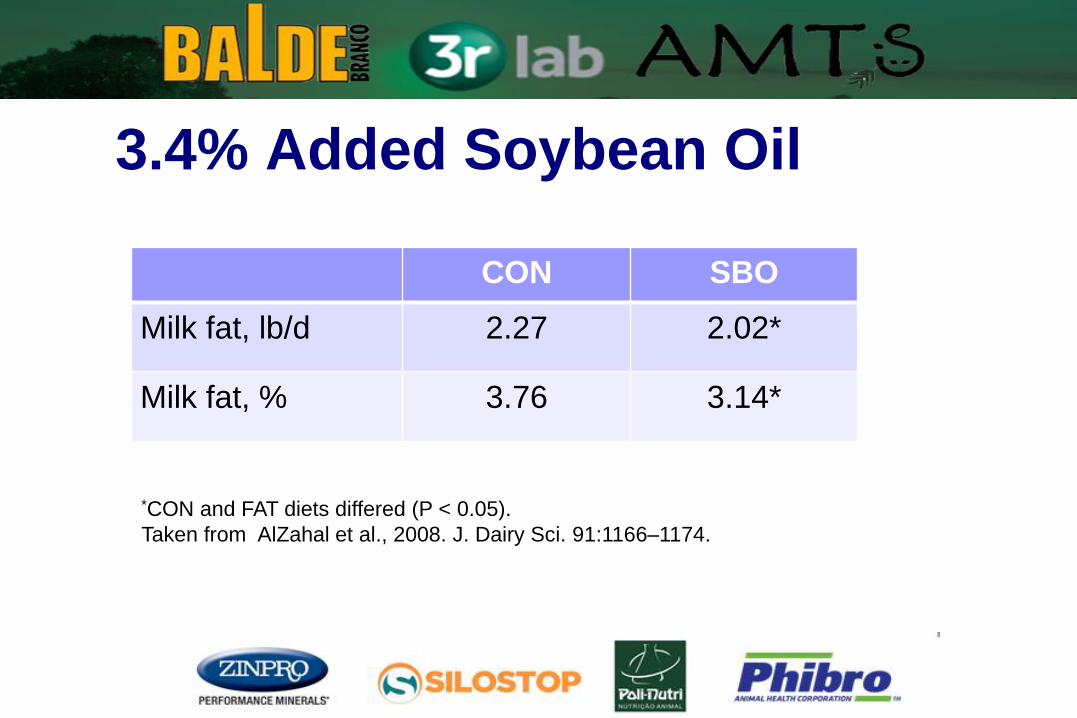
3.4% Added Soybean Oil
CON SBO
Milk fat, lb/d 2.27 2.02*
Milk fat, % 3.76 3.14*
*CON and FAT diets differed (P < 0.05).
Taken from AlZahal et al., 2008. J. Dairy Sci. 91:1166–1174.
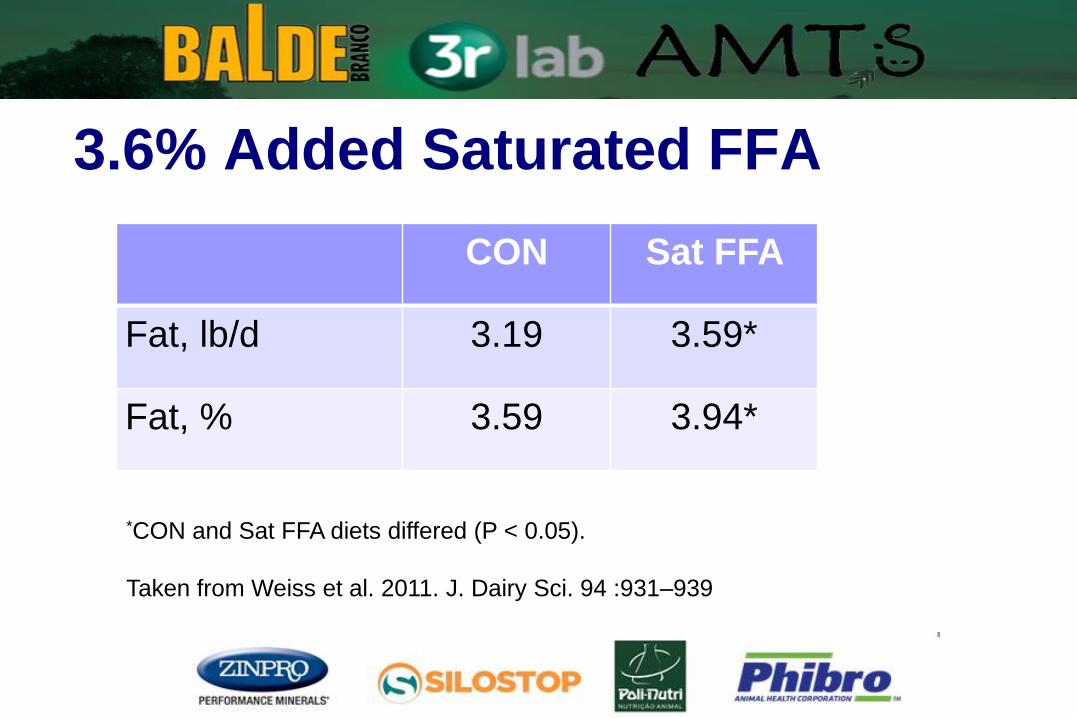
3.6% Added Saturated FFA
CON Sat FFA
Fat, lb/d 3.19 3.59*
Fat, % 3.59 3.94*
*CON and Sat FFA diets differed (P < 0.05).
Taken from Weiss et al. 2011. J. Dairy Sci. 94 :931–939
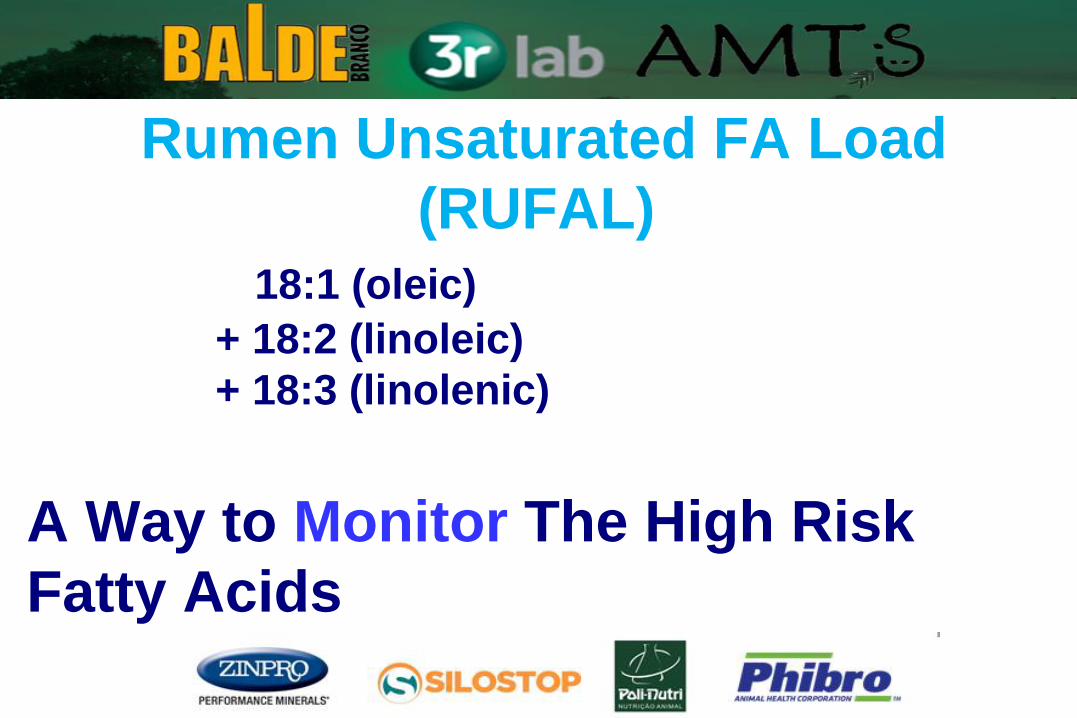
Rumen Unsaturated FA Load
(RUFAL)
18:1 (oleic)
+ 18:2 (linoleic)
+ 18:3 (linolenic)
A Way to Monitor The High Risk
Fatty Acids
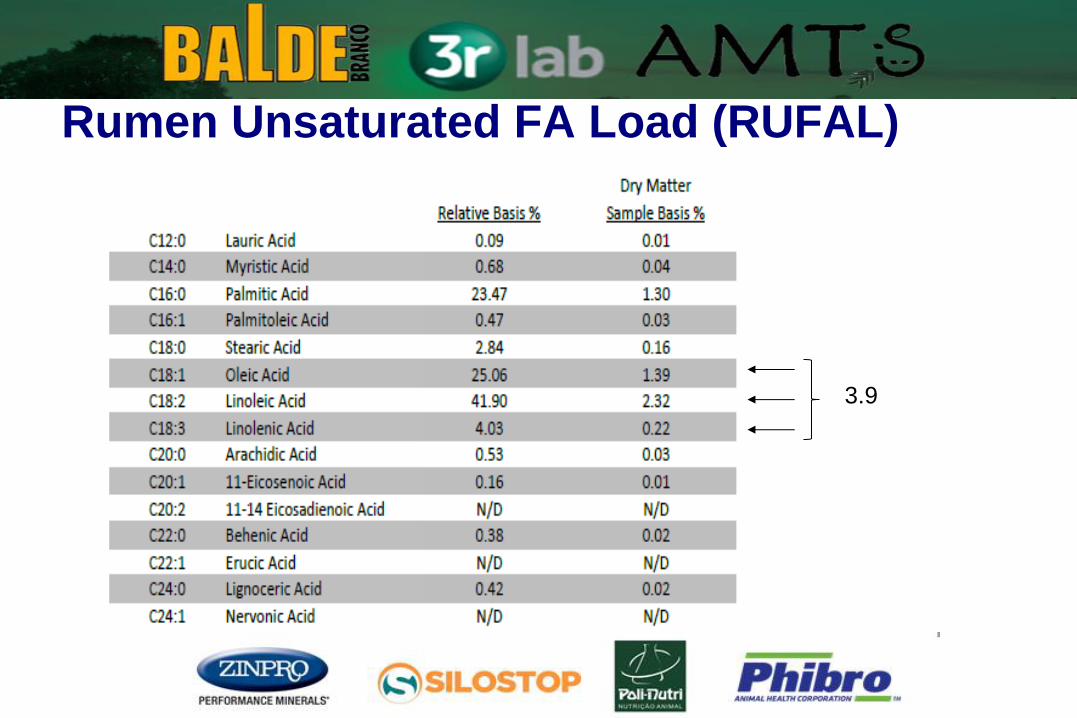
Rumen Unsaturated FA Load (RUFAL)
3.9
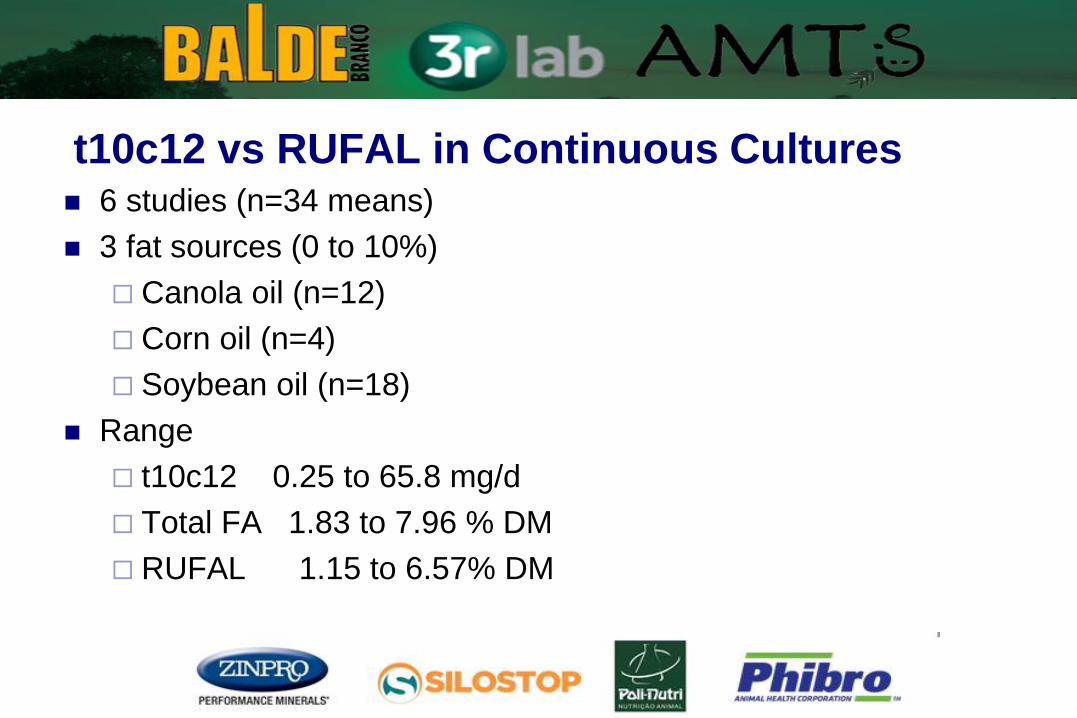
t10c12 vs RUFAL in Continuous Cultures 6 studies (n=34 means)
3 fat sources (0 to 10%)
Canola oil (n=12)
Corn oil (n=4)
Soybean oil (n=18)
Range
t10c12 0.25 to 65.8 mg/d
Total FA 1.83 to 7.96 % DM
RUFAL 1.15 to 6.57% DM
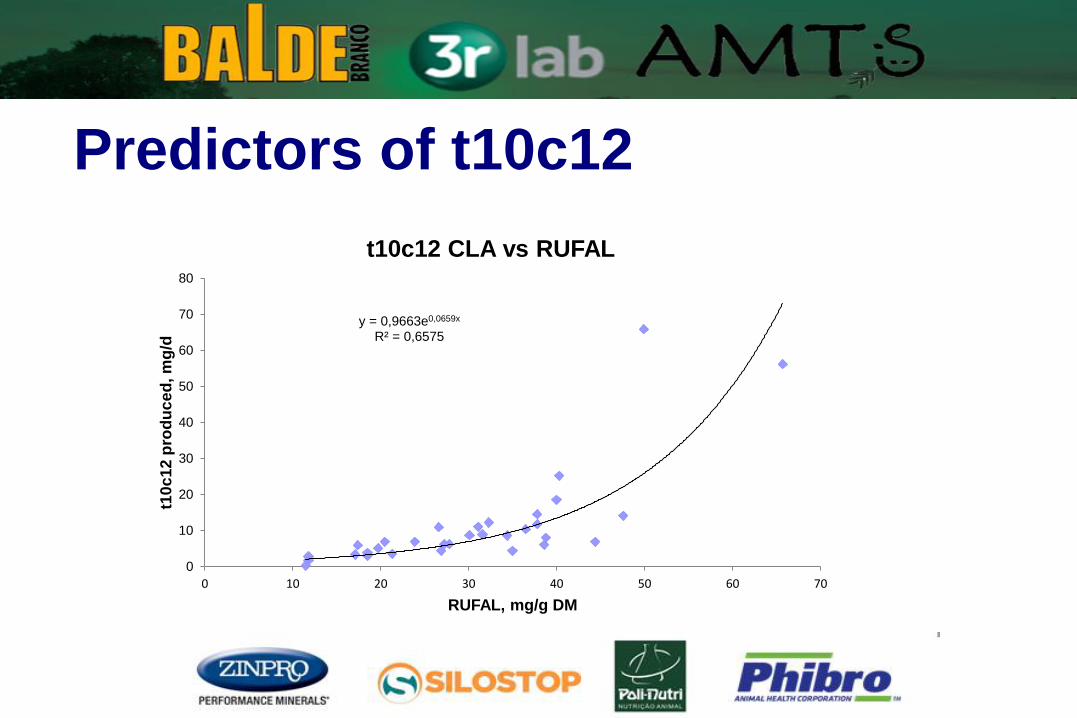
Predictors of t10c12
y = 0,9663e0,0659x R² = 0,6575
0
10
20
30
40
50
60
70
80
0 10 20 30 40 50 60 70
t10
c1
2 p
rod
uc
ed
, m
g/d
RUFAL, mg/g DM
t10c12 CLA vs RUFAL
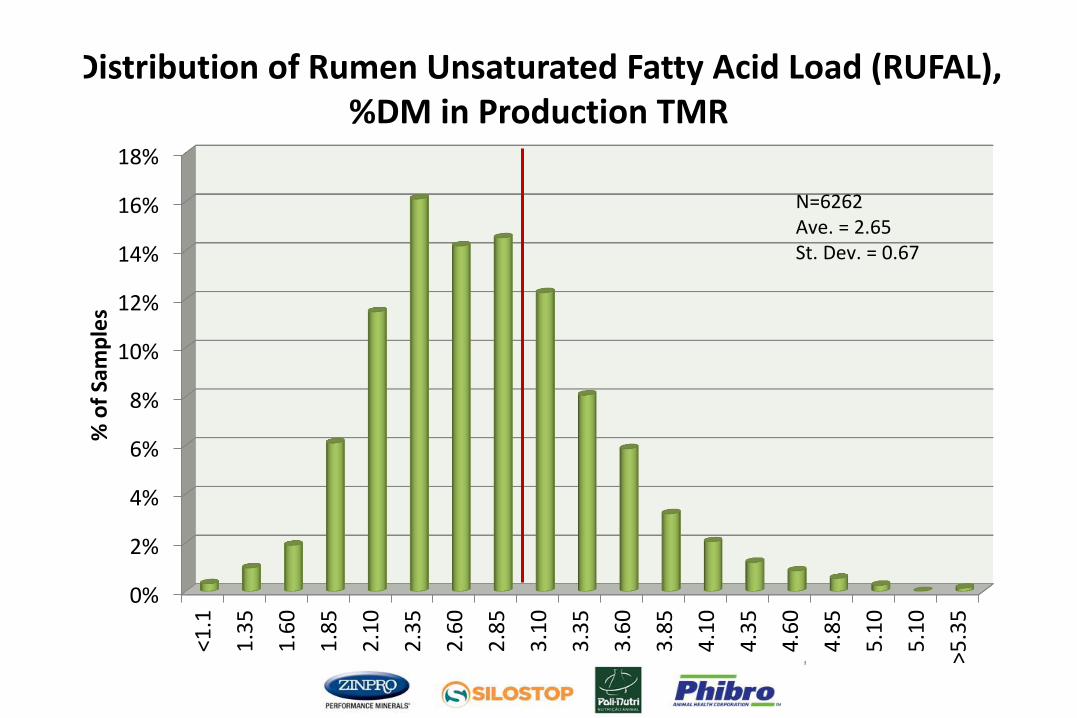
Distribution of Rumen Unsaturated Fatty Acid Load (RUFAL), %DM in Production TMR
0%
2%
4%
6%
8%
10%
12%
14%
16%
18%
<1.1
1.3
5
1.6
0
1.8
5
2.1
0
2.3
5
2.6
0
2.8
5
3.1
0
3.3
5
3.6
0
3.8
5
4.1
0
4.3
5
4.6
0
4.8
5
5.1
0
5.1
0
>5.3
5
% o
f Sa
mp
les
RUFAL, %DM
N=6262 Ave. = 2.65 St. Dev. = 0.67
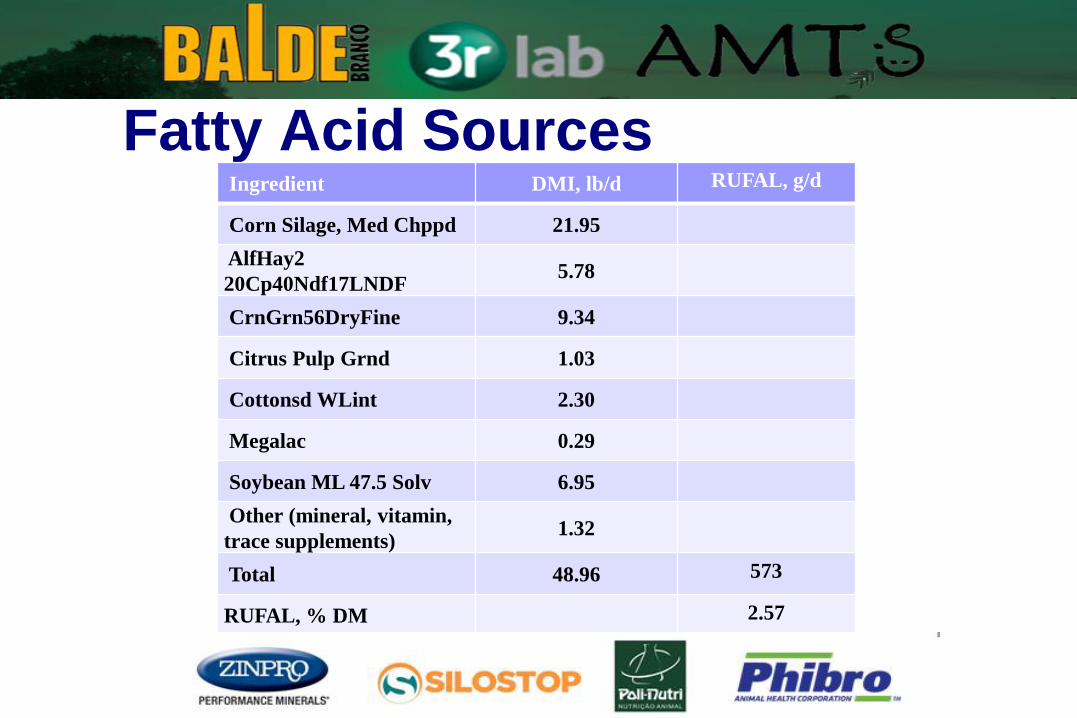
Fatty Acid Sources Ingredient DMI, lb/d RUFAL, g/d
Corn Silage, Med Chppd 21.95
AlfHay2
20Cp40Ndf17LNDF 5.78
CrnGrn56DryFine 9.34
Citrus Pulp Grnd 1.03
Cottonsd WLint 2.30
Megalac 0.29
Soybean ML 47.5 Solv 6.95
Other (mineral, vitamin,
trace supplements) 1.32
Total 48.96 573
RUFAL, % DM 2.57
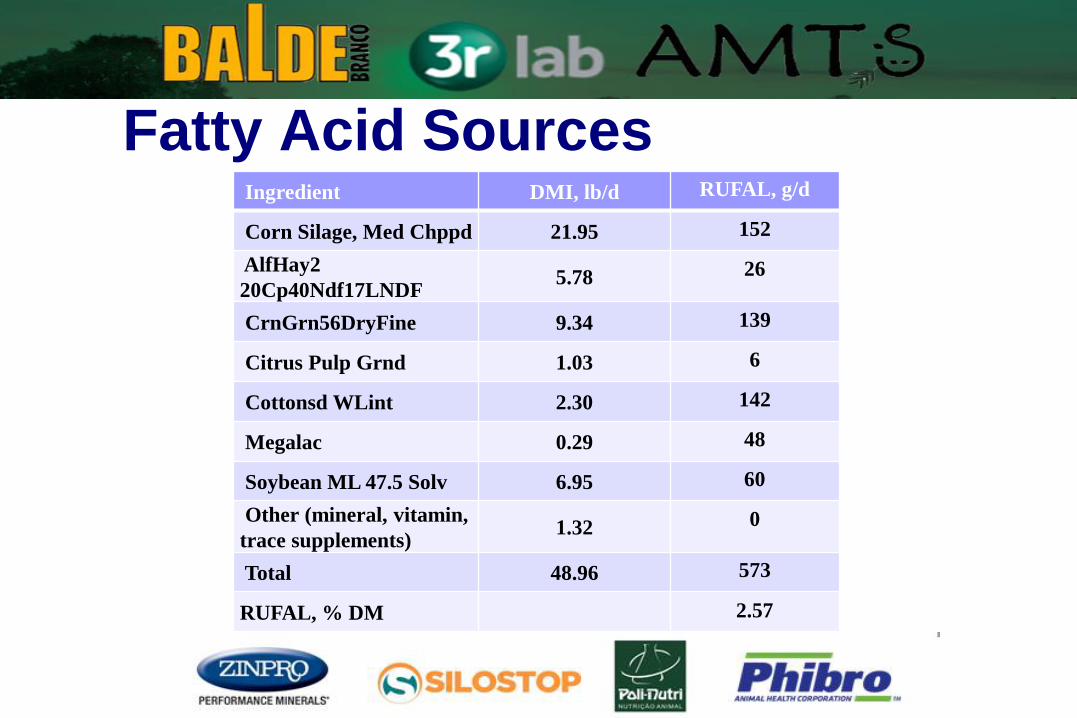
Fatty Acid Sources Ingredient DMI, lb/d RUFAL, g/d
Corn Silage, Med Chppd 21.95 152
AlfHay2
20Cp40Ndf17LNDF 5.78 26
CrnGrn56DryFine 9.34 139
Citrus Pulp Grnd 1.03 6
Cottonsd WLint 2.30 142
Megalac 0.29 48
Soybean ML 47.5 Solv 6.95 60
Other (mineral, vitamin,
trace supplements) 1.32 0
Total 48.96 573
RUFAL, % DM 2.57
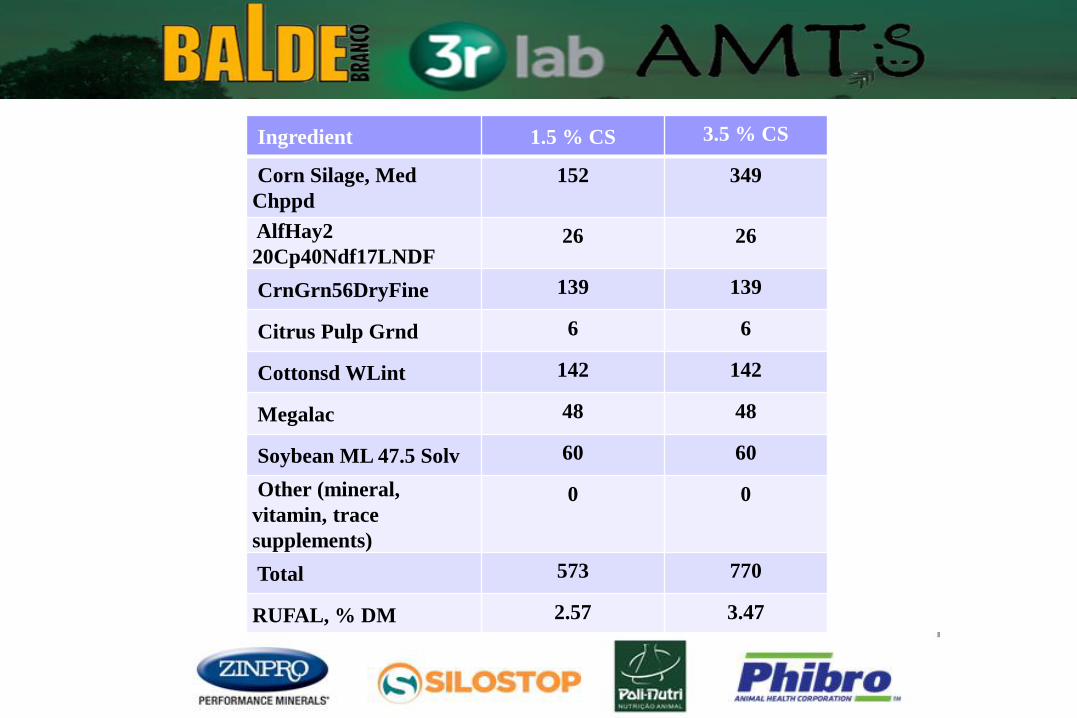
Ingredient 1.5 % CS 3.5 % CS
Corn Silage, Med
Chppd
152 349
AlfHay2
20Cp40Ndf17LNDF 26 26
CrnGrn56DryFine 139 139
Citrus Pulp Grnd 6 6
Cottonsd WLint 142 142
Megalac 48 48
Soybean ML 47.5 Solv 60 60
Other (mineral,
vitamin, trace
supplements)
0 0
Total 573 770
RUFAL, % DM 2.57 3.47
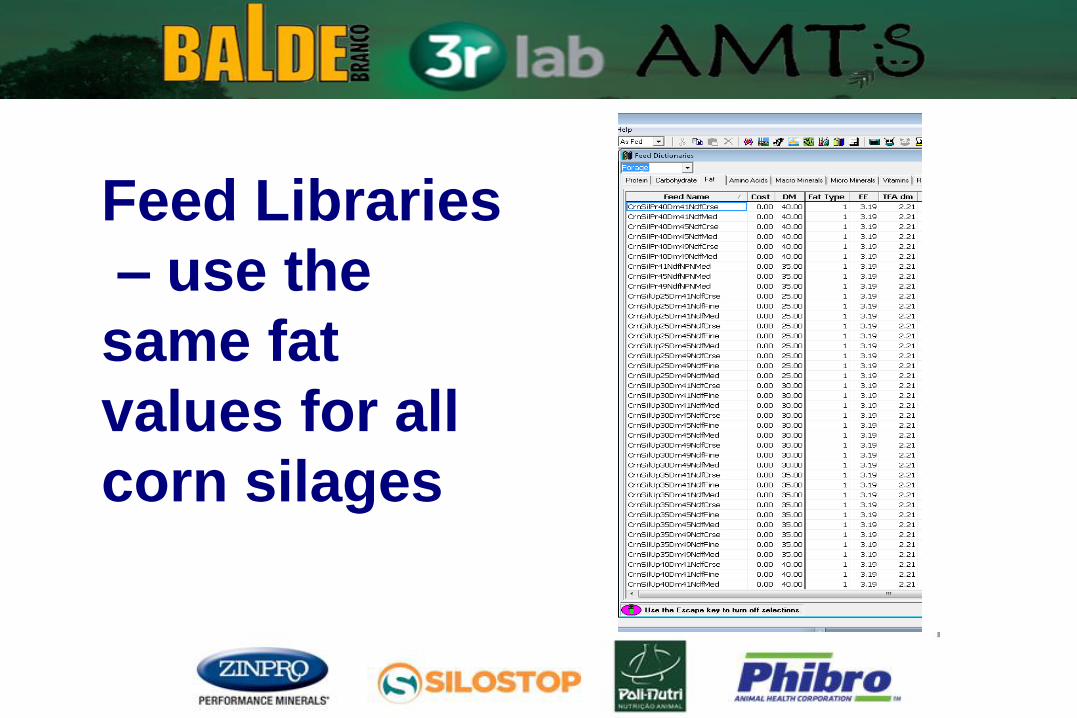
Feed Libraries
– use the
same fat
values for all
corn silages
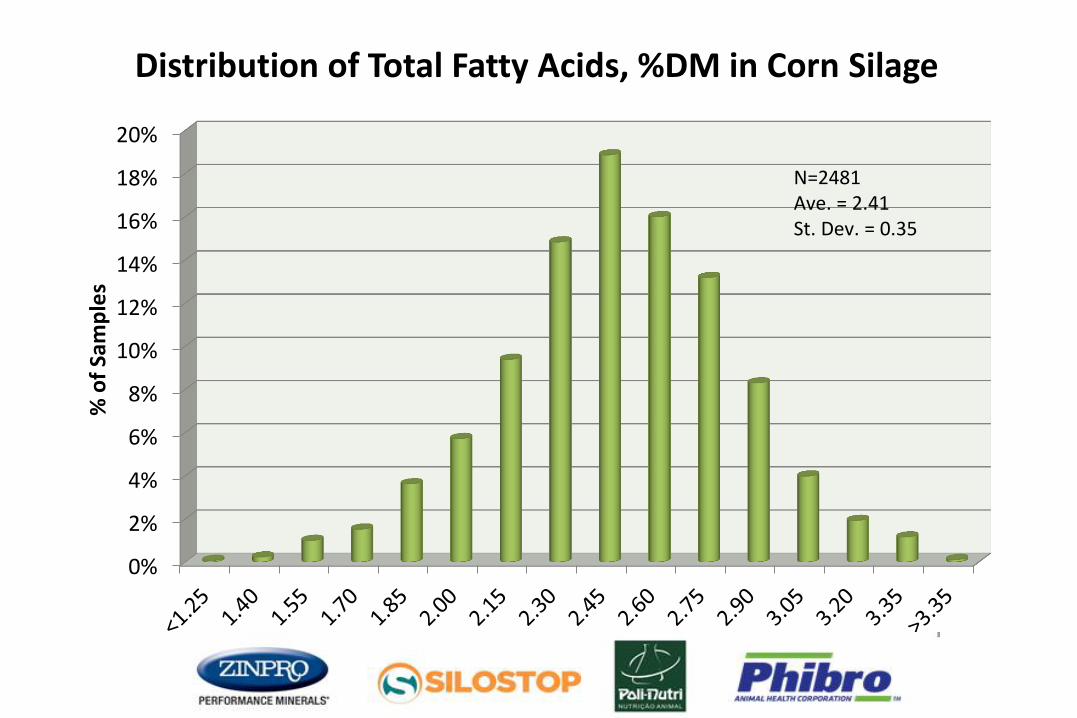
Distribution of Total Fatty Acids, %DM in Corn Silage
0%
2%
4%
6%
8%
10%
12%
14%
16%
18%
20%
% o
f Sa
mp
les
Total Fatty Acids, %DM
N=2481 Ave. = 2.41 St. Dev. = 0.35
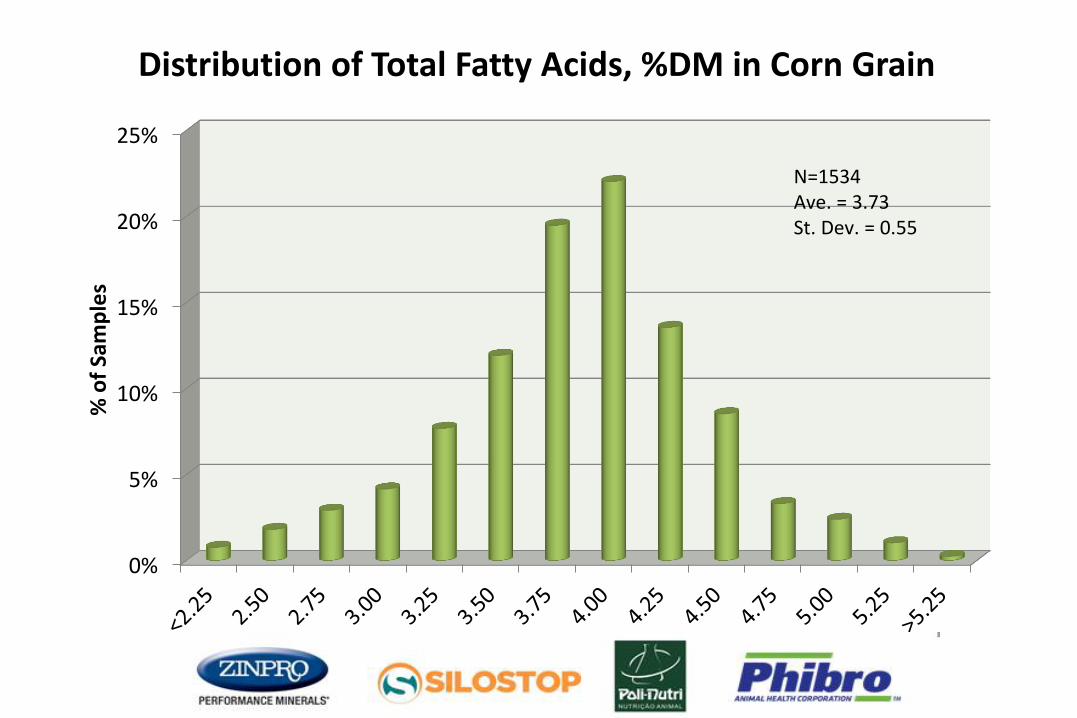
Distribution of Total Fatty Acids, %DM in Corn Grain
0%
5%
10%
15%
20%
25%
% o
f Sa
mp
les
Total Fatty Acids, %DM
N=1534 Ave. = 3.73 St. Dev. = 0.55
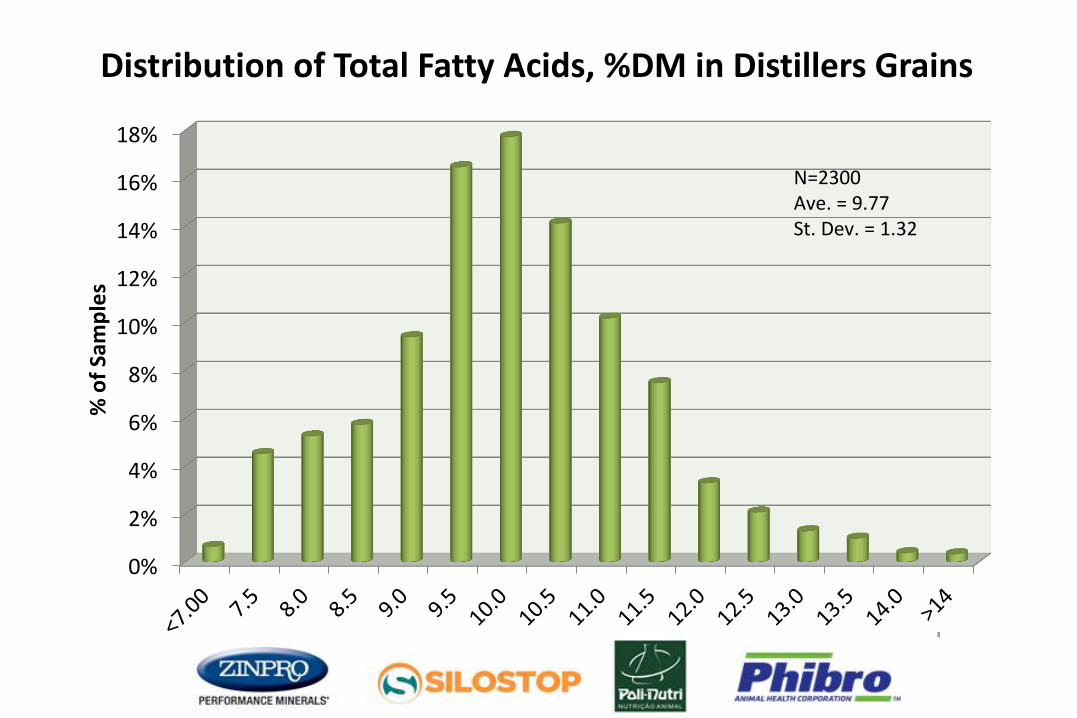
Distribution of Total Fatty Acids, %DM in Distillers Grains
0%
2%
4%
6%
8%
10%
12%
14%
16%
18%
% o
f Sa
mp
les
Total Fatty Acids, %DM
N=2300 Ave. = 9.77 St. Dev. = 1.32
RUFAL Risk Influenced by Other
Dietary Factors
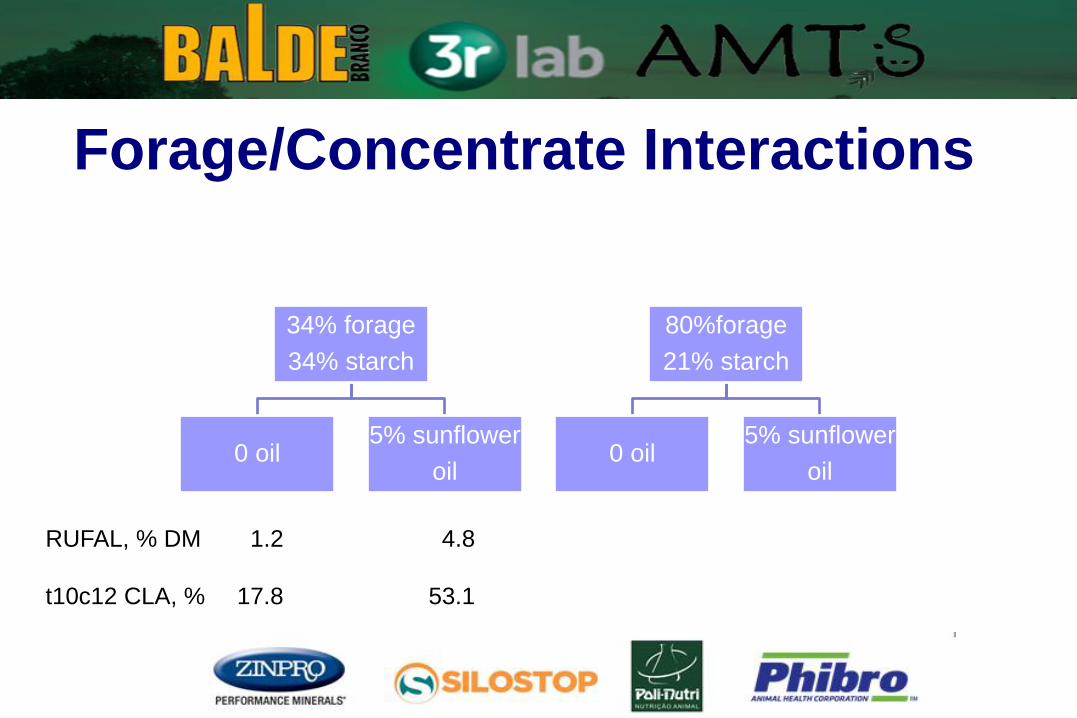
Forage/Concentrate Interactions
34% forage
34% starch
0 oil 5% sunflower
oil
80%forage
21% starch
0 oil 5% sunflower
oil
RUFAL, % DM 1.2 4.8
t10c12 CLA, % 17.8 53.1

Forage/Concentrate Interactions
34% forage
34% starch
0 oil 5% sunflower
oil
80% forage
21% starch
0 oil 5% sunflower
oil
RUFAL, % DM 1.2 4.8 1.2 4.8
t10c12 CLA, % 17.8 53.1 5.3 2.8
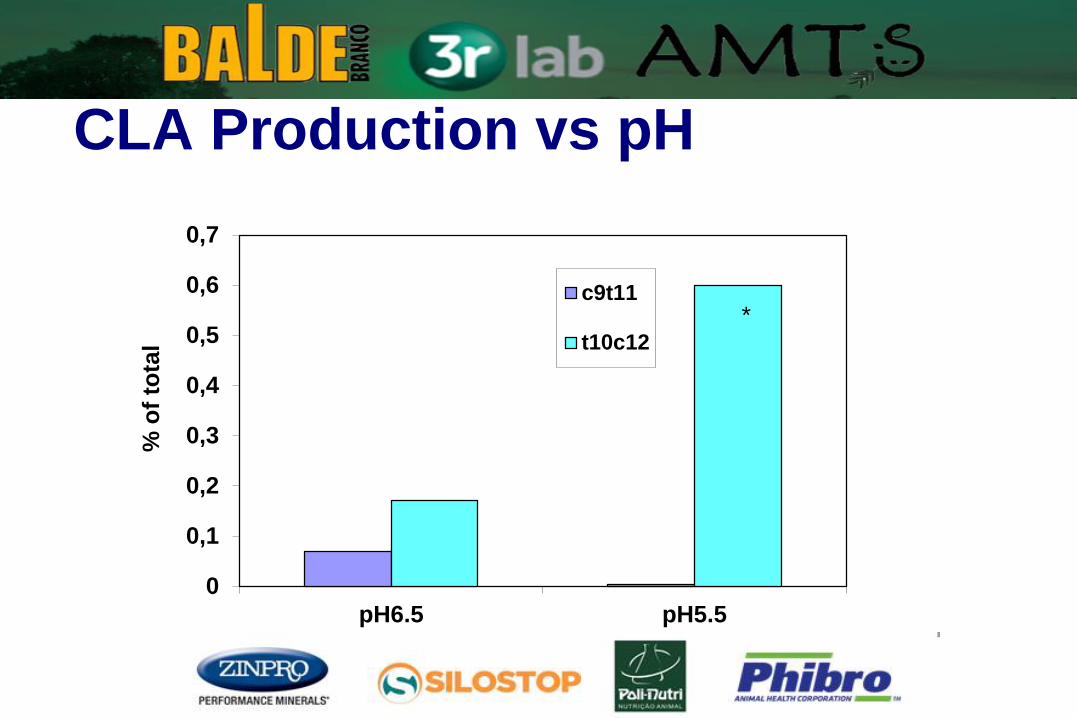
0
0,1
0,2
0,3
0,4
0,5
0,6
0,7
pH6.5 pH5.5
% o
f to
tal
c9t11
t10c12
CLA Production vs pH
*
Continuous culture data taken from Fuentes et al, 2009.
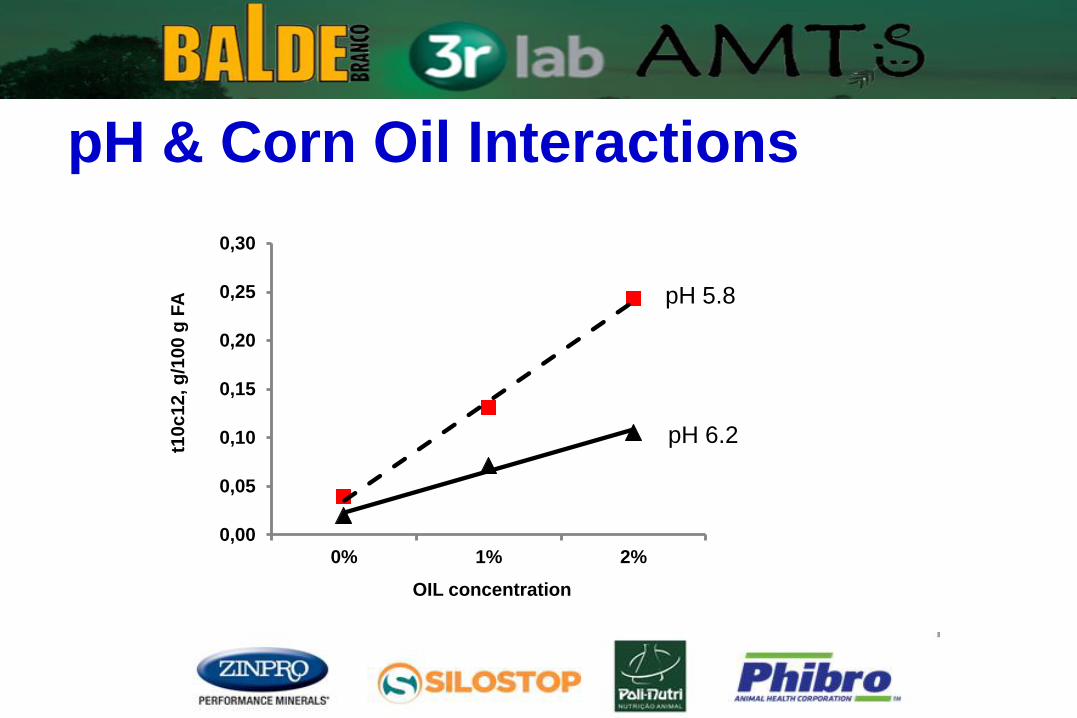
0,00
0,05
0,10
0,15
0,20
0,25
0,30
0% 1% 2%
t10
c1
2, g
/10
0 g
FA
OIL concentration
pH & Corn Oil Interactions
pH 6.2
pH 5.8
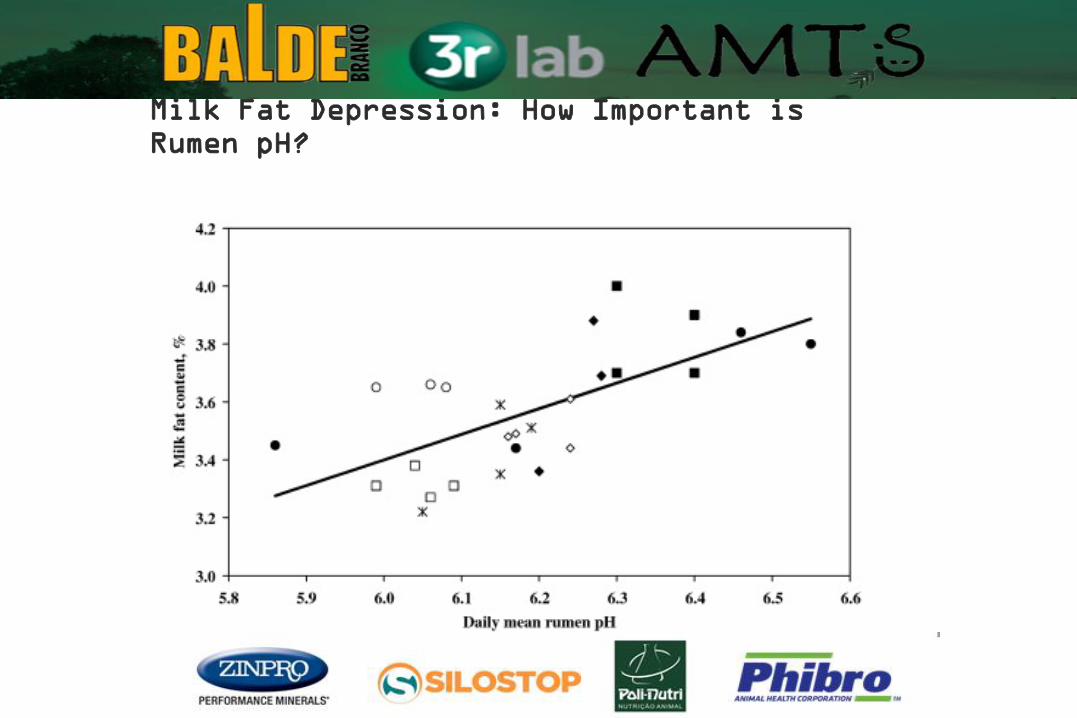
Milk Fat Depression: How Important is
Rumen pH?
Rumen pH vs. Milk Fat
Zebell et al. 2010. Livestock
Science 127:1-10.
How much fat is too much?
Common Recommendation Absolute maximum of 7% total Fat (DM basis)
6% maximum preferred
My Recommendation
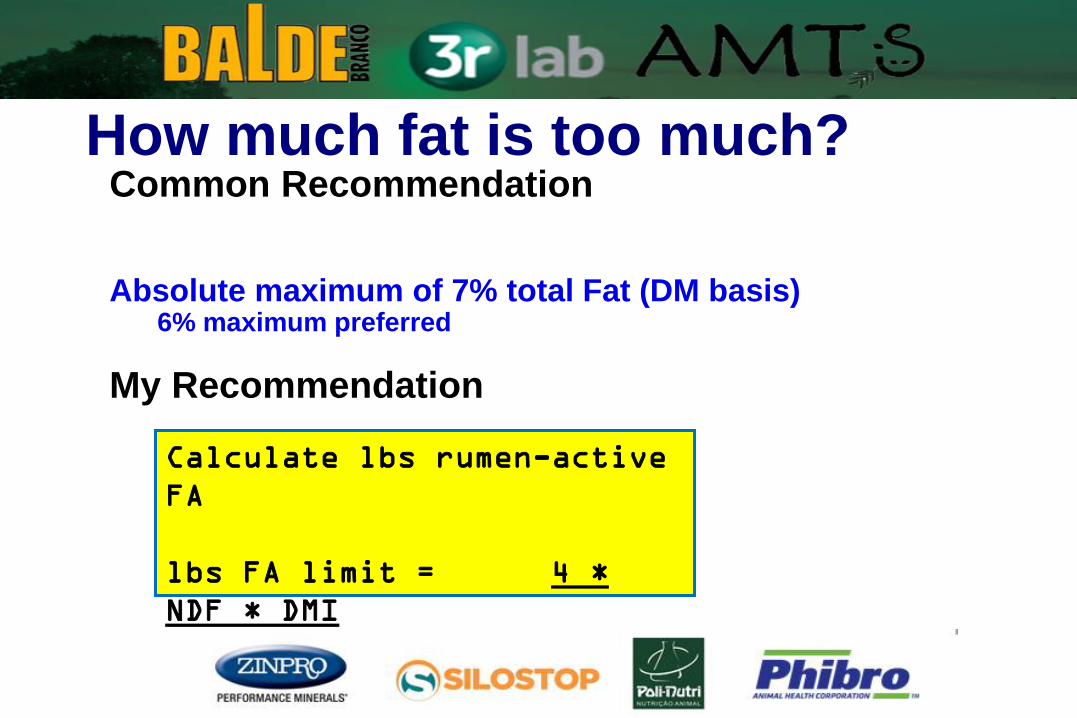
How much fat is too much? Common Recommendation
Absolute maximum of 7% total Fat (DM basis)
6% maximum preferred
My Recommendation
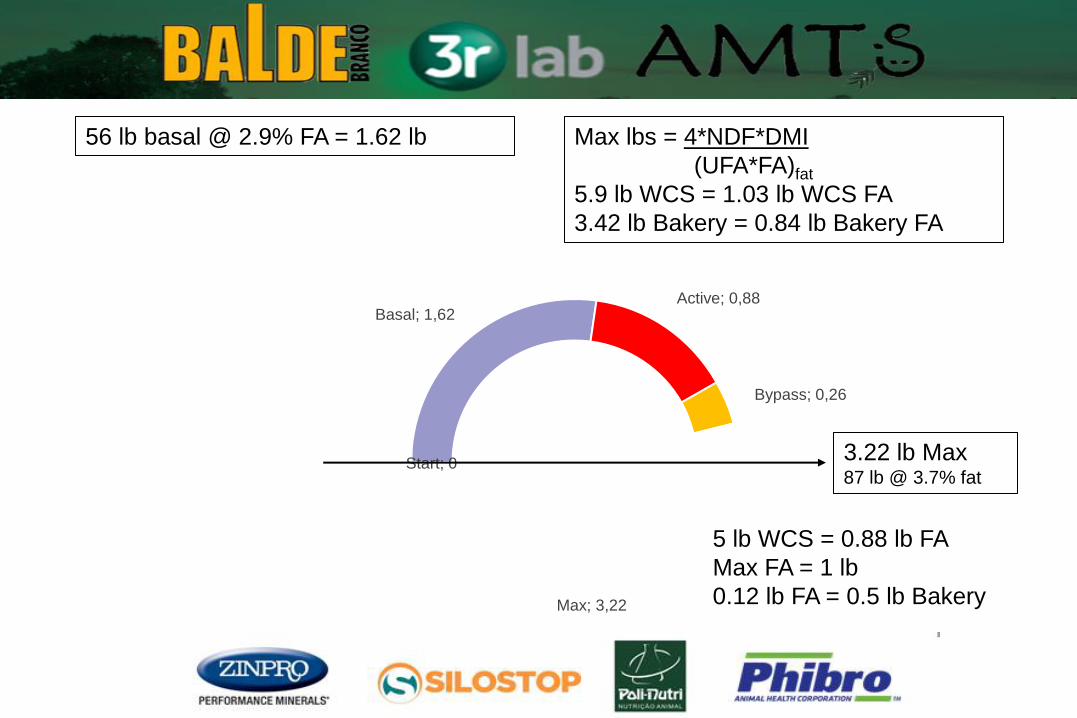
Calculate lbs rumen-active
FA
lbs FA limit = 4 *
NDF * DMI
(UFA*FA)fat
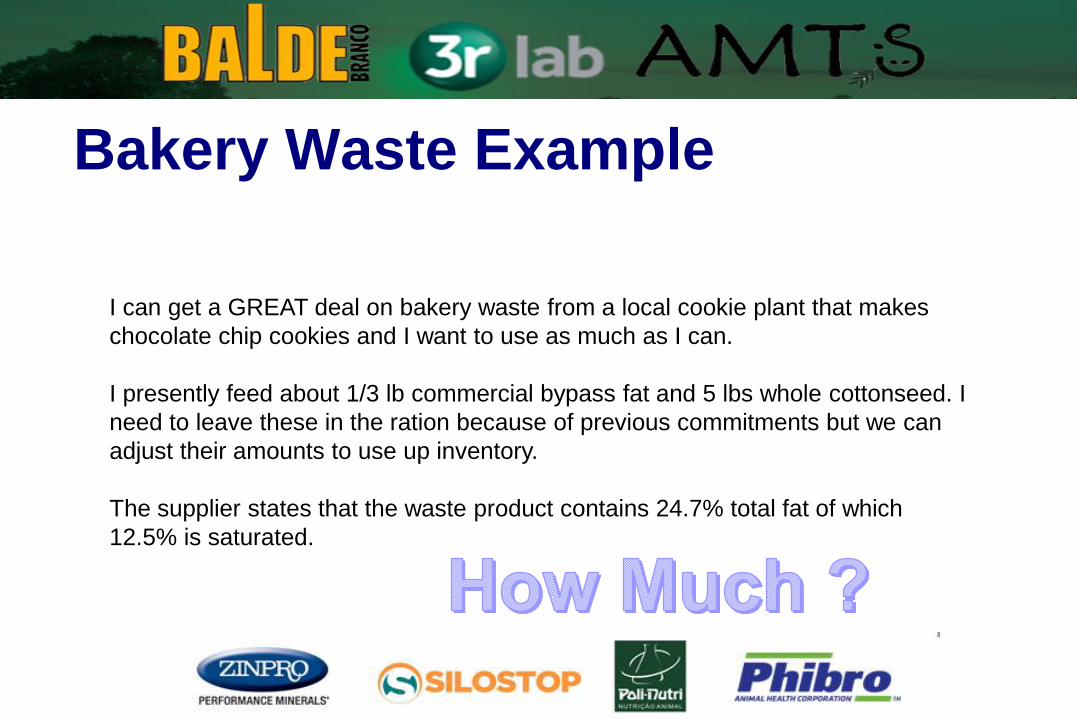
Bakery Waste Example
I can get a GREAT deal on bakery waste from a local cookie plant that makes
chocolate chip cookies and I want to use as much as I can.
I presently feed about 1/3 lb commercial bypass fat and 5 lbs whole cottonseed. I
need to leave these in the ration because of previous commitments but we can
adjust their amounts to use up inventory.
The supplier states that the waste product contains 24.7% total fat of which
12.5% is saturated.
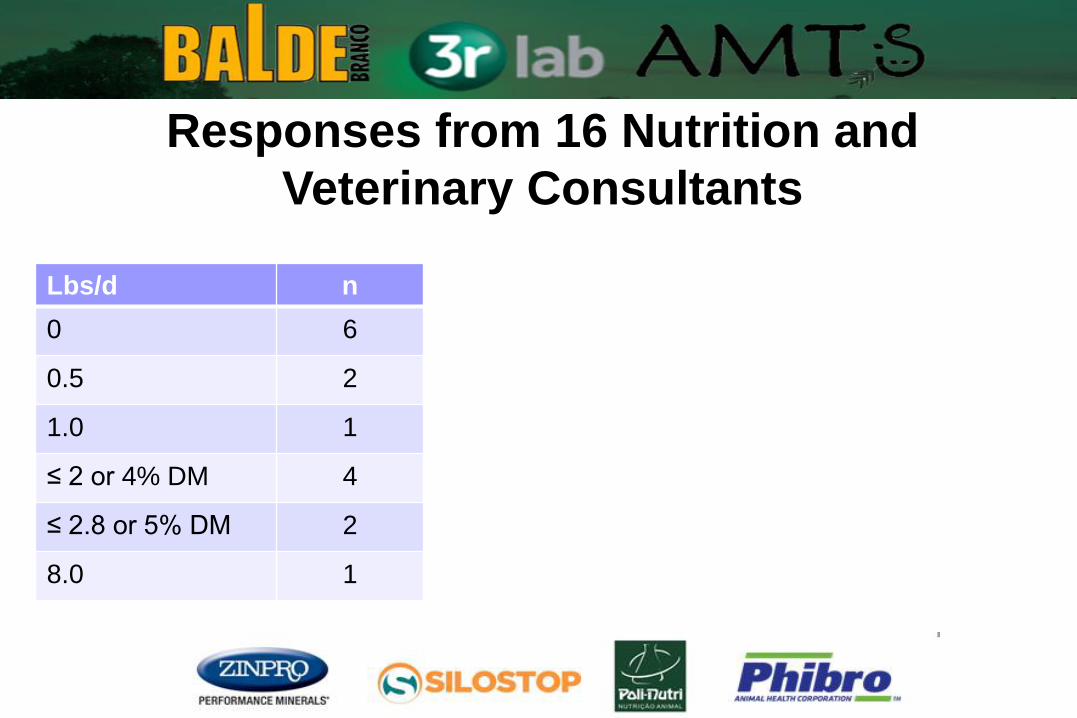
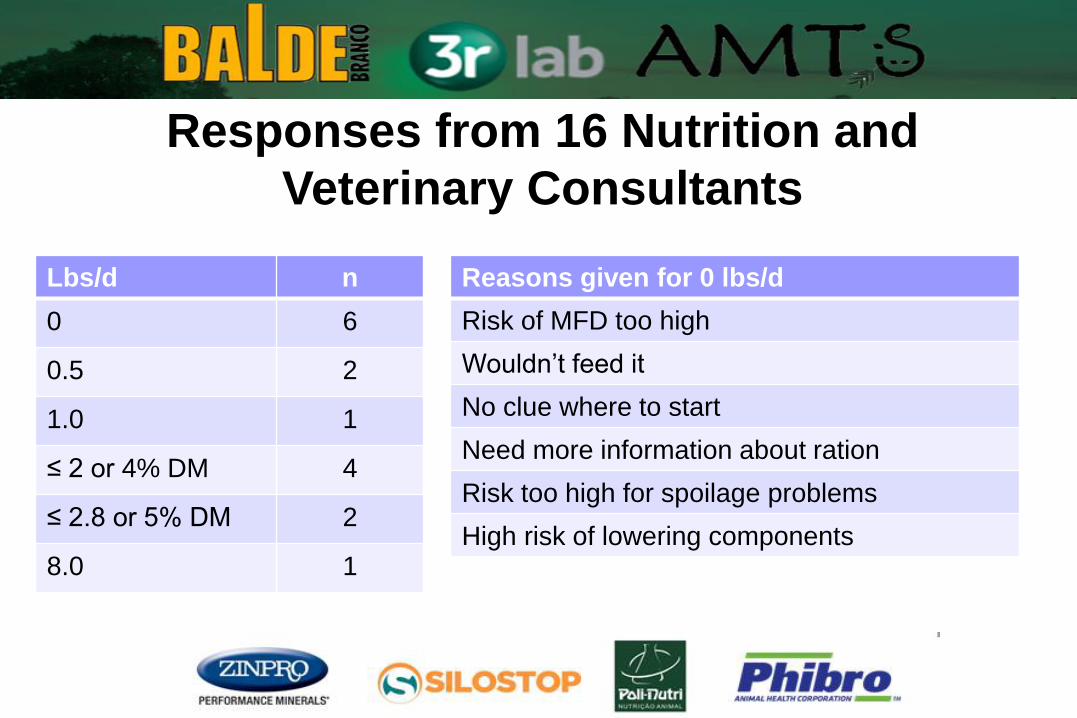
Lbs/d n
0 6
0.5 2
1.0 1
≤ 2 or 4% DM 4
≤ 2.8 or 5% DM 2
8.0 1
Responses from 16 Nutrition and
Veterinary Consultants
Lbs/d n
0 6
0.5 2
1.0 1
≤ 2 or 4% DM 4
≤ 2.8 or 5% DM 2
8.0 1
Reasons given for 0 lbs/d
Risk of MFD too high
Wouldn’t feed it
No clue where to start
Need more information about ration
Risk too high for spoilage problems
High risk of lowering components
Responses from 16 Nutrition and
Veterinary Consultants
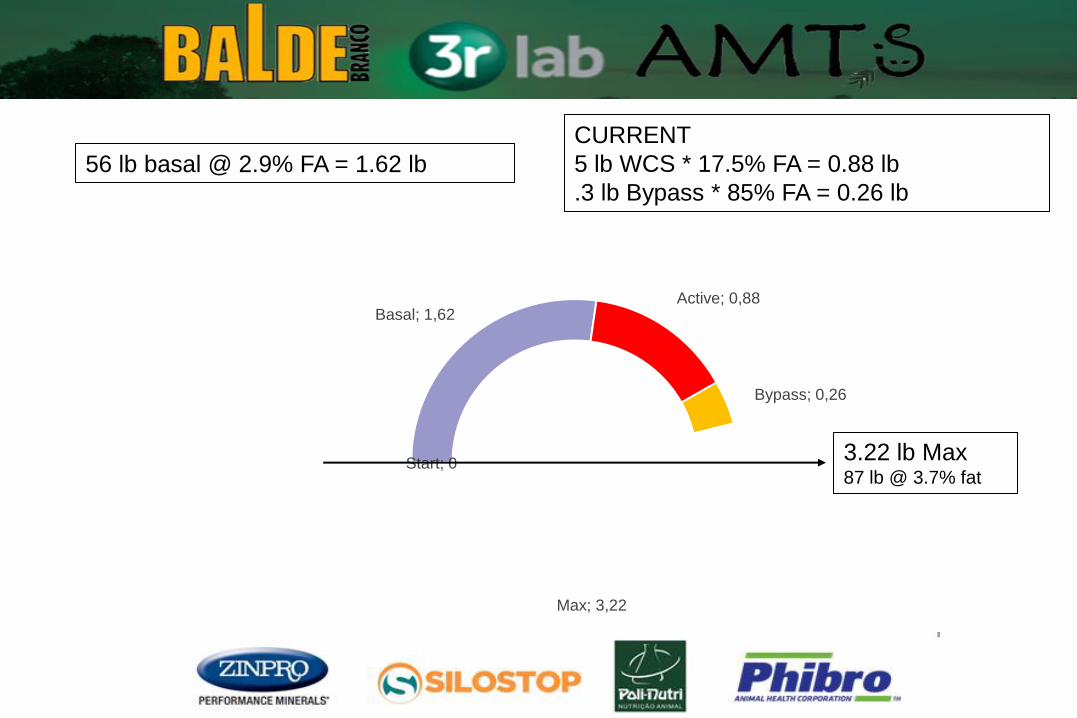
Start; 0
Basal; 1,62 Active; 0,88
Bypass; 0,26
Max; 3,22
3.22 lb Max 87 lb @ 3.7% fat
CURRENT
5 lb WCS * 17.5% FA = 0.88 lb
.3 lb Bypass * 85% FA = 0.26 lb
56 lb basal @ 2.9% FA = 1.62 lb
Start; 0
Basal; 1,62 Active; 0,88
Bypass; 0,26
Max; 3,22
3.22 lb Max 87 lb @ 3.7% fat
Max lbs = 4*NDF*DMI
(UFA*FA)fat
5.9 lb WCS = 1.03 lb WCS FA
3.42 lb Bakery = 0.84 lb Bakery FA
56 lb basal @ 2.9% FA = 1.62 lb
Start; 0
Basal; 1,62 Active; 0,88
Bypass; 0,26
Max; 3,22
3.22 lb Max 87 lb @ 3.7% fat
Max lbs = 4*NDF*DMI
(UFA*FA)fat
5.9 lb WCS = 1.03 lb WCS FA
3.42 lb Bakery = 0.84 lb Bakery FA
56 lb basal @ 2.9% FA = 1.62 lb
5 lb WCS = 0.88 lb FA
Max FA = 1 lb
0.12 lb FA = 0.5 lb Bakery

Fine Tuning!
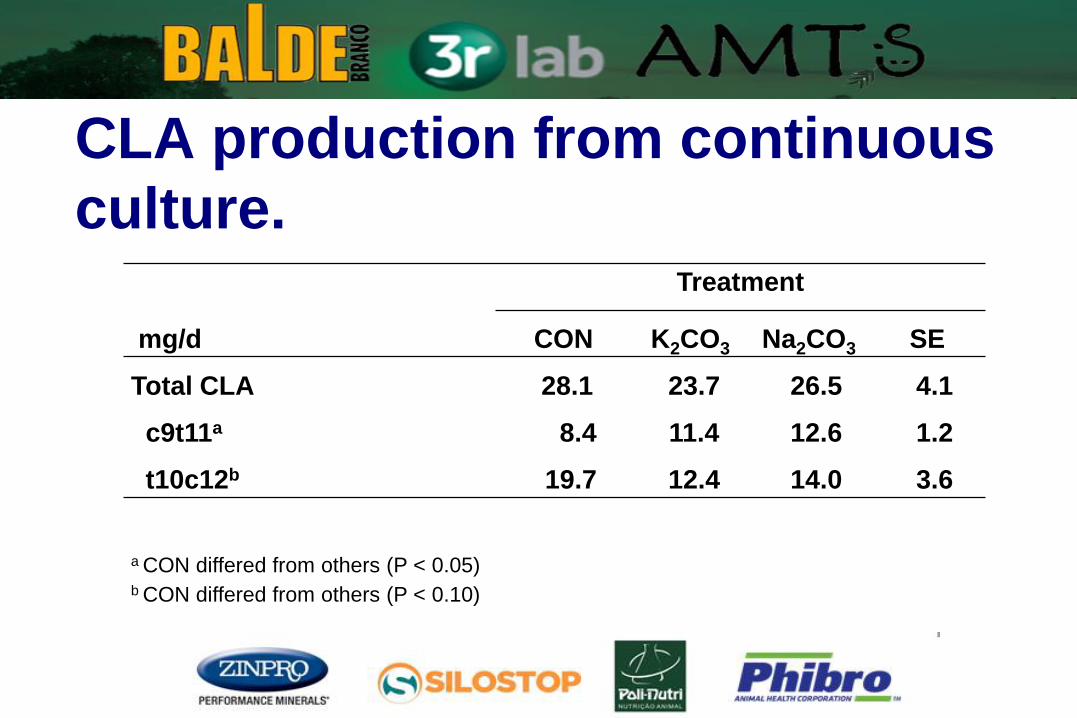
Treatment
mg/d CON K2CO3 Na2CO3 SE
Total CLA 28.1 23.7 26.5 4.1
c9t11a 8.4 11.4 12.6 1.2
t10c12b 19.7 12.4 14.0 3.6
a CON differed from others (P < 0.05) b CON differed from others (P < 0.10)
CLA production from continuous
culture.
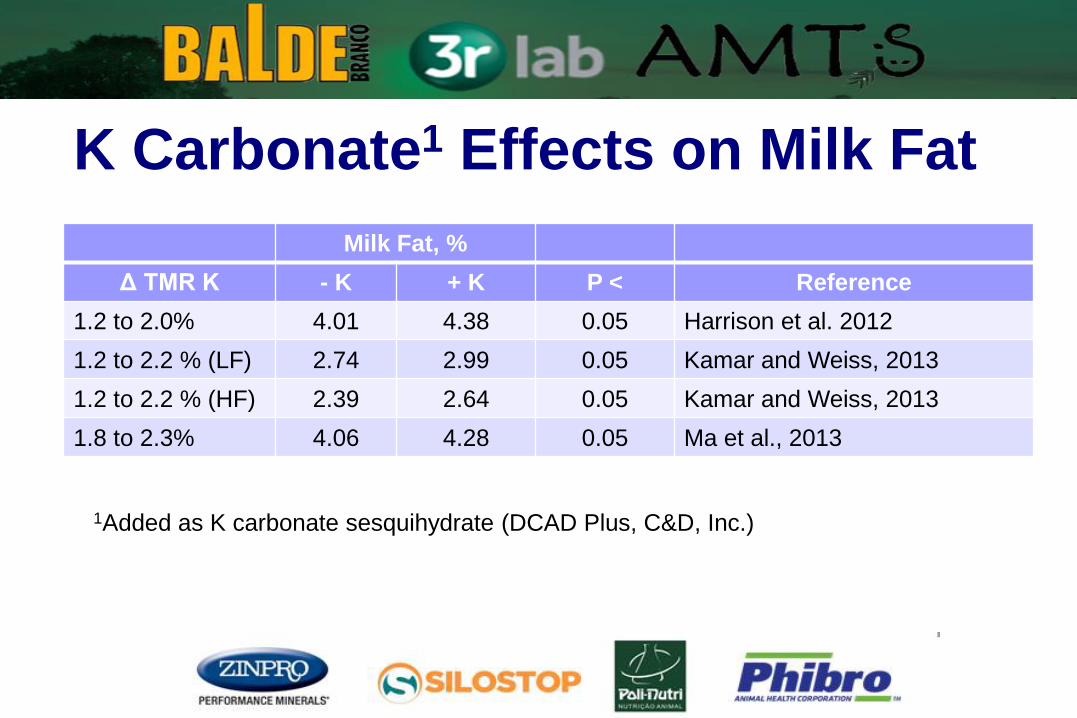
K Carbonate1 Effects on Milk Fat
Milk Fat, %
Δ TMR K - K + K P < Reference
1.2 to 2.0% 4.01 4.38 0.05 Harrison et al. 2012
1.2 to 2.2 % (LF) 2.74 2.99 0.05 Kamar and Weiss, 2013
1.2 to 2.2 % (HF) 2.39 2.64 0.05 Kamar and Weiss, 2013
1.8 to 2.3% 4.06 4.28 0.05 Ma et al., 2013
1Added as K carbonate sesquihydrate (DCAD Plus, C&D, Inc.)
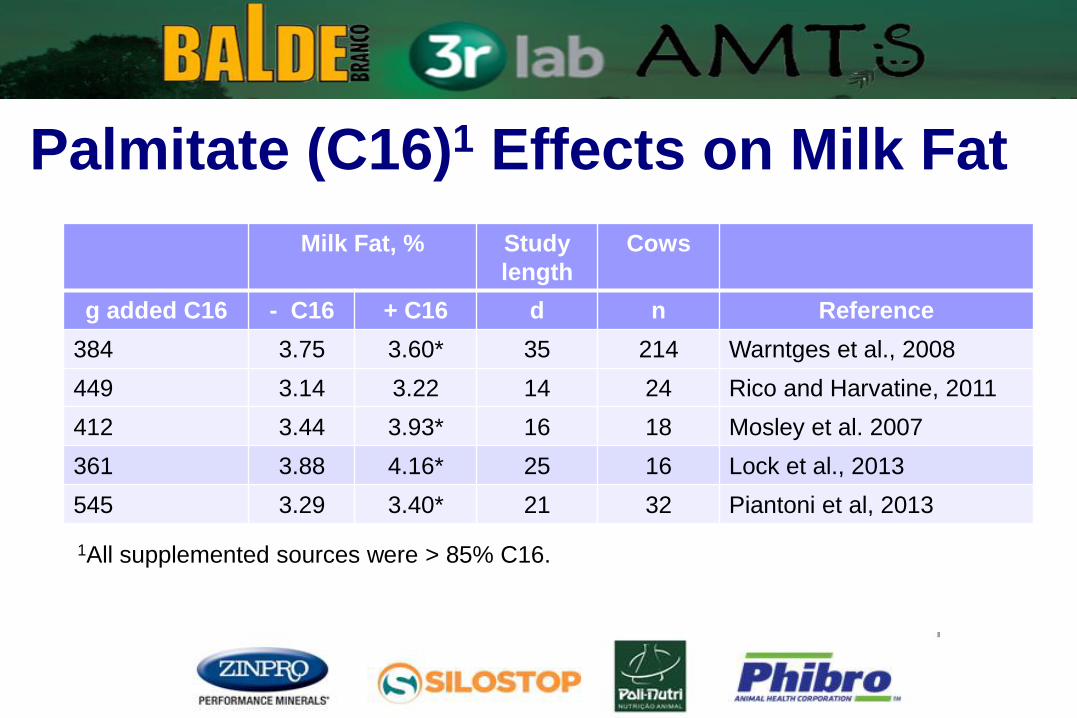
Palmitate (C16)1 Effects on Milk Fat
Milk Fat, % Study
length
Cows
g added C16 - C16 + C16 d n Reference
384 3.75 3.60* 35 214 Warntges et al., 2008
449 3.14 3.22 14 24 Rico and Harvatine, 2011
412 3.44 3.93* 16 18 Mosley et al. 2007
361 3.88 4.16* 25 16 Lock et al., 2013
545 3.29 3.40* 21 32 Piantoni et al, 2013
1All supplemented sources were > 85% C16.
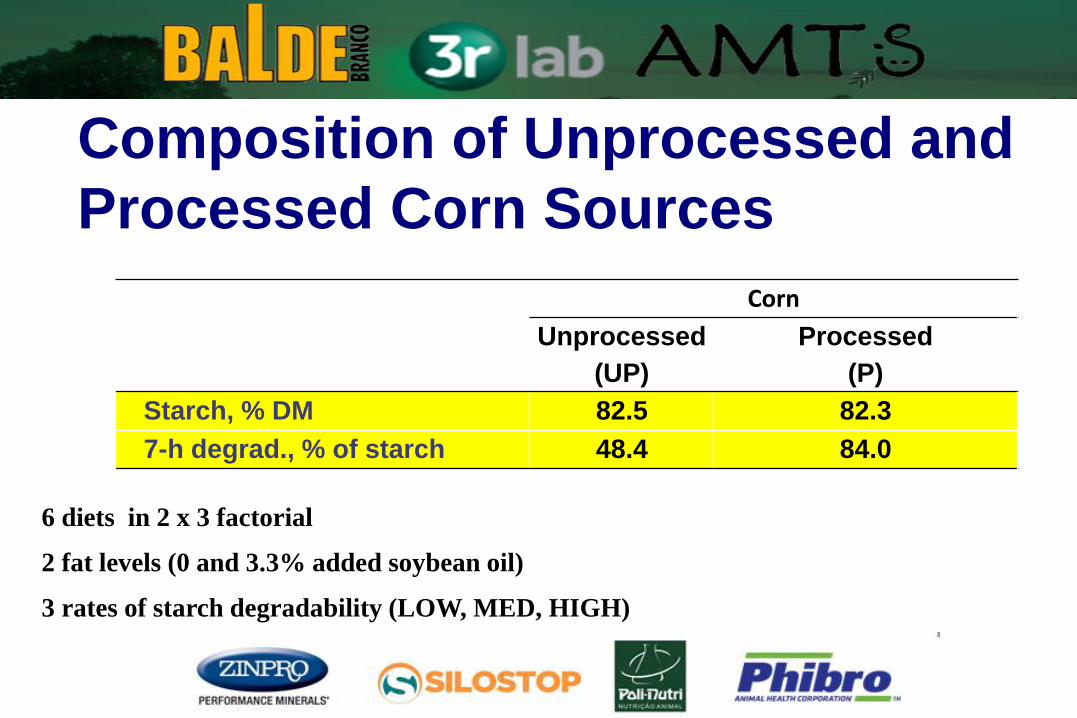
Composition of Unprocessed and
Processed Corn Sources
Corn
Unprocessed
(UP)
Processed
(P)
Starch, % DM 82.5 82.3
7-h degrad., % of starch 48.4 84.0
6 diets in 2 x 3 factorial
2 fat levels (0 and 3.3% added soybean oil)
3 rates of starch degradability (LOW, MED, HIGH)
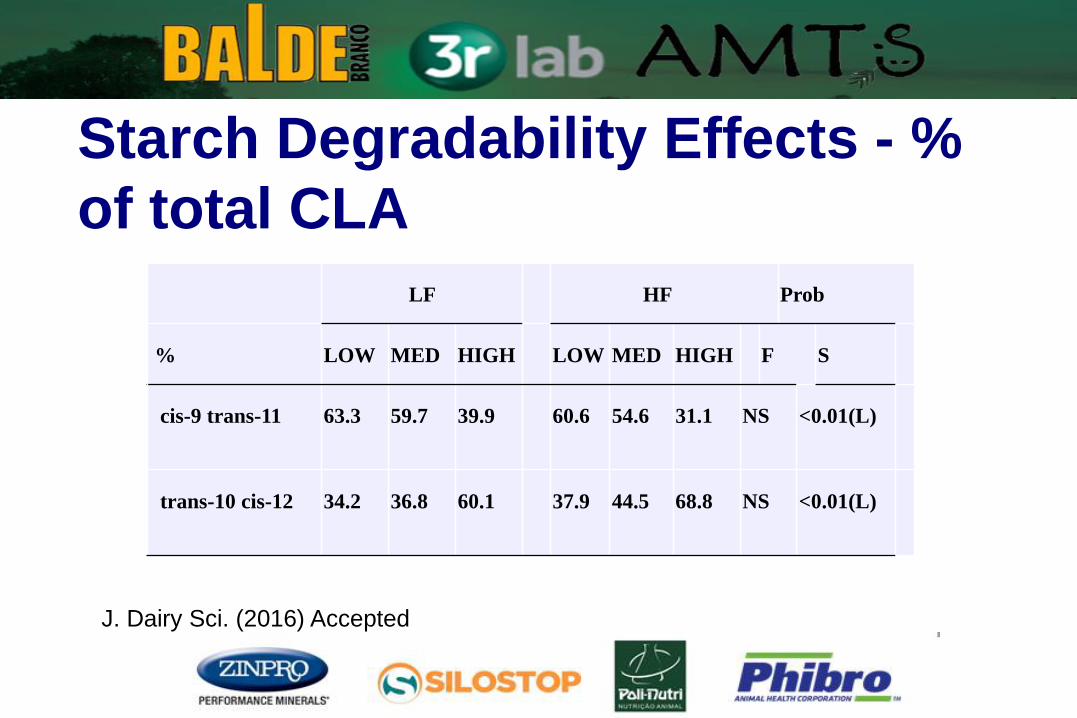
Starch Degradability Effects - %
of total CLA
LF HF Prob
% LOW MED HIGH LOW MED HIGH F S
cis-9 trans-11 63.3 59.7 39.9 60.6 54.6 31.1 NS <0.01(L)
trans-10 cis-12 34.2 36.8 60.1 37.9 44.5 68.8 NS <0.01(L)
J. Dairy Sci. (2016) Accepted
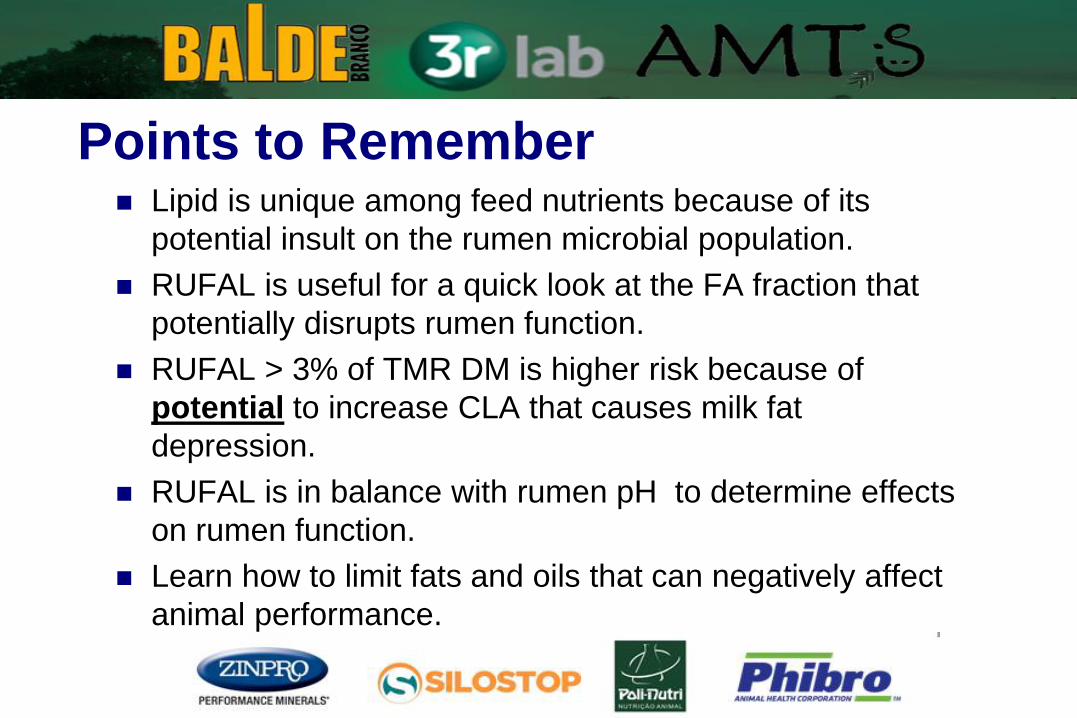
Points to Remember Lipid is unique among feed nutrients because of its
potential insult on the rumen microbial population.
RUFAL is useful for a quick look at the FA fraction that
potentially disrupts rumen function.
RUFAL > 3% of TMR DM is higher risk because of
potential to increase CLA that causes milk fat
depression.
RUFAL is in balance with rumen pH to determine effects
on rumen function.
Learn how to limit fats and oils that can negatively affect
animal performance.
Thank You!!!
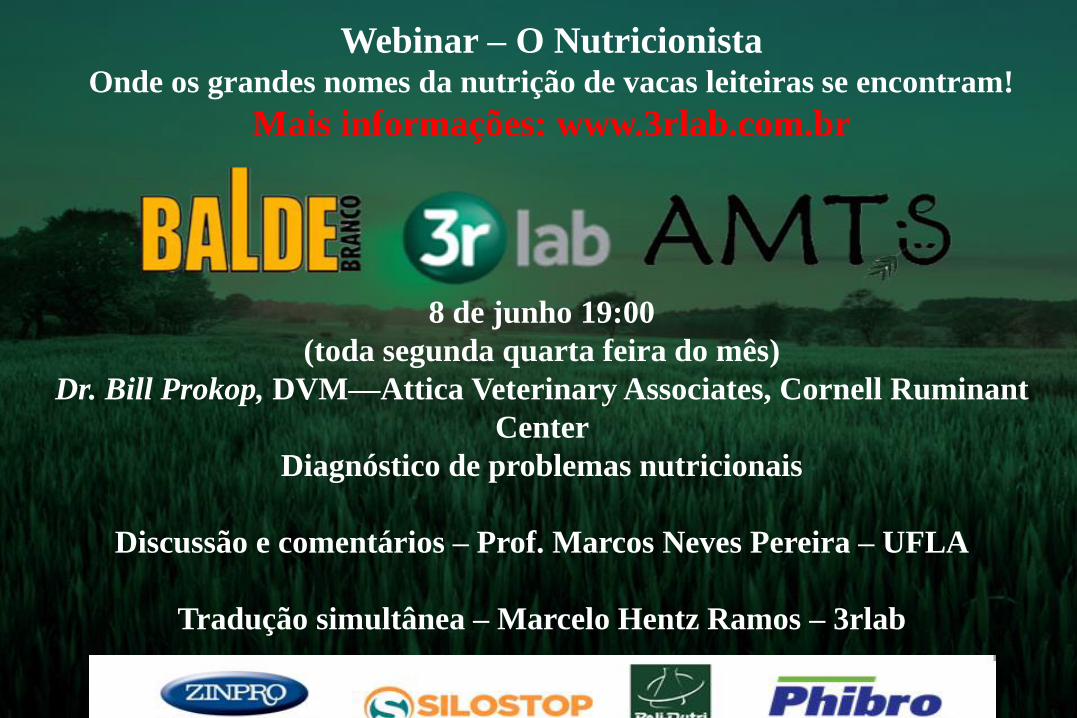
8 de junho 19:00
(toda segunda quarta feira do mês)
Dr. Bill Prokop, DVM—Attica Veterinary Associates, Cornell Ruminant
Center
Diagnóstico de problemas nutricionais
Discussão e comentários – Prof. Marcos Neves Pereira – UFLA
Tradução simultânea – Marcelo Hentz Ramos – 3rlab
Webinar – O Nutricionista Onde os grandes nomes da nutrição de vacas leiteiras se encontram!
Mais informações: www.3rlab.com.br

Sua empresa pode ser parceira no próximo Webinar. Ajude-nos a
trazer aos nutricionistas Brasileiros o que existe de mais novo em
nutrição de vacas leiteiras no mundo.

Cadastre-se nos nossos meios de comunicação para
receber os slides em português e o Webinar gravado:
http://3rlab.wordpress.com/
https://www.facebook.com/3rlab
Excelente material para treinamento de equipes/grupos de
estudos