Embed Size (px)
Citation preview
Analysts: Zachary Haller,
Andrew Paley Brown and Sean MillerWashburn University
Applied Portfolio Management
Report Date: 4/19/2016
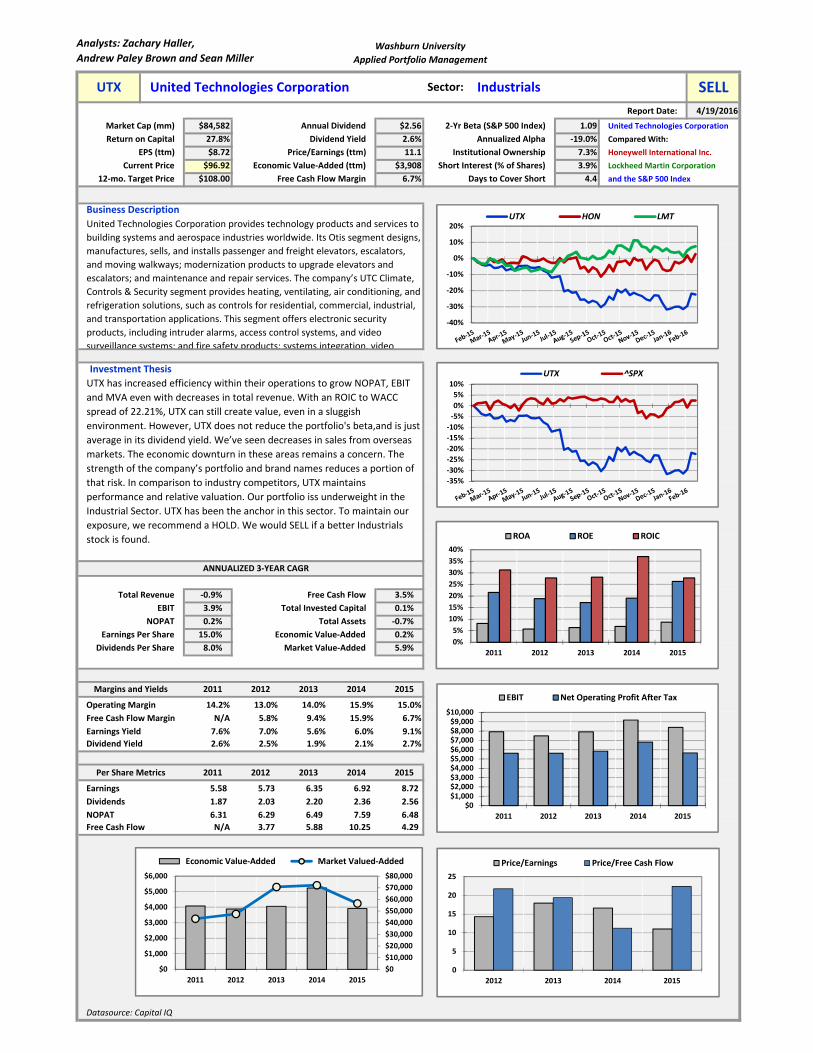
Market Cap (mm) $84,582 Annual Dividend $2.56 2‐Yr Beta (S&P 500 Index) 1.09 United Technologies Corporation
Return on Capital 27.8% Dividend Yield 2.6% Annualized Alpha ‐19.0% Compared With:
EPS (ttm) $8.72 Price/Earnings (ttm) 11.1 Institutional Ownership 7.3% Honeywell International Inc.
Current Price $96.92 Economic Value‐Added (ttm) $3,908 Short Interest (% of Shares) 3.9% Lockheed Martin Corporation
12‐mo. Target Price $108.00 Free Cash Flow Margin 6.7% Days to Cover Short 4.4 and the S&P 500 Index
Business Description
Total Revenue ‐0.9% Free Cash Flow 3.5%
EBIT 3.9% Total Invested Capital 0.1%
NOPAT 0.2% Total Assets ‐0.7%
Earnings Per Share 15.0% Economic Value‐Added 0.2%
Dividends Per Share 8.0% Market Value‐Added 5.9%
2011 2012 2013 2014 2015
14.2% 13.0% 14.0% 15.9% 15.0%
N/A 5.8% 9.4% 15.9% 6.7%
7.6% 7.0% 5.6% 6.0% 9.1%
2.6% 2.5% 1.9% 2.1% 2.7%
2011 2012 2013 2014 2015
5.58 5.73 6.35 6.92 8.72
1.87 2.03 2.20 2.36 2.56
6.31 6.29 6.49 7.59 6.48
N/A 3.77 5.88 10.25 4.29
Datasource: Capital IQ
UTX United Technologies Corporation Sector: Industrials SELL
Free Cash Flow Margin
United Technologies Corporation provides technology products and services to
building systems and aerospace industries worldwide. Its Otis segment designs,
manufactures, sells, and installs passenger and freight elevators, escalators,
and moving walkways; modernization products to upgrade elevators and
escalators; and maintenance and repair services. The company’s UTC Climate,
Controls & Security segment provides heating, ventilating, air conditioning, and
refrigeration solutions, such as controls for residential, commercial, industrial,
and transportation applications. This segment offers electronic security
products, including intruder alarms, access control systems, and video
surveillance systems; and fire safety products; systems integration, video
Investment Thesis
UTX has increased efficiency within their operations to grow NOPAT, EBIT
and MVA even with decreases in total revenue. With an ROIC to WACC
spread of 22.21%, UTX can still create value, even in a sluggish
environment. However, UTX does not reduce the portfolio's beta,and is just
average in its dividend yield. We’ve seen decreases in sales from overseas
markets. The economic downturn in these areas remains a concern. The
strength of the company’s portfolio and brand names reduces a portion of
that risk. In comparison to industry competitors, UTX maintains
performance and relative valuation. Our portfolio iss underweight in the
Industrial Sector. UTX has been the anchor in this sector. To maintain our
exposure, we recommend a HOLD. We would SELL if a better Industrials
stock is found.
ANNUALIZED 3‐YEAR CAGR
Margins and Yields
Operating Margin
NOPAT
Free Cash Flow
Earnings Yield
Dividend Yield
Per Share Metrics
Earnings
Dividends
‐35%
‐30%
‐25%
‐20%
‐15%
‐10%
‐5%
0%
5%
10%UTX ^SPX
‐40%
‐30%
‐20%
‐10%
0%
10%
20%UTX HON LMT
0
5
10
15
20
25
2012 2013 2014 2015
Price/Earnings Price/Free Cash Flow
$0$1,000$2,000$3,000$4,000$5,000$6,000$7,000$8,000$9,000$10,000
2011 2012 2013 2014 2015
EBIT Net Operating Profit After Tax
$0
$10,000
$20,000
$30,000
$40,000
$50,000
$60,000
$70,000
$80,000
$0
$1,000
$2,000
$3,000
$4,000
$5,000
$6,000
2011 2012 2013 2014 2015
Economic Value‐Added Market Valued‐Added
0%
5%
10%
15%
20%
25%
30%
35%
40%
2011 2012 2013 2014 2015
ROA ROE ROIC
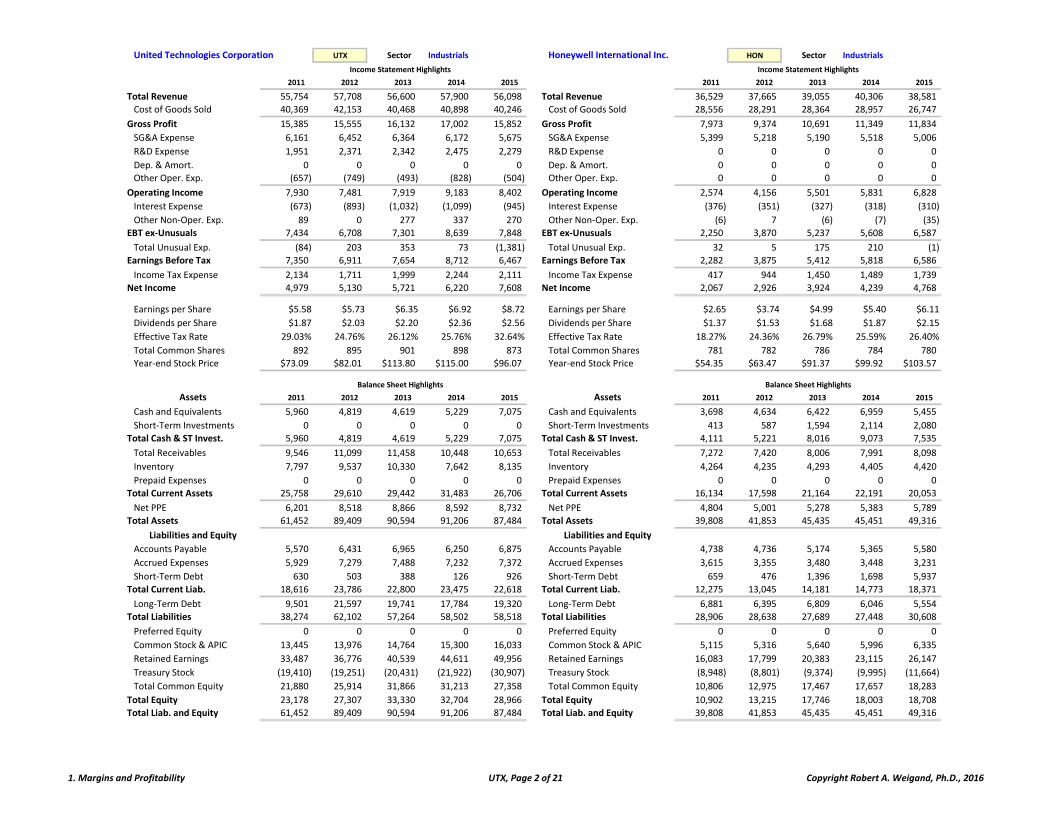
United Technologies Corporation UTX Sector Industrials Honeywell International Inc. HON Sector Industrials
2011 2012 2013 2014 2015 2011 2012 2013 2014 2015
Total Revenue 55,754 57,708 56,600 57,900 56,098 Total Revenue 36,529 37,665 39,055 40,306 38,581
Cost of Goods Sold 40,369 42,153 40,468 40,898 40,246 Cost of Goods Sold 28,556 28,291 28,364 28,957 26,747
Gross Profit 15,385 15,555 16,132 17,002 15,852 Gross Profit 7,973 9,374 10,691 11,349 11,834
SG&A Expense 6,161 6,452 6,364 6,172 5,675 SG&A Expense 5,399 5,218 5,190 5,518 5,006
R&D Expense 1,951 2,371 2,342 2,475 2,279 R&D Expense 0 0 0 0 0
Dep. & Amort. 0 0 0 0 0 Dep. & Amort. 0 0 0 0 0
Other Oper. Exp. (657) (749) (493) (828) (504) Other Oper. Exp. 0 0 0 0 0
Operating Income 7,930 7,481 7,919 9,183 8,402 Operating Income 2,574 4,156 5,501 5,831 6,828
Interest Expense (673) (893) (1,032) (1,099) (945) Interest Expense (376) (351) (327) (318) (310)
Other Non‐Oper. Exp. 89 0 277 337 270 Other Non‐Oper. Exp. (6) 7 (6) (7) (35)
EBT ex‐Unusuals 7,434 6,708 7,301 8,639 7,848 EBT ex‐Unusuals 2,250 3,870 5,237 5,608 6,587
Total Unusual Exp. (84) 203 353 73 (1,381) Total Unusual Exp. 32 5 175 210 (1)
Earnings Before Tax 7,350 6,911 7,654 8,712 6,467 Earnings Before Tax 2,282 3,875 5,412 5,818 6,586
Income Tax Expense 2,134 1,711 1,999 2,244 2,111 Income Tax Expense 417 944 1,450 1,489 1,739
Net Income 4,979 5,130 5,721 6,220 7,608 Net Income 2,067 2,926 3,924 4,239 4,768
Earnings per Share $5.58 $5.73 $6.35 $6.92 $8.72 Earnings per Share $2.65 $3.74 $4.99 $5.40 $6.11
Dividends per Share $1.87 $2.03 $2.20 $2.36 $2.56 Dividends per Share $1.37 $1.53 $1.68 $1.87 $2.15
Effective Tax Rate 29.03% 24.76% 26.12% 25.76% 32.64% Effective Tax Rate 18.27% 24.36% 26.79% 25.59% 26.40%
Total Common Shares 892 895 901 898 873 Total Common Shares 781 782 786 784 780
Year‐end Stock Price $73.09 $82.01 $113.80 $115.00 $96.07 Year‐end Stock Price $54.35 $63.47 $91.37 $99.92 $103.57996 997 998 999 1000 996 997 998 999 1000
Assets 2011 2012 2013 2014 2015 Assets 2011 2012 2013 2014 2015
Cash and Equivalents 5,960 4,819 4,619 5,229 7,075 Cash and Equivalents 3,698 4,634 6,422 6,959 5,455
Short‐Term Investments 0 0 0 0 0 Short‐Term Investments 413 587 1,594 2,114 2,080
Total Cash & ST Invest. 5,960 4,819 4,619 5,229 7,075 Total Cash & ST Invest. 4,111 5,221 8,016 9,073 7,535
Total Receivables 9,546 11,099 11,458 10,448 10,653 Total Receivables 7,272 7,420 8,006 7,991 8,098
Inventory 7,797 9,537 10,330 7,642 8,135 Inventory 4,264 4,235 4,293 4,405 4,420
Prepaid Expenses 0 0 0 0 0 Prepaid Expenses 0 0 0 0 0
Total Current Assets 25,758 29,610 29,442 31,483 26,706 Total Current Assets 16,134 17,598 21,164 22,191 20,053
Net PPE 6,201 8,518 8,866 8,592 8,732 Net PPE 4,804 5,001 5,278 5,383 5,789
Total Assets 61,452 89,409 90,594 91,206 87,484 Total Assets 39,808 41,853 45,435 45,451 49,316
Liabilities and Equity Liabilities and Equity
Accounts Payable 5,570 6,431 6,965 6,250 6,875 Accounts Payable 4,738 4,736 5,174 5,365 5,580
Accrued Expenses 5,929 7,279 7,488 7,232 7,372 Accrued Expenses 3,615 3,355 3,480 3,448 3,231
Short‐Term Debt 630 503 388 126 926 Short‐Term Debt 659 476 1,396 1,698 5,937
Total Current Liab. 18,616 23,786 22,800 23,475 22,618 Total Current Liab. 12,275 13,045 14,181 14,773 18,371
Long‐Term Debt 9,501 21,597 19,741 17,784 19,320 Long‐Term Debt 6,881 6,395 6,809 6,046 5,554
Total Liabilities 38,274 62,102 57,264 58,502 58,518 Total Liabilities 28,906 28,638 27,689 27,448 30,608
Preferred Equity 0 0 0 0 0 Preferred Equity 0 0 0 0 0
Common Stock & APIC 13,445 13,976 14,764 15,300 16,033 Common Stock & APIC 5,115 5,316 5,640 5,996 6,335
Retained Earnings 33,487 36,776 40,539 44,611 49,956 Retained Earnings 16,083 17,799 20,383 23,115 26,147
Treasury Stock (19,410) (19,251) (20,431) (21,922) (30,907) Treasury Stock (8,948) (8,801) (9,374) (9,995) (11,664)
Total Common Equity 21,880 25,914 31,866 31,213 27,358 Total Common Equity 10,806 12,975 17,467 17,657 18,283
Total Equity 23,178 27,307 33,330 32,704 28,966 Total Equity 10,902 13,215 17,746 18,003 18,708
Total Liab. and Equity 61,452 89,409 90,594 91,206 87,484 Total Liab. and Equity 39,808 41,853 45,435 45,451 49,316
Income Statement Highlights
Balance Sheet Highlights
Income Statement Highlights
Balance Sheet Highlights
1. Margins and Profitability UTX, Page 2 of 21 Copyright Robert A. Weigand, Ph.D., 2016
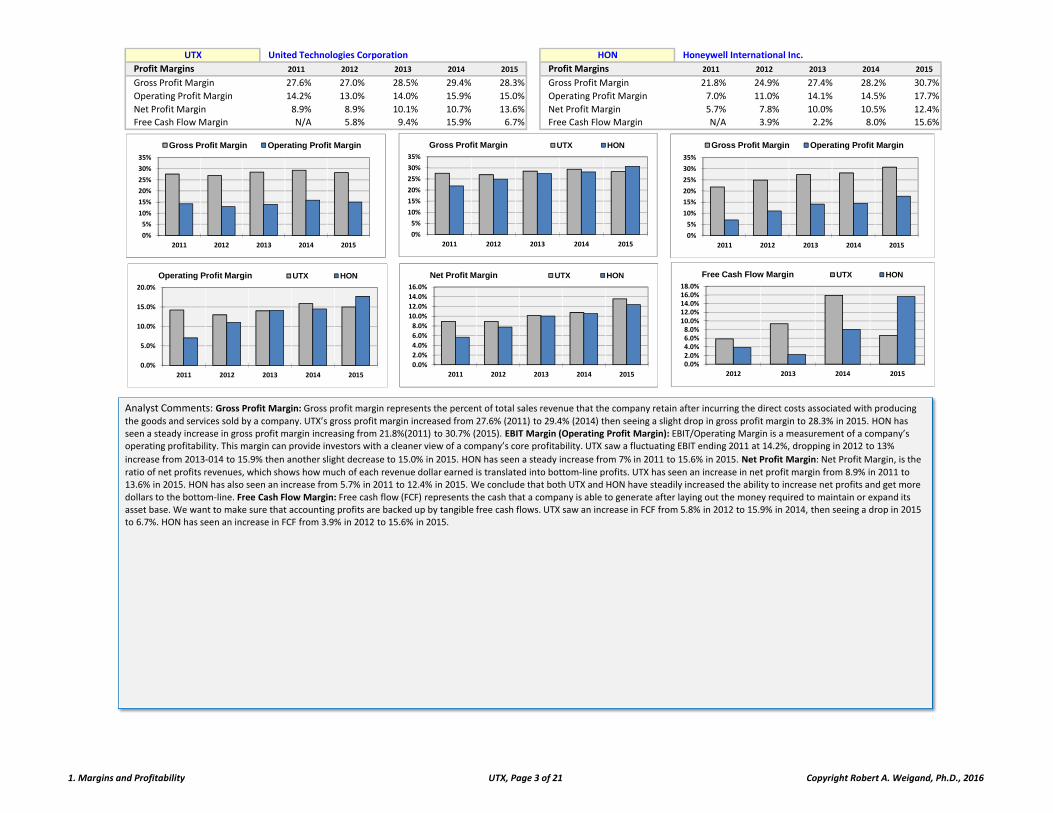
UTX United Technologies Corporation HON Honeywell International Inc.
Profit Margins 2011 2012 2013 2014 2015 Profit Margins 2011 2012 2013 2014 2015
Gross Profit Margin 27.6% 27.0% 28.5% 29.4% 28.3% Gross Profit Margin 21.8% 24.9% 27.4% 28.2% 30.7%
Operating Profit Margin 14.2% 13.0% 14.0% 15.9% 15.0% Operating Profit Margin 7.0% 11.0% 14.1% 14.5% 17.7%
Net Profit Margin 8.9% 8.9% 10.1% 10.7% 13.6% Net Profit Margin 5.7% 7.8% 10.0% 10.5% 12.4%
Free Cash Flow Margin N/A 5.8% 9.4% 15.9% 6.7% Free Cash Flow Margin N/A 3.9% 2.2% 8.0% 15.6%
0%
5%
10%
15%
20%
25%
30%
35%
2011 2012 2013 2014 2015
Gross Profit Margin Operating Profit Margin
0%
5%
10%
15%
20%
25%
30%
35%
2011 2012 2013 2014 2015
Gross Profit Margin Operating Profit Margin
0%
5%
10%
15%
20%
25%
30%
35%
2011 2012 2013 2014 2015
Gross Profit Margin UTX HON
0.0%
5.0%
10.0%
15.0%
20.0%
2011 2012 2013 2014 2015
Operating Profit Margin UTX HON
0.0%
2.0%
4.0%
6.0%
8.0%
10.0%
12.0%
14.0%
16.0%
2011 2012 2013 2014 2015
Net Profit Margin UTX HON
Analyst Comments: Gross Profit Margin: Gross profit margin represents the percent of total sales revenue that the company retain after incurring the direct costs associated with producing
the goods and services sold by a company. UTX’s gross profit margin increased from 27.6% (2011) to 29.4% (2014) then seeing a slight drop in gross profit margin to 28.3% in 2015. HON has seen a steady increase in gross profit margin increasing from 21.8%(2011) to 30.7% (2015). EBIT Margin (Operating Profit Margin): EBIT/Operating Margin is a measurement of a company’s operating profitability. This margin can provide investors with a cleaner view of a company’s core profitability. UTX saw a fluctuating EBIT ending 2011 at 14.2%, dropping in 2012 to 13%
increase from 2013‐014 to 15.9% then another slight decrease to 15.0% in 2015. HON has seen a steady increase from 7% in 2011 to 15.6% in 2015. Net Profit Margin: Net Profit Margin, is the
ratio of net profits revenues, which shows how much of each revenue dollar earned is translated into bottom‐line profits. UTX has seen an increase in net profit margin from 8.9% in 2011 to 13.6% in 2015. HON has also seen an increase from 5.7% in 2011 to 12.4% in 2015. We conclude that both UTX and HON have steadily increased the ability to increase net profits and get more dollars to the bottom‐line. Free Cash Flow Margin: Free cash flow (FCF) represents the cash that a company is able to generate after laying out the money required to maintain or expand its asset base. We want to make sure that accounting profits are backed up by tangible free cash flows. UTX saw an increase in FCF from 5.8% in 2012 to 15.9% in 2014, then seeing a drop in 2015 to 6.7%. HON has seen an increase in FCF from 3.9% in 2012 to 15.6% in 2015.
0.0%2.0%4.0%6.0%8.0%10.0%12.0%14.0%16.0%18.0%
2012 2013 2014 2015
Free Cash Flow Margin UTX HON
1. Margins and Profitability UTX, Page 3 of 21 Copyright Robert A. Weigand, Ph.D., 2016
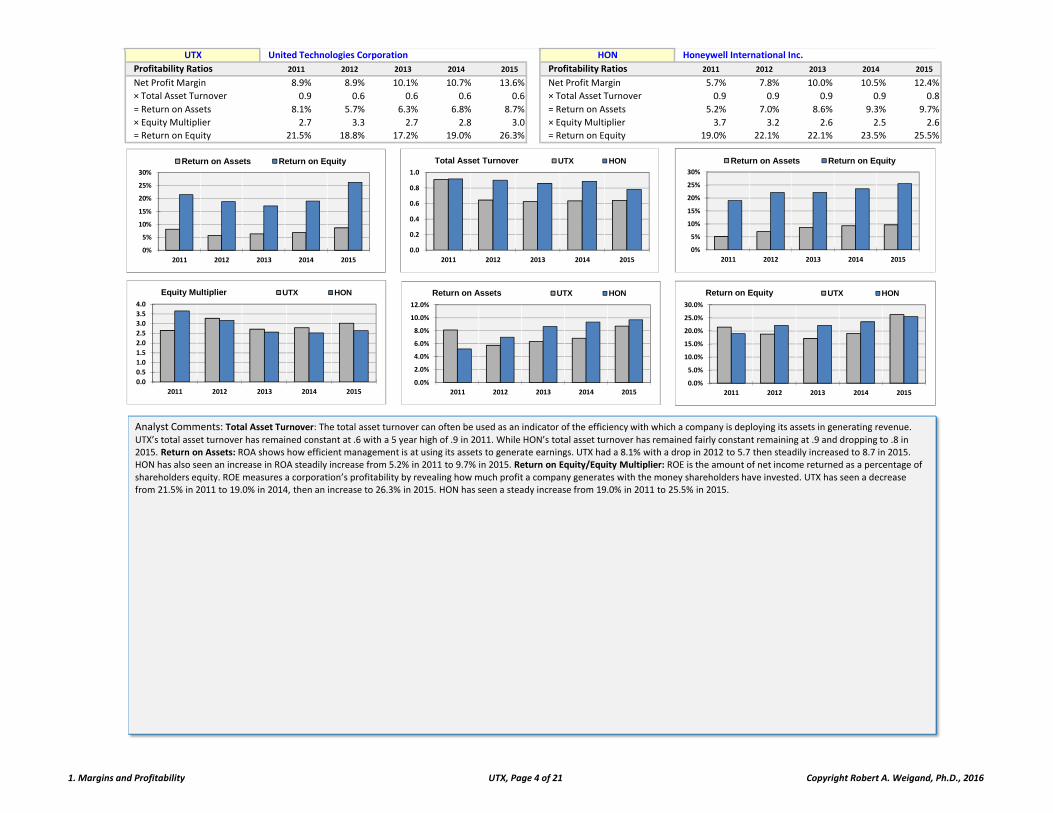
UTX United Technologies Corporation HON Honeywell International Inc.
Profitability Ratios 2011 2012 2013 2014 2015 Profitability Ratios 2011 2012 2013 2014 2015
Net Profit Margin 8.9% 8.9% 10.1% 10.7% 13.6% Net Profit Margin 5.7% 7.8% 10.0% 10.5% 12.4%
× Total Asset Turnover 0.9 0.6 0.6 0.6 0.6 × Total Asset Turnover 0.9 0.9 0.9 0.9 0.8
= Return on Assets 8.1% 5.7% 6.3% 6.8% 8.7% = Return on Assets 5.2% 7.0% 8.6% 9.3% 9.7%
× Equity Multiplier 2.7 3.3 2.7 2.8 3.0 × Equity Multiplier 3.7 3.2 2.6 2.5 2.6
= Return on Equity 21.5% 18.8% 17.2% 19.0% 26.3% = Return on Equity 19.0% 22.1% 22.1% 23.5% 25.5%
0%
5%
10%
15%
20%
25%
30%
2011 2012 2013 2014 2015
Return on Assets Return on Equity
0%
5%
10%
15%
20%
25%
30%
2011 2012 2013 2014 2015
Return on Assets Return on Equity
0.0
0.2
0.4
0.6
0.8
1.0
2011 2012 2013 2014 2015
Total Asset Turnover UTX HON
0.0%
2.0%
4.0%
6.0%
8.0%
10.0%
12.0%
2011 2012 2013 2014 2015
Return on Assets UTX HON
0.0%
5.0%
10.0%
15.0%
20.0%
25.0%
30.0%
2011 2012 2013 2014 2015
Return on Equity UTX HON
Analyst Comments: Total Asset Turnover: The total asset turnover can often be used as an indicator of the efficiency with which a company is deploying its assets in generating revenue.
UTX’s total asset turnover has remained constant at .6 with a 5 year high of .9 in 2011. While HON’s total asset turnover has remained fairly constant remaining at .9 and dropping to .8 in 2015. Return on Assets: ROA shows how efficient management is at using its assets to generate earnings. UTX had a 8.1% with a drop in 2012 to 5.7 then steadily increased to 8.7 in 2015. HON has also seen an increase in ROA steadily increase from 5.2% in 2011 to 9.7% in 2015. Return on Equity/Equity Multiplier: ROE is the amount of net income returned as a percentage of shareholders equity. ROE measures a corporation’s profitability by revealing how much profit a company generates with the money shareholders have invested. UTX has seen a decrease from 21.5% in 2011 to 19.0% in 2014, then an increase to 26.3% in 2015. HON has seen a steady increase from 19.0% in 2011 to 25.5% in 2015.
0.0
0.5
1.0
1.5
2.0
2.5
3.0
3.5
4.0
2011 2012 2013 2014 2015
Equity Multiplier UTX HON
1. Margins and Profitability UTX, Page 4 of 21 Copyright Robert A. Weigand, Ph.D., 2016
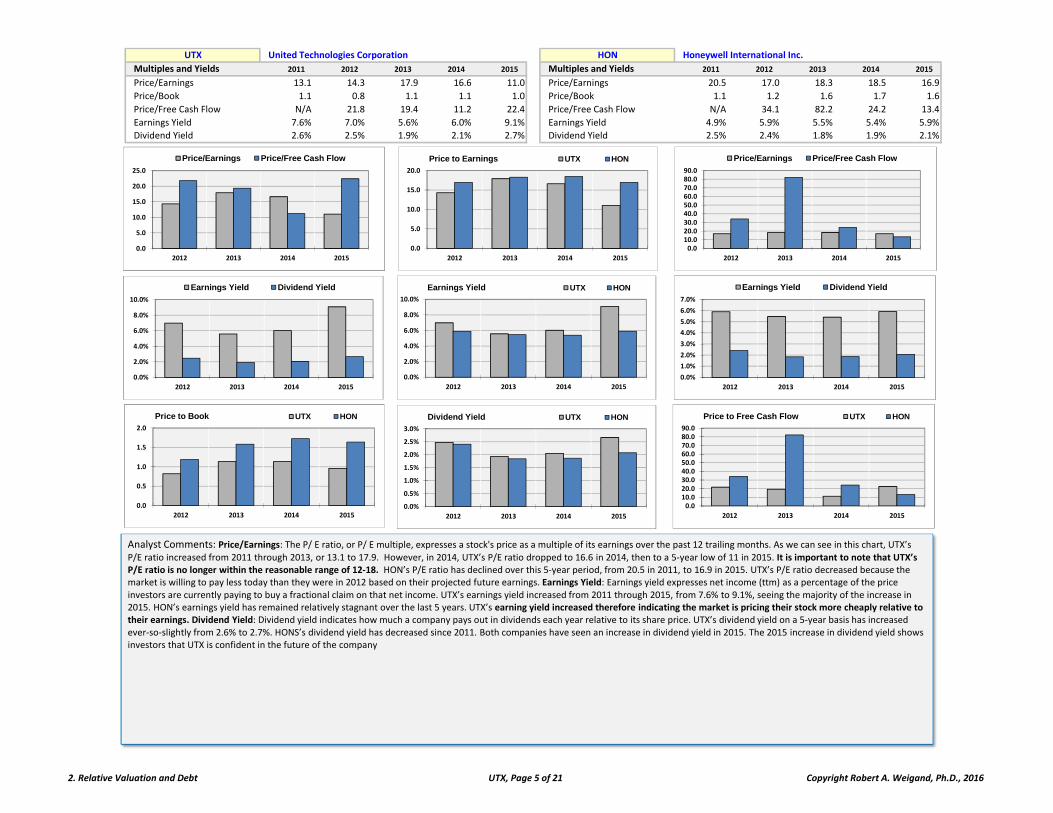
UTX United Technologies Corporation HON Honeywell International Inc.
Multiples and Yields 2011 2012 2013 2014 2015 Multiples and Yields 2011 2012 2013 2014 2015
Price/Earnings 13.1 14.3 17.9 16.6 11.0 Price/Earnings 20.5 17.0 18.3 18.5 16.9
Price/Book 1.1 0.8 1.1 1.1 1.0 Price/Book 1.1 1.2 1.6 1.7 1.6
Price/Free Cash Flow N/A 21.8 19.4 11.2 22.4 Price/Free Cash Flow N/A 34.1 82.2 24.2 13.4
Earnings Yield 7.6% 7.0% 5.6% 6.0% 9.1% Earnings Yield 4.9% 5.9% 5.5% 5.4% 5.9%
Dividend Yield 2.6% 2.5% 1.9% 2.1% 2.7% Dividend Yield 2.5% 2.4% 1.8% 1.9% 2.1%
0.0
5.0
10.0
15.0
20.0
25.0
2012 2013 2014 2015
Price/Earnings Price/Free Cash Flow
0.0%
2.0%
4.0%
6.0%
8.0%
10.0%
2012 2013 2014 2015
Earnings Yield Dividend Yield
0.0%
2.0%
4.0%
6.0%
8.0%
10.0%
2012 2013 2014 2015
Earnings Yield UTX HON
Analyst Comments: Price/Earnings: The P/ E ratio, or P/ E multiple, expresses a stock's price as a multiple of its earnings over the past 12 trailing months. As we can see in this chart, UTX’s
P/E ratio increased from 2011 through 2013, or 13.1 to 17.9. However, in 2014, UTX’s P/E ratio dropped to 16.6 in 2014, then to a 5‐year low of 11 in 2015. It is important to note that UTX’s P/E ratio is no longer within the reasonable range of 12‐18. HON’s P/E ratio has declined over this 5‐year period, from 20.5 in 2011, to 16.9 in 2015. UTX’s P/E ratio decreased because the market is willing to pay less today than they were in 2012 based on their projected future earnings. Earnings Yield: Earnings yield expresses net income (ttm) as a percentage of the price investors are currently paying to buy a fractional claim on that net income. UTX’s earnings yield increased from 2011 through 2015, from 7.6% to 9.1%, seeing the majority of the increase in 2015. HON’s earnings yield has remained relatively stagnant over the last 5 years. UTX’s earning yield increased therefore indicating the market is pricing their stock more cheaply relative to their earnings. Dividend Yield: Dividend yield indicates how much a company pays out in dividends each year relative to its share price. UTX’s dividend yield on a 5‐year basis has increased ever‐so‐slightly from 2.6% to 2.7%. HONS’s dividend yield has decreased since 2011. Both companies have seen an increase in dividend yield in 2015. The 2015 increase in dividend yield shows investors that UTX is confident in the future of the company
0.010.020.030.040.050.060.070.080.090.0
2012 2013 2014 2015
Price/Earnings Price/Free Cash Flow
0.0
5.0
10.0
15.0
20.0
2012 2013 2014 2015
Price to Earnings UTX HON
0.0%
1.0%
2.0%
3.0%
4.0%
5.0%
6.0%
7.0%
2012 2013 2014 2015
Earnings Yield Dividend Yield
0.0
0.5
1.0
1.5
2.0
2012 2013 2014 2015
Price to Book UTX HON
0.010.020.030.040.050.060.070.080.090.0
2012 2013 2014 2015
Price to Free Cash Flow UTX HON
0.0%
0.5%
1.0%
1.5%
2.0%
2.5%
3.0%
2012 2013 2014 2015
Dividend Yield UTX HON
2. Relative Valuation and Debt UTX, Page 5 of 21 Copyright Robert A. Weigand, Ph.D., 2016

UTX United Technologies Corporation HON Honeywell International Inc.
Liquidity and Debt 2011 2012 2013 2014 2015 Liquidity and Debt 2011 2012 2013 2014 2015
Current Ratio 1.38 1.24 1.29 1.34 1.18 Current Ratio 1.31 1.35 1.49 1.50 1.09
Quick Ratio 0.96 0.84 0.84 1.02 0.82 Quick Ratio 0.97 1.02 1.19 1.20 0.85
Days Sales Outstanding 62.49 70.20 73.89 65.86 69.31 Days Sales Outstanding 72.66 71.90 74.82 72.36 76.61
Inventory Turnover 7.15 6.05 5.48 7.58 6.90 Inventory Turnover 8.57 8.89 9.10 9.15 8.73
Total Debt to Assets 16.5% 24.7% 22.2% 19.6% 23.1% Total Debt to Assets 18.9% 16.4% 18.1% 17.0% 23.3%
Long‐Term Debt to Equity 43.4% 83.3% 62.0% 57.0% 70.6% Long‐Term Debt to Equity 63.7% 49.3% 39.0% 34.2% 30.4%
Times Interest Earned 11.78 8.38 7.67 8.36 8.89 Times Interest Earned 6.85 11.84 16.82 18.34 22.03
0.0
0.2
0.4
0.6
0.8
1.0
1.2
1.4
1.6
2011 2012 2013 2014 2015
Current Ratio Quick Ratio
0.0
0.2
0.4
0.6
0.8
1.0
1.2
1.4
1.6
2011 2012 2013 2014 2015
Current Ratio Quick Ratio
0.0
0.2
0.4
0.6
0.8
1.0
1.2
1.4
1.6
2011 2012 2013 2014 2015
Current Ratio UTX HON
Analyst Comments: Current Ratio: The current ratio is simply current assets over current liabilities, a quick check to make sure the company's short‐term liabilities can be covered by liquid
short‐term assets. UTX’s current ratio remained relatively constant from 2011 to 2014, dropping to 1.18 in 2015. HON’s has seen relatively similar movement in the current ratio during this period, but saw a higher high of 1.50 in 2014, and a lower low of 1.09 in 2015. We found that UTX has a better likelihood of maintaining its short‐term liabilities since HON’s current ratio is nearing 1. We can conclude UTX has adequate liquidity. Total Debt to Assets: Total debt to assets defines the total amount of debt relative to assets. UTX’s debt to assets increased from 2011 to 2015, from 16.5% to 23.1%. HONS’s total debt to assets has also increased over this 5‐year period, from 18.9% to 23.3%. UTX has stressed that they would like to decrease their debt to assets in the years to come. Based on this 5‐year period, UTX has been increasing their debt relative to their assets. Long‐Term Debt to Equity: Long‐term debt to equity is used to measure a company’s financial leverage; the ratio indicates how much debt a company is using to finance its assets relative to the amount of value represented in the shareholders equity. UTX’s long‐term debt to equity ratio has increased significantly from 2011 to 2015, from 43.4% to 70.6%. HON has seen a decline in debt to equity over the 5‐year period, from 63.7% to 30.4%. As previously stated we concluded that UTX was capital expenditures with more debt, therefore this explains why long‐term debt to equity has also been increasing.
0%
5%
10%
15%
20%
25%
30%
2011 2012 2013 2014 2015
Total Debt to Assets UTX HON
0.0
10.0
20.0
30.0
40.0
50.0
60.0
70.0
80.0
2011 2012 2013 2014 2015
Days Sales Outstanding Inventory Turnover
0.010.020.030.040.050.060.070.080.090.0
2011 2012 2013 2014 2015
Days Sales Outstanding Inventory Turnover
0%10%20%30%40%50%60%70%80%90%
2011 2012 2013 2014 2015
Total Debt to Assets Long-Term Debt to Equity
0.0%
10.0%
20.0%
30.0%
40.0%
50.0%
60.0%
70.0%
2011 2012 2013 2014 2015
Total Debt to Assets Long-Term Debt to Equity
0%10%20%30%40%50%60%70%80%90%
2011 2012 2013 2014 2015
Long-Term Debt to Equity UTX HON
2. Relative Valuation and Debt UTX, Page 6 of 21 Copyright Robert A. Weigand, Ph.D., 2016
UTX United Technologies Corporation HON Honeywell International Inc.
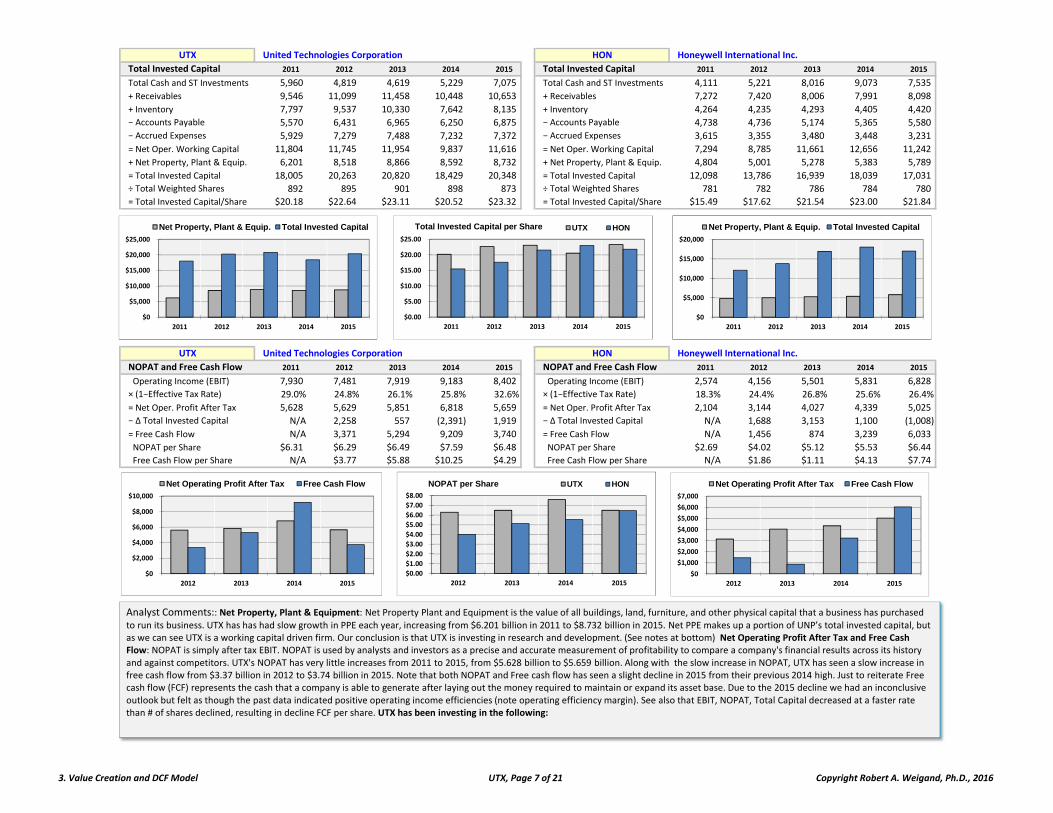
Total Invested Capital 2011 2012 2013 2014 2015 Total Invested Capital 2011 2012 2013 2014 2015
Total Cash and ST Investments 5,960 4,819 4,619 5,229 7,075 Total Cash and ST Investments 4,111 5,221 8,016 9,073 7,535
+ Receivables 9,546 11,099 11,458 10,448 10,653 + Receivables 7,272 7,420 8,006 7,991 8,098
+ Inventory 7,797 9,537 10,330 7,642 8,135 + Inventory 4,264 4,235 4,293 4,405 4,420
− Accounts Payable 5,570 6,431 6,965 6,250 6,875 − Accounts Payable 4,738 4,736 5,174 5,365 5,580
− Accrued Expenses 5,929 7,279 7,488 7,232 7,372 − Accrued Expenses 3,615 3,355 3,480 3,448 3,231
= Net Oper. Working Capital 11,804 11,745 11,954 9,837 11,616 = Net Oper. Working Capital 7,294 8,785 11,661 12,656 11,242
+ Net Property, Plant & Equip. 6,201 8,518 8,866 8,592 8,732 + Net Property, Plant & Equip. 4,804 5,001 5,278 5,383 5,789
= Total Invested Capital 18,005 20,263 20,820 18,429 20,348 = Total Invested Capital 12,098 13,786 16,939 18,039 17,031
÷ Total Weighted Shares 892 895 901 898 873 ÷ Total Weighted Shares 781 782 786 784 780
= Total Invested Capital/Share $20.18 $22.64 $23.11 $20.52 $23.32 = Total Invested Capital/Share $15.49 $17.62 $21.54 $23.00 $21.84
UTX United Technologies Corporation HON Honeywell International Inc.
NOPAT and Free Cash Flow 2011 2012 2013 2014 2015 NOPAT and Free Cash Flow 2011 2012 2013 2014 2015
Operating Income (EBIT) 7,930 7,481 7,919 9,183 8,402 Operating Income (EBIT) 2,574 4,156 5,501 5,831 6,828
× (1−Effective Tax Rate) 29.0% 24.8% 26.1% 25.8% 32.6% × (1−Effective Tax Rate) 18.3% 24.4% 26.8% 25.6% 26.4%
= Net Oper. Profit After Tax 5,628 5,629 5,851 6,818 5,659 = Net Oper. Profit After Tax 2,104 3,144 4,027 4,339 5,025
− ∆ Total Invested Capital N/A 2,258 557 (2,391) 1,919 − ∆ Total Invested Capital N/A 1,688 3,153 1,100 (1,008)
= Free Cash Flow N/A 3,371 5,294 9,209 3,740 = Free Cash Flow N/A 1,456 874 3,239 6,033
NOPAT per Share $6.31 $6.29 $6.49 $7.59 $6.48 NOPAT per Share $2.69 $4.02 $5.12 $5.53 $6.44
Free Cash Flow per Share N/A $3.77 $5.88 $10.25 $4.29 Free Cash Flow per Share N/A $1.86 $1.11 $4.13 $7.74
$0
$5,000
$10,000
$15,000
$20,000
$25,000
2011 2012 2013 2014 2015
Net Property, Plant & Equip. Total Invested Capital
$0
$5,000
$10,000
$15,000
$20,000
2011 2012 2013 2014 2015
Net Property, Plant & Equip. Total Invested Capital
$0.00
$5.00
$10.00
$15.00
$20.00
$25.00
2011 2012 2013 2014 2015
Total Invested Capital per Share UTX HON
$0
$2,000
$4,000
$6,000
$8,000
$10,000
2012 2013 2014 2015
Net Operating Profit After Tax Free Cash Flow
$0.00
$1.00
$2.00
$3.00
$4.00
$5.00
$6.00
$7.00
$8.00
2012 2013 2014 2015
NOPAT per Share UTX HON
$0
$1,000
$2,000
$3,000
$4,000
$5,000
$6,000
$7,000
2012 2013 2014 2015
Net Operating Profit After Tax Free Cash Flow
Analyst Comments:: Net Property, Plant & Equipment: Net Property Plant and Equipment is the value of all buildings, land, furniture, and other physical capital that a business has purchased
to run its business. UTX has has had slow growth in PPE each year, increasing from $6.201 billion in 2011 to $8.732 billion in 2015. Net PPE makes up a portion of UNP’s total invested capital, but as we can see UTX is a working capital driven firm. Our conclusion is that UTX is investing in research and development. (See notes at bottom) Net Operating Profit After Tax and Free Cash Flow: NOPAT is simply after tax EBIT. NOPAT is used by analysts and investors as a precise and accurate measurement of profitability to compare a company's financial results across its history and against competitors. UTX's NOPAT has very little increases from 2011 to 2015, from $5.628 billion to $5.659 billion. Along with the slow increase in NOPAT, UTX has seen a slow increase in free cash flow from $3.37 billion in 2012 to $3.74 billion in 2015. Note that both NOPAT and Free cash flow has seen a slight decline in 2015 from their previous 2014 high. Just to reiterate Free cash flow (FCF) represents the cash that a company is able to generate after laying out the money required to maintain or expand its asset base. Due to the 2015 decline we had an inconclusive outlook but felt as though the past data indicated positive operating income efficiencies (note operating efficiency margin). See also that EBIT, NOPAT, Total Capital decreased at a faster rate than # of shares declined, resulting in decline FCF per share. UTX has been investing in the following:
3. Value Creation and DCF Model UTX, Page 7 of 21 Copyright Robert A. Weigand, Ph.D., 2016
UTX United Technologies Corporation HON Honeywell International Inc.
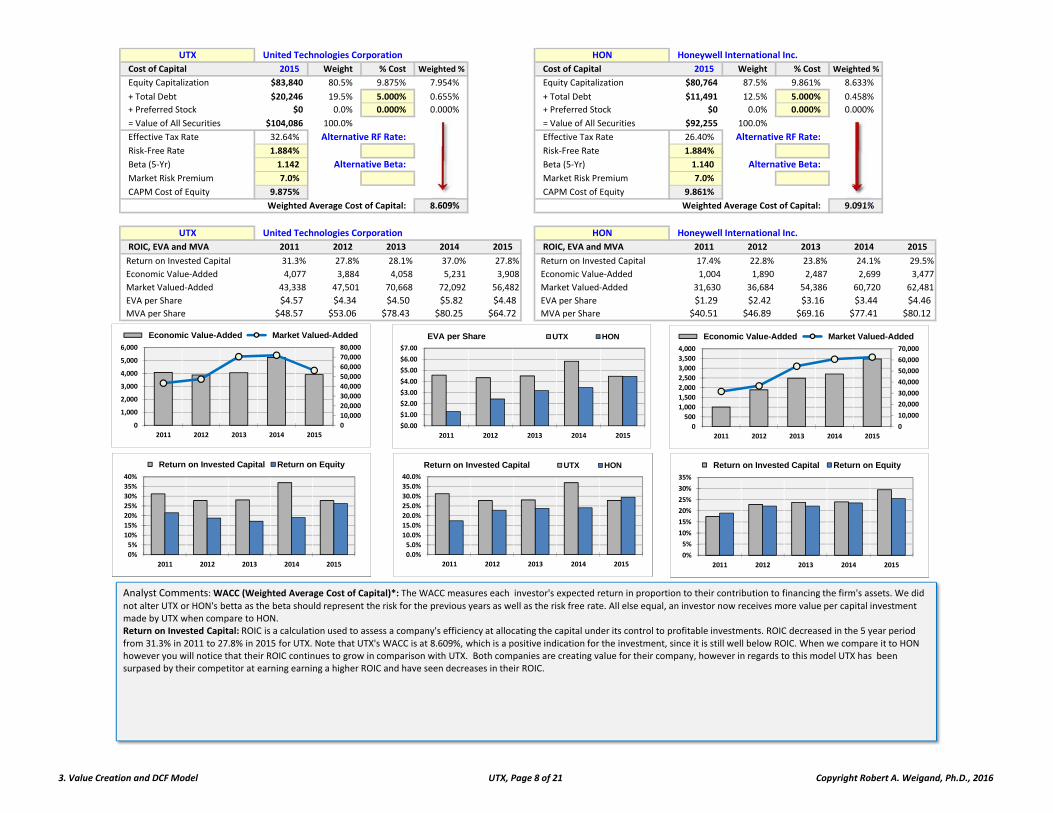
Cost of Capital 2015 Weight % Cost Weighted % Cost of Capital 2015 Weight % Cost Weighted %
Equity Capitalization $83,840 80.5% 9.875% 7.954% Equity Capitalization $80,764 87.5% 9.861% 8.633%
+ Total Debt $20,246 19.5% 5.000% 0.655% + Total Debt $11,491 12.5% 5.000% 0.458%
+ Preferred Stock $0 0.0% 0.000% 0.000% + Preferred Stock $0 0.0% 0.000% 0.000%
= Value of All Securities $104,086 100.0% = Value of All Securities $92,255 100.0%
Effective Tax Rate 32.64% Alternative RF Rate: Effective Tax Rate 26.40% Alternative RF Rate:
Risk‐Free Rate 1.884% 1.884% Risk‐Free Rate 1.884% 1.884%
Beta (5‐Yr) 1.142 Alternative Beta: 1.14159 Beta (5‐Yr) 1.140 Alternative Beta: 1.1396
Market Risk Premium 7.0% Market Risk Premium 7.0%
CAPM Cost of Equity 9.875% CAPM Cost of Equity 9.861%
Weighted Average Cost of Capital: 8.609% Weighted Average Cost of Capital: 9.091%
8.609% 8.609% 8.609% 8.609% 8.609%
UTX United Technologies Corporation HON Honeywell International Inc.
ROIC, EVA and MVA 2011 2012 2013 2014 2015 ROIC, EVA and MVA 2011 2012 2013 2014 2015
Return on Invested Capital 31.3% 27.8% 28.1% 37.0% 27.8% Return on Invested Capital 17.4% 22.8% 23.8% 24.1% 29.5%
Economic Value‐Added 4,077 3,884 4,058 5,231 3,908 Economic Value‐Added 1,004 1,890 2,487 2,699 3,477
Market Valued‐Added 43,338 47,501 70,668 72,092 56,482 Market Valued‐Added 31,630 36,684 54,386 60,720 62,481
EVA per Share $4.57 $4.34 $4.50 $5.82 $4.48 EVA per Share $1.29 $2.42 $3.16 $3.44 $4.46
MVA per Share $48.57 $53.06 $78.43 $80.25 $64.72 MVA per Share $40.51 $46.89 $69.16 $77.41 $80.12
$0.00
$1.00
$2.00
$3.00
$4.00
$5.00
$6.00
$7.00
2011 2012 2013 2014 2015
EVA per Share UTX HON
0
10,000
20,000
30,000
40,000
50,000
60,000
70,000
80,000
0
1,000
2,000
3,000
4,000
5,000
6,000
2011 2012 2013 2014 2015
Economic Value-Added Market Valued-Added
0
10,000
20,000
30,000
40,000
50,000
60,000
70,000
0
500
1,000
1,500
2,000
2,500
3,000
3,500
4,000
2011 2012 2013 2014 2015
Economic Value-Added Market Valued-Added
Analyst Comments: WACC (Weighted Average Cost of Capital)*: The WACC measures each investor's expected return in proportion to their contribution to financing the firm's assets. We did
not alter UTX or HON's betta as the beta should represent the risk for the previous years as well as the risk free rate. All else equal, an investor now receives more value per capital investment made by UTX when compare to HON. Return on Invested Capital: ROIC is a calculation used to assess a company's efficiency at allocating the capital under its control to profitable investments. ROIC decreased in the 5 year period from 31.3% in 2011 to 27.8% in 2015 for UTX. Note that UTX's WACC is at 8.609%, which is a positive indication for the investment, since it is still well below ROIC. When we compare it to HON however you will notice that their ROIC continues to grow in comparison with UTX. Both companies are creating value for their company, however in regards to this model UTX has been surpased by their competitor at earning earning a higher ROIC and have seen decreases in their ROIC.
0.0%
5.0%
10.0%
15.0%
20.0%
25.0%
30.0%
35.0%
40.0%
2011 2012 2013 2014 2015
Return on Invested Capital UTX HON
0%
5%
10%
15%
20%
25%
30%
35%
40%
2011 2012 2013 2014 2015
Return on Invested Capital Return on Equity
0%
5%
10%
15%
20%
25%
30%
35%
2011 2012 2013 2014 2015
Return on Invested Capital Return on Equity
3. Value Creation and DCF Model UTX, Page 8 of 21 Copyright Robert A. Weigand, Ph.D., 2016
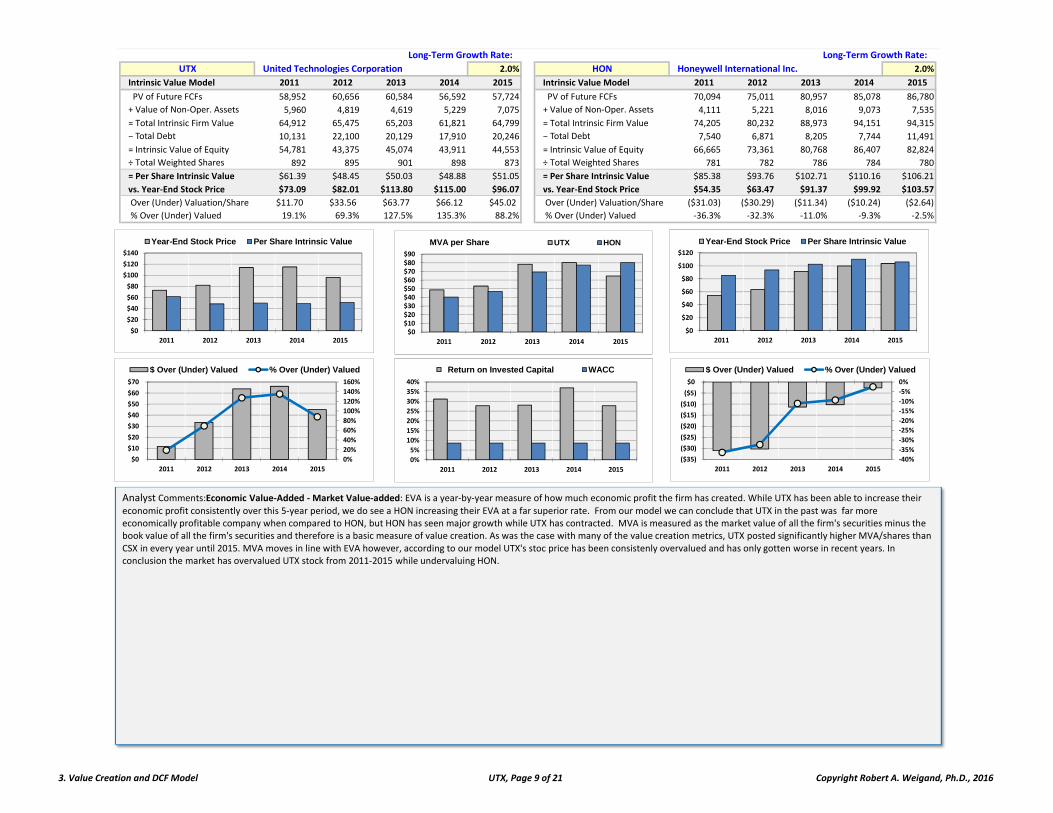
Long‐Term Growth Rate: Long‐Term Growth Rate:
UTX United Technologies Corporation 2.0% HON Honeywell International Inc. 2.0%
Intrinsic Value Model 2011 2012 2013 2014 2015 Intrinsic Value Model 2011 2012 2013 2014 2015
PV of Future FCFs 58,952 60,656 60,584 56,592 57,724 PV of Future FCFs 70,094 75,011 80,957 85,078 86,780
+ Value of Non‐Oper. Assets 5,960 4,819 4,619 5,229 7,075 + Value of Non‐Oper. Assets 4,111 5,221 8,016 9,073 7,535
= Total Intrinsic Firm Value 64,912 65,475 65,203 61,821 64,799 = Total Intrinsic Firm Value 74,205 80,232 88,973 94,151 94,315
− Total Debt 10,131 22,100 20,129 17,910 20,246 − Total Debt 7,540 6,871 8,205 7,744 11,491
= Intrinsic Value of Equity 54,781 43,375 45,074 43,911 44,553 = Intrinsic Value of Equity 66,665 73,361 80,768 86,407 82,824
÷ Total Weighted Shares 892 895 901 898 873 ÷ Total Weighted Shares 781 782 786 784 780
= Per Share Intrinsic Value $61.39 $48.45 $50.03 $48.88 $51.05 = Per Share Intrinsic Value $85.38 $93.76 $102.71 $110.16 $106.21
vs. Year‐End Stock Price $73.09 $82.01 $113.80 $115.00 $96.07 vs. Year‐End Stock Price $54.35 $63.47 $91.37 $99.92 $103.57
Over (Under) Valuation/Share $11.70 $33.56 $63.77 $66.12 $45.02 Over (Under) Valuation/Share ($31.03) ($30.29) ($11.34) ($10.24) ($2.64)
% Over (Under) Valued 19.1% 69.3% 127.5% 135.3% 88.2% % Over (Under) Valued ‐36.3% ‐32.3% ‐11.0% ‐9.3% ‐2.5%
$0
$20
$40
$60
$80
$100
$120
$140
2011 2012 2013 2014 2015
Year-End Stock Price Per Share Intrinsic Value
0%
20%
40%
60%
80%
100%
120%
140%
160%
$0
$10
$20
$30
$40
$50
$60
$70
2011 2012 2013 2014 2015
$ Over (Under) Valued % Over (Under) Valued
$0
$20
$40
$60
$80
$100
$120
2011 2012 2013 2014 2015
Year-End Stock Price Per Share Intrinsic Value
‐40%
‐35%
‐30%
‐25%
‐20%
‐15%
‐10%
‐5%
0%
($35)
($30)
($25)
($20)
($15)
($10)
($5)
$0
2011 2012 2013 2014 2015
$ Over (Under) Valued % Over (Under) Valued
$0$10$20$30$40$50$60$70$80$90
2011 2012 2013 2014 2015
MVA per Share UTX HON
Analyst Comments:Economic Value‐Added ‐Market Value‐added: EVA is a year‐by‐year measure of how much economic profit the firm has created. While UTX has been able to increase their
economic profit consistently over this 5‐year period, we do see a HON increasing their EVA at a far superior rate. From our model we can conclude that UTX in the past was far more economically profitable company when compared to HON, but HON has seen major growth while UTX has contracted. MVA is measured as the market value of all the firm's securities minus the book value of all the firm's securities and therefore is a basic measure of value creation. As was the case with many of the value creation metrics, UTX posted significantly higher MVA/shares than CSX in every year until 2015. MVA moves in line with EVA however, according to our model UTX's stoc price has been consistenly overvalued and has only gotten worse in recent years. In conclusion the market has overvalued UTX stock from 2011‐2015 while undervaluing HON.
0%
5%
10%
15%
20%
25%
30%
35%
40%
2011 2012 2013 2014 2015
Return on Invested Capital WACC
3. Value Creation and DCF Model UTX, Page 9 of 21 Copyright Robert A. Weigand, Ph.D., 2016
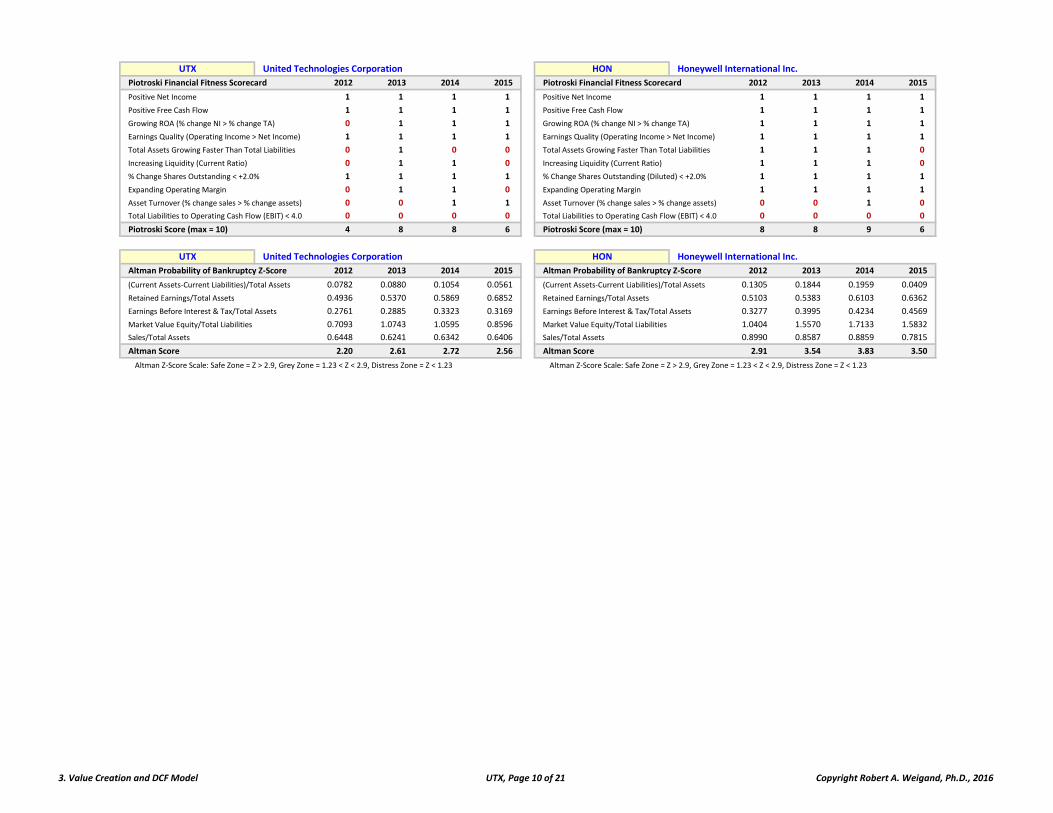
UTX United Technologies Corporation HON Honeywell International Inc.
Piotroski Financial Fitness Scorecard 2012 2013 2014 2015 Piotroski Financial Fitness Scorecard 2012 2013 2014 2015
Positive Net Income 1 1 1 1 Positive Net Income 1 1 1 1
Positive Free Cash Flow 1 1 1 1 Positive Free Cash Flow 1 1 1 1
Growing ROA (% change NI > % change TA) 0 1 1 1 Growing ROA (% change NI > % change TA) 1 1 1 1
Earnings Quality (Operating Income > Net Income) 1 1 1 1 Earnings Quality (Operating Income > Net Income) 1 1 1 1
Total Assets Growing Faster Than Total Liabilities 0 1 0 0 Total Assets Growing Faster Than Total Liabilities 1 1 1 0
Increasing Liquidity (Current Ratio) 0 1 1 0 Increasing Liquidity (Current Ratio) 1 1 1 0
% Change Shares Outstanding < +2.0% 1 1 1 1 % Change Shares Outstanding (Diluted) < +2.0% 1 1 1 1
Expanding Operating Margin 0 1 1 0 Expanding Operating Margin 1 1 1 1
Asset Turnover (% change sales > % change assets) 0 0 1 1 Asset Turnover (% change sales > % change assets) 0 0 1 0
Total Liabilities to Operating Cash Flow (EBIT) < 4.0 0 0 0 0 Total Liabilities to Operating Cash Flow (EBIT) < 4.0 0 0 0 0
Piotroski Score (max = 10) 4 8 8 6 Piotroski Score (max = 10) 8 8 9 6
UTX United Technologies Corporation HON Honeywell International Inc.
Altman Probability of Bankruptcy Z‐Score 2012 2013 2014 2015 Altman Probability of Bankruptcy Z‐Score 2012 2013 2014 2015
(Current Assets‐Current Liabilities)/Total Assets 0.0782 0.0880 0.1054 0.0561 ## (Current Assets‐Current Liabilities)/Total Assets 0.1305 0.1844 0.1959 0.0409
Retained Earnings/Total Assets 0.4936 0.5370 0.5869 0.6852 ## Retained Earnings/Total Assets 0.5103 0.5383 0.6103 0.6362
Earnings Before Interest & Tax/Total Assets 0.2761 0.2885 0.3323 0.3169 ## Earnings Before Interest & Tax/Total Assets 0.3277 0.3995 0.4234 0.4569
Market Value Equity/Total Liabilities 0.7093 1.0743 1.0595 0.8596 ## Market Value Equity/Total Liabilities 1.0404 1.5570 1.7133 1.5832
Sales/Total Assets 0.6448 0.6241 0.6342 0.6406 ## Sales/Total Assets 0.8990 0.8587 0.8859 0.7815
Altman Score 2.20 2.61 2.72 2.56 Altman Score 2.91 3.54 3.83 3.50
Altman Z‐Score Scale: Safe Zone = Z > 2.9, Grey Zone = 1.23 < Z < 2.9, Distress Zone = Z < 1.23 Altman Z‐Score Scale: Safe Zone = Z > 2.9, Grey Zone = 1.23 < Z < 2.9, Distress Zone = Z < 1.23
3. Value Creation and DCF Model UTX, Page 10 of 21 Copyright Robert A. Weigand, Ph.D., 2016
31‐Dec‐11 31‐Dec‐12 31‐Dec‐13 31‐Dec‐14 31‐Dec‐15
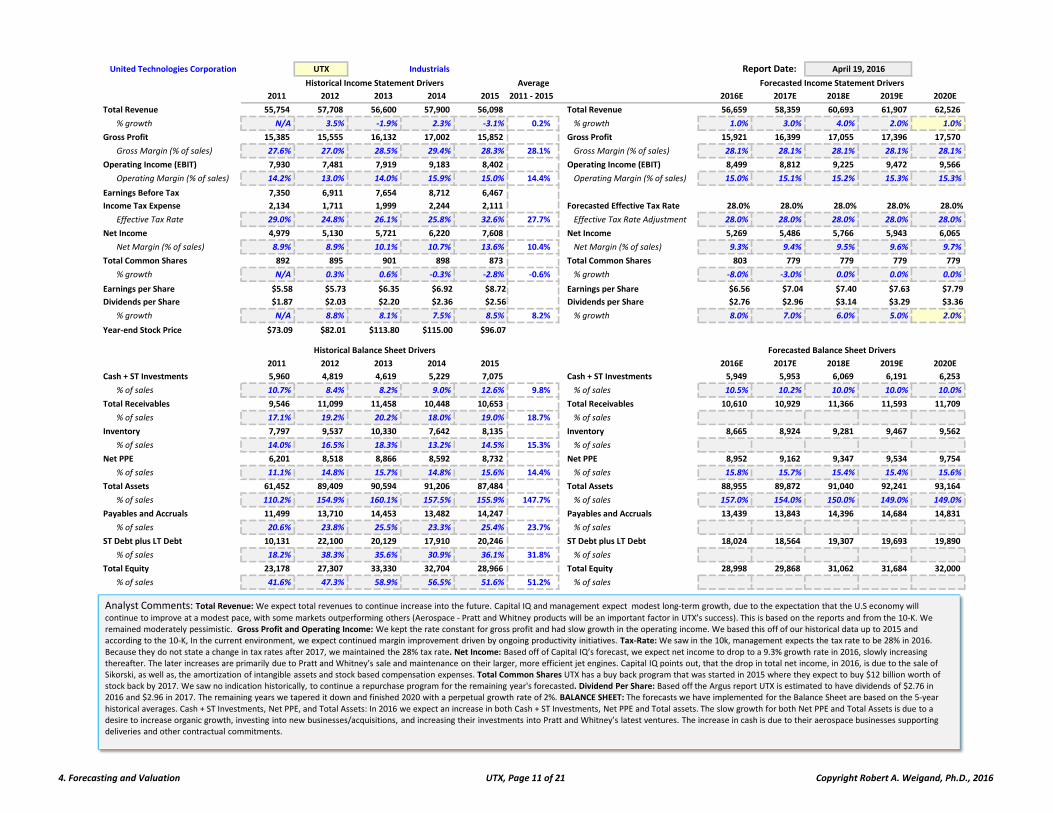
United Technologies Corporation UTX Industrials Report Date:
Average
2011 2012 2013 2014 2015 2011 ‐ 2015 2016E 2017E 2018E 2019E 2020E
Total Revenue 55,754 57,708 56,600 57,900 56,098 Total Revenue 56,659 58,359 60,693 61,907 62,526
% growth N/A 3.5% ‐1.9% 2.3% ‐3.1% 0.2% % growth 1.0% 3.0% 4.0% 2.0% 1.0%
Gross Profit 15,385 15,555 16,132 17,002 15,852 Gross Profit 15,921 16,399 17,055 17,396 17,570
Gross Margin (% of sales) 27.6% 27.0% 28.5% 29.4% 28.3% 28.1% Gross Margin (% of sales) 28.1% 28.1% 28.1% 28.1% 28.1%
Operating Income (EBIT) 7,930 7,481 7,919 9,183 8,402 Operating Income (EBIT) 8,499 8,812 9,225 9,472 9,566
Operating Margin (% of sales) 14.2% 13.0% 14.0% 15.9% 15.0% 14.4% Operating Margin (% of sales) 15.0% 15.1% 15.2% 15.3% 15.3%
Earnings Before Tax 7,350 6,911 7,654 8,712 6,467
Income Tax Expense 2,134 1,711 1,999 2,244 2,111 Forecasted Effective Tax Rate 28.0% 28.0% 28.0% 28.0% 28.0%
Effective Tax Rate 29.0% 24.8% 26.1% 25.8% 32.6% 27.7% Effective Tax Rate Adjustment 28.0% 28.0% 28.0% 28.0% 28.0%
Net Income 4,979 5,130 5,721 6,220 7,608 Net Income 5,269 5,486 5,766 5,943 6,065
Net Margin (% of sales) 8.9% 8.9% 10.1% 10.7% 13.6% 10.4% Net Margin (% of sales) 9.3% 9.4% 9.5% 9.6% 9.7%
Total Common Shares 892 895 901 898 873 Total Common Shares 803 779 779 779 779
% growth N/A 0.3% 0.6% ‐0.3% ‐2.8% ‐0.6% % growth ‐8.0% ‐3.0% 0.0% 0.0% 0.0%
Earnings per Share $5.58 $5.73 $6.35 $6.92 $8.72 Earnings per Share $6.56 $7.04 $7.40 $7.63 $7.79
Dividends per Share $1.87 $2.03 $2.20 $2.36 $2.56 Dividends per Share $2.76 $2.96 $3.14 $3.29 $3.36
% growth N/A 8.8% 8.1% 7.5% 8.5% 8.2% % growth 8.0% 7.0% 6.0% 5.0% 2.0%
Year‐end Stock Price $73.09 $82.01 $113.80 $115.00 $96.07996 997 998 999 1000 996 997 998 999 1000
2011 2012 2013 2014 2015 2016E 2017E 2018E 2019E 2020E
Cash + ST Investments 5,960 4,819 4,619 5,229 7,075 Cash + ST Investments 5,949 5,953 6,069 6,191 6,253
% of sales 10.7% 8.4% 8.2% 9.0% 12.6% 9.8% % of sales 10.5% 10.2% 10.0% 10.0% 10.0%
Total Receivables 9,546 11,099 11,458 10,448 10,653 Total Receivables 10,610 10,929 11,366 11,593 11,709
% of sales 17.1% 19.2% 20.2% 18.0% 19.0% 18.7% % of sales
Inventory 7,797 9,537 10,330 7,642 8,135 Inventory 8,665 8,924 9,281 9,467 9,562
% of sales 14.0% 16.5% 18.3% 13.2% 14.5% 15.3% % of sales
Net PPE 6,201 8,518 8,866 8,592 8,732 Net PPE 8,952 9,162 9,347 9,534 9,754
% of sales 11.1% 14.8% 15.7% 14.8% 15.6% 14.4% % of sales 15.8% 15.7% 15.4% 15.4% 15.6%
Total Assets 61,452 89,409 90,594 91,206 87,484 Total Assets 88,955 89,872 91,040 92,241 93,164
% of sales 110.2% 154.9% 160.1% 157.5% 155.9% 147.7% % of sales 157.0% 154.0% 150.0% 149.0% 149.0%
Payables and Accruals 11,499 13,710 14,453 13,482 14,247 Payables and Accruals 13,439 13,843 14,396 14,684 14,831
% of sales 20.6% 23.8% 25.5% 23.3% 25.4% 23.7% % of sales
ST Debt plus LT Debt 10,131 22,100 20,129 17,910 20,246 ST Debt plus LT Debt 18,024 18,564 19,307 19,693 19,890
% of sales 18.2% 38.3% 35.6% 30.9% 36.1% 31.8% % of sales
Total Equity 23,178 27,307 33,330 32,704 28,966 Total Equity 28,998 29,868 31,062 31,684 32,000
% of sales 41.6% 47.3% 58.9% 56.5% 51.6% 51.2% % of sales
April 19, 2016
Forecasted Income Statement Drivers
Forecasted Balance Sheet Drivers
Historical Income Statement Drivers
Historical Balance Sheet Drivers
Analyst Comments: Total Revenue: We expect total revenues to continue increase into the future. Capital IQ and management expect modest long‐term growth, due to the expectation that the U.S economy will
continue to improve at a modest pace, with some markets outperforming others (Aerospace ‐ Pratt and Whitney products will be an important factor in UTX’s success). This is based on the reports and from the 10‐K. We remained moderately pessimistic. Gross Profit and Operating Income: We kept the rate constant for gross profit and had slow growth in the operating income. We based this off of our historical data up to 2015 and according to the 10‐K, In the current environment, we expect continued margin improvement driven by ongoing productivity initiatives. Tax‐Rate: We saw in the 10k, management expects the tax rate to be 28% in 2016. Because they do not state a change in tax rates after 2017, we maintained the 28% tax rate. Net Income: Based off of Capital IQ’s forecast, we expect net income to drop to a 9.3% growth rate in 2016, slowly increasing thereafter. The later increases are primarily due to Pratt and Whitney’s sale and maintenance on their larger, more efficient jet engines. Capital IQ points out, that the drop in total net income, in 2016, is due to the sale of Sikorski, as well as, the amortization of intangible assets and stock based compensation expenses. Total Common Shares UTX has a buy back program that was started in 2015 where they expect to buy $12 billion worth of stock back by 2017. We saw no indication historically, to continue a repurchase program for the remaining year's forecasted. Dividend Per Share: Based off the Argus report UTX is estimated to have dividends of $2.76 in 2016 and $2.96 in 2017. The remaining years we tapered it down and finished 2020 with a perpetual growth rate of 2%. BALANCE SHEET: The forecasts we have implemented for the Balance Sheet are based on the 5‐year historical averages. Cash + ST Investments, Net PPE, and Total Assets: In 2016 we expect an increase in both Cash + ST Investments, Net PPE and Total assets. The slow growth for both Net PPE and Total Assets is due to a desire to increase organic growth, investing into new businesses/acquisitions, and increasing their investments into Pratt and Whitney’s latest ventures. The increase in cash is due to their aerospace businesses supporting deliveries and other contractual commitments.
4. Forecasting and Valuation UTX, Page 11 of 21 Copyright Robert A. Weigand, Ph.D., 2016
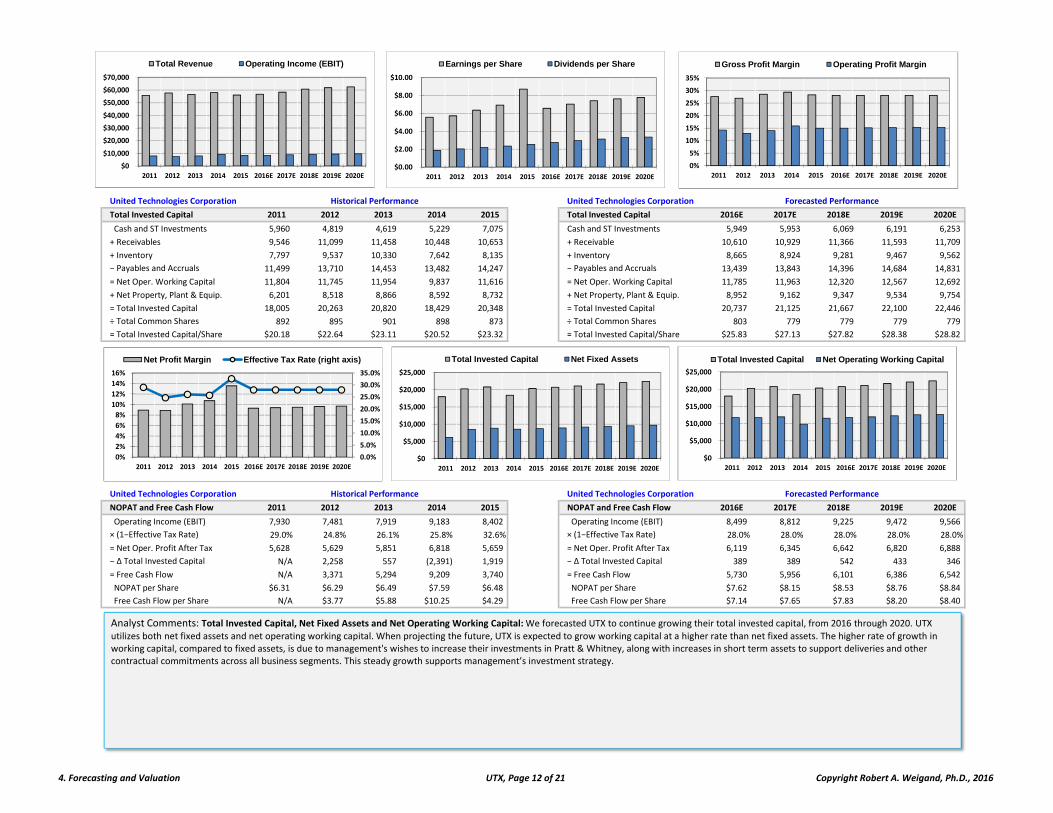
United Technologies Corporation United Technologies Corporation
Total Invested Capital 2011 2012 2013 2014 2015 Total Invested Capital 2016E 2017E 2018E 2019E 2020E
Cash and ST Investments 5,960 4,819 4,619 5,229 7,075 Cash and ST Investments 5,949 5,953 6,069 6,191 6,253
+ Receivables 9,546 11,099 11,458 10,448 10,653 + Receivable 10,610 10,929 11,366 11,593 11,709
+ Inventory 7,797 9,537 10,330 7,642 8,135 + Inventory 8,665 8,924 9,281 9,467 9,562
− Payables and Accruals 11,499 13,710 14,453 13,482 14,247 − Payables and Accruals 13,439 13,843 14,396 14,684 14,831
= Net Oper. Working Capital 11,804 11,745 11,954 9,837 11,616 = Net Oper. Working Capital 11,785 11,963 12,320 12,567 12,692
+ Net Property, Plant & Equip. 6,201 8,518 8,866 8,592 8,732 + Net Property, Plant & Equip. 8,952 9,162 9,347 9,534 9,754
= Total Invested Capital 18,005 20,263 20,820 18,429 20,348 = Total Invested Capital 20,737 21,125 21,667 22,100 22,446
÷ Total Common Shares 892 895 901 898 873 ÷ Total Common Shares 803 779 779 779 779
= Total Invested Capital/Share $20.18 $22.64 $23.11 $20.52 $23.32 = Total Invested Capital/Share $25.83 $27.13 $27.82 $28.38 $28.82
United Technologies Corporation United Technologies Corporation
NOPAT and Free Cash Flow 2011 2012 2013 2014 2015 NOPAT and Free Cash Flow 2016E 2017E 2018E 2019E 2020E
Operating Income (EBIT) 7,930 7,481 7,919 9,183 8,402 Operating Income (EBIT) 8,499 8,812 9,225 9,472 9,566
× (1−Effective Tax Rate) 29.0% 24.8% 26.1% 25.8% 32.6% × (1−Effective Tax Rate) 28.0% 28.0% 28.0% 28.0% 28.0%
= Net Oper. Profit After Tax 5,628 5,629 5,851 6,818 5,659 = Net Oper. Profit After Tax 6,119 6,345 6,642 6,820 6,888
− ∆ Total Invested Capital N/A 2,258 557 (2,391) 1,919 − ∆ Total Invested Capital 389 389 542 433 346
= Free Cash Flow N/A 3,371 5,294 9,209 3,740 = Free Cash Flow 5,730 5,956 6,101 6,386 6,542
NOPAT per Share $6.31 $6.29 $6.49 $7.59 $6.48 NOPAT per Share $7.62 $8.15 $8.53 $8.76 $8.84
Free Cash Flow per Share N/A $3.77 $5.88 $10.25 $4.29 Free Cash Flow per Share $7.14 $7.65 $7.83 $8.20 $8.40
Historical Performance Forecasted Performance
Historical Performance Forecasted Performance
Analyst Comments: Total Invested Capital, Net Fixed Assets and Net Operating Working Capital:We forecasted UTX to continue growing their total invested capital, from 2016 through 2020. UTX
utilizes both net fixed assets and net operating working capital. When projecting the future, UTX is expected to grow working capital at a higher rate than net fixed assets. The higher rate of growth in working capital, compared to fixed assets, is due to management's wishes to increase their investments in Pratt & Whitney, along with increases in short term assets to support deliveries and other contractual commitments across all business segments. This steady growth supports management’s investment strategy.
$0
$5,000
$10,000
$15,000
$20,000
$25,000
2011 2012 2013 2014 2015 2016E 2017E 2018E 2019E 2020E
Total Invested Capital Net Fixed Assets
$0
$10,000
$20,000
$30,000
$40,000
$50,000
$60,000
$70,000
2011 2012 2013 2014 2015 2016E 2017E 2018E 2019E 2020E
Total Revenue Operating Income (EBIT)
$0.00
$2.00
$4.00
$6.00
$8.00
$10.00
2011 2012 2013 2014 2015 2016E 2017E 2018E 2019E 2020E
Earnings per Share Dividends per Share
0%
5%
10%
15%
20%
25%
30%
35%
2011 2012 2013 2014 2015 2016E 2017E 2018E 2019E 2020E
Gross Profit Margin Operating Profit Margin
0.0%
5.0%
10.0%
15.0%
20.0%
25.0%
30.0%
35.0%
0%
2%
4%
6%
8%
10%
12%
14%
16%
2011 2012 2013 2014 2015 2016E 2017E 2018E 2019E 2020E
Net Profit Margin Effective Tax Rate (right axis)
$0
$5,000
$10,000
$15,000
$20,000
$25,000
2011 2012 2013 2014 2015 2016E 2017E 2018E 2019E 2020E
Total Invested Capital Net Operating Working Capital
4. Forecasting and Valuation UTX, Page 12 of 21 Copyright Robert A. Weigand, Ph.D., 2016

United Technologies Corporation
Cost of Capital 2015 Weight % Cost Weighted % United Technologies Corporation
Equity Capitalization $83,840 80.5% 9.670% 7.789%
+ Total Debt $20,246 19.5% 5.000% 0.700% Year 2016E 2017E 2018E 2019E 2020E
= Value of All Securities $104,086 100.0% Dividend Growth Rates 8.0% 7.0% 6.0% 5.0% 2.0%
Expected Future Dividends $2.76 $2.96 $3.14 $3.29 $3.36
Effective Tax Rate 28.00% Alternative RF Rate:
Risk‐Free Rate 1.970% 1.970% 1.884% PV Dividends 1‐4 $9.63 Dividend Yield 2.8%
Beta (5‐Yr) 1.100 Alternative Beta: 1.14159 PV Perpetual Div. $30.27
Market Risk Premium 7.0% 1.100 Intrinsic Value $39.90 If Purchased For: $98.84
CAPM Cost of Equity 9.670% Current Price $98.84 Expected Return = ‐14.1%
Weighted Average Cost of Capital: 8.489% ($98.84) $2.76 $2.96 $3.14 $47.08 $43.798.489% 8.489% 8.489% 8.489% 8.489% 8.489% 8.489% 8.489% 8.489% 8.489%
United Technologies Corporation United Technologies Corporation
ROIC, EVA and MVA 2011 2012 2013 2014 2015 ROIC, EVA and MVA 2016E 2017E 2018E 2019E 2020E
Return on Invested Capital 31.3% 27.8% 28.1% 37.0% 27.8% Return on Invested Capital 29.5% 30.0% 30.7% 30.9% 30.7%
Economic Value‐Added 4,099 3,909 4,083 5,253 3,932 Economic Value‐Added 4,359 4,551 4,803 4,944 4,982
Market Valued‐Added 42,040 46,108 69,204 70,601 54,874 Market Valued‐Added 50,359 42,783 42,100 42,163 42,584
EVA per Share $4.59 $4.37 $4.53 $5.85 $4.51 EVA per Share $5.43 $5.84 $6.17 $6.35 $6.40
MVA per Share $47.11 $51.51 $76.81 $78.59 $62.88 MVA per Share $62.72 $54.94 $54.06 $54.14 $54.68
Perpetual Growth Rate: 1.0%
United Technologies Corporation United Technologies Corporation
DCF Intrinsic Value Model 2011 2012 2013 2014 2015 DCF Intrinsic Value Model 2016E 2017E 2018E 2019E 2020E
PV of Future FCFs 77,275 80,464 82,001 79,753 82,784 PV of Future FCFs 84,081 85,263 86,400 87,349 88,222
+ Cash and ST Investments 5,960 4,819 4,619 5,229 7,075 + Cash and ST Investments 5,949 5,953 6,069 6,191 6,253
= Total Intrinsic Firm Value 83,235 85,283 86,620 84,982 89,859 = Total Intrinsic Firm Value 90,030 91,215 92,469 93,539 94,475
− Total Debt 10,131 22,100 20,129 17,910 20,246 − Total Debt 18,024 18,564 19,307 19,693 19,890
= Intrinsic Value of Equity 73,104 63,183 66,491 67,072 69,613 = Intrinsic Value of Equity 72,006 72,651 73,163 73,846 74,585
÷ Total Common Shares 892 895 901 898 873 ÷ Total Common Shares 803 779 779 779 779
= Per Share Intrinsic Value $81.93 $70.58 $73.80 $74.67 $79.77 = Per Share Intrinsic Value $89.68 $93.29 $93.94 $94.82 $95.77
vs. Year‐End Stock Price $73.09 $82.01 $113.80 $115.00 $96.07 vs. Most Recent Stock Price $98.84
Over (Under) Valuation/Share ($8.84) $11.43 $40.00 $40.33 $16.30 Over (Under) Valuation/Share $9.16
% Over (Under) Valued ‐10.8% 16.2% 54.2% 54.0% 20.4% % Over (Under) Valued 10.2%
Historical Performance Forecasted Performance
Dividend Discount Valuation Model
Historical Performance Forecasted Performance
0
10,000
20,000
30,000
40,000
50,000
60,000
70,000
80,000
0
1,000
2,000
3,000
4,000
5,000
6,000
2011 2012 2013 2014 2015 2016E 2017E 2018E 2019E 2020E
EVA MVA (right axis)
Analyst Comments: NOPAT: With projected revenues continuously growing through 2020, and UTX demonstrating their ability to grow their operating margin; we see NOPAT slowly growing. UTX is
forecasted to see an increase in bottom line profits. Free Cash Flow: Management is purposely holding higher free cash flows in order to support R&D for Pratt and Whitney. As expressed in UTX’s 10‐K, they are always looking for acquisitions, as‐well‐as, potentially reducing their future debt levels. EVA and MVA: We forecasted that UTX will continue to see both economic and market value added. EVA will grow sluggishly, while MVA decreases through 2017, then remains relatively stagnant. ROIC and WACC: WACC saw an increase in their risk‐free rate to the current 10‐year treasury note, as well as a reduction in the beta down to 1.1. Generating a WACC of 8.489%, this is greater than the average rate of return of 8%. Even with a WACC of 8.489%, UTX is earning an ROIC that far exceeds it. This is creating value for the firm.
$0
$2,000
$4,000
$6,000
$8,000
$10,000
2012 2013 2014 2015 2016E 2017E 2018E 2019E 2020E
NOPAT Free Cash Flow
$0
$2
$4
$6
$8
$10
$12
2012 2013 2014 2015 2016E 2017E 2018E 2019E 2020E
NOPAT per Share Free Cash Flow per Share
4. Forecasting and Valuation UTX, Page 13 of 21 Copyright Robert A. Weigand, Ph.D., 2016
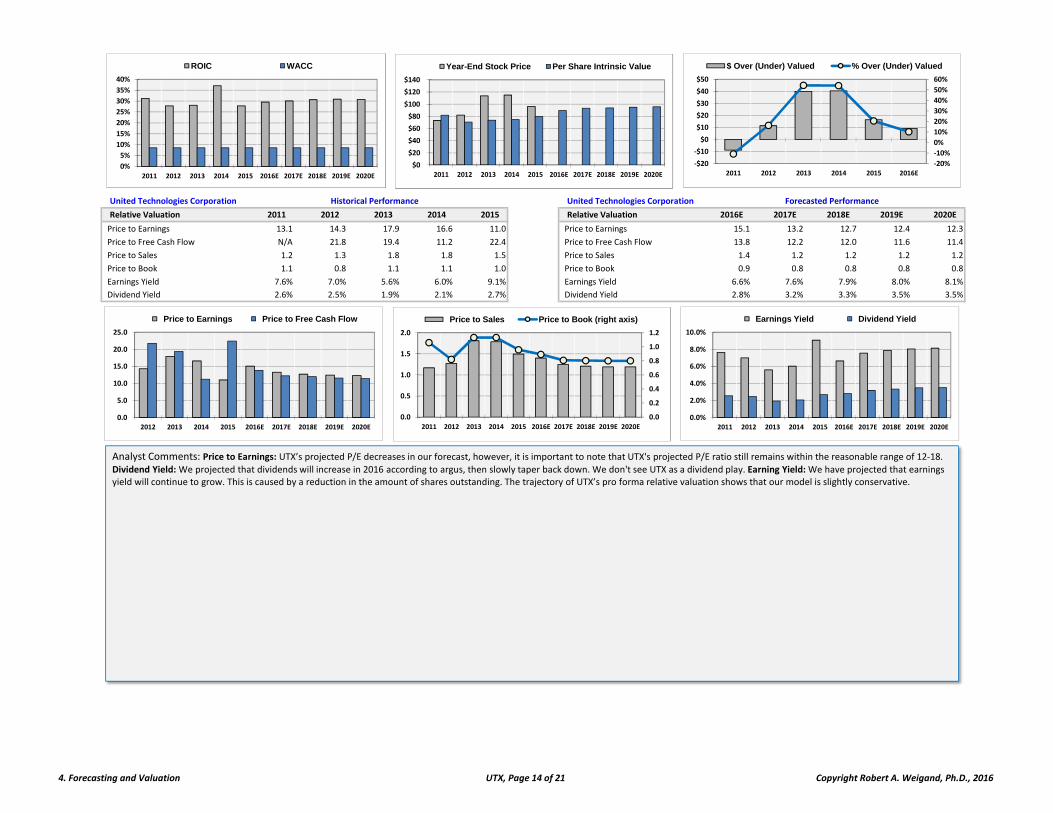
United Technologies Corporation United Technologies Corporation
Relative Valuation 2011 2012 2013 2014 2015 Relative Valuation 2016E 2017E 2018E 2019E 2020E
Price to Earnings 13.1 14.3 17.9 16.6 11.0 Price to Earnings 15.1 13.2 12.7 12.4 12.3
Price to Free Cash Flow N/A 21.8 19.4 11.2 22.4 Price to Free Cash Flow 13.8 12.2 12.0 11.6 11.4
Price to Sales 1.2 1.3 1.8 1.8 1.5 Price to Sales 1.4 1.2 1.2 1.2 1.2
Price to Book 1.1 0.8 1.1 1.1 1.0 Price to Book 0.9 0.8 0.8 0.8 0.8
Earnings Yield 7.6% 7.0% 5.6% 6.0% 9.1% Earnings Yield 6.6% 7.6% 7.9% 8.0% 8.1%
Dividend Yield 2.6% 2.5% 1.9% 2.1% 2.7% Dividend Yield 2.8% 3.2% 3.3% 3.5% 3.5%
Historical Performance Forecasted Performance
Analyst Comments: Price to Earnings: UTX’s projected P/E decreases in our forecast, however, it is important to note that UTX's projected P/E ratio still remains within the reasonable range of 12‐18.
Dividend Yield:We projected that dividends will increase in 2016 according to argus, then slowly taper back down. We don't see UTX as a dividend play. Earning Yield:We have projected that earnings yield will continue to grow. This is caused by a reduction in the amount of shares outstanding. The trajectory of UTX’s pro forma relative valuation shows that our model is slightly conservative.
0%
5%
10%
15%
20%
25%
30%
35%
40%
2011 2012 2013 2014 2015 2016E 2017E 2018E 2019E 2020E
ROIC WACC
$0
$20
$40
$60
$80
$100
$120
$140
2011 2012 2013 2014 2015 2016E 2017E 2018E 2019E 2020E
Year-End Stock Price Per Share Intrinsic Value
‐20%
‐10%
0%
10%
20%
30%
40%
50%
60%
‐$20
‐$10
$0
$10
$20
$30
$40
$50
2011 2012 2013 2014 2015 2016E
$ Over (Under) Valued % Over (Under) Valued
0.0
5.0
10.0
15.0
20.0
25.0
2012 2013 2014 2015 2016E 2017E 2018E 2019E 2020E
Price to Earnings Price to Free Cash Flow
0.0%
2.0%
4.0%
6.0%
8.0%
10.0%
2011 2012 2013 2014 2015 2016E 2017E 2018E 2019E 2020E
Earnings Yield Dividend Yield
0.0
0.2
0.4
0.6
0.8
1.0
1.2
0.0
0.5
1.0
1.5
2.0
2011 2012 2013 2014 2015 2016E 2017E 2018E 2019E 2020E
Price to Sales Price to Book (right axis)
4. Forecasting and Valuation UTX, Page 14 of 21 Copyright Robert A. Weigand, Ph.D., 2016