Embed Size (px)
Citation preview
UV Resonance Raman Spectroscopy Monitors PolyglutamineBackbone and Side Chain Hydrogen Bonding and FibrillizationKan Xiong,† David Punihaole, and Sanford A. Asher*
Department of Chemistry, University of Pittsburgh, Pittsburgh, Pennsylvania 15260, United States
*S Supporting Information
ABSTRACT: We utilize 198 and 204 nm excited UVresonance Raman spectroscopy (UVRR) and circular dichro-ism spectroscopy (CD) to monitor the backbone conforma-tion and the Gln side chain hydrogen bonding (HB) of a short,mainly polyGln peptide with a D2Q10K2 sequence (Q10). Wemeasured the UVRR spectra of valeramide to determine thedependence of the primary amide vibrations on amide HB. Weobserve that a nondisaggregated Q10 (NDQ10) solution(prepared by directly dissolving the original synthesized peptide in pure water) exists in a β-sheet conformation, where the Glnside chains form hydrogen bonds to either the backbone or other Gln side chains. At 60 °C, these solutions readily form amyloidfibrils. We used the polyGln disaggregation protocol of Wetzel et al. [Wetzel, R., et al. (2006) Methods Enzymol. 413, 34−74] todissolve the Q10 β-sheet aggregates. We observe that the disaggregated Q10 (DQ10) solutions adopt PPII-like and 2.51-helixconformations where the Gln side chains form hydrogen bonds with water. In contrast, these samples do not form fibrils. TheNDQ10 β-sheet solution structure is essentially identical to that found in the NDQ10 solid formed upon evaporation of thesolution. The DQ10 PPII and 2.51-helix solution structure is essentially identical to that in the DQ10 solid. Although the NDQ10solution readily forms fibrils when heated, the DQ10 solution does not form fibrils unless seeded with the NDQ10 solution. Thisresult demonstrates very high activation barriers between these solution conformations. The NDQ10 fibril secondary structure isessentially identical to that of the NDQ10 solution, except that the NDQ10 fibril backbone conformational distribution isnarrower than in the dissolved species. The NDQ10 fibril Gln side chain geometry is more constrained than when NDQ10 is insolution. The NDQ10 fibril structure is identical to that of the DQ10 fibril seeded by the NDQ10 solution.
There are at least nine neurodegenerative diseases that arecaused by long CAG DNA repeats that encode proteins
with long tracts of polyGln residues.1,2 In these diseases, theextended polyGln regions aggregate to form amyloid fibrils.3−5
Previous studies suggest that polyGln fibril structures arestabilized by both main chain and side chain hydrogen bonding(HB).6−9 However, there has been little examination of the roleof HB in the aggregation mechanism(s) of polyGln richpeptides and proteins.10
Given the central role that backbone and side chain HB canpotentially play in stabilizing polyGln aggregates, it is importantto find spectral markers for tracking these hydrogen bonds.Backbone HB is sometimes monitored by measuring thefrequencies of the backbone amide vibrations, such as the AmIvibration (mainly CO s) and the AmIII vibration (mainly in-phase combination of CN s and NH b) and the N−Hstretching vibration.11−16 The frequency of the AmII vibration(mainly out-of-phase combination of CN s and NH b) alsodepends on backbone HB.17
However, a method for studying side chain HB is needed.The CO stretching frequencies of Asn, Gln, protonated Asp,and Glu side chains are sensitive to HB.18−20 Unfortunately, theuse of IR spectroscopy for monitoring side chain vibrations ischallenging because of spectral congestion, and isotopiclabeling is often required to unambiguously assign bands.Solid state NMR spectroscopy (ssNMR) has been used to
characterize Gln side chain HB.21,22 However, ssNMR requireslong measurement times and often requires sophisticatedisotope labeling.In this work, we show that UVRR can selectively enhance the
Gln primary amide side chain vibrations, and that thesevibrations can be used to track Gln side chain HB. Here, weutilize 198 and 204 nm excited UVRR and CD to monitor thebackbone conformation and the Gln side chain HB of a short,mainly polyGln peptide Q10, with a D2Q10K2 sequence.Previous studies of similar peptides have shown that thesepeptides can aggregate to form β-sheet rich amyloidfibrils.8,9,23−29 We observe that nondisaggregated Q10(NDQ10) in solution occurs as β-sheets in which the Glnside chains form hydrogen bonds to either the backbone orother Gln side chains. At 60 °C, these solutions readily formamyloid fibrils. We used the polyGln disaggregation protocol ofWetzel et al.30 to disaggregate Q10. We observe that adisaggregated Q10 (DQ10) solution adopts PPII-like and 2.51-helix conformations in which the Gln side chains formhydrogen bonds to water. These samples do not form fibrils.Addition of small quantities of NDQ10 solution readily
Received: April 30, 2012Revised: June 28, 2012Published: July 2, 2012
Article
pubs.acs.org/biochemistry
© 2012 American Chemical Society 5822 dx.doi.org/10.1021/bi300551b | Biochemistry 2012, 51, 5822−5830
nucleates fibrils. This directly demonstrates that a highactivation barrier exists between the monomer extendedDQ10 solution conformation and the β-sheet structures thatfibrillize.
■ EXPERIMENTAL PROCEDURESMaterials. The short mainly polyGln peptide with a
D2Q10K2 sequence (Q10) (>90% pure) was synthesized byAnaSpec Inc. by using a solid-phase peptide synthesis method.Briefly, the first amino acid Fmoc-AA-OH was coupled to theresin, and the peptide was synthesized through sequentialsynthetic operations of Fmoc deprotection, washing, Fmocamino acid coupling, and washing. The synthesized crudepeptide was obtained after acid cleavage from the solid supportresin using a trifluoroacetic acid (TFA) cocktail (where TFA isthe major component).The resulting crude peptide was then purified via preparative
high-performance liquid chromatography (using large columnsand high flow rates) by using a mobile-phase gradientconsisting of 0.1% (v/v) TFA in water and pure acetonitrile.The purified sample was then lyophilized.Valeramide (97% pure) was purchased from Alfa Aesar. L-
Glutamine (99% pure) was purchased from Acros. TFA (99.5%pure) was purchased from Acros. 1,1,1,3,3,3-Hexafluoro-2-propanol (HFIP, ≥99% pure) was purchased from Fluka.Solutions of nondisaggregated Q10 (NDQ10) were prepared
by directly dissolving the peptide in pure water at aconcentration of 1 mg/mL at pH 4.3. NDQ10 solid sampleswere prepared by evaporating the NDQ10 solution. The UVRRspectra were identical to that of the solid sample obtained fromthe manufacturer. We used the polyGln disaggregation protocolof Wetzel et al.30 to dissolve the Q10 aggregates. Briefly,solutions of disaggregated Q10 (DQ10) were prepared bysuspending 10 mg of Q10 in a 5 mL solution of a 1:1 (v/v)TFA/HFIP mixture [TFA alone dissolves Q10 aggregates (seeFigure S3 of the Supporting Information); the primary functionof HFIP is to facilitate the removal of TFA30]. The sampleswere then sonicated for 20 min [sonication is not essential (seeFigure S3 of the Supporting Information)] and incubated atroom temperature for ∼2 h. The solvents were evaporated witha gentle stream of dry N2 gas for ∼20 min. The peptide filmwas resuspended in pure water at a final concentration of ∼1mg/mL, and the pH was adjusted to 7. The peptide solutionwas centrifuged at 627000g for 30 min at 4 °C, and the top 66%of the solution was used. DQ10 solid samples were prepared byevaporating the DQ10 solution. NDQ10 fibrils were preparedby incubating a 4 mg/mL NDQ10 solution at 60 °C for ∼1week (60 °C was chosen to accelerate the reaction). DQ10fibrils were prepared by incubating a 4 mg/mL DQ10 solutionafter seeding with a 2% NDQ10 solution at 60 °C for ∼4 days.Fibrils were harvested by centrifugation at 627000g for 15 min.CD spectra between 190 and 250 nm were measured by
using a Jasco-715 spectropolarimeter with a 0.02 cm pathlength cuvette. Five 1 min accumulations were averaged.The UVRR spectrometer was described in detail by Bykov et
al.31 Briefly, 204 nm UV light was obtained by generating thefifth anti-Stokes Raman harmonic of the third harmonic of aNd:YAG laser (Coherent, Infinity); 198 nm UV light wasobtained by mixing the third harmonic of 792 nm light with thefundamental of a 1 kHz repetition rate tunable Ti:sapphire laser(DM20-527 TU-L-FHG) from Photonics Industries.The liquid sample was circulated in a free surface,
temperature-controlled stream. A spinning cell was used for
the solid samples to minimize photodegradation; the solidsamples were packed into a circular groove of the cylindricalspinning disk. The fibrils were resuspended in 100 μL of purewater and transferred into a spinning Suprasil NMR tube. A165° sampling backscattering geometry was used. The collectedlight was dispersed by a double monochromator onto a back-thinned CCD camera with a Lumogen E coating (PrincetonInstruments, Spec 10 System). We averaged four 5 minaccumulations. The Raman spectral frequencies are accurate to±1 cm−1. The relative standard deviations in spectral intensitiesare ≤1%.Electron micrographs were measured by using a Tecnai T12
microscope (FEI) operating at 120 kV. Samples were preparedon carbon-coated grids and stained with 2% uranyl acetate.Samples were magnified 30000×.X-ray patterns were measured by using a Bruker Smart Apex
CCD diffractometer.
■ RESULTSUVRR of Valeramide. We examined the UVRR spectra of
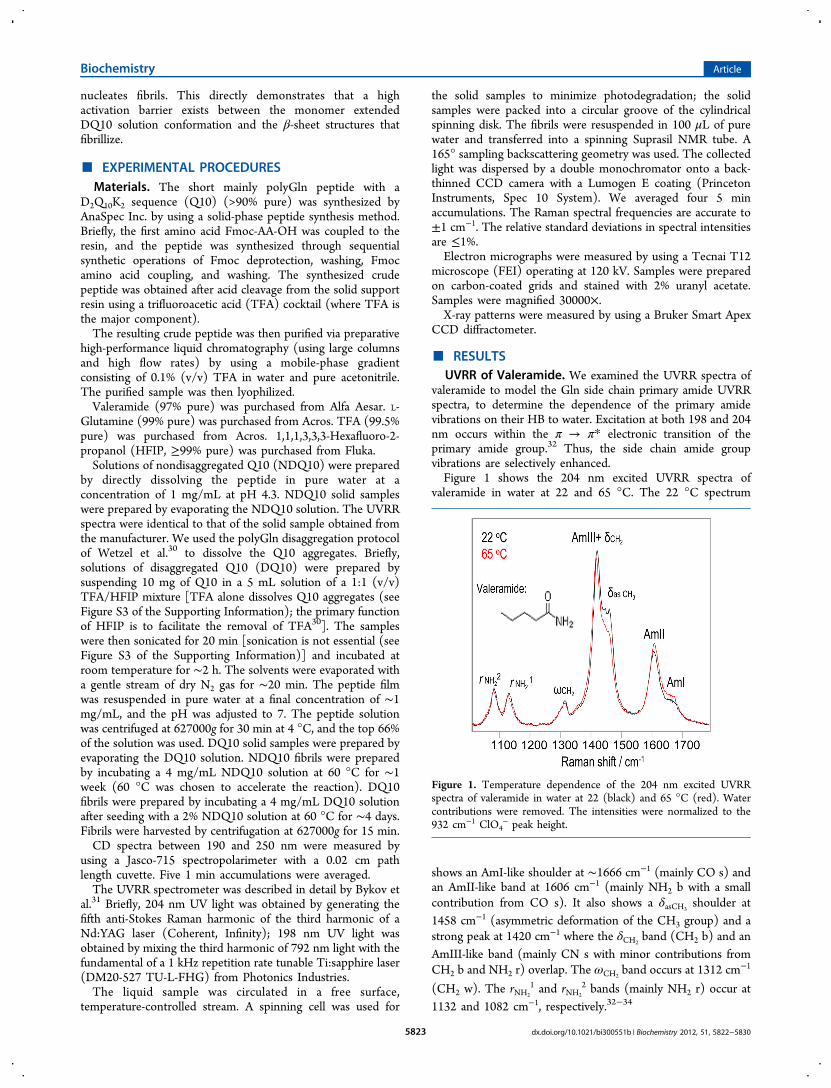
valeramide to model the Gln side chain primary amide UVRRspectra, to determine the dependence of the primary amidevibrations on their HB to water. Excitation at both 198 and 204nm occurs within the π → π* electronic transition of theprimary amide group.32 Thus, the side chain amide groupvibrations are selectively enhanced.Figure 1 shows the 204 nm excited UVRR spectra of
valeramide in water at 22 and 65 °C. The 22 °C spectrum
shows an AmI-like shoulder at ∼1666 cm−1 (mainly CO s) andan AmII-like band at 1606 cm−1 (mainly NH2 b with a smallcontribution from CO s). It also shows a δasCH3
shoulder at1458 cm−1 (asymmetric deformation of the CH3 group) and astrong peak at 1420 cm−1 where the δCH2
band (CH2 b) and anAmIII-like band (mainly CN s with minor contributions fromCH2 b and NH2 r) overlap. The ωCH2
band occurs at 1312 cm−1
(CH2 w). The rNH2
1 and rNH2
2 bands (mainly NH2 r) occur at1132 and 1082 cm−1, respectively.32−34
Figure 1. Temperature dependence of the 204 nm excited UVRRspectra of valeramide in water at 22 (black) and 65 °C (red). Watercontributions were removed. The intensities were normalized to the932 cm−1 ClO4
− peak height.
Biochemistry Article
dx.doi.org/10.1021/bi300551b | Biochemistry 2012, 51, 5822−58305823
As the temperature increases to 65 °C, the AmI bandfrequency changes little. The AmII band upshifts 2 cm−1. TheδasCH3
band downshifts 2 cm−1, and its intensity decreases. The
AmIII+δCH2peak downshifts 4 cm−1. The ωCH2
band does not
change. The rNH2
1 and rNH2
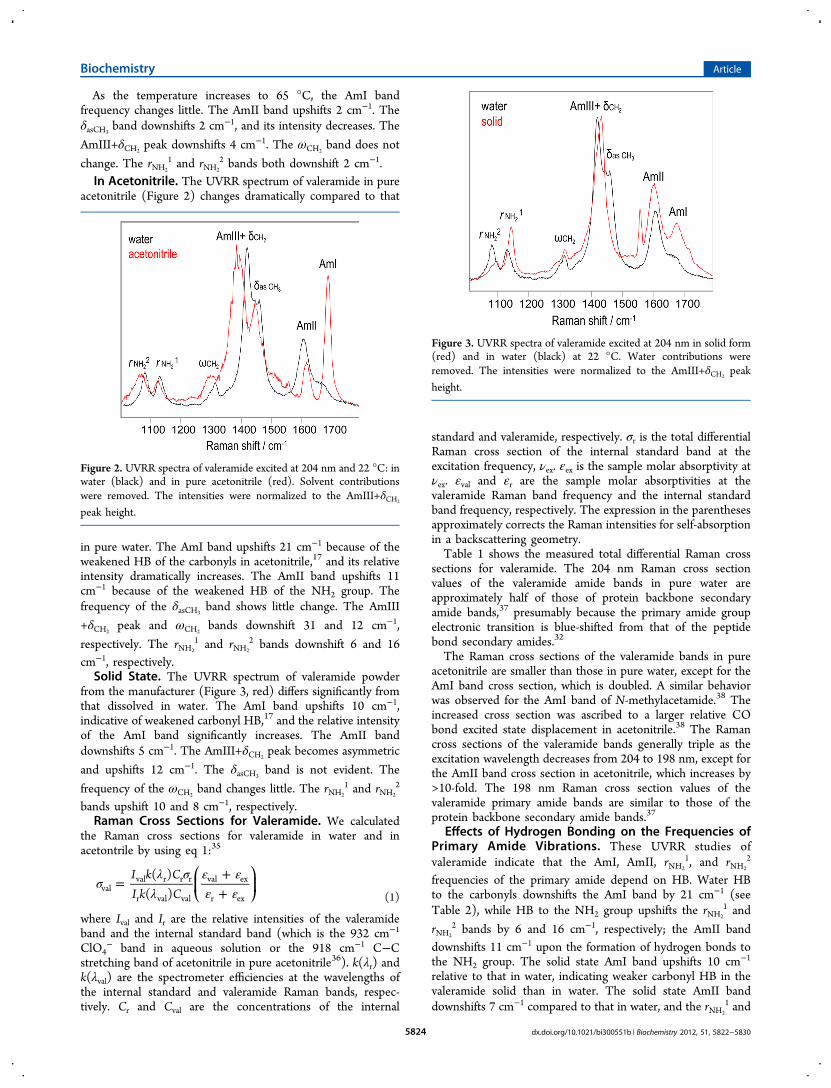
2 bands both downshift 2 cm−1.In Acetonitrile. The UVRR spectrum of valeramide in pure
acetonitrile (Figure 2) changes dramatically compared to that
in pure water. The AmI band upshifts 21 cm−1 because of theweakened HB of the carbonyls in acetonitrile,17 and its relativeintensity dramatically increases. The AmII band upshifts 11cm−1 because of the weakened HB of the NH2 group. Thefrequency of the δasCH3
band shows little change. The AmIII
+δCH2peak and ωCH2
bands downshift 31 and 12 cm−1,
respectively. The rNH2
1 and rNH2
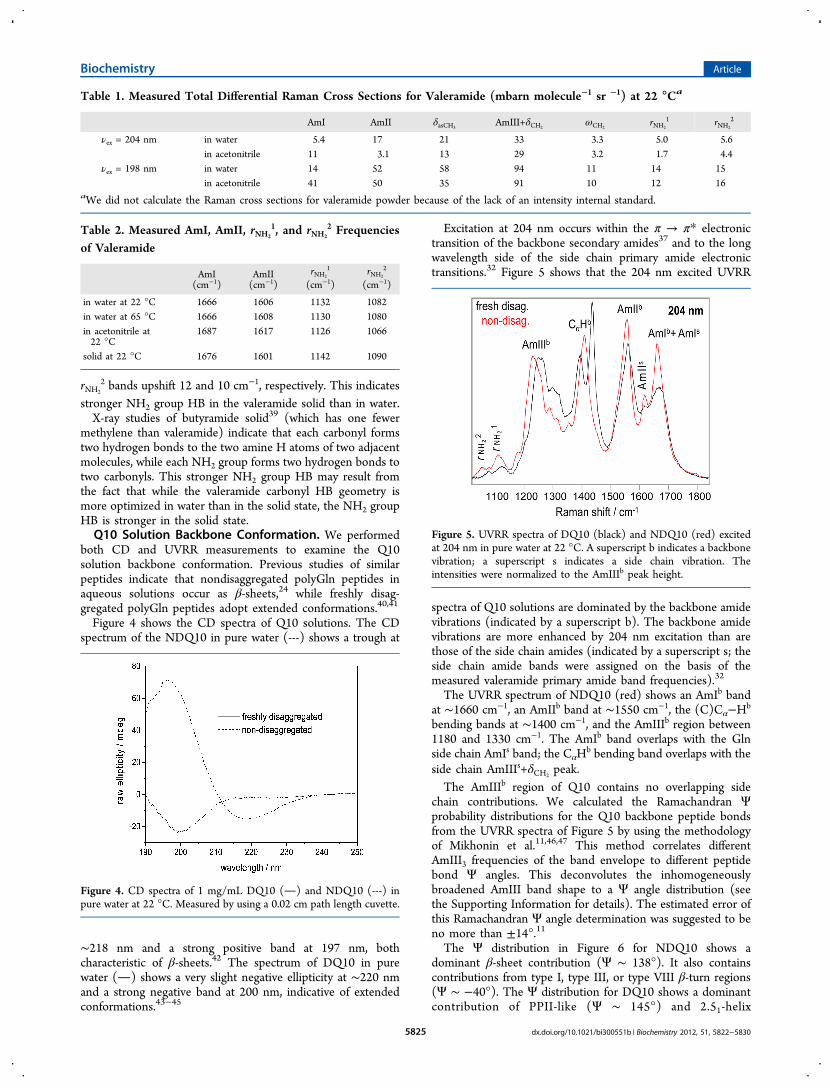
2 bands downshift 6 and 16cm−1, respectively.Solid State. The UVRR spectrum of valeramide powder
from the manufacturer (Figure 3, red) differs significantly fromthat dissolved in water. The AmI band upshifts 10 cm−1,indicative of weakened carbonyl HB,17 and the relative intensityof the AmI band significantly increases. The AmII banddownshifts 5 cm−1. The AmIII+δCH2
peak becomes asymmetric
and upshifts 12 cm−1. The δasCH3band is not evident. The
frequency of the ωCH2band changes little. The rNH2
1 and rNH2
2
bands upshift 10 and 8 cm−1, respectively.Raman Cross Sections for Valeramide. We calculated
the Raman cross sections for valeramide in water and inacetontrile by using eq 1:35
σλ σ
λε εε ε
=++
⎛⎝⎜
⎞⎠⎟
I k CI k C
( )( )val
val r r r
r val val
val ex
r ex (1)
where Ival and Ir are the relative intensities of the valeramideband and the internal standard band (which is the 932 cm−1
ClO4− band in aqueous solution or the 918 cm−1 C−C
stretching band of acetonitrile in pure acetonitrile36). k(λr) andk(λval) are the spectrometer efficiencies at the wavelengths ofthe internal standard and valeramide Raman bands, respec-tively. Cr and Cval are the concentrations of the internal
standard and valeramide, respectively. σr is the total differentialRaman cross section of the internal standard band at theexcitation frequency, νex. εex is the sample molar absorptivity atνex. εval and εr are the sample molar absorptivities at thevaleramide Raman band frequency and the internal standardband frequency, respectively. The expression in the parenthesesapproximately corrects the Raman intensities for self-absorptionin a backscattering geometry.Table 1 shows the measured total differential Raman cross
sections for valeramide. The 204 nm Raman cross sectionvalues of the valeramide amide bands in pure water areapproximately half of those of protein backbone secondaryamide bands,37 presumably because the primary amide groupelectronic transition is blue-shifted from that of the peptidebond secondary amides.32
The Raman cross sections of the valeramide bands in pureacetonitrile are smaller than those in pure water, except for theAmI band cross section, which is doubled. A similar behaviorwas observed for the AmI band of N-methylacetamide.38 Theincreased cross section was ascribed to a larger relative CObond excited state displacement in acetonitrile.38 The Ramancross sections of the valeramide bands generally triple as theexcitation wavelength decreases from 204 to 198 nm, except forthe AmII band cross section in acetonitrile, which increases by>10-fold. The 198 nm Raman cross section values of thevaleramide primary amide bands are similar to those of theprotein backbone secondary amide bands.37
Effects of Hydrogen Bonding on the Frequencies ofPrimary Amide Vibrations. These UVRR studies ofvaleramide indicate that the AmI, AmII, rNH2
1, and rNH2
2
frequencies of the primary amide depend on HB. Water HBto the carbonyls downshifts the AmI band by 21 cm−1 (seeTable 2), while HB to the NH2 group upshifts the rNH2
1 and
rNH2
2 bands by 6 and 16 cm−1, respectively; the AmII banddownshifts 11 cm−1 upon the formation of hydrogen bonds tothe NH2 group. The solid state AmI band upshifts 10 cm−1
relative to that in water, indicating weaker carbonyl HB in thevaleramide solid than in water. The solid state AmII banddownshifts 7 cm−1 compared to that in water, and the rNH2
1 and
Figure 2. UVRR spectra of valeramide excited at 204 nm and 22 °C: inwater (black) and in pure acetonitrile (red). Solvent contributionswere removed. The intensities were normalized to the AmIII+δCH2
peak height.
Figure 3. UVRR spectra of valeramide excited at 204 nm in solid form(red) and in water (black) at 22 °C. Water contributions wereremoved. The intensities were normalized to the AmIII+δCH2
peak
height.
Biochemistry Article
dx.doi.org/10.1021/bi300551b | Biochemistry 2012, 51, 5822−58305824
rNH2
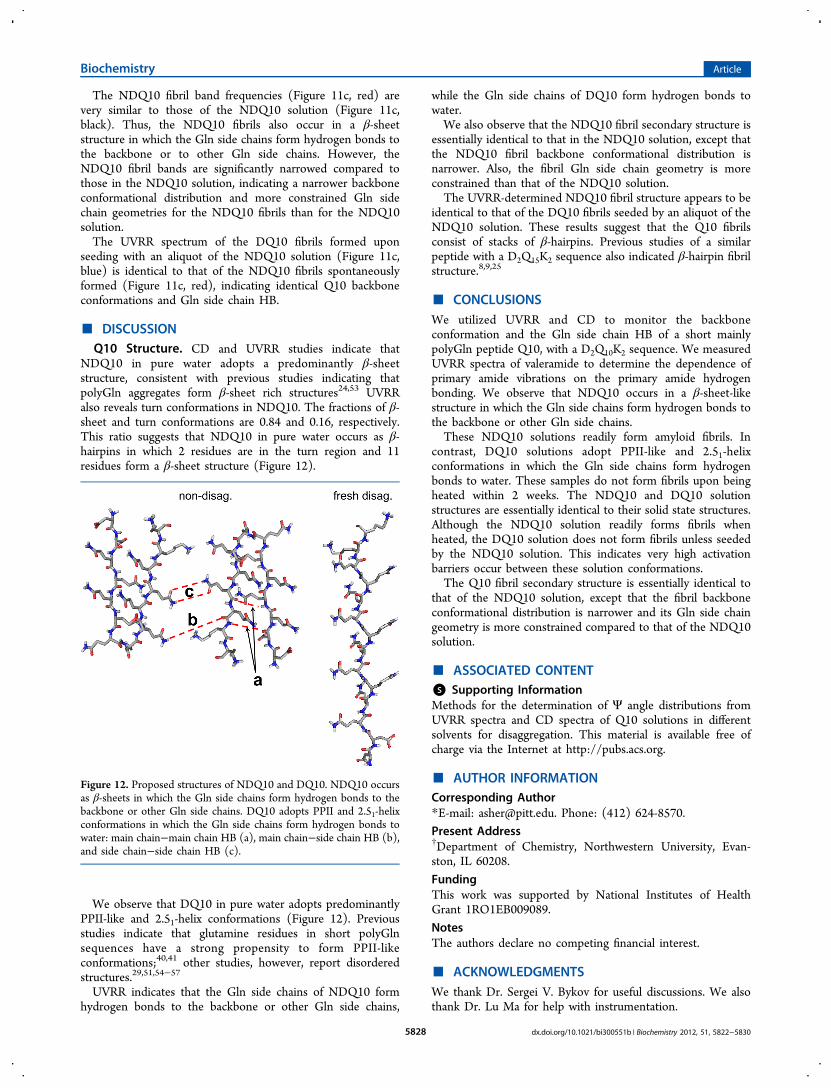
2 bands upshift 12 and 10 cm−1, respectively. This indicatesstronger NH2 group HB in the valeramide solid than in water.X-ray studies of butyramide solid39 (which has one fewer
methylene than valeramide) indicate that each carbonyl formstwo hydrogen bonds to the two amine H atoms of two adjacentmolecules, while each NH2 group forms two hydrogen bonds totwo carbonyls. This stronger NH2 group HB may result fromthe fact that while the valeramide carbonyl HB geometry ismore optimized in water than in the solid state, the NH2 groupHB is stronger in the solid state.Q10 Solution Backbone Conformation. We performed
both CD and UVRR measurements to examine the Q10solution backbone conformation. Previous studies of similarpeptides indicate that nondisaggregated polyGln peptides inaqueous solutions occur as β-sheets,24 while freshly disag-gregated polyGln peptides adopt extended conformations.40,41
Figure 4 shows the CD spectra of Q10 solutions. The CDspectrum of the NDQ10 in pure water (---) shows a trough at
∼218 nm and a strong positive band at 197 nm, bothcharacteristic of β-sheets.42 The spectrum of DQ10 in purewater () shows a very slight negative ellipticity at ∼220 nmand a strong negative band at 200 nm, indicative of extendedconformations.43−45
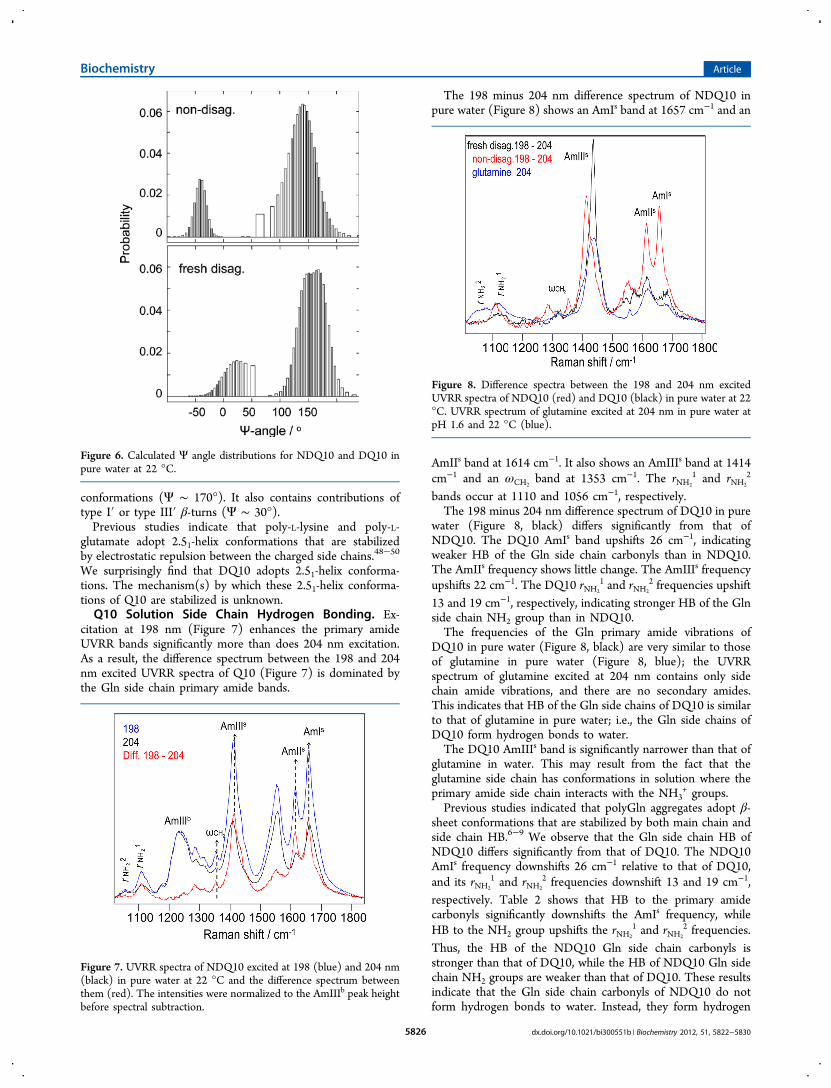
Excitation at 204 nm occurs within the π → π* electronictransition of the backbone secondary amides37 and to the longwavelength side of the side chain primary amide electronictransitions.32 Figure 5 shows that the 204 nm excited UVRR
spectra of Q10 solutions are dominated by the backbone amidevibrations (indicated by a superscript b). The backbone amidevibrations are more enhanced by 204 nm excitation than arethose of the side chain amides (indicated by a superscript s; theside chain amide bands were assigned on the basis of themeasured valeramide primary amide band frequencies).32
The UVRR spectrum of NDQ10 (red) shows an AmIb bandat ∼1660 cm−1, an AmIIb band at ∼1550 cm−1, the (C)Cα−Hb
bending bands at ∼1400 cm−1, and the AmIIIb region between1180 and 1330 cm−1. The AmIb band overlaps with the Glnside chain AmIs band; the CαH
b bending band overlaps with theside chain AmIIIs+δCH2
peak.The AmIIIb region of Q10 contains no overlapping side
chain contributions. We calculated the Ramachandran Ψprobability distributions for the Q10 backbone peptide bondsfrom the UVRR spectra of Figure 5 by using the methodologyof Mikhonin et al.11,46,47 This method correlates differentAmIII3 frequencies of the band envelope to different peptidebond Ψ angles. This deconvolutes the inhomogeneouslybroadened AmIII band shape to a Ψ angle distribution (seethe Supporting Information for details). The estimated error ofthis Ramachandran Ψ angle determination was suggested to beno more than ±14°.11
The Ψ distribution in Figure 6 for NDQ10 shows adominant β-sheet contribution (Ψ ∼ 138°). It also containscontributions from type I, type III, or type VIII β-turn regions(Ψ ∼ −40°). The Ψ distribution for DQ10 shows a dominantcontribution of PPII-like (Ψ ∼ 145°) and 2.51-helix
Table 1. Measured Total Differential Raman Cross Sections for Valeramide (mbarn molecule−1 sr −1) at 22 °Ca
AmI AmII δasCH3AmIII+δCH2
ωCH2rNH2
1 rNH2
2
νex = 204 nm in water 5.4 17 21 33 3.3 5.0 5.6in acetonitrile 11 3.1 13 29 3.2 1.7 4.4
νex = 198 nm in water 14 52 58 94 11 14 15in acetonitrile 41 50 35 91 10 12 16
aWe did not calculate the Raman cross sections for valeramide powder because of the lack of an intensity internal standard.
Table 2. Measured AmI, AmII, rNH2
1, and rNH2
2 Frequenciesof Valeramide
AmI(cm−1)
AmII(cm−1)
rNH2
1
(cm−1)rNH2
2
(cm−1)
in water at 22 °C 1666 1606 1132 1082in water at 65 °C 1666 1608 1130 1080in acetonitrile at22 °C
1687 1617 1126 1066
solid at 22 °C 1676 1601 1142 1090
Figure 4. CD spectra of 1 mg/mL DQ10 () and NDQ10 (---) inpure water at 22 °C. Measured by using a 0.02 cm path length cuvette.
Figure 5. UVRR spectra of DQ10 (black) and NDQ10 (red) excitedat 204 nm in pure water at 22 °C. A superscript b indicates a backbonevibration; a superscript s indicates a side chain vibration. Theintensities were normalized to the AmIIIb peak height.
Biochemistry Article
dx.doi.org/10.1021/bi300551b | Biochemistry 2012, 51, 5822−58305825
conformations (Ψ ∼ 170°). It also contains contributions oftype I′ or type III′ β-turns (Ψ ∼ 30°).Previous studies indicate that poly-L-lysine and poly-L-
glutamate adopt 2.51-helix conformations that are stabilizedby electrostatic repulsion between the charged side chains.48−50
We surprisingly find that DQ10 adopts 2.51-helix conforma-tions. The mechanism(s) by which these 2.51-helix conforma-tions of Q10 are stabilized is unknown.Q10 Solution Side Chain Hydrogen Bonding. Ex-
citation at 198 nm (Figure 7) enhances the primary amideUVRR bands significantly more than does 204 nm excitation.As a result, the difference spectrum between the 198 and 204nm excited UVRR spectra of Q10 (Figure 7) is dominated bythe Gln side chain primary amide bands.
The 198 minus 204 nm difference spectrum of NDQ10 inpure water (Figure 8) shows an AmIs band at 1657 cm−1 and an
AmIIs band at 1614 cm−1. It also shows an AmIIIs band at 1414cm−1 and an ωCH2
band at 1353 cm−1. The rNH2
1 and rNH2
2
bands occur at 1110 and 1056 cm−1, respectively.The 198 minus 204 nm difference spectrum of DQ10 in pure
water (Figure 8, black) differs significantly from that ofNDQ10. The DQ10 AmIs band upshifts 26 cm−1, indicatingweaker HB of the Gln side chain carbonyls than in NDQ10.The AmIIs frequency shows little change. The AmIIIs frequencyupshifts 22 cm−1. The DQ10 rNH2
1 and rNH2
2 frequencies upshift13 and 19 cm−1, respectively, indicating stronger HB of the Glnside chain NH2 group than in NDQ10.The frequencies of the Gln primary amide vibrations of
DQ10 in pure water (Figure 8, black) are very similar to thoseof glutamine in pure water (Figure 8, blue); the UVRRspectrum of glutamine excited at 204 nm contains only sidechain amide vibrations, and there are no secondary amides.This indicates that HB of the Gln side chains of DQ10 is similarto that of glutamine in pure water; i.e., the Gln side chains ofDQ10 form hydrogen bonds to water.The DQ10 AmIIIs band is significantly narrower than that of
glutamine in water. This may result from the fact that theglutamine side chain has conformations in solution where theprimary amide side chain interacts with the NH3
+ groups.Previous studies indicated that polyGln aggregates adopt β-
sheet conformations that are stabilized by both main chain andside chain HB.6−9 We observe that the Gln side chain HB ofNDQ10 differs significantly from that of DQ10. The NDQ10AmIs frequency downshifts 26 cm−1 relative to that of DQ10,and its rNH2
1 and rNH2
2 frequencies downshift 13 and 19 cm−1,respectively. Table 2 shows that HB to the primary amidecarbonyls significantly downshifts the AmIs frequency, whileHB to the NH2 group upshifts the rNH2
1 and rNH2
2 frequencies.Thus, the HB of the NDQ10 Gln side chain carbonyls isstronger than that of DQ10, while the HB of NDQ10 Gln sidechain NH2 groups are weaker than that of DQ10. These resultsindicate that the Gln side chain carbonyls of NDQ10 do notform hydrogen bonds to water. Instead, they form hydrogen
Figure 6. Calculated Ψ angle distributions for NDQ10 and DQ10 inpure water at 22 °C.
Figure 7. UVRR spectra of NDQ10 excited at 198 (blue) and 204 nm(black) in pure water at 22 °C and the difference spectrum betweenthem (red). The intensities were normalized to the AmIIIb peak heightbefore spectral subtraction.
Figure 8. Difference spectra between the 198 and 204 nm excitedUVRR spectra of NDQ10 (red) and DQ10 (black) in pure water at 22°C. UVRR spectrum of glutamine excited at 204 nm in pure water atpH 1.6 and 22 °C (blue).
Biochemistry Article
dx.doi.org/10.1021/bi300551b | Biochemistry 2012, 51, 5822−58305826
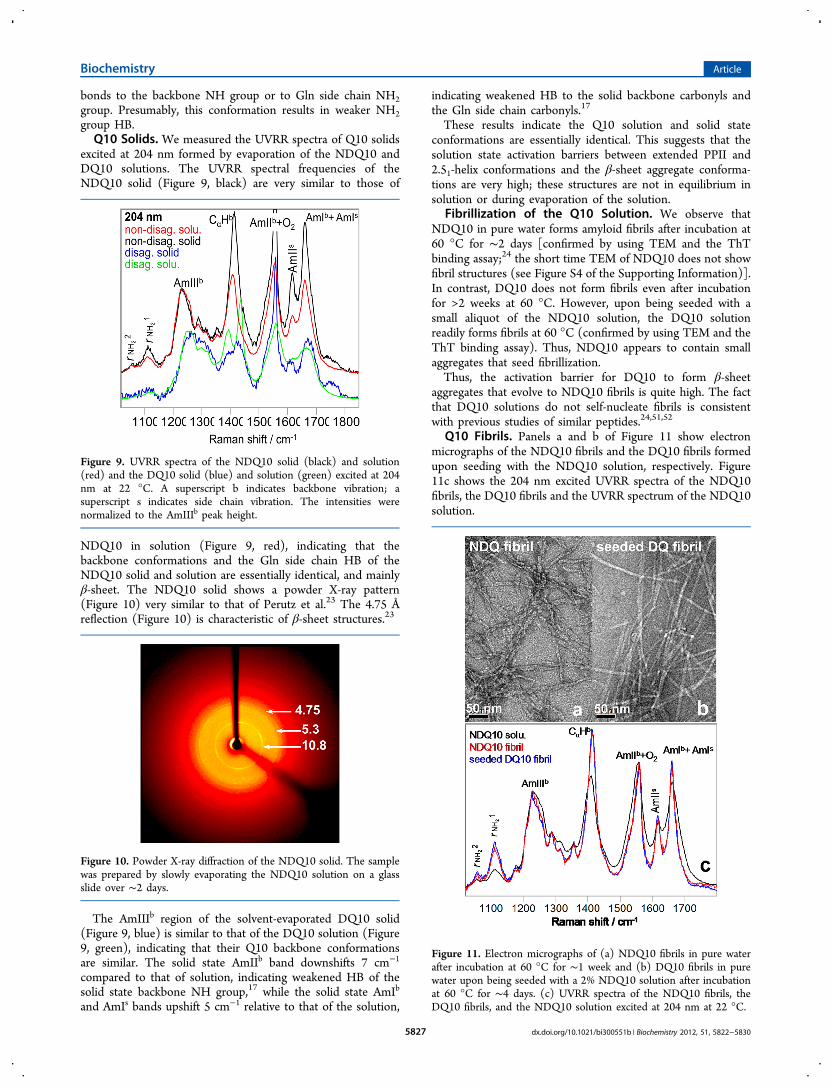
bonds to the backbone NH group or to Gln side chain NH2group. Presumably, this conformation results in weaker NH2group HB.Q10 Solids. We measured the UVRR spectra of Q10 solids
excited at 204 nm formed by evaporation of the NDQ10 andDQ10 solutions. The UVRR spectral frequencies of theNDQ10 solid (Figure 9, black) are very similar to those of
NDQ10 in solution (Figure 9, red), indicating that thebackbone conformations and the Gln side chain HB of theNDQ10 solid and solution are essentially identical, and mainlyβ-sheet. The NDQ10 solid shows a powder X-ray pattern(Figure 10) very similar to that of Perutz et al.23 The 4.75 Åreflection (Figure 10) is characteristic of β-sheet structures.23
The AmIIIb region of the solvent-evaporated DQ10 solid(Figure 9, blue) is similar to that of the DQ10 solution (Figure9, green), indicating that their Q10 backbone conformationsare similar. The solid state AmIIb band downshifts 7 cm−1
compared to that of solution, indicating weakened HB of thesolid state backbone NH group,17 while the solid state AmIb
and AmIs bands upshift 5 cm−1 relative to that of the solution,
indicating weakened HB to the solid backbone carbonyls andthe Gln side chain carbonyls.17
These results indicate the Q10 solution and solid stateconformations are essentially identical. This suggests that thesolution state activation barriers between extended PPII and2.51-helix conformations and the β-sheet aggregate conforma-tions are very high; these structures are not in equilibrium insolution or during evaporation of the solution.
Fibrillization of the Q10 Solution. We observe thatNDQ10 in pure water forms amyloid fibrils after incubation at60 °C for ∼2 days [confirmed by using TEM and the ThTbinding assay;24 the short time TEM of NDQ10 does not showfibril structures (see Figure S4 of the Supporting Information)].In contrast, DQ10 does not form fibrils even after incubationfor >2 weeks at 60 °C. However, upon being seeded with asmall aliquot of the NDQ10 solution, the DQ10 solutionreadily forms fibrils at 60 °C (confirmed by using TEM and theThT binding assay). Thus, NDQ10 appears to contain smallaggregates that seed fibrillization.Thus, the activation barrier for DQ10 to form β-sheet
aggregates that evolve to NDQ10 fibrils is quite high. The factthat DQ10 solutions do not self-nucleate fibrils is consistentwith previous studies of similar peptides.24,51,52
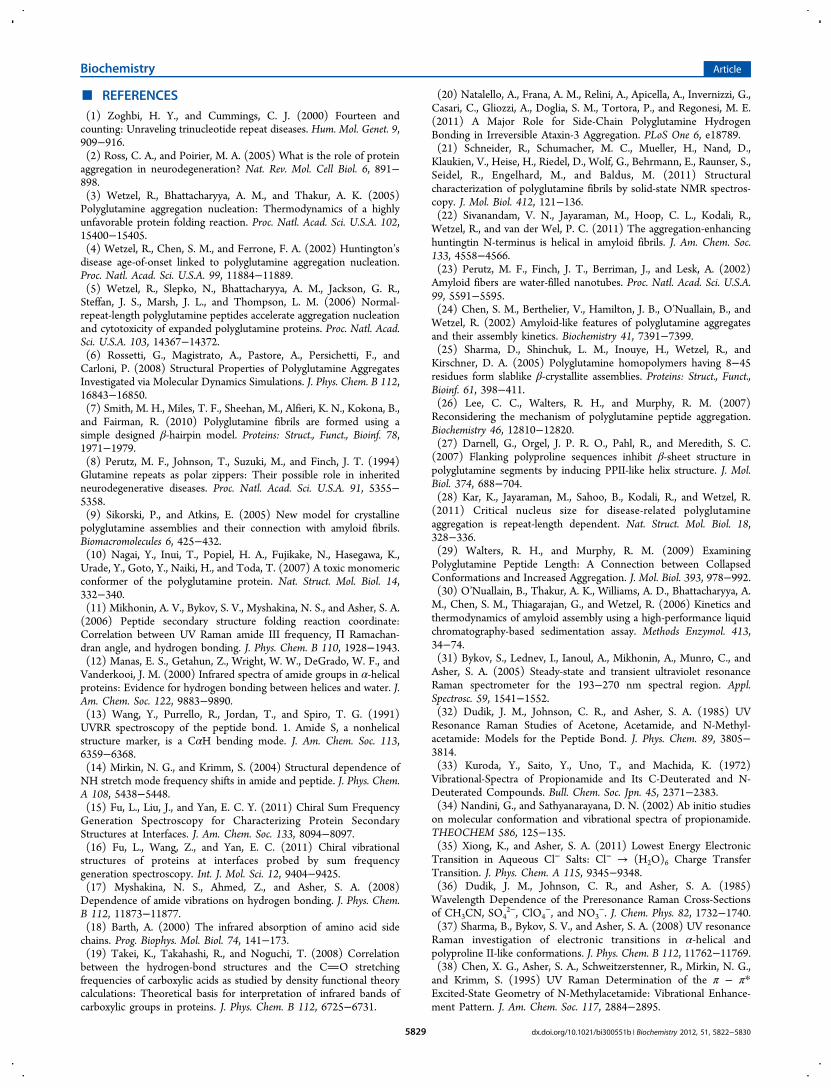
Q10 Fibrils. Panels a and b of Figure 11 show electronmicrographs of the NDQ10 fibrils and the DQ10 fibrils formedupon seeding with the NDQ10 solution, respectively. Figure11c shows the 204 nm excited UVRR spectra of the NDQ10fibrils, the DQ10 fibrils and the UVRR spectrum of the NDQ10solution.
Figure 9. UVRR spectra of the NDQ10 solid (black) and solution(red) and the DQ10 solid (blue) and solution (green) excited at 204nm at 22 °C. A superscript b indicates backbone vibration; asuperscript s indicates side chain vibration. The intensities werenormalized to the AmIIIb peak height.
Figure 10. Powder X-ray diffraction of the NDQ10 solid. The samplewas prepared by slowly evaporating the NDQ10 solution on a glassslide over ∼2 days.
Figure 11. Electron micrographs of (a) NDQ10 fibrils in pure waterafter incubation at 60 °C for ∼1 week and (b) DQ10 fibrils in purewater upon being seeded with a 2% NDQ10 solution after incubationat 60 °C for ∼4 days. (c) UVRR spectra of the NDQ10 fibrils, theDQ10 fibrils, and the NDQ10 solution excited at 204 nm at 22 °C.
Biochemistry Article
dx.doi.org/10.1021/bi300551b | Biochemistry 2012, 51, 5822−58305827
The NDQ10 fibril band frequencies (Figure 11c, red) arevery similar to those of the NDQ10 solution (Figure 11c,black). Thus, the NDQ10 fibrils also occur in a β-sheetstructure in which the Gln side chains form hydrogen bonds tothe backbone or to other Gln side chains. However, theNDQ10 fibril bands are significantly narrowed compared tothose in the NDQ10 solution, indicating a narrower backboneconformational distribution and more constrained Gln sidechain geometries for the NDQ10 fibrils than for the NDQ10solution.The UVRR spectrum of the DQ10 fibrils formed upon
seeding with an aliquot of the NDQ10 solution (Figure 11c,blue) is identical to that of the NDQ10 fibrils spontaneouslyformed (Figure 11c, red), indicating identical Q10 backboneconformations and Gln side chain HB.
■ DISCUSSIONQ10 Structure. CD and UVRR studies indicate that
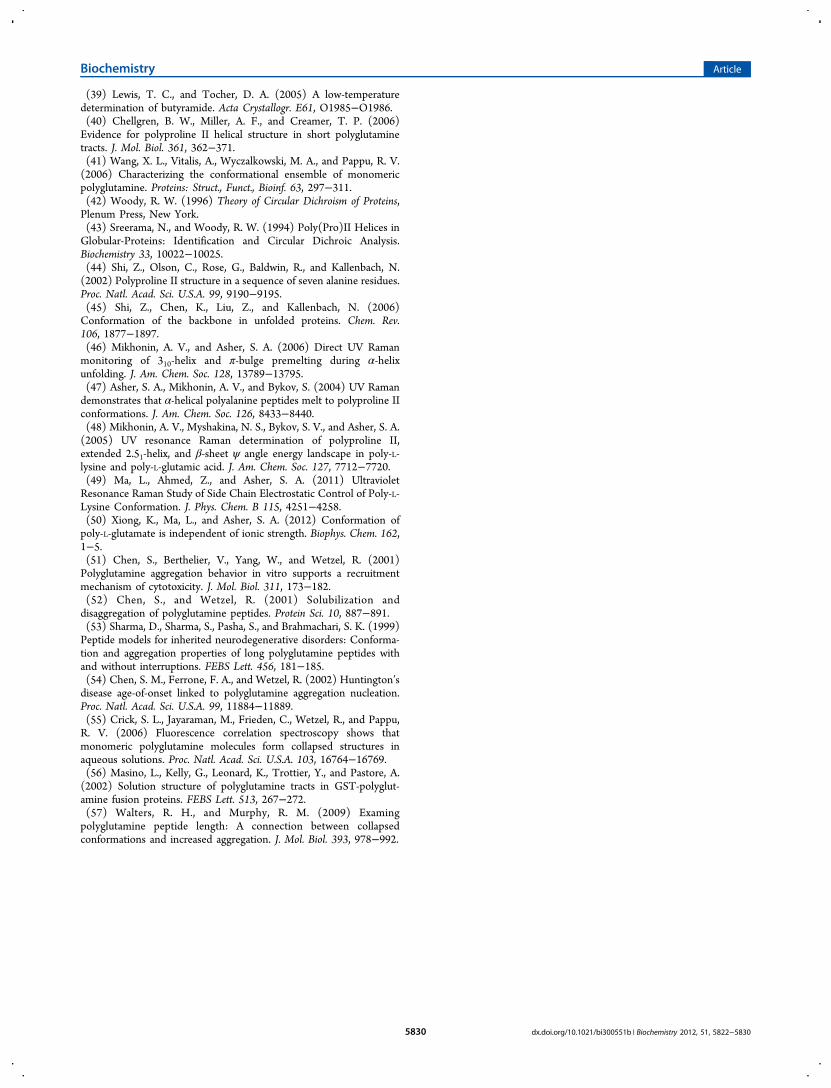
NDQ10 in pure water adopts a predominantly β-sheetstructure, consistent with previous studies indicating thatpolyGln aggregates form β-sheet rich structures24,53 UVRRalso reveals turn conformations in NDQ10. The fractions of β-sheet and turn conformations are 0.84 and 0.16, respectively.This ratio suggests that NDQ10 in pure water occurs as β-hairpins in which 2 residues are in the turn region and 11residues form a β-sheet structure (Figure 12).
We observe that DQ10 in pure water adopts predominantlyPPII-like and 2.51-helix conformations (Figure 12). Previousstudies indicate that glutamine residues in short polyGlnsequences have a strong propensity to form PPII-likeconformations;40,41 other studies, however, report disorderedstructures.29,51,54−57
UVRR indicates that the Gln side chains of NDQ10 formhydrogen bonds to the backbone or other Gln side chains,
while the Gln side chains of DQ10 form hydrogen bonds towater.We also observe that the NDQ10 fibril secondary structure is
essentially identical to that in the NDQ10 solution, except thatthe NDQ10 fibril backbone conformational distribution isnarrower. Also, the fibril Gln side chain geometry is moreconstrained than that of the NDQ10 solution.The UVRR-determined NDQ10 fibril structure appears to be
identical to that of the DQ10 fibrils seeded by an aliquot of theNDQ10 solution. These results suggest that the Q10 fibrilsconsist of stacks of β-hairpins. Previous studies of a similarpeptide with a D2Q15K2 sequence also indicated β-hairpin fibrilstructure.8,9,25
■ CONCLUSIONSWe utilized UVRR and CD to monitor the backboneconformation and the Gln side chain HB of a short mainlypolyGln peptide Q10, with a D2Q10K2 sequence. We measuredUVRR spectra of valeramide to determine the dependence ofprimary amide vibrations on the primary amide hydrogenbonding. We observe that NDQ10 occurs in a β-sheet-likestructure in which the Gln side chains form hydrogen bonds tothe backbone or other Gln side chains.These NDQ10 solutions readily form amyloid fibrils. In
contrast, DQ10 solutions adopt PPII-like and 2.51-helixconformations in which the Gln side chains form hydrogenbonds to water. These samples do not form fibrils upon beingheated within 2 weeks. The NDQ10 and DQ10 solutionstructures are essentially identical to their solid state structures.Although the NDQ10 solution readily forms fibrils whenheated, the DQ10 solution does not form fibrils unless seededby the NDQ10 solution. This indicates very high activationbarriers occur between these solution conformations.The Q10 fibril secondary structure is essentially identical to
that of the NDQ10 solution, except that the fibril backboneconformational distribution is narrower and its Gln side chaingeometry is more constrained compared to that of the NDQ10solution.
■ ASSOCIATED CONTENT*S Supporting InformationMethods for the determination of Ψ angle distributions fromUVRR spectra and CD spectra of Q10 solutions in differentsolvents for disaggregation. This material is available free ofcharge via the Internet at http://pubs.acs.org.
■ AUTHOR INFORMATIONCorresponding Author*E-mail: [email protected]. Phone: (412) 624-8570.Present Address†Department of Chemistry, Northwestern University, Evan-ston, IL 60208.FundingThis work was supported by National Institutes of HealthGrant 1RO1EB009089.NotesThe authors declare no competing financial interest.
■ ACKNOWLEDGMENTSWe thank Dr. Sergei V. Bykov for useful discussions. We alsothank Dr. Lu Ma for help with instrumentation.
Figure 12. Proposed structures of NDQ10 and DQ10. NDQ10 occursas β-sheets in which the Gln side chains form hydrogen bonds to thebackbone or other Gln side chains. DQ10 adopts PPII and 2.51-helixconformations in which the Gln side chains form hydrogen bonds towater: main chain−main chain HB (a), main chain−side chain HB (b),and side chain−side chain HB (c).
Biochemistry Article
dx.doi.org/10.1021/bi300551b | Biochemistry 2012, 51, 5822−58305828
■ REFERENCES(1) Zoghbi, H. Y., and Cummings, C. J. (2000) Fourteen andcounting: Unraveling trinucleotide repeat diseases. Hum. Mol. Genet. 9,909−916.(2) Ross, C. A., and Poirier, M. A. (2005) What is the role of proteinaggregation in neurodegeneration? Nat. Rev. Mol. Cell Biol. 6, 891−898.(3) Wetzel, R., Bhattacharyya, A. M., and Thakur, A. K. (2005)Polyglutamine aggregation nucleation: Thermodynamics of a highlyunfavorable protein folding reaction. Proc. Natl. Acad. Sci. U.S.A. 102,15400−15405.(4) Wetzel, R., Chen, S. M., and Ferrone, F. A. (2002) Huntington’sdisease age-of-onset linked to polyglutamine aggregation nucleation.Proc. Natl. Acad. Sci. U.S.A. 99, 11884−11889.(5) Wetzel, R., Slepko, N., Bhattacharyya, A. M., Jackson, G. R.,Steffan, J. S., Marsh, J. L., and Thompson, L. M. (2006) Normal-repeat-length polyglutamine peptides accelerate aggregation nucleationand cytotoxicity of expanded polyglutamine proteins. Proc. Natl. Acad.Sci. U.S.A. 103, 14367−14372.(6) Rossetti, G., Magistrato, A., Pastore, A., Persichetti, F., andCarloni, P. (2008) Structural Properties of Polyglutamine AggregatesInvestigated via Molecular Dynamics Simulations. J. Phys. Chem. B 112,16843−16850.(7) Smith, M. H., Miles, T. F., Sheehan, M., Alfieri, K. N., Kokona, B.,and Fairman, R. (2010) Polyglutamine fibrils are formed using asimple designed β-hairpin model. Proteins: Struct., Funct., Bioinf. 78,1971−1979.(8) Perutz, M. F., Johnson, T., Suzuki, M., and Finch, J. T. (1994)Glutamine repeats as polar zippers: Their possible role in inheritedneurodegenerative diseases. Proc. Natl. Acad. Sci. U.S.A. 91, 5355−5358.(9) Sikorski, P., and Atkins, E. (2005) New model for crystallinepolyglutamine assemblies and their connection with amyloid fibrils.Biomacromolecules 6, 425−432.(10) Nagai, Y., Inui, T., Popiel, H. A., Fujikake, N., Hasegawa, K.,Urade, Y., Goto, Y., Naiki, H., and Toda, T. (2007) A toxic monomericconformer of the polyglutamine protein. Nat. Struct. Mol. Biol. 14,332−340.(11) Mikhonin, A. V., Bykov, S. V., Myshakina, N. S., and Asher, S. A.(2006) Peptide secondary structure folding reaction coordinate:Correlation between UV Raman amide III frequency, Π Ramachan-dran angle, and hydrogen bonding. J. Phys. Chem. B 110, 1928−1943.(12) Manas, E. S., Getahun, Z., Wright, W. W., DeGrado, W. F., andVanderkooi, J. M. (2000) Infrared spectra of amide groups in α-helicalproteins: Evidence for hydrogen bonding between helices and water. J.Am. Chem. Soc. 122, 9883−9890.(13) Wang, Y., Purrello, R., Jordan, T., and Spiro, T. G. (1991)UVRR spectroscopy of the peptide bond. 1. Amide S, a nonhelicalstructure marker, is a CαH bending mode. J. Am. Chem. Soc. 113,6359−6368.(14) Mirkin, N. G., and Krimm, S. (2004) Structural dependence ofNH stretch mode frequency shifts in amide and peptide. J. Phys. Chem.A 108, 5438−5448.(15) Fu, L., Liu, J., and Yan, E. C. Y. (2011) Chiral Sum FrequencyGeneration Spectroscopy for Characterizing Protein SecondaryStructures at Interfaces. J. Am. Chem. Soc. 133, 8094−8097.(16) Fu, L., Wang, Z., and Yan, E. C. (2011) Chiral vibrationalstructures of proteins at interfaces probed by sum frequencygeneration spectroscopy. Int. J. Mol. Sci. 12, 9404−9425.(17) Myshakina, N. S., Ahmed, Z., and Asher, S. A. (2008)Dependence of amide vibrations on hydrogen bonding. J. Phys. Chem.B 112, 11873−11877.(18) Barth, A. (2000) The infrared absorption of amino acid sidechains. Prog. Biophys. Mol. Biol. 74, 141−173.(19) Takei, K., Takahashi, R., and Noguchi, T. (2008) Correlationbetween the hydrogen-bond structures and the CO stretchingfrequencies of carboxylic acids as studied by density functional theorycalculations: Theoretical basis for interpretation of infrared bands ofcarboxylic groups in proteins. J. Phys. Chem. B 112, 6725−6731.
(20) Natalello, A., Frana, A. M., Relini, A., Apicella, A., Invernizzi, G.,Casari, C., Gliozzi, A., Doglia, S. M., Tortora, P., and Regonesi, M. E.(2011) A Major Role for Side-Chain Polyglutamine HydrogenBonding in Irreversible Ataxin-3 Aggregation. PLoS One 6, e18789.(21) Schneider, R., Schumacher, M. C., Mueller, H., Nand, D.,Klaukien, V., Heise, H., Riedel, D., Wolf, G., Behrmann, E., Raunser, S.,Seidel, R., Engelhard, M., and Baldus, M. (2011) Structuralcharacterization of polyglutamine fibrils by solid-state NMR spectros-copy. J. Mol. Biol. 412, 121−136.(22) Sivanandam, V. N., Jayaraman, M., Hoop, C. L., Kodali, R.,Wetzel, R., and van der Wel, P. C. (2011) The aggregation-enhancinghuntingtin N-terminus is helical in amyloid fibrils. J. Am. Chem. Soc.133, 4558−4566.(23) Perutz, M. F., Finch, J. T., Berriman, J., and Lesk, A. (2002)Amyloid fibers are water-filled nanotubes. Proc. Natl. Acad. Sci. U.S.A.99, 5591−5595.(24) Chen, S. M., Berthelier, V., Hamilton, J. B., O’Nuallain, B., andWetzel, R. (2002) Amyloid-like features of polyglutamine aggregatesand their assembly kinetics. Biochemistry 41, 7391−7399.(25) Sharma, D., Shinchuk, L. M., Inouye, H., Wetzel, R., andKirschner, D. A. (2005) Polyglutamine homopolymers having 8−45residues form slablike β-crystallite assemblies. Proteins: Struct., Funct.,Bioinf. 61, 398−411.(26) Lee, C. C., Walters, R. H., and Murphy, R. M. (2007)Reconsidering the mechanism of polyglutamine peptide aggregation.Biochemistry 46, 12810−12820.(27) Darnell, G., Orgel, J. P. R. O., Pahl, R., and Meredith, S. C.(2007) Flanking polyproline sequences inhibit β-sheet structure inpolyglutamine segments by inducing PPII-like helix structure. J. Mol.Biol. 374, 688−704.(28) Kar, K., Jayaraman, M., Sahoo, B., Kodali, R., and Wetzel, R.(2011) Critical nucleus size for disease-related polyglutamineaggregation is repeat-length dependent. Nat. Struct. Mol. Biol. 18,328−336.(29) Walters, R. H., and Murphy, R. M. (2009) ExaminingPolyglutamine Peptide Length: A Connection between CollapsedConformations and Increased Aggregation. J. Mol. Biol. 393, 978−992.(30) O’Nuallain, B., Thakur, A. K., Williams, A. D., Bhattacharyya, A.M., Chen, S. M., Thiagarajan, G., and Wetzel, R. (2006) Kinetics andthermodynamics of amyloid assembly using a high-performance liquidchromatography-based sedimentation assay. Methods Enzymol. 413,34−74.(31) Bykov, S., Lednev, I., Ianoul, A., Mikhonin, A., Munro, C., andAsher, S. A. (2005) Steady-state and transient ultraviolet resonanceRaman spectrometer for the 193−270 nm spectral region. Appl.Spectrosc. 59, 1541−1552.(32) Dudik, J. M., Johnson, C. R., and Asher, S. A. (1985) UVResonance Raman Studies of Acetone, Acetamide, and N-Methyl-acetamide: Models for the Peptide Bond. J. Phys. Chem. 89, 3805−3814.(33) Kuroda, Y., Saito, Y., Uno, T., and Machida, K. (1972)Vibrational-Spectra of Propionamide and Its C-Deuterated and N-Deuterated Compounds. Bull. Chem. Soc. Jpn. 45, 2371−2383.(34) Nandini, G., and Sathyanarayana, D. N. (2002) Ab initio studieson molecular conformation and vibrational spectra of propionamide.THEOCHEM 586, 125−135.(35) Xiong, K., and Asher, S. A. (2011) Lowest Energy ElectronicTransition in Aqueous Cl− Salts: Cl− → (H2O)6 Charge TransferTransition. J. Phys. Chem. A 115, 9345−9348.(36) Dudik, J. M., Johnson, C. R., and Asher, S. A. (1985)Wavelength Dependence of the Preresonance Raman Cross-Sectionsof CH3CN, SO4
2−, ClO4−, and NO3
−. J. Chem. Phys. 82, 1732−1740.(37) Sharma, B., Bykov, S. V., and Asher, S. A. (2008) UV resonanceRaman investigation of electronic transitions in α-helical andpolyproline II-like conformations. J. Phys. Chem. B 112, 11762−11769.(38) Chen, X. G., Asher, S. A., Schweitzerstenner, R., Mirkin, N. G.,and Krimm, S. (1995) UV Raman Determination of the π − π*Excited-State Geometry of N-Methylacetamide: Vibrational Enhance-ment Pattern. J. Am. Chem. Soc. 117, 2884−2895.
Biochemistry Article
dx.doi.org/10.1021/bi300551b | Biochemistry 2012, 51, 5822−58305829
(39) Lewis, T. C., and Tocher, D. A. (2005) A low-temperaturedetermination of butyramide. Acta Crystallogr. E61, O1985−O1986.(40) Chellgren, B. W., Miller, A. F., and Creamer, T. P. (2006)Evidence for polyproline II helical structure in short polyglutaminetracts. J. Mol. Biol. 361, 362−371.(41) Wang, X. L., Vitalis, A., Wyczalkowski, M. A., and Pappu, R. V.(2006) Characterizing the conformational ensemble of monomericpolyglutamine. Proteins: Struct., Funct., Bioinf. 63, 297−311.(42) Woody, R. W. (1996) Theory of Circular Dichroism of Proteins,Plenum Press, New York.(43) Sreerama, N., and Woody, R. W. (1994) Poly(Pro)II Helices inGlobular-Proteins: Identification and Circular Dichroic Analysis.Biochemistry 33, 10022−10025.(44) Shi, Z., Olson, C., Rose, G., Baldwin, R., and Kallenbach, N.(2002) Polyproline II structure in a sequence of seven alanine residues.Proc. Natl. Acad. Sci. U.S.A. 99, 9190−9195.(45) Shi, Z., Chen, K., Liu, Z., and Kallenbach, N. (2006)Conformation of the backbone in unfolded proteins. Chem. Rev.106, 1877−1897.(46) Mikhonin, A. V., and Asher, S. A. (2006) Direct UV Ramanmonitoring of 310-helix and π-bulge premelting during α-helixunfolding. J. Am. Chem. Soc. 128, 13789−13795.(47) Asher, S. A., Mikhonin, A. V., and Bykov, S. (2004) UV Ramandemonstrates that α-helical polyalanine peptides melt to polyproline IIconformations. J. Am. Chem. Soc. 126, 8433−8440.(48) Mikhonin, A. V., Myshakina, N. S., Bykov, S. V., and Asher, S. A.(2005) UV resonance Raman determination of polyproline II,extended 2.51-helix, and β-sheet ψ angle energy landscape in poly-L-lysine and poly-L-glutamic acid. J. Am. Chem. Soc. 127, 7712−7720.(49) Ma, L., Ahmed, Z., and Asher, S. A. (2011) UltravioletResonance Raman Study of Side Chain Electrostatic Control of Poly-L-Lysine Conformation. J. Phys. Chem. B 115, 4251−4258.(50) Xiong, K., Ma, L., and Asher, S. A. (2012) Conformation ofpoly-L-glutamate is independent of ionic strength. Biophys. Chem. 162,1−5.(51) Chen, S., Berthelier, V., Yang, W., and Wetzel, R. (2001)Polyglutamine aggregation behavior in vitro supports a recruitmentmechanism of cytotoxicity. J. Mol. Biol. 311, 173−182.(52) Chen, S., and Wetzel, R. (2001) Solubilization anddisaggregation of polyglutamine peptides. Protein Sci. 10, 887−891.(53) Sharma, D., Sharma, S., Pasha, S., and Brahmachari, S. K. (1999)Peptide models for inherited neurodegenerative disorders: Conforma-tion and aggregation properties of long polyglutamine peptides withand without interruptions. FEBS Lett. 456, 181−185.(54) Chen, S. M., Ferrone, F. A., and Wetzel, R. (2002) Huntington’sdisease age-of-onset linked to polyglutamine aggregation nucleation.Proc. Natl. Acad. Sci. U.S.A. 99, 11884−11889.(55) Crick, S. L., Jayaraman, M., Frieden, C., Wetzel, R., and Pappu,R. V. (2006) Fluorescence correlation spectroscopy shows thatmonomeric polyglutamine molecules form collapsed structures inaqueous solutions. Proc. Natl. Acad. Sci. U.S.A. 103, 16764−16769.(56) Masino, L., Kelly, G., Leonard, K., Trottier, Y., and Pastore, A.(2002) Solution structure of polyglutamine tracts in GST-polyglut-amine fusion proteins. FEBS Lett. 513, 267−272.(57) Walters, R. H., and Murphy, R. M. (2009) Examingpolyglutamine peptide length: A connection between collapsedconformations and increased aggregation. J. Mol. Biol. 393, 978−992.
Biochemistry Article
dx.doi.org/10.1021/bi300551b | Biochemistry 2012, 51, 5822−58305830