Embed Size (px)
Citation preview

UvA-DARE is a service provided by the library of the University of Amsterdam (http://dare.uva.nl)
UvA-DARE (Digital Academic Repository)
Crystalline silicate dust around evolved stars. I. The sample stars
Molster, F.J.; Waters, L.B.F.M.; Tielens, A.G.G.M.; Barlow, M.J.
Published in:Astronomy & Astrophysics
DOI:10.1051/0004-6361:20011550
Link to publication
Citation for published version (APA):Molster, F. J., Waters, L. B. F. M., Tielens, A. G. G. M., & Barlow, M. J. (2002). Crystalline silicate dust aroundevolved stars. I. The sample stars. Astronomy & Astrophysics, 382, 184-221. DOI: 10.1051/0004-6361:20011550
General rightsIt is not permitted to download or to forward/distribute the text or part of it without the consent of the author(s) and/or copyright holder(s),other than for strictly personal, individual use, unless the work is under an open content license (like Creative Commons).
Disclaimer/Complaints regulationsIf you believe that digital publication of certain material infringes any of your rights or (privacy) interests, please let the Library know, statingyour reasons. In case of a legitimate complaint, the Library will make the material inaccessible and/or remove it from the website. Please Askthe Library: http://uba.uva.nl/en/contact, or a letter to: Library of the University of Amsterdam, Secretariat, Singel 425, 1012 WP Amsterdam,The Netherlands. You will be contacted as soon as possible.
Download date: 01 Jul 2018

A&A 382, 184–221 (2002)DOI: 10.1051/0004-6361:20011550c© ESO 2002
Astronomy&
Astrophysics
Crystalline silicate dust around evolved stars?,??
I. The sample stars
F. J. Molster1,2,†, L. B. F. M. Waters1,3, A. G. G. M. Tielens4, and M. J. Barlow5
1 Astronomical Institute “Anton Pannekoek”, University of Amsterdam, Kruislaan 403, 1098 SJ Amsterdam,The Netherlands
2 School of Materials Science and Engineering, Georgia Tech, Atlanta, GA 30332-0245, USA3 Instituut voor Sterrenkunde, Katholieke Universiteit Leuven, Celestijnenlaan 200B, 3001 Heverlee, Belgium4 SRON Laboratory for Space Research Groningen, PO Box 800, 9700 AV Groningen, The Netherlands5 Department of Physics and Astronomy, University College London, Gower Street, London WC1E 6BT, UK
Received 3 May 2001 / Accepted 5 November 2001
Abstract. This is the first paper in a series of three where we present the first comprehensive inventory ofsolid state emission bands observed in a sample of 17 oxygen-rich circumstellar dust shells surrounding evolvedstars. The data were taken with the Short and Long Wavelength Spectrographs on board of the Infrared SpaceObservatory (ISO) and cover the 2.4 to 195 µm wavelength range. The spectra show the presence of broad 10and 18 µm bands that can be attributed to amorphous silicates. In addition, at least 49 narrow bands are foundwhose position and width indicate they can be attributed to crystalline silicates. Almost all of these bands werenot known before ISO. The incredible richness of the crystalline silicate spectra observed by ISO allows detailedstudies of the mineralogy of these dust shells, and is a telltale about the origin and evolution of the dust. We havemeasured the peak positions, widths and strengths of the individual, continuum subtracted bands. Based on thesemeasurements, we were able to order the spectra in sequence of decreasing crystalline silicate band strength. Wefound that the strength of the emission bands correlates with the geometry of the circumstellar shell, as derivedfrom direct imaging or inferred from the shape of the spectral energy distribution. This naturally divides thesample into objects that show a disk-like geometry (strong crystalline silicate bands), and objects whose dustshell is characteristic of an outflow (weak crystalline silicate bands). All stars with the 33.6 µm forsterite bandstronger than 20 percent over continuum are disk sources. We define spectral regions (called complexes) wherea concentration of emission bands is evident, at 10, 18, 23, 28, 33, 40 and 60 µm. We derive average shapes forthese complexes and compare these to the individual band shapes of the programme stars. In an Appendix, weprovide detailed comments on the measured band positions and strengths of individual sources.
Key words. infrared: stars – circumstellar matter – stars: AGB and post-AGB – mass loss –Planetary Nebulae: general – dust, extinction
1. Introduction
Red giants and supergiants are characterized by low sur-face temperatures resulting in the presence of many differ-
Send offprint requests to: F. J. Molster,e-mail: [email protected]† Present address: F. J. Molster, ESA/ESTEC, SCI-SO,Postbus 299, 2200 AG Noordwijk, The Netherlands? Based on observations with ISO, an ESA project with in-
struments funded by ESA Member States (especially the PIcountries: France, Germany, The Netherlands and the UK) andwith the participation of ISAS and NASA.?? Tables 4 to 20 are only available in electronic format the CDS via anonymous ftp to cdsarc.u-strasbg.fr
(130.79.128.5) or viahttp://cdsweb.u-strasbg.fr/cgi-bin/qcat?J/A+A/382/184
ent molecules in their atmosphere. These objects are alsoknown to have dense stellar winds, presumably driven bya combination of pulsations and radiation pressure on thedust which forms in the cooling outflow. Since dust effi-ciently absorbes radiation at short wavelengths, the cen-tral star can easily become obscured and most of the lu-minosity of the star is re-radiated at mid-IR wavelengths.At these wavelengths, the most important ro-vibrationalbands of abundant molecules can be found, and indeedmany solid state bands from various dust components havebeen found using infrared spectrographs. The InfraredSpace Observatory (ISO, Kessler et al. 1996) has allowedfor the first time a comprehensive inventory of solid statebands in astrophysical objects with uninterrupted wave-length coverage from 2.4 to 200 µm and with a spectral

F. J. Molster et al.: Crystalline silicate dust around evolved stars. I. 185
resolution which is well suited for the detection of solidstate bands.
We have undertaken detailed studies of the dust emis-sion and absorption spectra of evolved stars, rangingfrom Asymptotic Giant Branch (AGB) stars to PlanetaryNebulae (PNe) and to (post) Red Supergiants (RSG).Preliminary results of these studies have been pub-lished elsewhere and can be summarized as follows: manyoxygen-rich evolved stars have a surprisingly rich spec-trum of solid state emission bands between 10 and 100 µm,dominated by both amorphous and crystalline silicates(e.g. Waters et al. 1996; Molster et al. 1999a; 1999b).The crystalline silicates were not known to be present indust shells around evolved stars before ISO was launched,and allow for the first time a mineralogical analysis ofthe dust composition around these objects. Some objectsshow a very high abundance of crystalline silicates (e.g.Molster et al. 2001a), which seems to be related to thegeometry of the circumstellar dust shell (Molster et al.1999a). Surprisingly, stars which were believed to have acarbon-rich dust chemistry also showed the presence ofcrystalline silicate emission, pointing to a complex chemi-cal composition of the circumstellar environment, possiblydue to rapid changes in the chemistry of the stellar photo-sphere (e.g. Waters et al. 1998; Cohen et al. 1999; Molsteret al. 2001a). These observations demonstrate the use ofthe crystalline silicate bands for a better understanding ofthe evolution of late type giants and supergiants.
This paper is the first in a series of three where wepresent a detailed and comprehensive overview of the solidstate emission bands in oxygen-rich dust shells surround-ing evolved stars and related objects. The purpose of thesepapers is to quantify as best as possible the presence andcharacteristics of the numerous new emission bands thathave been discovered using the ISO data. In Paper II(Molster et al. 2002a) of this series, we describe the aver-age band profiles of seven “complexes” that can be recog-nized in the combined Short- (de Graauw et al. 1996) andLong- (Clegg et al. 1996) wavelength spectrometers (here-after referred to as SWS and LWS respectively) that wereon board of ISO. Based on the strength of the crystallinesilicate bands, we divide in Paper II the sample of 17 starsinto two groups. This division is also one which separatesobjects with a highly flattened dust distribution (referredto here as “disk” sources) from those with a more spheri-cal distribution of dust (the non-disk or spherical outflowsources, hereafter referred to as “outflow” sources). In thepresent study, we present the 17 programme stars, we givean overview of the individual spectra, and we quantify theposition and strength of the bands. In Paper III (Molsteret al. 2002b) we will investigate several trends in the spec-trum and correlate them with other information availableabout these sources.
This paper is organized as follows: Sect. 2 presentsthe sample, the observations and data reduction; Sect. 3describes the nature of the individual sources, and theshape of the complexes as compared to the mean. Sect. 4summarizes the results of this study. In the appendix we
present the band strength data and some more detaileddiscussion about individual spectral features with respectto their reliability and blending.
2. The observations and data reduction
2.1. The sample
In order to get as broad as possible an overviewof the O-rich dust features around evolved stars, weaimed for a sample covering the evolution of stars fromthe Asymptotic Giant Branch (AGB) to the PlanetaryNebula (PN) phase, and also including some massive(post-) Red Supergiants (RSG). Several objects werealso included whose evolutionary status is unclear (e.g.MWC 922, MWC 300 and HD 45677). We inspected thespectra for the presence of crystalline silicate bands. Sincewe are interested in (sometimes weak) bands on top of acontinuum, we selected bright objects with fluxes higherthan about 20 Jy in the 20 to 45 µm region. We pref-erentially included objects for which both an SWS andan LWS spectrum are available. We finally arrived at asample of 17 objects, listed in Table 1.
In several cases more than one observation was avail-able. The boldface revolution numbers in Table 1 indicatewhich observations were used for the final spectrum. Theother observations were less accurately reduced and onlyused as a reference in case of doubt in the main spectrum.
2.2. Data reduction
2.2.1. SWS and LWS data reduction
For a description of the SWS instrument and its operatingmodes we refer to de Graauw et al. (1996). The spectraused in this study were reduced using version 7.0 of theSWS offline processing software. For a description of fluxand wavelength calibration procedures, see Schaeidt et al.(1996) and Valentijn et al. (1996). We used standard pro-cedures for flatfielding, sigma-clipping and rebinning ofthe signals from the 12 detectors. We removed the mainfringes in SWS band 3 (12.0–29.5 µm). The final resolu-tion (λ/∆λ) of the spectrum depends on the observingmode and the quality of the spectrum, but was typicallyaround 250 for a speed 1, 300 for a speed 2, 500 for aspeed 3, 750 for a speed 4 AOT01 and 1500 for an AOT06observation.
The LWS instrument and operating modes are de-scribed in Clegg et al. (1996). For a description of the fluxand wavelength calibration procedures see Swinyard et al.(1996). The LWS spectra were reduced with the LWS of-fline processing software version 7.0, and further processedusing ISAP. The reduced and rebinned LWS spectra ofNGC 6302 used in this study were taken from Molsteret al. (2001b); those of OH 26.5+0.6 from Sylvester et al.(1999); those of AFGL 4106 were taken from Molster et al.(1999b); for HD 44179 from Hony et al. (in preparation),for HD 161796 from (Hoogzaad et al., in preparation),

186 F. J. Molster et al.: Crystalline silicate dust around evolved stars. I.
Table 1. The programme stars and logbook of the observations used for this study. The boldface revolution numbers are thoseused for the final spectrum.
Object Type Revolution AOT Tint Comment(AOT nr) (s)
IRAS 09425–6040 C-rich AGB star with O-rich dust 084 SWS01 1816254 SWS01 6538
NGC 6537 Planetary Nebula, hot central star 470 SWS01 1912 mispointed470 LWS01 1318703 SWS01 3454703 LWS01 2230
NGC 6302 Planetary Nebula, hot central star 094 SWS01 6528479 SWS06 8532 2.4−7.0 and 12.0−27.5 µm479 SWS06 12 165 7.0−12.0 and 27.5−45.2 µm289–678 LWS01 13 243 combination of rev 289, 482,
489, 503, 510, 671, and 678MWC 922 Peculiar object 153 SWS01 1834 combined with rev 703
478 LWS01 1316703 SWS01 1912 combined with rev 153
AC Her Binary post-AGB star 106 SWS01 1834471 LWS01 1910520 SWS01 6538
HD 45677 B[e] star, nature unclear 711 SWS01 653889 Her Binary post-AGB star 082 SWS01 1044
336 LWS01 1860518 SWS01 6538
MWC 300 Evolved star, B supergiant 516 SWS01 3454Vy 2-2 Proto-planetary nebula 320 SWS01 1140
547 LWS01 1318 ≈7 arcsec mispointedHD 44179 Red Rectangle; binary post-AGB star 702 SWS06 1174 31.4−35.1 µm
702 SWS06 856 19.5−25 µm702 SWS01 6538709 LWS01 3428870 SWS06 8406 12−19.5 µm
HD 161796 Post-AGB star 071 SWS01 1044080 LWS01 1554342 SWS01 1912521 SWS06 1744 29.0−45.2 µm
OH 26.5+0.6 OH/IR star, high mass loss rate 330 SWS01 1912330 LWS01 1268340 LWS01 822
Roberts 22 post-AGB star, A supergiant 084 SWS01 1044 mispointed103 LWS01 478254 SWS01 3454 mispointed
HD 179821 post-AGB or post-RSG star 113 SWS01 1834520 SWS01 6538319 LWS01 1266
AFGL 4106 post-RSG, binary 060 SWS01 1130104 SWS01 1834104 LWS01 476249 SWS01 3454
NML Cyg Red Supergiant, high mass loss rate 052 SWS01 6544342 SWS01 1140530 SWS06 1688 29.5−45.2 µm555 LWS01 2798741 SWS01 1140
IRC+10420 post-RSG, A supergiant 128 SWS01 3462316 SWS06 1718 29.3−44.7 µm724 LWS01 3430
and for MWC 922 from Sylvester (private communica-tion). We verified that these LWS spectra were reduced
in a homogeneous way. The other LWS spectra were onlysigma-clipped and rebinned and mainly used as a reference
F. J. Molster et al.: Crystalline silicate dust around evolved stars. I. 187
Fig. 1. The spectra of the disk sources (solid line) and their eye-ball spline-fit continuum (dashed line). The jumps in thespectrum of Roberts 22 are due to a mispointing of the satellite. The straight lines after 45 µm in the spectra of IRAS 09425–6040, HD 45677 and MWC 300 are the connections with the IRAS datapoints.
for the adjustment of SWS band 4 and the placement ofthe continuum (see Sect. 2.2.2).
To match the individual sub-bands with each other, weused multiplications, when we expected the flux calibra-tion to be the most important source of error, and a linearshift when we expect the the dark curents to be the mainsource for the discrepancy between the different bands. Inall cases we tried to minimize the necessary shifts.
2.2.2. Determination of an underlying continuum
In order to enhance the visibility of the different featureswe have defined a continuum for the spectra in Figs. 1
and 2. We have used an eye-ball spline-fit continuum, max-imizing the continuum and still be smooth (no suddenchanges in the slope), both in Fν and Fλ. We empha-size that this continuum has not necessarily a physicalmeaning but is only used here to enhance the sharp fea-tures on top of the spectrum. In principle, the strengthof the features could be underestimated and there is apossibility that very broad features are treated as contin-uum. Whenever possible we tried to use the whole wave-length range (SWS + LWS) to determine the placementof the continuum. We have purposely not used (modi-fied) blackbody-fits, because most spectra could not sat-isfactory be fitted by one (modified) blackbody (BB).

188 F. J. Molster et al.: Crystalline silicate dust around evolved stars. I.
Fig. 2. The spectra of the outflow sources (solid line) and their eye-ball-spline-fit continuum (dashed line). The jumps in thespectrum of Vy 2–2 are due to a mispointing of the satellite.
This would have forced us to use multiple (modified)blackbodies, which would make it as arbitrary as the eye-ball fit and we had the feeling that we could be moreconsistent between the different spectra bye the eye-ballmethod than with BB-fitting. Finally, the BB-fitting re-sults in a quite artificial physical parameter, the tempera-ture, which is not always directly related to the real tem-perature of the dust species. In order to prevent confusionabout this parameter, we prefered the meaningless eye-ballcontinuum.
In two sources, Roberts 22 and Vy 2–2, flux jumpswere found due to a pointing offset of ISO. Pointing off-sets result in flux jumps due to the change in aperture
size of SWS with wavelength (see De Graauw et al. 1996).In these cases we have fitted separate continua to eachpart of the spectrum, where we took into account the rel-ative slope in the other parts of the spectrum. However,this may affect the shape of the complexes whose wave-length coverage extends over sub-bands with differentSWS apertures.
The Planetary Nebulae NGC 6537 and NGC 6302 havestrong emission lines that hamper the determination of thedust emission bands. We decided to remove most of theseby subtracting a Gaussian fit to the (unresolved) lines. Forvery strong lines (some could be 100 times the continuumlevel) the subtraction procedure resulted in excessive noise
F. J. Molster et al.: Crystalline silicate dust around evolved stars. I. 189
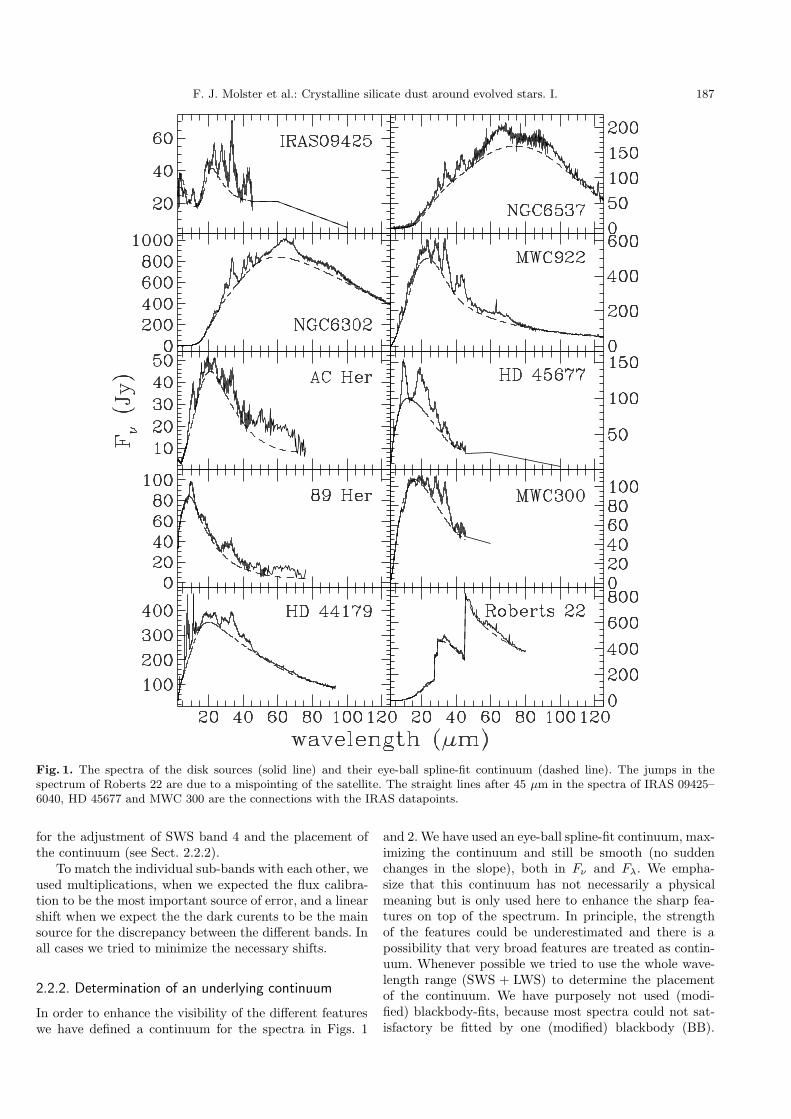
Fig. 3. The continuum subtracted spectra of the disk sources.
after removal of the Gaussians. In these cases, we removedthe noisy part of the spectrum.
2.2.3. The “final spectra”: Disk and outflow sources
After some study of the stars in our sample, it became ap-parent that there is a wide range in band strengths of thedifferent sources. We have accordingly ordered the spec-tra in sequence of decreasing strength of the 33.6 µm bandwith respect to its local continuum. As we will show later(see Sect. 3) this naturally divides the spectra into objectsthat have a disk-like distribution of dust, and objects thathave a more spherical dust distribution. We will use thisdivision into “disk” and “outflow” sources in the remain-der of this paper, and will group our sources accordingly.In Figs. 1 and 2 the final spectra are shown, and Figs. 3and 4 show the continuum subtracted spectra, in bothcases divided into disk and outflow sources.
2.3. Definition of complexes
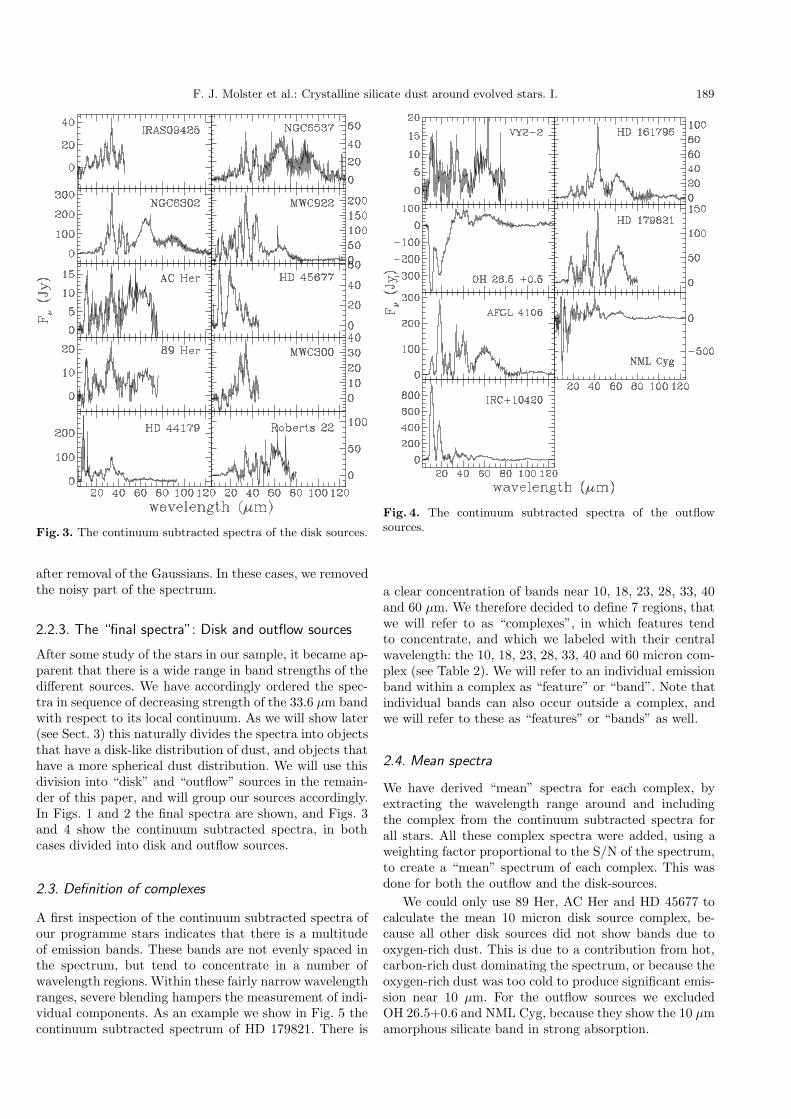
A first inspection of the continuum subtracted spectra ofour programme stars indicates that there is a multitudeof emission bands. These bands are not evenly spaced inthe spectrum, but tend to concentrate in a number ofwavelength regions. Within these fairly narrow wavelengthranges, severe blending hampers the measurement of indi-vidual components. As an example we show in Fig. 5 thecontinuum subtracted spectrum of HD 179821. There is
Fig. 4. The continuum subtracted spectra of the outflowsources.
a clear concentration of bands near 10, 18, 23, 28, 33, 40and 60 µm. We therefore decided to define 7 regions, thatwe will refer to as “complexes”, in which features tendto concentrate, and which we labeled with their centralwavelength: the 10, 18, 23, 28, 33, 40 and 60 micron com-plex (see Table 2). We will refer to an individual emissionband within a complex as “feature” or “band”. Note thatindividual bands can also occur outside a complex, andwe will refer to these as “features” or “bands” as well.
2.4. Mean spectra
We have derived “mean” spectra for each complex, byextracting the wavelength range around and includingthe complex from the continuum subtracted spectra forall stars. All these complex spectra were added, using aweighting factor proportional to the S/N of the spectrum,to create a “mean” spectrum of each complex. This wasdone for both the outflow and the disk-sources.
We could only use 89 Her, AC Her and HD 45677 tocalculate the mean 10 micron disk source complex, be-cause all other disk sources did not show bands due tooxygen-rich dust. This is due to a contribution from hot,carbon-rich dust dominating the spectrum, or because theoxygen-rich dust was too cold to produce significant emis-sion near 10 µm. For the outflow sources we excludedOH 26.5+0.6 and NML Cyg, because they show the 10 µmamorphous silicate band in strong absorption.
190 F. J. Molster et al.: Crystalline silicate dust around evolved stars. I.
Fig. 5. The continuum subtracted spectrum of HD 179821. We indicated the range of the different complexes.
The source OH 26.5+0.6 has also been excluded fromthe average spectra of the 18 and 23 micron (outflow) com-plexes because the spectrum is in absorption. NML Cygshows amorphous silicates in absorption in the 18 microncomplex, but the crystalline silicates are already in emis-sion. To avoid problems we have also excluded this ob-ject from the average outlfow spectrum for the 18 microncomplex.
In Paper II an extensive discussion will be presentedon the properties of the mean complexes and bands, forboth outflow and for disk sources. Here we will comparethe individual complex or band positions and shapes withthe mean. In Paper II we will also present average proper-ties and identify the bands using laboratory data of sev-eral materials. Most of the bands can be identified withforsterite (Mg2SiO4; the Mg-rich endmember of the crys-talline olivine series) and enstatite (MgSiO3; the Mg-richend member of the crystalline pyroxene series). About20 percent of the bands still lack an identification.
2.5. Measurement of solid state features
In order to get a consistent view of the strength and po-sition of the features found in our spectra, we have fitted
Table 2. The definition of the different complexes.
complex λmin λmax
name µm µm
10 7 13
18 15 20
23 22 25.5
28 26.5 31.5
33 31.5 37.5
40 38 45.5
60 50 72
Gaussians to features, or multiple Gaussians in the caseof complexes, with the ISAP-line fit programme. The fitshave been applied to the original, i.e. non-continuum sub-tracted, spectrum in Fλ. In this way we prevent very broadfeatures, extending over more than one complex, from con-tributing to the individual bands. We determined a localcontinuum, often a third order polynomial, for each spec-tral section and estimated the error on the measured wave-length, FWHM, peak to continuum ratio and integratedband flux for these features by multiple independent fits to

F. J. Molster et al.: Crystalline silicate dust around evolved stars. I. 191
Table 3. Overview of the different features seen in our sample (1 = IRAS 09425–6040; 2 = NGC 6537; 3 = NGC 6302;4 = MWC 922; 5 = AC Her; 6 = HD 45677; 7 = 89 Her; 8 = MWC 300; 9 = Vy 2–2; 10 = HD 44179; 11 = HD 161796;12 = OH 26.5+0.6; 13 = Roberts 22; 14 = HD 179821; 15 = AFGL 4106; 16 = NML Cyg; 17 = IRC+10420). The wavelengthsare in µm. A “?” indicates an uncertain detection. Blends are indicated by “}”. 1 indicates that this features is only found in1 star. 17.5 and 17.5b indicate respectively a narrow (enstatite) band and a broad (amorphous silicate) band. The features at11.05, 13.5 and 32.97 µm are instrumental artifacts. The status of the 13.8 and 14.2 micron features is unclear, they also seemto suffer from instrumental artifacts, but a contribution from enstatite cannot be excluded.
the (local continuum subtracted) spectrum. For this pur-pose we varied the defined continuum, since this is likelyto have the largest influence on the derived strength ofthe features. The drawback of this method is that the un-certainties in the spectrum are not taken into account.Therefore in a few low S/N cases the derived 1 σ errorsfor the wavelength position (see the appendix), might betoo low and should be a factor 2 to 3 higher. Still, for mostcases the wavelength determination is indeed quite accu-rate. Sometimes the error in the strength of the featuresmay have been overestimated, resulting in band strengthsthat are less than 3 sigma over the noise. However, care-ful inspection of the individual cases convinced us of their
reality. Finally, we note that non-Gaussian shapes occurfor certain bands, causing a systematic but reproducibleerror.
3. Description of the programme stars
Before discussing the bands and complexes, it is useful tosummarize the properties of our programme stars. Thisis relevant when one tries to correlate the observed dustspectrum with other properties of the object. We havesearched for correlations between the relative (to the lo-cal continuum) strength of the 33.6 µm band (identifiedwith forsterite, Waters et al. 1996), which is detected in

192 F. J. Molster et al.: Crystalline silicate dust around evolved stars. I.
all programme stars, and other properties of the star orits circumstellar shell. No obvious correlation could e.g.be found with the temperature of the star, or with thecolour temperature of the underlying continuum (we willreturn to these points in Paper III). However, a correlationbetween the geometry of the circumstellar shell and the(relative) strength of the 33.6 µm feature exists (Molsteret al. 1999a). Objects with strong crystalline silicate emis-sion bands have a highly flattened circumstellar geometry.This geometry is either derived from direct imaging at op-tical or near-IR wavelengths (e.g. in the case of the RedRectangle: Osterbart et al. 1997; Monnier et al. 1997), orit is inferred from the shape of the spectral energy distri-bution (SED; e.g. in the case of IRAS 09425–6040, Molsteret al. 2001a).
Because of these differences we have divided the starsinto disk and outflow sources and ordered them in decreas-ing 33.6 micron band strength. When discussing individualstars below, present evidence for either a disk or a morespherical geometry for the dust envelope.
3.1. Disk sources
3.1.1. IRAS 09425–6040
This carbon-rich AGB star is one of the most intriguingstars in our sample. The source is discussed extensivelyby Molster et al. (2001a). It was classified as a post-AGBobject based on its IRAS colours. The ISO-SWS spectrumhowever revealed a J-type carbon-star at wavelengths be-low 15 µm (Molster et al. 2001a), while at longer wave-lengths highly crystalline O-rich dust dominates the spec-trum. It has the highest contrast crystalline circumstellardust observed so far in the complete ISO sample (Molsteret al. 1999a). The oxygen-rich dust probably originatesfrom a previous mass loss phase before the star turnedC-rich. Somehow this O-rich material was stored aroundthe star. The IRAS 60 µm measurement suggests that thespectral energy distribution is flat up to that wavelength.Both the shape of the energy distribution and the com-plex chemistry point to the presence of a disk instead ofan ordinary outflow. Molster et al. (2001a) propose thatIRAS 09425–6040 is a binary and an evolutionary progen-itor of the Red Rectangle.
The SWS spectrum of this source has already beenshown by Molster et al. (1999a; 2001a).
3.1.2. NGC 6537
NGC 6537 is an extreme Type I planetary nebula (PN),which bears a lot of similarities to NGC 6302. It has abipolar outflow structure, which is probably caused bya disk (Cuesta et al. 1995). He and N are overabun-dant while C is severely underabundant, the typical char-acteristic of Type I PN, but for both NGC 6537 andNGC 6302 these abundances are more extreme than inother Type I PN. Both NGC 6537 and NGC 6302 havevery high excitation lines, e.g. [Si VI] (Ashley & Hyland
1988) which are not found in other PNe. NGC 6537 isprobably the evolutionary product of the most massivestars which end as a white dwarf and may have had aninitial main sequence mass in the range 5−7 M�. Shocksare expected to be present due to the interaction of thefast wind and the disk. The infrared spectrum shows ev-idence for both carbon-rich dust (PAHs) and oxygen-richdust (silicates).
3.1.3. NGC 6302
NGC 6302 or the “Butterfly Nebula” is one of the infraredbrightest PN. It has one of the hottest central stars knownwith Teff = 250 000 K (Casassus et al. 2000). Togetherwith the high abundance of nitrogen and helium in thenebula (Aller et al. 1981) this points to a massive progen-itor. It is a Type I PN, with a highly bipolar outflow and athick dusty “disk”. The spectrum shows highly excited for-bidden emission lines (up to [Si VII] for NGC 6302). Roche& Aitken (1986) already detected the PAH-features at 8.6and 11.3 micron, and Cohen et al. (1989) presented evi-dence for the 6.2 and 7.7 micron PAH feature. Both obser-vations indicate the presence of carbon-rich material. Onthe other hand Payne et al. (1988) detected an OH-maser,normally associated with oxygen-rich environments. Thisdichotomy in the dust is also present in our ISO spec-trum, where we find the PAH-features and the crystallinesilicates. The presence of an equatorial disk-like structurehas long been known (Meaburn & Walsh 1980; Lester &Dinerstein 1984; Rodriguez et al. 1985) and can also beseen as a dark (dust) lane on images of this PN. The 30to 45 µm part of the spectrum has first been published byWaters et al. (1996), Beintema (1998) showed the com-plete SWS spectrum while the LWS spectrum was shownby Barlow (1998).
The full ISO spectrum of NGC 6302 has been discussedby Molster et al. (2001b).
3.1.4. MWC 922
The evolutionary status of MWC 922 is unclear, it wasplaced among the unclassified B[e] stars by Lamers et al.(1998). Both a pre-main sequence (The et al. 1994) as wellas a post main sequence status (Voors 1999) have beensuggested. The distance to this object is unknown. Thestar is projected on the Ser OB1 association, which is at1.7 kpc. However, there is no independent evidence thatMWC 922 should be associated with Ser OB1. Simon &Dyck (1977) found an infrared excess at 20 and 25 µm.Meixner et al. (1999) observed this object at 8.2 and12.2 µm and marginally resolved it. Its broad spectral en-ergy distribution and rather high mm continuum flux arenot compatible with a spherically symmetric (continuous)dusty outflow, and we classify the star as disk-like. Spectrataken with the Kuiper Airborne Observatory (KAO) datashow strong PAH emission (Cohen et al. 1989), which usu-ally is found in carbon-rich environments. The ISO spec-trum shows that oxygen-rich material is also present.

F. J. Molster et al.: Crystalline silicate dust around evolved stars. I. 193
The continuum divided LWS part of the spectrum wasalready shown by Barlow (1998), while the SWS part wasshown by Voors (1999).
3.1.5. AC Her
AC Herculis is an RV Tauri star, with a stable pulsationperiod of 75.47 days (Zsoldos 1993). The star was foundto be a binary with a period of 1194 days (van Winckelet al. 1998). The narrow velocity width of the CO rota-tional line emission (Jura et al. 1995) suggests Keplerianrotation in a disk rather than outflow. Also, very strongmm continuum flux (van der Veen et al. 1994) indicatesthe presence of large grains, which suggests a long stor-age time and therefore a (planet forming?) dust disk. Theinfrared spectrum of the binary star AC Her is strikinglysimilar to the spectrum of the comet Hale Bopp (Molsteret al. 1999a). The SWS spectrum longwards of 7 µm hasalready been shown by Molster et al. (1999a) and is brieflydiscussed by van Winckel et al. (1998). Recently, the evi-dence for a disk has been provided by Jura et al. (2000).They found a dust ring with a radius of approximately300 AU in an image taken at a wavelength of 18.7 µm.
3.1.6. HD 45677
HD 45677 is a well studied B2 star whose evolutionary sta-tus is still unclear. A pre-main sequence nature has oftenbeen suggested for this star, however its isolated position(HD 45677 is not associated with nebulosity) and the ab-sence of Algol-like variations and “blueing” effect makethis questionable. Lamers et al. (1998) also discuss thisstar and place it amongst the “unclassified” B[e] stars.They propose that it is an extreme example of a classicalBe star. Polarization measurements show that the circum-stellar material is located in a disk (Schulte-Ladbeck et al.1992). Also, the strong absorption cores of the Na I Dand Ca II K lines indicate the presence of an opticallythick disk at zero velocity (de Winter & van den Ancker1997). This disk was already present before 1950 whena significant disruption took place. After this event, thestar dimmed up to ≈2 mag in 1981 without significantchange in the colours. This is most easily explained bythe production of large (= grey) particles (de Winter &van den Ancker 1997).
The spectrum of this star has already been publishedby Voors (1999) and Malfait (1999), who also modeled it.
3.1.7. 89 Her
89 Her is a high galactic latitude F2 Ibe supergiant with atemperature of about 6500 K (Waters et al. 1993). Waterset al. (1993) confirmed the binary hypothesis of ArrelanoFerro (1984), finding an orbital period of 288.4 days. TheCO(1–0) and CO(2–1) line observations show a narrow(<1 km s−1) central spike on top of a broader (≈8 km s−1)weak component (Likkel et al. 1991). This profile is very
different from the profiles seen from detached shells, andmay represent gas orbiting in a flattened disk-like struc-ture. Several other arguments for the presence of a disk,such as the lack of energy balance between the UV and IR,are given by Waters et al. (1993). Alcolea & Bujarrabal(1995) imaged 89 Her in CO(1–0) and found an outer shell,which likely originates from a heavy mass loss period ex-perienced by the star in the past. This eruption of masswas probably triggered by the companion by a Roche lobeoverflow or even by a common envelope phase, and endedthe “AGB” evolution of 89 Her. It is likely that duringthis period also the disk was formed.
3.1.8. MWC 300
MWC 300 is classified as a B1 Ia+ hypergiant by Wolf &Stahl (1985). With a luminosity of L∗ ≈ 5 × 10⁵ L� thestar is at 15.5 kpc and about 500 pc above the Galacticplane. Henning et al. (1994) detected MWC 300 at sub-mm wavelengths and pointed out that for the deriveddistance of 15.5 kpc (Wolf & Stahl 1985) the total dustmass in the circumstellar envelope would be in the orderof 300 M�, which seems unrealistically high. Different at-tempts were made to spatially resolve this object (Skinneret al. 1993; Ageorges et al. 1997; Leinert et al. 1997;Pirzkal et al. 1997), but they were all unsuccessful. This in-dicates that the dust is indeed circumstellar and not asso-ciated with nearby nebulosity. A more realistic circumstel-lar dust and gas mass of a few M� would result in a muchsmaller distance (an order of magnitude) and therefore aluminosity of about 104 L�. This new luminosity togetherwith its extended atmosphere characteristics would clas-sify this star as an evolved low mass star (Voors 1999).Winckler & Wolf (1989) and Hamann & Persson (1989)both argue that MWC 300 is surrounded by a (slowly ex-panding) disk-like structure and a low density wind nearthe poles.
3.1.9. HD 44179
HD 44179 is the central star in the X-shaped RedRectangle nebula (Cohen et al. 1975). It is an A typesupergiant with an effective temperature of about 7500 Kin a binary system (P = 318 days), surrounded by a cir-cumbinary disk (Waelkens et al. 1996), which we see (al-most) edge on. The central star is heavily obscured bythis disk and only seen in reflection by scattering lobesbelow and above the plane of the disk. The optically thickdisk has been imaged with high resolution in the opticaland near-IR by e.g. Roddier et al. (1995) and Osterbartet al. (1997). The CO(1–0) and CO(2–1) show very nar-row (≈5 km s−1) line emission (Jura et al. 1995), atypicalfor detached AGB remnants. The mm and cm continuumflux of this source is rather high and suggests the pres-ence of large (mm-sized) grains (Jura et al. 1997). Thesegrains are likely to be formed in the long-lived circum-binary dust disk. The similarities with the disks aroundyoung stars lead to speculations about possible planetformation around this evolved star (Waters et al. 1998).

194 F. J. Molster et al.: Crystalline silicate dust around evolved stars. I.
The detection of a mysterious dust clump aroundHD 44179 by Jura & Turner (1998) feeds this interestingspeculation. The star has both carbon-rich, as evidencedby the PAH-features, and oxygen-rich dust, as evidencedby the crystalline silicate features. The PAHs are predomi-nantly present in the scattering lobes, while the crystallinesilicates are expected to be present in the disk (Waterset al. 1998).
The SWS part of the spectrum was already shown byWaters et al. (1998).
3.1.10. Roberts 22
Roberts 22 is a bipolar reflection nebula, whose evolution-ary status has recently been determined as being post-AGB (see e.g. Sahai et al. 1999). Allen et al. (1980) foundthat the central star is completely obscured by a centraldust lane and they determined the spectral type of thisobject from the two reflection lobes, which gave identicalspectra (A2 I). At a distance of 2 kpc (Allen et al. 1980;Sahai et al. 1999) its total luminosity is ≈3 × 10⁴ L�.From IR and the CO emission line data the progenitor(AGB) mass-loss rate was about 10−4 M�/yr. Roberts 22has a time-variable OH maser (Allen et al. 1980), which ismainly located in the central waist, but is also seen in thenorthern and southern scattering lobes (Sahai et al. 1999).The velocity distribution of the OH masers might be in-terpreted as a rotating disk, which is seen almost edge-on.The fact that the OH is also seen in the the lobes suggeststhat the disk is being disrupted, probably due to the fastwind (450 km s−1) seen in Hα (also time variable) arisingfrom the central star. The spectrum of Roberts 22 alsoshows both PAH-features as well as the infrared featuresof crystalline silicates.
Part of the spectrum was shown by Molster et al.(1997).
3.2. Outflow sources
3.2.1. Vy 2–2
Vy 2–2 is classified as a compact planetary nebula sur-rounded by a fossil molecular envelope from the progeni-tor AGB star (Jewell et al. 1985 and references therein).Lamers et al. (1998) classified this star as a compact plan-etary nebula B[e] star. This very young PN has both anionized zone and a neutral, molecular cloud. The ion-ized nebula has been resolved as a thin shell extendingto ≈0
′′.5 both at 15 GHz (Seaquist & Davis 1983) and in
Hα (Sahai & Trauger 1998). The inner radius was esti-mated to be 0.′′2. Only the blue shifted OH maser compo-nent is detected in Vy 2–2. This is not in contrast with ahomogeneous spherically symmetric outflow, because thatscenario predicts that the red shifted component is ab-sorbed (Seaquist & Davis 1983). Although the quality ofthe spectrum is low, due to mispointing, we decided tokeep it in our sample since it was the only young O-richPN.
3.2.2. HD 161796
HD 161796 is a high galactic latitude F3 Ib supergiant.Skinner et al. (1994) determined a distance of 1.2 kpc andtherefore a luminosity of 3600 L�. Its photosphere haslow metallicity and an enhanced nitrogen abundance, im-plying that it is an evolved Population II object (Lucket al. 1990). The shape of the very strong CO emissionfound by Likkel et al. (1991) resembles the profile of mass-losing AGB stars and confirms the post-AGB nature ofthis object. The expansion velocity determined from thisline is about 12 km s−1, a typical value for AGB stars.Skinner et al. (1994) resolved the envelope around thissource in the mid-IR (10.5 and 12.5 µm). They foundan expanding dusty equatorial toroid in a final phase ofstrongly enhanced, equatorially concentrated mass loss,which stopped about 240 years ago. During this mass-loss burst the mass-loss rate was about 3× 10⁻⁴ M�/yr.Meixner et al. (1999) confirmed these results. The con-tinuum divided LWS spectrum was already presented byBarlow (1998).
3.2.3. OH 26.5+0.6
OH 26.5+0.6 is an extreme OH/IR star, which shows ev-idence of two mass-loss regimes: a superwind phase inwhich the mass-loss rate is ≈10−4 M�/yr which startedabout 200 years ago, and an earlier AGB phase with amass-loss rate of about ≈10−6 M�/yr (Justtanont et al.1994, 1996a). The transition between these two phaseswas probably very short (∆t < 150 yr). The total masslost during the superwind phase has been estimated tobe ≈0.1 M� (Justtanont et al. 1996a). Infrared speckleinterferometry at 9.7 µm (in the silicate feature) gives anangular size for the circumstellar dust shell of 0.′′50±0.′′02,while the angular size of the dust shell outside this feature(at 8.7 µm) is less than 0.′′2 (Fix & Cobb 1988). This dif-ference is caused by the enhanced opacity in the 10 µm sil-icate feature, therefore the dust seen at these wavelengthsis located at larger radial distances and is cooler than thedust seen on either side of the feature.
The spectrum of OH 26.5+0.6 has already been shownby Sylvester et al. (1999).
3.2.4. HD 179821
HD 179821 is a G5 Ia supergiant at a distance of about6 kpc (Zuckerman & Dyck 1986; Hawkins et al. 1995; Jura& Werner 1999). At this distance the star would have aluminosity of about 3.1×10⁵ L�, far above the AGB lumi-nosity limit. If the star is indeed massive, the origin of thedust envelope was probably the Red Supergiant phase. Inthat case, the star may evolve to the Wolf-Rayet phase,before exploding as a supernova. The dusty envelope hasbeen resolved at MIR wavelengths (Hawkins et al. 1995;Jura & Werner 1999). A ring-like structure was found withan inner radius of 1.′′75 (1.6 × 1017 cm at a distance of6 kpc). This implies that the mass loss burst has stopped

F. J. Molster et al.: Crystalline silicate dust around evolved stars. I. 195
about 1500 years ago. In CO (Bujarrabal et al. 1992) andNIR scattered light (Kastner & Weintraub 1995) the dustenvelope was found to extend to at least 18′′, indicatingthat the mass loss burst lasted for at least 6000 yr. Witha derived gas mass loss rate of the order of 10−3 M�/yr(Kastner & Weintraub 1995), about 6 M� was lost by thestar during this mass-loss burst. This value is similar tothat found by Jura & Werner (1999) based on submillime-tre measurements, if a gas-to-dust ratio of 200 is assumed.From infrared imaging (Jura & Werner 1999) and mapsin CO (Bujarrabal et al. 1992), it is seen that the gas anddust distribution is not spherical. Part of the spectrum ofthis source was already shown by Waters et al. (1996).
3.2.5. AFGL 4106
AFGL 4106 has been discussed by Molster et al. (1999b),and is a high mass (15 to 20 M�) binary with two almostequally luminous stars with temperatures of about 3750 Kand 7250 K. The binary is located at a distance of about3.3 kpc. During about 4.3× 10³ years, the more massivestar in the system (now the warmer of the two) had a gasmass-loss rate of about 9×10⁻⁴ M�/yr, which gives a totalexpelled mass of about 4 M�. This huge mass-loss burstended about 450 years ago. Mid-IR imaging by Molsteret al. (1999b) shows an asymmetric detached dust shell.
3.2.6. NML Cyg
NML Cyg is an M6 supergiant at a distance of 1.8 to 2 kpc(Morris & Jura 1983; Bowers et al. 1983) with a lumi-nosity of ≈5 × 10⁵ L�, implying a main sequence massof 50 M�. The present-day mass loss rate is between1.1 × 10−4 (from OH and IR; Netzer & Knapp 1987)and 1.8 × 10⁻⁴ M� yr−1 (from CO; Knapp et al. 1982).The dust shell has been partially resolved by Fix & Cobb(1988) in the N -band (10 µm). They found an outer ra-dius of 0.′′37, which corresponds to about 1016 cm. Monnieret al. (1997) found the same value for their outer dustshell, and detected a second dust shell, located inside thefirst one, at about 0.′′125. The outflow velocity determinedfrom the 1612 MHz OH maser line is 27.7 km s−1 (Bowerset al. 1983). In the H2O maser map an asymmetry isfound at subarcsecond-scales (Richards et al. 1996). Thisis also seen in the OH maser maps on scales of a few arc-sec, indicating that this asymmetry comes from the insideand is not due to external factors. Parts of the ISO spec-trum were already shown by Justtanont et al. (1996b) andWaters et al. (1996).
3.2.7. IRC+10420
IRC+10420 is an A5 Ia+ hypergiant with a large IR-excess. It is found to be continuously evolving from acooler (F8 Ia+; Humphreys et al. 1973) to a hotter spec-tral type (A5 Ia+; Oudmaijer 1998 and references therein).IRC+10420 is at a distance of 5 ± 1 kpc which gives it aluminosity of about 5×10⁵ L�, just below the Humphreys-Davidson limit. From CO and OH measurements, an
outflow velocity of 40 km s−1 has been derived (Nedoluha& Bowers 1992; Bachiller et al. 1988; Lewis et al. 1986).Kastner & Weintraub (1995) found from their near-IRpolarimetric maps that the dust envelope extends to 9′′,which implies a dynamical age of the dust in the outer lay-ers of about 5000 years. The mass loss rate that createdthe dust shell was of the order of 10−3 M�/yr, and a totalof 5 M� of gas and dust is present in the shell: a significantfraction of the 40 M� which it probably had on the mainsequence. Bowers (1984) observed this star in the 1612and 1667 MHz OH maser lines and found indications formultiple shells in OH extending out to 4′′. This suggeststhat the mass loss went in bursts and was not constantin time. The circumstellar dust shell has been resolved inthe mid-IR at 8.7, 9.8 and 20.6 µm (Fix & Cobb 1988;Jones et al. 1993; Meixner et al. 1999). In these images anelliptical structure is found, which Oudmaijer et al. (1994)attribute to a bipolar outflow, which is beamed into ourdirection.
4. Description of the complexes
In this section we discuss the individual spectra with re-spect to the mean spectra and with respect to each other.In Figs. 6 to 20 we show the emission (and in a few casesthe absorption) complexes of the individual stars and com-pare them with the mean spectra for every complex. Inthese figures we indicate the noise level and the wave-length (spread) of the individual features. The noise levelis the mean 3σ noise level, but might change with wave-length in one complex; e.g. due to a significant changein continuum level or to changes in SWS-band and there-fore detector characteristics. These effects are particularlypresent in the 10 and 28 micron complexes. Here, we limitthe discussion to the featuress that we are confident arereal. A full list of detected and measured features in thesample stars are found in the Tables 4 to 20 (only at theCDS), and we discuss some more dubious detections andartifacts in the appendix.
4.1. The 10 micron complex
The 10 micron complexes of the disk and outflow sourcesare shown in Figs. 6 and 7.
4.1.1. Disk sources
IRAS 09425–6040: the 10 micron complex ofIRAS 09425–6040 is still dominated by the carbon star andits present outflow, therefore C-rich molecules are foundin absorption and prominent SiC emission is seen in the10 micron complex. No clear evidence for crystalline ma-terial has been found.
NGC 6537: the 10 micron complex of NGC 6537 isdominated by PAH features, and no evidence for (crys-talline) silicate features has been found.

196 F. J. Molster et al.: Crystalline silicate dust around evolved stars. I.
Fig. 6. The 10 micron complex for the disk sources, together with the mean disk spectrum (gray line). The thin gray verticallines indicate the mean peak positions of the features found, while their range is indicated by the errorbar on top of the plot.The thick line in the upper left corner in each panel indicates the mean noise level.
NGC 6302: the 10 micron complex of NGC 6302 isdominated by PAH features, and no evidence for (crys-talline) silicate features has been found.
MWC 922: the 10 micron complex of MWC 922 isdominated by PAH features. Around 10 micron, absorp-tion features seem to be present, which line up very wellwith the position of crystalline silicate emission featuresin other stars. Since crystalline silicates are not abundantin the ISM, this must be circumstellar material, It is oneof the few sources where crystalline silicates are found inabsorption in the 10 micron complex.
AC Her: the 10 micron complex of AC Her is one ofthe best examples of the presence of crystalline silicates.All crystalline silicate features are found in this source (inemission). This complex is well fitted by only crystallinesilicates (Paper III), but an amorphous component cannotbe excluded.
HD 45677: crystalline silicate features are found in the10 micron complex of HD 45677. The 10 micron amor-phous silicate feature peaks at shorter wavelengths thanfor e.g. AC Her.
89 Her: 89 Her is the third source showing a clear ev-idence of crystalline silicates in its 10 micron complex.Still, the weakness of the 8.3 micron feature suggests thatthe complex is dominated by the 10 micron amorphoussilicate feature. The peak position is red shifted with re-spect to the ISM absorption feature (which is at 9.7 µm),an indication of the presence of large grains.
MWC 300: the 10 micron amorphous silicate ab-sorption feature is remarkable. There seems to be somesubstructure in the 10 micron complex, which mightbe explained by crystalline silicate features in emission.However, apart from the prominent 8.3 micron feature,these are always seen only in one scan direction and are

F. J. Molster et al.: Crystalline silicate dust around evolved stars. I. 197
Fig. 7. The 10 micron complex for the outflow sources, plus the mean spectra and the responsivity profile of the relevant bandsin this wavelength region (SWS-band 2C and 3A). The gray line is the mean outflow spectrum, except in the lower right cornerwhere it is the mean disk spectrum. The vertical gray lines indicate the mean peak positions of the features found, while theirrange is indicated by the errorbar on top of the plot. The thick line in the upper left corner in each panel indicates the meannoise level.
therefore not trusted. The 8.3 micron feature is very sim-ilar to the ones in AC Her, 89 Her and HD 45677, allsources which have crystalline silicate emission in the10 micron complex. In MWC 300 it seems that thereis amorphous silicate absorption. The E(B − V ) to thisstar is 1.19 (Voors 1999) which corresponds to an AVof 3.7, assuming a normal reddening law. This wouldcorrespond to a τ9.7 = 0.25 using the extinction law ofSandford et al. (1995). Based on the ISO spectra we de-rived τ9.7 = 0.13± 0.03. The interstellar extinction curvepresented by Roche & Aitken (1984) would give τ9.7 = 0.2,which still above the observed τ9.7. The lower value fromthe ISO data suggests that the shape and strength of thisfeature is not only due to interstellar absorption. A natu-ral explanation would be that the interstellar absorptionprofile is filled in by circumstellar emission. The centralwavelength of this broad circumstellar emission feature islikely shifted from the 9.7 µm interstellar absorption peak,
because the observed profile does not look like the typicalinterstellar absorption profile. This shift to longer wave-lengths might be explained by large grains (see Fig. 8).
HD 44179: the 10 micron complex of HD 44179 is dom-inated by PAH-features. No crystalline silicates seem tobe present. A possible crystalline silicate feature might beseen around 10.8 µm, however at about the same positiona feature is seen in genuine PAH-sources, and attributedto a PAH cation.
Roberts 22: the 10 micron complex is dominated byPAH features. The noise in the spectrum prevents us fromreaching a conclusion about the presence or absence ofcrystalline silicate features.
4.1.2. Outflow sources
Vy 2–2: the 10 micron complex of Vy 2–2 is domi-nated by the amorphous silicate feature, which is relatively

198 F. J. Molster et al.: Crystalline silicate dust around evolved stars. I.
Fig. 8. The Qabs for spherical amorphous olivine grains(MgFeSiO4; Dorschner et al. 1995) for different grain sizes:0.01 µm (solid line), 0.1 µm (dotted line), 0.3 µm (short dashedline), 1.0 µm (long dashed line), 3.0 µm (dashed dotted line).The curves were scaled to get an equal strength around 10 µmand then offset from each other.
broad. This feature starts at relatively blue wavelengthswhich suggests that the 8.3 micron feature is present.Because of the noise level (increasing with wavelength)no statements could be made about the presence of othercrystalline silicate features. At 12.8 µm the [Ne II] line isfound.
HD 161796: as in all outflow sources, the 10 micronfeature in HD 161796 is dominated by the 10 micron amor-phous silicate feature. The signal to noise level is too lowto detect the crystalline silicate features.
OH 26.5+0.6: the 10 micron complex is domi-nated by amorphous silicate absorption. Some structureseems present, however the absorption pattern cannot bematched with the features of crystalline silicates seen inother stars. Emission is not expected here, since at longerwavelengths we do see crystalline silicate features in ab-sorption. The origin of the substructure therefore remainsunclear.
HD 179821: the 10 micron complex is dominated bythe red-shifted amorphous silicate feature. The shape andposition resembles the feature of AFGL 4106 where it hasbeen attributed to the presence of large grains (Molsteret al. 1999b).
AFGL 4106: this complex is characterized by the10 micron amorphous silicate feature. The sharp featureat 11.06 µm is instrumental; no correction, as in the othersources, has been applied to this feature. There is no evi-dence for crystalline silicate features.
NML Cyg: the 10 micron feature is dominated byamorphous silicate absorption. The emission wings, atboth sides together with the location of the center of theabsorption profile suggest that it is mainly self absorption.A (small) contribution from interstellar extinction cannotbe excluded or confirmed. The substructure at 9.39, 9.54,10.07, 10.33, 10.76 and 11.0 µm is due to gas-phase NH3
(Yamamura, private comm.).IRC+10420: the 10 micron feature is dominated by
amorphous silicate emission. It peaks at a wavelength sig-nificantly offset from the usual 9.7 micron feature. Thismight be due to large grains, as in AFGL 4106. Fix &Cobb (1988) also suggested the presence of large grains
to explain the 10 over 20 micron amorphous silicate ra-tio (see Fig. 8). There are indications of substructure inthe amorphous silicate feature, which is also seen in starswith prominent 10 micron crystalline silicate features.Interestingly enough no 11.3 micron feature (attributedto forsterite) is detected. This suggest that the forsteriteabundance and/or temperature is probably very low, incontrast to the enstatite abundance. It should be notedthat in the rest of the spectrum the forsterite features areweak or not detected.
4.2. The 18 micron complex
The 18 micron complexes of the disk and outflow sourcesare shown in Figs. 9 and 10.
4.2.1. Disk sources
IRAS 09425–6040: the 18 micron complex ofIRAS 09425–6040 is quite similar to the mean 18 microncomplex of the disk sources, both with regard to the po-sitions of the features as well as in the strength of thefeatures.
NGC 6537: because of the low dust temperature, the18 micron complex is less prominent than in other sources.Still, most prominent features are easy to recognize. The18.1 micron feature is relatively strong compared to theother features. The 18.9 and 19.5 micron features arenicely separated. The sharp feature at 18.88 µm is uniden-tified; see the Appendix for more details on this feature.
NGC 6302: the 18 micron complex of NGC 6302 isdominated by crystalline silicates. The 19.5 micron featureis relatively strong compared to the 18.1 micron feature.
MWC 922: compared to the mean disk spectrum,MWC 922 shows a drop around 16.5 µm. It is quite similarto what has been found for MWC 300. In Sect. 4.1.1 it hasbeen argued, that the 10 micron complex of MWC 300 islikely to be filledin interstellar absorption. MWC 922 hasan E(B − V ) ≈ 2 (Voors 1999), which is higher than forMWC 300. It is not known which fraction is due to inter-stellar and which is due to circumstellar reddening, butthis high value leaves the possibility of filled in interstel-lar absorption open. One would expect to see evidence forthis hypothesis in the 10 micron complex. Unfortunatelythat complex is dominated by PAH features, which willfill in any absorption profile and make it more difficult torecognize, since these features are located on the slopes ofthe silicate absorption profile, masking its presence. Theabsorption by crystalline silicates in the 10 micron com-plex suggest that circumstellar amorphous silicates willalso be in absorption at 10 and 18 µm. Another indirectargument for interstellar absorption in the 18 micron com-plex is the peak wavelength of the absorption feature. Itis much bluer than the peak wavelength of the amorphoussilicates found in emission in the disk sources.
This is the only star where the 17 micron feature isclearly divided into a 16.7 and 17.0 micron feature. Inother sources where these features are found, they are

F. J. Molster et al.: Crystalline silicate dust around evolved stars. I. 199
Fig. 9. The 18 micron complex for the disk sources, together with the mean disk spectrum (gray line). The vertical gray linesindicate the mean peak positions of the features found, while their range is indicated by the errorbar on top of the plot. Thethick line in the upper left corner in each panel indicates the mean noise level.
severely blended. A closer look at the mean disk spectrumindicates that this feature is a blend of 2 features, even ifone excludes MWC 922 from this mean spectrum. It is alsofound in the two independent observations of MWC 922,so all these arguments make us confident about the real-ity of these two features. The 19.5 micron feature is thebluest found in our sample. There seems to be weak struc-ture on top of the 18.1 micron feature, which is also foundin HD 44179.
AC Her: the 18 micron complex is dominated by the15.3, 15.9 and 16.2 micron features. These features are rel-atively strong because of the high temperature the crys-talline silicates around this source attain. As in MWC 300and 89 Her, the 18.9 micron feature is rather blue-shifted.This object has a low E(B−V ) due to interstellar extinc-tion (≈0.1). This low value of the interstellarE(B−V ), thestrength of the 15.9 and 16.2 micron features, and the fact
that the spectrum returns to the same level around 15 µm,suggests that the spectral structure around 17 µm in thisobject is caused by the 16.2 and 18.1 micron features. Notethat in this source the spectrum drops at 18 µm, while inMWC 300 and MWC 922 the spectrum still rises long-wards of 18 µm, indicating that in the latter sources the18.1 micron feature is on a slope.
HD 45677: the 18 micron complex of HD 45677 is verysimilar to the mean disk spectrum. It shows evidence forthe presence of amorphous silicates. On top of the amor-phous silicate feature, weak crystalline silicate features arefound. Among the disk sources, it is the object with themost distinct presence of amorphous silicates. The amor-phous silicate feature peaks at a rather red wavelength,which might be an indication of relatively large grains.However, there is only a small shift in the 10 micron com-plex, which suggest that the grains are relatively small.

200 F. J. Molster et al.: Crystalline silicate dust around evolved stars. I.
Fig. 10. The 18 micron complex for the outflow sources, plus the mean spectra, and the responsivity profile of the relevantbands in this wavelength region (SWS-band 3A, 3C and 3D). The gray line is the mean outflow spectrum, except in the lowerright corner where it is the mean disk spectrum. The vertical gray lines indicate the mean peak positions of the features found,while their range is indicated by the errorbar on top of the plot. The thick line in the upper left corner in each panel indicatesthe mean noise level.
Therefore a compositional difference of the dust particlesis more likely to explain the red peak position. We canalso not exclude that there are contributions from othermaterials, such as simple oxides and/or other silicates.
89 Her: the 18 micron complex of 89 Her shows abroad emission plateau, unlike most disk sources. Thisis evidence for the presence of amorphous silicates. Itsprofile is rather broad, with a prominent blue wing. Ontop of this amorphous feature, the crystalline featuresare present. The 18.0 micron feature is relatively strong.Similar to MWC 300 and AC Her, the 18.9 micron featureis severely blue-shifted (towards 18.49 µm in this source),which makes the 19.5 micron feature rather prominent.The 16.9 micron feature is more pronounced than in mostspectra.
MWC 300: the 18 micron complex of MWC 300 ischaracterized by (interstellar) silicate absorption togetherwith circumstellar silicate emission. The circumstellar
amorphous silicate emission profile is red-shifted with re-spect to the normal (= interstellar) amorphous silicateprofile. This might indicate that large grains are present,a fact which can also be inferred from the high mm contin-uum flux (Henning et al. 1994). The different features ofcrystalline silicates are visible in the spectrum, althoughinfluenced by interstellar absorption. The clearest exam-ple of a feature influenced by interstellar absorption, isthe 18.0 micron feature. In most sources it is one of thestrongest features in the 18 micron complex, while inMWC 300 it is rather weak, since it has to fill up partof the interstellar absorption feature. The removal of theinterstellar absorption profile is likely to reveal a promi-nent 18.0 micron feature in MWC 300 too. The shapeof the 18.0 micron feature is also influenced by the blue-shifted 18.9 micron feature, a shift which was also foundin AC Her and 89 Her. The 19.5 micron feature is promi-nently present and rather broad, as is also seen for the

F. J. Molster et al.: Crystalline silicate dust around evolved stars. I. 201
AC Her and 89 Her. In the spectrum of MWC 922 the of-ten blended 16.9 micron feature is split into two sharp fea-tures at 16.7 and 17.0 µm. In the spectrum of MWC 300only the sharp 17.0 micron feature is present, while the16.7 micron feature is missing.
Crystalline silicates also influence the shape of thiscomplex. The 18.1 and 16.2 micron features are locatedat the positions of the rise in the “absorption” feature.This also leads to a change in the feature appearance andis another proof of silicate emission together with inter-stellar absorption. We exclude the possibility of no ab-sorption at all and only emission features, because thiswould lead to a broad emission plateau between the 10and 18 micron region, which has not been observed inother stars. Narrow absorption like profiles are also foundin the spectra of MWC 922, AC Her, IRAS 09425–6040and NGC 6302 (see Fig. 9). However, in most of thesecases it is caused by strong 16.2 and 18.1 micron features.This is evidenced by the decrease of the flux (in the con-tinuum subtracted spectra) on the blue side of the blendof the 15.9 and 16.2 micron features. This drop is not seenin MWC 300 nor probably MWC 922.
HD 44179: it cannot be excluded that part of the fea-tures in this complex originate from a carbon based chem-istry. The 18 micron complex differs in several respectsfrom the mean disk spectrum. The 18.9 micron feature isthe strongest seen in this sample. The spectrum around15 µm is influenced by CO2 absorption at 13.9, 14.9, 15.3and 16.2 µm. Without these absorptions the feature at15 µm would be very similar to the one found in 89 Her.The 15.9 and 16.2 micron features are rather prominent,although not as strong as in AC Her. The 16.5 micronfeature, probably a PAH-feature (Van Kerckhoven et al.2000), is present in both the AOT01 and the AOT06 spec-trum and seems therefore rather secure. The only otherstar where this feature has been detected is NGC 6537.Also, longwards of 16.5 µm these two stars look quite sim-ilar, with similar features at 16.9, 18.0 and 18.9 µm. The3 features found around 18 µm (at 17.8, 18.0 and 18.2 µm)are seen in both the AOT01 and the AOT06 spectra aswell as in the up and the down scans and there is notmuch doubt about their reality. The 19.5 micron featureis rather weak in HD 44179.
Roberts 22: the 18 micron complex is rather noisy, pre-venting the measurement of the individual components.The gentle slope at the blue side of the amorphous silicatefeature suggests the presence of some crystalline silicatesaround 16 µm. Other crystalline silicate features might bepresent but the noise prevents their detection.
4.2.2. Outflow sourcesVy 2-2: unfortunately no interesting features could be
confirmed in this wavelength range, because of the lowsignal to noise ratio. The emission line at 15.56 µm is[Ne III].
HD 161796: the 18 micron complex of HD 161796is dominated by the 18.1 micron feature. However, oneshould be careful with the interpretation of this feature
(see Appendix for more details). The 19.5 micron featureis relatively strong.
OH 26.5+0.6: the 18 micron complex of OH 26.5+0.6is an absorption spectrum. Both the amorphous and thecrystalline silicates are seen in absorption. We can rec-ognize most of the features which are normally seen inemission. All absorption features are slightly red-shifted,we speculate that this red-shift is due to a temperatureeffect (Bowey et al. 2000). It is clear from the absorptionprofile that crystalline silicates only play a minor role inthe spectrum (at these wavelengths).
HD 179821: this complex lies on a very steep slope. Itshows the characteristic outflow source spectrum. It muchresembles AFGL 4106 and IRC+10420, two other massivestars. It is dominated by the 18 micron amorphous silicatefeature. On top of this feature, weak crystalline silicatescan be detected.
AFGL 4106: the 18 micron complex of AFGL 4106 isvery similar to the mean outflow spectrum, a broad amor-phous silicate feature with weak crystalline silicate fea-tures on top. No differences between the mean spectrumand AFGL 4106 were found.
NML Cyg: the 18 micron amorphous silicate absorp-tion is less prominent than for similar high mass starIRC+10420. This might indicate that the 18 micron amor-phous silicate band is just in the regime between self-absorption and emission. Whatever the reason, it makesthe crystalline silicates more apparent. Most crystallinesilicate features are clearly seen. Still, the 19.5 micron fea-ture seems absent.
IRC+10420: the 18 micron spectrum is very similar tothe mean outflow spectrum. A strong amorphous compo-nent is seen with some weak crystalline silicate featureson top of it.
4.3. The 23 micron complex
The 23 micron complex spectra of the disk and outflowsources are presented in Figs. 11 and 12.
4.3.1. Disk sources
IRAS 09425–6040: as for the 18 micron complex, the23 micron complex in this source is also quite similar tothe mean 23 micron complex for the disk sources. Thereare some differences: The slope to the short wavelengthside continues to shorter wavelengths than in the meandisk spectrum and the plateau does not show the step-likestructure seen in the mean (disk) spectrum. The 24.5 mi-cron feature is relatively strong.
NGC 6537: the 23 micron complex of NGC 6537 ischaracterized by a very strong 23.7 micron feature andrelatively weak 23.0 micron feature. Although the 24.5 mi-cron feature is severely influenced by the [Ne V] emissionline, the step-like structure is visible in the plateau.
NGC 6302: the main differences between the mean23 micron complex and the 23 micron complex of

202 F. J. Molster et al.: Crystalline silicate dust around evolved stars. I.
Fig. 11. The 23 micron complex for the disk sources, together with the mean disk spectrum (gray line). The vertical gray linesindicate the mean peak positions of the features found, while their range is indicated by the errorbar on top of the plot. Thethick line in the upper left corner in each panel indicates the mean noise level.
NGC 6302, is found in the strength of the 23.0 and 25.0 mi-cron features. The 23.0 micron feature is slightly weakerthan average while the 25.0 micron feature is significantlystronger.
MWC 922: the most striking aspects of the 23 microncomplex of MWC 922 is the strong 23.9 micron featureand thus the relative weakness of the 23.7 micron feature.Also the 23.1 micron feature is relatively strong. However,there is no correlation between these two features; e.g.,compare MWC 922 with AC Her.
AC Her: the 23 micron complex differs in several re-spects from the mean spectrum. The feature at 22.69 µmhas a remarkable shape: it is sharp and rather prominent.It appears very similar to a feature in HD 44179, but thereit is weaker. However, there are some questions about thereality in AC Her (see the Appendix). If this feature can
be attributed to the 23.0 micron feature it is the mostblue-shifted, which implies that also the 23.7 micron fea-ture is significantly blue-shifted. Alike to MWC 922, thereis a 23.89 micron feature present. The 24.5 micron featurein the spectrum of AC Her is not as prominent as in themean spectrum.
HD 45677: the 23 micron complex of HD 45677 israther similar to the mean 23 micron disk complex. Stillthere are two subtle differences. The 25.0 micron featureis weaker in HD 45677 than in the mean spectrum, whileat the blue side of this complex the 23.0 micron featureis stronger than in the mean spectra. This is exactly theopposite of what is found in NGC 6302.
89 Her: the 23 micron complex of 89 Her is rathersmooth and few individual structures can be recognized.The broadness of this complex is similar to the complexes,

F. J. Molster et al.: Crystalline silicate dust around evolved stars. I. 203
Fig. 12. The 23 micron complex for the outflow sources, plus the mean spectra, and the responsivity profile of SWS-band 3D.The gray line is the mean outflow spectrum, except in the lower right corner where it is the mean disk spectrum. The verticalgray lines indicate the mean peak positions of the features found, while their range is indicated by the errorbar on top of theplot. The thick line in the upper left corner in each panel indicates the mean noise level.
including the plateau, seen in other sources. The width ofthe features seems larger than in the average disk spec-trum and this may cause severe blends. Still, better signal-to-noise will probably unveil similar structures to thosefound in the other sources.
MWC 300: the 23 micron complex attracts attentionbecause of the absence of the red shifted 23.0 micron fea-ture. Two of the components of the 25 micron plateau arequite clear in this object.
HD 44179: where the 18 micron complex looks quitesimilar to NGC 6537, the 23 micron complex is ratherdifferent. It has a rather prominent 23.0 micron featureand the slope at the red side of the 23.7 micron feature isvery gentle. There are indications for the step-function ofthe plateau but the noise level prevents strong conclusions.The 23.0 micron feature is rather prominent and blue-shifted with respect to the mean spectrum.
Roberts 22: the 23 micron complex is dominated bynoise and by fringes. The strong structures around 23 µmand 25 µm are due to constructive interference of thefringes in the up and down scan, and the relatively flatstructure around 24 µm is due to destructive interferenceof the fringes. The width of the whole structure is quitesimilar to the mean spectrum width. This suggests thatthe complex is present but not much can be said aboutthe structure of this complex.
4.3.2. Outflow sources
Vy 2–2: the spectrum in this wavelength range alsosuffers from a lot of noise. The comparison with the meanoutflow spectrum suggests the presence of the 23.0 and23.7 micron blend.

204 F. J. Molster et al.: Crystalline silicate dust around evolved stars. I.
HD 161796: apart from the 23.1 and the 23.7 micronfeatures, the most striking feature is the 25.0 micron fea-ture. It is rather blue-shifted with respect to the 25.0 mi-cron features in other sources. Its presence is also con-firmed in the rev071 dataset, although the feature thereseems less blue-shifted and more in line with the other25.0 micron features.
OH 26.5+0.6: as in the case of the 18 micron complex,the crystalline features appear as weak absorption featureson top of the wing of the amorphous silicate absorption.The blend of the 23.0 and 23.7 micron features is rathernarrow compared to the mean spectrum. The 23.89 micronfeature seems present in absorption.
HD 179821: as for all outflow sources, the 25 micronplateau is also very weak in this source. The feature at23.0 micron feature is surprisingly strong and the 23.7 mi-cron feature rather broad. The sharp rise of the 23.0 mi-cron feature, which is typical for the outflow sources, isevident here.
AFGL 4106: the 23 micron complex is somewhat re-markable. The 25 micron plateau is, as for most outflowsources, rather weak and ends already before 25 µm. Thefeatures around 23 µm produce a very flat plateau. Somestructure can be detected, but together with IRAS 09425–6040 it shows the flattest structure in our whole sample.
NML Cyg: the 23 micron complex is interesting in twoways. The 25 micron plateau is almost absent. However,the blend of the other features is the broadest seen in oursample. In this respect the spectrum is somewhat similarto the 23 micron complex of IRC+10420.
IRC+10420: the 23 micron complex is weak with re-spect to the continuum and therefore affected by noise.Still we could identify the different features. The complexis also quite broad and alike to what is seen for AFGL 4106and NML Cyg.
4.4. The 28 micron complex
The 28 micron complex spectra of the disk and the outflowsources are plotted in Figs. 13 and 14.
4.4.1. Disk sources
IRAS 09425–6040: the strength of its 27.6 micron fea-ture is an intriguing aspect of the 28 micron complex. Itis also very broad and blends with the 26.9 and 28.2 mi-cron features. The 30.6 micron feature is relatively strong.There is a hint of the 31.2 micron feature in the rev084data. However, this cannot be confirmed by the rev254data because of the noise level in this area. The 29.6 mi-cron feature peaks at the very blue side of the feature inthe mean disk spectrum.
NGC 6537: one of the most interesting aspects of the28 micron complex in NGC 6537 is the absence of the31.2 micron feature. The 29.6 and 30.6 micron featuresare both very strong relative to the 27.6 and 28.2 micronfeatures.
NGC 6302: the 29.6 and 30.6 micron features are verystrong compared to other sources, but very similar toNGC 6537. In contrast to NGC 6537, the 31 micron fea-ture is prominent in this source. The strength ratio of the27.6 micron feature to the 28.2 micron feature is ratherlow compared to the average.
MWC 922: the 27.6 and 28.1 micron features are rela-tively strong in this star. Compared to other spectra, the29.6 micron feature “misses” intensity at the long wave-length side. If the 29.6 micron feature is indeed a blendof two features, then the reddest feature is severely de-pressed in MWC 922. The 30.6 and 31.2 micron featuresare clearly present and relatively strong.
AC Her: the 28 micron complex is rather noisy, espe-cially longwards of 29 micron, where band 4 starts, butall features seem present. The 27.6 and 28.2 micron fea-ture are still well visible and rather strong. The 29.6 and30.6 micron features are hardly detectable above the noise.The sharp and strong peak at 31.0 µm is questionable.Still, there are indications of an underlying 31.2 micronfeature.
HD 45677: the 28 micron complex of HD 45677 is in-teresting due to the strong 27.6 and 28.2 micron features.The ratio between the flux of these two features and the29.6 micron feature is the highest found in our sample.The 30.6 micron feature is also weak, therefore the dustspecies that causes the prominent 29.6 and 30.6 micronfeatures in NGC 6302 and NGC 6537 must be only a mi-nor component in HD 45677.
89 Her: the 28 micron complex is dominated by the riseof the broad 33 micron band. On top of this feature arethe 27.6 and 28.2 micron features. We have possibly founda broad structure around 29.7 µm and no indications fora 30.6 micron feature. The 33 micron band together withthe low S/N for Band 4 make this a problematic part ofthe spectrum.
MWC 300: MWC 300 is again a source where the 27.6and 28.2 micron features are stronger than the 29.6 and30.6 micron features. The 28.8 micron feature is presentin this source, but the sharp peak (at 28.7 µm) on topof the 28.8 micron feature has significant uncertainties(see Appendix). Neglecting this peak, the remaining fea-ture lines up very well with the weak feature found inNGC 6537.
HD 44179: the 28 micron complex is, like that of89 Her, dominated by the onset of the broad 33 micronband. On top of the blue rise of this broad band, the 27.6and 28.2 micron features are rather prominent (in con-trast, for example, to NGC 6302). The 29.6 micron featureseems less pronounced and also the 30.6 micron feature isjust above the noise level. The 31.2 micron feature is notdetected.
Roberts 22: because of the flux jumps around band 3E,it was difficult to subtract a reliable continuum forband 3E. We have tried to maintain the relative slope aftera jump in the flux. In this way we were able to subtract thecontinuum, but the relative strength of the features in thedifferent bands (3D, 3E and 4) in this wavelength range

F. J. Molster et al.: Crystalline silicate dust around evolved stars. I. 205
Fig. 13. The 28 micron complex for the disk sources, together with the mean disk spectrum (gray line). The vertical gray linesindicate the mean peak positions of the features found, while their range is indicated by the errorbar on top of the plot. Thethick line in the upper left corner in each panel indicates the mean noise level.
is severly influenced by these flux jumps. We measuredthe bands in this wavelength range using a local contin-uum. We found the 27.6, 28.2 and 28.8 micron features,all three of which were seen in both the rev254 and therev084 spectra. The 28.8 micron band is interesting sinceit is the most red-shifted one from the four stars wherethis band is found.
4.4.2. Outflow sources
Vy 2–2: the beginning of band 4 is less effected bynoise. Band 4 has a larger aperture and is therefore lessinfluenced by the mispointing. The 29.6 and 30.6 micronfeatures can be identified.
HD 161796: the noise is rather severe in this part ofthe spectrum. Still, some features can be identified. Theblend of 27.6 and 28.2 micron features is present. The29.6 micron feature is detected but has an extension at
the short wavelength side, in both the up and down scan,which is not seen in the rev071 data. This leaves someuncertainty on the reality of this extension.
OH 26.5+0.6: this is the complex where the absorp-tion spectrum of this source goes into an emission spec-trum. The 29.6 micron feature, the first feature in this starwhich appears in emission, is rather blue-shifted. No 30.6or 31.2 micron feature is found.
HD 179821: the 27.6 and 28.2 micron features arerelatively weak with respect to the 29.6 micron feature.Whether this is a typical outflow source characteristicis difficult to say, because the mean outflow spectrum israther influenced by this spectrum (see Paper II).
AFGL 4106: because of badly corresponding up anddown scans we have removed the first part of band 4 (29to 30.5 µm). Still, the 27.6 and 28.2 micron features standout very prominently, with sharp drops on either side ofthe blend.
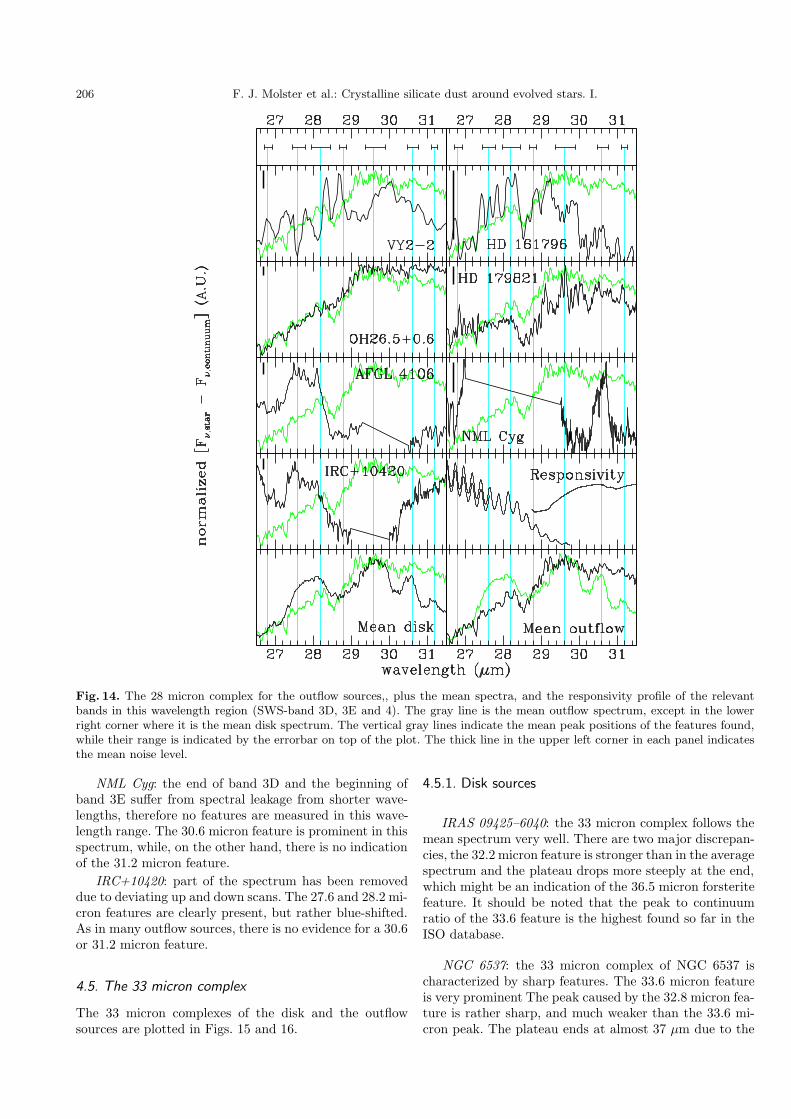
206 F. J. Molster et al.: Crystalline silicate dust around evolved stars. I.
Fig. 14. The 28 micron complex for the outflow sources,, plus the mean spectra, and the responsivity profile of the relevantbands in this wavelength region (SWS-band 3D, 3E and 4). The gray line is the mean outflow spectrum, except in the lowerright corner where it is the mean disk spectrum. The vertical gray lines indicate the mean peak positions of the features found,while their range is indicated by the errorbar on top of the plot. The thick line in the upper left corner in each panel indicatesthe mean noise level.
NML Cyg: the end of band 3D and the beginning ofband 3E suffer from spectral leakage from shorter wave-lengths, therefore no features are measured in this wave-length range. The 30.6 micron feature is prominent in thisspectrum, while, on the other hand, there is no indicationof the 31.2 micron feature.
IRC+10420: part of the spectrum has been removeddue to deviating up and down scans. The 27.6 and 28.2 mi-cron features are clearly present, but rather blue-shifted.As in many outflow sources, there is no evidence for a 30.6or 31.2 micron feature.
4.5. The 33 micron complex
The 33 micron complexes of the disk and the outflowsources are plotted in Figs. 15 and 16.
4.5.1. Disk sources
IRAS 09425–6040: the 33 micron complex follows themean spectrum very well. There are two major discrepan-cies, the 32.2 micron feature is stronger than in the averagespectrum and the plateau drops more steeply at the end,which might be an indication of the 36.5 micron forsteritefeature. It should be noted that the peak to continuumratio of the 33.6 feature is the highest found so far in theISO database.
NGC 6537: the 33 micron complex of NGC 6537 ischaracterized by sharp features. The 33.6 micron featureis very prominent The peak caused by the 32.8 micron fea-ture is rather sharp, and much weaker than the 33.6 mi-cron peak. The plateau ends at almost 37 µm due to the

F. J. Molster et al.: Crystalline silicate dust around evolved stars. I. 207
Fig. 15. The 33 micron complex for the disk sources, together with the mean disk spectrum (gray line). The vertical gray linesindicate the mean peak positions of the features found, while their range is indicated by the errorbar on top of the plot. Thethick line in the upper left corner in each panel indicates the mean noise level.
presence of a 36.5 micron feature. The 34.1 micron featureis seen as a small plateau on the 33.6 micron feature.
NGC 6302: in general, the complex in this source isquite similar to the mean complex structure. However, the32.8 micron feature is weaker than average in this source.
MWC 922: the 33 micron complex of MWC 922 is char-acterized by a prominent plateau. The weak structure (atabout 33.5 µm) on top of the 33.6 micron structure islikely the [S III] emission line. The 32.8 micron featureis slightly stronger than average. The feature at 34.8 µmis the [Si II] line.
AC Her: it should be noted that the band 4 data isof low quality, although a lot of spurious points (glitchesand glitch-tails) have already been removed by hand. Asin the 23 micron complex there is some doubt about oneof the most prominent features, the one at 32.6 µm (seefor more details the Appendix). We note that the 33 and23 micron complexes have a similar appearance. In the
23 micron spectrum of this source, a sharp feature hasalso been found at the short wavelength side.
HD 45677: the 33 micron complex of HD 45677 is thatof a typical disk source. It has a rather strong 33.6 micronfeature and a relatively weak 32.8 micron feature. Themain difference is found in the strength of the 35.9 micronfeature, which is much stronger in this source than in themean spectrum. As for NGC 6537, the red side of the33.6 micron feature shows evidence for the 34.1 micronfeature. The plateau extends beyond 37 µm.
89 Her: interpretation of the 33 micron complex suffersfrom the low flux levels. The three main features (the 32.8and 33.6 micron features and the plateau) are present. Anysubstructure is difficult to quantify due to the low S/N.The 32.8 and 33.6 micron features are rather blue-shifted.
MWC 300: the overall shape is very similar to the meanspectrum. The 33.6 and 34.1 micron bands are clearly splitin this source, and the structure nicely correlates with

208 F. J. Molster et al.: Crystalline silicate dust around evolved stars. I.
Fig. 16. The 33 micron complex for the outflow sources,, plus the mean spectra and the responsivity profile of SWS-band 4.The gray line is the mean outflow spectrum, except in the lower right corner where it is the mean disk spectrum. The verticalgray lines indicate the mean peak positions of the features found, while their range is indicated by the errorbar on top of theplot. The thick line in the upper left corner in each panel indicates the mean noise level.
the structure seen in AFGL 4106. The plateau extends toalmost 37 µm and the sharp feature at 34.81 µm is the[Si II] line. The 32.8 micron feature is weak but clearlypresent.
HD 44179: the 33 micron complex can be described asa very broad feature peaking at 33.6 µm, a sharp 32.8 mi-cron feature and a plateau extending to wavelengths largerthan 37 µm. This very broad feature is a blend of the 33.6and 34.0 micron features. In the 35 micron plateau thedifferent components can be identified.
Roberts 22: the general shape is roughly equal to themean disk spectrum. We masked the unreliable narrow(0.1 µm) peak at 33.3 µm (see Appendix for more de-tails), but still the 33.6 micron feature peaks at ratherblue wavelengths like 89 Her, which shows a similar com-plex. The 36.0 micron feature, which is mostly found in
outflow sources, is rather strong. It was already stated be-fore that this source shows a lot of outflow characteristics.On the other hand, the strength ratio of the 32.8 micronfeature to the 33.6 micron feature is more like that of thedisk sources.
4.5.2. Outflow sources
Vy 2–2: the 33 micron complex suffers also from alow signal-to-noise ratio, but the general structure canbe distinguished. The ratio of the 32.8 micron feature tothe 33.6 micron feature is rather low in comparison withthe rest of the outflow sources. The plateau is relativelystrong.
HD 161796: the 33 micron complex of HD 161796is more like the disk sources than the outflow sources.
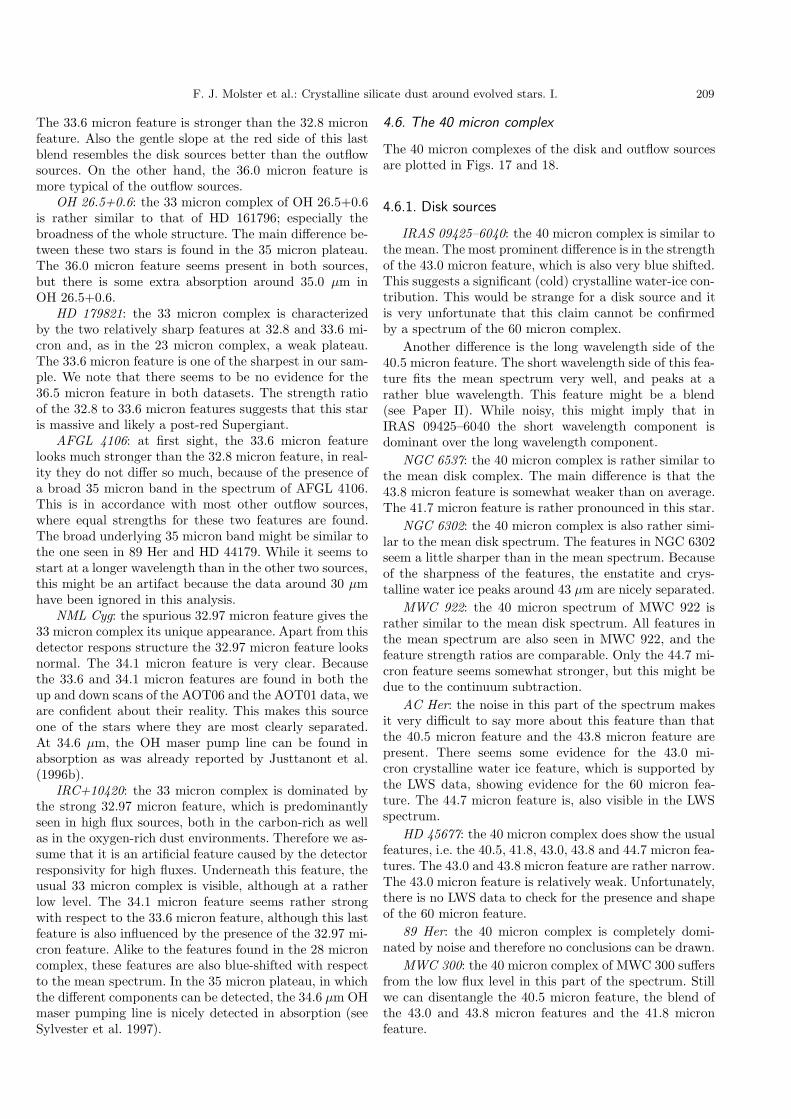
F. J. Molster et al.: Crystalline silicate dust around evolved stars. I. 209
The 33.6 micron feature is stronger than the 32.8 micronfeature. Also the gentle slope at the red side of this lastblend resembles the disk sources better than the outflowsources. On the other hand, the 36.0 micron feature ismore typical of the outflow sources.
OH 26.5+0.6: the 33 micron complex of OH 26.5+0.6is rather similar to that of HD 161796; especially thebroadness of the whole structure. The main difference be-tween these two stars is found in the 35 micron plateau.The 36.0 micron feature seems present in both sources,but there is some extra absorption around 35.0 µm inOH 26.5+0.6.
HD 179821: the 33 micron complex is characterizedby the two relatively sharp features at 32.8 and 33.6 mi-cron and, as in the 23 micron complex, a weak plateau.The 33.6 micron feature is one of the sharpest in our sam-ple. We note that there seems to be no evidence for the36.5 micron feature in both datasets. The strength ratioof the 32.8 to 33.6 micron features suggests that this staris massive and likely a post-red Supergiant.
AFGL 4106: at first sight, the 33.6 micron featurelooks much stronger than the 32.8 micron feature, in real-ity they do not differ so much, because of the presence ofa broad 35 micron band in the spectrum of AFGL 4106.This is in accordance with most other outflow sources,where equal strengths for these two features are found.The broad underlying 35 micron band might be similar tothe one seen in 89 Her and HD 44179. While it seems tostart at a longer wavelength than in the other two sources,this might be an artifact because the data around 30 µmhave been ignored in this analysis.
NML Cyg: the spurious 32.97 micron feature gives the33 micron complex its unique appearance. Apart from thisdetector respons structure the 32.97 micron feature looksnormal. The 34.1 micron feature is very clear. Becausethe 33.6 and 34.1 micron features are found in both theup and down scans of the AOT06 and the AOT01 data, weare confident about their reality. This makes this sourceone of the stars where they are most clearly separated.At 34.6 µm, the OH maser pump line can be found inabsorption as was already reported by Justtanont et al.(1996b).
IRC+10420: the 33 micron complex is dominated bythe strong 32.97 micron feature, which is predominantlyseen in high flux sources, both in the carbon-rich as wellas in the oxygen-rich dust environments. Therefore we as-sume that it is an artificial feature caused by the detectorresponsivity for high fluxes. Underneath this feature, theusual 33 micron complex is visible, although at a ratherlow level. The 34.1 micron feature seems rather strongwith respect to the 33.6 micron feature, although this lastfeature is also influenced by the presence of the 32.97 mi-cron feature. Alike to the features found in the 28 microncomplex, these features are also blue-shifted with respectto the mean spectrum. In the 35 micron plateau, in whichthe different components can be detected, the 34.6 µm OHmaser pumping line is nicely detected in absorption (seeSylvester et al. 1997).
4.6. The 40 micron complex
The 40 micron complexes of the disk and outflow sourcesare plotted in Figs. 17 and 18.
4.6.1. Disk sources
IRAS 09425–6040: the 40 micron complex is similar tothe mean. The most prominent difference is in the strengthof the 43.0 micron feature, which is also very blue shifted.This suggests a significant (cold) crystalline water-ice con-tribution. This would be strange for a disk source and itis very unfortunate that this claim cannot be confirmedby a spectrum of the 60 micron complex.
Another difference is the long wavelength side of the40.5 micron feature. The short wavelength side of this fea-ture fits the mean spectrum very well, and peaks at arather blue wavelength. This feature might be a blend(see Paper II). While noisy, this might imply that inIRAS 09425–6040 the short wavelength component isdominant over the long wavelength component.
NGC 6537: the 40 micron complex is rather similar tothe mean disk complex. The main difference is that the43.8 micron feature is somewhat weaker than on average.The 41.7 micron feature is rather pronounced in this star.
NGC 6302: the 40 micron complex is also rather simi-lar to the mean disk spectrum. The features in NGC 6302seem a little sharper than in the mean spectrum. Becauseof the sharpness of the features, the enstatite and crys-talline water ice peaks around 43 µm are nicely separated.
MWC 922: the 40 micron spectrum of MWC 922 israther similar to the mean disk spectrum. All features inthe mean spectrum are also seen in MWC 922, and thefeature strength ratios are comparable. Only the 44.7 mi-cron feature seems somewhat stronger, but this might bedue to the continuum subtraction.
AC Her: the noise in this part of the spectrum makesit very difficult to say more about this feature than thatthe 40.5 micron feature and the 43.8 micron feature arepresent. There seems some evidence for the 43.0 mi-cron crystalline water ice feature, which is supported bythe LWS data, showing evidence for the 60 micron fea-ture. The 44.7 micron feature is, also visible in the LWSspectrum.
HD 45677: the 40 micron complex does show the usualfeatures, i.e. the 40.5, 41.8, 43.0, 43.8 and 44.7 micron fea-tures. The 43.0 and 43.8 micron feature are rather narrow.The 43.0 micron feature is relatively weak. Unfortunately,there is no LWS data to check for the presence and shapeof the 60 micron feature.
89 Her: the 40 micron complex is completely domi-nated by noise and therefore no conclusions can be drawn.
MWC 300: the 40 micron complex of MWC 300 suffersfrom the low flux level in this part of the spectrum. Stillwe can disentangle the 40.5 micron feature, the blend ofthe 43.0 and 43.8 micron features and the 41.8 micronfeature.

210 F. J. Molster et al.: Crystalline silicate dust around evolved stars. I.
Fig. 17. The 40 micron complex for the disk sources, together with the mean disk spectrum (gray line). The vertical gray linesindicate the mean peak positions of the features found, while their range is indicated by the errorbar on top of the plot. Thethick line in the upper left corner in each panel indicates the mean noise level.
HD 44179: the 40 micron complex of HD 44179 is in-teresting because it shows a prominent 40.5 micron fea-ture, but the 43.0 and 43.8 micron features are much lesspronounced. The steep slope at the red side suggests thatthey are present, but part of the spectrum between the40.5 and 43.0 micron features must have been filled in.This might be due to an exceptionally strong 41.8 micronfeature, but the width and wavelength of this feature asmeasured in the other stars indicate that it is not suffi-cient to solely account for the closing of the gap betweenthe 40.5 and 43.0 micron features.
Roberts 22: the 40 micron complex is dominated bythe 43.0 micron feature, indicating that there is a lot ofcrystalline water ice. In this respect the spectrum lookssomewhat similar to that of HD 161796, although the rel-ative strength of the 40.5 micron feature in Roberts 22 ismuch stronger than in HD 161796.
4.6.2. Outflow sources
Vy 2–2: the low signal to noise ratio in this part ofthe spectrum prevents us from reaching firm conclusionsabout the structure in this complex. It seems that the40.5 micron feature and the 43.0 + 43.8 micron blend canbe distinguished.
HD 161796: the 40 micron complex is completely dom-inated by a very strong 43.0 micron (crystalline water ice)feature. There might be a red-shifted 43.8 micron featurein the strong 43.0 feature, but this is difficult to quantify.Most of the features found in other 40 micron complexesare present in this complex. There is an indication that the40.5 micron feature is in fact a blend of 2 separate bands.Closer inspection of the spectrum suggests that there is abroad band underlying the strong crystalline H2O band.A suitable candidate for this feature might be amorphous
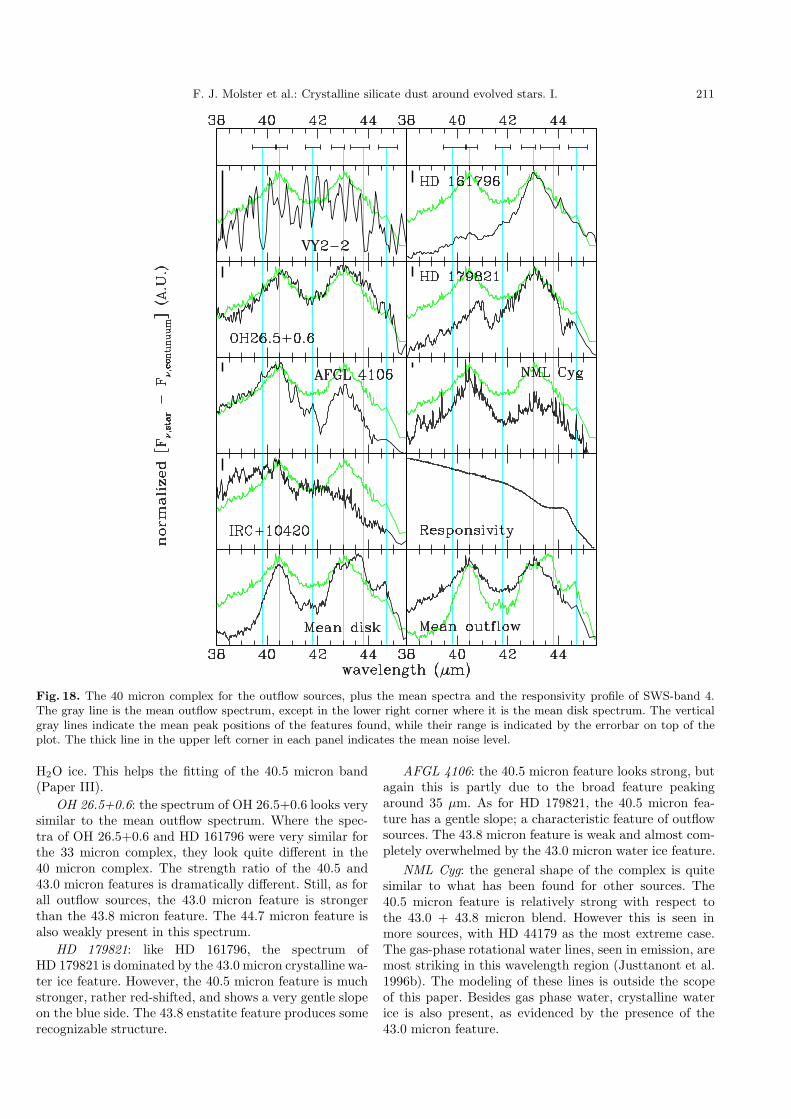
F. J. Molster et al.: Crystalline silicate dust around evolved stars. I. 211
Fig. 18. The 40 micron complex for the outflow sources, plus the mean spectra and the responsivity profile of SWS-band 4.The gray line is the mean outflow spectrum, except in the lower right corner where it is the mean disk spectrum. The verticalgray lines indicate the mean peak positions of the features found, while their range is indicated by the errorbar on top of theplot. The thick line in the upper left corner in each panel indicates the mean noise level.
H2O ice. This helps the fitting of the 40.5 micron band(Paper III).
OH 26.5+0.6: the spectrum of OH 26.5+0.6 looks verysimilar to the mean outflow spectrum. Where the spec-tra of OH 26.5+0.6 and HD 161796 were very similar forthe 33 micron complex, they look quite different in the40 micron complex. The strength ratio of the 40.5 and43.0 micron features is dramatically different. Still, as forall outflow sources, the 43.0 micron feature is strongerthan the 43.8 micron feature. The 44.7 micron feature isalso weakly present in this spectrum.
HD 179821: like HD 161796, the spectrum ofHD 179821 is dominated by the 43.0 micron crystalline wa-ter ice feature. However, the 40.5 micron feature is muchstronger, rather red-shifted, and shows a very gentle slopeon the blue side. The 43.8 enstatite feature produces somerecognizable structure.
AFGL 4106: the 40.5 micron feature looks strong, butagain this is partly due to the broad feature peakingaround 35 µm. As for HD 179821, the 40.5 micron fea-ture has a gentle slope; a characteristic feature of outflowsources. The 43.8 micron feature is weak and almost com-pletely overwhelmed by the 43.0 micron water ice feature.
NML Cyg: the general shape of the complex is quitesimilar to what has been found for other sources. The40.5 micron feature is relatively strong with respect tothe 43.0 + 43.8 micron blend. However this is seen inmore sources, with HD 44179 as the most extreme case.The gas-phase rotational water lines, seen in emission, aremost striking in this wavelength region (Justtanont et al.1996b). The modeling of these lines is outside the scopeof this paper. Besides gas phase water, crystalline waterice is also present, as evidenced by the presence of the43.0 micron feature.

212 F. J. Molster et al.: Crystalline silicate dust around evolved stars. I.
IRC+10420: the 40 micron complex suffers more fromthe noise than the other complexes. Still the main featurescan be distinguished. The 42.8 micron feature is difficultto disentangle, but there seems hardly any 43.6 micronfeature.
4.7. The 60 micron complex
The 60 micron complexes of the disk sources and the out-flow sources are plotted in Figs. 19 and 20.
4.7.1. Disk sources
NGC 6537: the 60 micron complex is rather smoothand peaks at about 65 µm. The 69 micron forsterite fea-ture is clearly present. The gentle rise at the blue side ofthis feature indicates that crystalline water ice is present,as was already indicated by the 43.0 micron feature inthe 40 micron complex. Another dust component is neces-sary to explain the peak position and the red side of thisfeature, and diopside might be a good candidate for this(Koike et al. 2000). The forbidden emission lines were re-moved by hand, but in the original spectrum the followinglines were found: [O III] at 51.79 µm, [N III] at 57.31 µmand [O I] at 63.16 µm. It is interesting to note that all linesare blue shifted (in both scan directions). We probably seehere the fast outflow from the star. Based on the shifts,the outflow velocity in our direction is 135 ± 30 km s−1.This is comparable to the velocity found by Cuesta et al.(1995). They came up with a model, based on [N II] pro-files at 6584 A, which predict a velocity of 180±40 km s−1
in the direction of the observer (400 ± 100 km s−1 totaloutflow velocity).
NGC 6302: the 60 micron complex is very similar tothe mean disk spectrum and lines up pretty well with thoseof NGC 6537 and MWC 922. Compared to MWC 922,NGC 6302 shows a little more intensity on the blue side,which probably indicates that there is a larger contribu-tion from crystalline water ice as is expected from the40 micron complex. The 69.0 micron forsterite feature isvery prominent and quite narrow.
MWC 922: the 60 micron complex of MWC 922 peaksat very long wavelengths, implying that crystalline waterice does not play an important role at these wavelengths.This is in contrast with the 40 micron complex, where aband at 43.0 micron has been found. In Paper III we willshow that the 40 micron complex of this source can nicelybe fitted with only enstatite, confirming the absence ofcrystalline water ice.
The 69 micron feature is very prominent and seemsbroadened at its red side, which might be an indicationfor another dust component. The rather sharp 65 micronfeature seems flanked by another feature at 66.5 µm.
HD 44179: the 60 micron complex is rather flat anddoes not show much structure, apart from the prominent69 micron feature and the [O I] line at 63.18 µm. Becauseof this broad flat complex it is likely that there is only
a small amount of crystalline water ice together with anextra dust component radiating at these wavelengths.
Roberts 22: while most disk sources do peak at a wave-length around 65 µm, Roberts 22 seems to peak around60 µm. This is very much alike to the outflow sources andHD 161796 in particular. The 63.18 µm [O I] line is alsovisible. In correspondence with the outflow sources, thereis hardly any 69 micron feature.
4.7.2. Outflow sources
Vy 2–2: the 60 micron complex is typical of an outflowspectrum. It peaks around 60–62 µm and the 69 micronfeature is absent.
HD 161796: the 60 micron spectrum is characterizedby the crystalline water ice structure. It peaks at ≈60 µm,which is much bluer than the disk sources, but in betteragreement with the expectation that there is crystallinewater ice around this star. There is a hint of a 69 mi-cron feature. We have measured it, but better data seemnecessary for this feature.
OH 26.5+0.6: the 60 micron complex has 2 peaks, oneat about 60 µm, probably due to crystalline water ice, andone at 65 µm, more like MWC 922. The 69 micron featureis clearly present, which is somewhat unexpected for anoutflow source.
HD 179821: the 60 micron complex peaks at ratherblue wavelengths, indicating the presence of a lot of crys-talline water ice; as was already concluded from the 40 mi-cron complex.
AFGL 4106: the 60 micron complex peaks around60 micron. This is typical for sources which are dominatedby crystalline water ice, and in agreement with the 40 mi-cron complex spectrum.
NML Cyg: the 60 micron feature is very similar to themean outflow spectrum, indicating that most of this fea-ture is formed by emission from crystalline water ice.
IRC+10420: the 60 micron complex peaks at veryshort wavelength, indicating that there is crystalline waterice and a relatively low abundance of crystalline silicates,as was also found in the other complexes.
4.8. Remaining bands
We chose not to show the individual remaining bands ofour programme stars. However, in Paper II we show theaverage band profiles of the disk and outflow sources ofthe most prominent remaining bands, near 14, 21, 26, 48and 90 µm.
4.8.1. Disk sources
IRAS 09425–6040: the (instrumental) features around14 µm are weak or absent in IRAS 09425–6040. The 20.7and 21.5 micron features are clearly distinguishable in thespectrum. The 26.1 micron feature is also rather promi-nent. We unfortunately have no data for features at wave-lengths longer than 45 µm.

F. J. Molster et al.: Crystalline silicate dust around evolved stars. I. 213
Fig. 19. The 60 micron complex for the disk sources, together with the mean disk spectrum (gray line). The vertical gray linesindicate the mean peak positions of the features found, while their range is indicated by the errorbar on top of the plot. Thethick line in the upper left corner in each panel indicates the mean noise level.
NGC 6537: as in IRAS 09425–6040, the (instrumental)features around 14 µm are weak or absent in NGC 6537.The 20.7 and 21.5 micron feature are present. The 26.1 mi-cron feature is one of the reddest in our sample. The 47.7and 48.6 micron features are separately identified. Finallythere is clear evidence for the presence of a 91 micronfeature, with the [O III] line at 88.35 µm.
NGC 6302: NGC 6302 has very nice 20.7 and 21.5 mi-cron features. The 26.1 micron feature is obscured by thepresence of a strong emission line ([O IV]) and its pres-ence cannot be confirmed at the moment. The 48 micronfeatures is split up into its separate components, i.e. the47.7 and 48.6 micron features. The 91 micron feature ispresent and even rather prominent.
MWC 922: the 3 (instrumental) features around 14 mi-cron are all detected in this source. The 20.7 and21.5 micron are clearly present and are only slightly less
prominent than in IRAS 09425–6040. The 26.1 micron fea-ture is also rather prominently present.
AC Her: the 20.5 and 21.5 features are more blendedthan in other stars and the final result looks somewhatsimilar to the responsivity profile. This might point to aproblem in the dark-current subtraction. However, thereare some remarkable differences between the data and theresponsivity at the edges of this structure and also thesame kind of profile is found in the rev106 data. Therefore,we believe it is real.
HD 45677: the 3 features around 14 µm, the 13.5, 13.8and 14.2 micron features, are clearly present in the spec-trum. The 20.7 and 21.5 micron feature are rather promi-nent and almost as strong as the 23 micron complex.
89 Her: the (instrumental) features around 14 µm areall present, but the 20.7, 21.5 and 26.1 micron features arenot detected.

214 F. J. Molster et al.: Crystalline silicate dust around evolved stars. I.
Fig. 20. The 60 micron complex for the outflow sources, plus the mean spectra and the responsivity profiles of LWS band 1(solid line), band 2 (dashed line), band 3 (solid line) and band 4 (dashed line). The gray line is the mean outflow spectrum,except in the lower right corner where it is the mean disk spectrum. The vertical gray lines indicate the mean peak positions ofthe features found, while their range is indicated by the errorbar on top of the plot. The thick line in the upper left corner ineach panel indicates the mean noise level.
MWC 300: the (responsivity) features around 14 µmare all present in this source. This is one of the few sourceswhere the 21.5 micron feature is not present, while the20.7 micron feature is rather prominent. This is evidencethat these two features are (at least partially) caused bydifferent dust species. The 26.1 micron feature is presentand rather prominent.
HD 44179: the 13.5 and 14.2 micron features are found,but might be due to carbon rich material that also peaks atthese wavelengths (Hony et al. 2000). There is no indica-tion of a 13.8 micron feature. There is a weak 26.1 micronfeature present. In the LWS regime a 48 micron featureis found, but it could not be resolved into the two sepa-rate components. No 91 micron feature could be detectedbecause the spectrum was unreliable at these wavelengths.
Roberts 22: interestingly the 14.2 feature seems presentbut without the 13.6 feature. The 26.1 micron featureseems absent and there is also no indication for featuresaround 48 µm. The presence of the other feature are uncer-tain and will be discussed in the Appendix. There is someuncertainty over the presence of a 91 micron feature.
4.8.2. Outflow sources
Vy 2–2: the features around 14 µm and the 26.1 mi-cron feature are not detected. Whether this is due to thenoise level or that they really are absent is difficult to say.A comparison with other stars suggests the first possibil-ity. While the 20.7 and 21.5 micron features are some-what uncertain, they fit the average profile quite well.
F. J. Molster et al.: Crystalline silicate dust around evolved stars. I. 215
Nevertheless, the noise around these wavelengths makesthem suspect.
HD 161796: the 21.5 micron feature is affected by thedifferences seen in the up and down scan. Comparison withthe rev071 and other data suggests that the 21.5 micronfeature is probably real, while other features in this wave-length region are probably not. The two features around48 micron are found as a blend.
OH 26.5+0.6: although all features are in absorption,the 3 features around 14 µm appear in emission. Thisstrengthens our suspicion that these features are instru-mental. The 20.7 micron feature is thought to be in ab-sorption, although it is rather blue-shifted with respect tothe emission spectra from other sources. The 26.1 micronfeature might have some self-absorption.
HD 179821: there are indications of a broad featurearound 13 micron, which is also seen in HD 161796 andAFGL 4106. However, it is more likely that it is just con-tinuum and that the 18 micron amorphous silicate featurealready starts around 14.5 µm. The 14 micron (responsiv-ity) features were not found in this source. A 20.7 micronfeature has been found, without a 21.5 micron feature.Also the 26.1 micron feature has been found. The 2 fea-tures around 48 µm were nicely split and therefore mea-sured separately.
AFGL 4106: there is a broad feature around 13 µmwhich is also seen in HD 161796 and HD 179821. It isthought to be just continuum and probably induced by anearly onset of the 18 micron amorphous silicate feature.On top of this broad structure, we see the (instrumental)features around 14 µm. The 20.7 and 21.5 micron fea-tures are found as well as the 26.1 micron feature, whichis rather broad. We also detect the 48 micron blend.
NML Cyg: the 13.6 and 14.2 micron features areblended with absorption features from HCN at 14.02 µmand an unknown broad absorption at 13.25 µm. These fea-tures are seen in all datasets. The 20.7 and 21.5 micronfeatures were detected. The 48 micron blend has also beendetected (and measured).
IRC+1042: the features around 14 µm are all found.The 20.7 and 21.5 micron feature are also present, al-though the first one is the broadest one found in our sam-ple. The 26.1 micron feature is weak but present. The47.7 and 48.6 micron feature are also found, with the lastone, in contrast to what has been found for other silicatefeatures in this star, the most red-shifted found in oursample.
5. Discussion and conclusions
We have made an extensive study of the infrared spec-tra of O-rich environments of evolved stars. The spectrashow a remarkably rich variety of features, most of whichnever seen before. We have defined seven complexes at 10,18, 23, 28, 33, 40 and 60 µm. Each of these complexesis a convolution of several contributions, which vary in-dependently, giving each spectrum a unique appearance.We have derived average shapes for the complexes. The
large sample enabled us also to identify weak structures.We have quantified the properties of the complexes and ofthe components that make up these complexes in termsof peak position, band strength and band width. We findthat the band strength correlates with the geometry ofthe circumstellar environment, and have accordingly con-ducted a systematic separate inventory of the bands andcomplexes for disk sources and outflow sources. We havepresented a detailed description of the shapes of the bandsand complexes of the individual stars, and how the spec-tra of individual objects differ from the average complexshapes. In Paper II, we will discuss, compare and identifythe average complexes.
The richness of the spectra undoubtedly contains im-portant information related to the conditions in which thegrains were formed and their thermal history. The crys-talline nature of the carriers of most of the narrow bands(see also Papers II and III) allows a detailed chemicalanalysis of these components, in a way which is unprece-dented. In this way, it may become possible to trace theevolution and processing of grains from their place of birth(in the outflows of evolved stars), through the interstel-lar medium, into star forming regions and proto-planetarydisks. For instance, Molster et al. (1999a) suggested thatin the disk sources low temperature crystallization takesplace. The crystallization of the silicates in outflow sourcesis likely to have taken place close to the star, i.e. high tem-perature crystallization. Therefore the difference found inthe spectra and thus dust properties might have to do withthe main crystallization process in these sources.
The data set presented in this study will serve as astarting point for more detailed investigations relating tothe identification of the carriers of the bands, and forcorrelation studies. These will be presented in Papers IIand III. In Paper II we will discuss the average complexesand will identify the carriers of the bands using laboratoryspectra of a variety of plausible components. In Paper IIIwe will study the correlations between the wavelengthsand strengths of the bands, and derive fits to the bandsusing simple radiative transfer and laboratory spectra.
Acknowledgements. FJM wants to acknowledge the supportfrom NWO under grant 781-71-052 and under the Talent fel-lowship programm. LBFMW acknowledges financial supportfrom an NWO “Pionier” grant.
Appendix: Notes on individual stars
IRAS 09425–6040
We have 2 SWS AOT01 observations for this star, andunfortunately no LWS data. We have slightly tilted band2A so that the different subbands were nicely connectedwith each other.
There is C2H2 absorption at 7.8 µm, also HCN ab-sorbs around these wavelengths. The change in slopearound 10.64 µm suggests the presence of a 10.7 mi-cron feature. However, no other features are found, which

216 F. J. Molster et al.: Crystalline silicate dust around evolved stars. I.
makes it somewhat doubtful. The 11.3 SiC feature pre-vents the detection of the 11.4 micron feature associatedwith forsterite. But, because of the absence of structureat shorter wavelengths, it is likely not present.
Because of the noise level, the 15.3, 15.9 and 16.2 mi-cron features are measured as one, but they seem allpresent in this star. There are indications in the spectrumthat there is a 17.5 micron feature, but this feature has notbeen measured separately. There might be an underlyingamorphous silicate feature, but it has not been measured.The 24.0, 28.8 and 34.1 micron features might be presentbut have not been measured separately. There is a hintof the 31.2 micron feature in the rev084 data. However,this cannot be confirmed on the basis of the rev254 databecause of the noise level in this area.
NGC 6537 = HD 312582 = Hen 2−340 =IRAS 18021−1950
For NGC 6537 we have 2 SWS and 2 LWS spectra.Unfortunately, the second SWS spectrum was mispointedand could hardly be used, even to check uncertain featuresin an independent dataset.
The origin of the sharp feature at 18.88 µm is un-known. A rise in the spectrum is found in both the upand the down scan. A similar feature is seen in AC Her,but only in one of the two datasets. No other stars showthis feature, including NGC 6302, which is almost a twinto this source. Therefore, we still have some doubts aboutthis feature. Independent of the status of this feature, itinfluenced our measurement of the broad 18.9 micron fea-ture underneath. The 24.5 micron feature is severely influ-enced by the [Ne V] emission line. The 27.6 and 28.2 mi-cron features are measured as one.
NGC 6302 = Butterfly Nebula = HD 155520 =Hen 2−204 = IRAS 17103−3702 =CD−36◦11341
Since NGC 6302 was one of the calibration sources, a lotof data was available. We had an AOT01 and a com-plete wavelength coverage in AOT06, together with 7 LWSdatasets. The SWS pointings were slightly offset from thecentre. Therefore, we multiplied the whole SWS spectrumto fit the LWS spectrum. The final spectrum is in agree-ment with the IRAS broad band fluxes.
The 13.6 and 14.2 micron features seem to be presentin the AOT01 dataset, while in the AOT06 dataset onlythe 14.2 seem to be present. However, strong atomic linesat these wavelengths make a clear detection of these fea-tures impossible. The spectrum of NGC 6302 shows fea-tures at 15.3 and 15.8 µm. However, the strong [Ne III] linein between these features influences them. The differencein the up and down scans also made this a problematicarea. The feature at 16.3 µm feature is only seen in band3C of the AOT01 speed 4 dataset, and not in band 3A ofthe same dataset. These last 3 features are also not visi-ble in the AOT06 spectrum, therefore we decided not to
include them. The sharp feature at 19.1 µm is found inboth the up and down scans. Also the AOT06 spectrumshows evidence for a narrow feature at that wavelength.The source of this feature is unknown. It seems too narrowfor a dust feature. We cannot exclude a forbidden emis-sion line, although it is quite broad with respect to theother lines in this wavelength region and we don’t have aclear identification yet. The 24.5 micron feature is difficultto measure since there is another [Ne V] line close to it.Also for the 26.1 micron feature we face the problem ofa rather strong line on top of it ([O IV]), which preventsus from getting a reasonable estimate for this feature. Ifthe 40.5 micron feature is a blend of 2 features, as is sug-gested in Paper II, these two features nicely blend into onestructure peaking at 40.5 µm.
MWC 922 = Hen 3−1680 = AFGL 2132 =IRAS 18184−1302
The SWS spectrum of MWC 922 is derived from a com-bination of 2 AOT01 speed 2 observations. Features weretreated as real if they were seen in both observations.
The 9.1 and 9.5 micron absorption features seem toform a blend, this might be caused by a known instru-mental feature at about 9.35 µm. The 9.8 micron featureis very clear and seen in both datasets (up and down scan),the same holds for the 10.6 micron feature. The 11.3 mi-cron feature, if present, is completely overwhelmed by the11.3 micron PAH feature.
As discussed in the text, the 18 micron complex mightsuffer from interstellar absorption. It was impossible todisentangle the circumstellar amorphous silicate featurefrom the interstellar absorption and the circumstellar crys-talline silicate emission and therefore it has not been mea-sured. The (interstellar) absorption by amorphous silicatesprevents us from measuring the features around 16 µm.Based on a comparison with other stars, these featuresseem to be present, but there remains uncertainty abouttheir strength and FWHM. The 18.0, 18.9 and 19.5 micronfeatures are clearly present. The small structure (3 fea-tures) on top of the 18.1 micron feature is located at thesame position as in HD 44179. The presence of a weakfeature at 17.43 µm is uncertain, since the two datasetsdo not fully agree around this wavelength. The feature at33.5 µm is the [S III] line. No separate 36.0 micron featurecan be distinguished in the plateau. The 47.7 and 48.6 mi-cron features were difficult to disentangle and thereforemeasured as one. The [O I] line is visible at 63.18 µm.There is a small extension at the long wavelength sideof the 69.0 micron feature. It might be caused by an un-known dust component, or by a population of relativelywarm forsterite grains, which will emit at a slightly longerwavelength (Bowey et al. 2000).
AC Her = HD 170756 = SAO 86134 =IRAS 18281 + 2149
For AC Her, we have two SWS and one LWS datasets. Nospecial treatments were necessary during data reduction.

F. J. Molster et al.: Crystalline silicate dust around evolved stars. I. 217
The feature at 18.85 micron is only seen in the rev520dataset and not in the rev106 data. Although a similarfeature has been found in NGC 6537, it makes this fea-ture questionable. There is a hint in the spectrum of the22.4 micron feature and we have measured it, but thereader should be aware of the noise level in this part ofthe spectrum. The strong feature at 22.69 µm looks ratherprominent and seems also to be present in HD 44179,where this feature is seen in both the AOT01 as well asthe AOT06 data. However, there is no indication of thisfeature in the rev106 spectrum of AC Her. It should benoted that the responsivity drops around that wavelength.It is clear that this feature should be treated with caution.The reality of the sharp peak around 31.0 µm is question-able. This noise peak sits probably on top of a genuine31.2 micron feature, which seems also present in the rev106spectrum. The shape of the underlying 31.2 micron fea-ture corresponds rather well with the mean shape of the31.2 micron feature. The prominent feature at 32.61 µm ispresent in both the up and down scans of rev520 (althoughmuch more prominent in the up scan). However, nothing isseen in the rev106 dataset and we have some doubt aboutits reality. Nevertheless, it should be noted that its wave-length position is not atypical for a 32.8 micron feature.The 33.7 and 34.1 micron features are measured together.In the rev520 dataset, there is an indication of the presenceof a 35.9 micron feature and the absence of the 34.9 micronfeature. However, it seems vice versa for the rev106 data,where a 34.9 micron feature seems present but hardly any-thing at 35.9 µm. It is clear that the noise level in bothdatasets play tricks on us here. We interpret this as evi-dence for the presence of the 35 micron plateau althoughit is not clear where this plateau ends.
HD 45677 = FS CMa = MWC 142 =SAO 151534 = AFGL 5195 =IRAS 06259−1301
For HD 45677 we only had one SWS dataset and unfortu-nately no LWS data. Band 2B has been rotated to let allthe bands nicely match.
In general, the features of HD 45677 are rather sharpcompared to the other stars. The 34.1 and 34.9 micronfeatures are both present but blend in this object and aretherefore measured as one. The same applies for the 35.9and 36.5 micron features. The sharp line at 34.81 µm isdue to [Si II].
89 Her = V441 Her = BD + 26◦3120 =HD 163506 = IRAS 17534 + 2603 =AFGL 2028 = SAO 85545
For 89 Her, we also have redundancy in the SWS domainwith two datasets. For the LWS wavelength range, we haveonly one dataset. To match the different bands with eachother, we are forced to slightly tilt band 2B.
There is uncertainty about the 15.2 micron feature.The structure seen at these wavelengths seems real, be-cause it is found in both the rev082 and the rev518 data.However, it is rather blue-shifted and also very broad.Therefore, the question arises whether the feature foundat 15.0 µm in this object is the same as the 15.2 micronfeature.
We have fitted the smooth 23 micron complex with3 features but these were not well constrained. Thereforecaution should be taken in interpreting the results of thiscomplex, even though the errors might look small.
The 31.2 micron feature is not detected. The structurethat is seen around this wavelength is noise.
MWC 300 = V431 Sct = AFGL 2170 =IRAS 18267−0606
For MWC 300 we unfortunately have only one SWS spec-trum and no long wavelength data. The substructurefound in the 10 micron complex, which might be at-tributed to crystalline silicates, is always seen in only onescan and we therefore do not trust its appearance. We havetherefore not measured them. There might be structurearound 16 µm, but this is severely blended by interstellarsilicate absorption and has therefore not been measured.The amorphous silicate feature detected at 17.03 µm isprobably due to interstellar absorption and not a cir-cumstellar amorphous silicate emission feature, which hastherefore not been measured. The up and down scans dif-fer for the sharp peak at 28.68 µm; in one it is present,but in the other it is not. But the drop around 28.9 µm isseen in both the up and down scan, confirming the pres-ence of the 28.8 micron feature. There is an indication ofthe 32.2 micron feature but at a very low level. Thereforeit has not been measured. The up and down scans do notcorrespond at 42.5 micron. Therefore, we have removedthis feature before measuring the 40 micron complex. Theshallow slope of the blue side of the 40.5 micron featuresuggests the presence of a 39.8 micron feature. The pres-ence of the 44.7 micron feature can neither be proven norrejected.
HD 44179 = Red Rectangle = BD−10◦1476 =IRAS 06176−1036 = AFGL 915 = SAO 151362
For this source we have an AOT01 spectrum and someparts done with a higher resolution (AOT06). Also anLWS spectrum is available.
The feature at 17.07 µm is likely to be a blend ofthe 16.7 and 17.0 micron features. The reality of the20.7 micron feature is uncertain since it is very broadin the AOT01 spectrum (although seen in both the upand down scans), but nothing is seen in the AOT06 spec-trum. Therefore, caution should be taken in interpretingthis feature in this star. The structure around 23.2 µm isnot found in all datasets and differs between the up andthe down scans. Therefore, we masked this part before

218 F. J. Molster et al.: Crystalline silicate dust around evolved stars. I.
measuring the complex. Comparing the 28 micron com-plex with 89 Her suggests that the 26.8 micron feature isalso present on the blue side of the 27.6 micron feature.
Roberts 22 = Hen 3−404 = Wray 15−549 =AFGL 4104 = OH284.18−0.79 =IRAS 10197−5750
When ISO observed Roberts 22 with the SWS it was off-set, and a lot of flux was missed. Increasing apertures gavealso flux jumps between the different subbands. In total,we have 2 SWS and 1 LWS spectrum for this source.
We have measured the 18 micron amorphous silicateband. However, it is likely that the 18.0, 18.9 and 19.5 mi-cron features are present and are therefore included in thismeasurement, but the noise level prevents firm conclusionsabout their presence. The 15.9 and 16.2 micron featuresare measured together. The 23 micron complex has beenmeasured as one feature, since it was too noisy to separatethe different features. The 28 micron complex suffers fromflux jumps between the different bands. Therefore, there issome uncertainty about the continuum in band 3E. Still,we were able to measure the features in this band since weused a local continuum for these measurements. Howevertheir relative strength is questionable. All 3 features foundin band 3E were seen in both the rev084 as well as therev254 datasets. Before measuring the 33 micron com-plex, we masked the narrow (0.1 µm) peak at 33.3 µm,since it was only found in one scan direction and not inthe rev084 data. The 35.9 + 36.5 micron features weremeasured as one, alike to the 39.8 + 40.5 micron features.The 20.7 and 21.5 micron features are found in rev254,where their shape resembles the average shape of thesefeatures quite well. However, because nothing is found inthe rev084 dataset, and because of the low S/N in thispart of the spectrum, these features are suspect. There issome concern about the data beyond 80 µm. Therefore,the detection of the 90 micron feature in Roberts 22 isuncertain.
Vy 2−2 = IRAS 19219+0947
Vy 2–2 is the other source on which ISO was not centeredcorrectly. This resulted in flux jumps and intensity losses.We had one SWS and one LWS spectrum. The whole SWSspectrum suffered from the mispointing of the satellite.This reduced the flux level and therefore the signal tonoise ratio.
The reality of the feature at 11.6 µm is severelydoubted, since the up and down scans do not agree witheach other. It is therefore a good indicator of the noise-level in that part of the spectrum. The amorphous silicatefeatures, clearly present in the 10 micron complex, couldnot be detected at the 18 micron complex, likely due tothe noise level.
The feature at 25.1 µm is too broad to be a forbiddenemission line. However it also seems narrower than the
normal 25.0 micron feature. The noise in this part of thespectrum is quite severe, therefore we have some doubtsabout this feature. If other data confirm this to be the25.0 micron feature, it would be the strongest 25.0 micronfeature in the sample. The overall intensity from 24.2 to25.2 µm suggests that the plateau is present and this hasbeen measured (excluding the uncertain strong peak at25.1 µm).
There were a lot of spurious features in band 4, whichwere removed by hand during the data reduction. Thereare hints in both the up and down scans for the differentfeatures in the 35 micron plateau, therefore we have mea-sured them. However, the signal to noise ratio in this re-gion makes these features somewhat uncertain and there-fore no firm conclusions should be drawn based on thesefeatures alone. Also the 40 micron complex suffers fromthe high noise level. The features seen in the spectrumprovided by the ISO-data archive in Vilspa are probablydue to glitches and glitch tails, which were found in thispart of the spectrum. We have removed these spuriouspoints by hand. We have tried to split the 40 micron com-plex into a 40.5 micron feature and a 43.0 + 43.8 micronblend and measured the result.
HD 161796 = V814 Her = BD + 50◦2457 =IRAS 17436 + 5003 = AFGL 5384 =SAO 30548
We got a nice dataset for HD 161796, including an AOT06observation of band 4. In the final spectrum we attachedthis AOT06 spectrum between 29.03 and 43.17 µm.
A broad feature around 13 micron may be present,which is also seen in AFGL 4106 and HD 179821, howeverin the latter spectra it resembles continuum with an earlyrise of the 18 micron silicate feature, starting at about14.5 µm. The 18 micron complex is located on the slopeof a steep spectrum and there is some uncertainty aboutthe strength of the 18 micron feature. The up and downscans do not completely agree around this feature. Stillthe peak position and FWHM agree very well with the fea-ture seen in the mean outflow spectrum. So we concludethat it is likely that there is a feature at this wavelength,but its strength is somewhat controversial. Because of thepresence of the crystalline silicate features, it is more diffi-cult to measure the amorphous silicates. This dust featurealso hampers from our method of measurement. We fittedGaussians while this feature is not a Gaussian. The smallfeature which is seen at 17.5 µm is noise. The shape of the20.5 micron feature is similar to the shape in the meanspectrum, however its strength is similar to the featuresat 22.0 and 22.4 µm, for which the up and down scansdiffer significantly. Therefore, the detection of the 20.5 mi-cron feature is only marginal. Because of the reasonableuncertainty about the 22.4 micron feature, it has not beenmeasured. The 28.8 micron feature might be present butone should take into account that we only measured it af-ter masking the spurious feature at 29.2 µm. It should

F. J. Molster et al.: Crystalline silicate dust around evolved stars. I. 219
be noted that the 30.6 micron feature is found in theAOT06 data and in the rev342 data but nothing is seenin the rev071 dataset. The spectrum between 29.03 and43.17 µm is from the AOT06 observation. The 35.9 and36.5 micron features have been measured as a blend. The35.1 micron feature is probably somewhat underestimatedand blue-shifted. The status of the feature at 44.09 µm isnot completely sorted out. It is seen in all data sets, butthe up and down scans do often differ at this point. Fornow, we assume that it is the result of a blend of the 43.8and the 44.7 micron features.
OH 26.5 + 0.6 = V347 Sct =IRAS 18348−0526 = AFGL 2205
For OH 26.5+0.6 we got 2 LWS and one SWS dataset.Up to 28 µm all features are in absorption. The amor-
phous 10 micron feature suffers from a high degree of ab-sorption and no Gaussian profile is fitted to it, the centre ofthe absorption is at 9.9± 0.1 µm. The substructure in the10 micron absorption band might be real, it is seen in boththe up and down scans, but the positions do not matchwith other sources in our sample. The 23.0 and 23.7 micronfeatures are measured as a blend. It is not completely clearwhether the 27.6 and 28.2 micron features are present ornot. They are located at the border where the spectrumgoes from absorption to emission. It seems that there issome excess emission at these wavelengths, but no clearpeak has been seen. This suggest that they suffer from selfabsorption, which makes it impossible to measure themwith Gaussians. So we have not measured these features,although they seem to be present. The 33 micron complexwithout the plateau has been measured as one feature,since it was not possible to make sure how to separatethe different features, for which are indications for theirpresence. Although there is an indication of 2 different fea-tures in the 60 micron complex of OH 26.5+0.6 we havemeasured it as one. There seems to be self-absorption inthe 26.1 micron feature, which hampers the measurementsof this feature. The 48 micron blend has again been mea-sured as one due to the noise level in that part of thespectrum.
HD 179821 = V1427 Aql = BD−00◦3679 =IRAS 19114 + 0002 = AFGL 2343 =SAO 124414
Our data products of HD 179821 consist of two SWS andone LWS spectrum.
The 18 micron complex lies on a very steep slope,which makes it difficult to identify and measure the dif-ferent features. The 18 micron amorphous silicate featuremight be about 10% too strong since it has been mea-sured including the crystalline silicate features. The 15.9and 16.2 micron features were measured together, since itappeared very difficult to separate them. The 17.0 micronfeature is very weak, but its width corresponds well with
the mean feature shape. The detection of the 18.9 micronfeature is uncertain, it has therefore been measured to-gether with the 18.0 micron feature. The 24.5 and 25.1 mi-cron features have been measured as one. The 40.5 mi-cron feature shows a relatively shallow slope towards theshorter wavelengths, this is fitted with an extra Gaussian,which is attributed to the 39.8 micron features. This ex-tra Gaussian influences the strength and probably also thederived width of the 40.5 micron feature. The sharp droparound 67 µm might have to do with the border betweentwo different bands in the LWS spectrum. We remind thereader that we have not performed any shift of the sub-bands for this LWS spectrum.
AFGL 4106 = HD 302821 = CPD−58◦2154 =IRAS 10215−5916
There are three SWS datasets for AFGL 4106 and oneLWS dataset. We had to rotate band 3E to match band3D and 4.
The 18 micron amorphous silicate feature might beabout 10%–20% too strong, since it has been measuredincluding the crystalline silicate features. Again somefeatures have been measured as a blend, such as the15.9 + 16.2 micron features, the 16.7 + 17.0 micron fea-tures and the 47.7 + 48.6 micron blend. There are slightindications of a 22.4 micron feature, however we decidednot to measure it because of the noise level, which makesthis feature rather uncertain.
NML Cyg = V1489 Cyg = IRC + 40448 =OH 80.8−1.9 = AFGL 2650
For NML Cyg there was a nice dataset available, with 4SWS, of which one was an AOT06 observation of band 4,and 3 LWS observations. We have included this high reso-lution spectrum in our final spectrum. Band 2A has beentilted to fit the other bands.
The 8.3 micron feature might be present, but is diffi-cult to separate from the amorphous silicate feature whichstill peaks at these wavelengths. The structure around10.07 µm coincides with a feature in the responsivity andis therefore not trusted. The structures around 11.05 µmare due to the apparently not completely correctly re-moved 11.1 micron responsivity feature.
The 13.6 and 14.2 micron features are influenced bymolecular absorption features at 13.25 and 14.02 µm.
We assumed that there was no 13.8 micron featureand that therefore the flux at that wavelength was con-tinuum. The features were measured with respect to thatcontinuum.
The 16.9 and 17.2 micron features are measured asone. If there is a very weak 19.5 micron feature it hasbeen measured together with the 18.9 micron feature. At14.96 µm gas phase CO2 absorption has been detected.

220 F. J. Molster et al.: Crystalline silicate dust around evolved stars. I.
The 18 micron amorphous silicate could not be ex-tracted from the data, it is probably between emission andself absorption. The 24.5 micron feature is rather blue-shifted and strong compared to the other 24.5 micron fea-tures. It gives NML Cyg the broadest appearance for thiscomplex of all sources. We cannot exclude that this featureis not the same as the other 24.5 micron features.
The end of band 3D and the beginning of Band 3E arenot OK due to leakage, therefore no features are measuredin this wavelength range There might be a 39.8 micronfeature present, however this is difficult to measure withso many water lines present in that region. Therefore wemeasured it as one feature, neglecting the presence of thewater lines. This might lead to an overestimation of theflux level of the features.
The 47.7 and 48.6 micron features were measured as ablend.
IRC + 10420 = V1302 Aql =IRAS 19244 + 1115 = AFGL 2390
The last source in our sample is IRC+10420. We gotcomplete spectral coverage in the SWS and LWS wave-length range. Part of the SWS-spectrum was done withan AOT06 which is included in our final spectrum. Theinfrared spectrum of IRC+10420 shows some structure inthe 10 micron complex which lines up quite nicely withcrystalline silicates in other sources. The weak 10.6 mi-cron feature is uncertain, since it is not consistent withthe feature seen in the mean disk spectrum feature. The11.3 micron feature is consistent with a feature seen inAC Her but very weak.
The 16.2 micron feature is somewhat unsure, since itis clearly seen in band 3c (up and down scan), but not inband 3A (neither in the up nor in the down scan). Theamorphous feature has been measured without the crys-talline features and the strength is therefore somewhatoverestimated, however this effect is negligible comparedto the uncertainty in continuum level. The 18.0 + 18.9 mi-cron features are measured as one.
Band 3D was not corrected for leakage problems in thecalibration sources, because the flux level in IRC+10420is so high that it is very likely that also here leakage hasits influence. Band 3E is tilted to fit the AOT06 and LWSon one side and the rest of the data at the other side.The 20.7 micron feature is the broadest one found in oursample, still the data seem valid, since the up and downscans show exactly the same trend.
The up and down scans of the AOT06 spectrum differseverely between 29.3 and 30 µm, probably due to memoryeffects for this high flux source. Therefore we have removedthis part of the spectrum, since also the AOT01 sufferedfrom the same problems in this part of the spectrum.
There is a possibility of a 39.8 micron feature howeverthe different datasets contradict each other around thesewavelengths. Therefore we have measured this feature asa 40.5 micron feature.
References
Ageorges, N., Eckart, A., Monin, J.-L., & Menard, F. 1997,A&A, 326, 632
Alcolea, J., & Bujarrabal 1985, A&A, 303, L21Allen, D. A., Hyland, A. R., & Caswell, J. L. 1980, MNRAS,
192, 505Aller, L. H., Ross, J. E., O’Mara, B. J., & Keyes, C. D. 1981,
MNRAS, 197, 95Arrelano Ferro, A. 1984, PASP, 96, 641Ashley, M. C. B., & Hyland, A. R. 1988, ApJ, 331, 532Bachiller, R., Gomea-Gonzalez, J., Bujarrabal, V., & Martin-
Pintado, J. 1988, A&A, 196, L5Barlow, M. J. 1998, A&SS, 255, 315Beckwith, S. V. W., Sargent, A. I., Chini, R. S., & Guesten,
R. 1990, AJ, 99, 924Beintema, D. A. 1998, A&SS, 255, 507Bowers, P. F. 1984, ApJ, 279, 350Bowers, P. F., Johnston, K. J., & Spencer, J. H. 1983, ApJ,
274, 733Bowey, J. E., Lee, C., Tucker, C., et al. 2000, in Proc. of ISO
beyond the peaks: The 2nd ISO workshop on analyticalspectroscopy, ed. A. Salama, M. F. Kessler, K. Leech, & B.Schulz, ESA-SP, 456, 339
Bujarrabal, V., Alcolea, J., & Planesas, P. 1992, A&A, 257,701
Casassus, S. P., Roche, P. F., & Barlow, M. J. 2000, MNRAS,submitted
Clegg, P. E., Ade, P. A. R., Armand, C., et al. 1996, A&A,315, L38
Cohen, M., Anderson, C. M., Cowley, A., et al. 1975, ApJ, 196,179
Cohen, M., Tielens, A. G. G. M., Bregman, J., et al. 1989, ApJ,341, 246
Cohen, M., Barlow, M. J., Sylvester, R. J., et al. 1999, ApJ,513, L135
Cuesta, L., Phillips, J. P., & Mampaso, A. 1995, A&A, 304,475
Dorschner, J., Begemann, B., Henning, Th., et al. 1995, A&A,300, 503
Fix, J. D., & Cobb, M. L. 1988, ApJ, 329, 290de Graauw, Th., Haser, L. N., Beintema, D. A., et al. 1996,
A&A, 315, L49Hamann, F., & Persson, S. E. 1989, ApJS, 71, 931Hawkins, G. W., Skinner, C. J., Meixner, M. M., et al. 1995,
ApJ, 452, 314Henning, Th., Launhardt, R., Steinacker, J., et al. 1994, A&A,
291, 546Hony, S., Van Kerckhoven, C., Peeters, E., et al. 2000 in Proc.
of ISO beyond the peaks: The 2nd ISO workshop on analyt-ical spectroscopy, ed. A. Salama, M. F. Kessler, K. Leech,& B. Schulz, ESA-SP, 456, 63
Humphreys, R. M., Strecker, D. W., Murdock, T. L., & Low,F. J. 1973, ApJ, 179, L53
Jewell, P. R., Schenewerk, M. S., & Snyder, L. E. 1985, ApJ,295, 183
Jones, T. J., Humphreys, R. M., Gehrz, R. D., et al. 1993, ApJ,411, 323
Jura, M., Balm, S. P., & Kahane, C. 1995, ApJ, 453, 721Jura, M., Turner, J., & Balm, S. P. 1997, ApJ, 474, 741Jura, M., & Turner, J. 1998, Nature, 395, 144 (1998)Jura, M., & Werner, M. W. 1999, ApJ, 525, L113Jura, M., Chen, C., & Werner, M. W. 2000, ApJ, 541, 264
F. J. Molster et al.: Crystalline silicate dust around evolved stars. I. 221
Justtanont, K., Skinner, C. J., & Tielens, A. G. G. M. 1994,ApJ, 435, 852
Justtanont, K., Skinner, C. J., Tielens, A. G. G. M., et al.1996a, ApJ, 456, 337
Justtanont, K., de Jong, T., Helmich, F. P., et al. 1996b, A&A,315, L217
Kastner, J. H., & Weintraub, D. A. 1995, ApJ, 452, 833Kessler, M. F., Steinz, J. A., Anderegg, M. E., et al. 1996,
A&A, 315, L27Knapp, G. R., Phillips, T. G., Leighton, R. B., et al. 1982,
ApJ, 252, 616Koike, C., Tsuchiyama, A., Shibai, H., et al. 2000, A&A, 363,
1115Lamers, H. G. J. L. M., Zickgraf, F.-J., de Winter, D., et al.
1998, A&A, 340, 117Leinert, C., Richichi, A., & Haas, M. 1997, A&A, 318, 472Lester, D. F., & Dinerstein, H. L. 1984, ApJ, 281, L67Lewis, B. M., Terzian, Y., & Eder, J. 1986, ApJ, 302, L23Likkel, L., Forveille, T., Omont, A., & Morris, M. 1991, A&A,
246, 153Luck, R. E., Bond, H. E., & Lambert, D. L. 1990, ApJ, 357,
188Malfait, K. 1999, Ph.D. Thesis, Katholieke Universiteit LeuvenMeaburn, J., & Walsh, J. R. 1980, MNRAS, 191, 5PMeixner, M., Ueta, T., Dayal, A., et al. 1999, ApJS, 122, 221Molster, F. J., Waters, L. B. F. M., de Jong, T., et al. 1997,
in Planetary nebulae, ed. H. J. Habing, & H. J. G. L. M.Lamers (Kluwer, Dordrecht), Proc. IAU 180, 361
Molster, F. J., Yamamura, I., Waters, L. B. F. M., et al. 1999a,Nature, 401, 563
Molster, F. J., Waters, L. B. F. M., Trams, N., et al. 1999b,A&A, 350, 163
Molster, F. J., Yamamura, I., Waters, L. B. F. M., et al. 2001a,A&A, 366, 923
Molster, F. J., Lim, T. L., Sylvester, R. J., et al. 2001b, A&A,372, 165
Molster, F. J., Waters, L. B. F. M., & Tielens, A. G. G. M.2002a, A&A, 382, 222 (Paper II)
Molster, F. J., Waters, L. B. F. M., Tielens, A. G. G. M., et al.2002b, A&A, 382, 241 (Paper III)
Monnier, J. D., Bester, M., Danchi, W. C., et al. 1997, ApJ,481, 420
Morris, M., & Jura, M. 1983, ApJ, 267, 179Nedoluha, G. E., & Bowers, P. F. 1992, ApJ, 392, 249Netzer, N., & Knapp, G. R. 1987, ApJ, 323, 734Osterbart, R., Langer, N., & Weigelt, G. 1997, A&A, 325, 609Oudmaijer, R. D. 1998, A&AS, 129, 541Oudmaijer, R. D., Geballe, T. R., Waters, L. B. F. M., & Sahu,
K. C. 1994, A&A, 281, L33Payne, H. E., Phillips, J. A., & Terzian, Y. 1988, ApJ, 326,
368Perez, M. R., Grady, C. A., van den Ancker, M. E., et al.
1993, in Frontiers of Space and Ground-Based Astronomy,The Astrophysics of the 21st Century, ed. M. S. Longair,Y. Kondo, & W. Wamstekker (Kluwer, Dordrecht, TheNetherlands), 563
Pirzkal, N., Spillar, E. J., & Dyck, H. M. 1997, ApJ, 481, 392Richards, A. M. S., Yates, J. A., & Cohen, R. J. 1996, MNRAS,
282, 665Roche, P. F., & Aitken, D. K. 1984, MNRAS, 208, 481Roche, P. F., & Aitken, D. K. 1986, MNRAS, 221, 63Roddiern, F., Roddiern, C., Gravesn, J. E., & Northcott, M.
J. 1995, ApJ, 443, 249Rodriguez, L. F., Garcia-Baretto, J. A., Canto, J., et al. 1985,
MNRAS, 215, 353Sahai, R., & Trauger, J. T. 1998, AJ, 116, 1357Sahai, R., Zijlstra, A., Bujarrabal, V., & te Lintel Hekkert, P.
1999, AJ, 117, 1408Sandford, S. A., Pendleton, Y. J., & Allamandola, L. J. 1995,
ApJ, 440, 697Schaeidt, S. G., Morris, P. W., Salama, A., et al. 1996, A&A,
315, L55Schulte-Ladbeck, R. E., Shepherd, D. S., Nordsieck, K. H.,
et al. 1992, ApJ, 401, L105Seaquist, E. R., & Davis, L. E. 1983, ApJ, 274, 659Simon, T., & Dyck, H. M. 1977, AJ, 82, 725Skinner, C. J., Meixner, M. M., Hawkins, G. W., et al. 1994,
ApJ, 423, L135Skinner, S. L., Brown, A., & Stewart, R. T. 1993, ApJS, 87,
217Swinyard, B. M., Clegg, P. E., Ade, P. A. R., et al. 1996, A&A,
315, L43Sylvester, R. J., Barlow, M. J., Liu, X. W., et al. 1997, MNRAS,
291, L42Sylvester, R. J., Kemper, F., Barlow, M. J., et al. 1999, A&A,
352, 587The, P. S., de Winter, D., & Perez, M. R. 1994, A&AS, 104,
315Valentijn, E. A., Feuchtgruber, H., Kester, D. J. M., et al. 1996,
A&A, 315, L60Van Kerckhoven, C., Hony, S., Peeters, E., et al. 2000, A&A,
357, 1013Van Winckel, H., Waelkens, C., Waters, L. B. F. M., et al.
1998, A&A, 336, L17van der Veen, W. E. C. J., Waters, L. B. F. M., Trams, N. R.,
& Matthews, H. E. 1994, A&A, 285, 551Voors, R. H. M. 1999, Ph.D. Thesis, University of UtrechtWaelkens, C., Van Winckel, H., Waters, L. B. F. M., & Bakker,
E. J. 1996, A&A, 314, L17Waters, L. B. F. M., Waelkens, C., Mayor, M., & Trams, N. R.
1993, A&A, 269, 242Waters, L. B. F. M., Molster, F. J., de Jong, T., et al. 1996,
A&A, 315, L361Waters, L. B. F. M., Waelkens, C., Van Winckel, H., et al.
1998, Nature, 391, 868Winckler, H., & Wolf, B. 1989, A&A, 219, 151de Winter, D., & van den Ancker, M. E. 1997, A&AS, 121, 275Wolf, B., & Stahl, O. 1985, A&A, 148, 412Zsoldos, E. 1993, A&A, 268, 149Zuckermann, B., & Dyck, H. M. 1986, ApJ, 311, 345