Embed Size (px)
Citation preview

UW-Parkside
Campus Climate Assessment
Results of Report
May 5, 2010
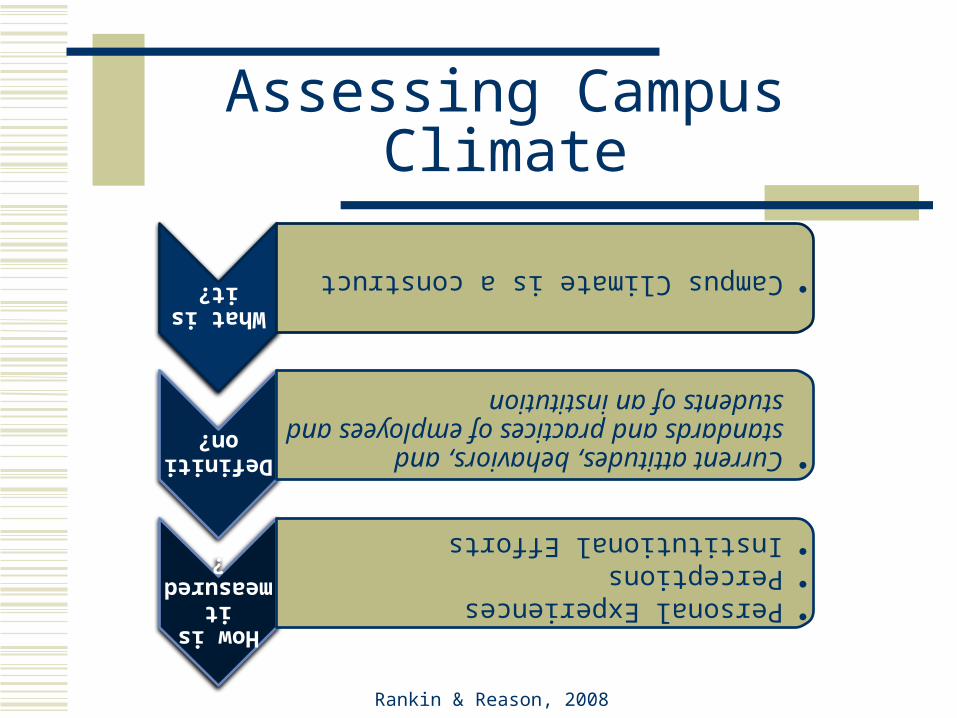
Assessing Campus Climate
Rankin & Reason, 2008
What is it?
•Campus Climate is a construct
Definition?
•Current attitudes, behaviors, and standards and practices of employees and students of an institution
How is it measured?
•Personal Experiences
•Perceptions
•Institutional Efforts
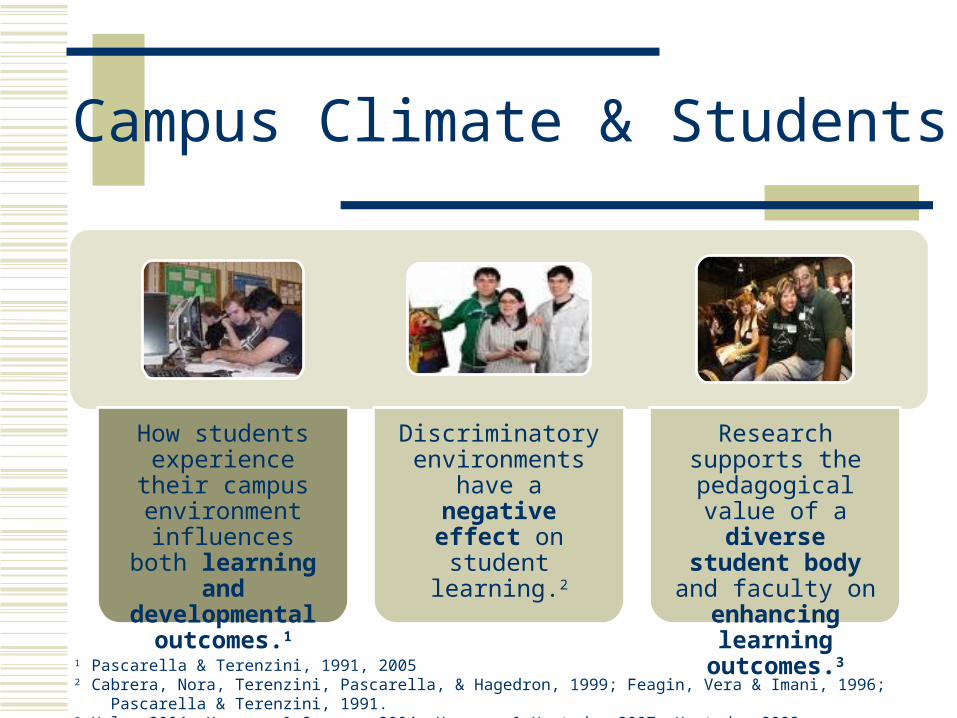
Campus Climate & Students
How students experience their
campus environment influences both learning and
developmental outcomes.1
Discriminatory environments have a negative effect on student learning.2
Research supports the pedagogical value of a diverse student body
and faculty on enhancing learning
outcomes.3
1 Pascarella & Terenzini, 1991, 20052 Cabrera, Nora, Terenzini, Pascarella, & Hagedron, 1999; Feagin, Vera & Imani, 1996; Pascarella & Terenzini, 1991. 3 Hale, 2004; Harper & Quaye , 2004; Harper, & Hurtado, 2007; Hurtado, 2003.

The Climate Project & Inclusive Excellence
The Climate Study is foundational to Inclusive Excellence in that it is the first time in the UW System that we are collecting data on multiple and intersectional identities based on experiences and perceptions of campus life by all members of the community.
It is a population study that encouraged every campus community member to provide input on the campus climate.
The input, data, and final results will be used in tandem with other data as a starting point to build an action plan that speaks to Inclusive Excellence.

Process to Date Participating Institutions
Spring 2008UW Colleges
UW-La Crosse
UW-Milwaukee
UW-Oshkosh
UW-Stevens Point
Fall 2009UW-Eau Claire
UW- Parkside
UW-River Falls
UW-Whitewater

Results
Response Rates

Who are the respondents?
1,652 people responded to the call to participate (28% response rate overall).
Several respondents contributed remarks to the open-ended questions.

Who are the respondents?
77%
•Students
13%
•Staff
8%
•Faculty

Faculty Response Rates
Instructional Academic Staff (56%, n = 31)
Assistant Professor (66%, n = 23)
Adjunct Faculty (17%, n = 17)
Associate Professor (67%, n = 37)
Professor (79%, n = 23)

Faculty Response Rates by Selected Demographics
Faculty of Color
67% (n = 36)
White Faculty
40% (n = 87)
By RaceWomen Faculty
53% (n = 68)
Men faculty
43% (n = 63)
By Gender

Staff Response Rates
Administrators (n = 18)
Limited Term Employee (17%, n = 15)
Classified Staff Non-Exempt (48%, n = 74)
Classified Staff Exempt (100%, n = 33)
Non-Instructional Academic Staff (50%, n = 61)
Limited Academic Staff (24%, n = 6)

Staff Response Rates by Selected Demographics
Staff of Color
49% (n = 37)
White Staff
30% (n = 169)
By RaceWomen Staff
55% (n =131)
Men Staff
42% (n = 75)
By Gender

Student Response Rates
Associate Degree (n = 61)
Non-Degree Seeking (n = 42)
Transfer (n = 141)
Dual Enrollment (n = 1)
Bachelor Degree Student (20%, n = 966)
Professional Degree (n = 22)
Master Degree Student (33%, n = 40)

Student Response Rates by Selected Demographics
Students of Color
28% (n = 337)
White Students
24% (n = 908)
By RaceWomen Students
28% (n = 797)
Men Students 20% (n = 462)
By Gender

Results
Demographic Characteristics

Student Respondents by Class Standing (n)
Students
269 244296
232176
17 1 5
First year 2nd yr
3rd yr 4th yr
5th yr or more Master's degree
Doctoral degree Professional degree

Student Residence
22% of student respondents
lived in residence halls
30% of student respondents lived in off-
campus apartment or
house
35% of student respondents lived in with
parent(s)/ family/ relatives

Income by Student Status (n)
Below $29,999K
$30K - $59,999
$60K - $99,999
$100K-$149K
$150K or above
120
170 160
7432
294
10258
223
27 10 14 5 2
Undergraduate Dependent
Undergraduate Independent
Graduate students

Employee Respondents by Position Status (n)
Series1
17
3123
37
2315
74
33
61
6
18
39
Adjunt professorInstructional academic staffAssistant professorAssociate professorProfessorLimited term employeeClassified staff non-exemptClassified staff exemptNon-instructional academic staffLimited academic staffAdministratorOther

Collapsed Employee Status (n)
Series1
131
100 107
FacultyAcademic StaffClassified Staff

Respondents by Gender and Position Status (n)
There were 4 respondents who identified as transgender
Women Men
757
439
40 2368 6360 3971 36
Undergraduate Students
Graduate Students
Faculty
Academic Staff
Classified Staff

Respondents by Sexual Orientation and Position Status (n)

Respondents by Racial Identity(Duplicated Total)
25145
1 30 28 5 5
1256
15143
15 43 7 51
African
African American/Black
Alaskan
Asian
Asian American
Southeast Asian
Caribbean/West Indian
Caucasian/White
Indian subcontinent
Latino(a)/Hispanic
Middle Eastern
Native American Indian
Pacific Islander
Other

Respondents by Racial Identity (Unduplicated Total)
Se
164
2073
People of Color White People

Respondents by Spiritual Affiliation (n)
Se
958
233387
52
ChristianOther than ChristianNo AffiliationOther

Respondents with Conditions that Substantially Affect Major Life Activities (n)
23
5057
70 12 0 34 2 4
Physical Disability Learning Disability Psychological Condition
Students
Faculty
Academic Staff
Classified Staff

Citizenship Status by Position
Students Employeesn % n %
US citizen 1192 94.0 298 88.4
US citizen – naturalized 23 1.8 15 4.5
Dual citizenship 6 0.5 * *
Permanent resident (immigrant) 26 2.1 11 3.3
Permanent resident (refugee) * * * *
International (F-1, J-1, or H1-B, or other visa)19 1.5 7 2.1
* Data is missing due to n < 5

Findings

Overall Comfort Levels
Campus Climate (79%)
Department/Work Unit (79%)
Classroom (81%)

Least comfortable with Overall
Campus Climate
People of Color
LGBQ
Least Comfortable with Climate in
Department/Work Unit
People of Color
Heterosexual
Least Comfortable with Classroom
Climate
People of Color
LGBQ
Women

Overall Satisfaction
75%
•Employees who were “highly satisfied” or “satisfied” with their jobs at UW-Parkside.
64%
•Students who were “highly satisfied” or “satisfied” with their education UW-Parkside.
80%
•Employees who were “highly satisfied” or “satisfied” with the way their careers have progressed at UW-Parkside.
67%
•Students who were “highly satisfied” or “satisfied” with the way their academic careers have progressed at UW-Parkside.

Levels of Satisfaction by Demographic Groups
• Classified staff were least satisfiedSatisfaction with Job
• Women, White respondents, heterosexual, and classified staff were least satisfiedSatisfaction with
Career Progression
• Men students were least satisfiedSatisfaction with Education
• LGBQ students were least satisfiedSatisfaction with Academic Career
Progression

Employee Comments with Regard to Job and Career Progression Satisfaction
Employees who were satisfied with the way their jobs and/or the way their careers have progressed liked their jobs; disciplines; co-workers; departments; working with students; the balance of teaching, research, and service (for faculty); and felt challenged and as though they “made a difference .”
Dissatisfied employees were unhappy with the reclassification process, difficult relationships with co-workers or supervisors, lack of opportunities for advancement, low salaries, lack of significant pay increases, lack of respect (in terms of salary and authority) afforded some positions (particularly adjunct faculty), lack of opportunity for growth in their current positions, feeling overworked and/or underappreciated, feeling their skills were underutilized, and wanting more training.

Student Comments with Regard to Satisfaction with Academic Experiences
Students who were satisfied with the way their academic careers have progressed said they had caring and intelligent teachers, worked hard to earn good grades, were interested in the subjects taught, and took advantage of most opportunities presented.
Dissatisfied students said faculty do not have time to answer questions, advising needs improvement, required courses were not offered at opportune times, they did not work hard or study enough, they had personal issues which impeded success, were disappointed in some general education courses, too few credits transferred from a previous institution, felt their academic careers have not prepared them for employment, and felt courses were not sufficiently challenging.

Challenges and Opportunities

Experiences with Harassment
303 respondents indicated that they had personally experienced exclusionary, intimidating, offensive and/or hostile conduct that interfered with their ability to work or learn at UW-Parkside
18%

Personally Experienced Based on…(%)
Series1
2928
26
23
20
16 1513 12
9
Gender (n=87)
Age (n=86)
Status (n=80)
Race (n=69)
Ethnicity (n=61)
Educational Level (n=48)
Political Views (n=45)
Physical Characteristics (n=39)
Religion/Spiritual Status (n=35)
Sexual Orientation (n=27)

Overall Personal Experiences of Perceived Offensive, Hostile, or Intimidating Conduct Due to
Gender (by Gender) (%)
¹ Percentages are based on total n split by group.² Percentages are based on n split by group for those who believed they had personally experienced this conduct.
(n=182)¹
(n=62)²
(n=115)¹
(n=22)²

Overall Personal Experiences of Perceived Offensive, Hostile, or Intimidating Conduct Due to
Position Status by Position Status (%)
¹ Percentages are based on total n split by group.² Percentages are based on n split by group for those who believed they had personally experienced this conduct.
(n=184)¹
(n=30)²
(n=45)¹
(n=)12²
(n=34)¹
(n=21)²
(n=27)¹
(n=10)²
Overall Personal Experiences of Perceived Offensive, Hostile, or Intimidating Conduct Due to
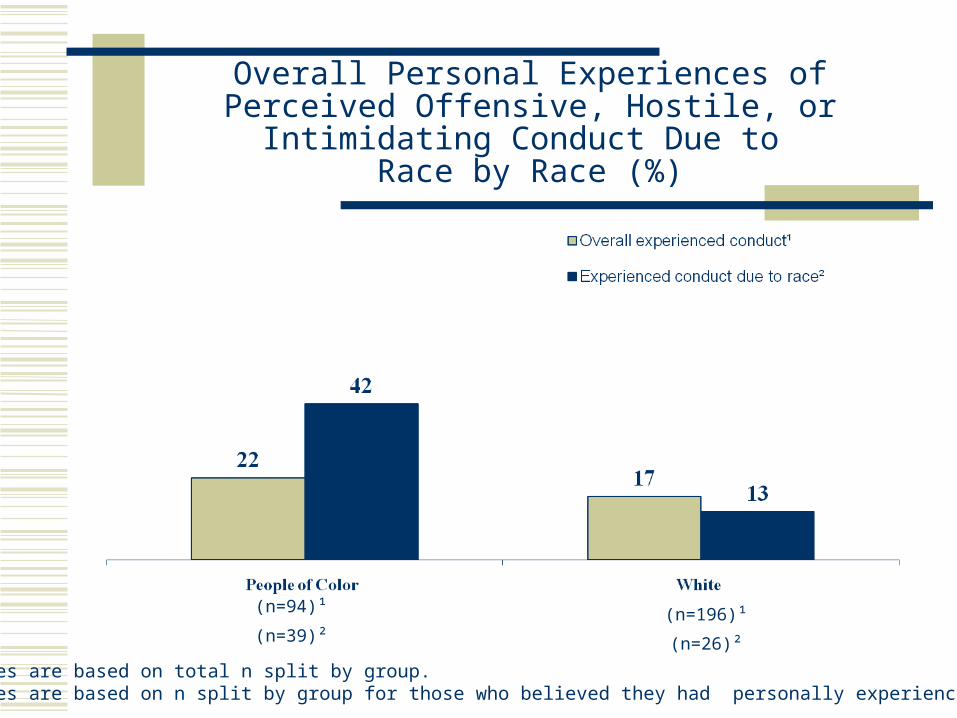
Race by Race (%)
¹ Percentages are based on total n split by group.² Percentages are based on n split by group for those who believed they had personally experienced this conduct.
(n=94)¹
(n=39)²(n=196)¹
(n=26)²

Overall Personal Experiences of Perceived Offensive, Hostile, or Intimidating Conduct Due to Sexual
Orientation by Sexual Orientation (%)
¹ Percentages are based on total n split by group.² Percentages are based on n split by group for those who believed they had personally experienced this conduct.
LGB respondents Heterosexual respondents
26
17
61
2
Overall experienced conduct¹
Experienced conduct due to sexual orientation²
(n=31)¹
(n=19)²
(n=254)¹
(n=5)²

Overall Personal Experiences of Perceived Offensive, Hostile, or Intimidating Conduct Due to Disability Status by Disability Status (%)
¹ Percentages are based on total n split by group.² Percentages are based on n split by group for those who believed they had personally experienced this conduct..
(n=244)¹ (n=20)¹
(n=4)²
(n=17)¹
(n=3)²
(n=24)¹
(n=10)²

Form of Perceived Offensive, Hostile, or Intimidating Conduct
n %
Deliberately ignored or excluded 149 49.2
Felt intimidated/bullied 93 30.7
Stares 74 24.4
Isolated or left out when working in groups 50 16.5
Derogatory remarks 47 15.5
Isolated or left out because of my identity 47 15.5
Received a low performance evaluation 42 13.9
Feared getting a poor grade because of hostile classroom environment 37 12.2
Target of racial/ethnic profiling 35 11.6
Note: Only answered by respondents who experienced harassment (n = 303). Percentages do not sum to 100 due to multiple responses.

Form of Perceived Offensive, Hostile, or Intimidating Conduct
n %
Derogatory written comments 31 10.2
Feared for my physical safety 26 8.6
Singled out as the “resident authority” regarding my identity 18 5.9
Derogatory/unsolicited e-mails 17 5.6
Someone assumed I was admitted or hired because of my identity 17 5.6
Threats of physical violence 15 5.0
Derogatory phone calls 12 4.0
Target of physical violence 8 2.6
Graffiti 7 2.3
Note: Only answered by respondents who experienced harassment (n = 303). Percentages do not sum to 100 due to multiple responses.

Respondents Who Believed They Were Deliberately Ignored or Excluded
Where Did The Perceived Conduct Occur? 45 percent (n = 67) - in a class 33 percent (n = 49) - in a meeting with a group of people
Note: Only answered by respondents who experienced harassment (n = 303). Percentages do not sum to 100 due to multiple responses.

Respondents Who Believed They Were Intimidated or Bullied
Where Did The Perceived Conduct Occur? 36 percent (n = 33) - in a class 25 percent (n = 23) - in a meeting with a group of people
Note: Only answered by respondents who experienced harassment (n = 303). Percentages do not sum to 100 due to multiple responses.
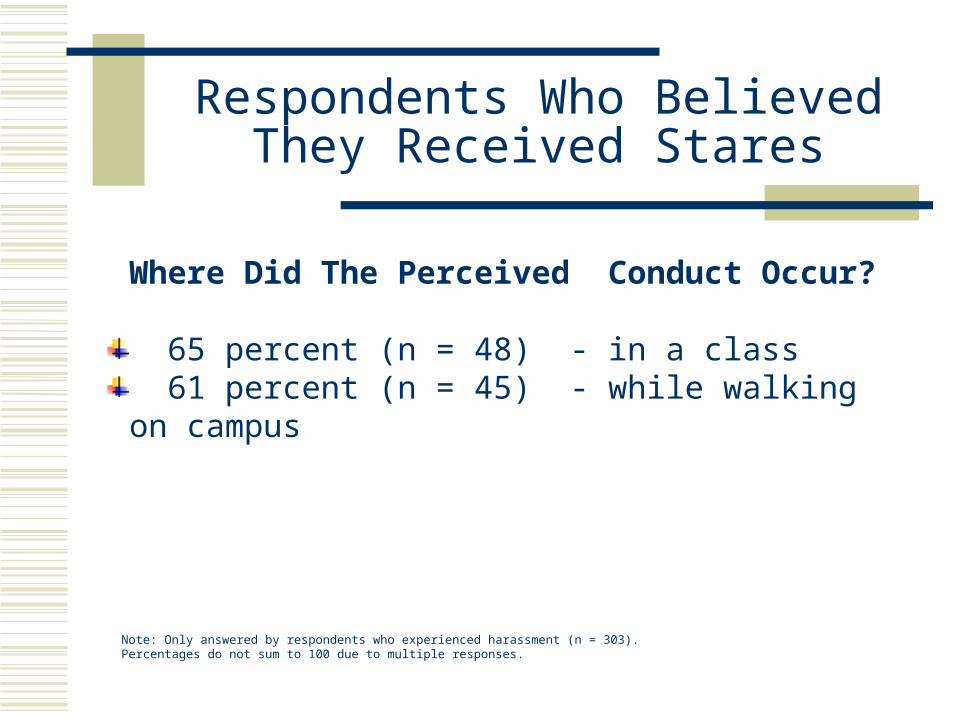
Respondents Who Believed They Received Stares
Where Did The Perceived Conduct Occur? 65 percent (n = 48) - in a class 61 percent (n = 45) - while walking on campus
Note: Only answered by respondents who experienced harassment (n = 303). Percentages do not sum to 100 due to multiple responses.

Source of Perceived Conduct by Position Status (n)
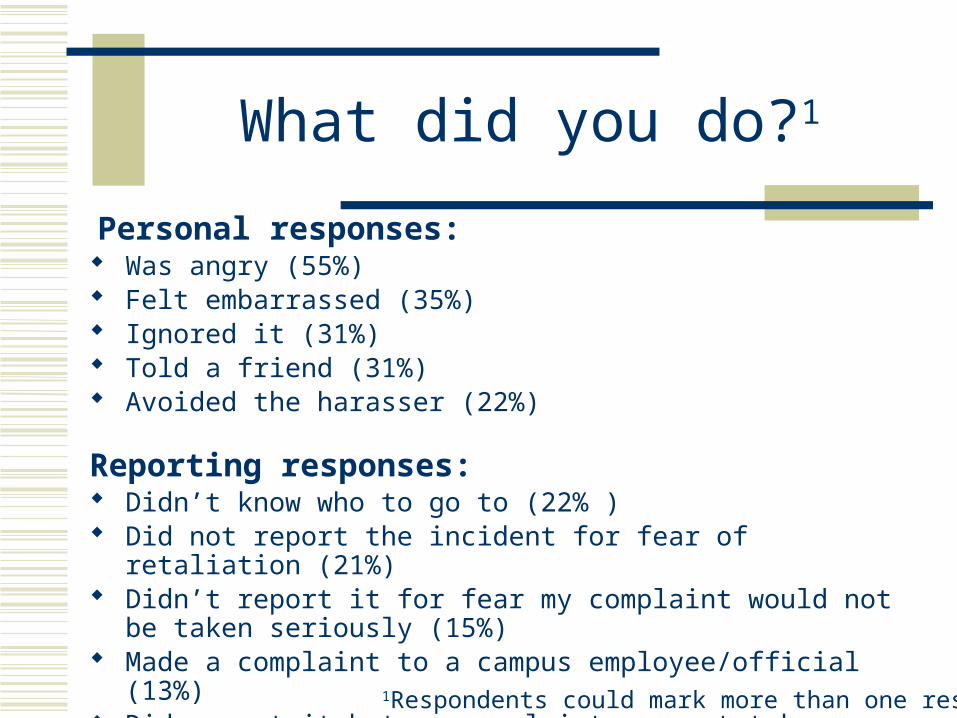
What did you do?1
Personal responses: Was angry (55%) Felt embarrassed (35%) Ignored it (31%) Told a friend (31%) Avoided the harasser (22%)
Reporting responses: Didn’t know who to go to (22% ) Did not report the incident for fear of retaliation (21%) Didn’t report it for fear my complaint would not be taken seriously (15%) Made a complaint to a campus employee/official (13%) Did report it but my complaint was not taken seriously (11%)
1Respondents could mark more than one response
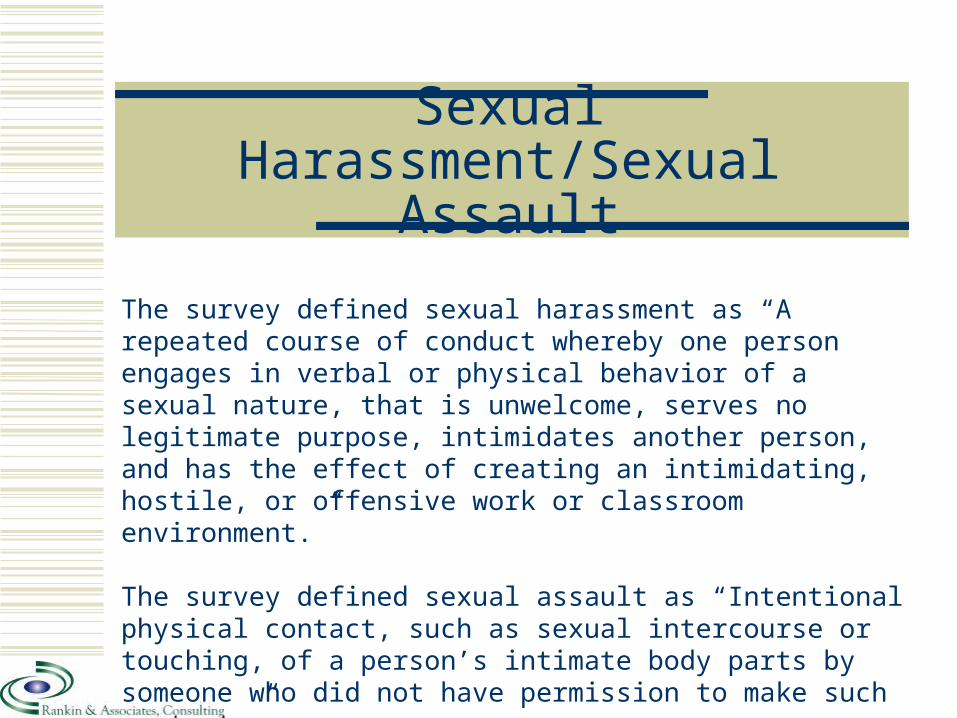
Sexual Harassment/Sexual Assault
The survey defined sexual harassment as “A repeated course of conduct whereby one person engages in verbal or physical behavior of a sexual nature, that is unwelcome, serves no legitimate purpose, intimidates another person, and has the effect of creating an intimidating, hostile, or offensive work or classroom environment.”
The survey defined sexual assault as “Intentional physical contact, such as sexual intercourse or touching, of a person’s intimate body parts by someone who did not have permission to make such contact.”

Sexual Misconduct at UW-Parkside
Believed they had been touched in a sexual manner that made them feel uncomfortable or fearful
4%
Were fearful of being sexually harassed at UW-Parkside
3%

Respondents Who Experienced Sexual Assault
21 respondents were victims of sexual assault
1%

Respondents Who Believed They Were Sexually Assaulted
By Gender Identity
• Women (2%; n = 19)
• Men (<1%; n=1)
By Sexual Identity
• Heterosexual (1%; n = 17)
• LGBQQ (4%, n = 5)
By Racial Identity
• White People (1%; n = 16)
• People of Color (1%, n = 5)
By Position
• Students (2%, = 18)
• Classified Staff
• (3%, n = 2)

Respondents Who Believed They Were Sexually Assaulted
Where did it occur?On-campus (n = 13)
Who were the offenders against students?*Students (n = 8)
What did you do1?Told a friend (n = 13)
Did nothing (n = 7)
Told a family member (n = 6)
1Respondents could mark more than one response

Respondents Who Seriously Considered Leaving UW-Parkside
50% (n = 813) of all Respondents
Faculty (61%)
Academic Staff (63%)
Classified Staff (61%)
Students (46%)

Employee Respondents Who Seriously Considered Leaving UW-Parkside
Employees
Men (62%)
Women (61%)
White (61%)
Employees of Color (61%)
LGBQ (67%)
Heterosexual (61%)

Student Respondents Who Seriously Considered Leaving UW-Parkside
Students
Men (48%)
Women (45%)
Students of Color (50%)
White (44%)
LGBQ (48%)
Heterosexual (46%)
Perceptions

Respondents Who Observed or Were Personally Made Aware of Conduct That Created an Exclusionary,
Intimidating, Offensive and/or Hostile Working or Learning Environment
% n
Yes 26.0 420

Observed Exclusionary, Intimidating, Offensive, or Hostile Conduct by Race (%)
2529
White People (n = 289)
People of Color (n = 121)

Observed Exclusionary, Intimidating, Offensive, or Hostile Conduct by Gender (%)
25 26
Women (n = 256)
Men (n = 158)
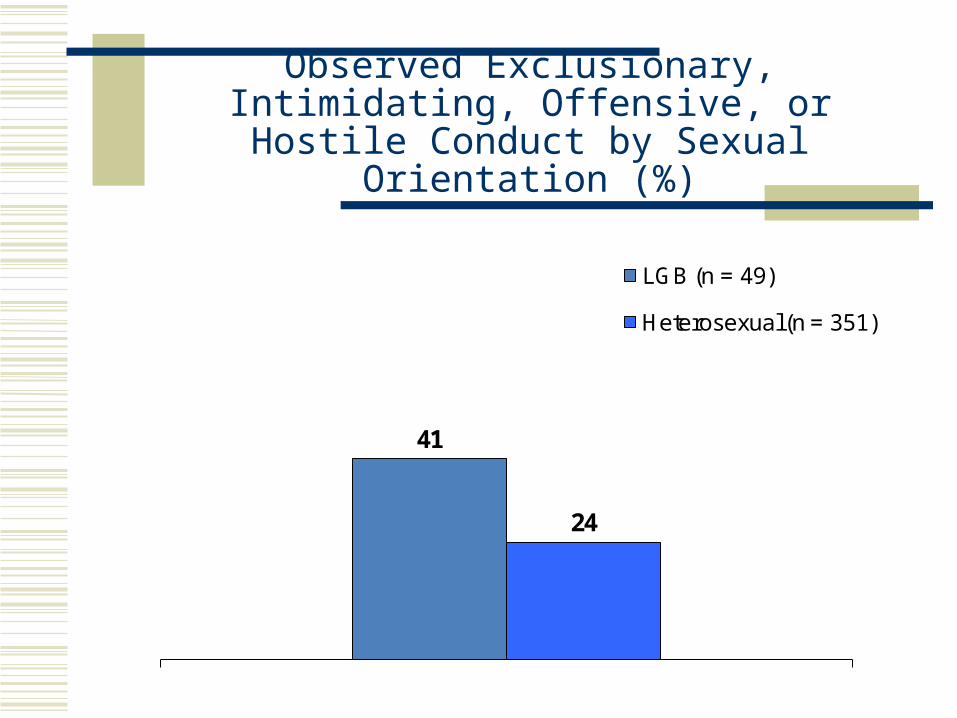
Observed Exclusionary, Intimidating, Offensive, or Hostile Conduct by Sexual Orientation (%)
41
24
LGB (n = 49)
Heterosexual (n = 351)

Observed Exclusionary, Intimidating, Offensive, or Hostile Conduct by Position Status (%)

Form of Observed Exclusionary, Intimidating, Offensive, or Hostile Conduct
n %Derogatory remarks
142 33.8Deliberately ignored or excluded
134 31.9Racial/ethnic profiling
128 30.5Stares
122 29.0Intimidation/bullying
87 20.7Graffiti
75 17.9Someone isolated or left out because of their identity
72 17.1Derogatory written comments
66 15.7Assumption that someone was admitted or hired because of their identity
59 14.0
Note: Only answered by respondents who observed harassment (n = 420). Percentages do not sum to 100 due to multiple responses.
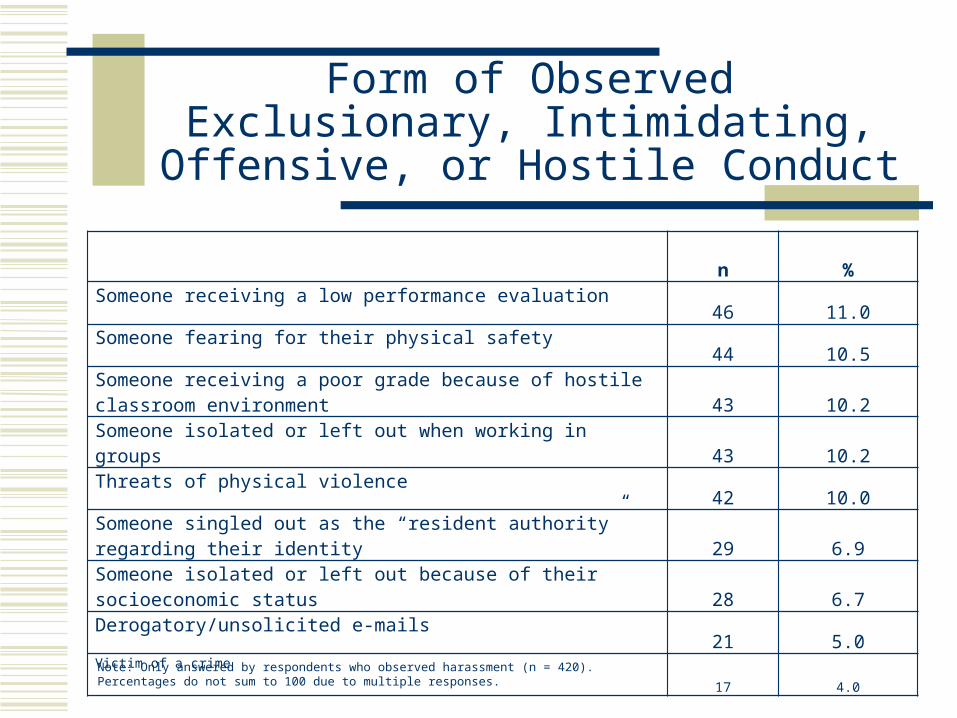
Form of Observed Exclusionary, Intimidating, Offensive, or Hostile Conduct
n %Someone receiving a low performance evaluation
46 11.0Someone fearing for their physical safety
44 10.5Someone receiving a poor grade because of hostile classroom environment
43 10.2Someone isolated or left out when working in groups
43 10.2Threats of physical violence
42 10.0Someone singled out as the “resident authority” regarding their identity
29 6.9Someone isolated or left out because of their socioeconomic status
28 6.7Derogatory/unsolicited e-mails
21 5.0Victim of a crime
17 4.0
Note: Only answered by respondents who observed harassment (n = 420). Percentages do not sum to 100 due to multiple responses.

Source of Observed Exclusionary, Intimidating, Offensive, or Hostile Conduct (%)
Students (42%) Faculty Members (17%) Colleagues (16%) Staff Members (10%) Administrators (8%)
Note: Only answered by respondents who observed harassment (n = 420). Percentages do not sum to 100 due to multiple responses.

Respondents Who Observed People Making Derogatory Remarks
Where Did The Perceived Conduct Occur? 40 percent (n = 57) - in a public space on campus 36 percent (n = 51) - while walking on campus
Note: Only answered by respondents who experienced harassment (n = 420). Percentages do not sum to 100 due to multiple responses.

Respondents Who Observed People Being Deliberately Ignored or Excluded
Where Did The Perceived Conduct Occur? 43 percent (n = 57) - in a class 32 percent (n = 43) - while walking on campus
Note: Only answered by respondents who experienced harassment (n = 420). Percentages do not sum to 100 due to multiple responses.

Respondents Who Observed Someone Being Subjected to Racial Profiling
Where Did The Perceived Conduct Occur? 41 percent (n = 52) - in a class 37 percent (n = 47) - in a public space on campus
Note: Only answered by respondents who experienced harassment (n = 420). Percentages do not sum to 100 due to multiple responses.

Perceived Discrimination
Hiring
(34%)
Due to Race (34%)
Due to Ethnicity (32%)
Due to Gender (21%)
Due to University Status (20%)
Employment Practices up to and including dismissal
(19%)
Due to Gender (34%)
Due to Race (31%)
Due to Age (29%)
Employment Practices Related to
Promotion (27%)
Due to Gender (34%)
Due to Race (28%)
Due to University Status (25%)

Work-Life Issues
The majority of respondents expressed positive attitudes about work-life issues.

Work-Life Issues
77% (n = 260) of employee respondents were comfortable asking questions about performance expectations.
32% (n = 105) believe there are many unwritten rules concerning how one is expected to interact with colleagues in their work units.
26% (n = 89) were reluctant to bring up issues that concern them for fear than it will affect their performance evaluation or tenure decision.
66% (n =223) believed that they had colleagues or peers who gave them career advice or guidance when they need it.

Work-Life Issues
53% (n = 177) believed that they had support from decision makers/colleagues who supported their career advancement
38% (n = 50) of faculty thought their research interests were valued by their colleagues
19% (n = 63) constantly felt under the scrutiny by their colleagues
27% (n = 90) felt they had to work harder than their colleagues do in order to be perceived as legitimate
33% (n = 111) thought their compensation was equitable to their peers with similar levels of experience

Work-Life Issues
67% (n = 227) of employees are usually satisfied with the way in which they were able to balance their professional and personal lives
38% (n = 125) found UW-Parkside supportive of family leave
29% (n = 97) have had to miss out on important things in their personal lives because of professional responsibilities
13% (n = 45) felt that employees who have children were considered less committed to their careers
14% (n = 47) felt that employees who do not have children were often burdened with work responsibilities

Work-Life Issues
7% (n = 22) believed the institution was unfair in providing health benefits to unmarried, co-parenting partners
18% (n = 58) thought they had equitable access to domestic partner benefits
24% (n = 76) believed they had equitable access to tuition reimbursement

Welcoming Workplace Climate
More than half of all employees thought the workplace climate was welcoming of “difference.”
Respondents of Color and women were least likely to believe the workplace climate was welcoming for employees based on gender.
Respondents of Color were least likely to believe the workplace climate was welcoming for employees based on race.
Women and LGBQ respondents were least likely to believe the workplace climate was welcoming for employees based on sexual orientation.

Welcoming Classroom Climate
More than half of all student respondents felt that the classroom climate was welcoming for students based on “difference” across all dimensions.
59% of Students of Color and 73% of White students thought the classroom climate was welcoming based on race
52% of LGB students and 66% of heterosexual students thought the climate was welcoming based on sexual orientation

Institutional Actions

Visible Leadership
More than half of all respondents thought that the faculty, the LGBTQ Resource Center, Office of Multicultural Student Affairs (OMSA), Residence Life, staff, and Student Activities had visible leadership to foster diversity/inclusion on campus.
A substantial percentage of respondents were unaware of the degree to which all the offices/individuals had visible leadership to support diversity/inclusion.

Inclusive Curriculum
More than half of all students and faculty felt the courses they took or taught included materials, perspectives, and/or experiences of people based on “difference.”
The exceptions included disability issues, immigrant status, sexual orientation issues, and veteran/military status.

EmployeesCampus Initiatives That Would Positively
Affect the Climate
More than half of all employee respondents recommended: training mentors and leaders within departments to model positive
climate behavior offering diversity training/programs as community outreach would
positively affect the climate that faculty/staff/students learn a second language, participate in
service-learning projects with lower socioeconomic status populations, and work with underrepresented/underserved populations
providing on-campus child care services providing gender neutral/family friendly facilities

EmployeesCampus Initiatives That Would Positively
Affect the Climate
More than half of all employee respondents recommended: providing recognition and rewards for including diversity in course
objectives throughout the curriculum providing, improving, and promoting access to quality services for
those individuals who experience sexual abuse providing mentors for minority faculty/students/staff new to campus providing a clear protocol for responding to hate/hostile incidents at
the campus level and departmental level reallocating resources to support inclusive climate changes on
campus

EmployeesCampus Initiatives That Would Positively
Affect the Climate
Less than half of all employee respondents recommended: providing tenure clock options with more flexibility for promotion
and tenure for faculty/staff with families would positively affect the climate
rewarding research efforts that evaluate outcomes of diversity training
requiring diversity related activities as one of the criteria for hiring and/or evaluation of staff, faculty, and administrators
requiring the Affirmative Action Office to provide diversity and equity training to every search and screen committee

Summary
Strengths and Successes
Challenges and Opportunities

Summary of Findings Strengths and Successes
80% percent of students were satisfied with their education at UW-Parkside.
75% of employees were satisfied with their jobs at
UW-Parkside Over 75% of respondents reported that they were very
comfortable or comfortable with the overall climate, climate in their departments or work unit, and climate in their classes.

Summary of FindingsOpportunities and Challenges
Challenge
Differential Treatment Due to University Position
Challenge
Gender Inequity
Challenge
Homophobia and Heterosexism
Challenge
Racial Tension

Racial Tension at UW-Parkside
Respondents of Color (22%, n = 94) were more likely to report personally experiencing harassment than their White counterparts (17%, n = 196).
Forty-two percent (n = 39) of Respondents of Color said the harassment was based on their race.
People of Color were more likely than White people to observe offensive, hostile, exclusionary, or intimidating conduct.
Of those who observed harassment, 34% (n = 143) believed it was based on race.

Racial Tension at UW-Parkside
People of Color were less comfortable than White respondents with the overall climate for diversity, the climate in their departments/work units, and the climate in their classes.
Employees of Color were more likely than White employees to report: colleagues expect them to represent “the point of view” of their identity that they have to work harder than their colleagues do in order to be perceived
as legitimate.
Respondents of Color were least likely to think their workplace climate was welcoming based on race when compared with other demographic groups.

Homophobia and Heterosexism
LGBQ respondents were more likely than heterosexual respondents to believe that they had experienced harassment.
Of those who believed they had experienced this type of conduct, 61% (n = 19) of LGBQ respondents indicated that the conduct was based on sexual orientation.
A higher percentage of LGBQ respondents believed they had observed offensive, hostile, exclusionary, or intimidating conduct than did their heterosexual respondents.
The most common basis for observed harassment was sexual orientation (36%).

Homophobia and Heterosexism
LGBQ respondents were less likely to feel “very comfortable” with the overall climate when compared to heterosexual respondents.
LGBQ students were less comfortable with the classroom climate than heterosexual students.
LGBQ employee respondents were less likely than heterosexual respondents to believe the workplace climate was welcoming based on sexual orientation.
67% of LGBQ employees have seriously thought of leaving the institution.

Gender Inequity
Gender was cited as the most common basis for experienced harassment, with women (34%) more likely than men (19%) to indicate such a basis.
Women were more likely than men to believe they had observed discriminatory hiring practices, discriminatory employment-related disciplinary up to and including dismissal, and promotion/tenure practices.
Gender was the most cited basis for observed discriminatory employment-related disciplinary actions and discriminatory practices related to promotion and tenure.

Differential Treatment by University Status
For those who reported they experienced harassment, university status was the third most common basis.
Of those respondents who believed that they had observed discriminatory hiring, discriminatory employment-related disciplinary actions, and discriminatory practices related to promotion, UW-Parkside status was indicated as one of the top five bases for discrimination.

Differential Treatment by University Status – Classified Staff
Classified staff members were significantly less satisfied with their jobs and with the way their careers have progressed than academic staff and faculty.
Classified staff members were more likely than academic staff and faculty to observe harassment, discriminatory hiring, discriminatory disciplinary actions, and discriminatory practices related to promotion.

Next Steps

Process ForwardFall/Winter 2010
Share report results with community Community dialogue regarding the assessment results Community feedback on recommended actions Executive Summary available at UW-Parkside website Full Report will be available in June 2010
Recommended planning “advance” to begin a “call to action” regarding the challenges uncovered in the report

Tell Us What You Think…
Additional questions/comments on results?Thoughts on process?Suggested actions?

Questions..? Other Ideas..?