Embed Size (px)
Citation preview
1
Volume 1 Issue 1 2016
Amity Journal of Management Research
AJMR
ADMAA
Amity Journal of Management Research1(1), (1–15)
©2016 ADMAA
Is Financial Inclusion Growth Significant?
Sr Usha A ASt. Joseph’s College for Women, Alappuzha, Kerala, India
B JohnsonUniversity of Calicut, Kerala, India
(Received: 26/10/2015, Accepted : 25/02/2016)
Abstract
An effective financial intermediation takes the country to higher economic growth by mobilising savings, allocating, and utilising the scare resources the best way possible. This paper is an endeavour to assess the extent of growth in the financial inclusiveness among the economies across the world from 2011 to 2014 after a series of policy implementation within the framework of national and international standards. Global Findex-2015 provided a detailed analysis of the financial penetration across the world from 2011 to 2014 based on income, gender, age, and region. In addition, it is an attempt to make a fine analysis of banking penetration by time and level of development of the economies. For this purpose, correlation between Gross National Income (GNI) and the financial inclusion indicators (FII) are established based on the Global Findex-2015 and subsequently, using the highly correlated factors of financial inclusion, the change in the banking penetration of 2014 over 2011 is assessed. The study revealed that ownership of accounts, savings, credit availability, debit card usage, and GNI are correlated. And financial inclusiveness does change significantly by period and by level of development.
Keywords: Developed and Developing Countries, Financial Inclusion Indicators and Gross National Income
JEL Classification: G2, G20, G21
Paper Classification: Research Paper
IntroductionInclusiveness aims at Indian principle, ‘Loko Samastha Sukhino Bhavanthu’. The prerequisites
for this long journey of ensuring happiness are equal opportunities and equal access. Financial inclusion is one of the means to the stated end implied in this invocational mantra. Financial Inclusion is a radical step to share the benefits of development in the formal financial sector to all equally without waiting to be trickled down in the due course. According to K.C. Chakrabarty, the former deputy director of RBI, inclusive growth is the shortest route to economic development. Financial inclusion is one of the four pillars of inclusive growth intended to improve the formal banking connectivity with unbanked and under-banked. The empirical studies have proved
2ADMAA
Volume 1 Issue 1 2016
Amity Journal of Management Research
AJMR
the correlation between effective financial system and the economic development of the nation. Developed and developing economies could further scale up the ladder of development if the financial inclusion initiatives are actualised, consequently there would be an increase in the household savings, added entrepreneurial activities and better life for the people, especially the poor.
The interest and commitment expressed by the World Leaders boosted the initiatives for financial inclusion all over the world. To be exact, the G20 leaders emphasised financial inclusion as one of the main pillars of the development agenda at the G20 Summit in Seoul, 2010. Leaders of G20 took up financial inclusion as an urgent and compelling target to be persuaded with well-defined action plan. Meeting the target is the challenge; G20 leaders formulated nine principles to face the challenge of financial exclusion that existed around the world (GPFI, 2015). They also identified three implementing and monitoring agencies at international level for the financial inclusion drive, namely, Alliance for Financial Inclusion, the Consultative Group to Assist the Poor, and the International Finance Corporation. Later on the World Bank (2012), the Organisation for Economic Co-operation and Development (2013) and the Better than Cash Alliance and the International Fund for Agricultural Development (2014) were joined in Global Partnership for Financial Inclusion (GPFI) as the implementing partners. Though the target setting was done at global level, its actual implementation and monitoring were left with individual economies. The national Governments and the apex banks around the world have laid down a number of legislations and constituted committees and has rolled out innovative financial products and tried out financial models with unwavering commitment to attain the ambitious goal of ‘financial services for all’.
Literature ReviewLevin (2005) has made an in-depth study on the interaction between financial system
and economic growth. The researcher clearly put forward that financial development fosters entrepreneurship, new firm formation, and hence economic growth. And as the economic growth escalates, the financial system has to advance constantly to provide better information about investment opportunities, to ensure efficient corporate governance, to pool and mobilise savings and to extend required financial services at different stages of development. Researcher concluded with a note of caution that financial system should not be restricted to wealthy and the influential, but should include all, to share the benefits of economic growth.
Singh and Kodan (2011), carried out a study using the database of 28 states and six union territories in India for the year ending 2006, to determine the role of financial inclusion in development and to explore the factors that significantly affect the financial inclusion in India. For the study four regression equations were framed, first one measured the degree of relationship between development (HDI); the second equation measured the relationship between economic development and financial inclusion using similar methodology as Sarma (2010); third, assessed the relationship between economic development indicators (per capita value of NSDP and employment rate) and financial inclusion; and the last determined the relationship between socio-economic development (literacy rate, urbanisation and sex-ratio) and financial inclusion. The study found that financial inclusion index is positively and significantly convergent to development (HDI) and financial inclusion is significantly influenced by per capita NSDP or economic development of the nation but not employment rate. Other major highlights of the study were socio-economic factors and financial inclusion was interrelated and there were no significant difference in the financial inclusion penetration among the selected states during the study period.
3
Volume 1 Issue 1 2016
Amity Journal of Management Research
AJMR
ADMAA
Van De Werff, Hogarth and Peach (2013) analysed the Global Findex of OECD countries and found that countries with even distribution of wealth had greater financial inclusion than the countries with uneven distribution of wealth and also confirmed that lack of income and trust in financial institutions have significant bearing on the financial inclusion rates. Ayyagari and Beck (2015) studied the financial development and inclusion in developing Asia and found that Asian region of economies have better banking sector depth compared to many other developing economies and it also highlighted the present status of financial inclusion in developing Asia. Around 27 per cent of adults in developing Asia have the ownership of accounts in formal financial institutions and 37 per cent enterprises have received credit from formal banking institutions. Moreover, unaffordable cost, lack of geographical access and identification requirements were pointed out as the major barriers to financial inclusion.
Micro Finance India-State of the Report, an annual evaluation of MFIs contribution to Indian rural poor prepared by Srinivasan (2013) states that financial inclusion is a cause and consequences of economic growth. Revolutionary changes are taking place in the banking sector in financial penetration and financial-engineering of financial products and services. Although it creates wealth to the financial intermediaries, the benefits of development in financial sector do not trickle down to the base of the pyramid. He opined that if the trickle down process has not been taking place in the perceived manner, it leads to increased inequality, vulnerability of the economy instead of growth and development.
According to Indira (2015), financial inclusion initiatives have succeeded to certain extent in the first step i.e., ensuring ownership of bank accounts to the low-income group but the time has come to rethink the meaningfulness of inclusive growth and multidimensional index of financial inclusion has to be revisited to differentiate between the access and use. The author proposed to assess the financial habit indicators and financial deepening indicators. The financial deepening indicators such as number of bank account per households from demand dimension and bank branches per 1,000 kilometres from supply dimension could be included to compute the effectiveness of financial inclusion. The researcher proposed that the actual usage of bank accounts by the chief earner of the house by their occupation was to be measured to assess the degree of financial banking habit of the account holders.
Research Gap IdentifiedFinancial system and its impact on economic growth of an economy has been a topic of
debate and discussion for researchers at national and international levels. Extensive studies have been undertaken on the determinants of financial development, influence of financial system on savings and investment decisions, financial system and the entrepreneurial thrust and the correlation between Human Development Index score and the financial inclusion index score etc. But the present study intends to assess the influence of GNI on financial inclusion indicators and to identify the progress of financial inclusion indicators by period of time and by the current level of development of economies across the world. This study would be a great help to the policy holders to take more realistic steps to accelerate the process of financial inclusion and to ensure a speedy sustainable development in the world.
First of all, the present study confirms to the earlier empirical evidences on the established association between overall development and the financial inclusion status of the economies. Secondly, it brings about the changes that have taken place in the financial inclusion indicators from 2011 to 2014 in the selected developed and developing economies. Thirdly, it invites the attention of the policy makers to a missing focus of financial inclusion thrust that the hesitance
4ADMAA
Volume 1 Issue 1 2016
Amity Journal of Management Research
AJMR
observed in extending institutional credit among the developed economies, which would weaken the soul of highlighted poverty alleviation tool. The study reiterates that financial inclusion should free the poor from the clutches of private money lenders and enable them to spend the surplus earning to escalate their standard of living rather than mere connecting them to the formal banking sector.
Statement of the ProblemThe banking sector around the world shows tremendous growth in volume and offer high-
ended products and services to its customers. A deliberate observation helps to fathom the tempo of the modern banking. It is oriented towards the maxim of big is beautiful and wealthy is safe. An analysis of the Global Findex data depicted that developed countries like Norway, Denmark and Finland have achieved cent percentage financial inclusion indicating tremendous efforts of such Governments’ concerted initiatives backed by legal framework. With a decade long untiring and focused commitment for financial inclusion by developing economies has been commendable as the banking penetration has been deepeed in terms of bank branches and ownership of accounts. But the depth of financial service penetration still raise a cause for debate. It is an attempt to assess the growth of financial inclusiveness among developed and developing economies from 2011 to 2014.
Objectives of the Study1. To ascertain the extent of correlation between Gross National Income (GNI) and financial
inclusion indicators.
2. To determine the change in the financial inclusion indicators of the global economies by period of time and by level of development.
Hypotheses
H01: There is no significant relation between GNI and other financial inclusion indicators of economies across the globe.
H02: There is no significant difference in the financial inclusion indicators among the selected economies from 2011 to 2014.
H03: There is no significant difference among the financial inclusion indicators across economies by their level of development.
Research Methodology & Database
Nature of ResearchThe present study is descriptive and analytical in nature based on the secondary data
collected from Global Findex-2015, the global financial inclusion data base maintained by World Bank and International Statistical Institute in 2014 (ISI, 2014) and the World Economic Situation and Prospects 2014 (UN, 2014) for classfiying the economies based on the prevailing status of development.
Sample The Global Findex database provides the demand-side data on access to and use of accounts,
5
Volume 1 Issue 1 2016
Amity Journal of Management Research
AJMR
ADMAA
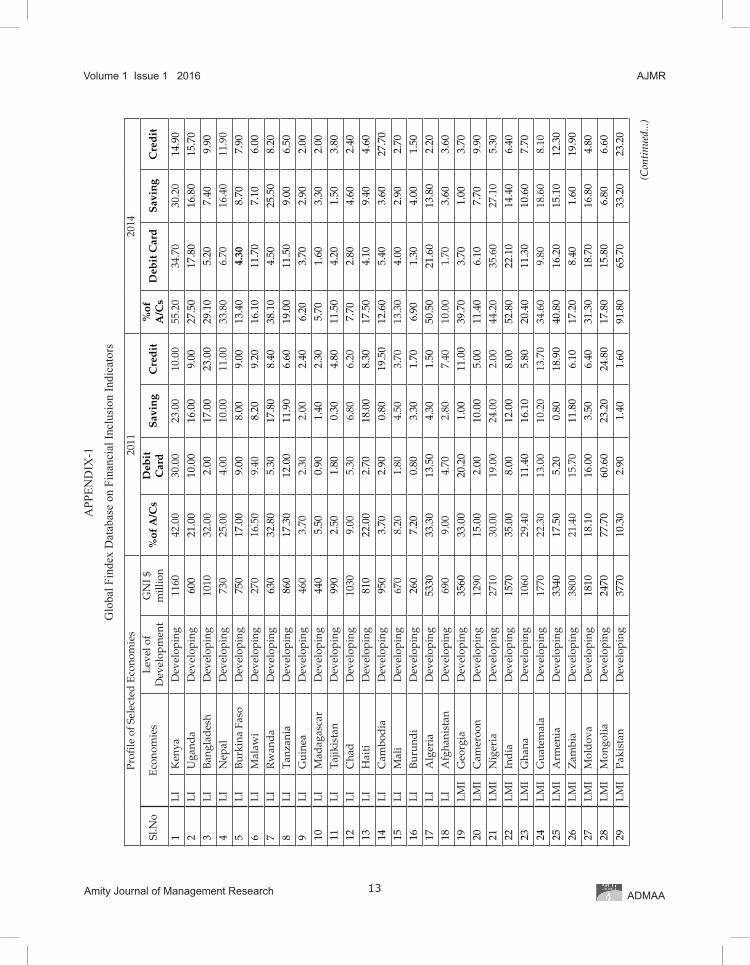
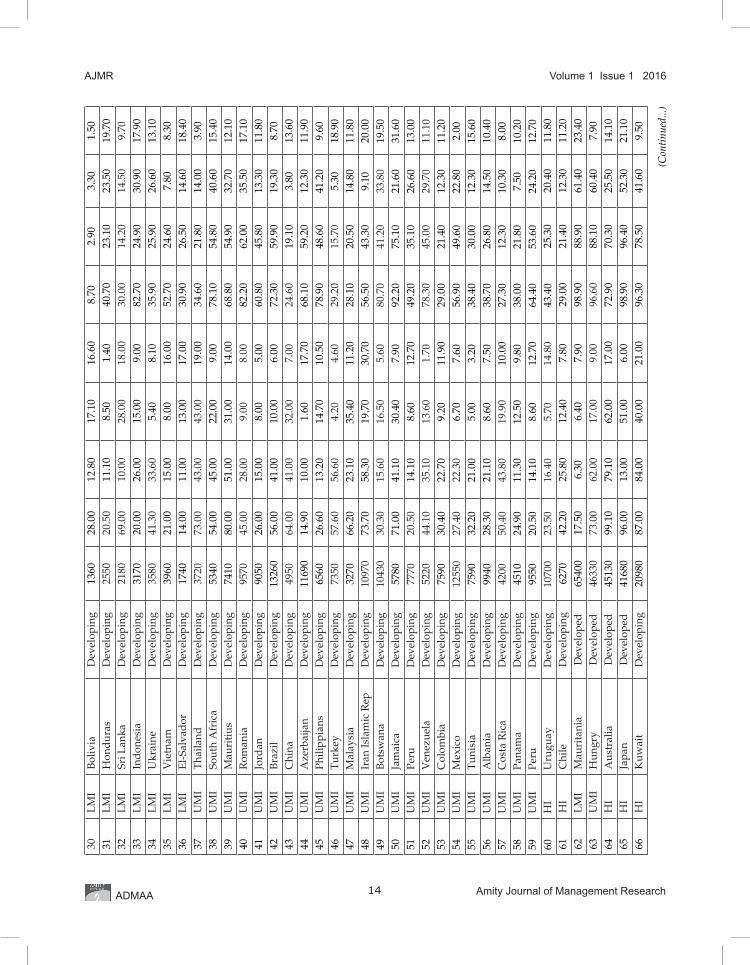
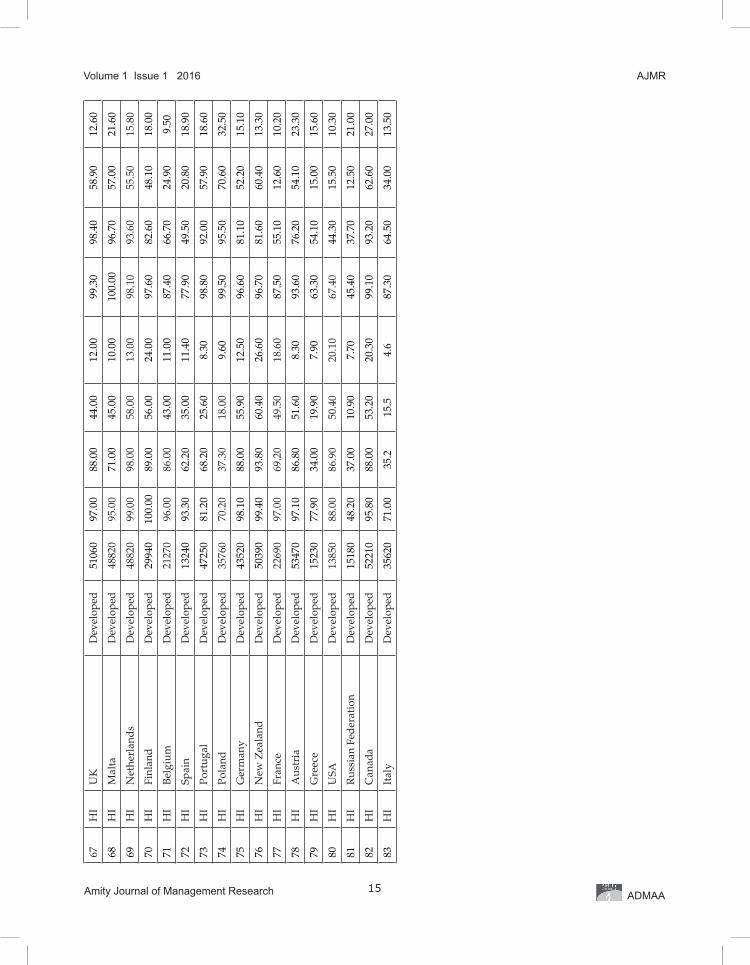
credit, payments, and savings by adults (age 15+) in 143 countries. The sample for the present study consists of 21 developed economies and 62 developing economies. The database for the present study is accessible in the APPENDIX-1, titled as Database of Financial Inclusion Indicators.
Variables Analysed Financial Inclusion Global Findex. As per recently published, Little Data Book on Financial
Inclusion updates financial inclusion database, maintained by World Bank and provides a detailed picture of the finacial landscape of the globe under regional category and income category. The variables under study are as follows, (i) GNI of each nationalities converted into US Dollars; (ii) Ownership of accounts; (iii) Debit card users; (iv) Savings; and (v) Borrowal from financial instituions; and (vi) Level of development of economies. The Global Findex 2012 presented financial inclusion status from 2001 to 2011 and the definition of ‘ownership of accounts’ was restricted to account holders of a financial institutions only, but in the Global Findex 2015, it has redefined ‘ownership of accounts’ as adult having an account either at a financial institution and through mobile money providers such as M-PESA, MTN Mobile Money, Airtel Money, or Orange Money (World Bank, 2015). Debit card users denote the percentage of respondents who reported to have debit cards. Savings denotes percentage of adults who saved in the past 12 month using accounts at a bank or financial institutions. Borrowing stands for percentage of respondents who have borrowed in the past 12 months from any of the financial institutions
Gross National Income. The concept ‘GNI’ measures income procured by an economy both domestically and from abroad, 143 economies were categorised as low income, middle income and high income on the basis of Gross National Income per capita in 2013. Low-income economies, otherwise known, as developing economies are those with GNI per capita of $1,045 or less and Middle-income economies are those with a GNI per capita of more than $1,045 but less than $12,746. Lower middle income refers to GNI per capita less than $4,125 and Upper-middle income economies are greater than GNI per capita of $4,125. High-income economies are those with a GNI per capita of $12,746 or more.
The breadth and depth of financial inclusion across the globe can be assessed taking into account of the economic advancement of the economies rather than the regional pattern. Hence, Gross National Income and level of development are chosen as the dependent variable. Subsequently, 81 countries consists of 16 low-income countries, 19 low-middle income countries, 24 upper-middle income counties and 22 high-income economies, with complete details of the financial inclusion variables like number of accounts per adults, number of adults who chose formal banks to deposit their savings, number of households raised credit from formal sector, adults using ATM cards, and ownership of debit cards of 2011 as well as 2014 were selected from the Global Findex data. As a first step, correlation between GNI (dependent variable) and five financial inclusion factors (independent variables) were determined. The correlated factors alone were considered to ascertain the change in the financial inclusion penetration by period from 2011 to 2014 and also by level of development.
Statistical Tools UsedThe researchers have made use of correlation technique to examine the relationship between
the study variables and paired t-test has been used to compare means of financial inclusion indicators by period of time and independent t-test is used to compare the means by level of development.
6ADMAA
Volume 1 Issue 1 2016
Amity Journal of Management Research
AJMR
Reference periodThe Global Findex database provides the financial inclusion details of 143 countries based on
the data collected for the year 2014. The level of development of economies are adopted from the list published by the Interrational Statistical Institute in 2014 (ISI, 2014) and the World Economic Situation and Prospects, 2014 (UN, 2014).
Result and Discussion
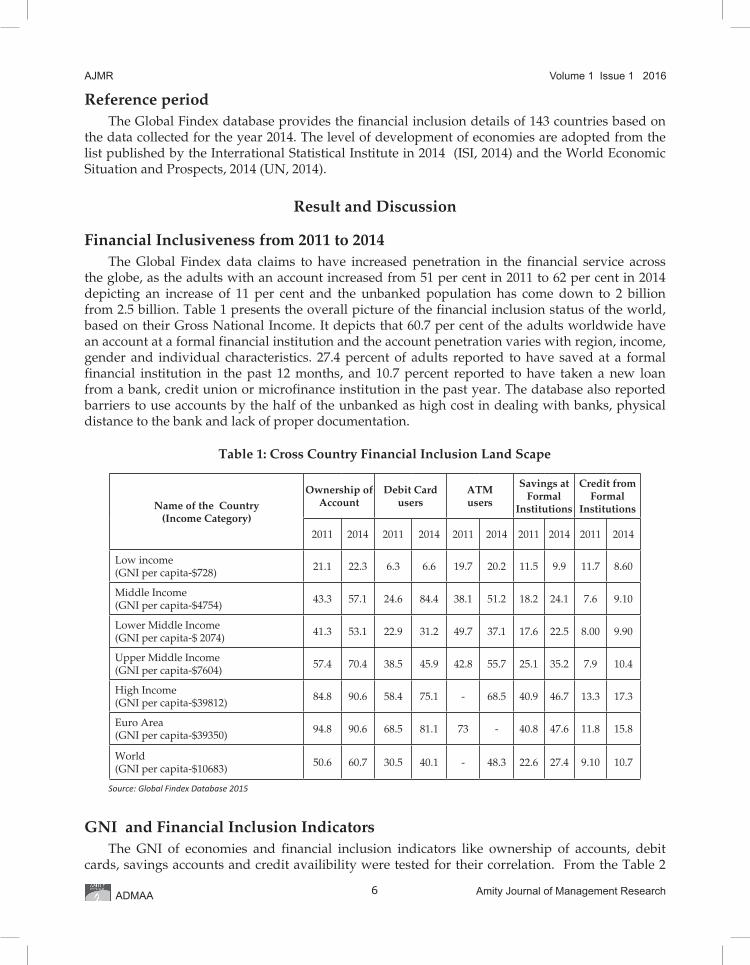
Financial Inclusiveness from 2011 to 2014The Global Findex data claims to have increased penetration in the financial service across
the globe, as the adults with an account increased from 51 per cent in 2011 to 62 per cent in 2014 depicting an increase of 11 per cent and the unbanked population has come down to 2 billion from 2.5 billion. Table 1 presents the overall picture of the financial inclusion status of the world, based on their Gross National Income. It depicts that 60.7 per cent of the adults worldwide have an account at a formal financial institution and the account penetration varies with region, income, gender and individual characteristics. 27.4 percent of adults reported to have saved at a formal financial institution in the past 12 months, and 10.7 percent reported to have taken a new loan from a bank, credit union or microfinance institution in the past year. The database also reported barriers to use accounts by the half of the unbanked as high cost in dealing with banks, physical distance to the bank and lack of proper documentation.
Table 1: Cross Country Financial Inclusion Land Scape
Name of the Country (Income Category)
Ownership of Account
Debit Card users
ATM users
Savings at Formal
Institutions
Credit from Formal
Institutions
2011 2014 2011 2014 2011 2014 2011 2014 2011 2014
Low income (GNI per capita-$728) 21.1 22.3 6.3 6.6 19.7 20.2 11.5 9.9 11.7 8.60
Middle Income (GNI per capita-$4754) 43.3 57.1 24.6 84.4 38.1 51.2 18.2 24.1 7.6 9.10
Lower Middle Income (GNI per capita-$ 2074) 41.3 53.1 22.9 31.2 49.7 37.1 17.6 22.5 8.00 9.90
Upper Middle Income (GNI per capita-$7604) 57.4 70.4 38.5 45.9 42.8 55.7 25.1 35.2 7.9 10.4
High Income (GNI per capita-$39812) 84.8 90.6 58.4 75.1 - 68.5 40.9 46.7 13.3 17.3
Euro Area (GNI per capita-$39350) 94.8 90.6 68.5 81.1 73 - 40.8 47.6 11.8 15.8
World (GNI per capita-$10683) 50.6 60.7 30.5 40.1 - 48.3 22.6 27.4 9.10 10.7
Source: Global Findex Database 2015
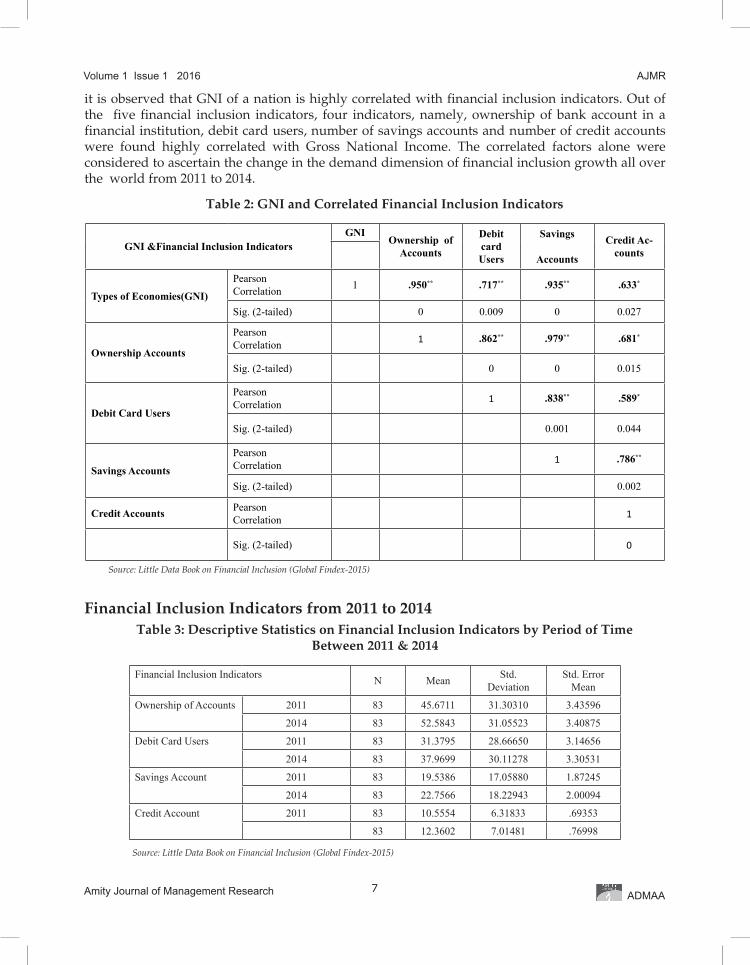
GNI and Financial Inclusion IndicatorsThe GNI of economies and financial inclusion indicators like ownership of accounts, debit
cards, savings accounts and credit availibility were tested for their correlation. From the Table 2
7
Volume 1 Issue 1 2016
Amity Journal of Management Research
AJMR
ADMAA
it is observed that GNI of a nation is highly correlated with financial inclusion indicators. Out of the five financial inclusion indicators, four indicators, namely, ownership of bank account in a financial institution, debit card users, number of savings accounts and number of credit accounts were found highly correlated with Gross National Income. The correlated factors alone were considered to ascertain the change in the demand dimension of financial inclusion growth all over the world from 2011 to 2014.
Table 2: GNI and Correlated Financial Inclusion Indicators
GNI &Financial Inclusion IndicatorsGNI
Ownership of Accounts
Debit card Users
Savings
Accounts
Credit Ac-counts
Types of Economies(GNI)
Pearson Correlation 1 .950** .717** .935** .633*
Sig. (2-tailed) 0 0.009 0 0.027
Ownership Accounts
Pearson Correlation 1 .862** .979** .681*
Sig. (2-tailed) 0 0 0.015
Debit Card Users
Pearson Correlation 1 .838** .589*
Sig. (2-tailed) 0.001 0.044
Savings Accounts
Pearson Correlation 1 .786**
Sig. (2-tailed) 0.002
Credit Accounts Pearson Correlation 1
Sig. (2-tailed) 0
Source: Little Data Book on Financial Inclusion (Global Findex-2015)
Financial Inclusion Indicators from 2011 to 2014 Table 3: Descriptive Statistics on Financial Inclusion Indicators by Period of Time
Between 2011 & 2014
Financial Inclusion Indicators N Mean Std. Deviation
Std. Error Mean
Ownership of Accounts 2011 83 45.6711 31.30310 3.43596
2014 83 52.5843 31.05523 3.40875
Debit Card Users 2011 83 31.3795 28.66650 3.14656
2014 83 37.9699 30.11278 3.30531
Savings Account 2011 83 19.5386 17.05880 1.87245
2014 83 22.7566 18.22943 2.00094
Credit Account 2011 83 10.5554 6.31833 .69353
83 12.3602 7.01481 .76998
Source: Little Data Book on Financial Inclusion (Global Findex-2015)
8ADMAA
Volume 1 Issue 1 2016
Amity Journal of Management Research
AJMR
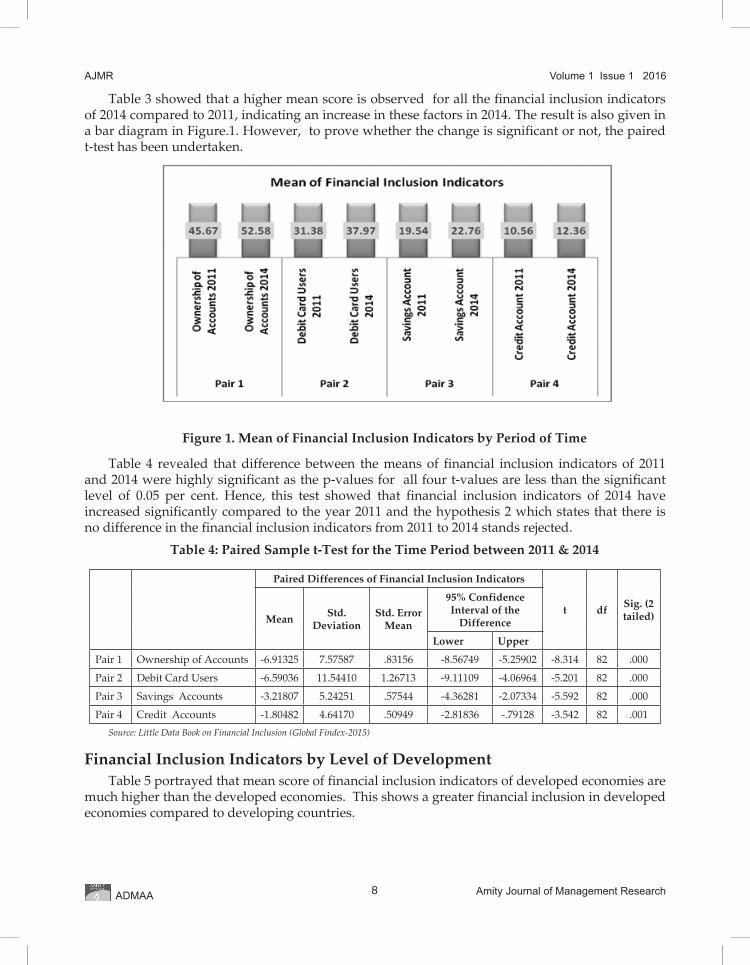
Table 3 showed that a higher mean score is observed for all the financial inclusion indicators of 2014 compared to 2011, indicating an increase in these factors in 2014. The result is also given in a bar diagram in Figure.1. However, to prove whether the change is significant or not, the paired t-test has been undertaken.
Figure 1. Mean of Financial Inclusion Indicators by Period of Time
Table 4 revealed that difference between the means of financial inclusion indicators of 2011 and 2014 were highly significant as the p-values for all four t-values are less than the significant level of 0.05 per cent. Hence, this test showed that financial inclusion indicators of 2014 have increased significantly compared to the year 2011 and the hypothesis 2 which states that there is no difference in the financial inclusion indicators from 2011 to 2014 stands rejected.
Table 4: Paired Sample t-Test for the Time Period between 2011 & 2014
Paired Differences of Financial Inclusion Indicators
t dfSig. (2 tailed)Mean
Std. Deviation
Std. Error Mean
95% Confidence Interval of the
Difference
Lower Upper
Pair 1 Ownership of Accounts -6.91325 7.57587 .83156 -8.56749 -5.25902 -8.314 82 .000
Pair 2 Debit Card Users -6.59036 11.54410 1.26713 -9.11109 -4.06964 -5.201 82 .000
Pair 3 Savings Accounts -3.21807 5.24251 .57544 -4.36281 -2.07334 -5.592 82 .000
Pair 4 Credit Accounts -1.80482 4.64170 .50949 -2.81836 -.79128 -3.542 82 .001
Source: Little Data Book on Financial Inclusion (Global Findex-2015)
Financial Inclusion Indicators by Level of DevelopmentTable 5 portrayed that mean score of financial inclusion indicators of developed economies are
much higher than the developed economies. This shows a greater financial inclusion in developed economies compared to developing countries.
9
Volume 1 Issue 1 2016
Amity Journal of Management Research
AJMR
ADMAA
Table 5: Descriptive Statistic of Financial Inclusion Indicator by Level of Development
Financial Inclusion Indicators
Level of Development N Mean Std. Deviation Std. Error Mean
Ownership of Accounts
Developed 21 85.2286 20.61917 4.49947
Developing 62 32.2726 21.36973 2.71396
Debit card UsersDeveloped 21 65.6667 27.65638 6.03512
Developing 62 19.7661 17.66618 2.24361
Savings in Financial Institutions
Developed 21 39.4429 18.20721 3.97314
Developing 62 12.7968 9.99538 1.26941
Credit from Financial Institutions
Developed 21 12.6571 6.09414 1.32985
Developing 62 9.8435 6.28111 0.79770
Source: Little Data Book on Financial Inclusion (Global Findex 2015)
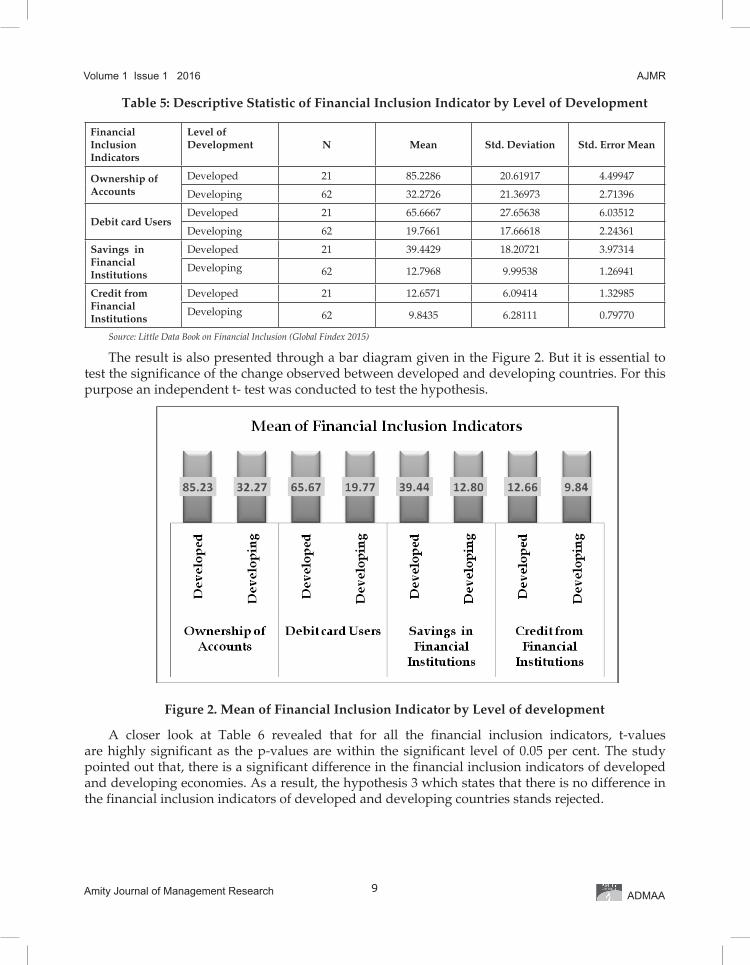
The result is also presented through a bar diagram given in the Figure 2. But it is essential to test the significance of the change observed between developed and developing countries. For this purpose an independent t- test was conducted to test the hypothesis.
Figure 2. Mean of Financial Inclusion Indicator by Level of development
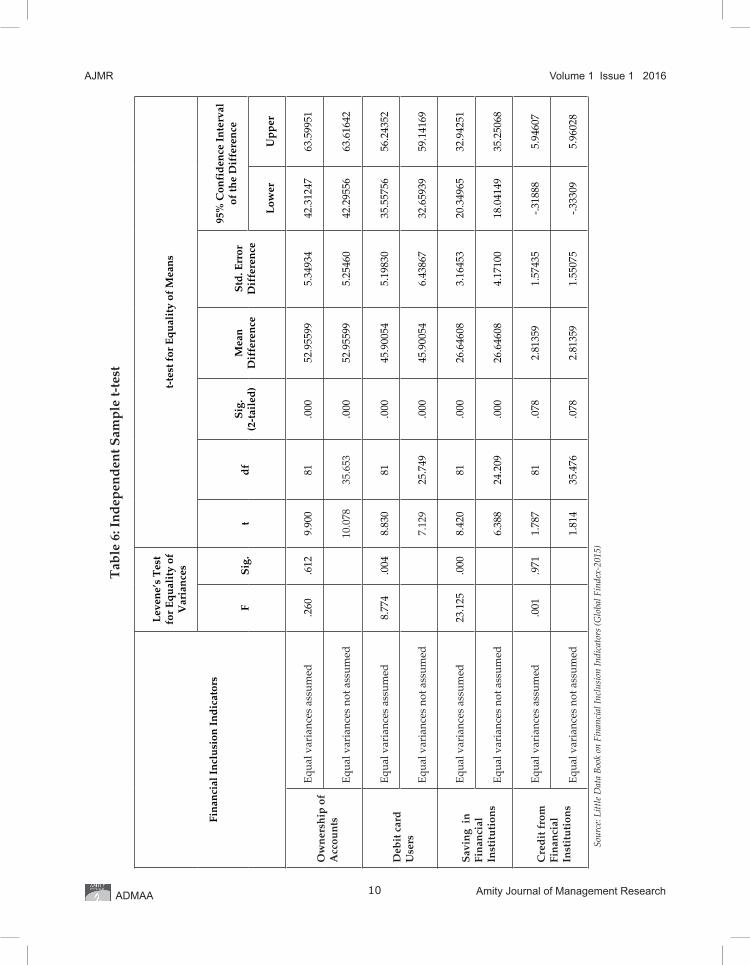
A closer look at Table 6 revealed that for all the financial inclusion indicators, t-values are highly significant as the p-values are within the significant level of 0.05 per cent. The study pointed out that, there is a significant difference in the financial inclusion indicators of developed and developing economies. As a result, the hypothesis 3 which states that there is no difference in the financial inclusion indicators of developed and developing countries stands rejected.
10ADMAA
Volume 1 Issue 1 2016
Amity Journal of Management Research
AJMR
Tab
le 6
: In
dep
end
ent S
amp
le t-
test
Fin
anci
al I
ncl
usi
on I
nd
icat
ors
Lev
ene’
s T
est
for
Eq
ual
ity
of
Var
ian
ces
t-te
st f
or E
qu
alit
y of
Mea
ns
FS
ig.
td
fS
ig.
(2-t
aile
d)
Mea
n
Dif
fere
nce
Std
. Err
or
Dif
fere
nce
95%
Con
fid
ence
In
terv
al
of th
e D
iffe
ren
ce
Low
erU
pp
er
Ow
ner
ship
of
Acc
oun
ts
Equ
al v
aria
nces
ass
umed
.260
.612
9.90
081
.000
52.9
5599
5.34
934
42.3
1247
63.5
9951
Equ
al v
aria
nces
not
ass
umed
10.0
7835
.653
.000
52.9
5599
5.25
460
42.2
9556
63.6
1642
Deb
it c
ard
U
sers
Equ
al v
aria
nces
ass
umed
8.77
4.0
048.
830
81.0
0045
.900
545.
1983
035
.557
5656
.243
52
Equ
al v
aria
nces
not
ass
umed
7.12
925
.749
.000
45.9
0054
6.43
867
32.6
5939
59.1
4169
Sav
ing
in
Fin
anci
al
Inst
itu
tion
s
Equ
al v
aria
nces
ass
umed
23.1
25.0
008.
420
81.0
0026
.646
083.
1645
320
.349
6532
.942
51
Equ
al v
aria
nces
not
ass
umed
6.38
824
.209
.000
26.6
4608
4.17
100
18.0
4149
35.2
5068
Cre
dit
fro
m
Fin
anci
al
Inst
itu
tion
s
Equ
al v
aria
nces
ass
umed
.001
.971
1.78
781
.078
2.81
359
1.57
435
-.318
885.
9460
7
Equ
al v
aria
nces
not
ass
umed
1.81
435
.476
.078
2.81
359
1.55
075
-.333
095.
9602
8
Sour
ce: L
ittl
e D
ata
Boo
k on
Fin
anci
al In
clus
ion
Indi
cato
rs (G
loba
l Fin
dex-
2015
)
11
Volume 1 Issue 1 2016
Amity Journal of Management Research
AJMR
ADMAA
Findings of the StudyThe study hinted at the fact that the favourable changes in all four financial inclusion
indicators by period of time are commendable. The paired sample t-test result revealed that there is a significant difference in the means of financial inclusion indicators from 2011 to 2014, indicating a progress in financial inclusion during this period.
But the Independent t-test conducted to compare the difference in the financial inclusion indicators by level of development of economies, showed a significant difference in the financial inclusion penetration. In short developed economies are better financially included than developing economies. A vast difference in the means of ownership of account in a financial institution is observed in developed countries (85.23) compared to developing countries (32.27) but by period of time, there is no significant difference. Another important result is that means of debit card users are more in developed economies (65.67) as compared to developing economies (19.77), as in the case of ownership of accounts. An analysis on the credit availability from financial institutions, it found that credit accounts are higher in developed economies compared to developing ones and the difference is significant as the p-value is less than the significant value of 0.05.
Further DiscussionFinancial inclusion has become favourite area of research at regional, national, and
international levels based on the data published by the various forums. Several studies have come up with socio-economic determinants at micro and macro levels that influence financial inclusion process. Moreover, extensive trials are on to find apt models of financial inclusion that bring about more people to the formal banking sector at the earliest. Evidences showed that economies with increased income equality have lower levels of financial inclusion. The present study also confirm to the fact that economies with greater GNI have higher number of ownership of accounts, savings and greater access to credit. Hence, financial inclusion process, in true sense, should have a multifaceted approach, achieved by multiple focuses, multiple plans and multiple players. All the resources and efforts should be directed to improve the socio-economic scenario, financial infrastructure, the financial education of the people and the financial stability of the nation simultaneously but not as a piecework.
Limitations of the StudyAlthough the present study is a cross-country analysis with new perspective of comparing
status of financial inclusion indicators by period and by level of development, it is not free from limitations. One of the drawbacks this paper to be acknowledged is that the study is based on the secondary data of two periods. Secondly, an attempt was made to present a comprehensive view of the financial inclusion status of economies through various models like bank-led models, ICT-based models and mobile-based models. The study had to be limited to financial institutions defined in the Global Findex database due to the non-availability of the data of many economies.
Scope for Further StudyAreas which could be further explored in the light of these findings would be to conduct a
study on the impact of Gross National Income on the financial inclusion indicators through all-inclusive models which have emerged till date to accelerate the spread and depth of financial inclusion.
12ADMAA
Volume 1 Issue 1 2016
Amity Journal of Management Research
AJMR
Conclusion Financial inclusion, a global goal, has attained a commendable progress in terms of
ownership of accounts and debit card users. The technology deployment and new models of financial inclusion have quickened the penetration of financial services among the low-income groups across the globe. The study indicated that the first step of ‘connecting people to the formal banking institutions’ is progressing but yet to achieve steam. Even after a decade of resolute efforts for financial inclusiveness, there is a financial penetration gap among the continents and economies, for instance the ownership of accounts in Euro Area is 94.8 per cent and in Asian developing countries is only 27 per cent. The banking sector all over the world is striving for financial stability and integrity but are challenged by the benchmarks laid down for their performance at national and international levels. But the real yardstick for a formal financial institution is the expertise to reach out to the unbanked and under-banked with suitable products especially credit for livelihood and emergencies while attracting and retaining the high net wealth customers.
ReferencesAyyagari, M., & Beck, T. (2015). Financial inclusion in Asia: an overview (ABD working paper Series No.449).
Retrieved from https://knrajlibrary.wordpress.com/2015/09/17/financial-inclusion-in-asia-an-overview.
GPFI. (2015). G20 Financial Inclusion Action Plan Financial Inclusion Experts Group. Retrieved 2015, from http://www.gpfi.org/sites/default/files/documents/G20%20Financial%20Inclusion%20Action%20Plan.docx.pdf
Indira, I. (2015). Financial inclusion need for differentiation between access and use. Economic and Political Weekly, 50(7), 19-20.
ISI. (2014). Developing countries. Retrieved October 5, 2015, from International Statistical Institute: http://www.isi-web.org/component/content/article/5-root/root/81-developing.
Levin, R. (2005). Finance and growth: theory and evidence: handbook of economic growth. Retrieved April 12, 2014, from National Bureau of Economic Research Organisation: http://www.nber.org/papers/w10766.pdf.
Sarma, M. (2010). Discussion papers in economics- index of financial inclusion. Retrieved August 3, 2013, from Centre for International Trade and Development School of International Studies Jawaharlal Nehru University: http://www.jnu.ac.in/sis/citd/DiscussionPapers/DP05_2010.pdf.
Singh, K., & Kodan, S. A. (2011). Financial inclusion development and its determinants: an empirical evidence of indian states. The Asian Economic Review, 53(1), 115-133.
Srinivasan, N. (2013). Micro finance india-state of the sector report 2012. New Delhi: Access Publications.
UN. (2014). World economic situation and prospects 2014. Retrieved August 23, 2015, from United Nations: http://www.un.org/en/development/desa/policy/wesp/wesp_archive/wesp2014.pdf.
Van De Werff, D. A., Hogarth, J. M., & Peach, D. N. (2013). A cross- country analysis of financial inclusion with the oecd. 59, 1-12, Retrieved December 26, 2015, from Americal Council on Consumer Interest: http://www.consumerinterests.org/assets/docs/CIA/CIA2013/OralSess2013/a%20cross%20country%20analysis%20of%20unbanked%20within%20the%20oecd%20-van%20der%20werff%20hogarth%20peach.pdf.
World Bank. (2015). Retrieved June 15, 2015, from http://data.worldbank.org/products/data-books/little-data-book-on-financial-inclusion.
13
Volume 1 Issue 1 2016
Amity Journal of Management Research
AJMR
ADMAA
APP
END
IX-1
Glo
bal F
inde
x D
atab
ase
on F
inan
cial
Incl
usio
n In
dica
tors
Prof
ile o
f Sel
ecte
d E
cono
mie
s20
1120
14
Sl.N
oE
cono
mie
sL
evel
of
Dev
elop
men
tG
NI $
m
illio
n%
of A
/Cs
Deb
it
Car
dS
avin
gC
red
it%
of
A/C
sD
ebit
Car
dS
avin
gC
red
it
1L
IK
enya
Dev
elop
ing
1160
42.0
030
.00
23.0
010
.00
55.2
034
.70
30.2
014
.90
2L
IU
gand
aD
evel
opin
g60
021
.00
10.0
016
.00
9.00
27.5
017
.80
16.8
015
.70
3L
IB
angl
ades
hD
evel
opin
g10
1032
.00
2.00
17.0
023
.00
29.1
05.
207.
409.
904
LI
Nep
alD
evel
opin
g73
025
.00
4.00
10.0
011
.00
33.8
06.
7016
.40
11.9
05
LI
Bur
kina
Fas
oD
evel
opin
g75
017
.00
9.00
8.00
9.00
13.4
04.
308.
707.
906
LI
Mal
awi
Dev
elop
ing
270
16.5
09.
408.
209.
2016
.10
11.7
07.
106.
007
LI
Rw
and
aD
evel
opin
g63
032
.80
5.30
17.8
08.
4038
.10
4.50
25.5
08.
208
LI
Tan
zani
aD
evel
opin
g86
017
.30
12.0
011
.90
6.60
19.0
011
.50
9.00
6.50
9L
IG
uine
aD
evel
opin
g46
03.
702.
302.
002.
406.
203.
702.
902.
0010
LI
Mad
agas
car
Dev
elop
ing
440
5.50
0.90
1.40
2.30
5.70
1.60
3.30
2.00
11L
IT
ajik
ista
nD
evel
opin
g99
02.
501.
800.
304.
8011
.50
4.20
1.50
3.80
12L
IC
had
Dev
elop
ing
1030
9.00
5.30
6.80
6.20
7.70
2.80
4.60
2.40
13L
IH
aiti
Dev
elop
ing
810
22.0
02.
7018
.00
8.30
17.5
04.
109.
404.
6014
LI
Cam
bod
iaD
evel
opin
g95
03.
702.
900.
8019
.50
12.6
05.
403.
6027
.70
15L
IM
ali
Dev
elop
ing
670
8.20
1.80
4.50
3.70
13.3
04.
002.
902.
7016
LI
Bur
und
iD
evel
opin
g26
07.
200.
803.
301.
706.
901.
304.
001.
5017
LI
Alg
eria
Dev
elop
ing
5330
33.3
013
.50
4.30
1.50
50.5
021
.60
13.8
02.
2018
LI
Afg
hani
stan
Dev
elop
ing
690
9.00
4.70
2.80
7.40
10.0
01.
703.
603.
6019
LM
IG
eorg
iaD
evel
opin
g35
6033
.00
20.2
01.
0011
.00
39.7
03.
701.
003.
7020
LM
IC
amer
oon
Dev
elop
ing
1290
15.0
02.
0010
.00
5.00
11.4
06.
107.
709.
9021
LM
IN
iger
iaD
evel
opin
g27
1030
.00
19.0
024
.00
2.00
44.2
035
.60
27.1
05.
3022
LM
IIn
dia
Dev
elop
ing
1570
35.0
08.
0012
.00
8.00
52.8
022
.10
14.4
06.
4023
LM
IG
hana
Dev
elop
ing
1060
29.4
011
.40
16.1
05.
8020
.40
11.3
010
.60
7.70
24L
MI
Gua
tem
ala
Dev
elop
ing
1770
22.3
013
.00
10.2
013
.70
34.6
09.
8018
.60
8.10
25L
MI
Arm
enia
Dev
elop
ing
3340
17.5
05.
200.
8018
.90
40.8
016
.20
15.1
012
.30
26L
MI
Zam
bia
Dev
elop
ing
3800
21.4
015
.70
11.8
06.
1017
.20
8.40
1.60
19.9
027
LM
IM
old
ova
Dev
elop
ing
1810
18.1
016
.00
3.50
6.40
31.3
018
.70
16.8
04.
8028
LM
IM
ongo
liaD
evel
opin
g24
7077
.70
60.6
023
.20
24.8
017
.80
15.8
06.
806.
6029
LM
IPa
kist
anD
evel
opin
g37
7010
.30
2.90
1.40
1.60
91.8
065
.70
33.2
023
.20
(Con
tinu
ed...
)
14ADMAA
Volume 1 Issue 1 2016
Amity Journal of Management Research
AJMR30
LM
IB
oliv
iaD
evel
opin
g13
6028
.00
12.8
017
.10
16.6
08.
702.
903.
301.
5031
LM
IH
ond
uras
Dev
elop
ing
2550
20.5
011
.10
8.50
1.40
40.7
023
.10
23.5
019
.70
32L
MI
Sri L
anka
Dev
elop
ing
2180
69.0
010
.00
28.0
018
.00
30.0
014
.20
14.5
09.
7033
LM
IIn
don
esia
Dev
elop
ing
3170
20.0
026
.00
15.0
09.
0082
.70
24.9
030
.90
17.9
034
LM
IU
krai
neD
evel
opin
g35
8041
.30
33.6
05.
408.
1035
.90
25.9
026
.60
13.1
035
LM
IV
ietn
amD
evel
opin
g39
6021
.00
15.0
08.
0016
.00
52.7
024
.60
7.80
8.30
36L
MI
El-
Salv
ador
Dev
elop
ing
1740
14.0
011
.00
13.0
017
.00
30.9
026
.50
14.6
018
.40
37U
MI
Tha
iland
Dev
elop
ing
3720
73.0
043
.00
43.0
019
.00
34.6
021
.80
14.0
03.
9038
UM
ISo
uth
Afr
ica
Dev
elop
ing
5340
54.0
045
.00
22.0
09.
0078
.10
54.8
040
.60
15.4
039
UM
IM
auri
tius
Dev
elop
ing
7410
80.0
051
.00
31.0
014
.00
68.8
054
.90
32.7
012
.10
40U
MI
Rom
ania
Dev
elop
ing
9570
45.0
028
.00
9.00
8.00
82.2
062
.00
35.5
017
.10
41U
MI
Jord
anD
evel
opin
g90
5026
.00
15.0
08.
005.
0060
.80
45.8
013
.30
11.8
042
UM
IB
razi
lD
evel
opin
g13
260
56.0
041
.00
10.0
06.
0072
.30
59.9
019
.30
8.70
43U
MI
Chi
naD
evel
opin
g49
5064
.00
41.0
032
.00
7.00
24.6
019
.10
3.80
13.6
044
UM
IA
zerb
aija
nD
evel
opin
g11
690
14.9
010
.00
1.60
17.7
068
.10
59.2
012
.30
11.9
045
UM
IPh
ilipp
ians
Dev
elop
ing
6560
26.6
013
.20
14.7
010
.50
78.9
048
.60
41.2
09.
6046
UM
IT
urke
yD
evel
opin
g73
5057
.60
56.6
04.
204.
6029
.20
15.7
05.
3018
.90
47U
MI
Mal
aysi
aD
evel
opin
g32
7066
.20
23.1
035
.40
11.2
028
.10
20.5
014
.80
11.8
048
UM
IIr
an Is
lam
ic R
epD
evel
opin
g10
970
73.7
058
.30
19.7
030
.70
56.5
043
.30
9.10
20.0
049
UM
IB
otsw
ana
Dev
elop
ing
1043
030
.30
15.6
016
.50
5.60
80.7
041
.20
33.8
019
.50
50U
MI
Jam
aica
Dev
elop
ing
5780
71.0
041
.10
30.4
07.
9092
.20
75.1
021
.60
31.6
051
UM
IPe
ruD
evel
opin
g77
7020
.50
14.1
08.
6012
.70
49.2
035
.10
26.6
013
.00
52U
MI
Ven
ezue
laD
evel
opin
g52
2044
.10
35.1
013
.60
1.70
78.3
045
.00
29.7
011
.10
53U
MI
Col
ombi
aD
evel
opin
g75
9030
.40
22.7
09.
2011
.90
29.0
021
.40
12.3
011
.20
54U
MI
Mex
ico
Dev
elop
ing
1255
027
.40
22.3
06.
707.
6056
.90
49.6
022
.80
2.00
55U
MI
Tun
isia
Dev
elop
ing
7590
32.2
021
.00
5.00
3.20
38.4
030
.00
12.3
015
.60
56U
MI
Alb
ania
Dev
elop
ing
9940
28.3
021
.10
8.60
7.50
38.7
026
.80
14.5
010
.40
57U
MI
Cos
ta R
ica
Dev
elop
ing
4200
50.4
043
.80
19.9
010
.00
27.3
012
.30
10.3
08.
0058
UM
IPa
nam
aD
evel
opin
g45
1024
.90
11.3
012
.50
9.80
38.0
021
.80
7.50
10.2
059
UM
IPe
ruD
evel
opin
g95
5020
.50
14.1
08.
6012
.70
64.4
053
.60
24.2
012
.70
60H
IU
rugu
ayD
evel
opin
g10
700
23.5
016
.40
5.70
14.8
043
.40
25.3
020
.40
11.8
061
HI
Chi
leD
evel
opin
g62
7042
.20
25.8
012
.40
7.80
29.0
021
.40
12.3
011
.20
62L
MI
Mau
rita
nia
Dev
elop
ed65
400
17.5
06.
306.
407.
9098
.90
88.9
061
.40
23.4
063
UM
IH
ungr
yD
evel
oped
4633
073
.00
62.0
017
.00
9.00
96.6
088
.10
60.4
07.
9064
HI
Aus
tral
iaD
evel
oped
4513
099
.10
79.1
062
.00
17.0
072
.90
70.3
025
.50
14.1
065
HI
Japa
nD
evel
oped
4168
096
.00
13.0
051
.00
6.00
98.9
096
.40
52.3
021
.10
66H
IK
uwai
tD
evel
opin
g20
980
87.0
084
.00
40.0
021
.00
96.3
078
.50
41.6
09.
50
(Con
tinu
ed...
)
15
Volume 1 Issue 1 2016
Amity Journal of Management Research
AJMR
ADMAA
67H
IU
KD
evel
oped
5106
097
.00
88.0
044
.00
12.0
099
.30
98.4
058
.90
12.6
0
68H
IM
alta
Dev
elop
ed48
820
95.0
071
.00
45.0
010
.00
100.
0096
.70
57.0
021
.60
69H
IN
ethe
rlan
ds
Dev
elop
ed48
820
99.0
098
.00
58.0
013
.00
98.1
093
.60
55.5
015
.80
70H
IFi
nlan
dD
evel
oped
2994
010
0.00
89.0
056
.00
24.0
097
.60
82.6
048
.10
18.0
0
71H
IB
elgi
umD
evel
oped
2127
096
.00
86.0
043
.00
11.0
087
.40
66.7
024
.90
9.50
72H
ISp
ain
Dev
elop
ed13
240
93.3
062
.20
35.0
011
.40
77.9
049
.50
20.8
018
.90
73H
IPo
rtug
alD
evel
oped
4725
081
.20
68.2
025
.60
8.30
98.8
092
.00
57.9
018
.60
74H
IPo
land
Dev
elop
ed35
760
70.2
037
.30
18.0
09.
6099
.50
95.5
070
.60
32.5
0
75H
IG
erm
any
Dev
elop
ed43
520
98.1
088
.00
55.9
012
.50
96.6
081
.10
52.2
015
.10
76H
IN
ew Z
eala
ndD
evel
oped
5039
099
.40
93.8
060
.40
26.6
096
.70
81.6
060
.40
13.3
0
77H
IFr
ance
Dev
elop
ed22
690
97.0
069
.20
49.5
018
.60
87.5
055
.10
12.6
010
.20
78H
IA
ustr
iaD
evel
oped
5347
097
.10
86.8
051
.60
8.30
93.6
076
.20
54.1
023
.30
79H
IG
reec
eD
evel
oped
1523
077
.90
34.0
019
.90
7.90
63.3
054
.10
15.0
015
.60
80H
IU
SAD
evel
oped
1385
088
.00
86.9
050
.40
20.1
067
.40
44.3
015
.50
10.3
0
81H
IR
ussi
an F
eder
atio
nD
evel
oped
1518
048
.20
37.0
010
.90
7.70
45.4
037
.70
12.5
021
.00
82H
IC
anad
aD
evel
oped
5221
095
.80
88.0
053
.20
20.3
099
.10
93.2
062
.60
27.0
0
83H
IIt
aly
Dev
elop
ed35
620
71.0
035
.215
.54.
687
.30
64.5
034
.00
13.5
0
16ADMAA
Volume 1 Issue 1 2016
Amity Journal of Management Research
AJMR
Authors’ Profile
Sr Usha A A, is an Assistant Professor in Commerce and has seven years of teaching experience. She is currently pursuing Ph.D degree in Mahatma Gandhi University, Kottayam, India. She has presented five papers in national and international seminars and has published five research articles in various research journals.
B Johnson, is an Associate Professor in Department of Commerce & Management Studies at MG University, Kottayam, India. He has 30 years of teaching experience and 22 years of research experience and expertise. He has supervised six M.Phil studies in University of Calicut and guided five PhDs in University of Kerala. He has presented 75 papers in national and international seminars and conferences. He has 57 research papers to his credit.