Embed Size (px)
Citation preview

From the desk. To the bench. To the bedside.
UERMemorial Medical Center, Inc.Research Institutefor Health Sciences
M
Student edition
ISSN 2244-4378 e-ISSN 2408-302X
Vol. 9 no. 2 July - december 2020

The HEALTH SCIENCES JOURNAL is published by the
University of the East Ramon Magsaysay Memorial Medical Center, Inc.Research Institute for Health Sciences
Ester A. Garcia, PhDPresident, UERMMMCI
Jennifer M. Nailes, MD, MSPHVice President for Research
EDITOR-IN-CHIEFJose D. Quebral, MD
ASSOCIATE EDITORSJennifer M. Nailes, MD, MSPHGlenn D. Marinas, MD, MSPH
Camille B. Angeles, MDRamon Jason M. Javier, MD, MSTMJose Ronilo G. Juangco, MD, MPH
Melissa Paulita V. Mariano, MDMaria Teresa S. Tolosa, MD, DipCE
CIRCULATION MANAGERMa. Juliana N. Gasmen, MLIS, RL
EDITORIAL ASSISTANTNelson P. Cayno
PEER REVIEWERS
Luis E. Abola, MDGastroenterology
Sherlyne A. Acosta, PhDSocial Science
Rajawen C. Africa, PTRP, MSSpEd(c)Physical Therapy
Jeffrey B. Alava, PTRPPhysical Therapy
Rosalina P. Anastacio, MDPediatric Hematology
Natividad Estrella Andaya, PTRPPhysical Therapy
Cynthia Ang-Muñoz, MD, MScRehabilitation Medicine
Wilhelmina Z. Atos, RN, PhDNursing
Romarico Rommel M. Azores, MDColorectal Surgery
Juliet J. Balderas, MDPediatric Cardiology
Milagros S. Bautista, MDPediatric Pulmonology
Benjamin B. Bince, MDDermatology
Renato S. Bondoc, MDThoracic Surgery
Salvador E. Brodit, Jr., MD, MA, MPAAnesthesiology and Pain Medicine
Josephine R. Bundoc, MDRehabilitation Medicine
Raquel S. Cabazor, MD, MSPHRehabilitation Medicine
Maria Minverva P. Calimag, MD, MSc, PhDAnesthesiologyClinical EpidemiologyEducational Management and Leadership
Renato M. Carlos, MDRadiology
Alberto T. Chua, MDNephrology
Juan Maria Ibarra O. Co, MDEndocrinology
Lilli May T. Cole, MDGynecologic Oncology
James Alfred P. Danganan, PTRP, MEMPhysical Therapy
Elmer M. Garcia, MDPulmunology
Virgilio R. de Gracia, MDOtorhinolaryngology
Jose Luis G. de Grano, MDOphthalmology
Maribeth T. de los Santos, MD, MSPHCardiology
John Christopher A. De Luna, PTRP, MSPHPhysical Therapy
Carmelita C. Divinagracia, RN, MAN, PhDNursing
Ivy Mae S. Escasa, MDHematology
Luis Emmanuel O. Esguerra, MDAnatomy
Jennifer C. Espinosa, PTRP, MSAHPPhysical Therapy
Joselyn A. Eusebio, MDDevelopmental Pediatrics
Gracieux Y. Fernando, MD, MHPEdMedical Oncology
Olivia C. Flores, MD, MEMAnesthesiology
Benida A. Fontanilla, MD, MBA, MSTMMicrobiology & Parasitology
Ruby N. Foronda, MDPediatric Immunology & Allergy
Maria Cristina Gerolia-Alava, PTRPPhysical Therapy
Cecilio S. Hipolito, Jr., MDSurgical Oncology
Araceli P. Jacoba, MDPathology
James B. Joaquino, MDPlastic & Reconstructive Surgery
Odette S. Justo, PTRP, MRSPhysical Therapy
Ronald P. Law, MD, MPHPublic Health & Disaster Management
Efren C. Laxamana, MD, MBA, PhDMedical Education / Ophthalmology
Maria Milagros U. Magat, MD, MEMBiochemistry
Celine Ivie Manuel-Altarejos, PTRP, MSPHPhysical Therapy
Gabriel L. Martinez, MDTrauma
Miguel C. Mendoza, MDMinimally Invasive Surgery
Suzette M. Mendoza, MD, MHSEMedical Education
Susan P. Nagtalon, MD, MSPHObstetrics & Gynecology
Nadia A. Pablo-Tedder, PTRPPhysical Therapy
Celso Pagatpatan, Jr., MSN, DrPHNursing
Yves Y. Palad, PTRP, MSPHPhysical Therapy
Erlinda C. Palaganas, RN, MPH, PhDNursing
Mario M. Panaligan, MDAdult Infectious Diseases
Georgina T. Paredes, MD, MPHPreventive & Community Medicine
Beatriz P. Quiambao, MDPediatric Infectious Diseases
Milagros B. Rabe, MD, MSc, PhDPhysiology
Ignacio V. Rivera, MDPediatric Neurology
Hilda M. Sagayaga, MDVascular & Transplant Surgery
Jose B. Salazar, MD, MSPHNeonatology
Jose Antonio M. Salud, MD, MHAHepatobiliary Surgery
Carmelita R. Salvador, MAEd-ASGeneral Education
Amado M. San Luis, MD, MPHAdult Neurology / Palliative Care
Fria Rose Santos-De Luna, PTRP, MSPHPhysical Therapy
Vanessa L. Sardan, PTRP, MSPHPhysical Therapy
Isidro C. Sia, MD, PhDHerbal Medicine
Josephine Y. Sunga, MDPediatrics
Paul Anthony L. Sunga, MDUrology
Alfred L. Tan, MDNeurosurgery
Carolina Linda L. Tapia, MD, MPHPreventive & Community Medicine
Maria Petrina S. Zotomayor, MDPharmacology
Ricardo C. Zotomayor, MDPulmonology
Contents
A comparison of the levels of earthquake awareness and preparedness in a high risk and low risk barangayJanine Alyanna O. See, MD; Lorraine C. Rivera, MD; Iñigo Teodoro G. Santos, MD; Kristin Janina C. Santos, MD; Maebellene Grace R. Santos, MD; Niña Angelieksa V. Sarmiento, Randulfo Erald G. Sese, MD; Shannon Petrina Sie, MD; Bernadine N. Urbano, MD; Jennifer M. Nailes, MD, MSPH; and Jose D. Quebral, MD
A narrative analysis on stories of underage smoking initiation among public school childrenChrista R. Baniqued, Stephanie I. Barbers, Daniel K. Bañas, Marianne G. Bangloy, Noel B. Bautista, Katrina M. Barretto, Kevin R. Base, Jeremae D. Bassig, Krisha F. Batalla, Alyssa F. Bautista, Trizia E. Bautista, Sean C. Belo, Joseph C. Beloso, Kristian M. Bercero, and Franciosa Gavino-Collins, MD, MPH
Correlation of family function and the quality of life of young adults with chronically-ill siblingsAezrile A. Ignacio, Kimberly T. Huplo, RN, Danielle Camille A. Ignacio, Shari L. Guerra, Vanessa Angelica D. Gulla, Alain Francis A. Guloy, Erickson P. Gudelano III, Alayssa Katrina Marie P. Ilagan, RN, Ada Marielle B. Ignacio, RMT, Micah Raphaela C. Guerrero, Camille Mariz P. Guerrero, John Adrian Gelino M. Guibone, and Maria Teresa S. Tolosa, MD, DClinEp
A study on the knowledge, attitude and behavior regarding mental health of residents in a selected barangayRichard Dean Clod C. Dela Cruz, Kelvin Michael G. Dela Cruz, Micah Jeanne A. Dela Rosa, Maria Kristina P. Descalzo, Andrew Carlo F. Dioso, Angelica Mae Camille P. Dizon, Ellen Stephanie M. Dizon, Vince Gabriel B. Dulay, Justine William T. Duran, Felicitas Asuncion C. Elago, Nicole Pauline L. Ereño, Angela B. Escobia, Karl Lorenzo Miguel M. Escovidal, Miraflor A. Espeleta, and Franciosa Gavino-Collins, MD, MPH
Correlation between incidence of dengue and climatic factors in the Philippines: An ecological studyAnn Kashmer D. Yu, Sophia Isabel E. Ytienza, Airees Mae D. Yu, Vincent Christopher S. Yu, Keith Alexius K. Wangkay, Maria Antonia R. Wong, Marielle Alyanna B. Zamudio, Eljine Mae T. Zhang, Wally D. Yumul, Zakhira Maye R. Zipagan, Arianna Krystelle R. Yaranon, Jake Byron C. Zapanta, Gija B. Ysip, and Catherine Danielle Duque-Lee, MD, MMHA
31
38
46
53
60

DISCLAIMER
The articles in this Health Sciences Journal are for general informational purposes only. They are the products of research which may not have been tested or approved by the Food and Drug Ad-ministration (FDA). They are not intended as professional medical counsel or advice and should not be used as such. The reader should consult his/her health professional to obtain advice for his/her particular problem. The reader’s use of this Health Sciences Journal does not create a doctor-patient relationship between any of the authors and the reader. The University of the East Ramon Magsaysay Memorial Medical Center, Inc. (UERMMMCI) is not responsible for the contents of this Journal and does not necessarily sponsor, endorse or otherwise approve of the materials appearing herein. Furthermore, the opinions expressed in the materials in this Journal are the opinions of the individual authors and may not reflect the opinions of UER-MMMCI, its officers and the editors. Consequently, UERMMMCI and the Health Sciences Journal shall not be liable for any adverse or undesirable effects that may occur from the use of any of the substances, devices or procedures discussed in this Journal.

31 VOL. 9 NO. 2 • JULY - DECEMBER • UERM Health Sciences Journal
A comparison of the levels of earthquake awareness and preparedness in a high risk and low risk barangay Janine Alyanna O. See, MD; Lorraine C. Rivera, MD; Iñigo Teodoro G. Santos, MD; Kristin Janina C. Santos, MD; Maebellene Grace R. Santos, MD; Niña Angelieksa V. Sarmiento, Randulfo Erald G. Sese, MD; Shannon Petrina Sie, MD; Bernadine N. Urbano, MD; Jennifer M. Nailes, MD, MSPH; and Jose D. Quebral, MD
AbstractIntroduction Metro Manila is at risk from “the big one”, a magnitude 7.2 earthquake caused by the movement of the West Valley Fault, thus awareness and preparedness of the people are very important. The study compared the levels of earthquake awareness and preparedness of households in a high-risk area and a low risk area.Methods This was a cross-sectional study among 376 households each from a high- and a low-risk barangay in Metro Manila using a self-administered household-based survey questionnaire consisting of questions on awareness and preparedness. The prevalence of households classified as aware and well-prepared was computed; the significance of differences between the high- and low risk barangays was determined through Fisher’s exact test. Results There were fewer households classified as aware in the high-risk barangay compared with the low risk barangay, but the difference was not significant (PR = 0.98, 95% CI 0.84, 1.01, p = 0.078, Fisher’s exact test). Less than half of households were classified as well-prepared in both high- and low risk barangays (49.7 vs 46.5%) and the difference was not significant (PR = 1.07, 95% CI 0.92, 1.24, p = 0.422, Fisher’s exact test). Television was the most common source of information in both barangays. Households in the high-risk barangay were more likely to be well-prepared when a member was at least a high school graduate (PR = 2.54, 95% CI 1.24, 5.22, p = 0.001, Fisher’s exact test).Conclusion There was no difference in the levels of awareness and preparedness between high and low risk barangays. Television was the most common source of information in both high and low risk barangays. The presence of at least one high school graduate in the household from a high-risk barangay was associated with preparedness but not awareness.
Keywords: Earthquake awareness, earthquake preparedness, Valley Fault System, West Valley Fault
_________________
Correspondence: Jennifer M. Nailes, MD, MSPH, Department of Preventive and
Community Medicine, College of Medicine, University of the East Ramon Magsaysay Memorial Medical Center, Inc., 64 Aurora Boulevard, Barangay Doña Imelda, Quezon City, PH 1113; Email: [email protected]
Metro Manila is bound on the east by the West Valley Fault and on the west by the Manila
Trench in Manila Bay, making the area highly vulnerable to “the big one”, a magnitude 7.2 earth-quake that could strike anytime, affecting a large area of Luzon including Metro Manila. Based on the Metro Manila Earthquake Impact Reduction Study (MMEIRS), approximately 40% of the residential buildings in Metro Manila will collapse, causing 34,000 deaths and 114,000 injuries.1 The Philippine Institute of Volcanology and Seismology (PHIVOLCS) has released an earthquake preparedness guide that

32 UERM Health Sciences Journal • VOL. 9 NO. 2 • JULY - DECEMBER 2020
highlights the necessary steps to be undertaken before, during, and after an earthquake.2 These, along with the efforts of local government units in information dissemination, aim to raise awareness and encourage proactivity in local communities. The problem is imparting knowledge to the people who think that they are safe until an emergency or disaster strikes. Thus, the researchers proposed to investigate the levels of awareness and preparedness of the local community. The results of the study may add to the existing body of knowledge on the topic which would benefit the academe, the local community, as well as the government agencies tasked to implement programs for raising awareness and increasing responsiveness to such disasters. Results of this study may be used to map out areas that need more aggressive implementation of government programs, such as communities with a higher risk due to their location near a fault line. Furthermore, the findings may be used by government agencies to improve on the existing programs and methods of information dissemination, in order to more effectively reach and create an impact on the target audience. The study compared the levels of earthquake awareness and preparedness of households in a high-risk area and a low risk area. Specifically, the study aimed to determine sources of information about earthquake awareness and preparedness, and factors associated with household earthquake awareness and preparedness among high and low risk barangays.
Methods
The study employed a quantitative cross-sectional design to determine the level of earthquake awareness and preparedness in a high risk and low risk barangay in Metro Manila through a self-administered household-based survey. High-risk areas were identified as those within 10 km from a fault zone.3 By tracing the fault line and different mapping methods, 81 barangays were identified to be traversed by the fault system in Metro Manila and its nearby provinces. Barangay Batasan Hills in Quezon City was identified to be a high-risk area being 436 m away from the fault line, with the largest population that can possibly be affected by an earthquake. Barangay Gen. T. De Leon in Valenzuela City is 10.8 km away from the West Valley Fault as mapped out in 2013.4 Thus, it is considered as a low risk area for earthquakes.
All households in the two barangays were eligible for inclusion. A literate adult was required to be present at the time of the survey. Informal settlers who had no legal claim or were not registered in the barangay were excluded. A sample size of 376 per barangay was computed based on the Z-value for alpha error of 1.96, a desired precision of 0.05 at 95% confidence interval. Since this study called for the participation of two barangays, the total sample size was 752 households. Convenience sampling was employed in selecting the households that participated in the study. Demographic data on the households were collected, including information about the members of the household, their corresponding ages, sex and highest educational attainment, household income and previous exposure to ear thquake emergencies. The study was approved by the Ethics Review Committee. Permission was obtained from both barangays, and informed consent was obtained from all the respondents. Data on awareness and preparedness were collected through a 28-item questionnaire adapted from the Department of Education’s (DepEd) and Ardalan’s survey tools and was reviewed by an expert.5,6 Ardalan’s questionnaire had a Cronbach’s alpha of 0.7 and CVIs ranging from 0.80 to 0.100.6 Four questions in the study questionnaire were taken from Ardalan, and the remaining 24 questions came from the DepEd tool.5,6 Nineteen of the questions were answerable by ‘yes’ or ‘no’, eight required a short descriptive response, and the remaining one was a checklist of items that should be included an emergency kit. The questionnaire consisted of five parts: household characteristics, sources of information, before earthquake, during earthquake, and after earthquake and first shake. The items included under the earthquake categories were classified as either awareness-related or preparedness-related questions. Ten questions measured earthquake awareness while 18 measured earthquake preparedness. The items reflect the knowledge of households on what to do in case of an earthquake, as well as specific preparations for such an event. A respondent was considered to be aware if he/she correctly answered at least 8 out of 10 questions on awareness and well-prepared if he/she correctly answered at least 14 out of 18 questions on preparedness. Those who got less than 75% correct answers were classified as not aware and poorly prepared, respectively. The questionnaire was self-administered and answered by an adult member of the household.
Levels of earthquake awareness and preparedness in a high risk and low risk barangay

33 VOL. 9 NO. 2 • JULY - DECEMBER • UERM Health Sciences Journal
Data were encoded using Microsoft Excel and analyzed using IBM Statistical Package for the Social Sciences (SPSS) version 23 (IBM Corporation, NY, USA). Difference in population proportions of those who are aware and not aware, and those who are well-prepared and poorly prepared was determined using the Fisher’s exact test. Effect size was then determined using ratio, which allowed the researchers to determine the level of association between the variables. Both statistical analyses were employed for finding the difference in population proportions and magnitude of association between the dependent variables and other factors such as households with children and/or senior citizens, having at least a high school graduate in the household, and previous experience of an emergency due to earthquakes.
Results
A total of 752 responses were recorded - 376 each from Barangays Batasan Hills (high risk) and Gen. T. De Leon (low risk). The ratio of males to females was 1:1 in both barangays, 60% of the respondents were in the 18 to 59-year-old bracket and one-third were less than 18 years in both areas. Three of four households in both barangays had occupants below 18 years. A third of respondents in both barangays were high school graduates. The annual household income was not more than PHP 59,000 in 44 and 38% in the high and low risk barangays, respectively. Television was the source of information in more than 90% of households in both barangays. Two-thirds of households in Barangay Gen. T. De Leon had the internet as the second most common source of information on earthquake awareness and preparedness. Half of the households from both areas relied on radio as a source of information. Around 30% of households had a previous experience of an earthquake in both barangays. As shown in Table 1, the demographic characteristics of the two barangays are similar. The ratio of households classified as aware to not aware was 2:1 in the high-risk barangay and 3:1 in the low risk barangay. There were fewer households classified as aware in the high-risk barangay compared with the low risk barangay, but the difference was not significant (PR = 0.98, 95% CI 0.84, 1.01, p = 0.078, Fisher’s exact test). The mean awareness score in the high-risk barangay was lower (8.1 vs 8.4) as shown in Table 2. The ratio of households classified as well-
Table 1. Demographic characteristics of individual members in 376 households each in the high risk and low risk barangays. Demographic Characteristic High risk Low risk n (%) (n = 1860) (n = 1877) Sex Male 946 (50.9) 913 (48.6) Female 914 (49.1) 964 (51.4)
Age (year) < 18 638 (34.3) 660 (35.2) 18 - 59 1083 (58.2) 1071 (57.1) > 59 113 (6.1) 133 (7.1) Not reported 26 (1.4) 13 (0.7)
Households with occupants below 18 years 284 (75.5) 294 (78.2)
Highest educational attainment Elementary & below 428 (23.0) 459 (24.4) Elementary 262 (14.1) 187 (9.9) High School 583 (31.3) 540 (28.8) College, postgraduate 359 (19.3) 490 (26.1) No formal education 35 (1.9) 17 (0.9) Not reported 193 (10.4) 184 (9.8)
Annual income (PHP) ≤39,000 123(32.7) 98(26.1) 40,000 - 59,000 43 (11.4) 46 (12.2) 60,000 - 99,000 50 (13.3) 48 (12.8) 100,000 - 249,000 106 (28.2) 93 (24.7) ≥250,000 36(9.6) 62(16.5) Not reported 18 (4.8) 29 (7.7)
Source of information Print media 134 (35.7) 136 (36.2) Internet 21 (5.6) 239 (63.6) Radio 194 (51.6) 196 (52.1) Television 355 (94.4) 347 (92.3) Government campaigns 167 (44.4) 175 (46.5) School/Office 157 (41.8) 166 (44.1) Friends 125 (33.2) 127 (33.8)
Previous experience of earthquake emergency 119 (31.7) 127 (33.8)
prepared to poorly prepared was 1:1 in the high-risk barangay. Less than half of households were classified as well-prepared in both barangays; there were more well-prepared households in the high-risk barangay compared with the low risk barangay (49.7 vs 46.5%) but the difference was not significant (PR = 1.07, 95% CI 0.92, 1.24, p = 0.422, Fisher’s exact test). The mean preparedness scores in the two barangays were similar (12.9 vs 13.0) as shown in Table 2.
Levels of earthquake awareness and preparedness in a high risk and low risk barangay

34 UERM Health Sciences Journal • VOL. 9 NO. 2 • JULY - DECEMBER 2020
Households with at least a high school graduate in the high-risk barangay had a higher mean awareness score compared with households without at least a high school graduate (8.2 vs 7.3) as seen in Table 3. There were no differences in the mean awareness scores when the presence of senior members or children, and previous experience were considered. The mean preparedness scores were higher in households with at least a high school graduate both high and low risk barangays (13.1 vs 11.1 and 13.1 vs 11.9, respectively) as seen in Table 3. There were no differences in the mean preparedness scores when the presence of senior members or children, and previous experience were considered.
Table 2. Percentage of aware and well-prepared households in the high- and low risk barangays.
Risk level Awareness, n (%) Preparedness, n (%) Aware Not aware Mean score Well-prepared Poorly prepared Mean score
High 254 (67.6) 122 (32.4) 8.1 187 (49.7) 189 (50.3) 12.9Low 277 (73.7) 99 (26.3) 8.4 175 (46.5) 201 (53.4) 13.0PR 0.98 (95% CI 0.84, 1.01), p = 0.078* 1.07 (95% CI 0.92, 1.24), p = 0.422*
* Fisher’s exact testPR – Prevalence (risk) ratio
Table 3. Comparison of mean awareness and preparedness scores in different variables. Factor Awareness score Preparedness score
Presence of children/senior citizens High risk With 8.1 13.0 Without 8.0 12.7 Low risk With 8.4 13.0 Without 8.2 12.8
Level of education High risk At least HS graduate 8.2 13.1 No HS graduate 7.3 11.1 Low risk At least HS graduate 8.4 13.1 No HS graduate 8.4 11.9
Previous experience High risk With 8.1 12.9 Without 8.1 12.9 Low risk With 8.3 13.0 Without 8.4 12.9
In both high and low risk barangays, 80 to 90% of households in both aware and not aware, and well-prepared and poorly prepared groups had children and/or senior members. The presence of children and/or senior members was not a significant factor in the percentage of households in awareness and preparedness in both high and low risk barangays. In both high and low risk barangays, 80 to 95% of households in both aware and not aware, and well-prepared and poorly prepared groups had at least a high school graduate. As shown in Table 4, households in the high-risk barangay were 2 ½ times more likely to be well-prepared when a member was at least a high school graduate (PR = 2.54, 95% CI 1.24, 5.22, p = 0.001, Fisher’s exact test). In the low risk barangay, households with at least a high school graduate were 1 ½ times more likely to be well-prepared (PR = 1.52, 95% CI 0.78, 2.97, p = 0.247, Fisher’s exact test). The presence of at least a high school graduate was not a significant factor in the proportion of households in awareness in both high and low risk barangays. Previous experience of an earthquake emergency was not a significant factor in the proportion of households in awareness and preparedness in both high and low risk barangays. A lower percentage of respondents from the high-risk barangay correctly answered 8 of 10 questions on awareness. The highest percentage of correct answers were the items on awareness of the danger of returning to the house due to the possible effects of aftershocks (94.1 vs 88.8%), credible sources of information (90.7 vs 92.6%) and duck-cover and hold (88.8 vs 90.4%) for the high and low risk barangays, respectively. Fewer respondents from the high-risk barangay were aware of emergency contact numbers of government agencies (68.1 vs 78.5%). A higher percentage of respondents from the high-risk barangay correctly answered 8 of 18 questions on preparedness and a higher percentage of respondents
Levels of earthquake awareness and preparedness in a high risk and low risk barangay

35 VOL. 9 NO. 2 • JULY - DECEMBER • UERM Health Sciences Journal
Table 4. Association between having one member who is at least a high school graduate and levels of awareness and preparedness.
Awareness Preparedness n (%) n (%)
Aware Not aware Well-prepared Poorly prepared
High risk With high school graduate (n = 329) 227 (69.0) 102 (31.0) 173 (52.6) 156 (47.4) No high school graduate (n = 29) 15 (51.7) 14 (48.3) 6 (20.7) 23 (79.3)
PR 1.33 (95% 0.93, 1.91), p = 0.095 2.54 (95% CI 1.24, 5.22), p = 0.001
Low risk With high school graduate (n = 340) 250 (73.5) 90 (26.5) 163 (47.9) 177 (52.1) No high school graduate (n = 19) 16 (84.2) 3 (15.8) 6 (31.6) 13 (68.4)
PR 0.87 (95% CI 0.71, 1.07), p = 0.455* 1.52 (95% CI 0.78, 2.97), p = 0.247*
* Fisher’s exact testPR – Prevalence (risk) ratio
from the low risk barangay correctly answered nine other questions. The highest percentage of correctly answered items in the high-risk barangay were knowledge of contact numbers of other household members (91.2%), effects of aftershocks such as fire and further damage (81.9%), and overhead shelves/cabinets free of heavy objects (81.4%), while in the low risk barangay, these were: knowledge of contact numbers of other household members (88.3%), having stored food and drinking water (84.8%), initial response (84.0%), and overhead shelves/cabinets free of heavy objects (83.0%). The most frequently mentioned items in the emergency kit in both high and low risk barangays were the first aid kit (91.7 vs 96.1%) and flashlight (90.9 vs 90.5%). Water was the third most frequently mentioned item in the high-risk barangay (80.4 vs 73.8%) while it was canned food in the low risk barangay (77.0 vs 67.5%). The can opener was the item least mentioned as part of the emergency kit in both high and low risk barangays (49.1 vs 47.7%). Less than half of respondents in the high-risk barangay mentioned a battery-operated radio as part of the emergency kit (49.4 vs 55.1%).
Discussion
Despite one barangay having a higher risk than the other, the study found that there was no significant difference in the percentage of households classified
as aware and well-prepared in the two barangays. The mean awareness and preparedness scores were slightly higher in the low risk barangay. As no significant difference in the levels of awareness and preparedness was found between high- and low risk barangays, this may imply that the government’s efforts in raising awareness and preparedness may not be concentrated only in the high risk areas but have been evenly distributed regardless of geographical risk. This means that communities in high-risk and low risk areas are almost equally equipped with the knowledge about earthquakes, and these campaigns can encourage households to take the necessary preparations in anticipation of disasters. The researchers note that government must intensify its efforts since less than 70% of households were aware and less than half were well-prepared in both high- and low risk barangays. The results showed that television plays a significant role in disseminating information on earthquakes. As television is an outlet for news networks and government agencies, most house-holds were assumed to receive reliable information regarding earthquakes. In Barangay Batasan Hills, radio was the next most common information source. Households from Barangay Gen. T. De Leon had the internet as one of its top sources of information. These are important to note since information sources are significant factors in household earthquake preparedness.7 They may be classified into formal agency communications and informal social media.
Levels of earthquake awareness and preparedness in a high risk and low risk barangay

36 UERM Health Sciences Journal • VOL. 9 NO. 2 • JULY - DECEMBER 2020
Formal agency sources can highlight credibility. Meanwhile, informal social media sources provide quicker means of communication, but are prone to passing along incorrect information. A previous study found that both formal and informal information sources can create an impact on raising household preparedness.8
The presence of many dependents in the family, such as children and elderly, reflects greater obstacles encountered when responding to an emergency.9 This makes them more vulnerable to disaster-related consequences. This study found no association between households having children and/or senior citizens in the family with awareness and preparedness in both high and low risk barangays. The researchers explored the possible role of having at least a high school graduate in the household in improving awareness and preparedness. A previous study found that disaster-related training is most effective for individuals with a high educational attainment.10 Present study shows a significant association with the level of preparedness based on educational level. However, no significant association is found with earthquake awareness. This is congruent with other research findings that showed significant association between the levels of disaster preparedness and respondents with at least a secondary education.10
As the ability to process abstract thinking and better learning skills are associated with a higher level of education, households may benefit from educational training on disaster. A previous study found a strong association between previous experience and awareness and preparedness, which may be explained by individuals recalling prior serious economical and physical damage, and fear of similar disastrous events in the future.11 Present findings did not show any significant association between having a previous earthquake experience and awareness or preparedness in both high- and low risk barangays. This is consistent with a Turkish study which showed the impact of the earthquake being forgotten over time.12 It is essential to know the short, medium- and long-term effects of disasters on societies. Recent efforts of the government in promoting disaster preparedness may be one of the factors affecting the results obtained in the study. According to the National Disaster Risk Reduction and Management Plan for 2011-2028, the goal of disaster preparedness is to establish and strengthen the capacity
of communities to anticipate, cope, and recover from the negative impacts of disasters. Hence, standard programs of instruction and training modules are to be implemented for communities to have an increased understanding of and application of risk-reduction measures.14 In addition, an earthquake preparedness guide was prepared by PHIVOLCS and was launched to the public. This guide includes information about what to do before, during, and after an earthquake.2
The present study concluded that there was no significant difference in the levels of awareness and preparedness for earthquakes between the high-risk and low risk barangays. Television was the most common source of information in both high- and low risk barangays. The presence of at least a high school graduate in the household was associated with being prepared but not with awareness. The presence of children and/or seniors, and previous experience of an earthquake were not associated with awareness and preparedness in both high- and low risk barangays. The scope of the study included households geographically located within the high-risk and low risk barangays at the time of data collection. The duration of residency of the occupants of the household was not considered in this study. Perceived risk and the association of household income were not investigated. Another limitation encountered in the study was the accessibility of the respondents in terms of location within the barangay. Based on the results of the study, the researchers recommend that perceived risk be included in future studies. Demographic data such as number of occupants in a household, total yearly household income, and sex may also be considered as independent variables in future studies.15 Obtaining a larger sample size and using a probability sampling method may also increase the reliability of the study.
Acknowledgements
The group would like to extend their gratitude to the people who helped make this research paper possible: Dr. Ronald P. Law, MPH, Medical Officer V of the Health Emergency Management Bureau of the Department of Health, for his participation and input in the formulation of the study questionnaire; Mr. Sanaz Sohrabidazeh and the Department of Education, for allowing the group to adapt the questionnaires used in their research; Mr. Daniel Jose
Levels of earthquake awareness and preparedness in a high risk and low risk barangay

37 VOL. 9 NO. 2 • JULY - DECEMBER • UERM Health Sciences Journal
Buhay, Science Research Specialist of PHIVOLCS, for helping the group identify the barangays; Barangay Captains John M. Abad of Batasan Hills and Alfren Caina of Gen. T. De Leon, and their respective barangay secretaries, for their assistance during data collection; and all the respondents, for their honesty and cooperation.
References 1. Metro Manila Earthquake Impact Reduction Study
[Internet]. Philippines: Philippine Institute of Volcanology and Seismology. Department of Science and Technology; 2010. [Cited 2017 Nov 10]. Available From: http://www.phivolcs.dost.gov.ph/index.php?option=com_content&view=article&id=419%3Ammeirs&catid=66
2. PHIVOLCS Earthquake Preparedness Guide [Internet]. Philippines: Philippine Institute of Volcanology and Seismology; 2009. [Cited 2018 Sep]. Available from: https://www.phivolcs.dost.gov.ph/images/IEC/what_to_do_pocketsize.pdf
3. Pacheco BM. Safety of PH structures during quakes [Internet]. Philippines: Metropolitan Manila Development Authority; 2011 Apr 9. [Cited 2017 Nov 11]; Available from http://www.mmda.gov.ph/20-faq/297-safety-of-ph-structures-during-quakes
4. Faultfinder [Internet]. Philippines: Philippine Institute of Volcanology and Seismology. Department of Science and Technology; 2010. [Cited 2017 Nov 11]. Available from: http://faultfinder.phivolcs.dost.gov.ph/
5. Earthquake Family Preparedness Questionnaire (K-2, SPED) [Internet]. Philippines: Department of Education; 2015. [cited 2017 Nov]. Available from: http://www.deped.gov.ph/sites/default/files/order/2015/DO_s2015_27.pdf
6. Ardalan A, Sohrabizadeh S. Assessing households preparedness for earthquakes: An exploratory study in the development of a valid and reliable Persian-version tool. PLoS Curr 2016 Feb 25. [Cited 2017 Nov 10]. Available from: https://www.ncbi.nlm.nih.gov/pmc/articles/PMC4778920/
7. Kirschenbaum A, Rapaport C and Canetti D. The impact of information sources on earthquake preparedness. Int J Disaster Risk Reduct 2017. [Cited 2017 Nov]. 21: 99-109. Available from: https://doi.org/10.1016/j.ijdrr.2016.10.018
8. Mar ti M, Stauffacher M, Matthes J, Wiemer S. Communicating earthquake preparedness: The influence of induced mood, perceived risk, and gain or loss frames on homeowners’ attitudes toward general precautionary measures for earthquakes. Risk Anal 2018 Apr. [Cited 2017 Sep 21]. 38(4):710-23. Available from: https://www.ncbi.nlm.nih.gov/pubmed/28799655
9. Morrow B. Identifying and mapping community vulnerability. Disasters 1999. [Cited 2018 Sep]. 23: 1-18. Available from: https://onlinelibrary.wiley.com/doi/abs/10.1111/1467-7717.00102
10. Muttarak R, Pothisiri W. The role of education on disaster preparedness: case study of 2012 Indian Ocean earthquakes on Thailand’s Andaman Coast. Ecol Soc 2013. [Cited 2018 Sep]. 18(4): 51. Available from: http://pure.iiasa.ac.at/id/eprint/10359/
11. Ashenefe B, Wubshet M, Shimeka A. Household flood preparedness and associated factors in the flood-prone community of Dembia district, Amhara National Regional State, northwest Ethiopia. Risk Manag Healthc Policy 2017. [Cited 2018 Sep]. 10: 95-106. Available from: https://pubmed.ncbi.nlm.nih.gov/28615980/
12. Gerdan S. Determination of disaster awareness, attitude levels and individual priorities at Kocaeli University. Eurasian J Educ Res 2014. [Cited 2018 Sep]. 55: 159-76. Available from: https://files.eric.ed.gov/fulltext/EJ1060452.pdf
13. Becker JS, Paton D, Johnston DM, et al. A model of household preparedness for earthquakes: How individuals make meaning of earthquake information and how this influences preparedness. Nat Hazards 2012. [Cited 2017 Sep 21]. 64(1): 107-137. Available from: https://doi.org/10.1007/s11069-012-0238-x
14. National Disaster Risk Reduction and Management Plan (NDRRMP)2011‐2028[Internet].Philippines:NationalDisaster Risk Reduction and Management Council; 2010. [Cited 2017 Nov]. Available from: http://www.ndrrmc.gov.ph/attachments/article/41/NDRRM_Plan_2011-2028.pdf
15. Wise GI. Preparing for disaster: A way of developing community relationships. Dis Manag Resp 2007. [Cited 2018 Sep]. 5(1): 14-7. Available from: https://www.sciencedirect.com/science/ar ticle/abs/pii/S1540248706000745
Levels of earthquake awareness and preparedness in a high risk and low risk barangay
38 UERM Health Sciences Journal • VOL. 9 NO. 2 • JULY - DECEMBER 2020
A narrative analysis on stories of underage smoking initiation among public school children
Christa R. Baniqued, Stephanie I. Barbers, Daniel K. Bañas, Marianne G. Bangloy, Noel B. Bautista, Katrina M. Barretto, Kevin R. Base, Jeremae D. Bassig, Krisha F. Batalla, Alyssa F. Bautista, Trizia E. Bautista, Sean C. Belo, Joseph C. Beloso, Kristian M. Bercero, and Franciosa Gavino-Collins, MD, MPH
AbstractIntroduction Smoking is one of the most common preventable risk factors for disease and continues to be a burden on public health, especially in developing countries like the Philippines. This study aims to provide an understanding of underage Filipino smokers that is sensitive to the context within which they are found. Methods: The narrative approach was used to understand events across time and in a way that gave meaning to the storied experience of the participants. Core story creation and emplotment were used to flesh out the narratives of smoking initiation. The stories of six residents of Barangay Doña Imelda were analyzed to understand the significance of smoking initiation in their context. Results: The overarching narrative found was “putting meaning into time” and from this, three themes emerged: 1) time is meaningful when shared, 2) finding solace from the struggles of daily living, and 3) resisting oppressive structures. Using these insights, the discussion was grounded on anti-smoking campaigns such as the DOH Annual No Smoking Month, the Sin Tax Law, and the Nationwide Smoking Ban. Conclusion: This paper concludes that a more proactive approach to smoking initiation is warranted by making meaningful alternative activities available to public school children.
Keywords: Smoking, underage, Filipino, narrative, qualitative
_________________
Correspondence: Franciosa Gavino-Collins, MD, MPH, Department of Preventive
and Community Medicine, College of Medicine, University of the East Ramon Magsaysay Memorial Medical Center, Inc., 64 Aurora Boulevard, Barangay Doña Imelda, Quezon City, PH 1113; email: [email protected]
Smoking initiation is most likely to occur before the age of 18.1-3 At this age, adolescents are
biologically more susceptible to dependence, prone to feelings of invulnerability, and the most likely to accumulate adverse effects of smoking throughout their lifetime.1,2,4-6 This is relevant in the context of the
Philippine youth because adolescents from developing countries are more vulnerable to the financial, social, and disease burden of smoking.1 Despite this, not much is known about the behavior, beliefs, practices, and motivation of the youth.7 There is a need to contribute to the understanding of the significance of smoking initiation at this age because studies suggest that individuals who avoid smoking in adolescence are unlikely to initiate the practice later on in life.1 Within the global context, the efforts of the WHO towards preventing underage smoking initiation are aimed at the reduction of the disease burden of smoking.4 This problem is situated within the wider discourse of health and poverty reduction.1 In order to address this problem, health practitioners and policy

39 VOL. 9 NO. 2 • JULY - DECEMBER • UERM Health Sciences Journal
makers must navigate between two different views of health. On one hand, the biomedical approach views smoking initiation as a product of a biological predisposition to initiate risky behavior and addiction, while the biopsychosocial approach sees smoking as a symptom of larger societal factors (i.e., poverty, capitalism).1,4,5,7,8 Despite increasing intervention efforts, the tension between the two views fails to establish a contextual approach to research and prevent smoking initiation among the youth.9 Thus, it continues to be a major public health concern especially in developing countries like the Philippines which remains the largest consumer of cigarettes in the world.1,10,11 This study employed a narrative framework to answer the question “What is the significance of smoking initiation in the lived experience of underage Filipino public school children embedded in the stories of residents of Barangay Doña Imelda?” This study aims to provide an understanding of underage Filipino smokers that is sensitive to the culture and context within which they are found. Existing literature on underage smoking can be conceptually organized into material factors and relational factors that promote initiation of smoking. Underage smoking is closely tied to the youth’s geographic location which often dictates the availability and cost of cigarettes, laws regulating smoking, and spending power.1 However, more than cost, studies suggest that affordability is a larger influence on cigarette consumption; but in a country in which one-fifth of the population live below the poverty threshold, cigarettes cannot be considered affordable.1,12,13 Despite this, the pattern of tobacco use among adolescents from low socioeconomic groups is consistently higher than those of the non-disadvantaged groups.5 Initiation among the Filipino youth despite the lack of spending power may be explained by the ability to buy single sticks of cigarettes, the lax enforcement of tobacco sale to minors, or it may be pointing to the presence of influences stronger than affordability that promote smoking in low socioeconomic youth.14 In this light, the lack of money and the stressors associated with belonging to the low socioeconomic class act as a driving factor instead of a deterrent to the propensity to smoke.8,14,15
Stressors associated with belonging to low socioeconomic class (i.e., day to day living, poor health) can interfere with children’s ability to
finish their education.16 Studies suggest that lower educational attainment, poor academic performance, and lack of interest in studies are substantial promoters of the initiation of smoking.3,17-19 Apart from the interruption of education, socioeconomic status dictates where education is attained. Being more likely to attend a school where someone in authority such as their teacher or director smokes in their presence promotes an onset of smoking in children and negatively affects their compliance to smoking regulations.3,20 Adolescence is a time of finding one’s identity and although it is seen as a time to seek some independence, family is still a large influence on their actions.21 The presence of family members who smoke does not only promote initiation of smoking but also influences earlier onset of smoking in adolescents.2,22
This propagated a new wave of research proposing that initiation of smoking results from the genetic predisposition towards risky behavior.5 Others argue instead that familial smoking behaviors are a result of shared environmental factors from living and interacting with each other.6 However, more than mere exposure to similar environments, the feeling of acceptance from family such as when they are given the safe space to smoke at home or when their first cigarette is given by a member of the family are even stronger influences on the initiation of smoking.2,3,22 On the other hand, the breakdown of these relationships, such as having a poor relationship with parents also influenced initiation of smoking in younger age groups but as a form of rebellion.3
A similar pattern of acceptance and rebellion is also found in adolescent peer groups. Multiple studies have determined a link between peer smoking, peer pressure, and initiation of smoking.5 At this age, acceptance from friends may be a stronger influence than parents when it comes to smoking initiation.23 Similarly, the lack of this social connection among hostile, depressive, or bullied students also poses as an influence on smoking initiation as a form of rebellion.24
Building on the foregoing literature, the authors critique the one-size-fits-all approach to understanding smoking initiation, which tends to neglect the specific context within which it occurs.2,8,9,22 Past studies done in cultural groups have pointed out the possible roles of gender, family, and friends in smoking initiation but failed to explain the significance of these findings in relation to the group’s lived experience.5,8 Instead, the
Underage smoking initiation among public school children

40 UERM Health Sciences Journal • VOL. 9 NO. 2 • JULY - DECEMBER 2020
authors contend that in understanding behavior such as smoking, there is a need for particularization of context in determining what really influences Filipino public school children to smoke. In the context of a developing country, the authors critique that the foregoing literature is insensitive to the issues of powers at play when understanding smoking initiation in the underprivileged youth.7 Although some scholars recognize that the problem of smoking initiation presents uniquely in the context of the poor, research attempting to understand the phenomenon remains scant and tends to favor generalizations; dismissing the growing gap as a consequence of lack of knowledge and bad health behaviors of the poor.1 These explanations fail to recognize the unique struggle of the poor and the wider cultural and social context shaping their decisions.8 Lastly, in the discourse of predisposing factors (i.e., genetic, environmental), the authors find that the agency in the decision to initiate smoking is minimized. Instead, we contend that the significance of smoking initiation should be understood as a multi-level phenomenon which includes the active decision to initiate smoking.25
Narrative framework invites one to understand events across time and in a way that gives meaning to the storied experience.26 “Thus, an understanding of the broader cultural narratives within which personal stories are told helps one interpret those stories, understand the nature of personal conflicts, and consider how they may be resolved by taking into account the broader cultural context of any difficulties.”26 On a social level, narratives provide insights into cultural and societal rules regarding people’s role and place in society.26 They draw from this cultural context to develop a shared understanding of experience that is influenced by wider power relations.27 On a personal level, narratives acknowledge the agency involved in forming and telling stories. It opens the opportunity to bridge personal and social forms of knowledge, locating their personal agency in the wider context of cultural influence.25
Methods
This study utilized a narrative framework, with interviews as the primary strategy for data collection, and core story creation and emplotment as the strategy for data analysis.28-30 For qualitative research,
information is collected until the point of theoretical saturation.31 The participants have been set to reflect the target audience of anti-smoking campaigns for the youth which are largely held in public schools. Inclusion criteria consisted of participants who started smoking before the age of 18 and previously attended a public school for primary and secondary education. Due to concerns with obtaining consent from parents who may be unaware of their children’s smoking, the exclusion criteria were individuals who were under 18 years old. The participants came from Doña Imelda community in Quezon City for feasibility and their status as an adopted community of UERMMMCI. Purposive sampling was used to recruit participants who fit our criteria. As researchers, they acknowledged that intrinsic to qualitative studies is the epistemological stand to minimize the gap in the researcher-participant relationship.32 This was done by creating a “feeling of empathy for informants” which is a non-threatening environment achieved by an “unstructured, informal, anti-authoritative, and non-hierarchical atmosphere” that minimizes the power hierarchy intrinsic to the relationship.32 Following this, unstructured interviews were the primary strategy for data collection. A ‘single question aimed inducing narrative’ or ‘SQUIN’ as proposed by Wengraf was used to encourage the formation of narratives by the participant.33 Written and oral informed consent was obtained before the interview to audio record the session. The interview was held in the preferred language of participants so as not to lose the depth of articulation of their experience in translation. For participants belonging to the low socioeconomic status group, additional measures were taken to address their potentially vulnerable position. A trusted and known person from the community was present during the interview to minimize feelings of coercion during the interview process. Data analysis was done using core story creation and ‘emplotment’ as theorized by Polkinghorne, Mishler, and Embden while also drawing insights from the step-by-step analysis laid out by Petty.28-30,34
The researchers transcribed audio recordings of the interviews verbatim in order to gain familiarity with the text. The transcribed narratives were reconstructed into core stories by removing unnecessary or confusing content and reorganizing events in the shortest form possible while still keeping meaning.27 Emplotment was done as a process of meaning making; weaving
Underage smoking initiation among public school children

41 VOL. 9 NO. 2 • JULY - DECEMBER • UERM Health Sciences Journal
together a single plot from multiple stories that capture meaningful events in relation to the theme that reveals their significance.27 Drawing from the work of Petty, thematic analysis was done on the final plot created to generate “key themes for learning”.29 These themes represent the educational value of the story and can be applied to create person-centered health campaigns that “places human experience at the heart of care.”29 In order to exercise validity in qualitative research, the authors used methods such as inter-rater coding, paper trail, and reflexivity. Personal bias is intrinsic to the researcher and could not be fully eliminated, rather, it was managed and used to add perspective to the interpretation of narratives. Managing reflexivity was practiced by keeping an individual diary throughout the research process that tracked decisions, thoughts, and feelings during the research in order to locate their own biases in conducting the research.30 Inter-rater coding was done and a paper trail was kept documenting the research process (i.e., transcript, timeline, changes). Lastly, the researchers were able to return to four of the participants to share the core stories and insights from the results and confirmed that it resonated with their personal experience.
Results
In order to answer the research question “What is the significance of smoking initiation in the lived experience of underage Filipino public school children embedded in the stories of residents of Brgy. Doña Imelda?”, core story and emplotment were employed on all 6 interviews to establish an overarching narrative of “the story of putting meaning into time”. A recurring theme across all interviews is the term nanlilibang. Panglibang is usually directly translated as entertainment, however it can be better understood as “to occupy time”. Here, the authors see that the story of underage smoking initiation in residents of Doña Imelda is a story of finding meaningful ways to occupy time. From this overarching narrative, three key themes for learning emerged. On Culture: Time is best when shared. Majority of the interviews revolved around the experience of the barkada at that stage of their lives. Most of the participants remember smoking initiation occurring in the midst of enjoyment with friends, often accompanied by drinking alcohol, and passing time in each other’s company. Here, time is constructed as meaningful when it is shared with others.
Paninigarilyo, pag iinom nung 15 years old ako sa mga barkada… Iniisip ko lang noon masarap lang ang buhay barkada, pareparehas ang bisyo.
In this context the authors understand the significance of the “barkada” in how they choose to spend their time. The barkada is perceived as meaningful because it reflects the values they prioritize— relationships and inclusivity. With this construction of time, smoking initiation occured when it was seen as an avenue for relations. For example, as “Cynthia” recalled the feeling of first wanting to try smoking, she determined that part of what convinced her to start was the feeling of jealousy over her friends bonding over smoking and wanting to be a part of it.
Parang nagkukumpol-kumpol sila dun tapos umuusok. Pag di ka naninigarilyo, tapos pupunta ka sa kanila ang pangit mas lalong ikaw yung tatamaan. Nag-try na rin ako, humingi lang ako sa kasama ko… parang nainggit na ako sa kasama ko kasi silang lahat naninigarilyo. Tapos (mas naging close) pag umiinom habang nag-iinuman naninigarilyo, parang masaya lang.
Here the authors see that smoking became meaningful when it is presented as a communal activity that fostered inclusivity into a group or community. Smoking was perceived as something that could be shared between friends, family, and people passing by on the street. This experience does not fit into the western narrative of rebellion where underage smoking is used to distance oneself from the norm. Instead, it was moving towards inclusivity in a community where underage smoking was seen as normal. In this context, it is not that underage smoking was expected but it was accepted.
May pagka-depressed area yung lugar namin dun kaya parang normal na lang yung mga kabataan na nagyoyosi. Karamihan sa lalaki nagyoyosi naki-uso lang ako.Kasi nung nakita ako magyosi ng tatay ko nagagalit siya sa akin… Hanggang sa hindi na niya ako ma-control. Minsan siya pa bumibili sakin ng sigarilyo kahit wala po akong trabaho.
On Power: Seeking solace from struggles of daily living. At a young age “Rudy” was faced with his parents’ separation and abandonment by his father. This forced him to start working to help support his family. He recalled distracting himself from thoughts about his life and future by spending his time on vices and getting into trouble.
Wala akong tatay noon. Kami-kami na lang. Walang nagpapalaki samin, walang nagtatrabaho, nanay ko lang. Pag masyadong matindi ang panahon, natuto
Underage smoking initiation among public school children

42 UERM Health Sciences Journal • VOL. 9 NO. 2 • JULY - DECEMBER 2020
narin ako magsimulang magtrabaho sa construction, yun yung umedad na ako mga 16-17. Parang mas gusto ko pang makibisyo ako sa mga barkada, di ko na inintindi yung kinabukasan. Wala na akong inintindi. Dahil sa barkada na yan madalas akong ma-barangay.
Here, time was constructed as meaningful when it provided solace from thoughts of the struggles of day to day living. With this construction of time, smoking initiation occured when it was seen as a way to fill time with pleasure. When smoking was presented by the community as an enjoyable activity, it became a meaningful way to fill their time. For example, “Toti” recalled that merely seeing people enjoying while smoking was enough to spark his curiosity even without personally knowing or interacting with the smokers.
Para bang nakakalanghap lang ako ng usok “parang ang sarap yata nun.” Tsaka ang iba nakikita ko mapormang-maporma pag nagyoyosi naeengganyo tuloy ako parang tingin ko sa kanila sarap na sarap sila. Lalo na kapag may liligawang babae.
Smoking became a distractor from the struggles of day to day living or a tool that helped make thinking of the stressors more bearable.
Ginagawa ko naman nasa bundok ako nagpupunta dun sa gulayan nagtatago ako para magyosi. Iniisip ko doon ang nangyari sa buhay ko, yung lagi akong pinapalo ng lola ko, wala yung magulang ko. Kasi sakin ang dahilan naman parang mawawala na yung lungkot at stress sa magulang ko, iyon ang nililibangan ko. Lalo nung nagpunta ako sa Maynila hinahanap ko magulang ko rito, di ko makita-kita. Tatay ko lang nakita ko. Noon, nung nagkaharap-harap kaming dalawa habang nag-uusap, yosi nang yosi. Syempre sinisisi ko yung tatay ko ba’t di ko nakita nanay ko. Panay ang yosi kaya lumakas nang lumakas ang aking pagyoyosi.
This experience is neglected in past research and health programs that approach smoking in low SES communities as solely the result of lack of education and poor health practices (i.e., box warnings, awareness campaigns). Instead, the authors saw that smoking initiation occured in spite of efforts towards health education because the persisting stressors associated with poverty (i.e., broken families, finances) continued to exist and served as a driving factor for smoking initiation. Agency: Resisting oppressive structures. “Melvin” recalled that the first time he tried smoking was due to his uncles; it was a negative experience and he vowed never to smoke again. However, when he was later
presented with an opportunity to initiate smoking independent of external demands the experience became significant and enjoyable.
Maliit pa ako (12y/o), yung mga uncle ko inutusan ako “bumili ka ng yosi, sindihan mo na (para sa amin), (pero) huwag mong gagayahin yan ha.” Ayoko sana bumili ng yosi noon (pero) ginawa ko rin kasi papaluin ako kapag di ko gagawin. Iniisip ko naman titikman ko yung pinapautos mo sakin, di mo naman sisindihan lang yun, sipsipin mo na… Nung una hindi ko nagustuhan, pag inutusan ako lagi kong ayaw… Nagsimula ako sa bisyo nung 17 na ako. Iniisip ko naman yung kasamahan at kalaro ko kasi nagyoyosi rin. Bakit ano ba yang yosi na yan? Kaya sabi ko subukan ko nga rin. Ako lang mag-isa yung bumili, kasi may iniwan sa aking pambili ng bigas. Yung kalahati pinambili ko ng yosi.
Here we saw that activities that imposed on the sense of free will such as being ordered around and threatened with punishment was not perceived as a meaningful use of time. Instead, the participant asserted his agency by resisting his uncle’s attempt to control his actions by trying the forbidden cigarette. Agency related to “people’s ability to make strategic life choices in a situation where this ability was previously denied to them”.35 The authors saw that in his subsequent trial of smoking, the full freedom to exercise his agency in the decision to smoke made the experience meaningful. Here, time was constructed as meaningful when it was used to exert agency. In previous studies on smoking and addiction, agency was lost in the discourse of risk factors and environmental influence. Health campaigns that only focus on addressing the predisposing factors to smoking suggest that the poor are passive recipients of influence who act without awareness of their actions or consequences. However, this study shows that 1) smokers asserted their agentic role in initiation which can occur with full awareness of the action and its consequences, and 2) smoking initiation occured when it was presented as a form of resistance to social structures that were perceived as oppressive. For example, “Cynthia” remembers that as a child there was a disconnect between being told that smoking was harmful and seeing the majority of the people in her community risking the dangers of smoking. This fueled curiosity and desire to decide for herself whether smoking was beneficial to her.
Walang nagsabi sakin, gusto ko lang talaga. Gusto kong malaman kung ano ang pakiramdam. Yun nga
Underage smoking initiation among public school children
43 VOL. 9 NO. 2 • JULY - DECEMBER • UERM Health Sciences Journal
kasi sa mga nakikita ko nga na nakapaligid. Bakit naninigarilyo sila? Di ba masama yun? Lalo na sa kalusugan? May mga nakikita rin akong mga doktor na naninigarilyo dati. Bat sila naninigarilyo kung alam nilang masama sa katawan? Yun yung naging question ng utak ko. Edi triny ko din.
The authors saw here that smoking became meaningful when it was perceived as an avenue to exert one’s agency. This experience did not fit into the narrative of peer pressure that is common in previous studies of smoking initiation. Peer pressure exerts that smoking initiation occurs as a result of persuasion from peers contrary to the desire of the agent. However, all the participants asserted their active role in smoking initiation. Even those that initiated in the barkada setting did not claim to feel forced but instead, actively sought out their first cigarette.
Nag-try na rin ako, humingi lang ako sa kasama ko. Hindi naman ako nahilo o naubo, Natuto ako agad kasi nga, sabi ng ibang tao ’pag gusto mo, madaling matutunan.
Discussion
This discussion grounds the results of the research in the evaluation past anti-smoking campaigns in the Philippines. This section focuses on three existing campaigns: No-Smoking Month, Sin Tax Law, and the Nationwide Smoking Ban in relation to the three key learning themes. In 2018, the Department of Education was ordered to observe the annual “No-smoking Month” celebration.38 This partnership with the DOH focuses on enjoining public elementary and secondary schools nationwide to undertake educational and advocacy campaigns to raise awareness through creative endeavors, lectures, seminars, and projects involving the participation of students. However, in order to create significant and lasting effects towards prevention of smoking initiation, it is not enough to hold standardized workshops nationwide which may not be relatable to children from different backgrounds. Instead, consultation should be made with stakeholders in the community, most especially the children on their experience with smoking initiation. In 2012, RA 10351 or the Sin Tax Law was enacted based on the recommendation of the Department of Health and the Department of Finance.39 It advocated
increased taxes on tobacco products and alcoholic beverages to curb consumption and ultimately reduce the incidence of illness. This law was modeled after the WHO recommendation and similar policies in other countries. However, unlike most developed countries, smoking in the setting of low SES communities in the Philippines is embedded in the larger problem of poverty reduction. The sole problem is not the cheap cost of cigarettes but the stressors associated with poverty. Neglecting the unique situation of the poor can cause more oppression when prices of cigarettes rise but their state of poverty does not change. Instead of eliminating smoking, the burden of smoking becomes greater because they are not effectively deterred from smoking and instead end up spending more of their money on cigarettes. Even after the enactment of the Sin Tax Law, more than one-fifth of Filipino adults still used tobacco daily and youth smoking rates remained worryingly high.37 In order to effectively reduce smoking initiation, more strides have to be made towards poverty reduction to address the feelings of the need for escape from thoughts of daily living. In 2017, the Nationwide Smoking Ban took effect which prohibited smoking in public spaces.40 These types of social denormalization strategies foster a ‘social transformation that appears to involve the active stigmatization of smokers’.37 Stigmatization, coupled with sudden strict enforcement of the smoking ban and the lack of designated smoking areas, can lead to the perception of the law as an oppressive structure. Neglecting to acknowledge the agency in smoking may lead to more resistance with smokers finding discreet areas to evade authorities, continuing of smoking in private properties, or resulting to e-cigarette use. Campaigns should avoid stigmatizing smokers and instead encourage and respect the smokers’ freedom to willfully choose for themselves to quit or refrain from smoking initiation. Despite many efforts by the government towards decreasing the rate of smoking initiation, it still remains to be a significant problem among the Filipino youth. Government policies and programs should be sensitive to the unique context of low SES communities by meaningful consultation with community members, most especially the youth themselves. In the case of the residents of Barangay Doña Imelda, smoking initiation occured when it became a meaningful way to occupy time. With this construction of time, the authors believe an approach
Underage smoking initiation among public school children
44 UERM Health Sciences Journal • VOL. 9 NO. 2 • JULY - DECEMBER 2020
such as instituting government sponsored after-school programs (i.e., sports, art) can address the desire for relationships, pleasure, and agency in an avenue that avoids resorting to smoking initiation. This type of program, although not directly an intervention for smoking initiation is not a reactive process but instead, a proactive process that targets the root cause of the problem by providing alternatives for meaningful activities accessible to public school children. `This study does not include what particular activities would be effective in sustaining the youth’s interest. It is recommended that another context sensitive study be made to determine what activities could be proposed as after-school programs in public schools. This study is also specific to residents of Brgy. Doña Imelda and does not claim to be generalizable to the entire Filipino youth. Lastly, this study tackles prevention of smoking initiation and therefore insights on smoking cessation is beyond the scope of this study. Since there is also a lack of contextual research on smoking cessation, the authors recommend that context sensitive studies be made on cessation in order to address current smokers who continue to influence the succeeding generations to initiate smoking.
Declaration
This research paper was done with the support of the UERMMMCI Research Institute for Health Sciences. There is no known conflict of interest associated with this publication and the study was conducted without any financial support that could have influenced the outcome.
References 1. Esson KM, Leeder SR. The Millennium development
goals and tobacco control: An opportunity for global partnership. Geneva: World Health Organization; 2004.
2. Strunin L, Díaz-Martínez A, Díaz-Martínez LR, et al. Age of onset, current use of alcohol, tobacco or marijuana and current polysubstance use among male and female Mexican students. Alcohol 2017; 52(5): 564-71. doi: 10.1093/alcalc/agx027
3. Yañez A, Leiva A, Gorreto L, et al. School, family and adolescent smoking. Adicciones 2013; 25(3): 253-9.
4. Maes HH, Prom-Wormley E, Eaves LJ, et al. A genetic epidemiological mega analysis of smoking initiation in adolescents. Nicotine Tob Res 2017; 19(4): 401-9. doi: 10.1093/ntr/ntw294.
5. Towns S, DiFranza JR, Jayasuriya G, Marshall T, Shah S. Smoking cessation in adolescents: Targeted approaches that work. Paediatr Respir Rev 2017; 22: 11-22. doi: 10.1016/j.prrv.2015.06.001. Epub 2015 Jun 11.
6. Oncel SY,DickDM,MaesHH,Alıev F. Risk factorsinfluencing smoking behavior: A Turkish twin study. Twin Res Hum Genet 2014; 17(6): 563-73.
7. Mashita RJ, Themane MJ, Monyeki KD, Kemper HC. Current smoking behaviour among rural South African children: Ellisras longitudinal study. BMC Pediatr 2011; 11: 58. doi: 10.1186/1471-2431-11-58
8. Passey ME, Gale JT, Sanson-Fisher RW. It’s almost expected. Rural Australian aboriginal women’s reflections on smoking initiation and maintenance: A qualitative study. BMC Women’s Health 2011; 11: 55. doi: 10.1186/1472-6874-11-55
9. O’Connor RM, Fite PJ, Nowlin PR, Colder CR. Children’s beliefs about substance use: An examination of age differences in implicit and explicit cognitive precursors of substance use initiation. Psychol Addict Behav 2007; 21(4): 525-33. doi: 10.1037/0893-164X.21.4.525
10. Bejjani N, El Bcheraoui C, Adib SM. The social context of tobacco products use among adolescents in Lebanon (MedSPAD-Lebanon). J Epidemiol Glob Health 2012; 2(1): 15-22. doi: 10.1016/j.jegh.2012.02.001. Epub 2012 Apr 3.
11. Sarmiento CQ. Philippines 2007 regional study on smoking in girls and young women. JPAIR Multidiscipl Res 2007; 1(1).
12. Blecher EH, van Walbeek CP. An international analysis of cigarette affordability. Tob Control 2004; 13(4): 339-46. doi: 10.1136/tc.2003.006726
13. World Bank. Making growth work for the poor: A poverty assessment for the Philippines. Washington, D.C. : World Bank Group. 2018. Available from:
h t t p : / / d o c u m e n t s . w o r l d b a n k . o r g / c u r a t e d /en/273631527594735491/Making-growth-work-for-the-poor-a-poverty-assessment-for-the-Philippines. [Accessed October 20, 2019].
14. Silver D, Bae JY, Jimenez G, Macinko J. Compliance with minimum price and legal age for cigarette purchase laws: Evidence from NYC in advance of raising purchase age to 21. Tob Control 2016; 25(3): 289-94. doi: 10.1136/tobaccocontrol-2014-051860. Epub 2015 Feb 11.
15. Taylor L, Jorm L, Frommer M, Rubin G. The health of the people of NSW - Report of the Chief Health Officer. NSW Public Health Bull, 1996; 7(5).
16. Baum A, Garofalo JP, Yali AM. Socioeconomic status and chronic stress. Does stress account for SES effects on health? Ann N Y Acad Sci 1999; 896: 131-44. doi: 10.1111/j.1749-6632.1999.tb08111.x
17. Gilman SE, Martin LT, Abrams DB, et al. Educational attainment and cigarette smoking: A causal association? Int J Epidemiol 2008; 37(3): 615–24.
18. Piontek D, Buehler A, Rudolph U, et al. Social contexts in adolescent smoking: Does school policy matter? Health Educ Res 2008; 23(6): 1029-38. doi: 10.1093/her/cym063. Epub 2007 Oct 17.
Underage smoking initiation among public school children
45 VOL. 9 NO. 2 • JULY - DECEMBER • UERM Health Sciences Journal
19. Jackson C, Henriksen L, Dickinson D, Levine DW. The early use of alcohol and tobacco: its relation to children’s competence and parents’ behavior. Am J Public Health, 1997 Mar; 87(3): 359-64. doi: 10.2105/ajph.87.3.359
20. Murray M, Swan AV, Clarke G. Long term effect of a school based anti-smoking programme. J Epidemiol Comm Health 1984; 38: 247-52.
21. Erikson EH. Childhood and Society. London: Vintage Digital; 2014.
22. Okoli C, Greaves L, Fagyas V. Sex differences in smoking initiation among children and adolescents. Public Health 2013; 127(1): 3-10. doi: 10.1016/j.puhe.2012.09.015. Epub 2012 Nov 10.
23. Flay BR, Hu FB, Siddiqui O, et al. Differential influence of parental smoking and friends’ smoking on adolescent initiation and escalation of smoking. J Health Soc Behav 1994; 35(3): 248-65.
24. Weiss JW, Mouttapa M, Cen S, Johnson CA, Unger J. Longitudinal effects of hostility, depression, and bullying on adolescent smoking initiation. J Adolesc Health, 2011; 48(6): 591-6. doi: 10.1016/j.jadohealth.2010.09.012. Epub 2010 Dec 18.
25. Flay BR, Snyder FJ, Petraitis J. The theory of triadic influence. In: DiClemente RJ, Crosby RA, Kegler MC (Eds.). Emerging theories in health promotion practice and research. Jossey-Bass/Wiley; 2009; 451–510.
26. Stephens C, Breheny M. Narrative analysis in psychological research: An integrated approach to interpreting stories. Qual Res Psychol, 2012; 10(1): 14–27.
27. Bruner J. The narrative construction of reality. Crit Inq 1991; 18: 1–21.
28. Polkinghorne DE. Narrative knowing and the human sciences. New York, NY: State Univ. of New York Press; 1988.
29. Petty J, Jarvis J, Thomas R. Core story creation: Analysing narratives to construct stories for learning. Nurse Researcher 2018; 25(4): 47–51.
30. Emden C. Conducting a narrative analysis. Collegian 1998; 5(3): 34–9.
31. Mason M. Sample Size and saturation in PhD studies using qualitative interviews. Forum Qualitative Sozialforschung/Forum: Qualitative Social Research. Available from: http://www.qualitative-research.net/index.php/fqs/article/view/1428/3027. [Accessed October 14, 2019].
32. Robinson-Pant A, Singal N. Research ethics in comparative and international education: Reflections from anthropology and health. Compare: J Comp Int Educ 2013; 43(4): 443–63.
33. Wengraf T. Qualitative research interviewing: Biographic narrative and semi-structured methods. London: Sage; 2011.
34. Mishler EG. Models of narrative analysis: A typology. J Narrat Life Hist 1995; 5(2): 87–123.
35. Kabeer N. Reflections on the measurement of women’s empowerment. Discussing women’s empowerment - theory and practice. Stockholm, Sweden: Novum Grafiska AB. 2001.
36. Protect your Family, Stop Smoking! [Internet]. DOH Philippines; 2016. Available from:
http://ro5.doh.gov.ph/index.php/13-press-releases/169-protect-your-family-stop-smoking. [Accessed October 12, 2019].
37. Bell K, Salmon A, Bowers M, Bell J, McCullough L. Smoking, stigma and tobacco ‘‘denormalization’’: Further reflections on the use of stigma as a public health tool. Soc Sci Med 2010; 70: 795–9.
38. Department of Education. DepEd Memorandum No. 106 s2018: 2018 National No Smoking Month Celebration. Available from: http://deped.gov.ph/wp-content/uploads/2018/06/DM_s2018_106.pdf
39. Republic Act No. 10351. Available from: https://www.officialgazette.gov.ph/2012/12/19/republic-act-no-10351/
40. Executive Order No. 26 Providing for the establishment of smoke-free environments in public and closed spaces. Available from: https://www.officialgazette.gov.ph/20170516-EO-26-RRD
Underage smoking initiation among public school children

46 UERM Health Sciences Journal • VOL. 9 NO. 2 • JULY - DECEMBER 2020
Correlation of family function and the quality of life of young adults with chronically-ill siblings
Aezrile A. Ignacio, Kimberly T. Huplo, RN, Danielle Camille A. Ignacio, Shari L. Guerra, Vanessa Angelica D. Gulla, Alain Francis A. Guloy, Erickson P. Gudelano III, Alayssa Katrina Marie P. Ilagan, RN, Ada Marielle B. Ignacio, RMT, Micah Raphaela C. Guerrero, Camille Mariz P. Guerrero, John Adrian Gelino M. Guibone, and Maria Teresa S. Tolosa, MD, DClinEp
AbstractIntroduction Chronically-ill patients are known to pose an impact on the family function (FF) and quality of life (QoL) of their family caregivers and pediatric siblings. However, there is limited literature on the relationship between FF and QoL. This study aimed to determine the correlation of FF and QoL among healthy young adults with siblings with chronic diseases. Methods This was an analytical cross-sectional study among young adults, selected by purposive sampling, with chronically-ill siblings. The CAPGAR and WHOQOL-BREF questionnaires were used for data collection. Spearman’s correlation coefficient r was used to determine the correlation between FF and QoL. Results More than half (53.9%) of the respondents had highly functional families. Majority of the participants (66.5%) had fair QoL. There was a weak but significant positive correlation (r = 0.27, p < 0.001) between FF and QoL.Conclusion There is a weak but significant positive correlation between family function and quality of life among healthy young adults with a sibling suffering from a chronic debilitating illness.
Keywords: Sibling, chronically-ill, family function, quality of life
_________________
Correspondence: Maria Teresa S. Tolosa, MD, DClinEpi, Department of Preventive
and Community Medicine, College of Medicine, University of the East Ramon Magsaysay Memorial Medical Center, Inc., 64 Aurora Boulevard, Barangay Doña Imelda, Quezon City, PH 1113; email: [email protected]
The presence of a chronically-ill family member may result in emotional burdens and stress which
greatly impacts not just the family caregiver’s quality of life, but also the siblings’.1-6 Recent studies have shown the impact of chronically-ill patients on their siblings, as the healthy children may feel “forgotten” by their parents - contributing to an increased risk of depression and anxiety.2,5,7 The effects of chronically-ill patients on their siblings may pose great psychosocial
risks and physical health strain due to the close influence that they have on each other.6,8
Family function is an essential factor which affects the quality of life of an individual. To date, there has been limited research investigating the correlation of the family function (FF) and quality of life (QoL) among healthy young adults with chronically-ill siblings. The objective of this study was to determine the correlation of FF and the QoL among healthy young adults with siblings suffering from chronic debilitating diseases. The research may provide data to serve as a basis in formulating policies to protect and develop sensitivity for healthy young adults with a chronically-ill sibling and increase awareness of the possible problems among them. The relationship covers the young adult’s perception of himself, dynamics with his sibling with chronic disease, parents, peers, and other people in the society;

47 VOL. 9 NO. 2 • JULY - DECEMBER • UERM Health Sciences Journal
relevant research can provide information to families with chronically-ill members, researchers, and medical professionals on the aspects of the young adult’s life which may need intervention.
Methods
This analytical cross-sectional study was conducted after being approved by the Ethics Review Committee of UERMMMCI. It included healthy young adults aged 18 to 35 years, who had siblings clinically-diagnosed with a debilitating non-communicable disease necessitating close monitoring and supervision. Participants and the chronically-ill sibling should have been living together for at least a year, with the latter residing or receiving treatment and care in a health facility within Quezon City. Participants were included if they were literate and provided written informed consent. Individuals who were unable to communicate, currently diagnosed with, or had a history of neurologic and psychiatric illness, currently treated with medications that might affect concentration, and those with adverse habits and drug abuse were excluded. Purposive sampling was used to screen eligible participants who were sourced from barangays and health care service institutions in Quezon City. The area was chosen because this is where the most number of chronically-ill persons undergo therapy due to the presence of more advanced treatment facilities.9 The sample size of 341 respondents was computed based on the study of Rodriguez-Sanchez which showed that 32.3 ± 5% of caregivers had low quality of life, 0.05 significance and 99.99% power.10 An additional 20% were recruited as allowance for respondents with incomplete responses. Participants answered either the Filipino or English version of the Comprehensive Family APGAR (CAPGAR) and WHO Quality of Life-BREF (WHOQOL-BREF) questionnaires in their primary care settings or in their homes following permission of a primary health facility or the assistance of focal barangay persons, respectively. The CAPGAR and WHOQOL-BREF questionnaires are generic instruments whose validity and reliability have been tested by the WHO and various researchers and the UP Philippine General Hospital’s Department of Family and Community Medicine to be used as a standardized
tool to assess family function (FF) and quality of life (QoL), respectively.9,11,12 The data collection tool also included a section for respondents’ demographics and characteristics. The 15-item CAPGAR Scale was adapted from the Family APGAR questionnaire which is used to determine the function of the family and the ability to endure and adapt to the situation, based on adaptation, partnership, growth, affectation, and resolve.11,13,14
The CAPGAR includes three subscales representing three domains: flexibility (6 items), cohesion (6 items), and communication (6 items). It also has five items similar to those of the original Family APGAR.11
This was scored as follows: 0-6, highly dysfunctional; 7-12, moderately dysfunctional; 13-18, functionally at risk; 19-24, moderately functional; and 25-30, highly functional.14 The CAPGAR questionnaire was created to provide a valid and reliable measure of family function among Filipinos. The World Health Organization Quality of Life-BREF Instruments (WHOQOL-BREF), an abbreviated form of the WHOQOL-100, was used to assess the QoL profiles of the respondents.12 The WHOQOL-BREF can be self-administered if the respondent has adequate knowledge, or interview-assisted if deemed necessary. The 26-item questionnaire includes overall QoL and general health (two items), plus 24 other items grouped under four domains: physical health (7), psychological (6), social relationships (3), and environment (8). The tool uses a five-point scale with 1 being the lowest and 5 being the highest.12 The items were constructed in a Likert scale with five balanced responses such as very poor/dissatisfied (1), poor/dissatisfied (2), fair (3), good/satisfied (4), and very good/very satisfied (5). The raw total domain QoL score was arranged from poor (26-60), fair (61-95), and good (96-130), following the categorization method employed by Dajpratham.15
The raw scores were transformed to make them comparable to the WHOQOL-100.12 The domain scores in the WHOQOL-BREF questionnaire were scaled in a positive direction: the higher the score, the higher the QoL. This also denoted the perception of an individual in a particular domain and aided in the correlation of the mean total transformed domain score against the total CAPGAR scores. The CAPGAR score was correlated with the transformed WHOQOL-BREF score and tested using Spearman’s correlation coefficient rho (r). This was
Family function and the quality of life of young adults with chronically-ill siblings

48 UERM Health Sciences Journal • VOL. 9 NO. 2 • JULY - DECEMBER 2020
computed using SPSS Statistics 24.0 Software, with a pvalueof ≤0.05setassignificant.Ascatterplotwasproduced to visualize the direction of the correlation. The processing of scatter plot and the organization and computation of demographic data were done using Microsoft Excel.
Results
A total of 409 individuals were recruited but 33 were excluded because of illness or non-completion of at least 80% of the WHOQOL-BREF questionnaire, leaving 376 respondents for analysis. Majority of the participants were female, with a mean age of 26 years; a third of them belonged to the 25-29-year-old bracket, as shown in Table 1. Half of the participants completed tertiary education. Most of them were in common-law relationships. More than half of the participants had no employment or regular activity, and the identified financial source of expenses was savings or salary in more than half of the respondents. The rest relied on family, spouse and children. Around 95% of the respondents denied any illness, while the rest assumed or felt that they had an undiagnosed disease. Overall, half of the participants’ siblings had neuropsychiatric problems (53.2%), followed by other major organ diseases (29.3%), cancer (10.1%), and PWD (7.4%), as shown in Table 1. Participants whose siblings had intellectual disability (22.1%) described the latter’s condition as being or having any of the following: special child, Down syndrome, autism, global late development, and mental retardation; central nervous system disorders were seizures, epilepsy, dementia, stroke, hydrocephalus, meningitis, or cerebral palsy. Some respondents had siblings with a learning disability (i.e., hearing, visual, and speech impairment); other siblings had a psychiatric disorder (i.e., bipolar disorder, schizophrenia, clinical depression). Among the cardiovascular diseases, patent ductus arteriosus, patent foramen ovale and hypertension were mentioned. Endocrine diseases included goiter, hyperlipidemia, and diabetes; malignancies included leukemia, prostate and breast cancer. Physical disability was present as a congenital condition or a bilateral lower extremity amputation. Most of the participants (53.99%, 95% CI 48.90, 58.99%) had highly functional FF. Less than 5% had dysfunctional FF, as seen in Table 2. The untransformed
(raw) and transformed mean scores of QoL and its domains are presented in Table 3. The overall QoL of the participants was 69.56 ± 8.79. Among the
Table 1. Demographic characteristics and profile of participants (N = 376). Variables Participants, n (%)
Sex Male 141 (37.5) Female 235 (62.5)
Age (years), mean ± SD 15-35 26.0 ± 4.82 15-19 39 (10.4) 20-24 115 (30.6) 25-29 121 (32.2) 30-34 84 (22.3) ≥35 17(4.5)
Education None 3 (0.8) Primary 15 (4.0) Secondary 145 (38.6) Tertiary 191 (50.8) Vocational 20 (5.3) Postgraduate 2 (0.5)
Marital status Single 50 (13.3) Married 76 (20.2) Common-law spouse 241 (64.1) Separated 7 (1.9) Widowed 2 (0.5)
Employment/regular Yes 167 (44.4)activity No 209 (55.6)
Financial source for Savings/salary 212 (56.4)expenses Family 105 (27.9) Spouse 49 (13.0) Children 2 (0.5) Not specified 7 (1.9) None 1 (0.3)
Presence of illness No 359 (95.5) Not diagnosed but feels like they have 17 (4.5)
Disease of the Cardiovascular 46 (12.2)respondent’s sibling Lung 8 (2.1) Kidney 13 (3.5) Endocrine 42 (11.2) Gastrointestinal 1 (0.3) CNS disorder 54 (14.4) Intellectual disability 83 (22.1) Learning disability 43 (11.4) Psychiatric disorder 20 (5.3) Cancer 38 (10.1) PWD 28 (7.4)
Family function and the quality of life of young adults with chronically-ill siblings

49 VOL. 9 NO. 2 • JULY - DECEMBER • UERM Health Sciences Journal
Table 2. Family function classification, frequency distribution. Family Function Classificationa Frequency 95% CI (%) n = 376 (%)
Highly dysfunctional 1 (0.27) 0.04, 1.88Moderately dysfunctional 13 (3.46) 2.01, 5.88Functionally at risk 46 (12.23) 9.28, 15.97Moderately functional 113 (30.05) 25.61, 34.90Highly functional 203 (53.99) 48.90, 58.99
aRaw scores were classified as highly dysfunctional (0 - 6), moderately dysfunctional (7 - 12), functionally at risk (13 - 18), moderately functional (19 - 24), and highly functional (25 - 30) as proposed by Powazki & Walsh.14
Table 3. Quality of life (QoL) mean scores, untransformed and transformed. Dimensions of Quality Untransformed Transformed of Life Scores Scoresb
Mean ± SD Mean ± SD
Overall quality of life 3.48 ± 0.44 69.56 ± 8.79 Physical health 3.28 ± 0.47 65.52 ± 9.48 Psychological health 3.59 ± 0.51 71.90 ± 10.10 Social relationships 3.77 ± 0.66 75.48 ± 13.21 Environment 3.43 ± 0.62 68.66 ± 12.38
Perceived quality of life 3.55 ± 0.87 71.17 ± 17.43Perceived health state 3.58 ± 0.78 71.60 ± 15.58
bScores were transformed using the standard scoring mechanics for the WHOQoL-BREF raw scores by multiplying each domain by 20.12
Table 4. Quality of life classification, frequency distribution. Quality of life Frequency 95% CI (%)classificationc n = 376, (%)
Poor 3 (0.80) 0.26, 2.46Fair 250 (66.49) 61.54, 71.10Good 123 (32.71) 28.14, 37.64
cRaw scores were classified as poor (26 - 60), fair (61 - 95), and good (96 - 130) quality of life according to the categorization of Dajpratham, Tantiniramai, & Lukkanapichonchut.15
Figure 1. Scatter plot of CAPGAR (x-axis) and transformed domain total of WHOQOL-BREF Score (y-axis).
transformed mean scores, social relationships had the highest score, followed in decreasing order by psychological health, environment, and physical health. Scores for perceived QoL and perceived health state were 3.55 and 3.58, respectively. As shown on Table 4, all except three respondents had a fair to good quality of life. Family function was shown to have a significant positive correlation with overall quality of life (r
s = 0.27, p < 0.001), the physical domain (r
s = 0.11,
p = 0.032), psychological health domain (rs = 0.27,
p < 0.001), social relationships domain (rs = 0.25,
p < 0.001), and environment domain (rs = 0.24,
p < 0.001). The correlation coefficients ranged from 0.11 to 0.27, considered as weak positive correlation.16
The scatterplot demonstrated that as the FF of young adults increased, their QoL also increased (Figure 1).
Family function and the quality of life of young adults with chronically-ill siblings

50 UERM Health Sciences Journal • VOL. 9 NO. 2 • JULY - DECEMBER 2020
Discussion
Family function is an essential factor affecting the quality of life of an individual. The objective of this study was to determine the correlation of FF and the QoL among healthy young adults with siblings with chronic diseases. Sharpe found that adults who have chronically-ill siblings appear to be more compassionate and resilient; he also indicated the possible negative effects on the psychological and emotional life of those individuals with a chronically-ill sibling.5 The present study shows that most young adults have fair QoL, where psychological and social indicators scored highest. This proportion of participants is consistent with the findings of Almeida-Brasil who explained that in this stage of life, a functional peak of networks of relationships are established, with much time devoted on friendship.17
The physical health domain, which includes activities of daily living, dependence on medicinal substances and medical aids, enough energy and mobility, pain and discomfort, sleep and rest, and work capacity, had the least correlation with family function (r
s = 0.11, p = 0.032). These factors play a vital role in a
person’s functionality, and could affect an individual’s QoL. The low correlation of physical health can be attributed to the participants’ age and medical status, being young adults with no comorbidities or illnesses. The respondents may tend to ignore their physical complaints, as there may be a sense of omnipotence when caring for others, as shown by Ribe.18 Hence, the physical domain is less likely to have strong correlation with family function. Among the other components of the WHO-QoL-BREF, the psychological domain has the highest correlation (r = 0.27, p < 0.001) with FF. Rossiter and Sharpe concluded that having a brother or sister with disability has a negative effect on psychological functioning, caretaking, and peer activities but it has a positive effect on the quality of the sibling relationship.5 Other studies also show that family closeness, greater sensitivity and personal growth are some of the positive effects of having a sibling with disability. Moreover, Patterson mentions that coping which is directed at keeping the family integrated - by doing things together as a family - maintains a good outlook in life, thus corresponding to having a good family function.19 Filipino culture, deeply rooted in its family-centered attitude, is a potential factor to
consider in determining function, especially when it comes to care and support for loved ones. The use of CAPGAR questionnaire in this study looked into the functional state of the patient’s family because chronic illness and disability represent a certain stress to the family, as in the study of Smilkstein.20
Majority of the participants in this research have highly functional families. Panganiban cited that close family ties and close-knit communities influence FF.21 Friends and neighbors alike are ready to help the family in times of crisis. This observation is consistent with the findings of Love and Murdock, who observed that attachment (operationalized as paternal and maternal care) was a significant factor for the well-being of a young adult, and that membership in an intact, biological family is associated with higher levels of psychological well-being.22
It is possible that siblings of persons with chronic illnesses may still have a positive outlook and good QoL because they accept and understand the need of their sibling. Menguito and Teng-Calleja discussed “bahala na” as a reflection of the Filipino’s courage, optimism, and hope which serve as springboards towards success.23 Though perhaps taken as a form of surrender on one hand, the expression “bahala na” implies confidence and motivation to keep facing whatever may come. Questions 28 and 29 of the Filipino version of WHOQoL-BREF allow the participants to share their thoughts in improving their QoL through these questions: “Anu-ano ang mga bagay na makakadagdag ng kalidad sa inyong buhay?” and “Paano sa inyong palagay, maitataas ang kalidad ng inyong buhay?” Most participants said that QoL can be improved through education and opportunities to attain financial growth. This way, they can support their families better, making them happier with a sense of accomplishment. Aside from personal means to attain financial growth, the participants also count on the government’s assistance in lowering prices of commodities, better support for persons with disability (PWDs), and even better public transportation to lighten traffic. These answers fall under the environment domain, which has the second lowest correlation to FF. Other answers include quality time and communication within families, which further highlights the importance Filipinos give towards their family function. Economy and socialization may remain at the core of what it means to be a family, as mentioned earlier. Roces calls this core “politica de familia” and claims that
Family function and the quality of life of young adults with chronically-ill siblings

51 VOL. 9 NO. 2 • JULY - DECEMBER • UERM Health Sciences Journal
Filipinos “perceive the world in terms of how outside resources could be used to improve the status of the family in socio-economic terms.”24 Filipinos, in spite of inherent challenges, have a “primary allegiance” to the family - often viewing the self as an extension of it, and holding the family’s wellbeing to be more important than one’s own.24
In summary, this study shows that among young adults with chronically-ill siblings, family function is high and correlates with quality of life. A limitation of this study is the study population came from certain barangays, hospitals, and institutions which approved the request for data collection. Several hospitals and non-government organizations declined the invitation to participate, citing the Data Privacy Act. Future studies can be done using qualitative methods to explore the relationship between family function and quality of life in more depth. One-on-one interviews or focus group discussions may provide better understanding of the feelings, challenges and experiences of the chronically ill individual’s siblings which may complement the WHOQOL BREF and CAPGAR findings. Future studies can also have participants from a younger population starting from 14 years of age, as the teenage years are crucial in holistic development and any significant findings in this age group would thus need support from the family and society. Further studies may likewise perform separate analyses per category of disease to identify more precisely which diseases have the greatest impact on the quality of life and family function. This study showed that despite having chronically- ill siblings, more than half of young adults had highly functional families. Two-thirds of the participants had fair quality of life. There is a weak but significant positive correlation between family function and quality of life among young adults with a sibling suffering from a chronic debilitating illness.
Acknowledgements
We wish to acknowledge and thank the barangay captains and PWD focal person representatives whose assistance greatly expedited our search for participants, the participants who patiently and candidly answered the questionnaires, and the UERMMMCI and World Citi Medical Center.
Source of fundingThis research was funded by the UERMMMCI College of Medicine.
Conflict of interestThe authors declare no conflict of interest.
References 1. Secinti E, Thompson EJ, Richards M, Gaysina D. Research
review: Childhood chronic physical illness and adult emotional health - a systematic review and meta-analysis. J Child Psychol Psychiatr 2017; 58(7): 753-69. doi: 10.1111/jcpp.12727. Epub 2017 Apr 27.
2. Ogunlana MO, Dada OO, Oyewo OS, Odole AC, Ogunsan MO. Quality of life and burden of informal caregivers of stroke survivors. Hong Kong Physiother J 2014; 32(1): 6-12.
3. Berggreen SM. A study of the mental health of the near relatives of twenty multihandicapped children. Acta Pædiatr 1971; 60: 6-24.
4. Mattsson A. Long-term physical illness in childhood: A challenge to psychosocial adaptation. Pediatrics 1972; 50(5): 801-11.
5. Sharpe D, Rossiter L. Siblings of children with a chronic illness: A meta-analysis. J Pediatr Psychol 2002; 27(8): 699-710.
6. McKeever P. Siblings of chronically-ill children: A literature review with implications for research and practice. Am J Orthopsychiatr 1983; 53(2): 209.
7. Frawley JE, Hebert RS. Seriously ill pediatric patients who transition to adulthood. J Palliat Med 2018; 21(2): 257-8.
8. Rana P, Mishra D. Quality of life of unaffected siblings of children with chronic neurological disorders. Indian J Pediatr 2015; 82(6): 545-8. doi: 10.1007/s12098-014-1672-4. Epub 2015 Feb 3.
9. Department of Health. The 2015 Health Statistics. Available from: https://www.doh.gov.ph/sites/default/files/publications/2015PHS.pdf. Accessed May 2019.
10. Rodríguez-Sánchez E, Pérez-Peñaranda A, Losada-Baltar A, et al. Relationships between quality of life and family function in caregiver. BMC Fam Pract 2011; 12:19. doi: 10.1186/1471-2296-12-19
11. Medina M. Section of Supportive Hospice & Palliative Medicine. The Comprehensive Family APGAR (CAPGAR). In: Compendium of Filipino Assessment Tools for Clinical Practice and Research. Available from: https://sites.google.com/site/hospiceandpalliativemedicine/compendium-of-filipino-assessment-tools
12. World Health Organization. World Health Organization Quality of Life-BREF: Introduction, administration, scoring and generic version of the assessment, program on mental health. 1996. Available from: http://www.who.int/mental_health/media/en/76.pdf.
Family function and the quality of life of young adults with chronically-ill siblings

52 UERM Health Sciences Journal • VOL. 9 NO. 2 • JULY - DECEMBER 2020
13. Good MD, Smilkstein G, Good BJ, Shaffer T, Arons T. The Family APGAR Index: A study on construct validity. J Fam Pract 1979; 8(3): 577-82.
14. Powazki RD, Walsh D. Family distress in palliative medicine: A pilot study of the family APGAR scale. Am J Hosp Palliat Care, 2002; 19(6).
15. Dajpratham P, Tantiniramai S, Lukkanapichonchut P. Health related quality of life among the Thai people with unilateral lower limb amputation. J Assoc Med Thai = Chotmaihet thangphaet, 2011; 94(2): 250-5. Available from: https://www.ncbi.nlm.nih.gov/pubmed/21534374. Accessed May 16, 2019.
16. Daniel WW, Cross CL. Biostatistics: A foundation for analysis in the health sciences. 11th ed. Wiley 2013; 191-3.
17. Almeida-Brasil CC, Silveira MR, Silva KR, et al. Quality of life and associated characteristics: Application of WHOQOL-BREF in the context of primary health care. Revista Ciência & Saúde Coletiva 2017; 22(5).
18. Ribé JM, Salamero M, Testor CP, et al. Quality of life in family caregivers of schizophrenia patients in Spain: Caregiver characteristics, caregiving burden, family functioning, and social and professional support. Int J Psychiatry Clin Pract 2018; 22(1): 25-33.
19. Patterson JM, McCubbin HI, Warwick WI. The impact of family functioning on health changes in children with cystic fibrosis. Soc Sci Med 1990; 31(2): 159-64.
20. Smilkstein G. The family APGAR: A proposal for a family function test and its use by physicians. J Fam Pract 1978; 6(6): 1231-9.
21. Panganiban-Corales AT, Medina MF. Family resources study: Part 1: Family resources, family function and caregiver strain in childhood cancer. Asia Pac Fam Med 2011; 10:14.
22. Love KM, Murdock TB. Attachment to parents and psychological well-being: An examination of young adult college students in intact families and stepfamilies. J Fam Psychol 2004; 18(4): 600–8. doi:10.1037/0893-3200.18.4.600.
23. Menguito MM, Teng-Calleja M. Bahala na as an expression of the Filipino’s courage, hope, optimism, self-efficacy, and search for the sacred. Phil J Psychol 2010; 43(1): 1-26.
24. Roces M. Kinship politics in post-war Philippines: The Lopez Family, 1945-1989. Mod Asian Stud, 2000; 34(1): 181-221. Available from: http://www.jstor.org/stable/313115.
-
Family function and the quality of life of young adults with chronically-ill siblings
53 VOL. 9 NO. 2 • JULY - DECEMBER • UERM Health Sciences Journal
A study on the knowledge, attitude and behavior regarding mental health of residents in a selected barangay
Richard Dean Clod C. Dela Cruz, Kelvin Michael G. Dela Cruz, Micah Jeanne A. Dela Rosa, Maria Kristina P. Descalzo, Andrew Carlo F. Dioso, Angelica Mae Camille P. Dizon, Ellen Stephanie M. Dizon, Vince Gabriel B. Dulay, Justine William T. Duran, Felicitas Asuncion C. Elago, Nicole Pauline L. Ereño, Angela B. Escobia, Karl Lorenzo Miguel M. Escovidal, Miraflor A. Espeleta, and Franciosa Gavino-Collins, MD, MPH
AbstractIntroduction Stigmatizing attitudes are barriers to treatment of mental health disorders. The burden of stigma has not been established locally. This study aimed to assess the stigma in the community by determining the knowledge, attitudes and behaviors of barangay residents towards mental health and persons with mental health illness.Methods A total of 422 participants were included using convenience sampling. Participants were given self-administered questionnaires that consisted of the Mental Health Knowledge Schedule (MAKS), Community Attitudes Towards the Mentally Ill (CAMI), and Reported and Intended Behavior Scale (RIBS) tools. The mean scores and percentages were computed and compared across the sociodemographic data of the respondents.Results Knowledge levels were relatively high with a mean score of 26.63. Depression, stress, bipolar disorder and drug addiction were recognized as mental illnesses by the majority of the participants. Scores in the stigmatizing ideologies authoritarianism (3.07) and social restrictiveness (2.58) were low, while the positive ideologies benevolence (3.76) and community health ideology (3.85) had higher scores. Participants were reluctant to work with mentally-ill people (3.18) but were willing to be friends with them (3.87).Conclusion This study concludes that the respondents were generally knowledgeable about mental health illness. There was a general acceptance and less stigmatizing attitude, and a willingness to interact with people with mental illness.
Keywords: Mental health, stigma, mental illness, behavior, psychiatry
_________________
Correspondence: Franciosa Gavino-Collins, MD, MPH, Department of Preventive
and Community Medicine, College of Medicine, University of the East Ramon Magsaysay Memorial Medical Center, Inc., 64 Aurora Boulevard, Barangay Doña Imelda, Quezon City, PH 1113; Email: [email protected]
In 2016, the global burden of mental health disorders reached around 15.5%, affecting 1.1 billion people.1
Lifetime prevalence may reach up to 36% among those
affected.2 Over the years, the burden has increased further, equivalent to 13.0% of disability-adjusted life years (DALYs) and 21.5% years lost to disability (YLD).3 Persons with mental disorders are 60% more likely to die prematurely from non-communicable diseases. It is estimated that around 14.6% or 8 million deaths worldwide are attributed to mental disorders.4 Unfortunately, mentally-ill people have to face the stigma against mental health illnesses which may mark them as outcasts; as a consequence, around 70% fail to receive treatment.5,6

54 UERM Health Sciences Journal • VOL. 9 NO. 2 • JULY - DECEMBER 2020
Stigma has been conceptualized to consist of three facets: knowledge, attitudes and behavior.7 It is one of the main barriers in providing services to persons with mental illness. Stigma marks persons with mental illness, making the community and health workers look at them with low regard.8 Studies suggest that factors that lead to decreased health-seeking behavior by the persons with mental illness include lack of knowledge, ignorance of accessibility of treatment, prejudice, and discrimination.5 It is also established that stigmatizing attitudes have been associated with reluctance to seek help.6
The prevalence of mental disorders in the Philippines is 13% , with anxiety disorder being the most common.1 The President signed into law RA 11036, the Philippine Mental Health Law, in June 2018.9 Although there are studies that support the effectiveness and feasibility of primary health care for the mentally-ill in the Philippines, there has been no real nationwide integration.7,10 There are 19 community-based psychiatric inpatient units, or 1.58 beds per 100,000 population.7 Stigma persists in the Philippines, but its burden has not been established. According to the Department of Health, the lack of programs contributes to the persistence of stigma.11,12 This study aimed to determine the knowledge, attitude and behavior of respondents towards mental health and mental health illness.
Methods
This is a descriptive cross-sectional study using the Mental Health Knowledge Schedule (MAKS), Community Attitudes Towards the Mentally Ill (CAMI), and Reported and Intended Behavior Scale (RIBS) questionnaires to measure the level of knowledge, attitude, and behavior towards mental health and mental illness, respectively, among residents of Barangay Tibagan in San Juan City. A sample size of 422 respondents was computed using the formula to estimate a population parameter for measuring prevalence. Residents of Barangay Tibagan who were 18 to 65 years old, mentally capable, and could read and write were invited and selected by logistical convenience sampling. Those who had incompletely answered the questionnaires were excluded. Those who gave their informed consent were asked to answer the three questionnaires which were previously translated in Filipino.
Questionnaires measuring the knowledge, attitude, and behavior of the respondents were based on published research utilizing KAB as a measurement for mental health and mental illness.5 The Mental Health Knowledge Schedule (MAKS) was designed to assess the mental health-related knowledge of a population, to determine the trend in changing levels of mental health knowledge, and to track stigma-related mental health knowledge.13-17 The MAKS consisted of six stigma-related mental health knowledge categories: help-seeking, recognition, support, employment, treatment, and recovery; and six mental illness condition recognition categories, including depression, stress, schizophrenia, bipolar disorder, and grief. The questionnaire’s reliability for the study was moderate to substantial at 0.71 (Lin’s concordance statistic) while the internal consistency was moderate at 0.65 (Cronbach’s alpha). A modified version of the Community Attitudes Toward the Mentally Ill (CAMI), consisting of 26 items, was used to measure the attitude of the respondent on mental distress.18 The questionnaire was divided into four subscales: 1) authoritarianism (AU), viewing a person with mental illness as someone inferior and requiring supervision; 2) benevolence (BE), a humanistic and sympathetic view towards persons with mental illness; 3) social restrictiveness (SR), the belief that persons with mental illness were a threat to society and should be avoided; and 4) community mental health ideology (CMHI), the acceptance of mental health services and the integration of persons with mental illness in the community. The questionnaire’s reliability index for each subscale measured using Cronbach’s alpha was AU = 0.68, BE = 0.76, SR = 0.80, CMHI =0.88.18-21 CAMI was analyzed by obtaining the mean score using the Likert 5-point labeled scale: 5 strongly agree (SA); 4 agree (A); 3 neutral (N); 2 disagree (D); and 1 strongly disagree (SD). The Reported and Intended Behavior Scale (RIBS) was used to assess the behavioral discrimination of a population towards mental illness. It is an 8-item questionnaire from the Star Social Distance Scale dividing the behavior of the population into their current and potential behavior which is depicted in four different contexts: 1) living with, 2) working with, 3) living nearby, and 4) continuing relationships with mentally-ill individuals. The questionnaire’s reliability for the study was moderate to substantial, 0.75 (Lin’s concordance statistic)
Knowledge, attitude and behavior regarding mental health of residents in a selected barangay

55 VOL. 9 NO. 2 • JULY - DECEMBER • UERM Health Sciences Journal
while the internal consistency was moderate, 0.85 (Cronbach’s alpha). The study utilized Cronbach’s alpha in assessing the internal consistency in the three questionnaires. Mean scores were obtained from each questionnaire which was then compared internally and externally. For the analysis of MAKS, each item was scored using the Likert Scale to obtain the total mean score. A comparison of mean scores was performed across different prior studies.14-17,22 The mean scores of the target population were compared to the mean scores of community samples, health care worker samples, and health care professional samples from other countries studied by other researchers. For the analysis of CAMI, the items were also scored using the Likert scale and the total mean score was analyzed based on the four subscales: authoritarianism, benevolence, social restrictiveness, and community mental health ideology. Each subset was analyzed by the respondent’s stand as being pro- or anti-subscale where a high-score in authoritarianism and social restrictiveness denoted a profound stigma and a high score in benevolence and community mental health ideology indicated a minor stigma and acceptance of the mentally ill.18,22-,24 For analysis of RIBS, the mean percentage of responses was computed for Part A while the Likert scale mean score was computed for Part B. The mean scores and percentages were computed and compared across the sociodemographic data of the respondents.
Results
The study consisted of 422 participants with mean age of 37.6 years; 70% were 25 to 59 years old and more than half were women. As seen in Table 1, 75% of respondents were at least a high school graduate and 60% were employed or engaged in business. The Community Attitudes Toward the Mentally Ill (CAMI) and Reported and Intended Behavior Scale (RIBS) had a Cronbach’s alpha of 0.755 and 0.754, respectively. The Mental Health Knowledge Schedule (MAKS) had a Cronbach’s alpha of 0.695, which is comparable to the original study of Evans-Lacko who obtained a Cronbach’s alpha of 0.69-0.71.21
For the first part of MAKS, 80 to 90% of respondents agreed to statements on helping persons with mental health problems seek help, that treatment can be effective, that they need support and wish to be employed, and that they can recover from their
illness. The mean MAKS score for this part was 26.63 out of a possible 30 points. College graduates had the highest mean score at 26.58; mean scores were noted to increase from elementary to college. There was no difference in mean scores between sexes and across age groups. As shown in Table 2, depression was recognized as a form of mental illness by 75% of respondents. More than half recognized stress, schizophrenia, bipolar disorder and drug addiction as mental health illnesses. Forty percent of respondents saw grief as a mental health problem and less than half said that it is not a mental health problem. Forty percent of respondents did not know whether schizophrenia is a mental health problem and a third did not know whether bipolar disorder is a mental health problem. Benevolence and community mental health ideology (CMHI), the positive attitudes towards mental health illness had relatively higher mean scores (3.76 and 3.85, respectively), compared with the subscales denoting negative attitudes (authoritarianism 3.07 and social restrictiveness 2.58), as seen in Table 3. The same pattern was noted in both sexes and across age groups and levels of education. The men had higher mean scores in authoritarianism (3.13 vs 3.03) and social restrictiveness (2.65 vs 2.52); the scores for
Table 1. Socio-demographic characteristics of 422 respondents. Variable n (%)
Sex Male 180 (42.6) Female 242 (57.4)
Age (years) 18-24 93 (22.0) 25-39 145 (34.4) 40-59 150 (35.5) 60-65 34 (8.1)
Occupation Unemployed 134 (31.8) Employed 216 (51.2) Businessman 40 (9.5) Student 32 (7.6)
Education No formal education 15 (3.6) Elementary 24 (5.7) High School 157 (37.2) College 186 (44.1) Postgraduate 40 (9.5)
Knowledge, attitude and behavior regarding mental health of residents in a selected barangay

56 UERM Health Sciences Journal • VOL. 9 NO. 2 • JULY - DECEMBER 2020
benevolence (3.77 vs 3.75) and CMHI (3.91 vs 3.98) were similar between sexes. Starting in early adulthood (25-39 years) benevolence and CMHI scores decreased with increasing age while SR scores increased with increasing age. Benevolence and CMHI showed an increasing trend in mean scores with higher levels of education, while a decreasing trends with higher levels of education was noted for authoritarianism and SR as seen in Table 3. The Reported and Intended Behavior Scale (RIBS) revealed that participants had a low prevalence of contact with people with mental health problems at home (20.9%), at work (16.1%), and as a neighbor (42.2%); however, more than half (56.2%) of the participants had a close friend with a mental health problem. More than half of respondents were willing to live with (53.1%) or have a neighbor (55.1%) with
Table 2. Respondents’ recogntion of mental illness conditions.
MAKS Part II, n (%) Mental illness Not a mental illness I don’t know
1. Depression 320 (75.8) 73 (17.3) 29 (6.9)2. Stress 243 (57.6) 152 (36) 27 (6.4)3. Schizophrenia 212 (50.2) 42 (10) 168 (39.8)4. Bipolar disorder 247 (58.5) 51 (12.1) 124 (29.4)5. Drug addiction 236 (55.9) 148 (35.1) 38 (9)6. Grief 168 (39.8) 199 (47.2) 55 (13)
Table 3. Mean CAMI subscale scores and mean scores based on sex, age and educational attainment.
Variable AU BE SR CMHI
Mean subscale score 3.07 3.76 2.58 3.85
Sex Male 3.13 3.77 2.65 3.91 Female 3.03 3.75 2.52 3.98
Age group (years) 18 - 24 3.05 3.79 2.43 3.92 25 - 39 3.03 3.83 2.47 4.05 40 - 59 3.12 3.71 2.72 3.90 60 - 65 3.06 3.61 2.81 3.84
Educational level No formal education 3.22 3.65 2.17 4.15 Elementary 3.13 3.34 3.00 3.49 High school 3.10 3.72 2.66 3.89 College 3.06 3.85 2.43 4.09 Postgraduate 2.91 3.85 2.62 3.87
AU – authoritarianism, BE – benevolence, SR – social restrictiveness, CMHI – community mental health ideology
mental health issues. Less than half (48.1%) were willing to work with such a person and 70.9% were willing to continue the relationship with a friend who developed a mental health problem. Respondents who were 25 to 39 years old had the highest RIBS mean score (14.2). A decrease in mean scores was noted with increasing age: 13.3 for 40-59 years and 12.2 for 60-65 years. There was no difference in the mean scores between sexes and there was no discernible pattern across levels of education.
Discussion
The findings that 80 to 90% of respondents answered affirmatively to the Mental Health Knowledge Schedule (MAKS) questions and the
Knowledge, attitude and behavior regarding mental health of residents in a selected barangay
57 VOL. 9 NO. 2 • JULY - DECEMBER • UERM Health Sciences Journal
mean score of 26.63 indicate a high level of mental health and stigama-related knowledge. The results are consistent with those of previous studies.5-9,11,14 Previous studies found that age and educational attainment are factors affecting the MAKS score while another study noted minimal differences in MAKS scores relative to educational attainment.10,11,25,26 The results suggest that age and educational attainment, but not sex may have an effect on MAKS scores which is consistent with other researches.25,27
Depression was the most commonly recognized condition as a mental health disorder. Stress, schizophrenia, bipolar disorder and drug addiction, but not grief, were also regarded as mental health conditions. The results are similar to those of other studies.28,29 Henderson noted that stress may be perceived as a symptom rather than a condition.5 This may explain why 152 respondents said that stress is not a mental health illness. The finding that 40% of respondents did not know whether schizophrenia is a mental disorder is similar to findings in other Asian countries where the recognition of the condition is low.6-8 That 30% of respondents did not know that bipolar disorder is a mental health condition is lower than a sample from England.11,22 More than a third of respondents did not consider drug addiction as a mental health condition. Abdullah postulates that these respondents believe that the persons choose to be addicted to substances rather perceive that there is a dysfunction in the mechanism of pleasure seeking and reward in the brains of those with addiction problems.30 Less than half of respondents recognized grief as a mental health problem; they may perceive grief as a normal and temporary state.18
The males had a high mean score compared with the females, similar to the findings of Aznar-Lou.31 The respondents belonging to the 40 to 59-year-age group had higher authoritarian scores compared with the other age brackets. Letovancova posits that this may be due to fear and lack of trust in persons with mental illness.32 Evans-Lacko found that the older generation tended to have more fear and lack of trust on people with mental illness, leading to a higher stigmatization.33 Song found a strong association between increasing age and authoritarianism.34 The data showed an inverse relationship between an individual’s educational level and authoritarianism score, similar to the findings in several other studies where lower levels
of education was associated with a more negative attitude towards persons with mental illness.20,35,36
Social restrictiveness (SR) received the lowest mean score among the subscales, indicating that participants were unlikely to view the mentally ill as a threat to society. Women had lower scores consistent with the findings in Singaporean women.37 Various studies had different findings regarding age and social restrictiveness, with several associating higher SR scores with increasing age and those which found no relation.38-41 The results of this study show that SR score increased with age. Park attributed this to lesser exposure of older people to persons with mental illness and differences in outlook across generations.41 The findings showed that SR scores decreased with an increasing level of education. These results are in contrast with those from Ethiopia, in which well-educated individuals had higher SR scores.35,42 The higher benevolence scores among men compared with women indicate that the males were more accepting and encouraging for people with mental illnesses. The respondents below 60 years had higher scores, with those 25 to 39 years having the highest scores. Some studies found no relationship between benevolence and educational attainment while others concluded that benevolence comes with higher educational attainment.20,31,36 The results show increasing benevolence scores with higher levels of education. Community mental health ideology (CMHI) had the highest mean score among the four subscales. Women had higher scores than men, similar to other sutdies.37,43 Respondents aged 25 to 39 years had the highest mean score; the scores decreased with increasing age after 39 years.The results are similar to those of other investigators.33,39,44,45 The findings, similar to those of Reta, revealed increasing scores with higher educational attainment.35 The high mean scores for benevolence and community mental health ideology (CMHI) coupled with lower scores for authoritarianism and social restrictiveness (SR) reflect the respondents’ positive and less stigmatizing attitude towards persons with mental health disorders. This study concludes that the respondents were generally knowledgeable about mental health illness. There was a general acceptance and less stigmatizing attitude, and a willingness to interact with people with mental illness.
Knowledge, attitude and behavior regarding mental health of residents in a selected barangay

58 UERM Health Sciences Journal • VOL. 9 NO. 2 • JULY - DECEMBER 2020
Acknowledgments
The authors would like to thank Dr. Catherine Danielle R. Duque-Lee and Dr. Ralph Cylon M. Jacinto for their advice and support as their supervisors in the making of this paper. The authors would also like to thank the Tibagan Barangay Chairman Daniel Simon Gaa and the barangay health workers who devoted their time in helping them in their data collection.
Support/Funding
This paper received financial support from the UERMMMCI College of Medicine.
Conflict of interest declaration
The authors certify that they have NO affiliations with or involvement in any organization or entity with any financial or non-financial interest in the subject matter or materials discussed in this manuscript. No connections, agreements, or sponsorships were made with the authors of the references used in the research.
References 1. Ritchie H, Roser M. Mental Health. 2018. [Accessed 2018
Nov 18] Available from: https://ourworldindata.org/mental-health
2. Kessler RC, Angermeyer M, Anthony JC, et al. Lifetime prevalence and age-of-onset distributions of mental disorders in the World Health Organization’s World Mental Health Survey Initiative. World Psychiatry 2007; 6(3): 168-76.
3. Vigo D, Thornicroft G, Atun R. Estimating the true global burden of mental illness. The Lancet Psychiatry 2016; 3(2): 171-8.
4. Sartorius N. Stigma and mental health. The Lancet 2007; 370(9590): 810-1.
5. Henderson C, Evans-Lacko S, Thornicroft G. Mental illness stigma, help seeking, and public health programs. Am J Public Health 2013; 103(5): 777-80.
6. Ahmedani B. Mental health stigma: society, individuals, and the profession [Internet]. PMC, 2018 [cited 2018 Nov 10]. Available from: https://www.ncbi.nlm.nih.gov/pmc/articles/PMC3248273/
7. C o n d e B. P h i l i p p i n e s m e n t a l h e a l t h c o u n t r y profile. Int Rev Psychiatry, 2004; 16(1-2): 159-66. doi:10.1080/095402603100016. [Accessed 15 Nov 2018]
8. Walker E, McGee R, Druss B. Mortality in mental disorders and global disease burden implications. JAMA Psychiatry 2015; 72(4): 334.
9. Republic Act No. 11036 | GOVPH [Internet]. Official Gazette of the Republic of the Philippines. 2018 [cited 2018 Nov 10]. Available from: https://www.officialgazette.gov.ph/2018/06/20/republic-act-no-11036/
10. Greenhalgh T. WHO/WONCA report – Integrating mental health in primary care: A global perspective. London J Prim Care 2009; 2(1) :81-2.
11. Rivera AK, Antonio CA. Mental health stigma: time for paradigm shift. Philipp J Health Res Dev 2017; 21(2): 20-4.
12. Department of Health. Health Policy Notes: Scaling Up the Mental Health Program. Manila, Philippines. 2008.
13. Evans-Lacko S, Little K, Meltzer H, et al. Development and psychometric properties of the mental health knowledge schedule. Can J Psychiatry 2010; 55(7): 440–8.
14. Triplett D. Working with mental illness and the preparation of social workers. 2017
15. Pheh KS, WH AO, Low SK, Tan CS, Kok JK. The Malay version of the Mental Health Knowledge Schedule: A preliminary study. Malaysian J Psychiatry 2018; 26(1).
16. Li J, Fan Y, Zhong HQ, et al. Effectiveness of an anti-stigma training on improving attitudes and decreasing discrimination towards people with mental disorders among care assistant workers in Guangzhou, China. Int J Ment Health Syst 2019; 13(1): 1s.
17. Sibeko G, Milligan PD, Roelofse M, et al. Piloting a mental health training programme for community health workers in South Africa: An exploration of changes in knowledge, confidence and attitudes. BMC Psychiatry 2018; 18(1): 191.
18. Taylor SM, Dear MJ. Scaling community attitudes toward the mentally ill. Schizophr.Bull 1981; 7: 225–40.
19. Girma E, Tesfaye M, Froeschl G, Möller-Leimkühler AM, Müller N, Dehning S. Public stigma against people with mental illness in the Gilgel Gibe Field Research Center (GGFRC) in Southwest Ethiopia. PLOS ONE 2013; 8(12).
20. Barke A, Nyarko S, Klecha D. The stigma of mental illness in southern ghana: attitudes of the urban population and patients’ views. Soc Psychiatry Psychiatr Epidemiol 2011; 46: 1191–202. doi: 10.1007/s00127-010-0290-3
21. Audu I, Idris S, Olisah V, Sheikh T. Stigmatization of people with mental illness among inhabitants of a rural community in northern Nigeria. Int J Soc Psychiatry 2013; 59(1): 55–60. doi: 10.1177/0020764011423180
22. Evans-Lacko S, Henderson C, Thornicroft G. Public knowledge, attitudes and behaviour regarding people with mental illness in England 2009-2012. Br J Psychiatry 2013; 202(s55): s51-s7.
23. Basu R, Sau A, Saha S, Mondal S, Ghoshal P, Kundu S. A study on knowledge, attitude, and practice regarding mental health illnesses in Amdanga Block, West Bengal. Indian J Public Health 2017; 61(3): 169.
24. Rolstad S, Adler J, and Ryden A. Response burden and questionnaire length: is shorter better? a review and meta-analysis [Internet]. ScienceDirect. Elsevier; 2011 [cited 2019 Mar 3]. Available from: https://www.sciencedirect.com/science/article/pii/S1098301511015245
Knowledge, attitude and behavior regarding mental health of residents in a selected barangay

59 VOL. 9 NO. 2 • JULY - DECEMBER • UERM Health Sciences Journal
25. Keyes CLM. Mental health as a complete state: how the salutogenic perspective completes the picture. Bridging Occupational, Organizational and Public Health 2013; 179–92.
26. Galderisi S, Heinz A, Kastrup M, Beezhold J, Sartorius N. Toward a new definition of mental health. World Psychiatry 2015; 14(2): 231–3.
27. Anderson P, Jane-Llopis E, Hosman C. Reducing the silent burden of impaired mental health. Health Promot Int 2011; 26(suppl 1): i4–i9.
28. Rössler W. The stigma of mental disorders. EMBO reports 2016; 17(9): 1250–3.
29. Cagande C. Child mental health in the Philippines. A d o l e s c P s y c h i a t r y 2 0 1 3 ; 3 ( 1 ) : 1 1 - 3 . d o i : 10.2174/2210676611303010003
30. Abdullah T, Brown TL. Mental illness stigma and ethnocultural beliefs, values, and norms: an integrative review. Clin Psychol Rev 2011; 31(6): 934–48.
31. Aznar-Lou I, Serrano-Blanco A, Fernández A, Luciano JV, Rubio-Valera M. Attitudes and intended behaviour to mental disorders and associated factors in Catalan population, Spain: Cross-sectional population-based survey. BMC Public Health, 2015; 16(1): 127.
32. Letovancova K, Kovalcikova N, Dobrikova P. Attitude of society towards people with mental illness: The results of national survey of the Slovak population. Int J Soc Psychiatry 2017; 1(6). doi: 10.1177/0020764017696334
33. Evans-Lacko S, Corker E, Williams P, Henderson C, Thornicroft G. Effect of the time to change anti-stigma campaign on trends in mental-illness-related public stigma among the English population in 2003–13: An analysis of survey data. The Lancet Psychiatry 2014; 1(2): 121–8. doi: 10.1016/s2215-0366(14)70243-3
34. Song LY, Chang LY, Shih CY, Lin CY, Yang MJ. Community attitudes towards the mentally-ill: The results of a national survey of the Taiwanese population. Int J Soc Psychiatry 2005; 51(2): 162–76. doi: 10.1177/0020764005056765
35. Reta Y, Tesfaye M, Girma E, Dehning S, Adorjan K. Public stigma against people with mental illness in Jimma Town, Southwest Ethiopia. PLOS ONE 2016; 11(11): 1-14.
36. Ching LS, Ong SJ. Public Stigmatization Towards Mental Illness in Kampar, Perak. Doctoral dissertation, UTAR 2015.
37. Subramaniam M, Abdin E, Picco L, et al. Stigma towards people with mental disorders and its components – a perspective from multi-ethnic Singapore. Epidemiol Psychiatr Sci 2016; 26(4): 371–82
38. Gateshill G, Kucharska-Pietura K, Wattis, J. Attitudes towards mental disorders and emotional empathy in mental health and other healthcare professionals. The Psychiatrist 2011; 35(03): 101–5. doi: 10.1192/pb.bp.110.029900
39. Lauber C, Anthony M, Ajdacic-Gross V, Rössler W. What about psychiatrists’ attitude to mentally ill people? Eur Psychiatry 2004; 19(7): 423–7. doi: 10.1016/j.eurpsy.2004.06.019
40. Riana AR, Osman CB, Ainsah O. Psychiatric morbidity and attitudes towards mental illness among patients attending primary care clinic of Hospital Universiti Kebangsaan Malaysia. Malaysian J Psychiatry 2010; 17(1).
41. Park JP. A comparison of attitudes and perceptions toward mental health between Koreans in Korea and Korean Americans in U.S (Order No. 3494689). Available from: ProQuest Dissertations & Theses Global 2013. UMI Number: 3494689
42. Bedaso A, Yeneabat T, Yohannis Z, Bedasso K, Feyera F. Community attitude and associated factors towards people with mental illness among residents of Worabe Town, Silte Zone, Southern Nation’s Nationalities and People’s Region, Ethiopia. PLOS ONE 2016; 11(3).
43. Buizza C, Ghilardi A, Ferrari C. Beliefs and prejudices versus knowledge and awareness: how to cope stigma against mental illness. A college staff e-survey. Community Ment Health J 2017; 53(5): 589-97. Available from: https://doi.org/10.1007/s10597-017-0116-9
44. Ewalds-Kvist B, Högberg T, Lützén K. Impact of gender and age on attitudes towards mental illness in Sweden. Nord J Psychiatry 2012; 67(5): 360–8. doi: 10.3109/08039488.2012.748827
45. Papadopoulos C, Foster J, Caldwell K. “Individualism-Collectivism” as an explanatory device for mental illness stigma. Community Ment Health J 2012; 49(3): 270–80. doi: 10.1007/s10597-012-9534-x
Knowledge, attitude and behavior regarding mental health of residents in a selected barangay

60 UERM Health Sciences Journal • VOL. 9 NO. 2 • JULY - DECEMBER 2020
Correlation between incidence of dengue and climatic factors in the Philippines: An ecological study
Ann Kashmer D. Yu, Sophia Isabel E. Ytienza, Airees Mae D. Yu, Vincent Christopher S. Yu, Keith Alexius K. Wangkay, Maria Antonia R. Wong, Marielle Alyanna B. Zamudio, Eljine Mae T. Zhang, Wally D. Yumul, Zakhira Maye R. Zipagan, Arianna Krystelle R. Yaranon, Jake Byron C. Zapanta, Gija B. Ysip, and Catherine Danielle Duque-Lee, MD, MMHA
AbstractIntroduction Dengue continues to be a major health concern in the Philippines. This study aimed to establish trends and correlations between the incidence of dengue and rainfall, humidity and temperature, respectively, in the different regions.Methods Using 2018 records obtained from DOH and PAGASA, correlations were made between monthly measurements of climatic factors and the incidence of dengue using Pearson’s r, while maps and interpolations were generated using quantum geographical information system software.Results There was a significant positive but weak correlation between the incidence of dengue and rainfall (r = 0.379, 95% CI 0.255, 0.491; p < 0.001) and humidity (r = 0.215, 95% CI 0.080, 0.342; p = 0.002). There was a significant negative but weak correlation between the incidence of dengue and temperature (r = -0.145, 95% CI -0.277, -0.008; p = 0.039). A strong positive correlation was noted between the incidence of dengue, and rainfall and humidity, respectively, in several regions. Multiple regression indicates that rainfall, humidity and temperature are poor predictors of the incidence of dengue (R2 = 0.1436, 0.0461 and 0.0209, respectively).Conclusion This study showed overall a significant but weak correlation between an increased incidence of dengue and heavy rainfalls and high relative humidity, and a weak negative correlation for temperature. A high positive correlation of an increased incidence of dengue and heavy rainfalls and high relative humidity was observed in several regions.
Keywords: Dengue, rainfall, temperature, humidity, correlation
_________________* Presented in the 22nd Annual Research Forum, November
25, 2020 (online), UERMMMCI Research Institute for Health Sciences; recipient of the Dean Fernando S. Sanchez, Jr. Research and Publication Award
Correspondence: Catherine Danielle Duque-Lee, MD, MMHA, Department of
Preventive and Community Medicine, College of Medicine, University of the East Ramon Magsaysay Memorial Medical Center Inc., 64 Aurora Boulevard, Barangay Doña Imelda, Quezon City, PH 1113; e-mail: [email protected]
Dengue is a major public health concern mainly in tropical and subtropical parts of the world
with two-fifths of the world’s population at risk to its clinical manifestations and lethal complications. Reports indicate that there are about 50-100 million reported cases of this disease every year.1 The Philippines as a tropical country has a high incidence of dengue. Recent studies have shown that climatic factors such as temperature, humidity, and rainfall influence the distribution of the incidence of dengue.2
Despite the growing concern for the disease, there

61 VOL. 9 NO. 2 • JULY - DECEMBER • UERM Health Sciences Journal
have been limited local studies on the relationship between the number of dengue cases and these climatic factors.3 Majority of the international studies have concluded that these climatic factors are related with the dengue case incidence while a significant minority have suggested otherwise.4-6
To contribute to the growing area of research on dengue, the researchers used the Quantum Geographic Information System (QGIS) as an innovative tool to develop alternative means in conducting epidemiological studies, to advance the knowledge and understanding among high-risk communities, and to encourage further promotion and implementation of laws and healthcare programs to raise awareness for dengue.7 This is an analytic time-trend type of ecological study because the study is not only looking into dengue incidence over time in the different regions but it is also the ecological association between climatic changes over time and dengue incidence across the regions. This study aimed to establish a correlation between the incidence of dengue cases and the predisposing climatic factors observed across the regions. The specific objectives of the study were to determine recorded monthly and annual climatic data per region and to determine recorded monthly and annual number of dengue cases in. The study then aimed to determine the correlation between these variables through linear regression. In addition, the study also aimed to create a geographical map using the QGIS software to illustrate patterns of correlation among the variables at a regional level of assessment.
Methods
This was an analytical time-trend type ecological study that determined relationship between the number of dengue cases and climatic factors temperature, relative humidity and average rainfall in the 17 regions of the country in 2018. The number of dengue cases per region was obtained from the Department of Health (DOH) database.10 Information on the annual and monthly climatic readings were obtained from 51 out of 58 Surface Synoptic Stations of Philippine Atmospheric, Geophysical and Astronomical Services Administration (PAGASA). The incidence of dengue was defined as the number of individual cases per 100,000 population,
as recorded in the DOH database.10 All the data on dengue cases retrieved from the DOH database were included in this study, including the regional and provincial data records of dengue cases and deaths. Data was available for all 17 regions. The climatic factors considered were temperature (°C), relative humidity (%) and average rainfall (mm/m2). Information about the annual and monthly climatic readings were provided by the active stations of PAGASA. Among the 58 Surface Synoptic Stations (SYNOP) of PAGASA, 54 stations (93.1%) were active in 2018; the inactive stations were excluded.9 Three more stations were excluded due to missing readings for either temperature or humidity. All 17 regions of the country were included in this study. The SYNOP is a representative station located in certain cities per region where all meteorological elements are measured at fixed observation times; collated data are submitted to the PAGASA Central Office.11 The climatic records used in this study were from the PAGASA Central Office. IBM SPSS Statistics software was utilized for statistical analyses with regards to the correlation between incidence of dengue and climatic factors. Pearson’s correlation coefficient was used to measure the strength of association among variables, and the value of r determined the direction of the correlation. Results were interpreted as positively correlated if the value was in the positive range or towards +1; no relationship, if the value was 0; and negatively correlated if the value was in the negative range or towards -1. Multiple regression was used to assess the effectiveness of all climatic factors as predictors for the incidence of dengue cases. The Quantum Geographic Information System (QGIS) was used to create representative maps to provide information on correlations between the incidence of dengue and the climatic factors as a form of geospatial analysis. In order to visually appreciate possible correlations, an increasing magnitude of the independent variables were assigned with representative patterns using a 4 x 4 legend with two-dimensional axes (e.g., Figure 12). This study was approved by the Ethics Review Committee of the UERMMMCI Research Institute for Health Sciences. Permission was obtained from the DOH and PAGASA for the retrieval and use of the data on dengue and climatic factors, respectively, in accordance with the Data Privacy Act.12
Incidence of dengue and climatic factors in the Philippines
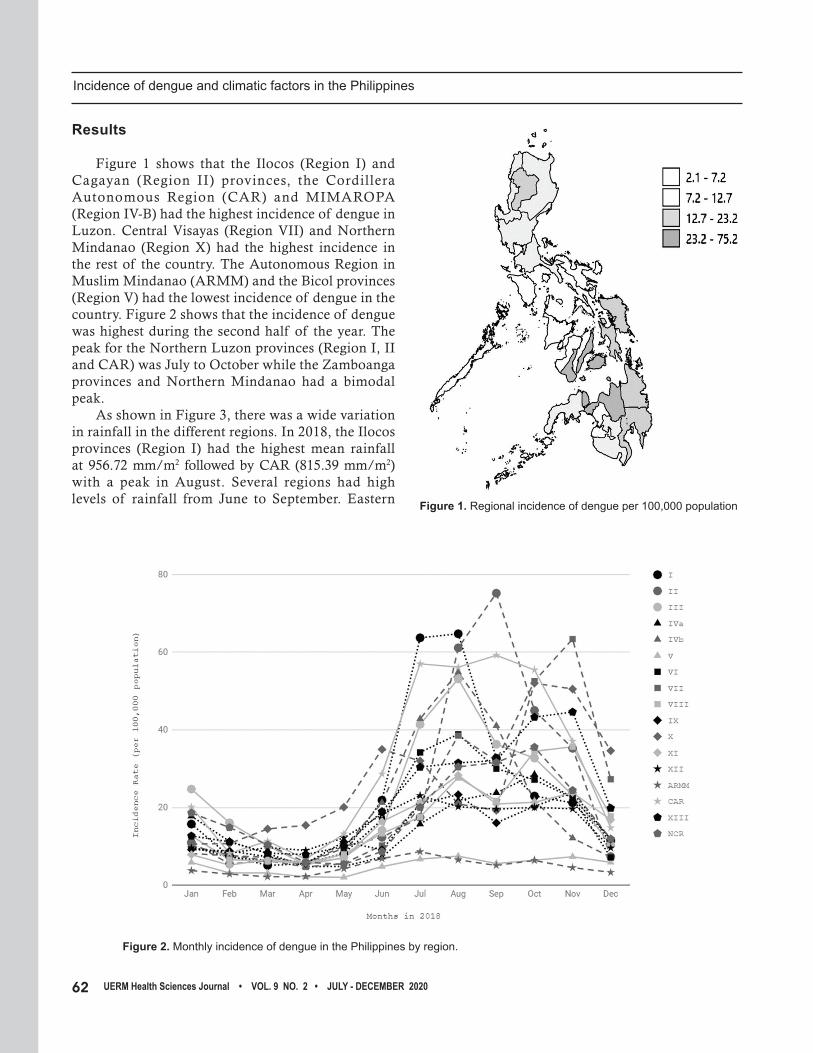
62 UERM Health Sciences Journal • VOL. 9 NO. 2 • JULY - DECEMBER 2020
Results
Figure 1 shows that the Ilocos (Region I) and Cagayan (Region II) provinces, the Cordillera Autonomous Region (CAR) and MIMAROPA (Region IV-B) had the highest incidence of dengue in Luzon. Central Visayas (Region VII) and Northern Mindanao (Region X) had the highest incidence in the rest of the country. The Autonomous Region in Muslim Mindanao (ARMM) and the Bicol provinces (Region V) had the lowest incidence of dengue in the country. Figure 2 shows that the incidence of dengue was highest during the second half of the year. The peak for the Northern Luzon provinces (Region I, II and CAR) was July to October while the Zamboanga provinces and Northern Mindanao had a bimodal peak. As shown in Figure 3, there was a wide variation in rainfall in the different regions. In 2018, the Ilocos provinces (Region I) had the highest mean rainfall at 956.72 mm/m2 followed by CAR (815.39 mm/m2) with a peak in August. Several regions had high levels of rainfall from June to September. Eastern Figure 1. Regional incidence of dengue per 100,000 population
Figure 2. Monthly incidence of dengue in the Philippines by region.
Incidence of dengue and climatic factors in the Philippines

63 VOL. 9 NO. 2 • JULY - DECEMBER • UERM Health Sciences Journal
Visayas (Region VIII) and the Bicol area (Region V) had their peak rainfall around December-January (768.33 and 696.44 mm/m2, respectively). The mean relative humidity ranged from 60.5 to 88.7% and was highest in August, as shown in Figure 4.
Figure 3. Monthly total rainfall (mm/m2) in the Philippines by region.
Region XII SOCCSKARGEN and ARMM had the lowest humidity. The mean temperature range was 24.4–29.8°C with a peak in May as seen in Figure 5. January was the coldest month of the year.
Figure 4. Monthly relative humidity (%) in the Philippines by region.
Incidence of dengue and climatic factors in the Philippines

64 UERM Health Sciences Journal • VOL. 9 NO. 2 • JULY - DECEMBER 2020
Figure 5. Monthly mean temperature (°C) in the Philippines by region.
As shown in Figure 6, the incidence of dengue paralleled the amount of rainfall for the previous month: an increase in rainfall in May was accompanied by an increase in dengue cases in June. As the rainfall increased from April to July, the incidence of dengue also increased from May to August. A similar pattern was observed for dengue and humidity, as seen in Figure 7, but not for dengue and temperature (Figure 8). Statistical analysis revealed a significant positive but weak correlation between the incidence of dengue and rainfall (r = 0.379, 95% CI 0.255, 0.491; p < 0.001) and humidity (r = 0.215, 95% CI 0.080, 0.342; p = 0.002). There was a significant negative but weak correlation between the incidence of dengue and temperature (r = -0.145, 95% CI -0.277, -0.008; p = 0.039) as seen in Table 1. A strong positive correlation was noted between the incidence of dengue, and rainfall and humidity, respectively, in the Northern Luzon regions, ARMM and Region IV-B. Multiple regression as shown in Figures 9 to 11 indicates that rainfall, humidity and temperature are poor predictors of the incidence of dengue (R2 = 0.1436, 0.0461 and 0.0209, respectively). Figure 12 depicts the incidence rate of dengue and rainfall through bivariate analysis in map form for July and March. The maps provide a representation of the degree of relationship between the compared
Figure 6. Mean incidence of dengue (black) vs rainfall (gray) by month (x-axis); left-hand y-axis is incidence per 100,000 population; right-hand y-axis is rainfall (mm/m2)
variables. The pattern-legend indicated on each figure can be used as a guide to understand the magnitudes between dengue incidence and rainfall, simultaneously. The varying patterns arranged from left to right represent an increasing incidence of dengue while the patterns from top to bottom represent an increasing mean rainfall. The map for July shows the highest rainfall and incidence of dengue in the western part of Luzon, MIMAROPA, Western Visayas and Northern Mindanao.
Incidence of dengue and climatic factors in the Philippines

65 VOL. 9 NO. 2 • JULY - DECEMBER • UERM Health Sciences Journal
Figure 7. Mean incidence of dengue (black) vs humidity (gray) by month (x-axis); left-hand y-axis is incidence per 100,000 population; right-hand y-axis is relative humidity (%)
Figure 8. Mean incidence of dengue (black) vs temperature (gray) by month (x-axis); left-hand y-axis is incidence per 100,000 population; right-hand y-axis is temperature (oC)
Table 1. Correlation of incidence of dengue and climatic factors by region.
Region Rainfall Humidity Temperature
Aggregate 0.379, 95% CI 0.255, 0.492, p < 0.001 0.215, 95% CI 0.080, 0.342, p = 0.002 -0.145, 95% CI -0.277, -0.008, p = 0.039
ARMM 0.753, 95% CI 0.315, 0.927, p = 0.005 -0.574, 95% CI -0.863, 0.000, p = 0.051 -0.094, 95% CI -0.634, 0.507, p = 0.772
CAR 0.730, 95% CI 0.269, 0.919, p = 0.007 0.733, 95% CI 0.275, 0.920, p = 0.007 0.120,95% CI -0.487, 0.649, p = 0.709
NCR 0.246, 95% CI -0.382, 0.718, p = 0.441 0.406, 95% CI -0.219, 0.795, p = 0.191 -0.280, 95% CI -0.736, 0.350, p = 0.378
Region I 0.900, 95% CI 0.674, 0.972, p < 0.001 0.830, 95% CI 0.489, 0.951, p = 0.001 -0.098, 95% CI -0.636, 0.504, p = 0.762
Region II 0.570, 95% CI -0.006, 0.862, p = 0.053 0.500, 95% CI -0.104, 0.834, p = 0.098 0.462, 95% CI -0.152, 0.819, p = 0.462
Region III 0.683, 95% CI 0.179, 0.903, p = 0.014 0.687, 95% CI 0.187, 0.904, p = 0.014 -0.319, 95% CI -0.755, 0.312, p = 0.311
Region IV-A 0.113, 95% CI -0.493, 0.645, p = 0.726 0.346, 95% CI -0.284, 0.768, p = 0.271 -0.193, 95% CI -0.690, 0.428, p = 0.547
Region IV-B 0.718, 95% CI 0.245, 0.915, p = 0.009 0.691, 95% CI 0.194, 0.906, p = 0.013 -0.119, 95% CI -0.649, 0.488, p = 0.713
Region V 0.286, 95% CI -0.344, 0.739, p = 0.367 0.188, 95% CI -0.433, 0.688, p = 0.559 -0.032, 95% CI -0.552, 0.595, p = 0.922
Region VI 0.314, 95% CI -0.317, 0.752, p = 0.321 0.104, 95% CI -0.500, 0.640, p = 0.749 0.271, 95% CI -0.359, 0.731, p = 0.394
Region VII -0.001, 95% CI -0.573, 0.575, p = 0.997 -0.014, 95% CI -0.564, 0.583, p = 0.965 -0.005, 95% CI -0.571, 0.577, p = 0.987
Region VIII -0.196, 95% CI -0.692, 0.426, p = 0.542 -0.272, 95% CI -0.732, 0.358, p = 0.392 0.237, 95% CI -0.390, 0.714, p = 0.458
Region IX 0.069, 95% CI -0.526, 0.618, p = 0.831 -0.203, 95% CI -0.696, 0.420, p = 0.527 0.064, 95% CI -0.529, 0.615, p = 0.843
Region X 0.000, 95% CI -0.574, 0.574, p = 0.999 -0.054, 95% CI -0.609, 0.537, p = 0.869 0.240, 95% CI -0.387, 0.715, p = 0.453
Region XI 0.009, 95% CI -0.567, 0.580, p = 0.979 -0.222, 95% CI -0.706, 0.405, p = 0.488 0.100, 95% CI -0.503, 0.736, p = 0.757
Region XII -0.495, 95% CI -0.832, 0.110, p = 0.102 -0.057, 95% CI -0.611, 0.534, p = 0.859 -0.265, 95% CI -0.728, 0.364, p = 0.405
Region XIII -0.785, 95% CI -0.937, -0.384, p = 0.002 -0.895, 95% CI -0.970, -0.660, p < 0.001 0.230, 95% CI -0.396, 0.710, p = 0.472
Incidence of dengue and climatic factors in the Philippines

66 UERM Health Sciences Journal • VOL. 9 NO. 2 • JULY - DECEMBER 2020
Figure 9. Correlation of incidence of dengue per 100,000 population and rainfall (mm/m2)
Figure 10. Correlation of incidence of dengue per 100,000 population and relative humidity (%)
Figure 11. Correlation of incidence of dengue per 100,000 population with temperature (oC)
Figure 12. QGIS map showing rainfall and incidence of dengue in the different regions in July (left) and March (right)
Discussion
The incidence of dengue—being a mosquito-borne disease —is expected to be dependent on the life cycle of its vector, Aedes. As previously mentioned, rainfall, humidity, and temperature are expected to contribute to the progression of its life cycle. This study observed an increasing incidence of dengue cases during the typical rainy season in the Philippines (June to September) but not from October to December. The results showed a weak correlation between the incidence of dengue with heavy rainfall and high relative humidity, respectively. However,
Incidence of dengue and climatic factors in the Philippines

67 VOL. 9 NO. 2 • JULY - DECEMBER • UERM Health Sciences Journal
the negative correlation between the incidence of dengue and temperature is not in accordance with most studies in Southeast Asia which reported that a higher temperature resulted in an increased population growth of Aedes aegypti and the transmission of the dengue virus.14 A possible explanation for the findings is that both mosquito vectors of Aedes aegypti and Aedes albopictus are found here in the Philippines with the former breeding in both indoors and outdoors, and the latter breeding mostly in outdoors and is more adaptable to changes in temperature.15 Hence, it may be that some regions may have more of Aedes albopictus resulting in the less significant impact of temperature on the incidence of dengue compared with the regions having less of the vector. However, no available literature has been published on which specific regions in the Philippines have Aedes albopictus as the more predominant specie and hence, such assumptions are difficult to ascertain. It is also possible that the recorded range of temperature in this study may have had no effect on the vectors as this may be the ideal functioning range in terms of Aedes albopictus’ biology. The results are consistent with studies which observed that heavy rainfall led to an increased transmission of dengue virus as it created abundant outdoor breeding places, but are not in consonance with studies concluding that heavy rainfall led to reduced survival of the mosquito, translating into a lower incidence of dengue.16,17 In addition, the results showed a lag period between the increased rainfall and higher relative humidity, and dengue incidence, where the increase in rainfall and humidity preceded the rise in incidence (Figures 6 & 7). This may be attributed to the lag phase of the vectors’ growth cycle after the appearance of a favorable breeding environment. This might also explain a weaker correlation than expected with dengue incidence versus the climatic factors on a monthly basis. This study showed strong correlation of the increased incidence of dengue with heavy rainfall and higher relative humidity, respectively, in Regions I, III, IV-B and CAR, and a strong negative correlation in Region XIII. The different finding in Region XIII is difficult to ascertain given only the information of its climatic factors. As mentioned, negative correlations for humidity and rainfall were noted in parts of the Visayas and Mindanao, indicating that there may be a common factor in these regions that may explain the data. It may be helpful to see the correlations of the same variables in previous years to determine if
a similar trend will be observed as the present study was limited to a one-year observation period. The maps produced from QGIS mapping software provided a visual representation of the correlations observed allowing an instant visual identification and demarcation of regions at risk of having a high incidence of dengue cases. There were several limitations in this study such as the number of active PAGASA stations per province and the dengue serotype classifications. Confounding factors such as population density, topographical differences, health policies and education among the regions may have resulted in current findings. Differences in the biology and perhaps even adaptations of the mosquito-vectors may have altered the expected results, specifically for temperature. Given the seasonal variation in the incidence of dengue, a time-series analysis rather than multiple regression would have shown a more precise relationship between dengue and the climatic factors studied This study showed that overall, there is a significant but weak positive correlation between an increased incidence of dengue, and heavy rainfall and high relative humidity, respectively, and a weak negative correlation for temperature. Strong positive correlations for both heavy rainfall and higher relative humidity were observed in Regions I, III, IV-B, and CAR, and a weak negative correlation was observed in Region XIII. Rainfall, humidity and temperature are poor predictors of dengue. The reader is advised to exercise caution in interpreting the results in this study so as to not to commit the fallacy of ecological interference, given that the aggregation of dengue incidence and climatic factors at a regional level would result in the loss or concealment of certain details of information which can only be observed at the provincial or city/municipality level.
Acknowledgements
The authors are very thankful to Mr. Ben Hur S. Pintor, a QGIS software expert from BNHR IT Solution, for rendering them time and effort in training and helping them learn about the QGIS mapping software. All his teachings, advice and reminders brought them to a higher learning experience. They also acknowledge the Department of Health and the Philippine Atmospheric, Geophysical and Astronomical Services Administration which were
Incidence of dengue and climatic factors in the Philippines

68 UERM Health Sciences Journal • VOL. 9 NO. 2 • JULY - DECEMBER 2020
accommodating and responsive in providing them the necessary information needed for their study.
References 1. Longo DL, Fauci AS, Kasper DL, Hauser SL, Jameson J,
Loscalzo J. eds. Harrison’s Principles of Internal Medicine. 19th ed. New York, NY: McGraw-Hill; 2015.
2. Edillo F, Roble N, Otero N. The key breeding sites by pupal survey for dengue mosquito vectors, Aedes aegypti (Linnaeus) and Aedes albopictus (Skuse), in Guba, Cebu City, Philippines. SEA J Trop Med PH 2012; 43(6): 1365-74.
3. Bravo L, Roque VG, Brett J, Dizon R, L’Azou M. Epidemiology of dengue disease in the Philippines (2000–2011): A systematic literature review [Internet]. PLoS Negl Trop Dis 2014; 8(11): e3027. Available from: https://doi.org/10.1371/journal.pntd.0003027
4. Morin CW, Comrie AC, Ernst K. Climate and dengue transmission: Evidence and implications. Environ Health Perspect. 2013; 121(11-12): 1264–72. doi: 10.1289/ehp.1306556
5. Alto BW, Bettinardi D. Temperature and dengue virus infection in mosquitoes: independent effects on the immature and adult stages [Internet]. Am J Trop Med Hyg. 2013 Mar 6; 88(3): 497–505. Available from: https://www.ncbi.nlm.nih.gov/pmc/articles/ PMC3592531/.
6. Louis VR, Phalkey R, Horstick O, Ratanawong P, Wilder-Smith A, Tozan Y, Dambach P. Modeling tools for dengue risk mapping - a systematic review. Int J Health Geogr 2014; 13: 50. doi: 10.1186/1476-072X-13-50
7. Sia Su GL. Correlation of climatic factors and dengue incidence in Metro Manila, Philippines [Internet]. Ambio. 2008 Jun; 37(4): 292–4. Available from: http://doi.-org/10.1579/00447447(2008)37[292:COCFAD]2.0.CO;2
8. Climate of the Philippines [Internet]. Philippine Atmospheric, Geophysical and Astronomical Services Administration. [cited 2020 Nov 1]. Available from: http://bagong.pagasa.dost.gov.ph/information/climate-philippines
9. Mandate/Mission/Vision/Values/Functions. Citizen’s Charter [Internet]. Philippine Atmospheric, Geophysical and Astronomical Services Administration. [cited 2020 Nov 1]. Available from: https://pubfiles.pagasa.dost.gov.ph/pagasaweb/files/PAGASA_Citizen’s_Charter_signed_copy.pdf
10. Dengue [Internet]. Republic of the Philippines Department of Health. [cited 2019 Oct 08]. Available from: https://www.doh.gov.ph/Health-Advisory/Dengue
11. Field Station Categories [Internet]. Philippine Atmospheric, Geophysical and Astronomical Services Administration. [cited 2020 Nov 1]. Available from: http://bagong.pagasa.dost. gov.ph/information/field-station-categories
12. Republic Act 10173 – Data Privacy Act of 2012 [Internet]. National Privacy Commission. [cited 2019 Oct 08]. Available from: https://privacy.gov.ph/data-privacy-act/
13. Lai YH. The climatic factors affecting dengue fever outbreaks in southern Taiwan: an application of symbolic data analysis. Biomed Eng Online 2018; 17(Suppl 2): 148. doi: 10.1186/s12938-018-0575-4
14. Comparison on Dengue Vectors [Internet]. Centers for Disease Control and Prevention. [cited 2019 Oct 26] Available from: https://www.cdc.gov/dengue/resources/30jan2012/comparisondenguevectors.pdf
15. Bhatt S, Gething PW, Brady OJ, et al. The global distribution and burden of dengue. Nature. 2013 Apr 25; 496(7446): 504-7. doi: 10.1038/nature12060. Epub 2013 Apr 7.
16. Alshehri MSA. Dengue fever outburst and its relationship with climatic factors. World Appl Sci J 2013; 22(4): 506–15. doi: 10.5829/idosi.wasj.2013.22.04.443
17. Sociodemographic data [Internet]. Commission on Population and Development. [cited 2019 Oct 29] Available from: http://popcom.gov.ph/?fbclid=IwAR1LfiV7iyLb2 C1SXjiQTEMPVuoMUyo1v70832ThpIjae_yOhbF_dZI1mm4
Incidence of dengue and climatic factors in the Philippines

69 VOL. 9 NO. 2 • JULY - DECEMBER • UERM Health Sciences Journal
Instructions to Authors
Aim and Scope
The UERMMMCI Health Sciences Journal is a peer-reviewed journal published twice a year by the University of the East Ramon Magsaysay Memorial Medical Center Research Institute for Health Sciences. It publishes original articles, reviews, systematic reviews, meta-analyses, case reports and editorials written by the faculty, trainees, students and personnel of the Medical Center.
Style of Papers
All contributions should be written in English. Papers should be written to be intelligible to the professional reader who is not a specialist in the field. The editor and his staff reserve the right to modify manuscripts to eliminate ambiguity and repetitions, and to improve communication between author and reader. If extensive alterations are required, the manuscripts will be returned to the author for revision. Therefore, to minimize delay in publication, manuscripts should be submitted in accordance with the instructions detailed herein. The author may refer to the Recommendations for the Conduct, Reporting, Editing, and Publication of Scholarly Work in Medical Journals 2019 available at www.icmje.org for additional guidance. The editor will not be held responsible for views expressed in this journal.
Submission of Manuscript
A copy of the manuscript, including tables and figures, should be submitted to the editor. The manuscript should be typed on short bond paper, in a single column, double-spaced all throughout, using Times New Roman or Arial 12. All pages, starting from the title page should have page numbers on the lower right-hand corner. Tables, figures and illustrations should be in separate sheets (not embedded in the text). This should be accompanied by a cover letter containing the following: 1) corresponding author with complete
contact details; 2) signed declaration by all authors of their involvement and willingness to take public responsibility for the paper’s contents; 3) ethics approval when applicable; 4) declaration that the paper has not been published and is not under consideration for publication in another journal; 5) declaration of support/funding when applicable; and 6) declaration of conflict of interest. To facilitate revision of the manuscript, the editor requires submission of an electronic copy in Microsoft Word aside from the printed copy.
All pages of the typed manuscript should be numbered, including those containing declarations, acknowledgments and references. The manuscript should be arranged as follows: 1) title and list of authors, 2) corresponding author with contact details, 3) abstract, 4) key words, 5) introduction, 6) methods, 7) results, 8) discussion, 9) acknowledgments, 10) support/funding, 11) conflict of interest declaration, 12) references, tables and figures. Tables and figures and their legends should be submitted as a separate Word file. Photographs should be submitted as a separate jpeg file.
Title, list of authors, corresponding author
The title should be as concise and informative as possible and should contain all key words to facilitate indexing and information retrieval. This should be followed by the list of authors’ names to be written as follows: first name, middle initial, family name and highest academic degree. The sequence of names should be agreed upon by the authors. The department or institution of each of the authors should also be provided. Only those qualified based on the Recommendations for the Conduct, Reporting, Editing, and Publication of Scholarly Work in Medical Journals 2019 should be listed as authors. The contact details (affiliation, address, email address, contact number) of the corresponding author should be provided. The corresponding author should be a regular faculty/staff of the Medical Center.
70 UERM Health Sciences Journal • VOL. 9 NO. 2 • JULY - DECEMBER 2020
Abstract
This should be a concise structured summary consisting of the Introduction, Methods, Results and Conclusion. It should be no more than 200 words and include the purpose, basic procedures, main findings and principal conclusions of the investigation. New and important information should be emphasized.
Key Words
Two to six key words or phrases, preferably Medical Subject Headings (MeSH) terms, should be provided. This will assist in cross-indexing the article.
Introduction
This should contain a summary of the rationale and objectives of the study and provide an outline of pertinent background material. It should not contain either results or conclusions.
Methods
This should adequately describe the study design, populat ion, select ion process, randomization, blinding, study procedures, data collected, and statistical methods used in data analysis.
Results
This should be presented in logical sequence in the text, tables, and figures, avoiding repetitive presentation of the same data. Measurements should be in International System (SI) units. This section should not include material appropriately belonging to the discussion. Results must be statistically analyzed when appropriate.
Discussion
Data mentioned in the results should be explained in relation to any hypothesis advanced in the introduction. This may also include an evaluation of the methodology and the relationship of new information to previously gathered data. Conclusions should be incorporated in the final paragraph and
should be commensurate with and completely supported by data gathered in the study.
Acknowledgments
Only persons who have made genuine contributions and who endorse the data and conclusions should be acknowledged. Authors are responsible for obtaining written permission to utilize any copyrighted text and/or illustrations.
References
It is preferred that references and intext citations be in the National Library of Medicine (Vancouver) format, however, authors may choose to use the American Psychological Association (Harvard) format. The format selected by the authors should be used consistently throughout the manuscript.
References in the NLM/Vancouver style cited in the text shall be written as Arabic numerals in superscript at the end of the sentence in the order in which they appear in the text. Use the format in the Recommendations for the Conduct, Reporting, Editing, and Publication of Scholarly Work in Medical Journals (updated 2019) which is available at www.icmje.org. Titles of journals should be abbreviated in the reference list according to the style used in Index Medicus. Electronic references should include the date that the material was accessed. Unpublished observations and personal communications may not be used as references. Examples of the correct manner of listing references in the NLM/Vancouver format are illustrated below:
Standard journal article (List all authors when six or less; when seven or more, list only the first three then add “et al”.)
Francis D, Hadler SC, Thompson S, et al. The prevention of hepatitis B with vaccine: Report of the Centers for Disease Control multi-center efficacy trial among homosexual men. Ann Intern Med 1982; 97: 362-6. Krugman S, Overby LR, Mushahwar IK, et al. Viral hepatitis type B: studies on the natural history and prevention reexamined. N Engl J Med 1979; 300: 101-6.

71 VOL. 9 NO. 2 • JULY - DECEMBER • UERM Health Sciences Journal
Nyland LJ, Grimmer KA. Is undergraduate physiotherapy study a risk factor for low back pain? A prevalence study of LBP in physiotherapy students. Retrieved from: http://www.Biomed-central.com/1471-2474/4/22. 2003. [Accessed August 27, 2011].
Rankin J, Tennant PW, Stothard KJ, et al. Maternal body mass index and congenital anomaly risk: A cohort study. Int J Obes 2010; 34(9): 1371-80. Available from: http://ncbi.nlm.nih.gov/pubmed/20368710. [Accessed August 27, 2011].
Books and other monographs
Personal authors
Adams RD, Victor M. Principles of Neurology. New York: McGraw-Hill; 1981.
Chapter in a book Corbett S. Systemic Response to Injury and Metabolic Support. In: Brunicardi FC (editor). Schwartz’s Principles of Surgery. 10th ed. New York: McGraw-Hill; 2015: 13-50.
Tables and figures
These should be submitted as a separate Word or Excel file (NOT AN IMAGE FILE), numbered with Arabic numerals and accompanied by a title and an explanatory caption at the top. Each table must be referred to in the text and an indication of the preferred position in the text should be given. Other explanatory materials should be placed in footnotes below the tables. All non-standard abbreviations should be explained in the footnotes. Vertical
and horizontal rules between entries should be omitted. Each figure (graphs, charts, etc.) should be identified clearly and numbered in Arabic numerals and accompanied by a title and an explanatory caption at the bottom.
Photographs
Photographs and illustrations should be submitted as a separate image file in jpeg format with a resolution of at least 800 x 600 dpi. Each photograph or illustration should be identified as a figure and numbered in Arabic numerals and accompanied by a title and an explanatory caption at the bottom. Specific points of interest in the photograph or illustration should be marked with an arrow or encircled. When symbols, arrows, numbers, and letters are used to identify parts of illustrations, each one should be identified and explained in the legend. Photographs of persons must be retouched to make the subject unidentifiable when possible and be accompanied by written permission from the subject to use the photograph.
For inquiries and concerns, please contact: UERMMMCI Health Sciences Journal Research Institute for Health Sciences 2/F Jose M. Cuyegkeng Building University of the East Ramon Magsaysay Memorial Medical Center, Inc. Aurora Boulevard, Barangay Doña Imelda, Quezon City 1113 Secretary: Mr. Jayson P. Barasona Telefax: (632) 87161843 (632) 87150861 to 69 local 358 E-mail: [email protected] [email protected]

Research Institute for Health Sciences2/F Jose M. Cuyegkeng Building
University of the East Ramon Magsaysay Memorial Medical CenterAurora Boulevard, Brgy. Doña Imelda, Quezon City 1113
Telefax (02) 8716-1843; Trunk Line (02) 8715-0861 loc. 358Email: [email protected]
UERMemorial Medical Center, Inc.Research Institutefor Health Sciences
M

![J V J L T W - minjustnkr.amminjustnkr.am/nkr/documents/Sahman.naxagits.pdf_ J V J L T W J i j J V Y J _ i J c N h a k R ^ J _ f J Y ] J _ J M i a k R ^ a k _ րցախի ժողովուրդը,](https://img.pdfslide.net/doc/110x75/5eca991f2fcc5c7ee06897ba/j-v-j-l-t-w-j-v-j-l-t-w-j-i-j-j-v-y-j-i-j-c-n-h-a-k-r-j-f-j-y-j-j.jpg)


![Thu Aud 09.20 Molecular biology in Malignnat pleural … · 2019. 8. 15. · v Á µ W í ] u u µ v } ] v ] v P ( } Z ] } v Á v^D v ^ W EK J J J J J /RVV RI %$3 QXFOHDU VWDLQLQJ](https://img.pdfslide.net/doc/110x75/6105fc63b4f8af2a146f6411/thu-aud-0920-molecular-biology-in-malignnat-pleural-2019-8-15-v-w-.jpg)


![J~ j]v Z](https://img.pdfslide.net/doc/110x75/5a91026b7f8b9a78648e5417/j-jv-z-p-pubsusgsgov-to-axtena1ve-tublar-aolut1-pmkp-tbroqb.jpg)