Embed Size (px)
Citation preview
Coal is a commonly utilized fossil fuel,providing over 40% of global electricitydemand and about 90% of South Africa’sprimary energy needs. However, less than20% of the known world resources aresuitable for possible extraction usingconventional surface and underground miningtechniques (Andrianopolous,, Korre, andDurucan, 2015). Underground coalgasification (UCG) has the potential to recoverthe energy stored in coal in anenvironmentally responsible manner byexploiting seams that are deemed unmineableby traditional methods. The UCG process, ifsuccessfully developed, can increase coalreserves substantially. For example, in theLimpopo region of South Africa alone, theestimated potential for UCG gas, based onexisting geological records, is over 400 trillioncubic feet (TCF) natural gas equivalent – thisis about a hundred times more gas than the
existing 4-TCF Pande-Temane natural gasfield reserve in Mozambique (de Pontes,Mocumbi, and Sangweni, 2014).
Sasol has been producing synthesis gasfrom surface gasifiers for over 60 years usingSouth African bituminous coal that is minedusing traditional methods (van Dyk, Keyser,and Coertzen, 2006). The authorsacknowledge that South Africa will, for manyyears, rely on its abundant coal resources forenergy, with gasification technology playingan enabling role.
The gasification propensity of low-gradeSouth African coal was studied by Engelbrechtet al. (2010) in a surface fluidized bed reactor.The coal samples from New Vaal, Matla,Grootegeluk, and Duvha coal mines were highin ash (up to 45%), rich in inertinite (up to80%), had a high volatile matter content(20%) and low porosity. The study establishedthat these low-grade South African coals wereable to gasify to produce syngas fordownstream processes.
UCG is a thermo-chemical process whichconverts coal into a gas with significantheating value. The process requires thereaction of coal in air/oxygen (and possiblywith the addition of steam and carbon dioxide)within the underground seam to producesynthesis gas (syngas). The primarycomponents of syngas are the permanentgases hydrogen, carbon monoxide, carbondioxide, and methane along with tars,hydrogen sulphide, and carbonyl sulphide. Theash is deliberately left below the groundwithin the cavity. A typical gasification cavityis carefully controlled to operate just below thehydrostatic pressure to ensure ingress ofsubsurface water into the cavity and theretention of products within the gasificationsystem. The nature of UCG processes are suchthat a limited number of parameters can be
Graphical analysis of undergroundcoal gasification: Application of acarbon-hydrogen-oxygen (CHO)diagram by S. Kauchali
Underground coal gasification (UCG) is recognized as an efficient miningtechnique capable of chemically converting the coal from deep coal seamsinto synthesis gas. Depending on the main constituents of the synthesis gas,chemicals, electricity, or heat can be produced at the surface. This paperprovides a high-level graphical method to assist practitioners in developingpreliminary gasification processes and experimental programmes prior todetailed designs or field trials. The graphical method identifies theoreticallimits of operation for sensible gasification within a thermally balancedregion, based primarily on the basic coal chemistry. The analyses of thetheoretical outputs are compared to actual field trials from sites in the USAand Australia, with very favourable results. A South African coal is studiedto determine the possible synthesis gas outputs achievable using variousUCG techniques: controlled retractable injection point (CRIP) and linkedvertical wells (LVW). For CRIP techniques, an important result suggests thatpyrolysis, and subsequent char production, are important intermediatephenomena allowing for increased thermal efficiencies of UCG. Theconclusion is that South African coals need to be studied for pyrolysis-charbehaviour as part of any future UCG programme. The results also suggestthat UCG with CRIP would be a preferred technology choice for Bosjesspruitcoal where pyrolysis dynamics are important. Lastly, the use of CO2 asoxidant in the gasification process is shown to produce syngas withsignificant higher heating value.
Underground coal gasification, pyrolysis, char, thermal balance.
* School of Chemical & Metallurgical Engineering,University of the Witwatersrand, South Africa.
© The Southern African Institute of Mining andMetallurgy, 2018. ISSN 2225-6253. Paper receivedApr. 2018; revised paper received Sep. 2018.
1067VOLUME 118 �
http://dx.doi.org/10.17159/2411-9717/2018/v118n10a8

Graphical anaylsis of underground coal gasification: Application of a carbon-hydrogen-oxygen (CHO) diagram
either controlled or measured. Furthermore, UCG processesrequire multidisciplinary integration of knowledge fromgeology, hydrogeology. and the fundamental understandingof the gasification process.
Recent review articles by Perkins (2018a, 2018b) providean excellent basis for UCG practitioners. Perkins (2018a)covered the various methods of UCG as well as theperformance of the methods at actual field sites worldwide.Of particular interest are the descriptions for drillingorientations, linking, and operational methods utilized forUCG: linked vertical wells (LVW), controlled retractableinjection point (CRIP), and the associated variations. Thefactors affecting the performance of various UCG trials werestudied as well as an assessment of economic andenvironmental issues around UCG projects. Guidelines areprovided for site and oxidant selection based on field trialsfrom the USA, Europe, Australia, and Canada.
Huang et al. (2012) studied the feasibility of UCG inChina using field research, trial studies, and fundamentallaboratory work comprising petrography, reactivity, andmechanical tests of roof material. In contrast, Hsu et al.(2014) performed a laboratory-scale gasification simulationof a coal lump and used X-ray tomography to assess thecavity formation. The cavity formation in the experiment wasconsistent with a teardrop pattern typical in UCG trials. Thecavity shape and effect of operating parameters on the UCGcavity during gasification were studied by Jokwar, Sereshki,and Najafi (2018) using commercial COMSOL software.
Andrianopolous, Korre, and Durucan (2015) developedmodels to represent the chemical processes in UCG. In thisstudy, models previously developed for surface gasifiers wereadapted for UCG processes. The molar compositions andsyngas production from the models were compared toreported results from a laboratory-scale experiment. A highcorrelation of the experimental and modelling results wasachieved.
Zogala (2014a, 2014b) studied a simplistic coalgasification simulation method based on thermodynamiccalculations for the reacting species as well as kinetic andcomputational fluid dynamics (CFD) models. Mavhengere etal. (2016) developed a modified distributed activation energymodel (DAEM) for incorporation into advanced CFDcalculations for gasification processes.
Yang et al. (2016) reviewed the practicalities ofworldwide UCG projects and research activities over a five-year period. Their studies included developments incomputational modelling as well as laboratory and field testresults. The techno-economic prospects of combining UCGwith carbon capture and storage (CCS) was also discussed.
Klebingat et al. (2018) developed a thermodynamic UCGmodel to maximize syngas heating values and minimize tarproduction from early UCG field trials at Centralia-PSC,Hanna-I, and Pricetown. The optimization suggested that tarproduction in the field trials could be eliminated, withsignificant improvements to the syngas heating values.
UCG development has been largely concerned withestablishing methods to enhance well interconnectivity aswell as techniques for drilling horizontal in-seam boreholes.In addition, methods are sought for the ignition of the coal aswell as appropriate process control to ensure syngas quality.Site selection criteria have been considered crucial, while the
contribution from laboratory work is considered to be limited.This undelines the need for site-specific piloting and testing.
In this study, the focus is restricted to the development ofthe UCG process based on the inherent chemical nature ofcoal and the specific reactions required to complete theconversion of solid coal into syngas. A graphical method ispresented that allows an engineer with a basic competence inchemistry to develop high-level UCG processes without theneed for detailed studies of kinetics, equilibrium, geology,and hydrogeology. The information obtained from such anexercise provides a target for the subsequent, and costly, fieldtrials. The results obtained from the high-level graphicalanalyses are compared to UCG outputs from the RockyMountain (USA) and Chinchilla (Australia) trials. Aninteresting outcome is that the field trial outputs lie in apredictively narrow region, regardless of the UCG techniqueused. This is useful when new designs, with different coals,are being planned for UCG. Furthermore, the undergroundgasification of a South African coal from Bosjesspruit mine isstudied to determine the possible regions of operation forproducing syngas with the highest heating value suitable forpower generation. A key result here shows that the preferredmethod for applying UCG to the coal from Bosjesspruit mineis the CRIP method, whereby the coal undergoes pyrolysisand char production prior to gasification.
The representation of gasification reactions on a bondequivalent phase diagram was advocated by Battaerd andEvans (1979). The bond equivalent phase diagram is aternary representation of carbon, hydrogen, and oxygen(CHO) where species are represented by the bonding capacityof the constituent elements. To obtain the bond equivalentfraction for a species CxHyOz, the contribution by carbon is4(x), hydrogen is 1(y), and oxygen is 2(z), which isnormalized for each species. Thus, CH4 (methane) isrepresented by the midpoint between C and H. Similarly CO2(carbon dioxide) and H2O (water) are midway between C-Oand H-O respectively. CO (carbon monoxide) is one-thirdbetween C-O, as shown in Figure 1. According to Kauchali(2017), the important gasification reactions are obtained byconsiderations of the intersection of the feed (coal)-oxidant(steam, oxygen, or carbon dioxide) with the following lines:H2-CO, H2-CO2, H2-CO, CH4-CO and CH4-CO2 (Figure 1).These intersections represent the stoichiometric region inwhich sensible gasification occurs – outside of these regionsan excess amount of coal (carbon) or oxidants is evident,implying that they do not react within the gasificationsystem. A further analysis of the intersections indicates theinherent thermal nature of the reactions, some of which areendothermic while others are exothermic. The endothermicand exothermic nature of the important reactions will befurther explained in the examples that follow from thevarious field trials.
In an idealized underground gasification process thesystem must be overall thermally balanced so that there is nonet heat released or added to the cavity. This requirementfurther limits the region of operation of thermally balancedgasification reactions.
In addition, the following criteria (Wei, 1979; Kauchali,
�
1068 VOLUME 118

2017) are used to decide on reactions that will form theoverall mass and energy balances:
� Feed components may not appear in the product. Forexample, any gasification reaction that usessteam/oxygen as oxidant cannot have water as aproduct.
� The reactions on the CHO diagram represent themaximum region they enclose – mathematically, theintersection points represent the extreme points of alinearly independent reaction system.
� The extreme reactions points, representing overallstoichiometry, will lie on either of the lines H2-CO, H2-CO2, H2-CO, CH4-CO and CH4-CO2.
The graphical representation of the UCG processes is depictedon a ternary CHO diagram. The three different coals (USA,Australia, and South Africa) and the oxidants (steam, oxygenor carbon dioxide) are represented on the diagrams as feedpoints. From the representation of the feed points and thevarious intersections with the product lines (H2-CO, H2-CO2,H2-CO, CH4-CO and CH4-CO2), a region of stoichiometricallyacceptable gasification products is obtained. Thisstoichiometric region is a mass balance region indicating thepossible combinations of elements (C, H, and O) resultingfrom the various reaction schemes during gasification. Thisstoichiometric region thus represents the maximum allowablearea and possible products that can be obtained. Once thereactions governing the stoichiometry are obtained, the
possible pairing of endothermic-exothermic reactions can beestablished. This requires the thermodynamic properties(heat of formation) of each species participating in thereaction. The combinations of the reaction pairs (exothermicand endothermic) lead to thermally balanced points wherethe reactions have a heat of reaction of zero (kJ/mol). Thisthermally balanced point represents a ‘balanced’ UCG processand is also plotted on the CHO diagram. Depending on thenumber of possible exothermic and endothermicstoichiometric reactions, a number of thermally balancedpoints exist. A study of the thermally balanced reactionpoints will result in identifying a smaller subset of reactionsthat will form the basic reactions, i.e. the extreme reactionsthat will form a boundary around all other thermally balancedreactions. These extreme reactions are referred to as ‘linearlyindependent thermally balanced reactions’ and are unique forevery coal used. The linearly independent reactions are alsoplotted on the CHO diagram and the region enclosed by themis shaded to indicate the ‘thermally balanced region’ for thespecific coal. These calculations can be repeated for charsresulting from the drying and pyrolysis of the parent coal,provided that the data is available.
The information thus obtained enables the determinationof important gasification parameters such as the type ofoxidants to use, the ratio of C:H or C:O going into thegasification process, the UCG technique required formaximum energy, and product recovery.
The following sections essentially provide the graphicaldevelopment for a US and an Australian coal, and SouthAfrican coal and char.
Graphical anaylsis of underground coal gasification: Application of a carbon-hydrogen-oxygen (CHO) diagram
1069VOLUME 118 �

Subbituminous coal from the Rocky Mountain site wasgasified using UCG (Dennis, 2006). The coal had a chemicalformula CH0.811O0.167 and a calculated heat of formation(from coal CV) of –203.1 kJ/mol. Table I represents theultimate analysis. In Table II, the syngas output from the twoUCG operations employed is shown, namely extended linkingwell (ELW) / linked vertical well (LVW) and controlledretractable injection point (CRIP) (Dennis, 2006). The ELW
technique used two vertical wells about 40 m apart but linkedto a horizontally drilled gas production well. The CRIPmethod used two directionally drilled horizontal wells intothe coal seam: one for steam and oxygen injection and thesecond for syngas recovery. The ELW and CRIP methodsproduced syngas with different compositions.
In the final technical report on the site, Dennis (2006)discussed two technologies, both using a combination ofsteam and oxygen as oxidants. The report details the dry gascomposition for ELW and CRIP operations. The ELW site useda steam to oxygen ratio of approximately 1.88 and the CRIPsite a ratio of approximately 2.04. Tables III and IV representthe stoichiometric reaction scheme adapted for the RockyMountain coal and the thermally balanced reactionsrespectively. Table V lists the standard heat of formation percompound required to determine the heat of reaction for therespective systems for all samples considered in this study. InTable V, the standard heat of formation for coal wascalculated from the coal CV, assuming total combustion toliquid water and carbon dioxide only. For the char, anestimate of the CV of char from South African coals was usedas derived by Theron and le Roux (2015).
Table III is obtained by consideration of the intersectionof the line joining Rocky Mountain coal with oxygen/steamand the lines H2-CO, H2-CO2, H2-CO, CH4-CO and CH4-CO2(Figure 1). It is noted that eight reactions (r1 to r8) form thebasis of the stoichiometric region within which gasificationoccurs. Moreover, two of these reactions are exothermic: r2and r6. Table IV is thus obtained by taking linearcombinations of exothermic-endothermic pairs such that theoverall heat of reaction is zero, leading to a further 16reactions. At these conditions the gasification reactions areconsidered to be thermally balanced and are considered the‘desirable’ operation from a mass and energy perspective. ForUCG, this implies that the cavity is ‘self-sustaining’ from anenergy perspective and assuming that there are no heat ormass losses from the system.
A matrix analysis of the thermally balanced reactions inTable IV indicates that there are in fact only four linearlyindependent thermally balanced reactions (zero heat ofreaction). Also included are the calculated standard statehigher heating values (HHV), in MJ/m3, of the syngasproduced (with air as the source of oxygen), as given by Li et al. (2004).
Graphical anaylsis of underground coal gasification: Application of a carbon-hydrogen-oxygen (CHO) diagram
�
1070 VOLUME 118
Table I
Carbon 67.45Hydrogen 4.56Nitrogen 0.96Sulphur 0.98Chlorine 0.01Ash 11.03Oxygen 15.01CV (MJ/kg) 19.8
Table II
Component ELW CRIPHydrogen 32.7 39.6Methane 10.1 10.3Carbon monoxide 8.2 11.9Carbon dioxide 45.7 35.3Hydrogen sulphide 0.8 0.6Nitrogen 0.5 0.5Argon 0.2 0.1Higher hydrocarbons 1.8 1.7
Table III
r1 CH0.811O0.167 + 0.4165O2 CO + 0.4056H2 91.9 (endothermic)r2 CH0.811O0.167 + 0.9165O2 CO2 + 0.4056H2 –191.3 (exothermic)
r3 CH0.811O0.167 + 0.8331H2O CO + 1.2387H2 293.3 (endothermic)r4 CH0.811O0.167 + 1.8331H2O CO2 + 2.2387H2 251.92 (endothermic)r5 CH0.811O0.167 + 0.3151O2 0.2028CH4 + 0.7972CO 99.1 (endothermic)r6 CH0.811O0.167 + 0.7137O2 0.2028CH4 + 0.7972CO2 –126.7 (exothermic)
r7 CH0.811O0.167 + 0.4202H2O 0.4129CH4 + 0.5871CO 208.1 (endothermic)r8 CH0.811O0.167 + 0.7137H2O 0.5597CH4 + 0.4403CO2 159.62 (endothermic)

Figure 1 illustrates the thermally balanced region(shaded grey area) based on the four basic reactions A, C,L, and J. It is of interest to note the position of the syngas(X) from the ELW and CRIP UCG field trials, which theproximity of the field trial results relative to the theoreticaldevelopments (grey shaded region) based only on the coalthermodynamic properties. Furthermore, it is noted thatthe theoretical HHV ranges from 6.95–14.34 MJ/m3 (forpure oxygen blown) with an average of 10.64 MJ/m3 andconfirms the actual values of about 9.5 MJ/m3 reported byPerkins (2018a). The highest HHV reported at L is notachievable due to equilibrium considerations, as the hightemperatures required for gasification favour thedestruction of methane and the production of CO2, leadingto lower HHV values.
Graphical anaylsis of underground coal gasification: Application of a carbon-hydrogen-oxygen (CHO) diagram
VOLUME 118 1071 �
Table IV
A CH0.811O0.167 + 0.5788O2 0.6756CO + 0.32446CO2 + 0.4056H2 r2 + r1B CH0.811O0.167 + 0.3289H2O + 0.5547O2 0.3948CO + 0.6052CO2 + 0.7345H2 r2 + r3C CH0.811O0.167 + 0.7912H2O + 0.5209O2 CO2 + 1.1969H2 r2 + r4D CH0.811O0.167 + 0.5203O2 0.1336CH4 + 0.3412CO2 + 0.5252CO + 0.1384H2 r2 + r5E CH0.811O0.167 + 0.2013H2O + 0.4776O2 0.1978CH4 + 0.521CO2 + 0.2812CO + 0.2114H2 r2 + r7F CH0.811O0.167 + 0.3891H2O + 0.4169O2 0.3051CH4 + 0.6949CO2 + 0.1845H2 r2 + r8G CH0.811O0.167 + 0.5415O2 0.0853CH4 + 0.3351CO2 + 0.5796CO + 0.2351H2 r6 + r1H CH0.811O0.167 + 0.2513H2O + 0.4984O2 0.1416CH4 + 0.5567CO2 + 0.3016CO + 0.3736H2 r6 + r3I CH0.811O0.167 + 0.6134H2O + 0.4749O2 0.135CH4 + 0.865CO2 + 0.7491H2 r6 + r4J CH0.811O0.167 + 0.4901O2 0.2028CH4 + 0.3498CO2 + 0.4473CO r6 + r5K CH0.811O0.167 + 0.159H2O + 0.4437O2 0.2823CH4 + 0.4956CO2 + 0.2221CO r6 + r7L CH0.811O0.167 + 0.3158H2O + 0.3979O2 0.3607CH4 + 0.6393CO2 r6 + r8
Table V
Water (g) –241.80Water (l) –285.80Carbon monoxide –111.25Carbon dioxide –394.45Methane –75.75Rocky Mountain coal –203.13Chinchilla coal –112.27Bosjesspruit Coal –212.67Bosjesspruit char –14.11
Table VI
A CH0.811O0.167 + 0.5788O2 0.6756CO + 0.32446CO2 + 0.4056H2 3.84C CH0.811O0.167 + 0.7912H2O + 0.5209O2 CO2 + 1.1969H2 3.68J CH0.811O0.167 + 0.4901O2 0.2028CH4+0.3498CO2+ 0.4473CO 4.84L CH0.811O0.167 + 0.3158H2O + 0.3979O2 0.3607CH4+0.6393CO2 5.77
Table VII
Carbon 80.2Hydrogen 6Nitrogen 1.5Sulphur 0.7Oxygen 11.6CV (MJ/kg) 28
Graphical anaylsis of underground coal gasification: Application of a carbon-hydrogen-oxygen (CHO) diagram
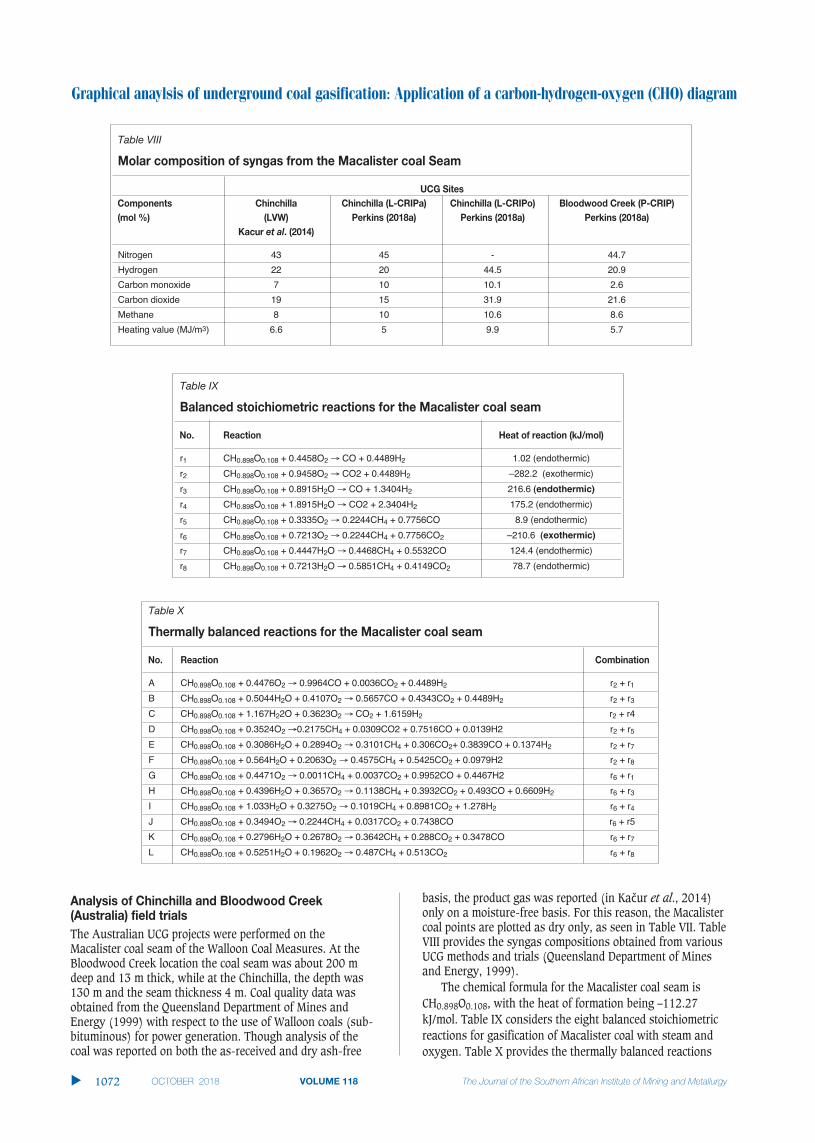
The Australian UCG projects were performed on theMacalister coal seam of the Walloon Coal Measures. At theBloodwood Creek location the coal seam was about 200 mdeep and 13 m thick, while at the Chinchilla, the depth was130 m and the seam thickness 4 m. Coal quality data wasobtained from the Queensland Department of Mines andEnergy (1999) with respect to the use of Walloon coals (sub-bituminous) for power generation. Though analysis of thecoal was reported on both the as-received and dry ash-free
basis, the product gas was reported (in Kačur et al., 2014)only on a moisture-free basis. For this reason, the Macalistercoal points are plotted as dry only, as seen in Table VII. TableVIII provides the syngas compositions obtained from variousUCG methods and trials (Queensland Department of Minesand Energy, 1999).
The chemical formula for the Macalister coal seam isCH0.898O0.108, with the heat of formation being –112.27kJ/mol. Table IX considers the eight balanced stoichiometricreactions for gasification of Macalister coal with steam andoxygen. Table X provides the thermally balanced reactions
�
1072 VOLUME 118
Table VIII
Nitrogen 43 45 - 44.7Hydrogen 22 20 44.5 20.9Carbon monoxide 7 10 10.1 2.6Carbon dioxide 19 15 31.9 21.6Methane 8 10 10.6 8.6Heating value (MJ/m3) 6.6 5 9.9 5.7
Table IX
r1 CH0.898O0.108 + 0.4458O2 CO + 0.4489H2 1.02 (endothermic)r2 CH0.898O0.108 + 0.9458O2 CO2 + 0.4489H2 –282.2 (exothermic)r3 CH0.898O0.108 + 0.8915H2O CO + 1.3404H2 216.6 (endothermic)
r4 CH0.898O0.108 + 1.8915H2O CO2 + 2.3404H2 175.2 (endothermic)r5 CH0.898O0.108 + 0.3335O2 0.2244CH4 + 0.7756CO 8.9 (endothermic)r6 CH0.898O0.108 + 0.7213O2 0.2244CH4 + 0.7756CO2 –210.6 (exothermic)
r7 CH0.898O0.108 + 0.4447H2O 0.4468CH4 + 0.5532CO 124.4 (endothermic)r8 CH0.898O0.108 + 0.7213H2O 0.5851CH4 + 0.4149CO2 78.7 (endothermic)
Table X
A CH0.898O0.108 + 0.4476O2 0.9964CO + 0.0036CO2 + 0.4489H2 r2 + r1B CH0.898O0.108 + 0.5044H2O + 0.4107O2 0.5657CO + 0.4343CO2 + 0.4489H2 r2 + r3C CH0.898O0.108 + 1.167H22O + 0.3623O2 CO2 + 1.6159H2 r2 + r4D CH0.898O0.108 + 0.3524O2 0.2175CH4 + 0.0309CO2 + 0.7516CO + 0.0139H2 r2 + r5E CH0.898O0.108 + 0.3086H2O + 0.2894O2 0.3101CH4 + 0.306CO2+ 0.3839CO + 0.1374H2 r2 + r7F CH0.898O0.108 + 0.564H2O + 0.2063O2 0.4575CH4 + 0.5425CO2 + 0.0979H2 r2 + r8G CH0.898O0.108 + 0.4471O2 0.0011CH4 + 0.0037CO2 + 0.9952CO + 0.4467H2 r6 + r1H CH0.898O0.108 + 0.4396H2O + 0.3657O2 0.1138CH4 + 0.3932CO2 + 0.493CO + 0.6609H2 r6 + r3I CH0.898O0.108 + 1.033H2O + 0.3275O2 0.1019CH4 + 0.8981CO2 + 1.278H2 r6 + r4J CH0.898O0.108 + 0.3494O2 0.2244CH4 + 0.0317CO2 + 0.7438CO r6 + r5K CH0.898O0.108 + 0.2796H2O + 0.2678O2 0.3642CH4 + 0.288CO2 + 0.3478CO r6 + r7L CH0.898O0.108 + 0.5251H2O + 0.1962O2 0.487CH4 + 0.513CO2 r6 + r8
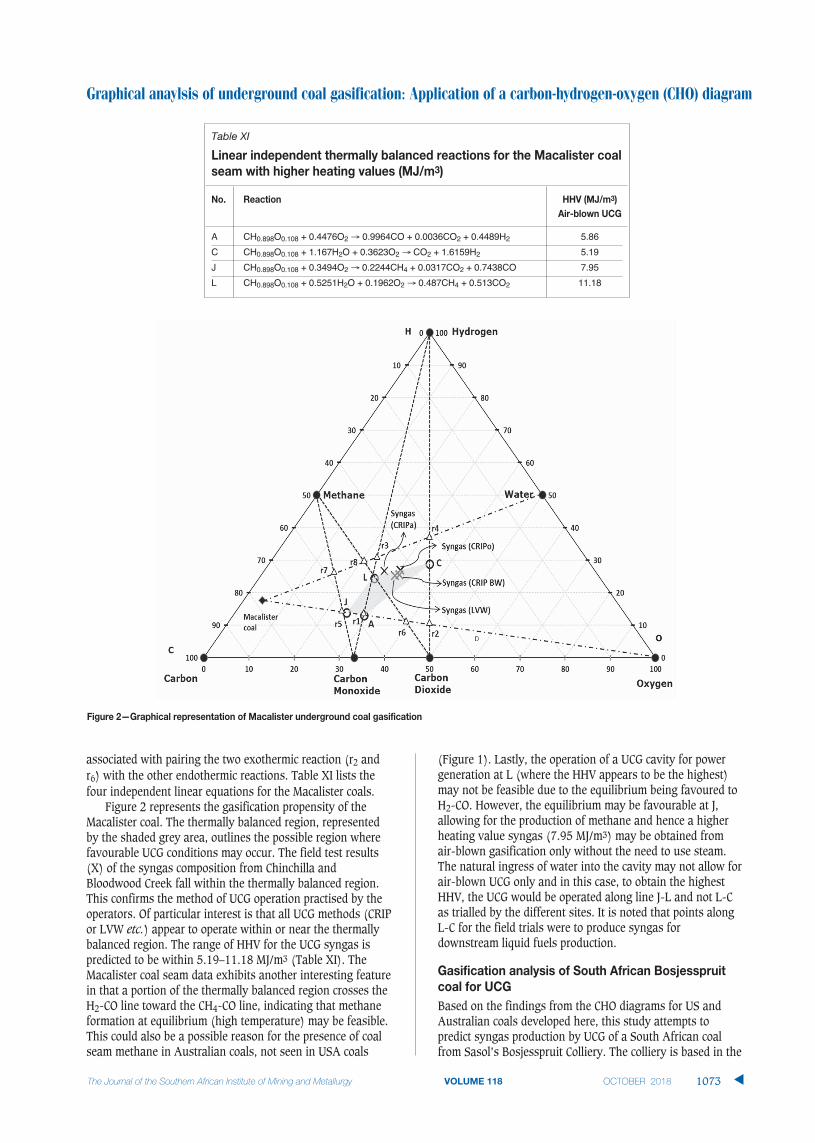
associated with pairing the two exothermic reaction (r2 andr6) with the other endothermic reactions. Table XI lists thefour independent linear equations for the Macalister coals.
Figure 2 represents the gasification propensity of theMacalister coal. The thermally balanced region, representedby the shaded grey area, outlines the possible region wherefavourable UCG conditions may occur. The field test results(X) of the syngas composition from Chinchilla andBloodwood Creek fall within the thermally balanced region.This confirms the method of UCG operation practised by theoperators. Of particular interest is that all UCG methods (CRIPor LVW etc.) appear to operate within or near the thermallybalanced region. The range of HHV for the UCG syngas ispredicted to be within 5.19–11.18 MJ/m3 (Table XI). TheMacalister coal seam data exhibits another interesting featurein that a portion of the thermally balanced region crosses theH2-CO line toward the CH4-CO line, indicating that methaneformation at equilibrium (high temperature) may be feasible.This could also be a possible reason for the presence of coalseam methane in Australian coals, not seen in USA coals
(Figure 1). Lastly, the operation of a UCG cavity for powergeneration at L (where the HHV appears to be the highest)may not be feasible due to the equilibrium being favoured toH2-CO. However, the equilibrium may be favourable at J,allowing for the production of methane and hence a higherheating value syngas (7.95 MJ/m3) may be obtained fromair-blown gasification only without the need to use steam.The natural ingress of water into the cavity may not allow forair-blown UCG only and in this case, to obtain the highestHHV, the UCG would be operated along line J-L and not L-Cas trialled by the different sites. It is noted that points alongL-C for the field trials were to produce syngas fordownstream liquid fuels production.
Based on the findings from the CHO diagrams for US andAustralian coals developed here, this study attempts topredict syngas production by UCG of a South African coalfrom Sasol’s Bosjesspruit Colliery. The colliery is based in the
Graphical anaylsis of underground coal gasification: Application of a carbon-hydrogen-oxygen (CHO) diagram
VOLUME 118 1073 �
Table XI
A CH0.898O0.108 + 0.4476O2 0.9964CO + 0.0036CO2 + 0.4489H2 5.86C CH0.898O0.108 + 1.167H2O + 0.3623O2 CO2 + 1.6159H2 5.19J CH0.898O0.108 + 0.3494O2 0.2244CH4 + 0.0317CO2 + 0.7438CO 7.95L CH0.898O0.108 + 0.5251H2O + 0.1962O2 0.487CH4 + 0.513CO2 11.18

Graphical anaylsis of underground coal gasification: Application of a carbon-hydrogen-oxygen (CHO) diagram
Highveld Coalfield, South Africa. The bituminous coal is highin ash and typically inertinite-rich. The CHO diagram is usedto demonstrate the stoichiometric region in which sensiblegasification (i.e. conversion of solid coal to syngas) occurs.From the analysis of the thermally balanced reactions, aregion for UCG is determined from which various syngascompositions are analysed for downstream processes: syngasfor the Fischer Tropsch (FT) process requiring 2H2:1CO ratiosand syngas for power production. An analysis of the ELWand CRIP methods for UCG of Bosjesspruit coal will bestudied. Lastly, the feasibility of using CO2 as oxidant forUCG is considered.
The characteristics of the Bosjesspruit coal are provided inTable XII, from which the molecular formula is determined tobe CH0.75O0.16 (for coal as received), with the heat offormation being –212.6 KJ/mol (Pinheiro, 1999). It must benoted that the volatile matter and char analyses used herewere not determined experimentally but are derived fromanother South African sub-bituminous coal (van Dyk, 2014).The molecular formulae and heats of formation ofBosjesspruit coal and the Rocky Mountain coal are similar.
An analysis of the Bosjesspruit coal, similar to the US andAustralian coals, is considered based on the details in TableXII. The oxidants are assumed to be air and steam, from
�
1074 VOLUME 118
Table XII
Proximate analysis (air-dry w/w%)(Pinheiro, 1999)Moisture 3.9Ash 32.8Volatile matter 21.6Fixed carbon 52.2Calorific value as-received (MJ/kg) 18.88Ultimate analysis (air-dry w/w%)Carbon 50.48Hydrogen 2.74Oxygen 7.24Molecular formula (as received CH0.75O0.16)Heat of formation (calculated) (KJ/mol) -212.6Volatile matter analysis (w/w%) for sub-bituminous coal(van Dyk, 2014)H2O 2.9H2 0.15CH4 4.01CO 0.98CO2 7.2N2 2.1Tar and oils 5.6Char analysis (calculated)Calorific value (MJ/kg) 34Molecular formula CH0.477O0.042Heat of formation (KJ/mol) -14.1
Table XIII
r1 CH0.75O0.16 + 0.42O2 CO + 0.375H2 101.3 (endothermic)r2 CH0.75O0.16 + 0.92O2 CO2 + 0.375H2 –181.9 (exothermic)
r3 CH0.75O0.16 + 0.84H2O CO + 1.215H2 304.4 (endothermic)r4 CH0.75O0.16 + 1.84H2O CO2 + 2.215H2 263.0 (endothermic)r5 CH0.75O0.16 + 0.326O2 0.187CH4 + 0.812CO 107.9 (endothermic)r6 CH0.75O0.16 + 0.73O2 0.187CH4 + 0.812CO2 –122.1 (exothermic)
r7 CH0.75O0.16 + 0.435H2O 0.405CH4 + 0.595CO 220.9 (endothermic)r8 CH0.75O0.16 + 0.732H2O 0.554CH4 + 0.446CO2 171.7(endothermic)
Table XIV
Linear independent thermally balanced reactions for Bosjesspruit coal with higher heatingvalues (MJ/m3)
A CH0.75O0.16 + 0.599O2 0.642CO + 0.358CO2 + 0.375H2 3.6C CH0.75O0.16 + 0.752H2O + 0.544O2 CO2 + 1.127H2 3.5J CH0.75O0.16 + 0.517O2 0.187CH4 + 0.381CO2+ 0.431CO 4.4L CH0.75O0.16 + 0.304H2O + 0.428O2 0.34CH4 + 0.66CO2 5.2
which Tables XIII and XIV are derived for the stoichiometricbasis reactions and the four thermally balanced independentreactions respectively. Table XV and Table XVI are for thechar resulting from the drying and pyrolysis of theBosjesspruit coal. The char analyses for the US and
Australian coals have not been considered due to lack ofinformation on the pyrolysis and char products of thosecoals.
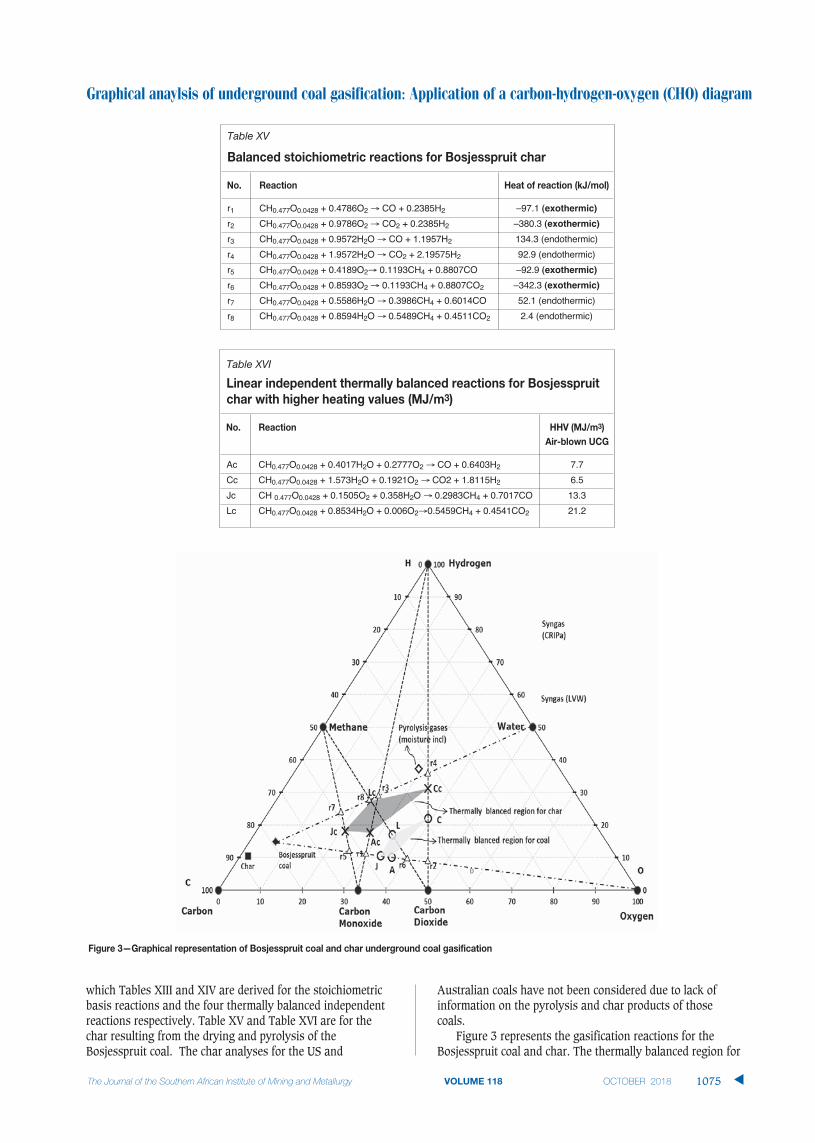
Figure 3 represents the gasification reactions for theBosjesspruit coal and char. The thermally balanced region for
Graphical anaylsis of underground coal gasification: Application of a carbon-hydrogen-oxygen (CHO) diagram
VOLUME 118 1075 �
Table XV
r1 CH0.477O0.0428 + 0.4786O2 CO + 0.2385H2 –97.1 (exothermic)
r2 CH0.477O0.0428 + 0.9786O2 CO2 + 0.2385H2 –380.3 (exothermic)
r3 CH0.477O0.0428 + 0.9572H2O CO + 1.1957H2 134.3 (endothermic)r4 CH0.477O0.0428 + 1.9572H2O CO2 + 2.19575H2 92.9 (endothermic)r5 CH0.477O0.0428 + 0.4189O2 0.1193CH4 + 0.8807CO –92.9 (exothermic)
r6 CH0.477O0.0428 + 0.8593O2 0.1193CH4 + 0.8807CO2 –342.3 (exothermic)
r7 CH0.477O0.0428 + 0.5586H2O 0.3986CH4 + 0.6014CO 52.1 (endothermic)r8 CH0.477O0.0428 + 0.8594H2O 0.5489CH4 + 0.4511CO2 2.4 (endothermic)
Table XVI
Ac CH0.477O0.0428 + 0.4017H2O + 0.2777O2 CO + 0.6403H2 7.7Cc CH0.477O0.0428 + 1.573H2O + 0.1921O2 CO2 + 1.8115H2 6.5Jc CH 0.477O0.0428 + 0.1505O2 + 0.358H2O 0.2983CH4 + 0.7017CO 13.3Lc CH0.477O0.0428 + 0.8534H2O + 0.006O2 0.5459CH4 + 0.4541CO2 21.2
Graphical anaylsis of underground coal gasification: Application of a carbon-hydrogen-oxygen (CHO) diagram
coal is represented by the light grey area bounded by pointsA,C,L, and J, and for the char by Ac, Cc, Lc, and Jc (darkgrey). There is a resemblance to Rocky Mountain coal (Figure1) as both the molecular formulae and heat of formationvalues are similar, and hence the thermally balanced regionsappear very similar. The syngas resulting from the CRIPmethod for Rocky Mountain coal appears to be an outlierfrom the thermally balanced region in Figure 1. However, ifthe similarity of the Bosjesspruit coal is applied to the RockyMountain coal, then the Bosjesspruit char thermally balancedregion will be sufficient to predict the Rocky Mountain chargasification behaviour. In this case, the CRIP result for RockyMountain coal would fall within the char gasificationthermally balanced region. This is an important result,suggesting that UCG using CRIP leads to pyrolysis andsubsequent char gasification, which is not prominent in LVWmethods.
The effect of coal drying and pyrolysis is evident fromFigure 3, where the char thermally balanced region hassignificantly enlarged with a higher achievable HHV (6.5–21.2 MJ/m3) than for coal (3.5–5.2 MJ/m3). This thermallybalanced region is more efficient and shows the importanceof allowing the coal to dry and pyrolysis to occur prior togasification. Also, the equilibrium at Jc is favourable, thusallowing the production of methane and carbon monoxidewith higher HHV (13.3 MJ/m3) with air as oxidant.
The models for UCG methodologies are complex (Perkins,2018a). Andrianopolous, Korre, and Durucan (2015)attempted to model LVW and CRIP. Their description of themechanisms for CRIP suggests that there are roof-top andfloor-bottom (spalled roof material that falls to the bottom)gasification steps resulting in different gas compositions that
ultimately mix and exit the reactor cavity. This suggests thatthere is a greater degree of drying and pyrolysis productsmixing with the syngas from char gasification. In comparisonto the LVW method, the high-temperature gasification zone islocalized near the reactor injection point, implying that anypyrolysis product from freshly exposed coal surfaces willeventually react to form the final exit gases. The implicationof this analysis is that LVW follows the UCG thermallybalanced results obtained for coal (Figure 3 – light grey area),while CRIP follows the char reactions (Figure 3 – dark greyarea). These results for LVW (or ELW) are confirmed by theUSA (Figure 1) and Australian (Figure 2) trials, where bothELW/LVW lie within the thermally balanced region for thecoals (not char). This leads to the conclusion that SouthAfrican coals need to be studied further to determine thepyrolysis-char behaviour prior to deciding on the UCGmethod. The results also suggest CRIP would be the preferredtechnology choice for Bosjesspruit coal, where the pyrolysisdynamics are important.
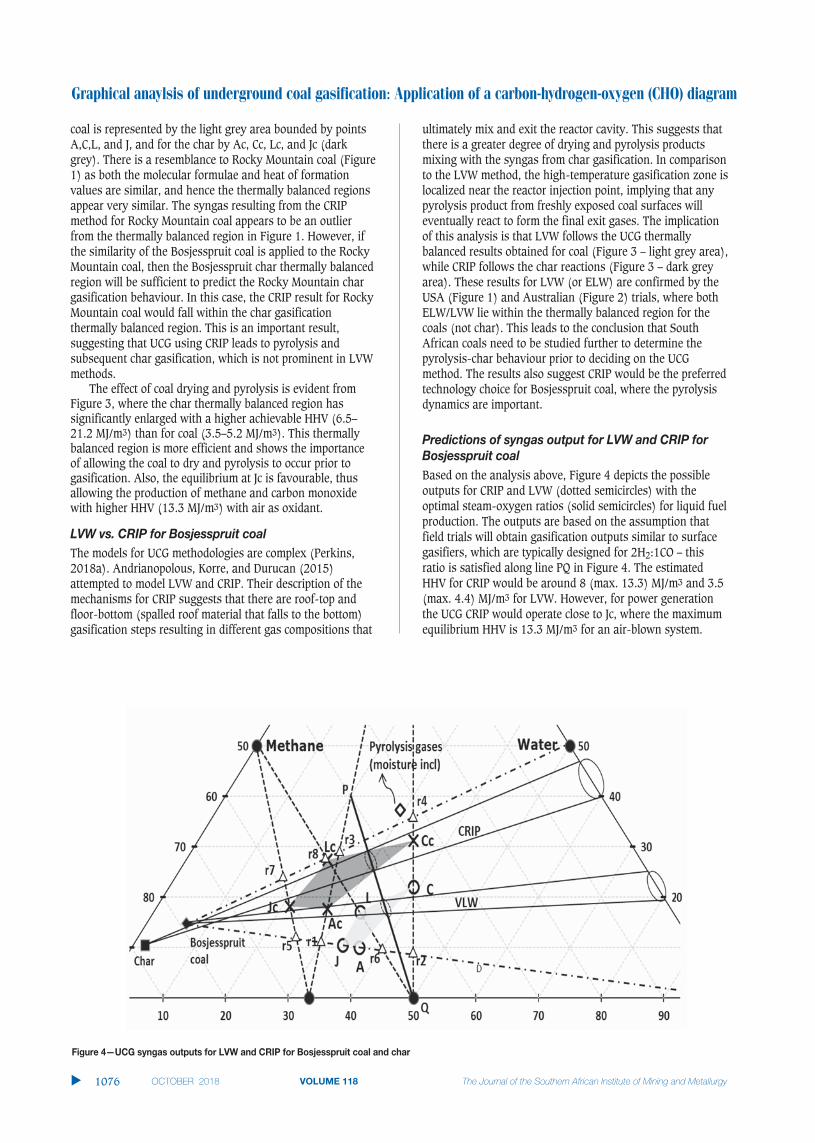
Based on the analysis above, Figure 4 depicts the possibleoutputs for CRIP and LVW (dotted semicircles) with theoptimal steam-oxygen ratios (solid semicircles) for liquid fuelproduction. The outputs are based on the assumption thatfield trials will obtain gasification outputs similar to surfacegasifiers, which are typically designed for 2H2:1CO – thisratio is satisfied along line PQ in Figure 4. The estimatedHHV for CRIP would be around 8 (max. 13.3) MJ/m3 and 3.5(max. 4.4) MJ/m3 for LVW. However, for power generationthe UCG CRIP would operate close to Jc, where the maximumequilibrium HHV is 13.3 MJ/m3 for an air-blown system.
�
1076 VOLUME 118
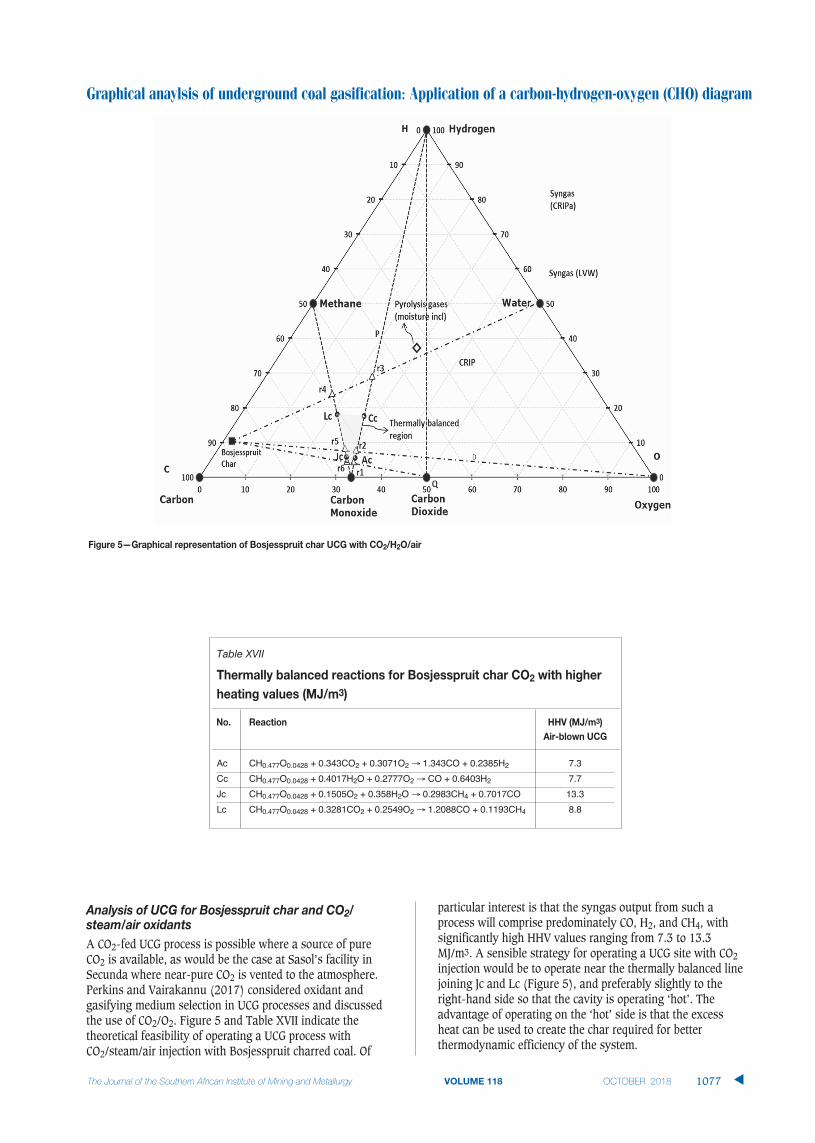
A CO2-fed UCG process is possible where a source of pureCO2 is available, as would be the case at Sasol’s facility inSecunda where near-pure CO2 is vented to the atmosphere.Perkins and Vairakannu (2017) considered oxidant andgasifying medium selection in UCG processes and discussedthe use of CO2/O2. Figure 5 and Table XVII indicate thetheoretical feasibility of operating a UCG process withCO2/steam/air injection with Bosjesspruit charred coal. Of
particular interest is that the syngas output from such aprocess will comprise predominately CO, H2, and CH4, withsignificantly high HHV values ranging from 7.3 to 13.3MJ/m3. A sensible strategy for operating a UCG site with CO2injection would be to operate near the thermally balanced linejoining Jc and Lc (Figure 5), and preferably slightly to theright-hand side so that the cavity is operating ‘hot’. Theadvantage of operating on the ‘hot’ side is that the excessheat can be used to create the char required for betterthermodynamic efficiency of the system.
Graphical anaylsis of underground coal gasification: Application of a carbon-hydrogen-oxygen (CHO) diagram
VOLUME 118 1077 �
Table XVII
Ac CH0.477O0.0428 + 0.343CO2 + 0.3071O2 1.343CO + 0.2385H2 7.3Cc CH0.477O0.0428 + 0.4017H2O + 0.2777O2 CO + 0.6403H2 7.7Jc CH0.477O0.0428 + 0.1505O2 + 0.358H2O 0.2983CH4 + 0.7017CO 13.3Lc CH0.477O0.0428 + 0.3281CO2 + 0.2549O2 1.2088CO + 0.1193CH4 8.8
Graphical anaylsis of underground coal gasification: Application of a carbon-hydrogen-oxygen (CHO) diagram
The CHO phase diagram proved to be a useful tool foranalysing gasification systems, and in particular for UCGwhere a limited number of control parameters exist. Thedevelopment of a thermally balanced system for the coalsallowed the prediction of the syngas output within a narrowregion – these regions were tested for US and Australian fieldtrials and were found to correlate with reasonably accuracy.This method was able to predict, without prior knowledge ofthe UCG technique employed, the flow rates of oxidants,reaction kinetics, heat and mass transfer kinetics, andhydrogeology. It was shown that only four reactions governthe output of any thermally balanced UCG system.
A South African coal was assessed and the effects ofpyrolysis were shown to enhance the thermodynamicefficiency of the system, leading to a key conclusion that thedetermination of pyrolysis propensity and char characteristicsshould form part of any future UCG programme. It wassuggested that the CRIP method be used for the Bosjesspruitcoal, where a theoretical maximum syngas HHV can beobtained (13.3 MJ/m3) when air is used as oxidant. The useof CO2 in addition to steam and air indicates that a UCGprocess for the Bosjesspruit char would be possible andcapable of producing syngas with a HHV value as high as 8.8 MJ/m3.
A part of this work was presented at the workshop held in2016 by the South African Underground Coal GasificationAssociation (SAUCGA). Also, my thanks to Keeshan Moodleyfor the presentation, development of the ternary CHOdiagram, and some of the literature field data collation.
ANDRIANOPOULOS, E., KORRE, A., and DURUCAN S. 2015. Chemical processmodelling of underground coal gasification and evaluation of producedgas quality for end use. Energy Procedia, vol. 76. pp. 444–453.
BATTAERD, H.A.J. and EVANS, D.G. 1979. An alternative representation of coalcomposition data. Fuel, vol. 58, no. 2. pp.105–108.
DE PONTES, M., MOCUMBI, P., and SANGWENI, C.J. 2014. Gas resources andreserves in Southern and East Africa. Proceedings of the FFF GasConference, Johannesburg, 21 May. Fossil Fuel Foundation.
DENNIS, S. 2006. Rocky Mountain underground coal gasification test project(Hanna, Wyoming): Final technical report for the period 1986 to 2006.National Energy Technology Laboratory, US Department of Energy. pp. 1–51.
ENGELBRECHT, A.D., EVERSON,R.C., NEOMAGUS, H.W.P.J., and NORTH B.C. 2010.Fluidized bed gasification of selected South African coals. Journal of theSouthern African Institute of Mining and Metallurgy, vol. 110. pp. 225–230.
HSU, C., DAVIES, P.T., WAGNER N.J., and KAUCHALI S. 2014. Investigation of cavityformation in lump coal in the context of underground coal gasification.Journal of the Southern African Institute of Mining and Metallurgy, vol.114. pp. 305–309.
HUANG, W.G., WANG, Z.T., XIN L., DUAN T.H., and KANG G.J. 2012. Feasibilitystudy on underground coal gasification of No. 15 seam in FenghuangshanMine. Journal of the Southern African Institute of Mining and Metallurgy,vol. 112. pp. 879–903.
JOWKAR, A., SERESHKI, F., and NAJAFI, M. 2018. A new model for evaluation ofcavity shape and volume during underground coal gasification process.Energy, vol. 148. pp. 756–765.
KAČUR, J., DURDAN, M., LACIAK, M., and FLEGNER, P. 2014. Impact analysis of theoxidant in the process of underground coal gasification. Measurement, vol.51. pp. 147–155.
KAUCHALI, S. 2017. Development of sustainable coal to liquid processes:Minimising process CO2 emissions. South African Journal of ChemicalEngineering, vol. 24. pp.176–182.
KLEBINGAT, S., KEMPKA, T., SCHULTEN, M., and AZZAM, R. 2018. Optimization ofsynthesis gas heating values and tar by-product yield in underground coalgasification. Fuel, vol. 229. pp. 248–261.
LI, X.T., GRACE, J.R., LIM, C.J., WATKINSON, A.P., CHEN, H.P., and KIM, J.R. 2004.Biomass gasification in a circulating fluidizing bed. Biomass andBioenergy, vol. 26. pp.171–193.
MAVHENGERE, P., VITTEE, T., WAGNER, N.J., and KAUCHALI, S. 2016. An algorithmfor determining kinetic parameters for the dissociation of complex solidfuels. Journal of the Southern African Institute of Mining and Metallurgy,vol. 116. pp. 55–63.
PERKINS, G. 2018a. Underground coal gasification – Part I: Field demonstrationsand process performance. Progress in Energy and Combustion Science, vol. 67. pp. 158–187.
PERKINS, G. 2018b. Underground coal gasification – Part II: Fundamentalphenomena and modeling. Progress in Energy and Combustion Science,vol. 67. pp. 234–274.
PERKINS, G. and VAIRAKANNU, P. 2017. Considerations for oxidant and gasifyingmedium selection in underground coal gasification. Fuel ProcessingTechnology, vol. 165. pp. 145–154.
PINHEIRO, H.J. (ed.) 1999. A techno-economic and historical review of the SouthAfrican coal industry in the 19th and 20th centuries, and analyses of coalproduct samples of South African collieries 1998 - 1999. SABS Bulletin113. pp. 68–74.
QUEENSLAND DEPARTMENT OF MINES AND ENERGY 1999. Utilisation of Walloon coalsof Southern Queensland for power generation, Department of Mines andEnergy, Queensland, Australia. pp. 1–38.
THERON, J.A. and LE ROUX, E. 2015. Representation of coal and coal derivativesin process modelling. Journal of the Southern African Institute of Miningand Metallurgy, vol. 116. pp. 339–348.
VAN DYK, J.C., KEYSER, M., and COERTZEN, M. 2006. Syngas production fromSouth African coal sources using Sasol–Lurgi gasifiers. InternationalJournal of Coal Geology, vol. 65. pp. 243–253.
VAN DYK, J.C., WAANDERS, F. and BRAND, J. 2014. Applying Thermo 350Munderground: A FactsageTM equilibrium study for undergound coalgasification. Proceedings of the GTT Workshop, Aachen, Germany, July2014.
WEI, J. 1979. A stoichiometric analysis of coal gasification. Industrial &Engineering Chemistry Process Design and Development, vol. 18, no. 3.pp. 554–558. doi: 10.1021/i260071a034
YANG, D., KOUKOUZAS, N., GREEN, M., and SHENG, Y. 2016. Recent developmenton underground coal gasification and subsequent CO2 storage. Journal ofthe Energy Institute, vol. 89. pp 469–484.
ZOGALA, A. 2014a. Critical analysis of underground coal gasification models.Part I: equilibrium models – literary studies. Journal of SustainableMining, vol. 13, no. 1. pp. 22–28.
ZOGALA, A. 2014b. Critical analysis of underground coal gasification models.Part II: kinetic and computational fluid dynamics models. Journal ofSustainable Mining, vol. 13, no. 1. pp. 29–37. �
�
1078 VOLUME 118