Embed Size (px)
Citation preview

HOMETRAK COMPANION CRM ‐ CLIENT RELATIONSHIP / REFERRAL MANAGEMENT PROCESS
VERSION 6.3
2 | P a g e
In this document we are going to be outlining how HomeTrak Companion can assist you in developing your referral sources, organize your time and quantify your sources.
In order to make the most out of this process we have some required set up. Most of you will already have these parameters set in your database, but it is a good idea to ensure this is the case. These set up procedures are going to tie directly to reports.
Setup:
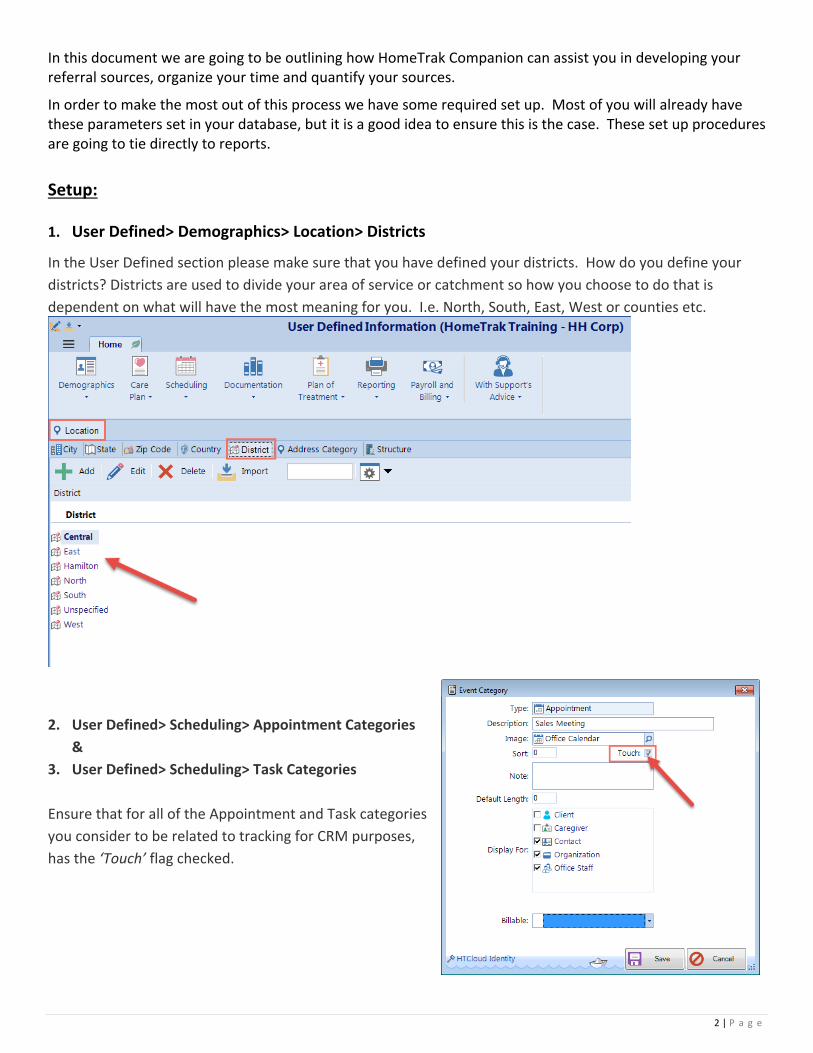
1. User Defined> Demographics> Location> Districts
In the User Defined section please make sure that you have defined your districts. How do you define your
districts? Districts are used to divide your area of service or catchment so how you choose to do that is
dependent on what will have the most meaning for you. I.e. North, South, East, West or counties etc.
2. User Defined> Scheduling> Appointment Categories
&
3. User Defined> Scheduling> Task Categories
Ensure that for all of the Appointment and Task categories
you consider to be related to tracking for CRM purposes,
has the ‘Touch’ flag checked.
3 | P a g e
Once you have these features set up, you are now ready to start building your referral Sources through the
Organizations Tab in the Relationship Module.
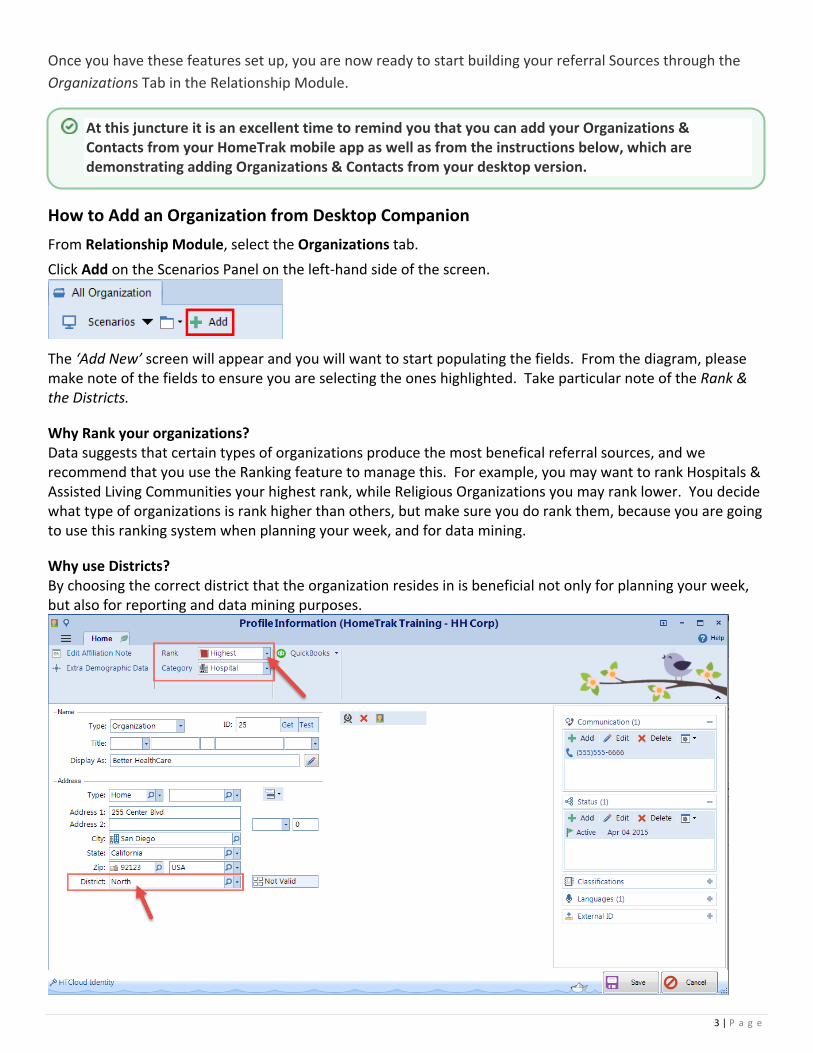
How to Add an Organization from Desktop Companion
From Relationship Module, select the Organizations tab.
Click Add on the Scenarios Panel on the left‐hand side of the screen.
The ‘Add New’ screen will appear and you will want to start populating the fields. From the diagram, please make note of the fields to ensure you are selecting the ones highlighted. Take particular note of the Rank & the Districts.
Why Rank your organizations? Data suggests that certain types of organizations produce the most benefical referral sources, and we recommend that you use the Ranking feature to manage this. For example, you may want to rank Hospitals & Assisted Living Communities your highest rank, while Religious Organizations you may rank lower. You decide what type of organizations is rank higher than others, but make sure you do rank them, because you are going to use this ranking system when planning your week, and for data mining.
Why use Districts? By choosing the correct district that the organization resides in is beneficial not only for planning your week, but also for reporting and data mining purposes.
At this juncture it is an excellent time to remind you that you can add your Organizations & Contacts from your HomeTrak mobile app as well as from the instructions below, which are demonstrating adding Organizations & Contacts from your desktop version.
4 | P a g e
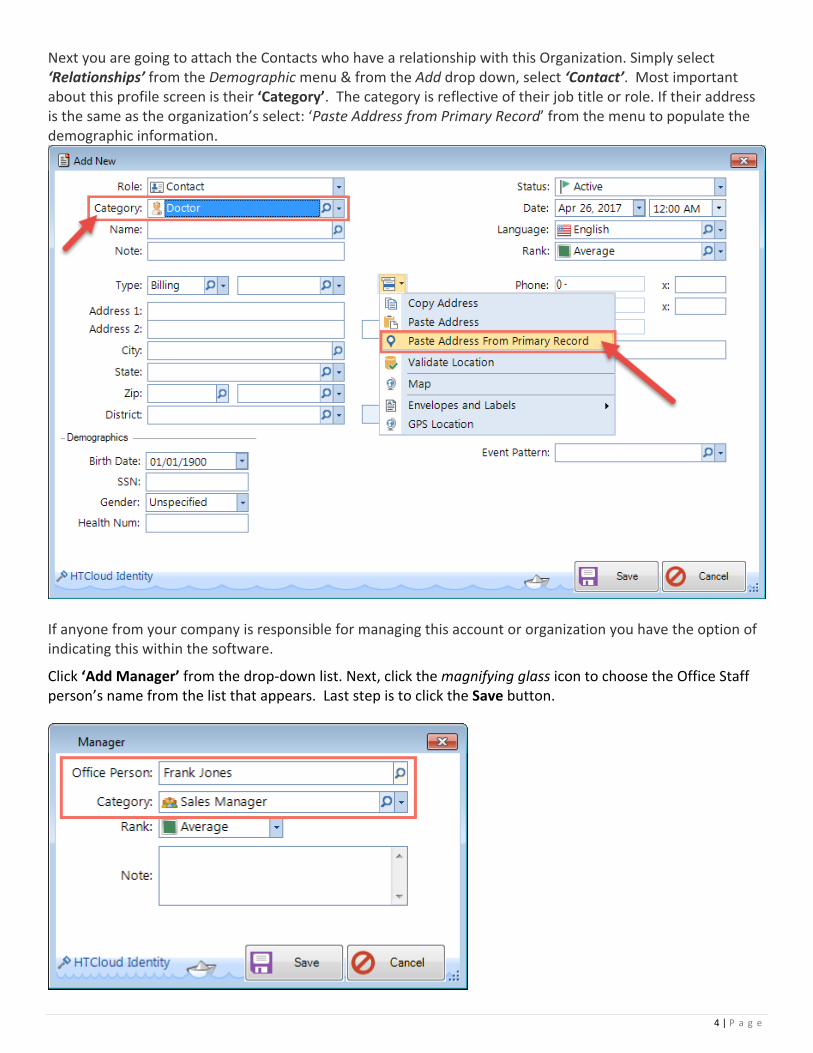
Next you are going to attach the Contacts who have a relationship with this Organization. Simply select ‘Relationships’ from the Demographic menu & from the Add drop down, select ‘Contact’. Most important about this profile screen is their ‘Category’. The category is reflective of their job title or role. If their address is the same as the organization’s select: ‘Paste Address from Primary Record’ from the menu to populate the demographic information.
If anyone from your company is responsible for managing this account or organization you have the option of indicating this within the software.
Click ‘Add Manager’ from the drop‐down list. Next, click the magnifying glass icon to choose the Office Staff person’s name from the list that appears. Last step is to click the Save button.

5 | P a g e
Coordinating your Week from the Desktop:
1. First, check to see if you have received any referrals in the week prior. From the Main Module> Reports> Clients> Documentation> Referrals report. Use the Scenario panel on the left‐hand side to select the Date Range and choose you’re Rank and Districts filter options. Click ‘View Data’ to show the results. Make note of any or the organizations that have sent you referrals.
2. Next you will want to have an overview of the past week’s appointments and tasks. Go to Reports>
Organization> Documentation> Excel Style Reporting> Tasks and Appointments. Same as above, select the Date Range and choose your Rank and District filter options. You will want to scroll through the notes that have been documented. Make note of the right‐hand panel as you go through the list, any notes taken will be visible to you for review. NOTE: Remember to tell your sales people to make notes after each appointment….this is very important and can be done very easily from their mobile apps.
6 | P a g e
Scheduling your week:
Many of your upcoming appointments and tasks will be made while you or your sales persons are on the road and using their mobile apps. Quick reminder…..anything you do in your mobile app will impact on your desktop version and vice versa.
From the Relationship Module select the Organizations Tab next, click Scheduling then click Calendar. Now you are going to make use of the filtering feature to make the best use of your time. Decide what District you are going to travel in and then select the Rank. Basically you are telling the system what area you want to focus your appointments/tasks in AND by order of importance (the rank feature). In addition you will easily be able to see where you are falling short with regards to referral sources by rank and district. As you click through the organizations (on the scenario panel) you can create your appointments/tasks and also see any appointments/tasks that have already been made. You have the ability to create these events for yourself or for anyone else in your office.
Go to Help System, click Scheduling then review Single Events or Recurring Events to learn how to add an Appointment or Task.
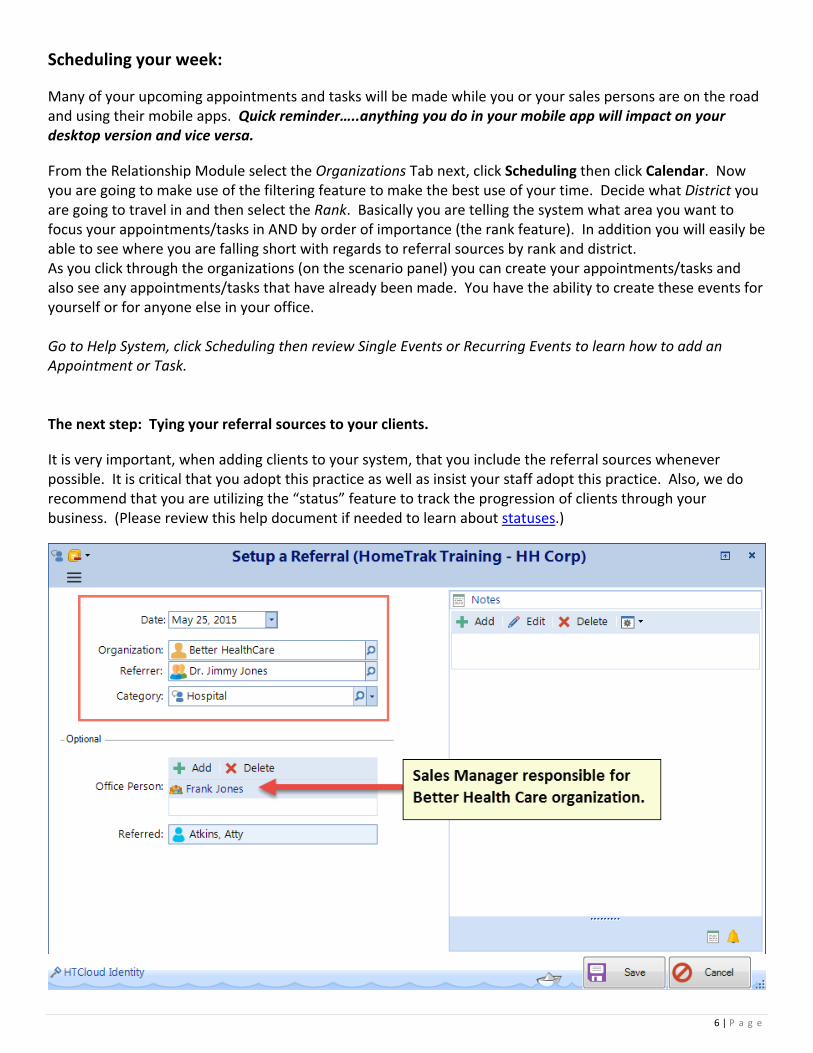
The next step: Tying your referral sources to your clients.
It is very important, when adding clients to your system, that you include the referral sources whenever possible. It is critical that you adopt this practice as well as insist your staff adopt this practice. Also, we do recommend that you are utilizing the “status” feature to track the progression of clients through your business. (Please review this help document if needed to learn about statuses.)
7 | P a g e
Data Mining and Analyzing for the CRM Process
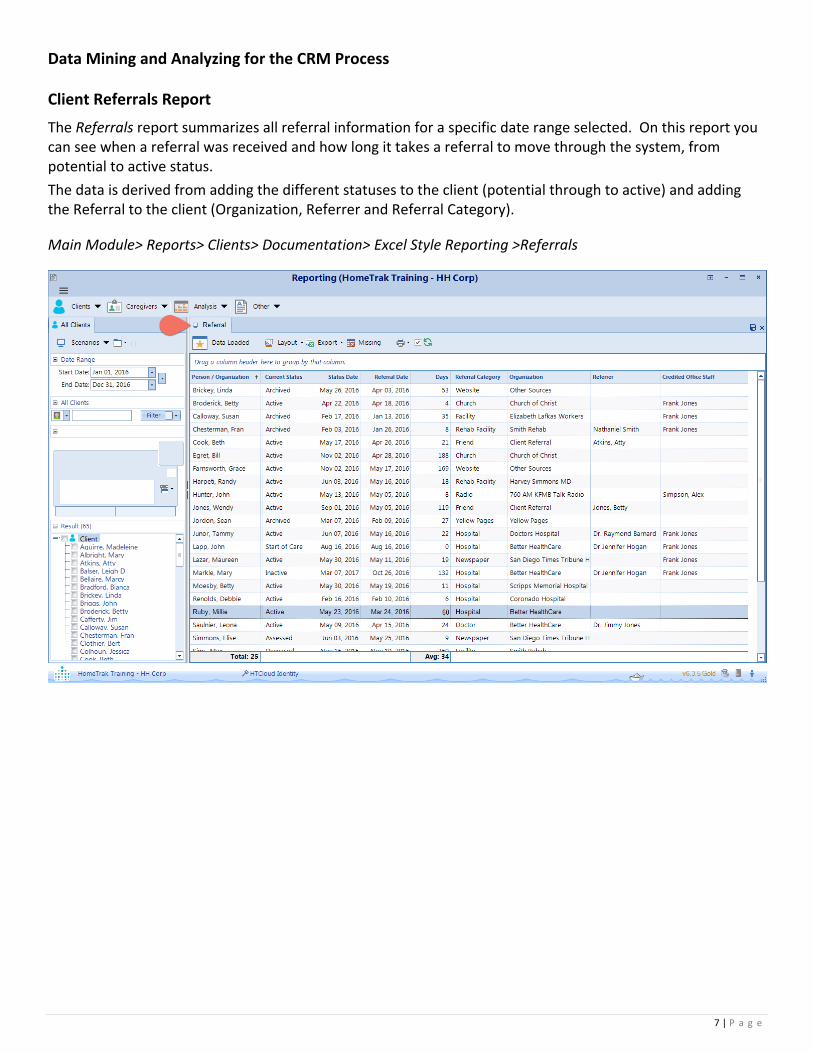
Client Referrals Report
The Referrals report summarizes all referral information for a specific date range selected. On this report you can see when a referral was received and how long it takes a referral to move through the system, from potential to active status.
The data is derived from adding the different statuses to the client (potential through to active) and adding the Referral to the client (Organization, Referrer and Referral Category).
Main Module> Reports> Clients> Documentation> Excel Style Reporting >Referrals
8 | P a g e
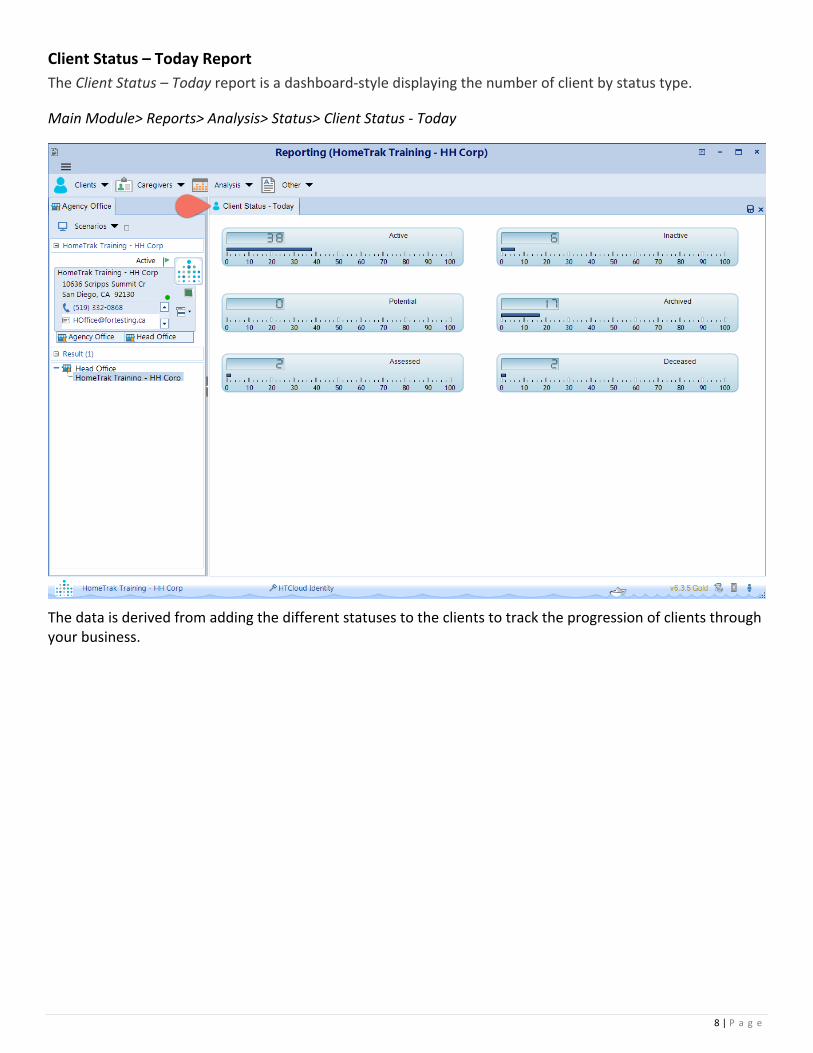
Client Status – Today Report
The Client Status – Today report is a dashboard‐style displaying the number of client by status type.
Main Module> Reports> Analysis> Status> Client Status ‐ Today
The data is derived from adding the different statuses to the clients to track the progression of clients through your business.

9 | P a g e
Client Lead Funnel Reports
We have two lead funnel reports; one from the date of inquiry and the second from the date you consider the client to be potential.
1. Client Lead Funnel – Inquiry
This grid provides a 12‐month analysis of how many Inquiry clients were added each month, and how many of those clients eventually progressed through Potential, Assessed statuses and became Active.
NOTE: The Potential, Assessed and Active count columns in the grid always track the progress of those Inquiry clients added in the month, regardless of when their status changed to Potential, Assessed or Active.
EXAMPLE: In January, a prospect client is added as an Inquiry. In February, this client’s status changes to Potential. The Potential status is counted against January in the lead funnel grid, not February. The grid does not count raw totals for each type of status on a month‐by‐month basis. It provides a count of Inquiry Clients added and analyzes how many of those Inquiry Clients actually become Active.
In order to be counted in the lead funnel, the Client must first have a Potential Status, followed by an Assessed Status before an Active Status. A client who is added as Active, without a previous Potential and Assessed status, will never be counted here.
Main Module> Reports> Analysis> Status> Client Lead Funnel – Inquiry
The data is derived from adding the different statuses to the clients to track the progression of clients through your business.
10 | P a g e
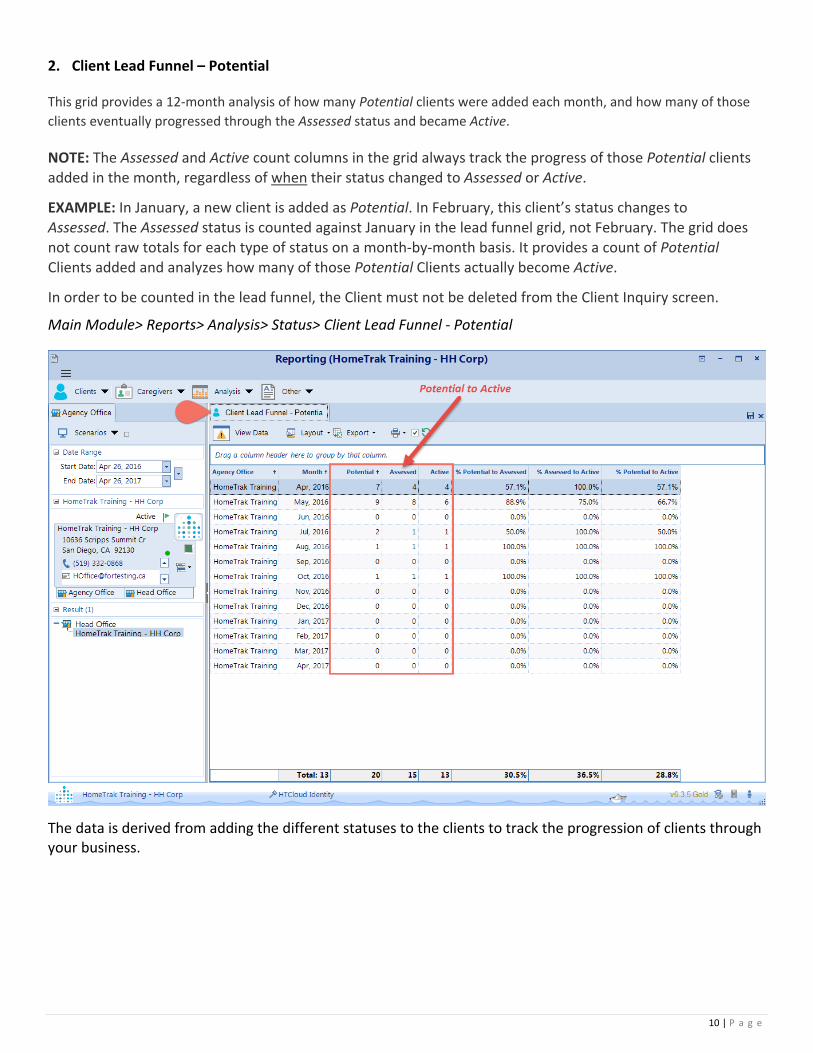
2. Client Lead Funnel – Potential
This grid provides a 12‐month analysis of how many Potential clients were added each month, and how many of those
clients eventually progressed through the Assessed status and became Active.
NOTE: The Assessed and Active count columns in the grid always track the progress of those Potential clients added in the month, regardless of when their status changed to Assessed or Active.
EXAMPLE: In January, a new client is added as Potential. In February, this client’s status changes to Assessed. The Assessed status is counted against January in the lead funnel grid, not February. The grid does not count raw totals for each type of status on a month‐by‐month basis. It provides a count of Potential Clients added and analyzes how many of those Potential Clients actually become Active.
In order to be counted in the lead funnel, the Client must not be deleted from the Client Inquiry screen.
Main Module> Reports> Analysis> Status> Client Lead Funnel ‐ Potential
The data is derived from adding the different statuses to the clients to track the progression of clients through your business.
11 | P a g e
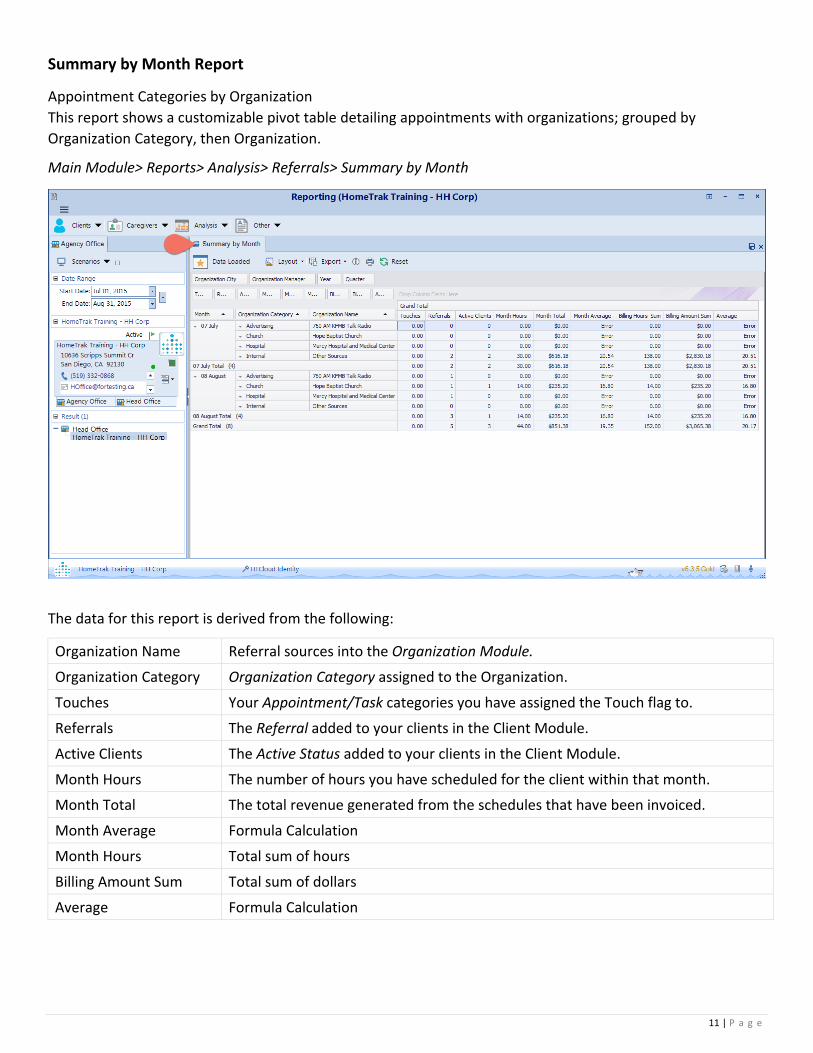
Summary by Month Report
Appointment Categories by Organization
This report shows a customizable pivot table detailing appointments with organizations; grouped by
Organization Category, then Organization.
Main Module> Reports> Analysis> Referrals> Summary by Month
The data for this report is derived from the following:
Organization Name Referral sources into the Organization Module.
Organization Category Organization Category assigned to the Organization.
Touches Your Appointment/Task categories you have assigned the Touch flag to.
Referrals The Referral added to your clients in the Client Module.
Active Clients The Active Status added to your clients in the Client Module.
Month Hours The number of hours you have scheduled for the client within that month.
Month Total The total revenue generated from the schedules that have been invoiced.
Month Average Formula Calculation
Month Hours Total sum of hours
Billing Amount Sum Total sum of dollars
Average Formula Calculation

12 | P a g e
Times Contacted Report
This report shows appointments and tasks with organizations; grouped by Organization Category, then
Organization.
Main Module> Reports> Analysis> Referrals> Times Contacted
The data for this report is derived from the appointments and tasks entered on the Organization’s calendar.
13 | P a g e
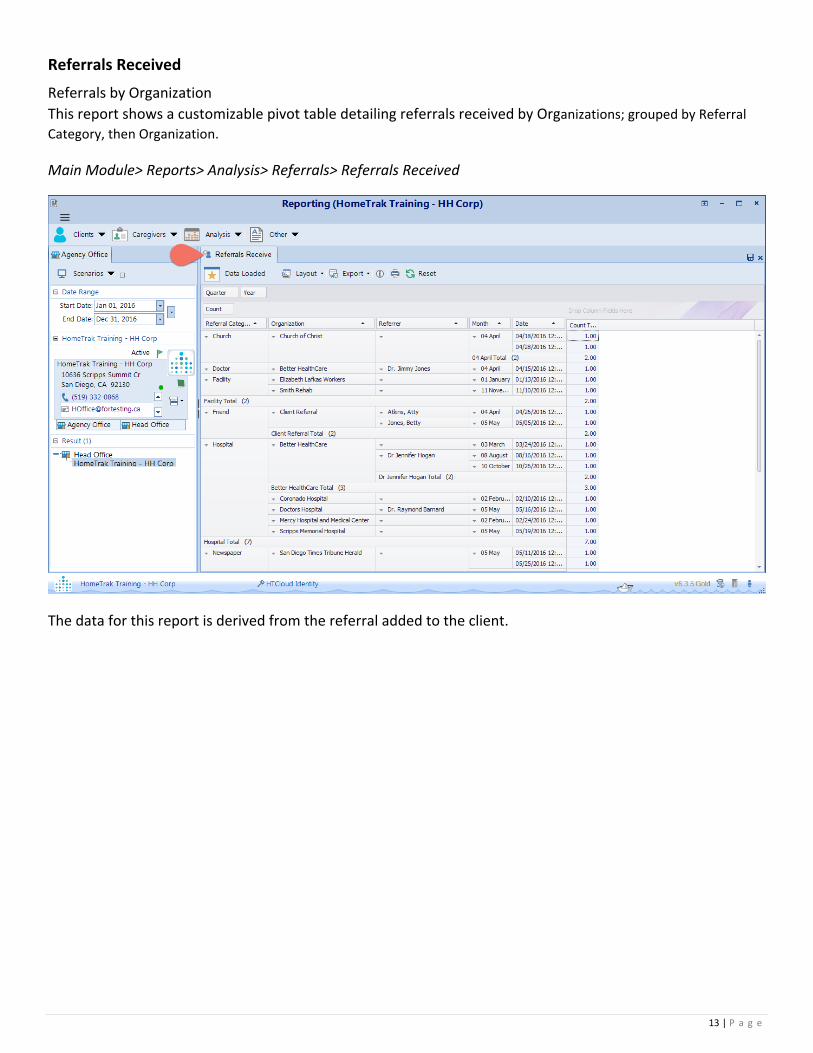
Referrals Received
Referrals by Organization
This report shows a customizable pivot table detailing referrals received by Organizations; grouped by Referral Category, then Organization.
Main Module> Reports> Analysis> Referrals> Referrals Received
The data for this report is derived from the referral added to the client.

14 | P a g e
Client Status Added by Referral
This report shows a customizable pivot table detailing information on statuses added to Clients in the system, grouped
by Referral Category, then Referral Organization.
Main Module> Reports> Analysis> Referrals> Client Status Added
The data is derived from adding the different statuses to the clients to track the progression of clients through your business.
15 | P a g e
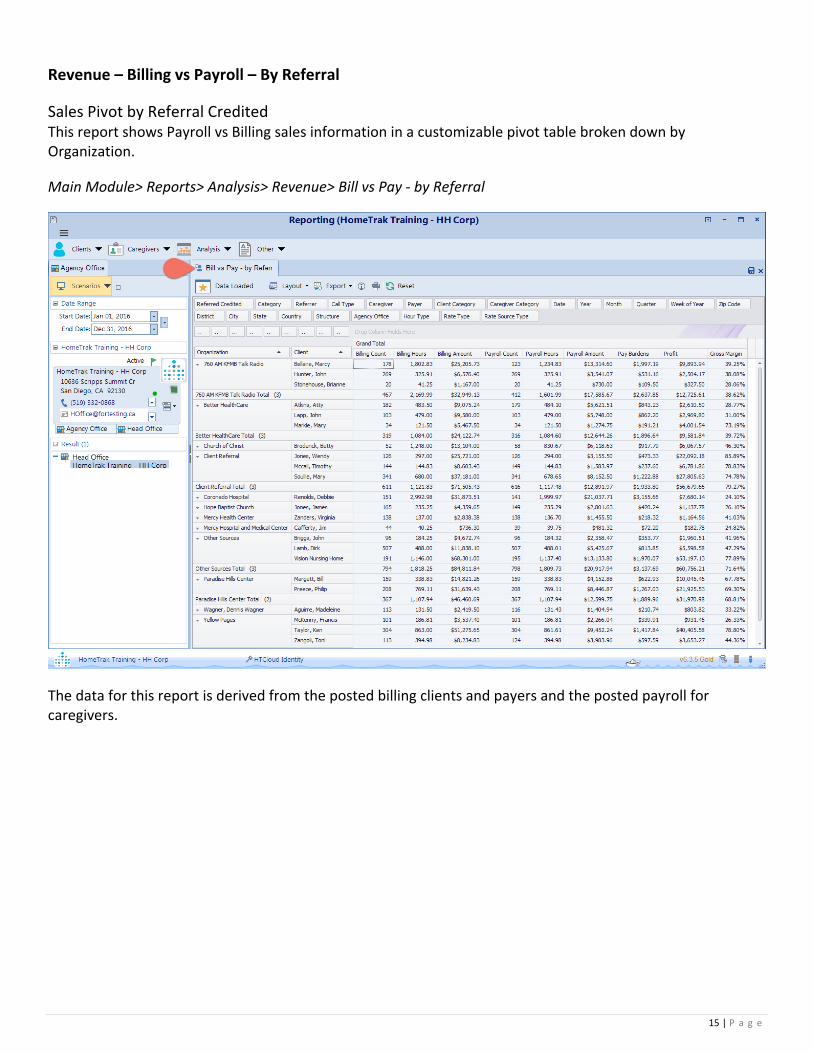
Revenue – Billing vs Payroll – By Referral
Sales Pivot by Referral Credited This report shows Payroll vs Billing sales information in a customizable pivot table broken down by Organization.
Main Module> Reports> Analysis> Revenue> Bill vs Pay ‐ by Referral
The data for this report is derived from the posted billing clients and payers and the posted payroll for caregivers.