Embed Size (px)
Citation preview

VA Decision Support System (DSS)
Paul G. Barnett PhD
Wei Yu, PhD
Samuel King, MS
Ciaran Phibbs, PhD
July 20, 2005

Outline of DSS Presentation
1. DSS Production Data
2. DSS National Data Extracts (NDE)
3. Comparison of DSS to VA Utilization Databases
4. Reports and Documentation

1. DSS Production Data
• Workload, clinical, and financial data from VA electronic medical recordVeterans Health Information Systems and Technology Architecture
(VistA)/Computerized Patient Record System (CPRS)
• Allocation data and schedule of relative values (unique to DSS)
• DSS finds the cost of:– VA health care products– VA health care stays and visits

DSS Production System
• Proprietary software and databases
• Located at Austin Automation Center
• Each medical center a separate database
• Medical centers grouped into data regions by network (VISN)
Where do DSS data come from?
VISTA workload, clinical, & financial data
Extracts of DSS- SAS Files at Austin
Time allocation Relative values
DSS VISN Level Production Databases
(at Austin but limited access)

DSS Production System Program Modules
• Account Level Budgeter (ALB)
• Department Cost Manager (DCM)
• Daily Cost & Resource Profiler (DCR)

Account Level Budgeter (ALB)
• Labor and supply costs are assigned to ALB cost centers

Costs assigned to cost centersCost allocation to ALBCC
Salary and supply cost
(PAID, FMS)
Activity allocation
Dropped
Account Level Budgeter
Dead-end Cost Centers
(no workload)
Indirect Cost Centers
Direct Cost Centers
Costs allocated to cost centers by activity reports and assignment of supply, equipment, other costs

Department Cost Manager (DCM)
• Overhead is distributed to patient care departments
• Workload is tabulated in units of relative value
• Cost per relative value is found
• Unit cost of each product is found
DCM distributes overhead to direct care departments
Account Level Budgeter
Indirect Cost CentersAdministration
Teaching
Research
Engineering etc.
Direct Cost CentersInpatient Medicine WardInpatient Psychiatric WardLong-Term Care UnitPrimary Care ClinicCardiology Clinic etc.
Department Cost ManagerInpatient Medicine Ward
Inpatient Psychiatric Ward
Long-Term Care Unit
Primary Care Clinic
Cardiology Clinic etc.
“Step down” allocation

Workload is tabulated in units of relative value
WorkloadCount of units of eachintermediate product
produced in department
Schedule of Relative Value Units
(RVUs) Relative resources neededfor each intermediate
product
Total RVUs produced
in department
X
=

Cost per unit of relative value is found
Total RVUs produced
in department
Department Cost
Cost per RVU in this department
=

Unit cost of each product is found
Cost per RVU in this department
Relative Value Unitsto produce this intermediate
product
=Unit cost of this
intermediate product
X
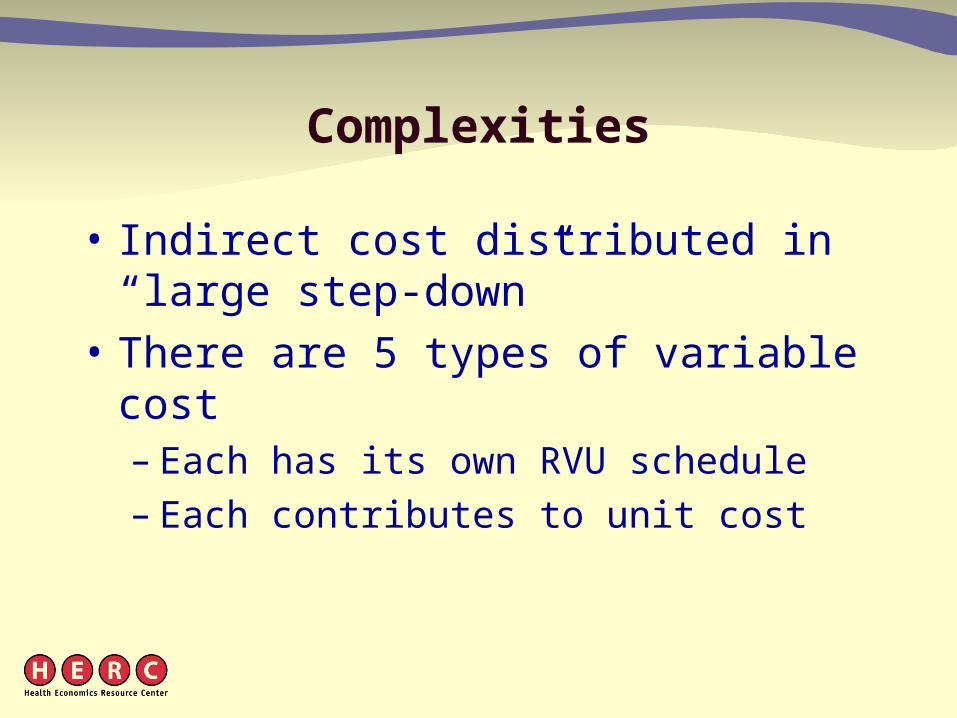
Complexities
• Indirect cost distributed in “large step-down”
• There are 5 types of variable cost– Each has its own RVU schedule– Each contributes to unit cost

Daily Cost & Resource Profiler (DCR)
• Intermediate products are bundled into encounters– (outpatient visit or inpatient stay)
• Costs are assigned to each encounter

Costs assigned to encounters Daily Cost & Resource Profiler (DCR)
Unit cost of each
intermediate product
WorkloadCount of each
intermediate product used in encounter
Total cost of encounter
(Visit or stay)
=
X

Financial data in DSS Production System
• Production unit cost and workload– Variance from budgeted cost & workload
• Intermediate product cost• Encounter (bundle of intermediate products)
– Inpatient stay– Outpatient encounter
• Analytical tools allow aggregation of encounters– e.g., episodes, cohorts

Clinical data in DSS Production System
• Diagnoses and procedures
• Detailed utilization data from radiology, laboratory surgery, pharmacy, other VISTA packages– Prescriptions– Results of 59 laboratory tests

Accessibility of production system
• Very difficult to obtain access permission – must be obtained from each medical center or VISN
– Only uses real Social Security Numbers - privacy issues
– Scarce computational power
– Costs accrue to facility owning data
• Even with permission, data can be extracted only with DSS report software, one network at a time

Outline of DSS Presentation
1. DSS Production Data
2. DSS National Data Extracts (NDE)
3. Comparison of DSS to VA Utilization Databases
4. Reports and Documentation

2. DSS National Data Extracts (NDE)
• Encounter level files– Inpatient files– Outpatient files– Intermediate Product Department files
• Department level financial files
• Clinical NDEs

Accessibility of national extract
• Stored as SAS files at Austin
• Web based report generator – VISN Support Service Center web site
(klfmenu)
• Easy access for users of VA Austin Automation Center (see HERC manual)

DSS Encounter Level NDE
• Inpatient files– Treating specialty file– Discharge file
• Outpatient Files– 4 pharmacy files– 4 files of all other care files

Cost data in all DSS NDE encounter files
• Total cost of encounter• Cost by department group
– Nursing, Lab, Pharmacy, Radiology, Surgery, Other
• Each type of cost divided into fixed direct, variable direct, and indirect
• Units of service• No intermediate product detail

Inpatient discharge file
• Care of patients discharged in fiscal year
• Record represents one discharge (even if stay involves multiple bed sections)
• Includes cost incurred in prior fiscal years
• May exclude stays that began before DSS implementation

DSS NDE data only in discharge file
• Admit Day
• Discharge Day
• Days of Stay
• Discharge treating specialty (bed section)

DSS inpatient treating specialty file
• The terms “treating specialty” and “bedsection” mean the same thing
• File includes:– Care provided during fiscal year– Stays not yet over – One record per bed section (treating specialty)
per month
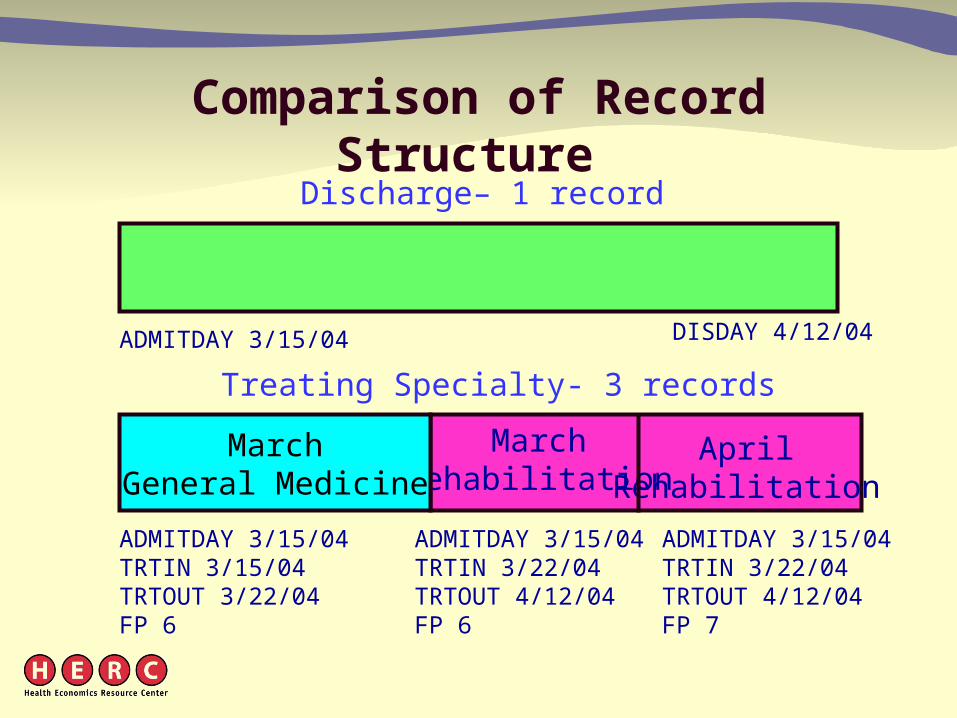
Comparison of Record Structure
ADMITDAY 3/15/04TRTIN 3/22/04TRTOUT 4/12/04FP 6
ADMITDAY 3/15/04TRTIN 3/22/04TRTOUT 4/12/04FP 7
MarchRehabilitation
AprilRehabilitation
ADMITDAY 3/15/04 DISDAY 4/12/04
MarchGeneral Medicine
ADMITDAY 3/15/04TRTIN 3/15/04TRTOUT 3/22/04FP 6
Treating Specialty- 3 records
Discharge– 1 record

DSS NDE data only in treating specialty file
• Treating Specialty• Census indicator (patient in hospital at end
of fiscal year)• Date of entry and exit from treating
specialty– Not number of days in treating specialty
• Stay admission date – Neither discharge date, nor length of stay

Comparison of Record Structure(Overlapping fiscal year)
SeptemberGeneral Medicine
OctoberGeneral Medicine
ADMITDAY 9/22/03 DISDAY 10/8/03In FY04 file
ADMITDAY 9/22/03TRTIN 9/22/03TRTOUT 9/30/03FP 12 CENSUS=Y
In FY03 File
ADMITDAY 9/22/03TRTIN 9/22/03TRTOUT 10/8/03FP 1 CENSUS=N
In FY04 File
Treating Specialty- 2 records
Discharge– 1 record

DSS NDE data in both inpatient files
• Admitting DRG
• Principal Diagnosis, Admitting Diagnosis
• Physician (VL4) and contract labor (VL5) cost sub-totals– Surgery, radiology, all other

Outpatient files
• Record represents all services provided to patient on a given day in a given clinic stop
• ~100 million records per year total
• Data divided into files by four groups of regional networks– 4 pharmacy files– 4 files for all other visits

DSS NDE data only in outpatient files
• Date of encounter
• DSS identifier (clinic stop)– DSS uses “pseudo stop” to characterize
utilization of laboratory, pharmacy etc.
• Flag variables identifying data source– National Patient Care Database– Pharmacy, Laboratory, Prosthetics, other

DSS Outpatient Records and Costs by Category Flag (Non-Pharmacy records)
FY2003Flag % of total records % of total cost
NPCD 81.4 79.0
CLI-records not in NPCD 2.0 1.9
PROS-prosthetics 3.5 5.0
DDC-Denver Distribution Center
0.8 0.9
NOSHOW 6.5 2.3
UTIL-no link to encounter 2.7 2.7
NOFLAG-ASI tests, etc. 2.5 7.2
MULTIPLE 0.7 0.9

Contract Long-term Care in DSS Outpatient File FY2004
Cost
(millions)
650 Community Nursing Homes 290.5
651 State Nursing Home 331.6
653 State Hospital 44.3
654 Non-VA Residential 12.0
655 Community non-VA 18.5

Intermediate Product Department Detail
• Both inpatient and outpatient files
• One record with costs incurred in each intermediate product department in stay/visit
• Not yet documented

DSS Department-Level NDE • Account Level Budget Cost Center (ALBCC)
– Cost and Hours– Cost Center (VA Service)– Budget Object Code (e.g. type of personnel)– ALB Cost Center– Production Unit– DCM Department
• Useful to find labor costs and hours rates by clinical area
• E.g., hourly labor cost of RN in psychiatry clinics
• Not yet documented, but see: klfmenu

DSS Department-Level NDE (cont.)
• Monthly Program Cost Report – Cost by Cost Distribution Account– Intended to replace CDR– Does not allocate national costs, depreciation,
unfunded pensions

Clinical DSS National Data Files
• Laboratory Tests– All tests, inpatient and outpatient
• Radiology– Cost of Each Procedure
• Prescriptions– Cost of Each Prescription
• Laboratory Results – 59 laboratory tests

Outline of DSS Presentation
1. DSS Production Data
2. DSS National Data Extracts (NDE)
3. Comparison of DSS to VA Utilization Databases
4. Reports and Documentation

Concerns about DSS accuracy
• Inpatient medical procedures not captured at all sites
• Uncertain quality of relative value units
• Uncertain accuracy of labor cost estimates
• Rare “million dollar” intermediate products

Validation Studies of DSS
• HERC annual evaluation of extracts• HERC validation of DSS Estimates of the
Cost of VA Stays for Acute Myocardial Infarction
• Additional studies underway:– ESRD Patients by Murphy et al at VIREC– CBOC costs by Maciejewski, et al– Stroke patient costs by Reker et al

Reason to Compare DSS and VA Utilization Data
• To check data validity
• To merge clinical data with cost files – NPCD files (PTF, OPC) have clinical data not
in DSS • diagnoses and procedure codes, length of stay,
demographics, etc.
– DSS has cost data
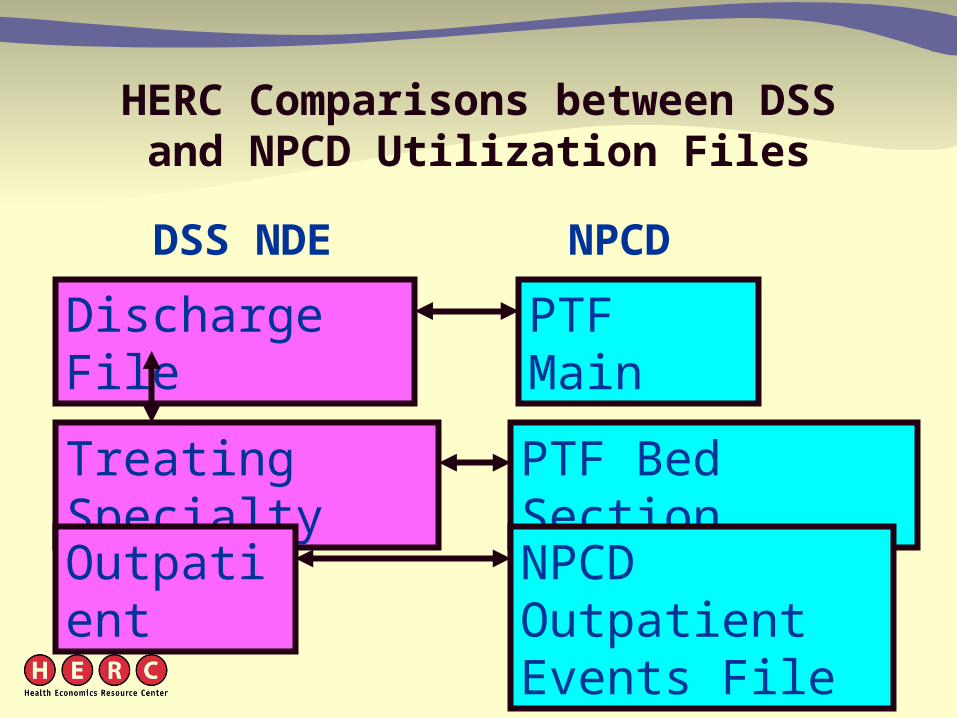
HERC Comparisons between DSS and NPCD Utilization Files
DSS NDE NPCD
Discharge File PTF Main
Treating Specialty PTF Bed Section
Outpatient NPCD Outpatient Events File

Design Differences Between DSS Discharge and PTF Main
• DSS treats observation care as outpatient care • PTF puts observation care in a separate hospital stay
file (PMO)• DSS does not have stays that began before date of
DSS implementation• Integration of facilities sometimes implemented on
different dates in different databases

PTF Main
633,116
Records
DSS Discharge vs. PTF Main FY2003
After adjusting for design differences
DSS NDE Discharge632,421Records PTF
only757
DSS
only
62
In both632,359

Design Differences Between DSS Treating Specialty and
PTF Bed Section
• DSS Treating Specialty file – divides bed section stays into separate records for
each month– includes stays not yet over at end of fiscal year– excludes days provided in prior fiscal years– excludes observation care– does not count a day that is less than 24 hours
when a patient is transferred to another bedsection

PTF Bed
Section
812,248
Records
Comparison of DSS Treating Specialty File with PTF Bed Section Files FY2003
After adjusting for design differences
DSS Treating Specialty819,148StaySegments
PTF only
4,877
DSS
only
11,294
In both~807,500
Differences between DSS Treating Specialty and PTF Bed Section
• Most of poor matches due to differences in dates– Differences in date of admission to bedsection – Differences in date of transfer/discharge from
bedsection– Differences (of one day) in admission or
discharge dates

Design Differences between DSS Treating Specialty File and Discharge File
• Discharge file has days provided before beginning of fiscal year (excluded from Treating Specialty)
• Treating Specialty file has stays that aren’t over by end of fiscal year (excluded from Discharge)
• Treating specialty divides a stay into separate records for each bedsection, for each month

Comparison of DSS Treating Specialty File and DSS Discharge FY2003
DSS
Discharge
606,950
Stays
DSS Treating Specialty611,893Stays
After adjusting for design differences
Discharge only221
stays
Treating
specialty
only
5,619
stays
In both606,274
stays

Comparison of DSS Treating Specialty and Discharge File
FY2002 FY2003
> $100 203 2,367
>$1,000 121 1,392
>$5,000 50 440
Number of staysby amount of cost difference

Design Differences Between DSS and NPCD Outpatient Files
• DSS outpatient file puts all of a day’s activities for a clinic stop in one record
• NPCD can have 2 or more records with same clinic stop on same day

Design Differences Between DSS and NPCD Outpatient Files (cont.)
• DSS has utilization not recorded in NPCD– Prosthetics
– Pharmacy
– No show (These are being phased out)
– Ancillary services
• NPCD has utilization not in DSS– Telephone care (but some is being added)
– Clinic visits by domiciliary and residential inpatients

Comparison of DSS and NPCD Outpatient Files FY2003
10% Sample, after adjusting for design differences
NPCD
Outpatient
6,177,171
Visit
Days
DSS Outpatient5,601,790Records
NPCD only390,151
DSS
only
2,301
In both5,599,489

Cost outliers in DSS Outpatient Files (Cost greater than $100,000)
FY2002 FY2003
Pharm
acy
Number 195 86
Total cost $43,034,998 $23,623,266
Maximum $1,249,454 $812,737
Clinics
Number 98 123
Total cost $22,180,695 $27,671,254
Maximum $758,844 $1,400,710

Summary
• DSS represents a great improvement in VA cost data
• DSS cost data are accessible in NDEs
• Data quality is improving
• DSS NDEs can be combined with utilization data bases to obtain demographics, procedures, & diagnoses

Summary (cont).
• Merger must consider differences in definition of record, what utilization is included– DSS discharge files easily matched to PTF main
– DSS treating specialty difficult to merge to PTF bed section files
– Outpatient • NPCD has data only on DSS visits with NPCD flag
• May be multiple NPCD records for each DSS record

Summary (cont.)
• Many sites have cost data that are consistent with variance and cost of non-VA sector, even in areas where DSS has weaknesses
• There are still problems with some DSS data
• Users should modify costs estimates that are unexpectedly high given characteristics of care

Outline of DSS Presentation
1. DSS Production Data
2. DSS National Data Extracts (NDE)
3. Comparison of DSS to VA Utilization Databases
4. Reports and Documentation

DSS National Data Extract Documentation
• See Publications on HERC web site– http://www.herc.research.med.va.gov– Research Guide to Decision Support System
National Cost Extracts 1998 - 2000 – Soon to be updated!
• Describes steps to gain access to DSS national extracts
• “Non-Disclosure statement” is no longer needed
DSS system
• DSS web site
• KLF menu

HERC Technical Reports
• Reconciliation of DSS NDE to VA utilization databases– #4: Reconciliation for FY2001– #9: Reconciliation for FY2001-2002– Next release: FY2003-2004 reconciliation

HERC Technical Reports (cont.)
• Comparisons of HERC and DSS Cost Data – #10: Inpatient Cost Comparisons– #13: Person-Level Aggregate Costs– Next release: Outpatient Cost

DSS Clinical NDE Documentation
• VIReC Research User Guide: DSS Clinical National Data Extracts FY2001-FY2003
• http://www.virec.research.med.va.gov/References/RUG/RUG-DSS01-03.pdf