Embed Size (px)
Citation preview
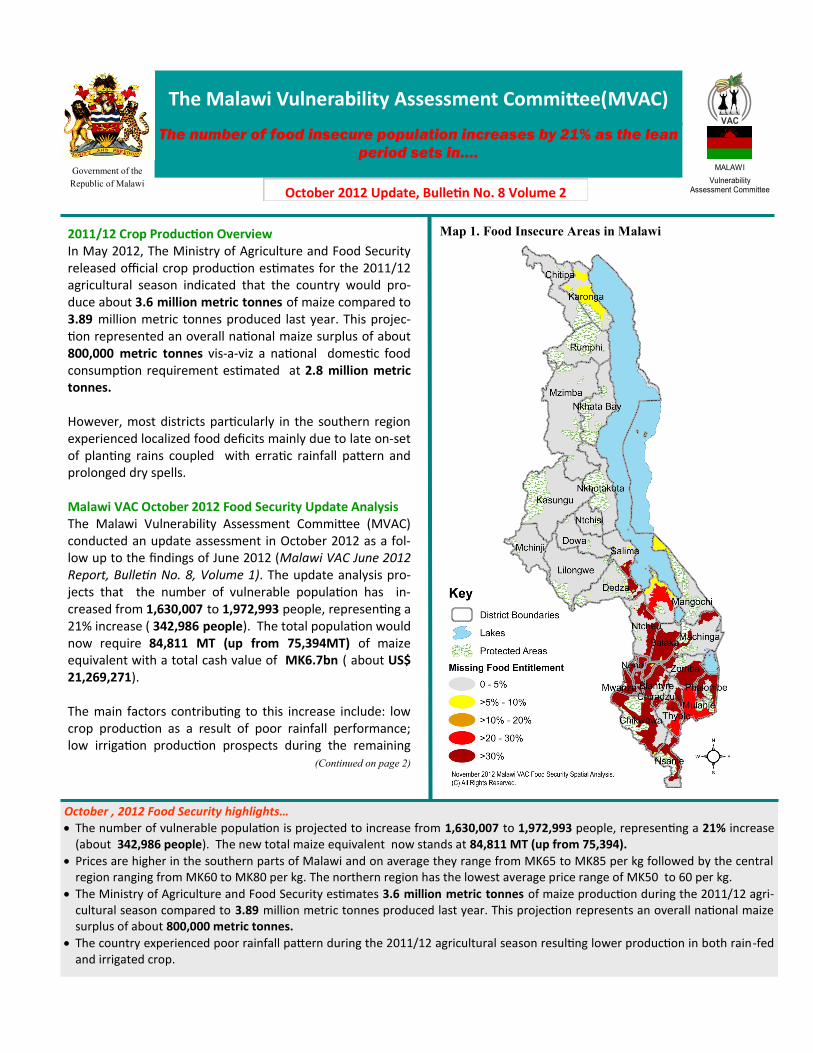
2011/12 Crop Production Overview In May 2012, The Ministry of Agriculture and Food Security released official crop production estimates for the 2011/12 agricultural season indicated that the country would pro-duce about 3.6 million metric tonnes of maize compared to 3.89 million metric tonnes produced last year. This projec-tion represented an overall national maize surplus of about 800,000 metric tonnes vis-a-viz a national domestic food consumption requirement estimated at 2.8 million metric tonnes. However, most districts particularly in the southern region experienced localized food deficits mainly due to late on-set of planting rains coupled with erratic rainfall pattern and prolonged dry spells. Malawi VAC October 2012 Food Security Update Analysis The Malawi Vulnerability Assessment Committee (MVAC) conducted an update assessment in October 2012 as a fol-low up to the findings of June 2012 (Malawi VAC June 2012 Report, Bulletin No. 8, Volume 1). The update analysis pro-jects that the number of vulnerable population has in-creased from 1,630,007 to 1,972,993 people, representing a 21% increase ( 342,986 people). The total population would now require 84,811 MT (up from 75,394MT) of maize equivalent with a total cash value of MK6.7bn ( about US$ 21,269,271). The main factors contributing to this increase include: low crop production as a result of poor rainfall performance; low irrigation production prospects during the remaining
(Continued on page 2)
October , 2012 Food Security highlights…
The number of vulnerable population is projected to increase from 1,630,007 to 1,972,993 people, representing a 21% increase (about 342,986 people). The new total maize equivalent now stands at 84,811 MT (up from 75,394).
Prices are higher in the southern parts of Malawi and on average they range from MK65 to MK85 per kg followed by the central region ranging from MK60 to MK80 per kg. The northern region has the lowest average price range of MK50 to 60 per kg.
The Ministry of Agriculture and Food Security estimates 3.6 million metric tonnes of maize production during the 2011/12 agri-cultural season compared to 3.89 million metric tonnes produced last year. This projection represents an overall national maize surplus of about 800,000 metric tonnes.
The country experienced poor rainfall pattern during the 2011/12 agricultural season resulting lower production in both rain-fed and irrigated crop.
The Malawi Vulnerability Assessment Committee(MVAC)
The number of food insecure population increases by 21% as the lean
period sets in….
MALAWI
Vulnerability Assessment Committee
VAC
Government of the
Republic of Malawi
October 2012 Update, Bulletin No. 8 Volume 2
Map 1. Food Insecure Areas in Malawi

half of the consumption period due to inadequate re-sidual moisture; increase in food prices and essential non-food items; larger geographical areas have been affected within the districts; low income levels due to poor cash crop production and sales; devaluation of the local currency has further weakened the purchas-ing of local communities; and instability in the supply of fuel products which is contributing to logistical prob-lems of moving food commodities from food surplus areas to food deficit areas. This update analysis will hold between October 2012 and March 2013 if the following conditions will prevail: That maize price will remain within the annual pro-
jected average of MK70 to MK80 price band during the third quarter and last quarter of the consump-tion period and that it will not surpass the maxi-mum projected price of MK100 during the last quar-ter of the consumption period.
That the humanitarian response in various forms will be up-scaled as the lean period sets in and pro-gresses until the next harvest.
That ADMARC and private traders will stock ade-quate quantities of food commodities during the re-maining part of the consumption period.
Labour opportunities will remain within the seasonal expected trends.
That the general price trend of different commodities will not increase significantly.
That Government will continue monitoring and regu-lating the flow of staple foods being exported .
Methodology and coverage of the assessment The Malawi VAC conducts vulnerability assessment and analysis (VAA) using a livelihood based analytical frame-work known as Household Economy Approach (HEA). Basically, the approach looks at how people‘s livelihoods operate in a normal situation and how this normal way of life changes when exposed to a shock(s), and how they respond in order to survive and protect their livelihood systems. Shocks may include drought, dry spells, price changes, and loss of labour opportunities. The analysis uses both primary and secondary data to arrive at conclu-sions. Districts covered during the update assessment include the following: Karonga, Mzimba and Rumphi in the north, Kasungu, Dedza, Ntcheu and Salima in the centre, Blantyre, Balaka, Chikhwawa, Mulanje, Mwanza, Mango-chi, Machinga, Phalombe, Neno, Nsanje, Thyolo, and
Zomba in the south. Markets and marketing The current maize nominal price trends show that price levels are within the projected trends as per the Malawi VAC June 2012 Report (Bulletin 8, Volume 1). Prices are higher in the southern parts of Malawi and on average they range from MK65 to MK85 per kg followed by the central region ranging from MK60 to MK80 per kg. The northern region has the lowest average price range of MK50 to 60 per kg. However, in Karonga, maize price ranges from MK66 to MK70 per kg largely due to influ-ence of demand from the Kayelekera Uranium mine and also cross border trading with Tanzania. This will need to be closely monitored as the prices have shown abnormal high trends. The Malawi VAC predicts that the price trends for maize will be in the range of MK85 to MK100 per kg, if interven-tions in the affected areas are implemented as recom-mended.
No District
Total
Affected
Population
Maize
Equivalent
(MT)
Cash Equivalent
(MK)
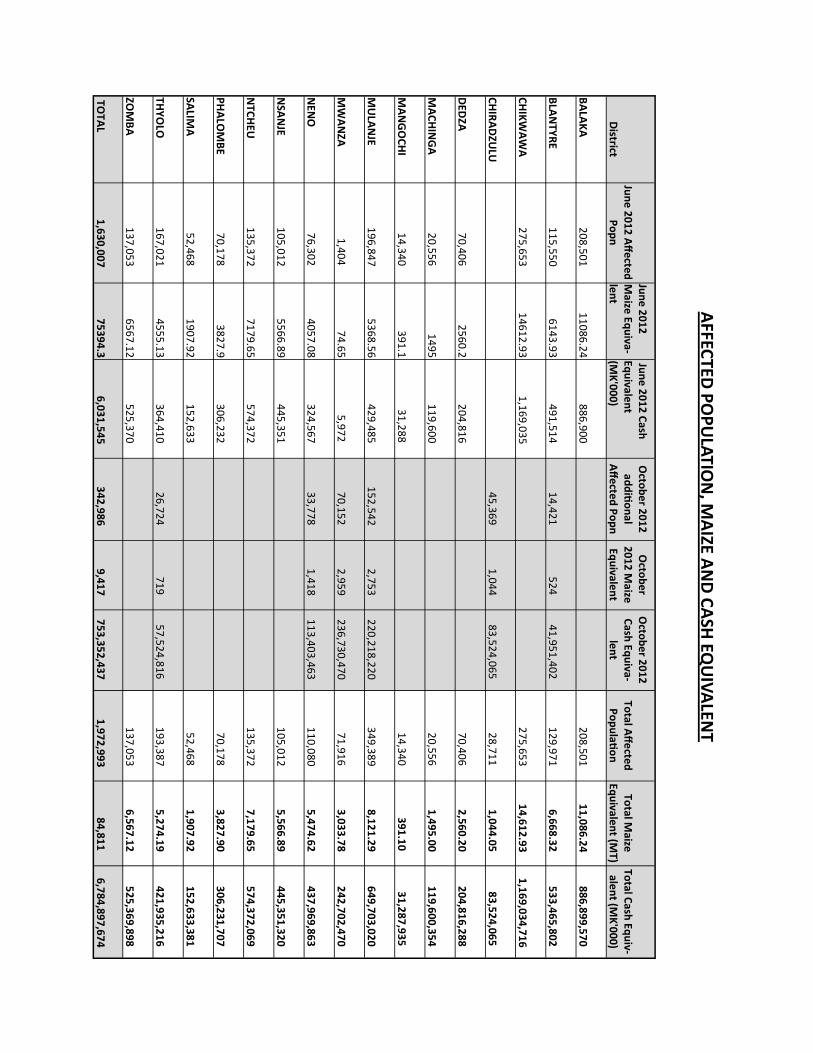
1 Balaka 208 501 11 086 886 899 569.56
2 Blantyre 129 971 6 668 533 465 801.89
3 Chikwawa 275 653 14 613 1 169 034 716.39
4 Chiradzulu 28 711 1 044 83 524 065.34
5 Dedza 70 406 2 560 204 816 287.62
6 Machinga 20 556 1 495 119 600 354.03
7 Mangochi 14 340 391 31 287 934.95
8 Mulanje 349 389 8 121 649 703 020.36
9 Mwanza 71 916 3 034 242 702 469.94
10 Neno 110 080 5 475 437 969 862.81
11 Nsanje 105 012 5 567 445 351 319.76
12 Ntcheu 135 372 7 180 574 372 069.47
13 Phalombe 70 178 3 828 306 231 706.68
14 Salima 52 468 1 908 152 633 381.10
15 Thyolo 193 387 5 274 421 935 216.17
16 Zomba 137 053 6 567 525 369 898.40
TOTAL 1 972 993 84 811 6 784 897 674
No District
Total
Affected
Population
Maize
Equivalent
(MT)
Cash Equivalent
(MK)
1 Balaka 208 501 11 086 886 899 569.56
2 Blantyre 129 971 6 668 533 465 801.89
3 Chikwawa 275 653 14 613 1 169 034 716.39
4 Chiradzulu 28 711 1 044 83 524 065.34
5 Dedza 70 406 2 560 204 816 287.62
6 Machinga 20 556 1 495 119 600 354.03
7 Mangochi 14 340 391 31 287 934.95
8 Mulanje 349 389 8 121 649 703 020.36
9 Mwanza 71 916 3 034 242 702 469.94
10 Neno 110 080 5 475 437 969 862.81
11 Nsanje 105 012 5 567 445 351 319.76
12 Ntcheu 135 372 7 180 574 372 069.47
13 Phalombe 70 178 3 828 306 231 706.68
14 Salima 52 468 1 908 152 633 381.10
15 Thyolo 193 387 5 274 421 935 216.17
16 Zomba 137 053 6 567 525 369 898.40
TOTAL 1 972 993 84 811 6 784 897 674
Table 1. Updated Food Insecure Population 2012/13
AFFEC
TED P
OP
ULA
TION
, MA
IZE AN
D C
ASH
EQU
IVA
LENT
District
Jun
e 2
01
2 A
ffe
cted
P
op
n
Jun
e 2
01
2
Maize
Equ
iva-le
nt
Jun
e 2
01
2 C
ash
Equ
ivalen
t (M
K'0
00
)
Octo
be
r 20
12
ad
diti
on
al
Aff
ecte
d P
op
n
Octo
be
r 2
01
2 M
aize
Equ
ivalen
t
Octo
be
r 20
12
C
ash Eq
uiva-
len
t To
tal Aff
ecte
d
Po
pu
latio
n
Total M
aize
Equ
ivalen
t (MT)
Total C
ash Eq
uiv-
alen
t (MK
'00
0)
BA
LAK
A
20
8,5
01
1
10
86
.24
88
6,9
00
20
8,5
01
1
1,0
86
.24
8
86
,89
9,5
70
BLA
NTY
RE
1
15
,55
0
61
43
.93
49
1,5
14
1
4,4
21
5
24
4
1,9
51
,40
2
12
9,9
71
6
,66
8.3
2
53
3,4
65
,80
2
CH
IKW
AW
A
27
5,6
53
1
46
12
.93
1,1
69
,03
5
2
75
,65
3
14
,61
2.9
3
1,1
69
,03
4,7
16
CH
IRA
DZU
LU
4
5,3
69
1
,04
4
83
,52
4,0
65
2
8,7
11
1
,04
4.0
5
83
,52
4,0
65
DED
ZA
70
,40
6
25
60
.2 2
04
,81
6
7
0,4
06
2
,56
0.2
0
20
4,8
16
,28
8
MA
CH
ING
A
20
,55
6
14
95
11
9,6
00
20
,55
6
1,4
95
.00
1
19
,60
0,3
54
MA
NG
OC
HI
14
,34
0
39
1.1
31
,28
8
1
4,3
40
3
91
.10
3
1,2
87
,93
5
MU
LAN
JE 1
96
,84
7
53
68
.56
42
9,4
85
1
52
,54
2
2,7
53
2
20
,21
8,2
20
3
49
,38
9
8,1
21
.29
6
49
,70
3,0
20
MW
AN
ZA
1,4
04
7
4.6
5 5
,97
2
70
,15
2
2,9
59
2
36
,73
0,4
70
7
1,9
16
3
,03
3.7
8
24
2,7
02
,47
0
NEN
O
76
,30
2
40
57
.08
32
4,5
67
3
3,7
78
1
,41
8
11
3,4
03
,46
3
11
0,0
80
5
,47
4.6
2
43
7,9
69
,86
3
NSA
NJE
10
5,0
12
5
56
6.8
9 4
45
,35
1
1
05
,01
2
5,5
66
.89
4
45
,35
1,3
20
NTC
HEU
1
35
,37
2
71
79
.65
57
4,3
72
13
5,3
72
7
,17
9.6
5
57
4,3
72
,06
9
PH
ALO
MB
E 7
0,1
78
3
82
7.9
30
6,2
32
70
,17
8
3,8
27
.90
3
06
,23
1,7
07
SALIM
A
52
,46
8
19
07
.92
15
2,6
33
52
,46
8
1,9
07
.92
1
52
,63
3,3
81
THY
OLO
1
67
,02
1
45
55
.13
36
4,4
10
2
6,7
24
7
19
5
7,5
24
,81
6
19
3,3
87
5
,27
4.1
9
42
1,9
35
,21
6
ZOM
BA
1
37
,05
3
65
67
.12
52
5,3
70
13
7,0
53
6
,56
7.1
2
52
5,3
69
,89
8
TOTA
L 1
,63
0,0
07
7
53
94
.3 6
,03
1,5
45
3
42
,98
6
9,4
17
7
53
,35
2,4
37
1
,97
2,9
93
8
4,8
11
6
,78
4,8
97
,67
4

MALAWI
Vulnerability Assessment Committee
VAC
The MVAC Secretariat is funded by the Government of Malawi and the British
Department for International Development (DFID), with technical and financial
support from SADC RVAA Programme.
Room 58, Ministry of Economic Planning & Development
P O. Box 30136 Lilongwe, 3
Malawi Tel. +265 (0) 1 78 8417 Fax +265 (0) 1 78 8609
The Malawi Vulnerability Assessment Committee comprises Government, inter-government, academic and non-profit member organizations that seek to pro-vide information to inform public action. Participating MVAC members and funding institutions include:
Ministry of Economic Planning &
Development.
Ministry of Agriculture and Food
Security
Ministry of Local Government and
Rural Development
Department Disaster Management
Affairs
National Statistics Office
OPC, Department of Nutrition and
HIV/AIDS
Department of Climate Change
World Food Programme
University of Malawi
Conclusions and Recommendations
The update analysis projects that the number of vulnerable population is projected to increase from 1,630,007 to 1,972,993 people, representing a 21% increase ( 342, 986 additional people between November , 2012 and March 2013) . These people would require a total 84,811 MT of maize equivalent with a cash value of MK6.7bn ( about US$ 21,269,271) up to March, 2013.
The main factors contributing to this increase in food insecure population include: poor rainfall performance; increase in food prices and essential non-food items; low poor cash crop production and sales; devaluation of the local currency; and instability in the supply of fuel products which is contributing to logistical problems.
Maize prices are currently within the projected trends as per the MVAC June 2012 analysis (Bulletin 8, Volume 1).
Unlike last year when only the poor wealth groups were affected due to their low coping capacity, this year’s situation has also affected the middle wealth groups in some areas.
With poor crop production and low income levels, better off households, that normally engage others in casual labour, will offer fewer casual opportunities because they have also been affected by the dry spells.
The MVAC recommends the following:
The on– going humanitarian response resources will end around November or December, 2012, we implore government and cooperating partners to mobilise extra resources to cover the deficit for the remaining months to March, 2013.
Government and its partners should explore a range of interventions varying from cash-based to food-based public works programmes in addressing the situation. Further more, there is need to coo
A need to conduct a nutrition survey in the affected areas later in the year to assess nutrition status of the vul-nerable groups of people.
ADMARC and private traders to stock enough maize in the affected areas to stabilize price fluctuations.
Government should intensify promotion of irrigation to reduce heavy reliance on rain-fed agriculture.


![POTENZA DI CORTOCIRCUITO NELLE RETI ... - … · Scc [MVA] AT 500 MVA con trasformatori < 40 MVA AT 2000 MVA con trasformatori < 40 MVA AT 500 MVA con trasformatori 63 MVA Per i nodi](https://img.pdfslide.net/doc/110x75/5c0c153909d3f252498b8ed4/potenza-di-cortocircuito-nelle-reti-scc-mva-at-500-mva-con-trasformatori.jpg)