Embed Size (px)
Citation preview

1
Vale’s Performance in 1Q17
Ricardo Teles / Agência Vale
Rio de Janeiro, April 27th, 2017

2 Ag
en
da“This presentation may include statements that present Vale's expectations about
future events or results. All statements, when based upon expectations about the
future and not on historical facts, involve various risks and uncertainties. Vale
cannot guarantee that such statements will prove correct. These risks and
uncertainties include factors related to the following: (a) the countries where we
operate, especially Brazil and Canada; (b) the global economy; (c) the capital
markets; (d) the mining and metals prices and their dependence on global
industrial production, which is cyclical by nature; and (e) global competition in the
markets in which Vale operates. To obtain further information on factors that may
lead to results different from those forecast by Vale, please consult the reports
Vale files with the U.S. Securities and Exchange Commission (SEC), the
Brazilian Comissão de Valores Mobiliários (CVM), the French Autorité des
Marchés Financiers (AMF) and in particular the factors discussed under
“Forward-Looking Statements” and “Risk Factors” in Vale’s annual report on Form
20-F.”
“Cautionary Note to U.S. Investors - The SEC permits mining companies, in their
filings with the SEC, to disclose only those mineral deposits that a company can
economically and legally extract or produce. We present certain information in
this presentation, including ‘measured resources,’ ‘indicated resources,’ ‘inferred
resources,’ ‘geologic resources’, which would not be permitted in an SEC filing.
These materials are not proven or probable reserves, as defined by the SEC, and
we cannot assure you that these materials will be converted into proven or
probable reserves, as defined by the SEC. U.S. Investors should consider closely
the disclosure in our Annual Report on Form 20-K, which may be obtained from
us, from our website or at http://http://us.sec.gov/edgar.shtml.” Dis
clai
mer

3 Ag
en
da
1. Vale’s performance in 1Q17
2. Capital expenditures
3. Capital structure
4. Business segment performance
Agen
da

4
Vale’s performance in
1Q17

5
Fe Pellets Ni Cu Coal
Record production performance in iron ore
and coal
Production highlights 1Q17
Total: 86.2 Mt
Carajás: 36.0 Mt
Total: 12.4 Mt Total: 71.4 kt
VNC: 10.2 kt
Total: 109.0 kt
Salobo: 42.6 kt
Mozambique: 2.4 Mt
&
%
Quarterly record%
&
% &
5
Record for a first quarter&

6
45%
14%
18%
10%
7%
3%4%
China Other AsiaEurope BrazilNorth America Middle EastRest of the World
Seasonally lower sales volumes led to lower
q-o-q revenues
Highlights 1Q17
Net operating revenues of US$ 8.515
billion
Revenues were 8.1% lower vs. 4Q16
mainly due to seasonally lower sales
volumes of Ferrous Minerals
59% sales to Asia and 10% domestic
sales
Ferrous Minerals accounted for 76%
of revenues
Base Metals accounted for 19% of
revenues
Net operating revenues by destination
in 1Q17
6

7
5.632
5.115
0.703
0.213
0.121 0.148
4Q16 Sales volumes
Higher costs
FX Expenses 1Q17
Lower costs achieved driven by lower sales
despite exchange rate and inflation
Highlights
Total costs and expenses decreased
by US$ 517 million
COGS was impacted by higher price-
related cost factors such as the
leasing of pellet plants, royalties, feed
purchased from third-parties and higher
bunker oil prices
Higher costs were partially offset by
lower expenses
Costs and expenses 1Q17 vs. 4Q16
US$ billion
7

8
1.935
4.7224.308
1Q16 4Q16 1Q17
EBITDA impacted by seasonally lower
volumes and higher prices
Highlights 1Q17
Overall EBITDA increased 123% vs.
1Q16; and decreased 9% vs. 4Q16
EBITDA decreased driven by seasonally
lower sales volumes (US$ 828 million)
partially offset by higher prices (US$ 672
million)
Iron ore sales volumes were planned to
take into account the build-up of
inventory due to blending activities
EBITDA, q-o-q
123%
US$ billion
8
9
Capital expenditures

10
Steady reduction of investments
Highlights 1Q17
Total capex was US$ 1.113 billion in 1Q17,
decreasing US$ 210 million vs. 4Q16
Ferrous Minerals and Base Metals business
segments represented 57% and 38% of
sustaining capex
Base Metals sustaining will be higher in
2017 due to the transition to a single furnace
operation in Sudbury and the Air Emission
Reduction project
Project and sustaining capex
US$ million
913
588 587
497735
526
1Q16 4Q16 1Q17
Growth projects Sustaining
1,323
1,113
10
1,410

11
4.2 4.03.7
2017E 2018E 2019E
Vale’s capex guidance excluding
investments in Fertilizers segment
US$ billion
Note: BRL/USD exchange rate of BRL/USD 3.37 from 2017 onwards
11

12
S11D continued its successful ramp-up,
advancing according to plan
Highlights
88% of combined physical
progress in 1Q17 with 98%
progress at the mine site and
80% at the logistic
infrastructure sites
The duplication of the
railway reached 66%
physical progress with 367
km duplicated
Onshore expansion reached
89% physical progress
12
S11D Mine – In operation

13
Capital structure
14
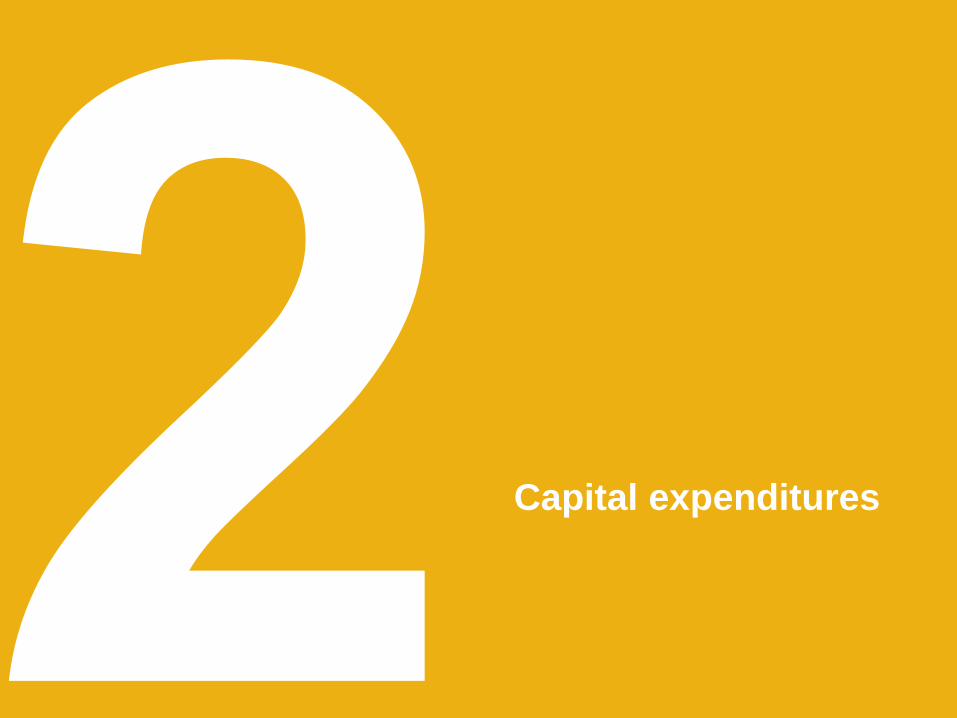
27,661
25,042
22,777
1Q16 4Q16 1Q17
US$ 6.793 billion
Delivering net debt reduction to achieve
US$ 15-17 billion target
14
Net debt
Cash position
on March 31st, 2017
US$ million

15
4.03.8
3.0
2.1
1.6
1Q16 2Q16 3Q16 4Q16 1Q17
A significant improvement in Net Debt /
EBITDA ratio
Net debt / LTM1 EBITDA Ratio
1 LTM – last twelve months, excluding non-recurring items.
Net debt in
1Q17:
US$ 22.777
billion
Cash position in
1Q17:
US$ 6.793 billion
Average maturity:
8.0 years
Average cost of
debt:
4.71% per annum
15

16
0.83.1 3.5 3.9
17.6
28.9
2017 2018 2019 2020 2021onwards
Gross debt
Cash balance will be used to implement a liability
management program to reduce Gross Debt in 2017
Gross debt amortization schedule1
1 As of March 31st, 2017. Does not include accrued charges.
US$ billion
61% of our debt settlement will occur
after 2020
16
31,470
29,322 29,570
1Q16 4Q16 1Q17
Gross debt
US$ million

17
We concluded the equity transaction with
Mitsui in March 2017
1 Very Large Ore Carriers2 Total value of transaction is US$ 2.5 billion with US$ 1.25 billion in cash and the remainder in Mosaic’s shares; the deal was announced in December 2016
and is expected to be completed late 2017 as conditions precedent are fulfilled
17
US$ billion
Reference
US$ 1 billion
10 VLOCs¹
El Hatillo
Araucária
Ferroalloys in
Europe
Oil and gasconcessions
CADAM
2011-2012
US$ 2.6 billion
GoldstreamI
VLI
Log-In
Fosbrasil
Tres Valles
Norsk
Hydro
2013
US$ 6.0 billion
Goldstream II
Belo Monte stake
2015
US$ 3.0 billion
8 VLOCs¹
MBR preferredshares
2016
US$ 1.3 billion
Goldstream III
3 VLOCs1
Fertilizers2
Paragominas
Capesizes
2017
US$ 3.2 billion
Global
Coal –
Mitsui
Equity
Aluminumassets
18
Business segment
performance

19
Ferrous Minerals EBITDA was practically in line with
4Q16, despite seasonally lower sales volumes
4,109 3,967
584
84 51
774
138
5 75 115
EBITDA 4Q16
Price FX Bunker Volume Commercial initiatives
CFR Freight Sales
Unit costs Others EBITDA 1Q17
US$ million, 4Q16 vs. 1Q17
US$ 183M
19

201 Ex-ROM
1Q17 cash break-even cost landed in China
for iron ore and pellets
14.7
14.2
2.6
0.6 2.9
2.4
32.6
2.1
30.5
3.8 34.4
C1 cash cost¹ Freight Royalties & expenses
Distribution Moisture Quality EBITDA breakeven
iron ore fines
Pellet adjustment
EBITDA breakeven (pellets &
fines)
Sustaining Iron ore & pellets cash breakeven
Cost landed in China
US$/t, 1Q17
20

21
Cash cost1 in BRL remained at low levels
despite inflationary pressures
54.6
50.0
46.9 46.347.5
46.1
42.2
44.846.1
0.73.0
1Q15 2Q15 3Q15 4Q15 1Q16 2Q16 3Q16 4Q16 1Q17
1 2015 figures were adjusted to the new allocation criteria, as reported in the 4Q15, and include acquisition costs of third party purchased ore
-15.6%
R$/tNon-recurring costs
21
-2.9%

22
Price realization continued to improve in
1Q17
85.6 86.7
75.8
1.9
0.5
4.1 2.1 0.1
3.2
4.1
6.8
AveragePlatts
1Q17 (dmt)
Quality Premium / discount and commercial conditions
Provisionalprices in
prior quarter¹
Laggedprices
Current Provisionalprices
in currentquarter²
CFR reference price (dmt)
Adjustmentfor
FOB sales
Moisture Vale CFR/FOB price
(wmt)³
Impact of pricing system adjustments
1 Adjustment as a result of provisional prices booked in 4Q16 at US$ 74.6/t.2 Difference between the weighted average of the prices provisionally set at the end of 1Q17 at US$ 77.9/t based on forward curves and US$ 85.6/t from the 1Q17 IODEX.3 Vale price is net of taxes.
US$/t, 1Q17
+ 1.1 US$/t
22
23
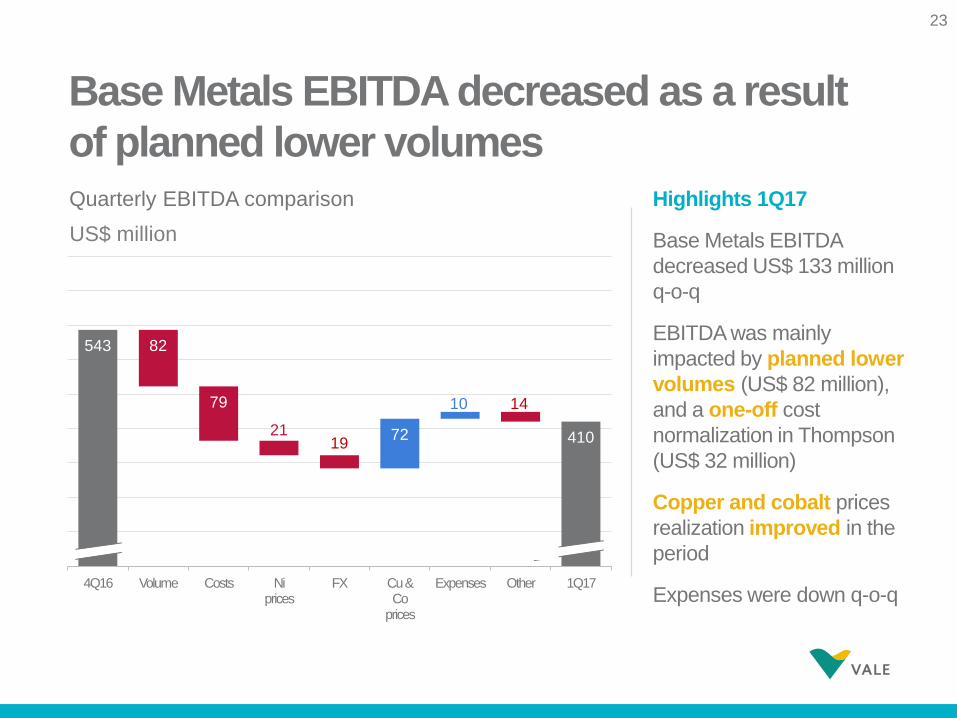
543
410
82
79
2119
72
10 14
4Q16 Volume Costs Ni prices
FX Cu & Co
prices
Expenses Other 1Q17
Base Metals EBITDA decreased as a result
of planned lower volumesHighlights 1Q17
Base Metals EBITDA
decreased US$ 133 million
q-o-q
EBITDA was mainly
impacted by planned lower
volumes (US$ 82 million),
and a one-off cost
normalization in Thompson
(US$ 32 million)
Copper and cobalt prices
realization improved in the
period
Expenses were down q-o-q
Quarterly EBITDA comparison
US$ million
23

24
Coal production cost per ton through Nacala
decreased driven by the quarterly production record
24
900
1,585
2,434
1Q16 4Q16 1Q17
Moatize coal production
000’ t
168.0
97.883.9
1Q16 4Q16 1Q17
Moatize production cost through Nacala
US$/t

25
Additional
information

26
Non-recurring costs
Evolution of iron ore fines cash cost, freight
and expenses
12.313.5
14.7
0.9
1Q16 4Q16 1Q17
C1 Cash Cost FOB Port1 Freight
US$/t
11.3
13.214.2
1Q16 4Q16 1Q17
Expenses2 & Royalties
4.0
3.5
2.5
1.3
1Q16 4Q16 1Q17
1 Ex-ROM and ex-royalties; all figures as per new managerial allocation changes, as reported in 4Q15, and include acquisition costs of third party
purchased ore.2 Net of depreciation.3 Positive one-off impact of insurance recoveries of US$ 85 million in 1Q17.
+20.5% +25.7% -5.0%
26
Positive one-off impact3

27
Iron ore pricing systems
Provisional - prior quarter Lagged
Current Provisional - current quarter
4.84.1
4Q16 1Q17-1.3
-2.1
4Q16 1Q17
1.0
-0.1
4Q16 1Q17
1.7
-3.2
4Q16 1Q17
Pricing system breakdown Impact of pricing mechanisms
US$/t
27
10% 10%
45% 49%
45% 41%
4Q16 1Q17
Lagged
Current
Provisional
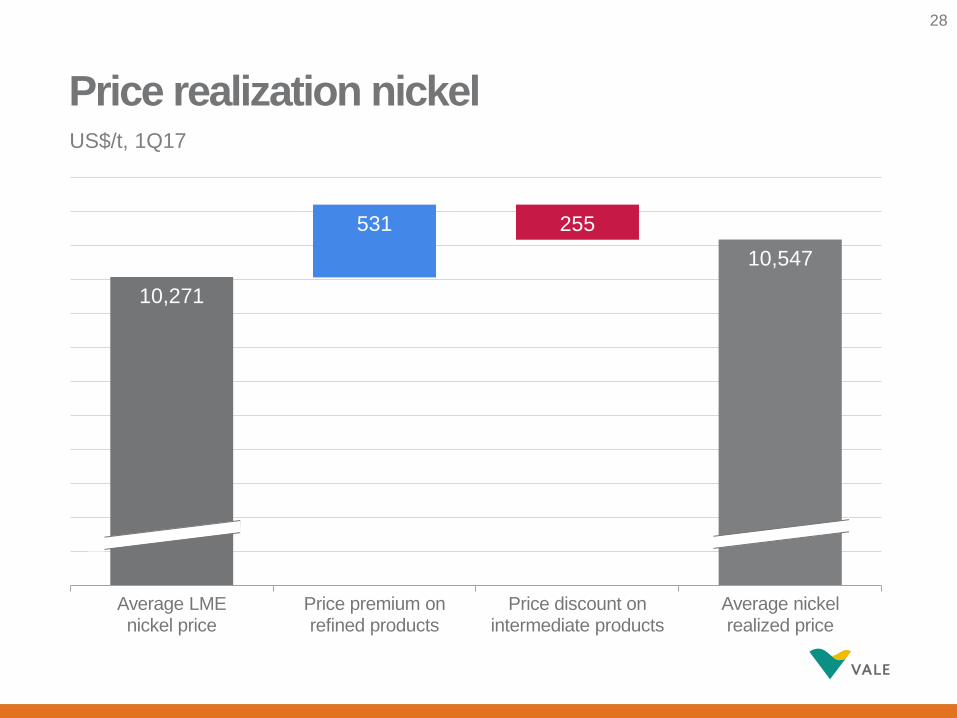
28
Price realization nickel
10,271
10,547
531 255
Average LME nickel price
Price premium on refined products
Price discount on intermediate products
Average nickel realized price
28
US$/t, 1Q17
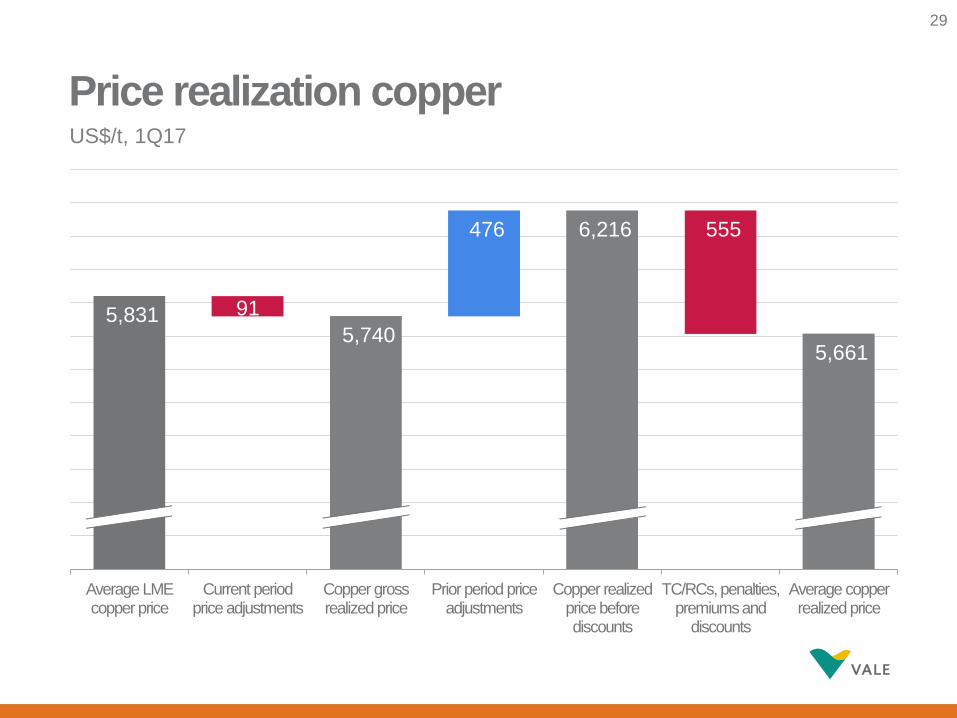
29
Price realization copper
5,831 5,740
6,216
5,661
91
476 555
Average LME copper price
Current period price adjustments
Copper gross realized price
Prior period price adjustments
Copper realized price before discounts
TC/RCs, penalties, premiums and
discounts
Average copper realized price
US$/t, 1Q17
29

30
Unit cost of sales per operation, net of by-
product credits1
Operation (US$ / t) 1Q17 4Q164 1Q164
North Atlantic Operations2 (nickel) 6,699 5,125 4,008
PTVI2 (nickel) 6,821 5,770 6,636
VNC3 (nickel) 11,232 11,375 13,691
Onça Puma (nickel) 9,341 9,204 8,064
Sossego (copper) 2,941 3,207 2,692
Salobo (copper) 1,406 589 923
1 North Atlantic figures includes Clydach and Acton refining costs.2 Prior periods restated to include royalties, freight and other period costs.3 Unit cash cost restated for periods prior to 1Q17 to exclude pre-operating and other operating expenses.4 We realigned our unit cash cost of sales methodology in 1Q17 to include all freight, royalty and other costs reported as cost of goods sold and to exclude other
operating expenses and pre-operating expenses for certain operations. Considering the previous criteria, the unit cash cost figures in prior periods would be: North
Atlantic, US$ 3,412/t and US$ 3,218/t in 4Q16 and 1Q16, respectively; PTVI, US$ 5,695/t and US$ 5,806/t in 4Q16 and 1Q16, respectively; VNC, US$ 11,017/t
and US$ 12,711/t in 4Q16 and 1Q16, respectively.
30

31
Price realization – metallurgical coal from
Mozambique
168.2 165.2 165.2
8.1 0.9 9.1
4.2 0.6
7.9
Averagereference price
1Q17
Quality Current Lagged price index
Lagged pricequarterly
benchmark
Freightdifferential
Others Valeprice
US$/t, 1Q17
31
Impact of pricing system adjustments

32
Price realization – thermal coal from
Mozambique
82.4
68.2
14.0
1.0 0.9 0.1 2.0
Averagereference price
1Q17
Quality Current Lagged price index
Freight margin Others Vale price
US$/t, 1Q17
32
Impact of pricing system
adjustments

33
73%
21%
5%
USD Hedge to USD BRL Others
73%
23%
3%
USD BRL EUR Others
Debt position breakdown by currency
Debt position breakdown by currency
(before hedge)
Debt position breakdown by currency
(after hedge)
33
34