Embed Size (px)
Citation preview
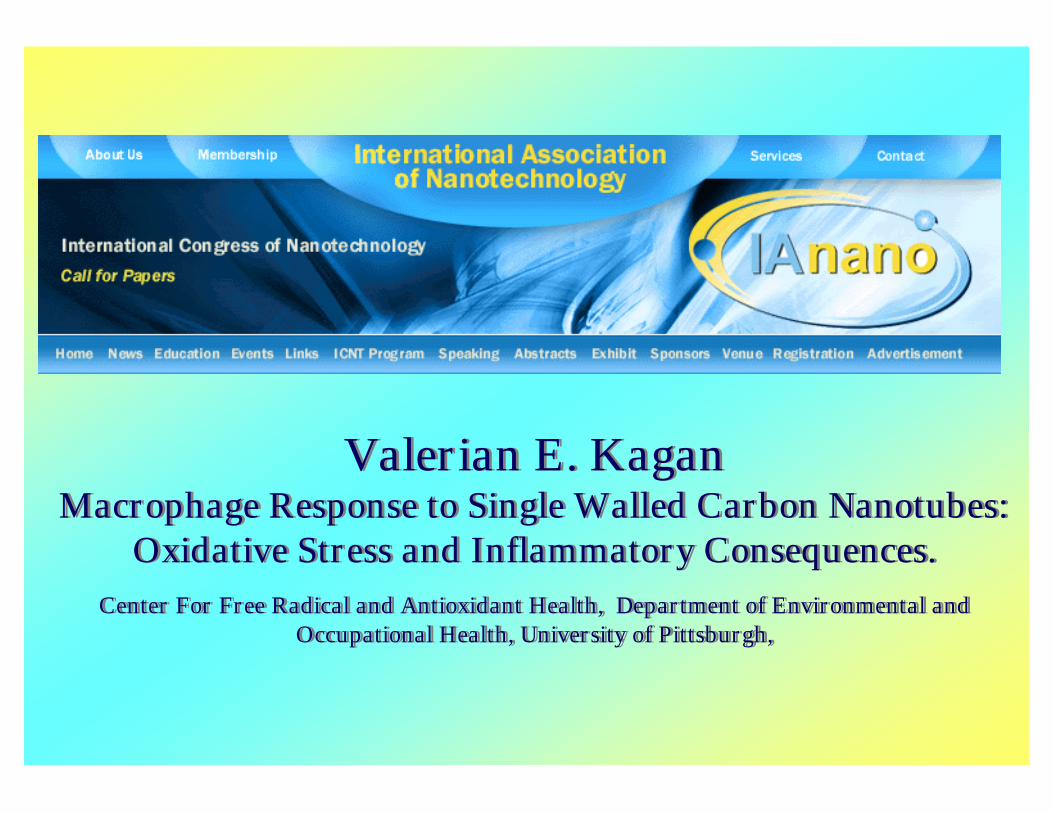
Valerian E. KaganMacrophage Response to Single Walled Carbon Nanotubes:
Oxidative Stress and Inflammatory Consequences.Center For Free Radical and Antioxidant Health, Department of Environmental and
Occupational Health, University of Pittsburgh,
Valerian E. KaganMacrophage Response to Single Walled Carbon Nanotubes:
Oxidative Stress and Inflammatory Consequences.Center For Free Radical and Antioxidant Health, Department of Environmental and
Occupational Health, University of Pittsburgh,
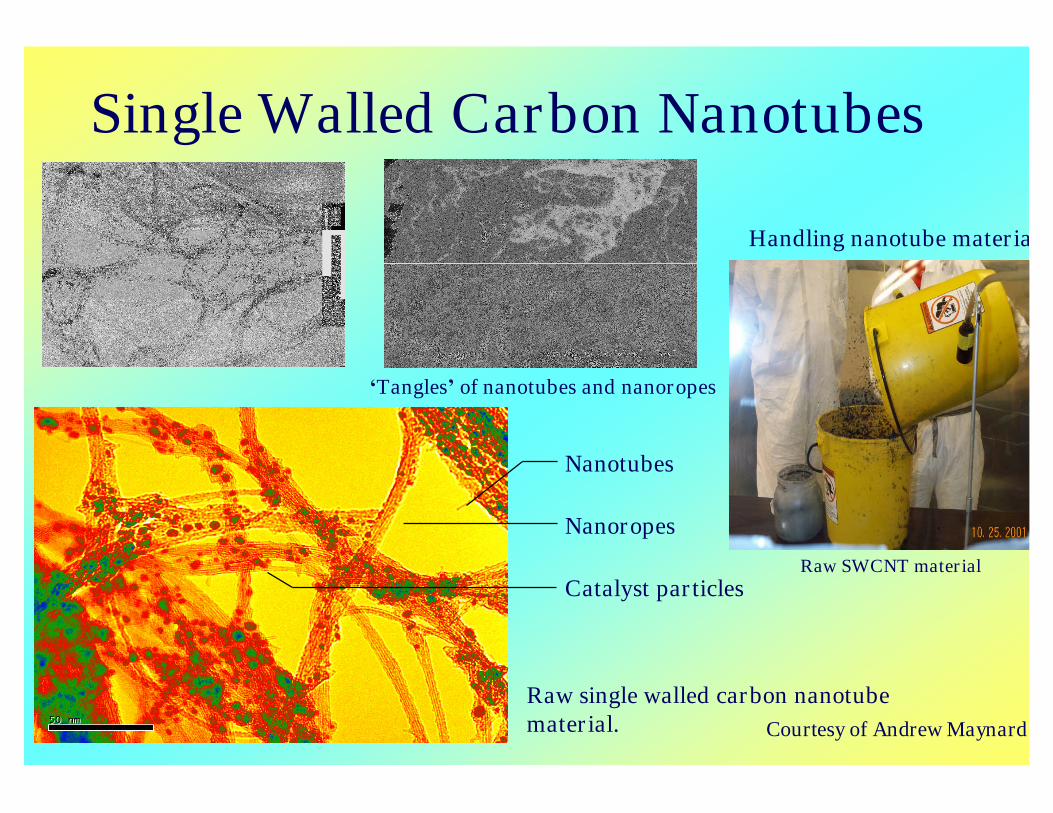
Raw single walled carbon nanotubematerial.
Nanotubes
Nanoropes
Catalyst particles
Single Walled Carbon Nanotubes
Courtesy of Andrew Maynard
‘Tangles’of nanotubes and nanoropes
Handling nanotube material
Raw SWCNT material
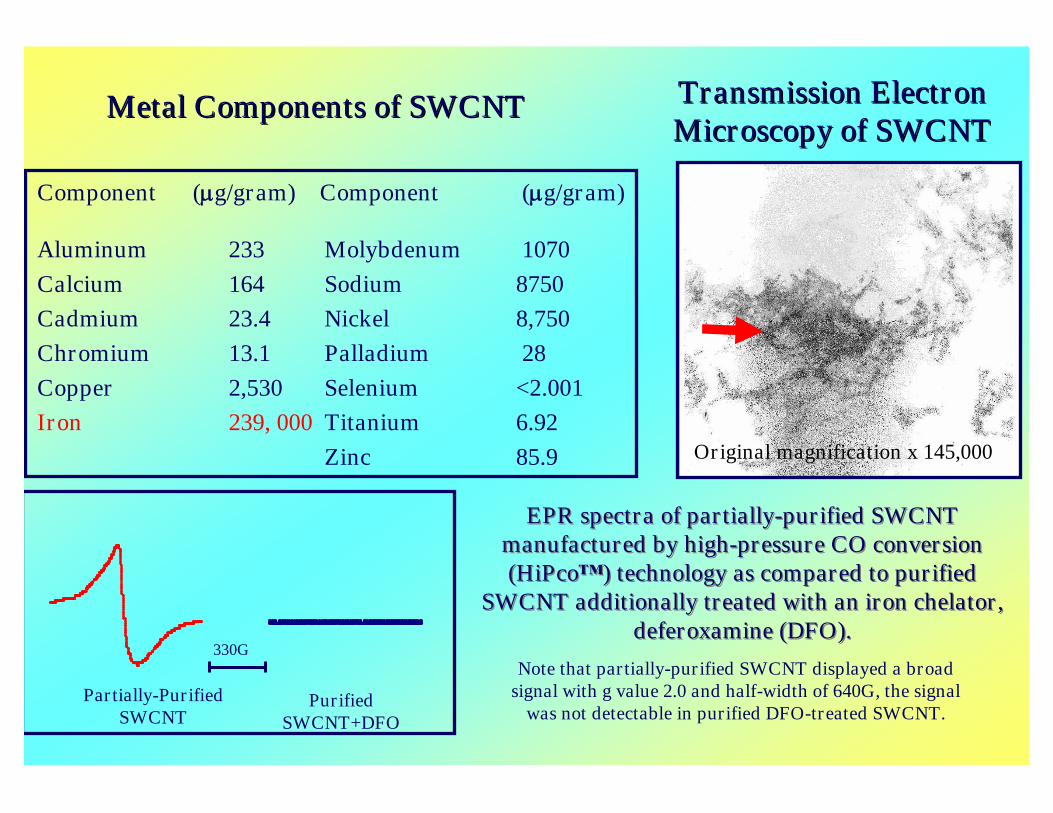
Metal Components of SWCNTMetal Components of SWCNT
Component (g/gram) Component (g/gram)
Aluminum 233 Molybdenum 1070Calcium 164 Sodium 8750Cadmium 23.4 Nickel 8,750Chromium 13.1 Palladium 28Copper 2,530 Selenium <2.001Iron 239, 000 Titanium 6.92
Zinc 85.9 Original magnification x 145,000
Transmission ElectronTransmission ElectronMicroscopy of SWCNTMicroscopy of SWCNT
EPR spectra of partially-purified SWCNTmanufactured by high-pressure CO conversion(HiPco™) technology as compared to purified
SWCNT additionally treated with an iron chelator,deferoxamine (DFO).
EPR spectra of partially-purified SWCNTmanufactured by high-pressure CO conversion(HiPco™) technology as compared to purified
SWCNT additionally treated with an iron chelator,deferoxamine (DFO).
330GNote that partially-purified SWCNT displayed a broad
signal with g value 2.0 and half-width of 640G, the signalwas not detectable in purified DFO-treated SWCNT.
Partially-PurifiedSWCNT
PurifiedSWCNT+DFO
Raw Samples ofCarbon
NanotubesContain
Redox-ActiveIron
Raw Samples ofCarbon
NanotubesContain
Redox-ActiveIron
O2Fe2+
Fe3+
O2
ProteinsLipids
DNA
NoEnzymatic
ControlHO (RO)
Fe2+
Fe3+
H2O2
++ Fe3+
Fe2+
SOD
CatalasePeroxidase
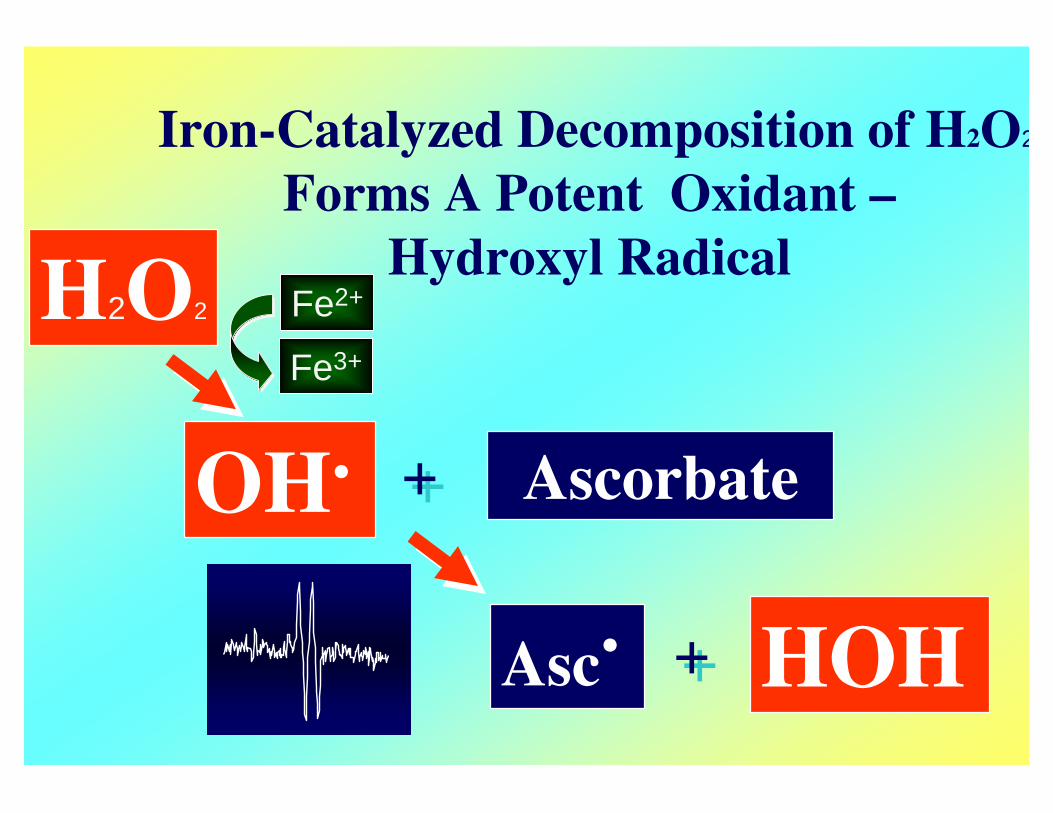
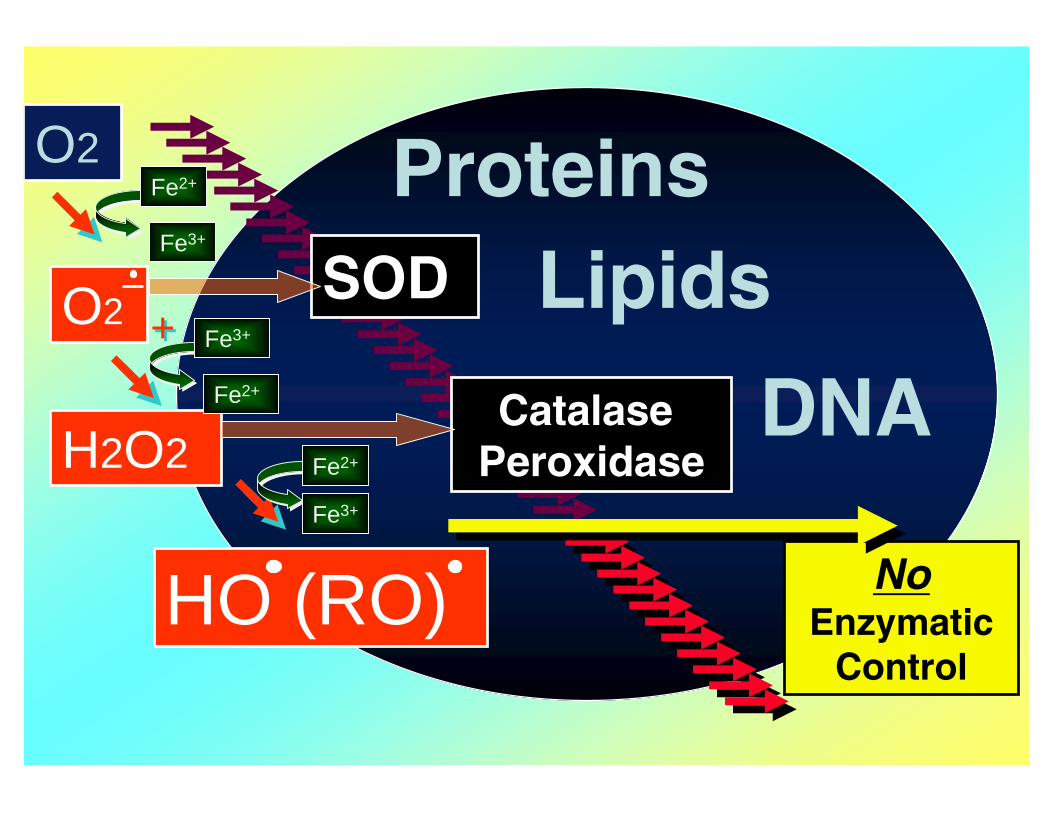
Iron-Catalyzed Decomposition of H2O2
Forms A Potent Oxidant –Hydroxyl Radical
OH.
H2O2 Fe2+
Fe3+
++ Ascorbate
Asc. ++ HOH
RAW264.7 macrophages
10 G
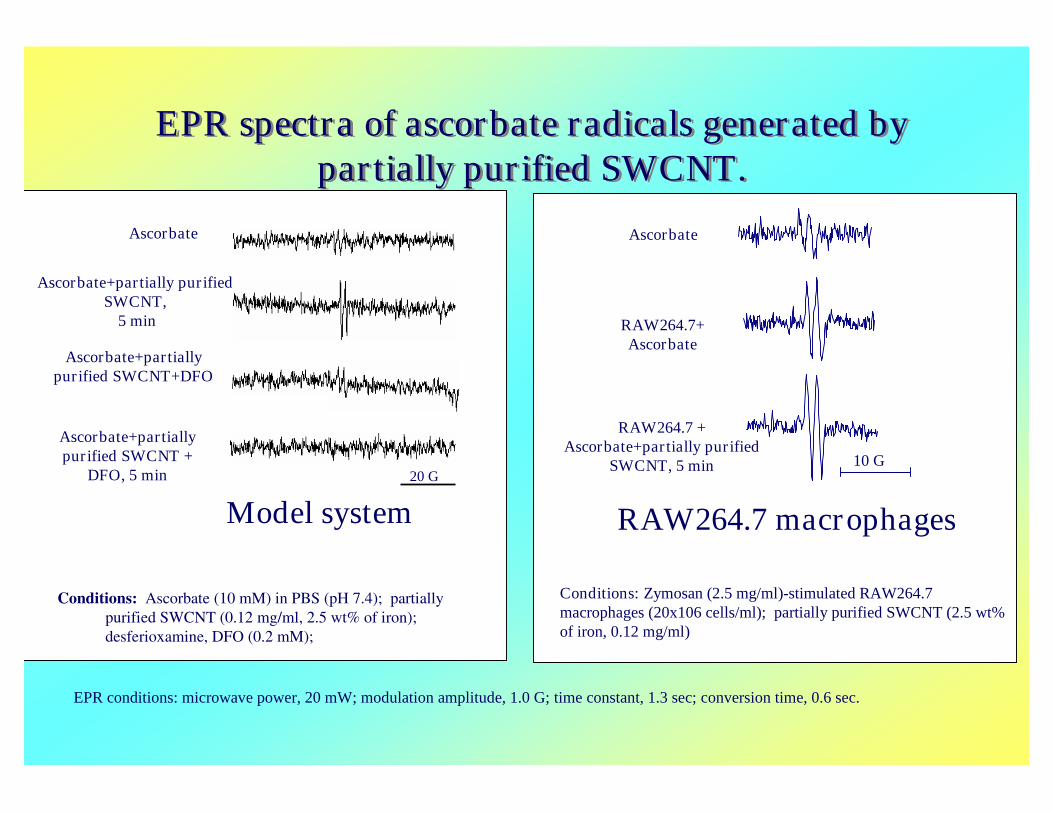
Ascorbate
RAW264.7 +Ascorbate+partially purified
SWCNT, 5 min
RAW264.7+Ascorbate
Conditions: Zymosan (2.5 mg/ml)-stimulated RAW264.7macrophages (20x106 cells/ml); partially purified SWCNT (2.5 wt%of iron, 0.12 mg/ml)
20 G
EPR spectra of ascorbate radicals generated bypartially purified SWCNT.
EPR spectra of ascorbate radicals generated bypartially purified SWCNT.
Model system
Ascorbate
Ascorbate+partially purifiedSWCNT,
5 min
Ascorbate+partiallypurified SWCNT +
DFO, 5 min
Ascorbate+partiallypurified SWCNT+DFO
Conditions: Ascorbate (10 mM) in PBS (pH 7.4); partiallypurified SWCNT (0.12 mg/ml, 2.5 wt% of iron);desferioxamine, DFO (0.2 mM);
EPR conditions: microwave power, 20 mW; modulation amplitude, 1.0 G; time constant, 1.3 sec; conversion time, 0.6 sec.
CarbonNanotubes
DirectlyDamage
Broncho-EpithelialCells
CarbonNanotubes
DirectlyDamage
Broncho-EpithelialCells
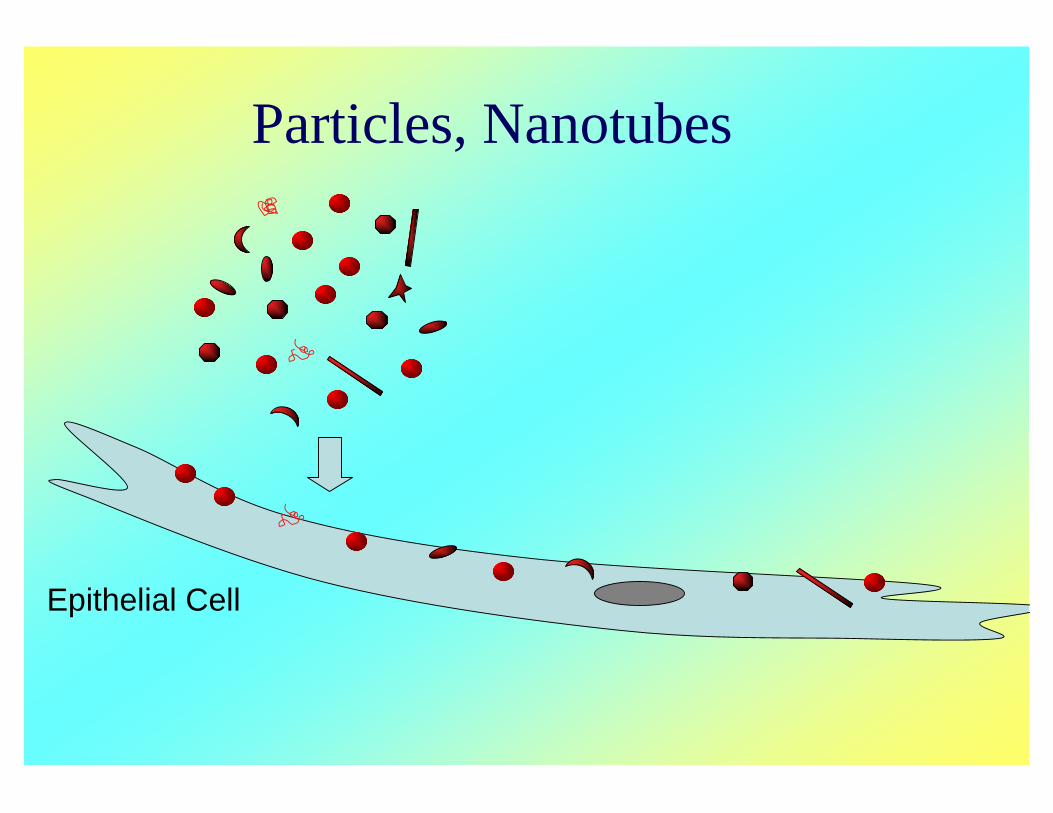
Particles, Nanotubes
Epithelial Cell
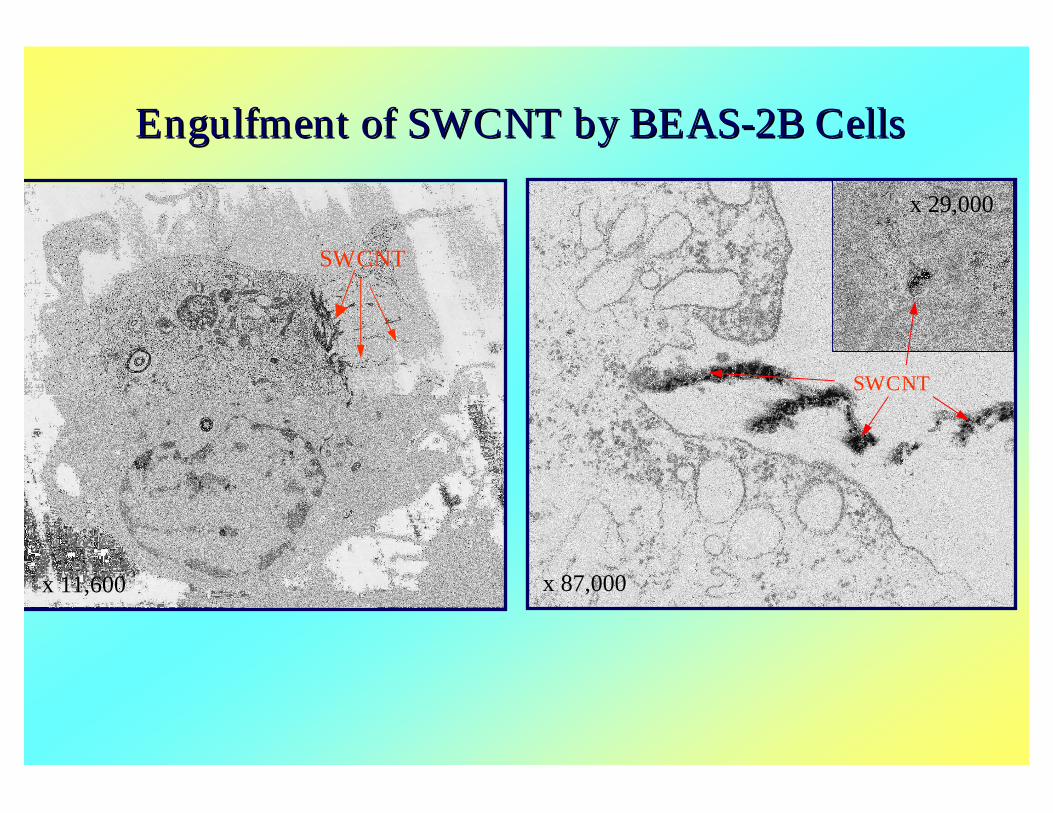
SWCNT
SWCNT
Engulfment of SWCNT by BEASEngulfment of SWCNT by BEAS--2B Cells2B Cells
x 11,600 x 87,000
x 29,000
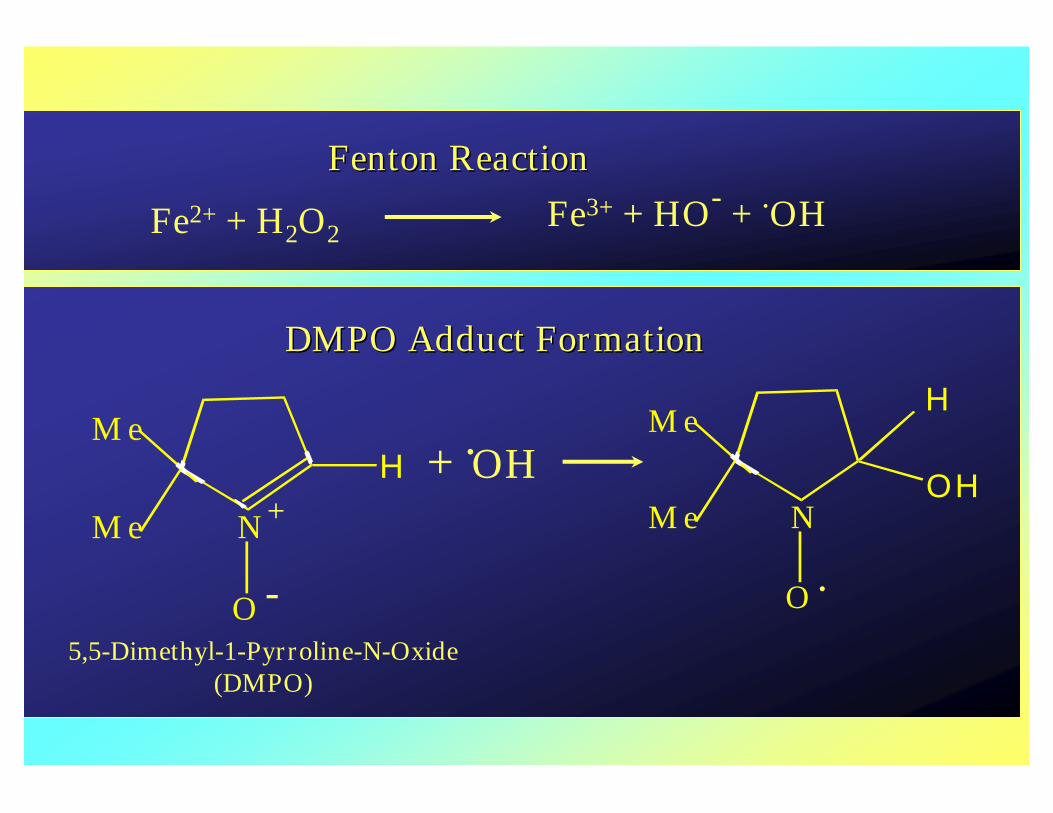
5,5-Dimethyl-1-Pyrroline-N-Oxide(DMPO)
Fe2+ + H2O2Fe3+ + HO- + .OH
N
HM e
M e
O
+ OH.
-
+
.N
OH
M e
M e
O
H
Fenton ReactionFenton Reaction
DMPO Adduct FormationDMPO Adduct Formation
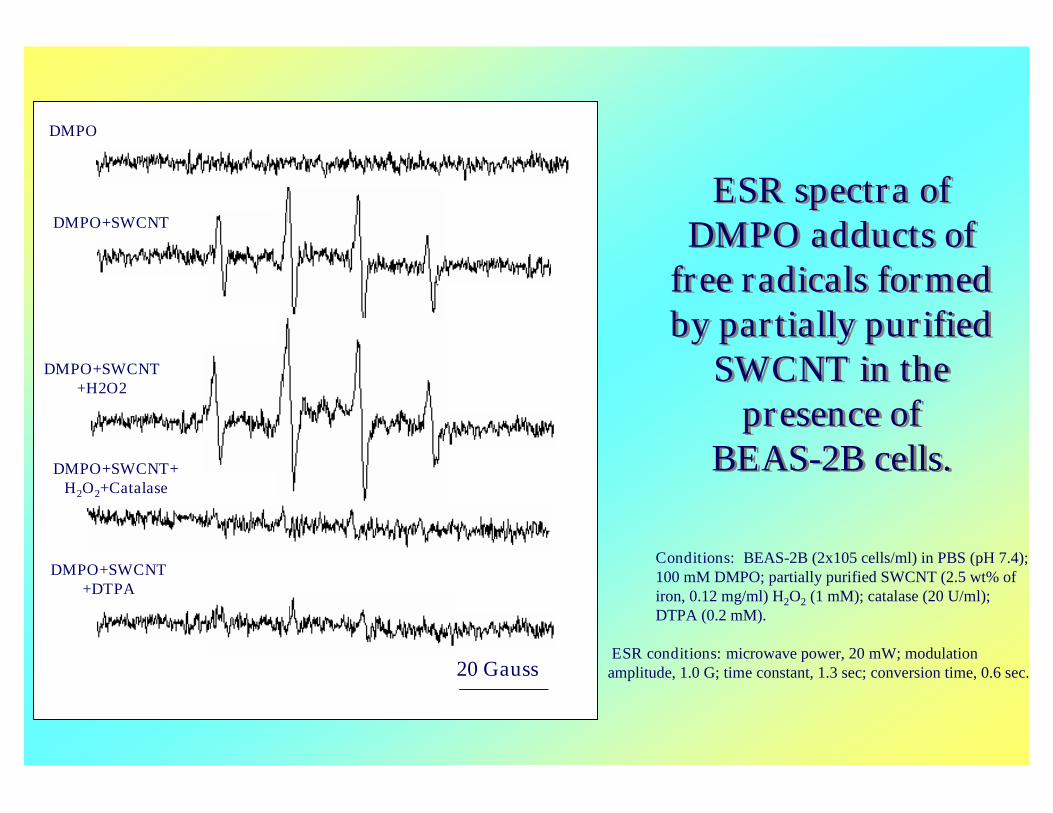
ESR spectra ofDMPO adducts of
free radicals formedby partially purified
SWCNT in thepresence of
BEAS-2B cells.
ESR spectra ofDMPO adducts of
free radicals formedby partially purified
SWCNT in thepresence of
BEAS-2B cells.
20 Gauss
DMPO
DMPO+SWCNT
DMPO+SWCNT+H2O2
DMPO+SWCNT+H2O2+Catalase
DMPO+SWCNT+DTPA
Conditions: BEAS-2B (2x10⁵ cells/ml) in PBS (pH 7.4);100 mM DMPO; partially purified SWCNT (2.5 wt% ofiron, 0.12 mg/ml) H2O2 (1 mM); catalase (20 U/ml);DTPA (0.2 mM).
ESR conditions: microwave power, 20 mW; modulationamplitude, 1.0 G; time constant, 1.3 sec; conversion time, 0.6 sec.
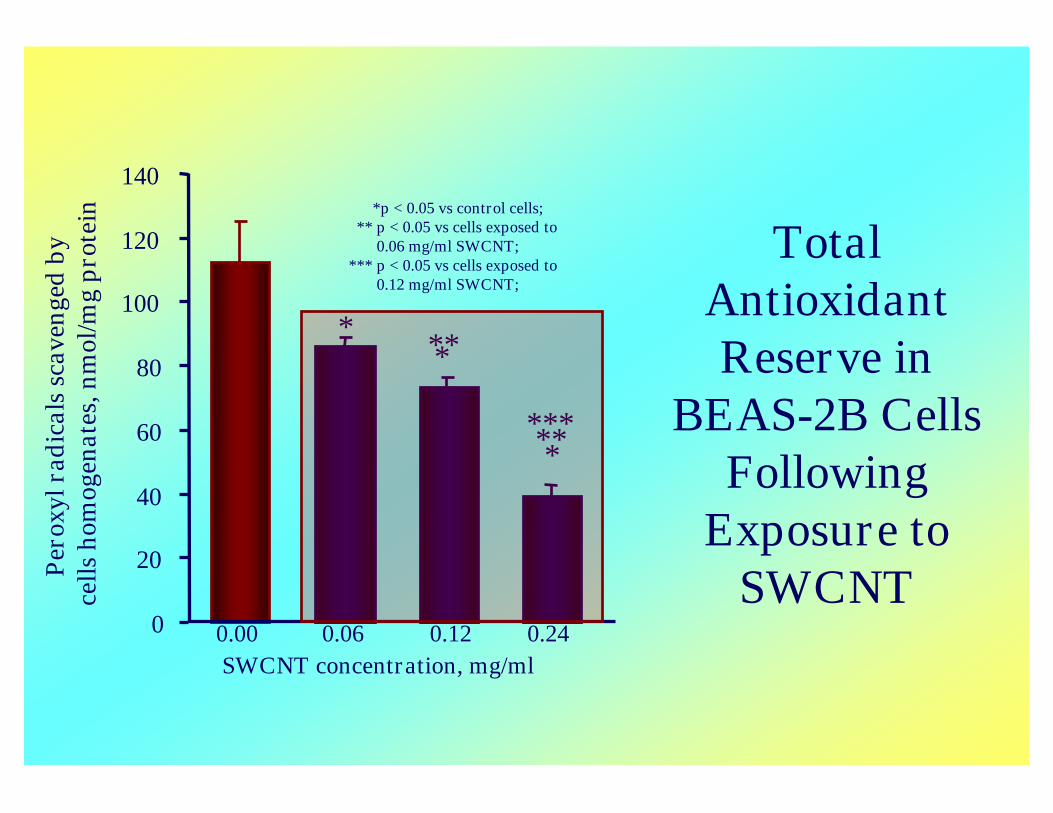
TotalAntioxidantReserve in
BEAS-2B CellsFollowing
Exposure toSWCNT
0.06 0.12 0.24
*
*p < 0.05 vs control cells;** p < 0.05 vs cells exposed to
0.06 mg/ml SWCNT;*** p < 0.05 vs cells exposed to
0.12 mg/ml SWCNT;
***
******
0.00SWCNT concentration, mg/ml
Per
oxyl
radi
cals
scav
enge
dby
cells
hom
ogen
ates
,nm
ol/m
gpr
otei
n
0
20
40
60
80
100
120
140
0.06 0.12 0.24
*
***
******
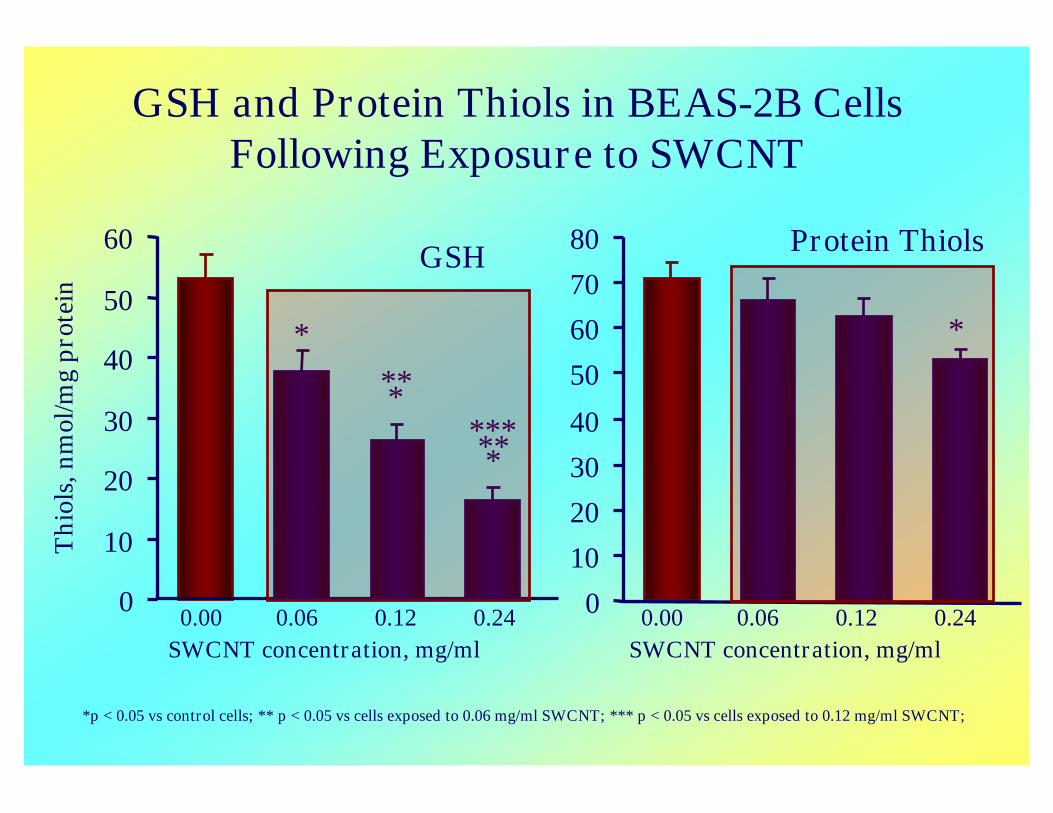
GSH and Protein Thiols in BEAS-2B CellsFollowing Exposure to SWCNT
GSH
*p < 0.05 vs control cells; ** p < 0.05 vs cells exposed to 0.06 mg/ml SWCNT; *** p < 0.05 vs cells exposed to 0.12 mg/ml SWCNT;
0.00SWCNT concentration, mg/ml
Thi
ols,
nmol
/mg
prot
ein
0
10
20
30
40
50
60
0.06 0.12 0.24
*
Protein Thiols
0
10
20
30
40
50
60
70
80
0.00SWCNT concentration, mg/ml
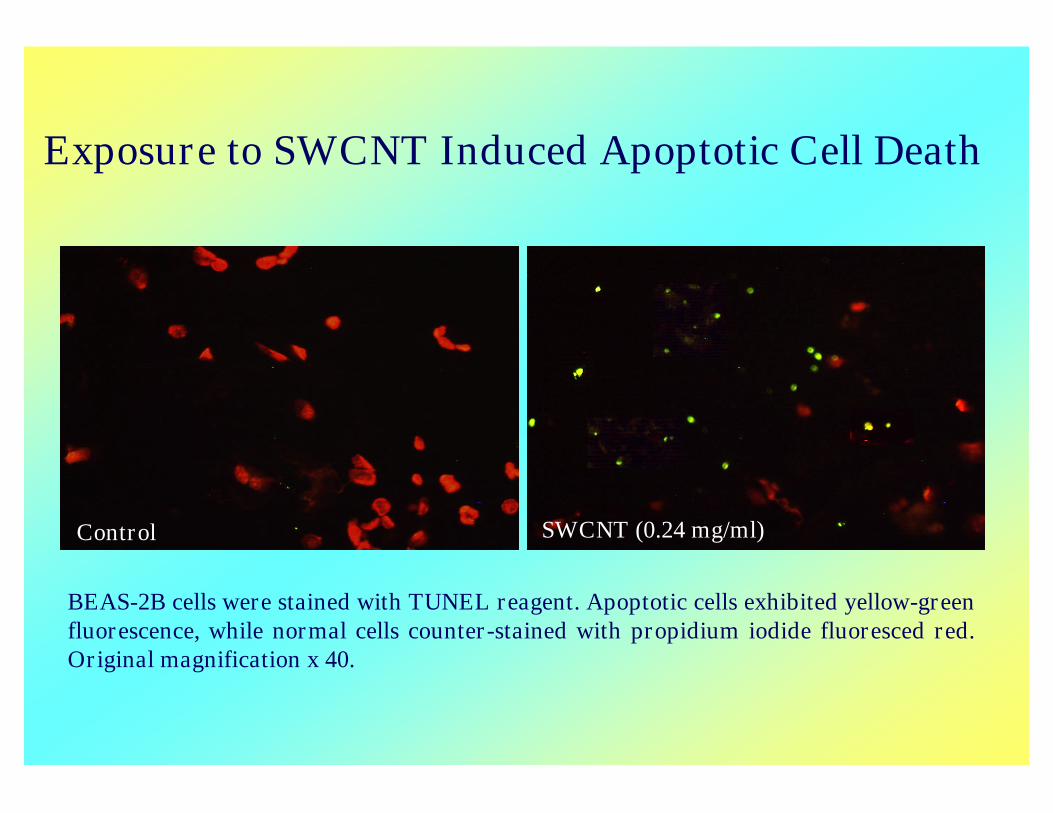
Exposure to SWCNT Induced Apoptotic Cell Death
BEAS-2B cells were stained with TUNEL reagent. Apoptotic cells exhibited yellow-greenfluorescence, while normal cells counter-stained with propidium iodide fluoresced red.Original magnification x 40.
SWCNT (0.24 mg/ml)Control
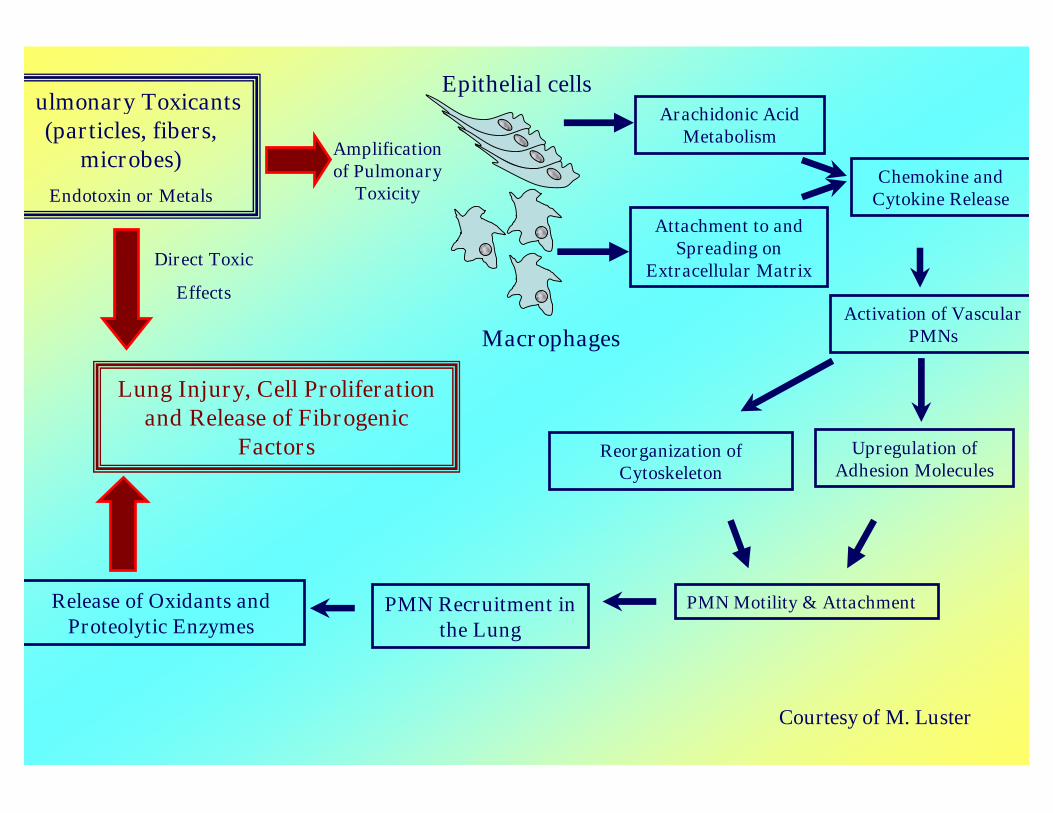
Courtesy of M. Luster
Release of Oxidants andProteolytic Enzymes
PMN Recruitment inthe Lung
Attachment to andSpreading on
Extracellular Matrix
Arachidonic AcidMetabolism
Chemokine andCytokine Release
Activation of VascularPMNs
Upregulation ofAdhesion Molecules
Reorganization ofCytoskeleton
PMN Motility & Attachment
Pulmonary Toxicants(particles, fibers,
microbes)Endotoxin or Metals
Lung Injury, Cell Proliferationand Release of Fibrogenic
Factors
Direct Toxic
Effects
Amplificationof Pulmonary
Toxicity
Macrophages
Epithelial cells
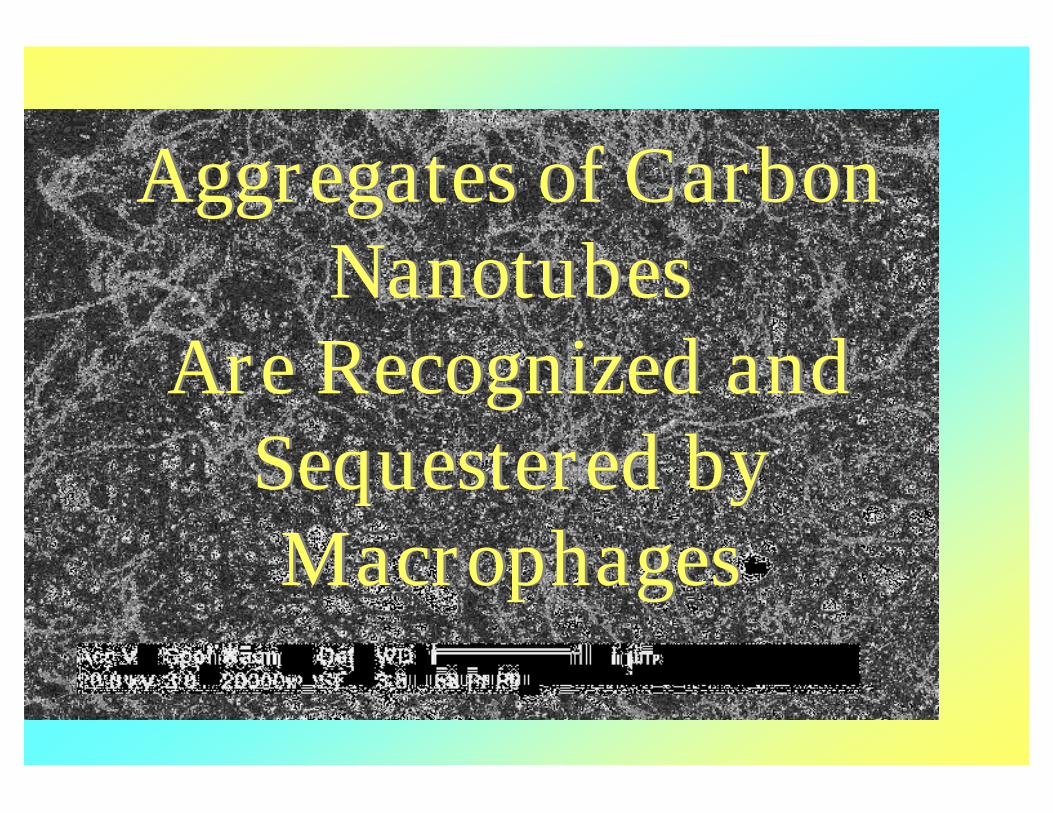
Aggregates of CarbonNanotubes
Are Recognized andSequestered byMacrophages
Aggregates of CarbonNanotubes
Are Recognized andSequestered byMacrophages
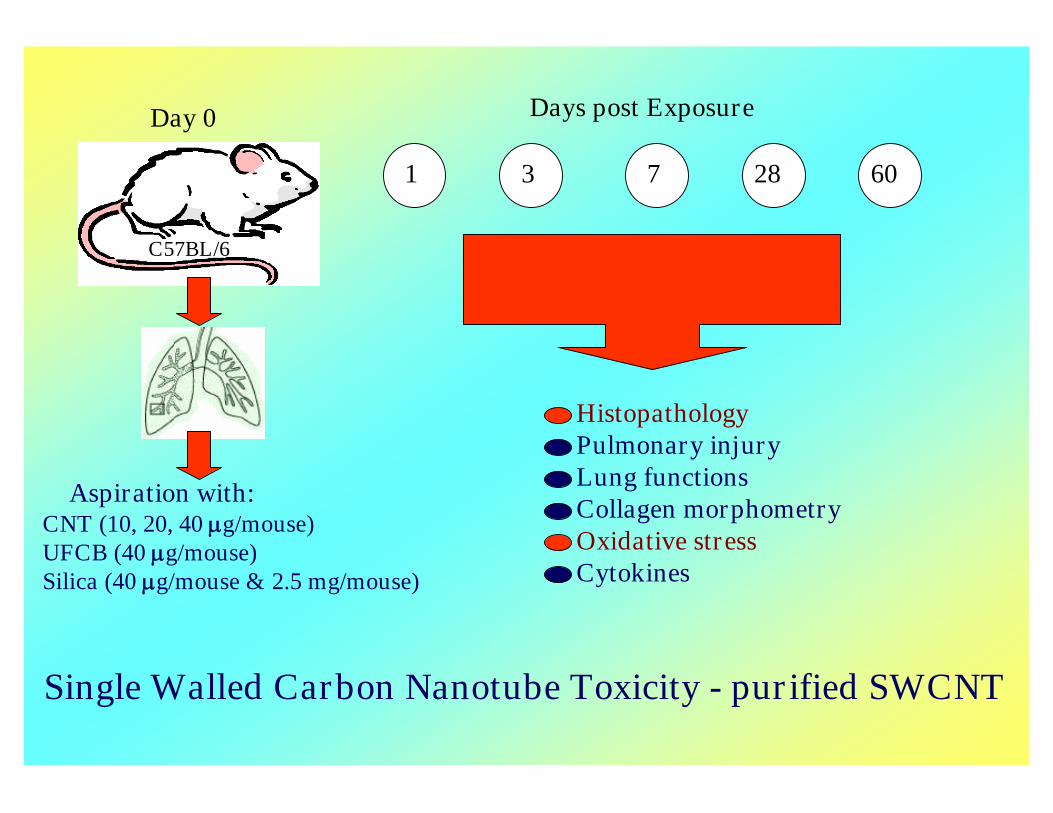
Day 0
Aspiration with:CNT (10, 20, 40 g/mouse)UFCB (40 g/mouse)Silica (40 g/mouse & 2.5 mg/mouse)
1
Days post Exposure
HistopathologyPulmonary injuryLung functionsCollagen morphometryOxidative stressCytokines
3 7 28 60
C57BL/6
Single Walled Carbon Nanotube Toxicity - purified SWCNT
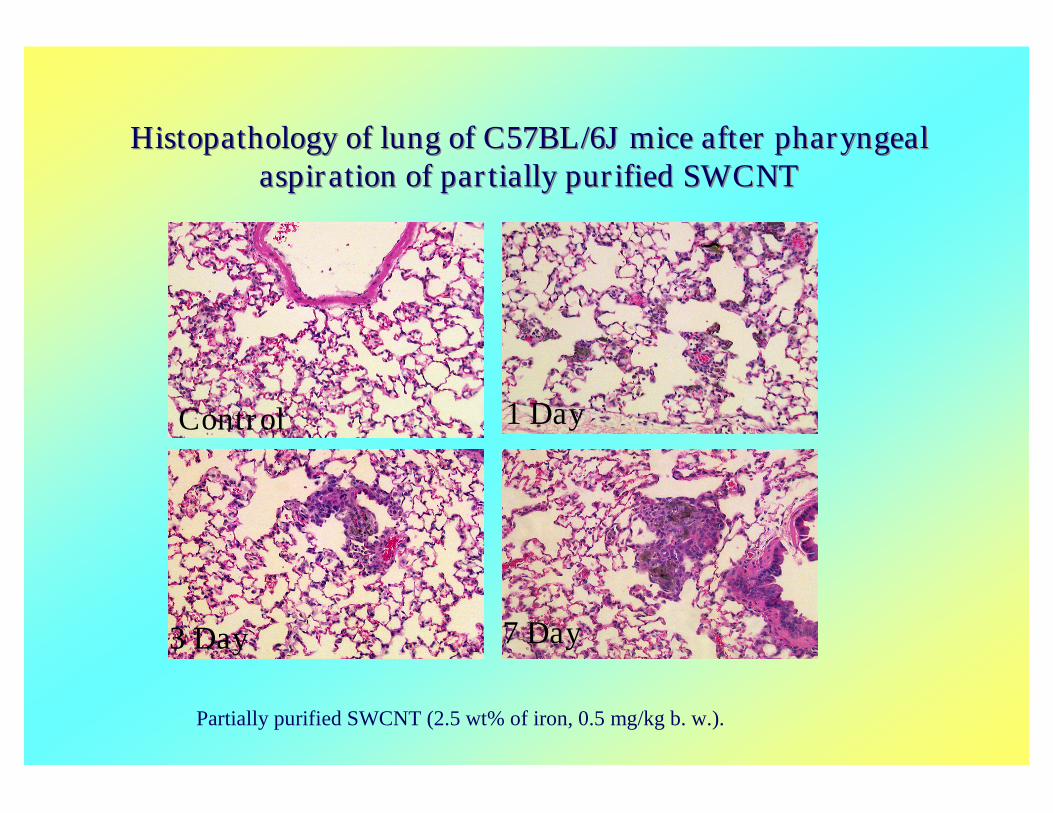
3 Day
1 Day
Histopathology of lung of C57BL/6J mice after pharyngealaspiration of partially purified SWCNT
Histopathology of lung of C57BL/6J mice after pharyngealaspiration of partially purified SWCNT
7 Day
Control
Partially purified SWCNT (2.5 wt% of iron, 0.5 mg/kg b. w.).
1 3 7
Days after exposure
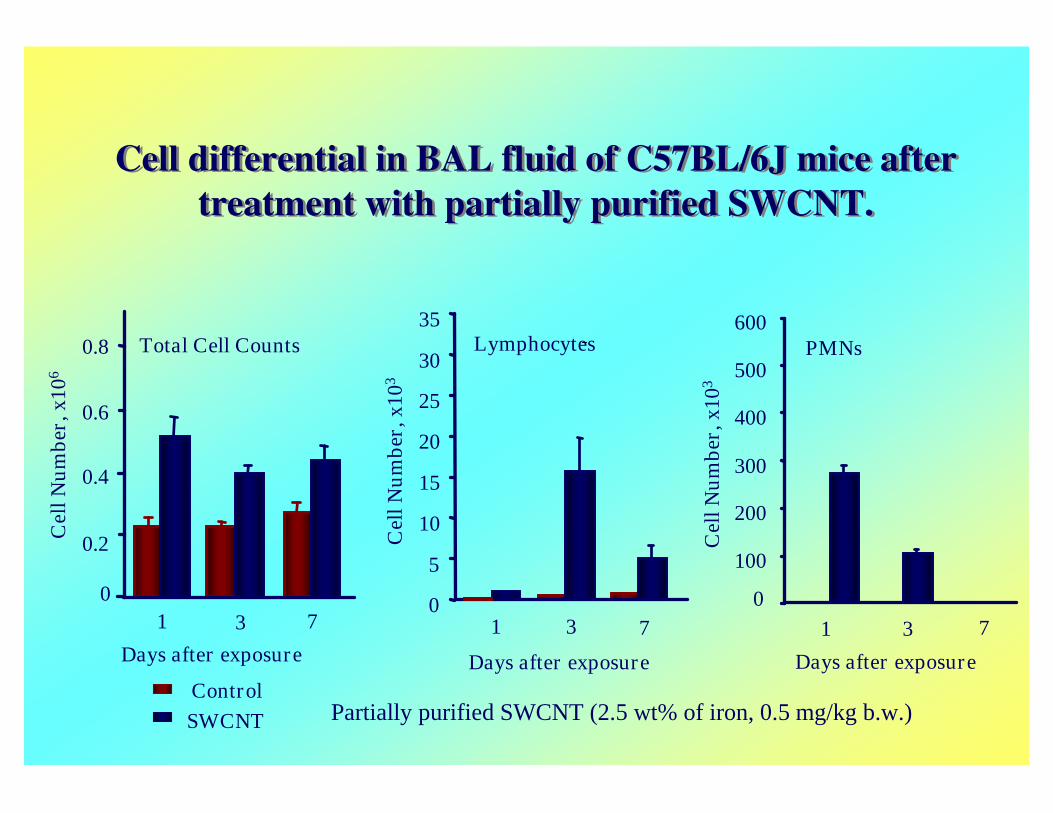
PMNs
0
100
200
300
400
500
600
Cel
lNum
ber,
x103
Days after exposure
1 3 7
Lymphocytes
0
5
10
15
20
25
30
35
Cel
lNum
ber,
x103
Cell differential in BAL fluid of C57BL/6J mice aftertreatment with partially purified SWCNT.
Cell differential in BAL fluid of C57BL/6J mice aftertreatment with partially purified SWCNT.
Cel
lNum
ber,
x106
Total Cell Counts
0
0.2
0.4
0.6
0.8
1 3 7
Days after exposure
ControlSWCNT Partially purified SWCNT (2.5 wt% of iron, 0.5 mg/kg b.w.)
0
100
200
300
400
500
600
700
1 3 7 28 60
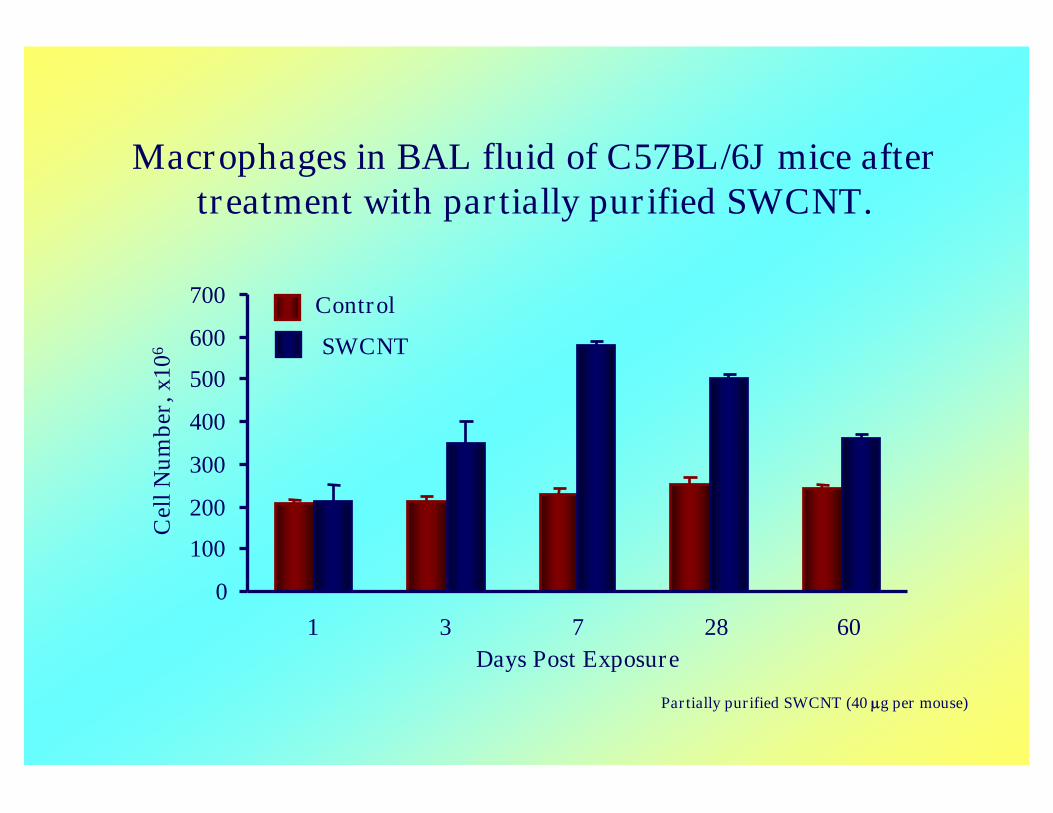
Macrophages in BAL fluid of C57BL/6J mice aftertreatment with partially purified SWCNT.
Partially purified SWCNT (40 g per mouse)
Days Post Exposure
SWCNT
Control
Cel
lNum
ber,
x106
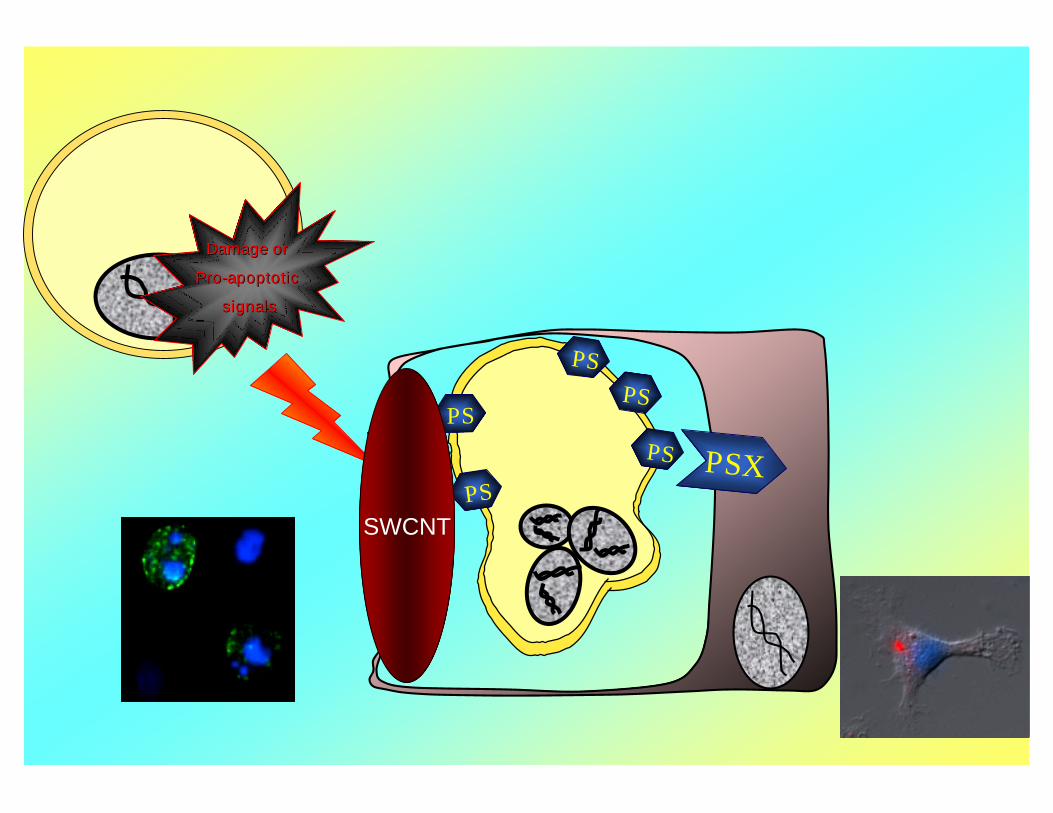
Damage orDamage or
ProPro--apoptoticapoptotic
signalssignals
PS
PS
PS
PS
PS PSX
SWCNT
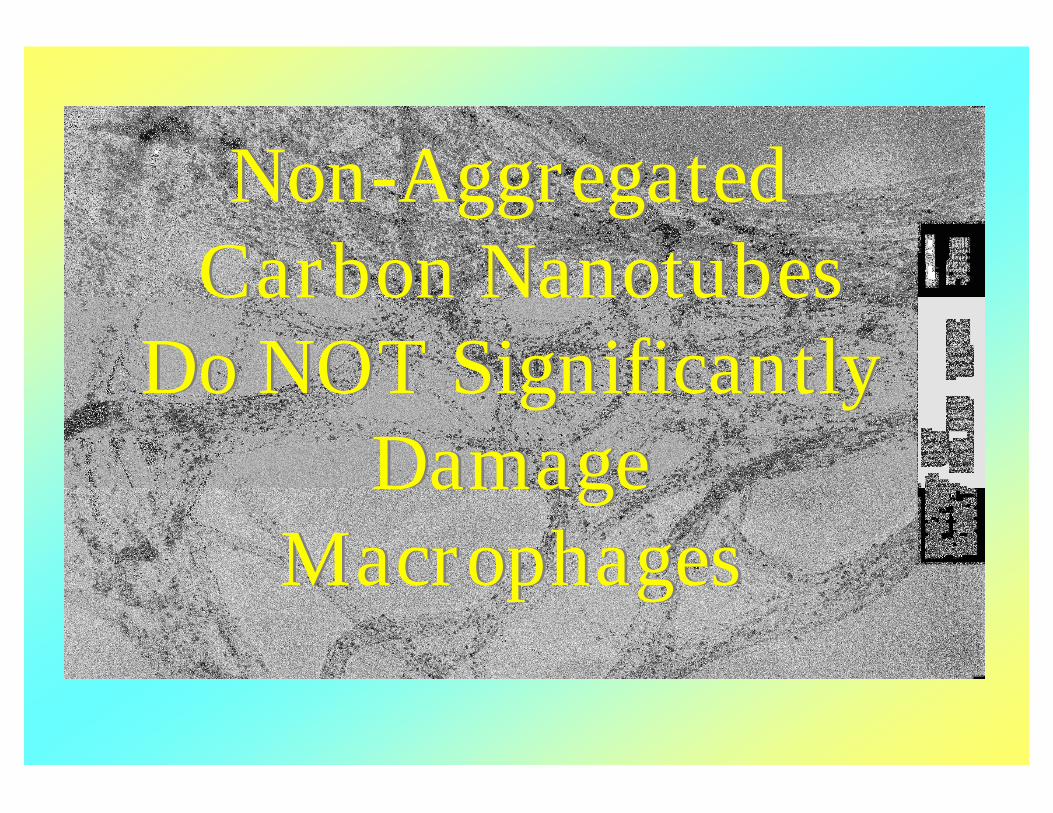
Non-AggregatedCarbon Nanotubes
Do NOT SignificantlyDamage
Macrophages
Non-AggregatedCarbon Nanotubes
Do NOT SignificantlyDamage
Macrophages

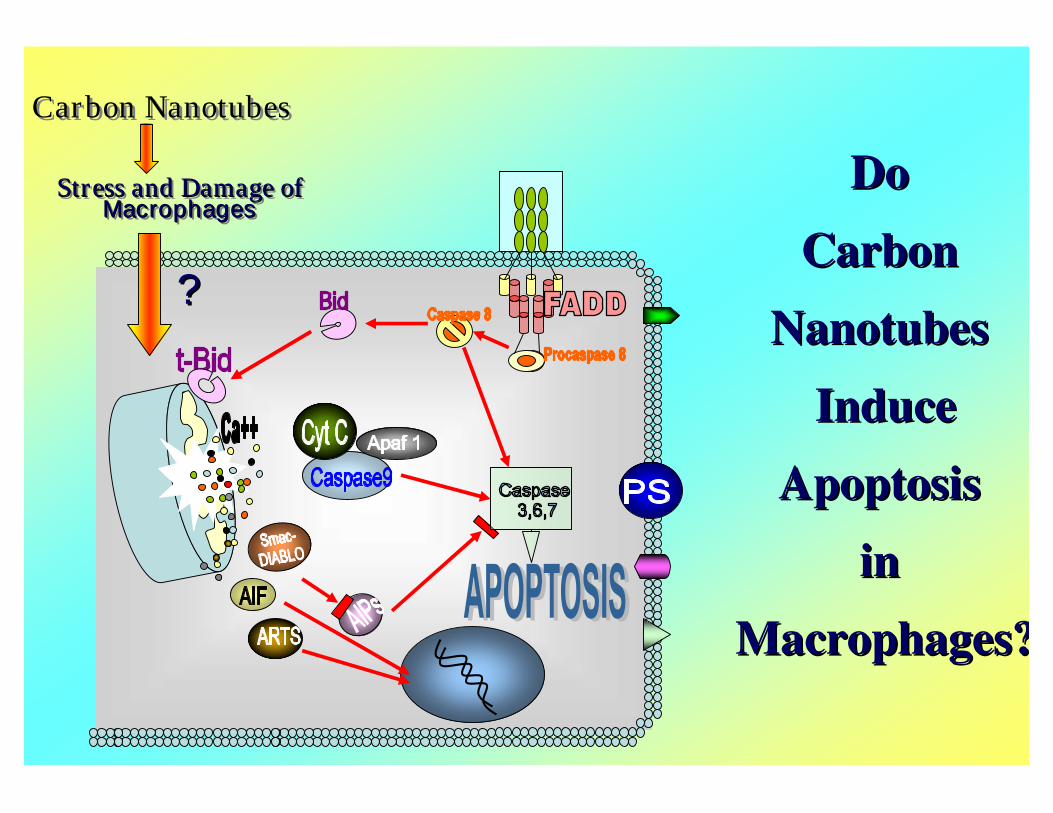
DoDo
CarbonCarbon
NanotubesNanotubes
InduceInduce
ApoptosisApoptosis
inin
Macrophages?Macrophages?
Carbon NanotubesCarbon Nanotubes
Stress and Damage ofMacrophages
Stress and Damage ofStress and Damage ofMacrophagesMacrophages
??
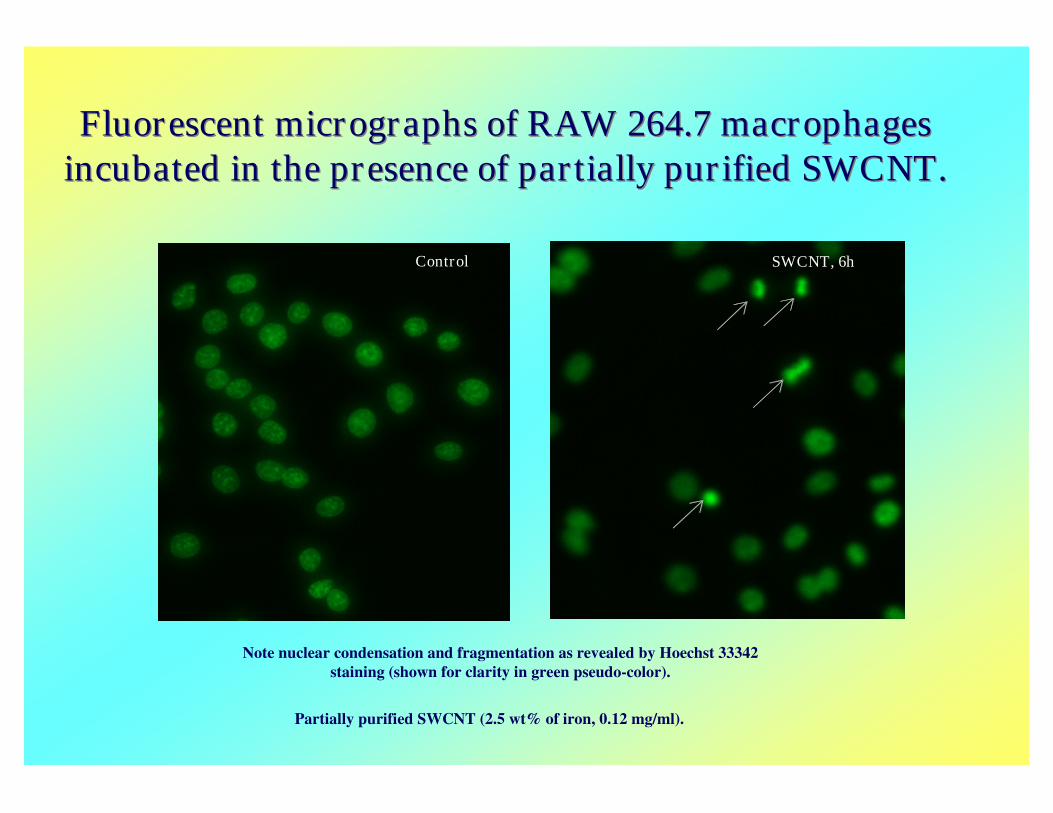
SWCNT, 6h
AAControl
Note nuclear condensation and fragmentation as revealed by Hoechst 33342staining (shown for clarity in green pseudo-color).
Fluorescent micrographs of RAW 264.7 macrophagesincubated in the presence of partially purified SWCNT.Fluorescent micrographs of RAW 264.7 macrophages
incubated in the presence of partially purified SWCNT.
Partially purified SWCNT (2.5 wt% of iron, 0.12 mg/ml).
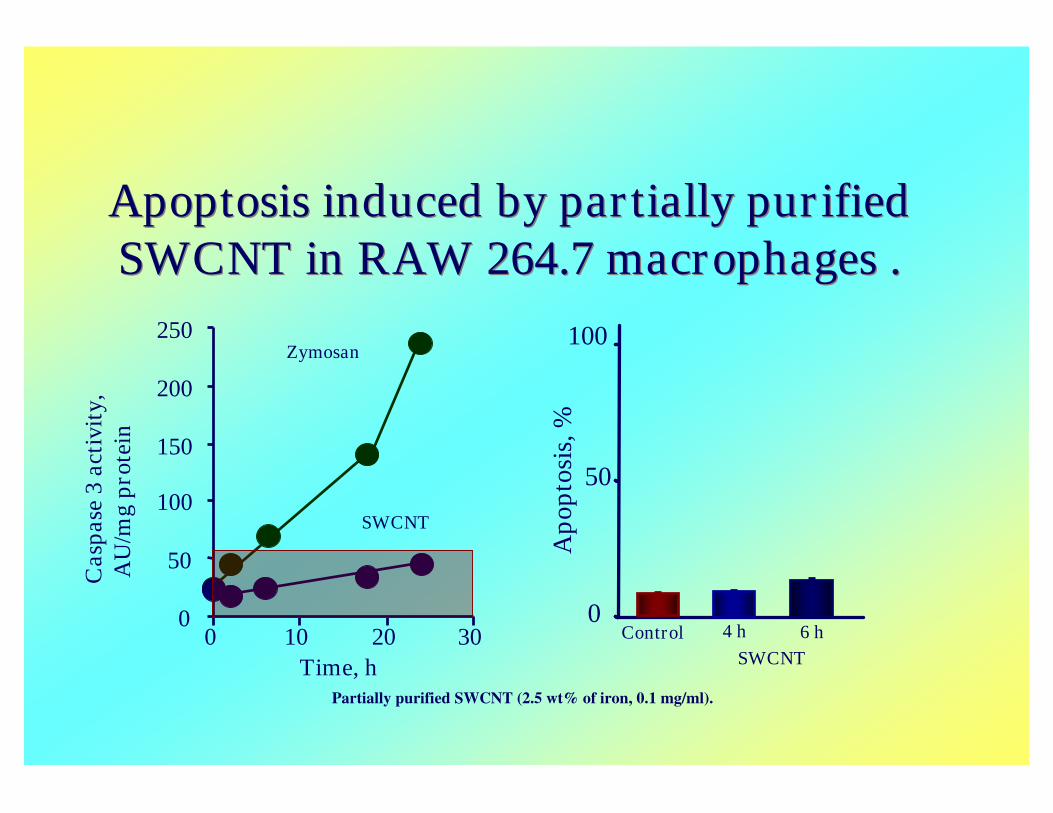
Apoptosis induced by partially purifiedSWCNT in RAW 264.7 macrophages .Apoptosis induced by partially purifiedSWCNT in RAW 264.7 macrophages .
Partially purified SWCNT (2.5 wt% of iron, 0.1 mg/ml).
0
50
100
150
200
250
0 10 20 30Time, h
Cas
pase
3ac
tivi
ty,
AU
/mg
prot
ein
Zymosan
SWCNT
6 hSWCNT
0
50
100
4 hControl
Apo
ptos
is,%
C
SWCNTSWCNT
6 h
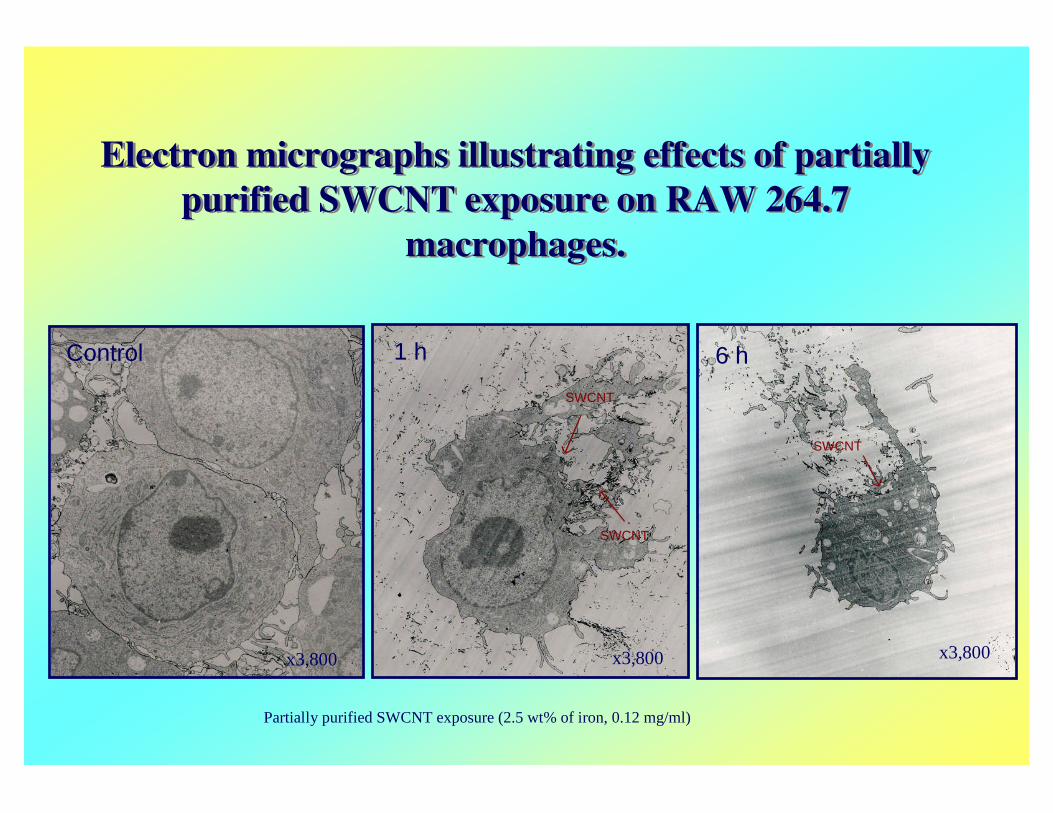
x3,800
BSWCNT
SWCNT
SWCNT
SWCNT
1 h
x3,800
Electron micrographs illustrating effects of partiallypurified SWCNT exposure on RAW 264.7
macrophages.
Electron micrographs illustrating effects of partiallypurified SWCNT exposure on RAW 264.7
macrophages.
AControl
x3,800
Partially purified SWCNT exposure (2.5 wt% of iron, 0.12 mg/ml)
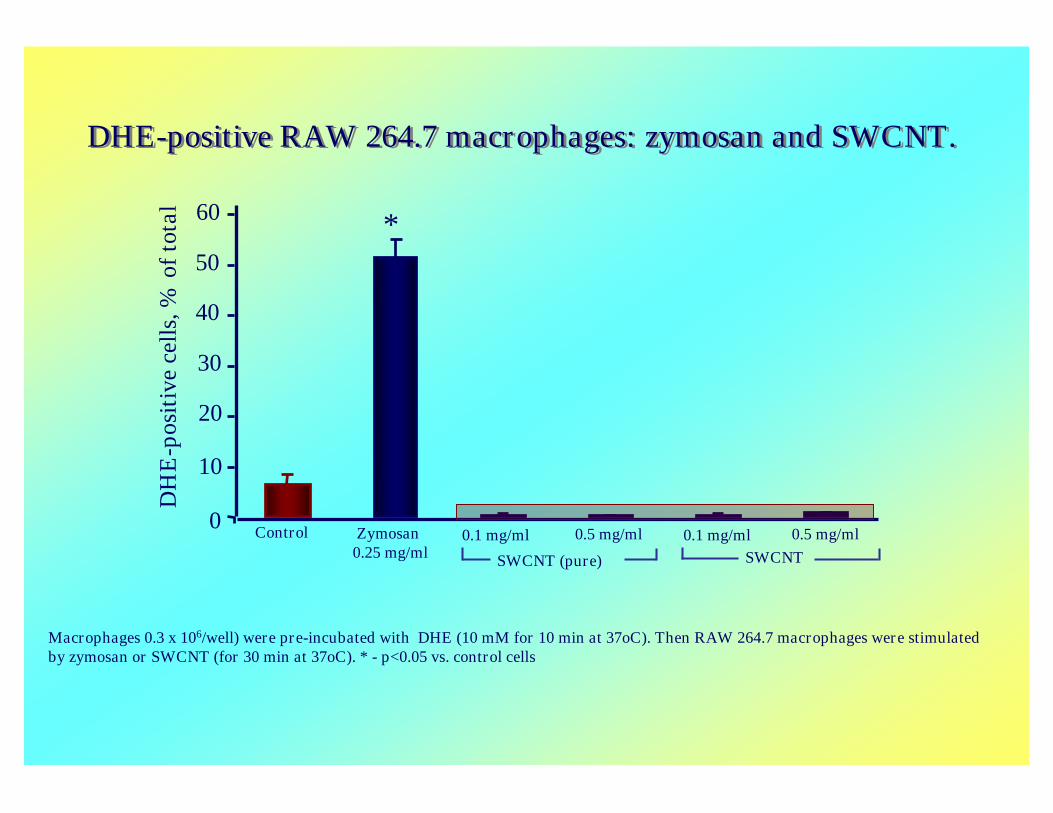
DHE-positive RAW 264.7 macrophages: zymosan and SWCNT.DHE-positive RAW 264.7 macrophages: zymosan and SWCNT.
0
10
20
30
40
50
60
Control Zymosan0.25 mg/ml
0.1 mg/ml
DH
E-p
osit
ive
cells
,%of
tota
l
0.1 mg/ml0.5 mg/ml 0.5 mg/ml
SWCNT (pure) SWCNT
*
Macrophages 0.3 x 10⁶/well) were pre-incubated with DHE (10 mM for 10 min at 37oC). Then RAW 264.7 macrophages were stimulatedby zymosan or SWCNT (for 30 min at 37oC). * - p<0.05 vs. control cells
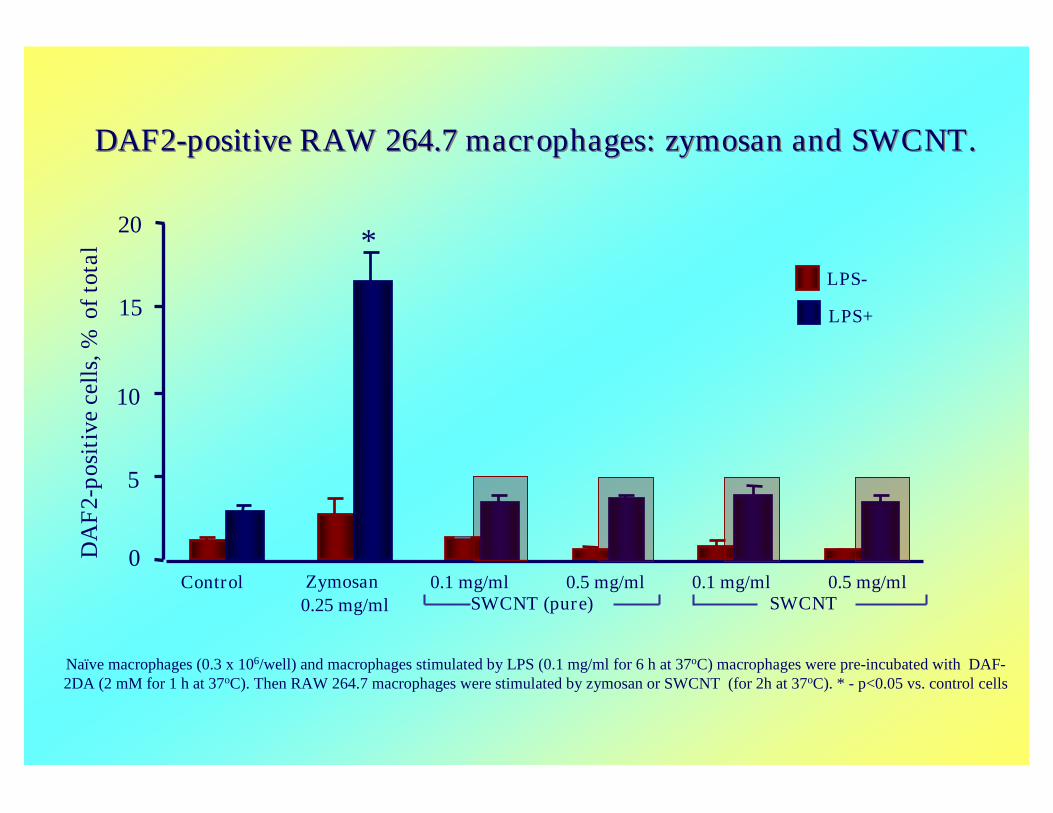
DAF2-positive RAW 264.7 macrophages: zymosan and SWCNT.DAF2-positive RAW 264.7 macrophages: zymosan and SWCNT.
0
5
10
15
20
DA
F2-
posi
tive
cells
,%of
tota
l
LPS-
LPS+
Control Zymosan0.25 mg/ml
0.1 mg/ml 0.1 mg/ml0.5 mg/ml 0.5 mg/mlSWCNT (pure) SWCNT
*
Naïve macrophages (0.3 x 10⁶/well) and macrophages stimulated by LPS (0.1 mg/ml for 6 h at 37oC) macrophages were pre-incubated with DAF-2DA (2 mM for 1 h at 37oC). Then RAW 264.7 macrophages were stimulated by zymosan or SWCNT (for 2h at 37oC). * - p<0.05 vs. control cells
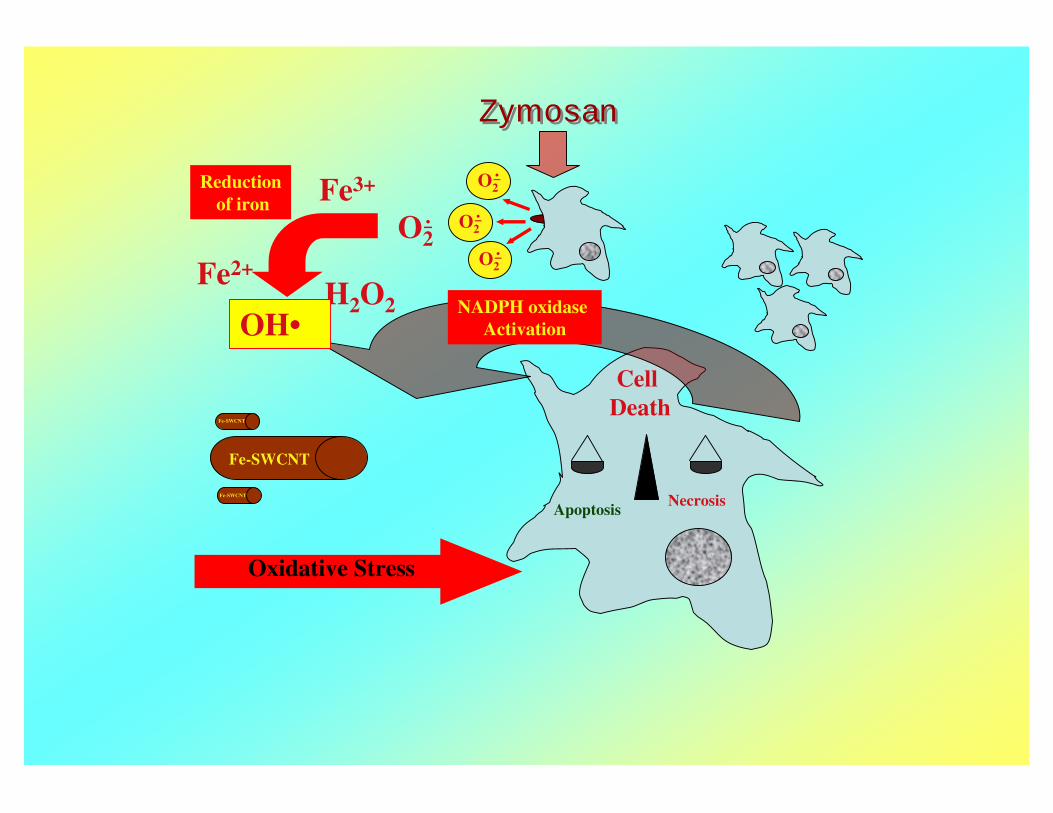
NecrosisApoptosis
CellDeath
H2O2Fe2+
Fe3+
OH•
Reductionof iron
O2.
O2.
O2.
O2.
NADPH oxidaseActivation
Fe-SWCNT
Fe-SWCNT
Oxidative Stress
Fe-SWCNT
ZymosanZymosan
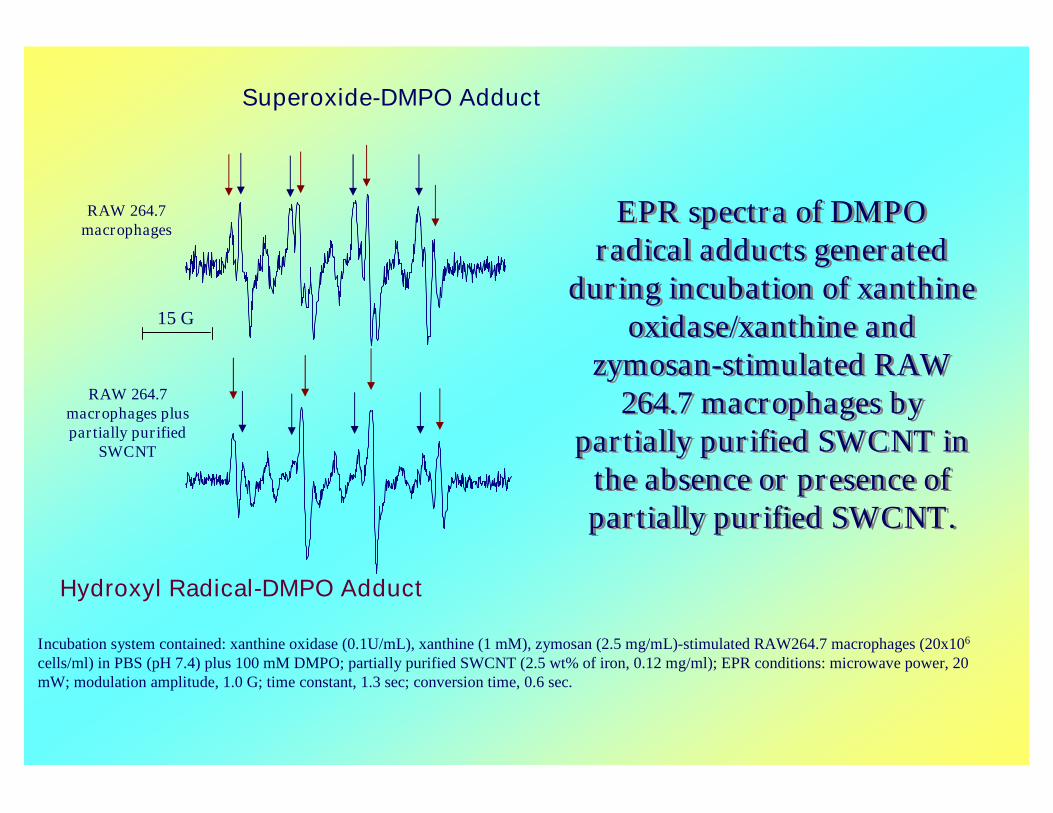
Superoxide-DMPO Adduct
RAW 264.7macrophages pluspartially purified
SWCNT
EPR spectra of DMPOradical adducts generated
during incubation of xanthineoxidase/xanthine and
zymosan-stimulated RAW264.7 macrophages by
partially purified SWCNT inthe absence or presence ofpartially purified SWCNT.
EPR spectra of DMPOradical adducts generated
during incubation of xanthineoxidase/xanthine and
zymosan-stimulated RAW264.7 macrophages by
partially purified SWCNT inthe absence or presence ofpartially purified SWCNT.
15 G
RAW 264.7macrophages
Incubation system contained: xanthine oxidase (0.1U/mL), xanthine (1 mM), zymosan (2.5 mg/mL)-stimulated RAW264.7 macrophages (20x106
cells/ml) in PBS (pH 7.4) plus 100 mM DMPO; partially purified SWCNT (2.5 wt% of iron, 0.12 mg/ml); EPR conditions: microwave power, 20mW; modulation amplitude, 1.0 G; time constant, 1.3 sec; conversion time, 0.6 sec.
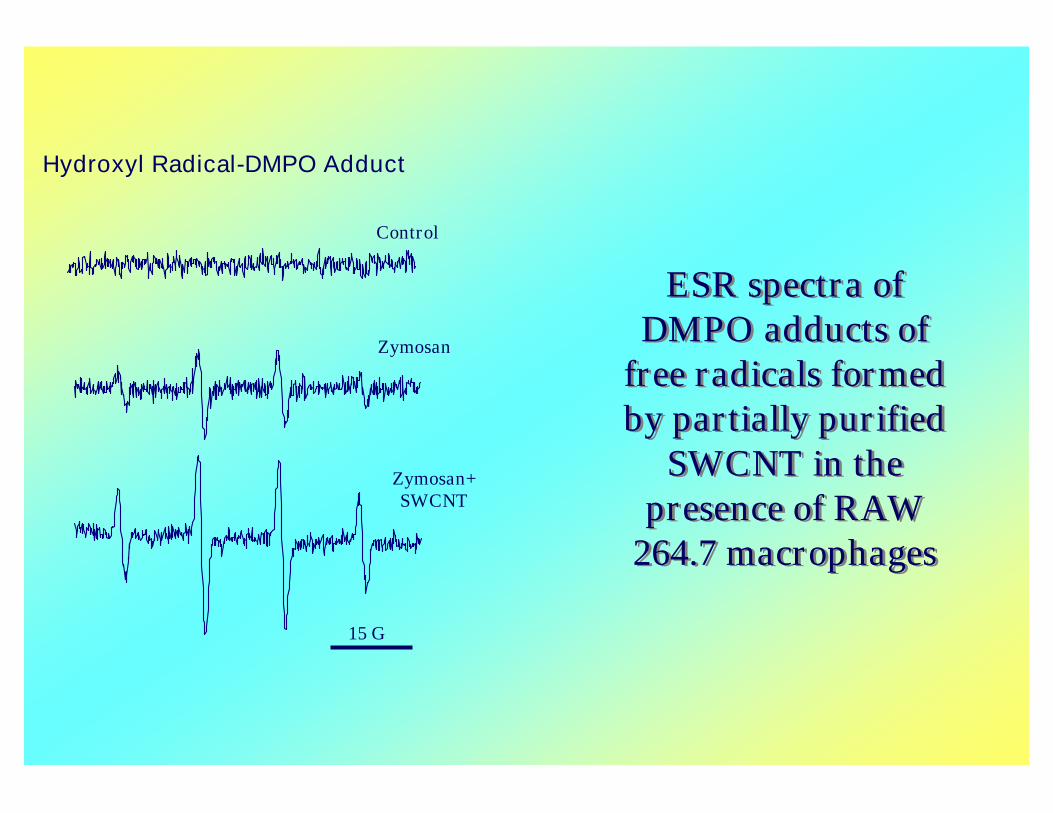
Hydroxyl Radical-DMPO Adduct
15 G
Control
Zymosan
Zymosan+SWCNT
ESR spectra ofDMPO adducts of
free radicals formedby partially purified
SWCNT in thepresence of RAW
264.7 macrophages
ESR spectra ofDMPO adducts of
free radicals formedby partially purified
SWCNT in thepresence of RAW
264.7 macrophages
Hydroxyl Radical-DMPO Adduct
CH2H2C
CH2H2C
CH2
HCCH2 H2C
CCH2
H2CCH2
H2C
HC
HC CH
CHCH
CCH2
H2CCH2
H2CCH2
H2CCH2
H2CCH2
H2CCH2
H2CCH2
H2CCH2
H3C
HC
CH2
CH
O
OCH2
OO
HCH2C
OPO
OOCH2 CH COO
NH3
OxidationCH2
H2CCH2
H2CCH2
HCCH H2C
CCH2
H2CCH2
H2C
CH
HC CH
CHCH
CCH2
H2CCH2
H2CCH2
H2CCH2
H2CCH2
H2CCH2
H2CCH2
H2CCH2
H3C
HC
CH2
CH
O
OCH2
OO
HCH2C
OPO
OOCH2 CH COO
NH3
HOO
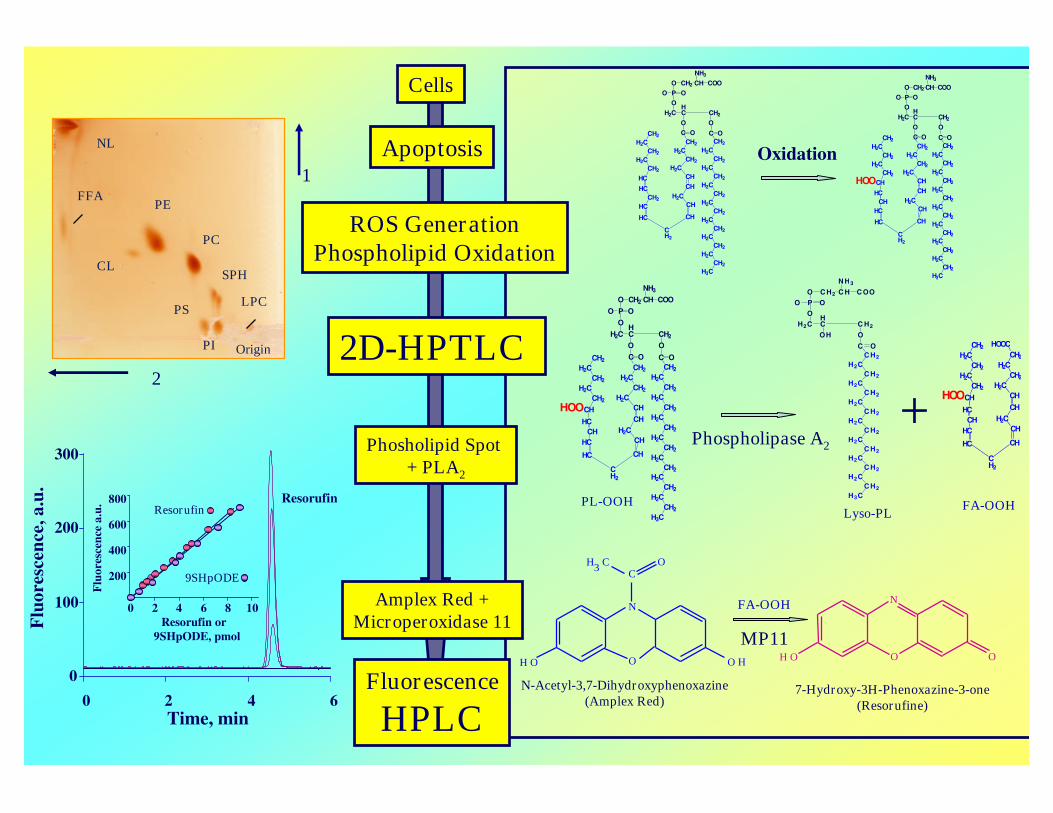
Cells
ROS GenerationPhospholipid Oxidation
Apoptosis1
NL
FFAPE
CL
PC
SPH
LPCPS
PI Origin
22D-HPTLC CH2
H2CCH2
H2CCH2
HCCH H2C
CCH2
H2CCH2
H2C
CH
HC CH
CHCH
CCH2
H2CCH2
H2CCH2
H2CCH2
H2CCH2
H2CCH2
H2CCH2
H2CCH2
H3C
HC
CH2
CH
O
OCH2
OO
HCH2C
OPO
OOCH2 CH COO
NH3
HOO
CC H2
H2CC H2
H2CC H2
H2CC H2
H2CC H2
H2CC H2
H2CC H2
H2CC H2
H3C
O
OC H2
OH
HCH2C
OPO
OOC H2 C H C OO
N H3
CH2H2C
CH2H2C
CH2
HCCH H2C
HOOCCH2
H2CCH2
H2C
CH
HC CH
CHCH
HC
CH2
CH
HOO+Phospholipase A2
FA-OOHLyso-PLPL-OOH
Phosholipid Spot+ PLA2
H O
C
O H
H3 C O
O
N
H O OO
N
N-Acetyl-3,7-Dihydroxyphenoxazine(Amplex Red)
7-Hydroxy-3H-Phenoxazine-3-one(Resorufine)
FA-OOH
MP11
Amplex Red +Microperoxidase 11
200
400
600
800
0 2 4 6 8 10Resorufin or
9SHpODE, pmol
Flu
ores
cenc
ea.
u. Resorufin
9SHpODE
0
100
200
300
0 2 4 6Time, min
Flu
ores
cenc
e,a.
u. Resorufin
Fluorescence
HPLC
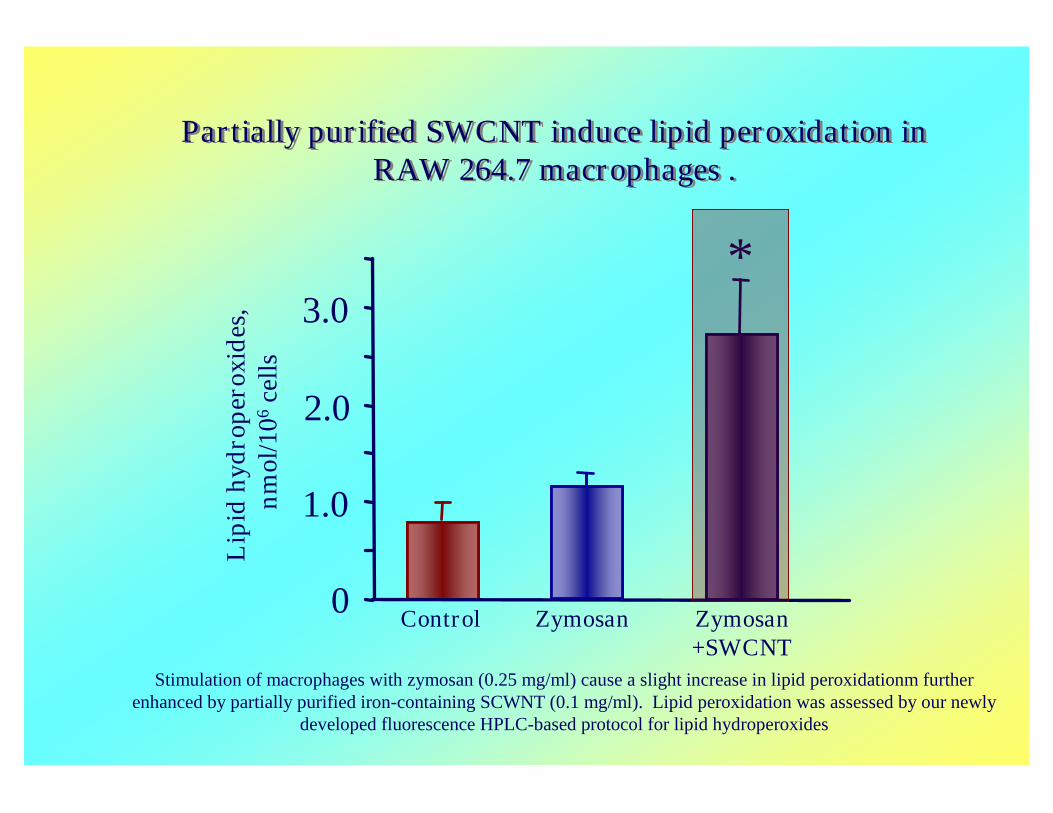
Partially purified SWCNT induce lipid peroxidation inRAW 264.7 macrophages .
Partially purified SWCNT induce lipid peroxidation inRAW 264.7 macrophages .
Stimulation of macrophages with zymosan (0.25 mg/ml) cause a slight increase in lipid peroxidationm furtherenhanced by partially purified iron-containing SCWNT (0.1 mg/ml). Lipid peroxidation was assessed by our newly
developed fluorescence HPLC-based protocol for lipid hydroperoxides
Control Zymosan Zymosan+SWCNT
*
0
1.0
2.0
3.0
Lip
idhy
drop
erox
ides
,nm
ol/1
06ce
lls
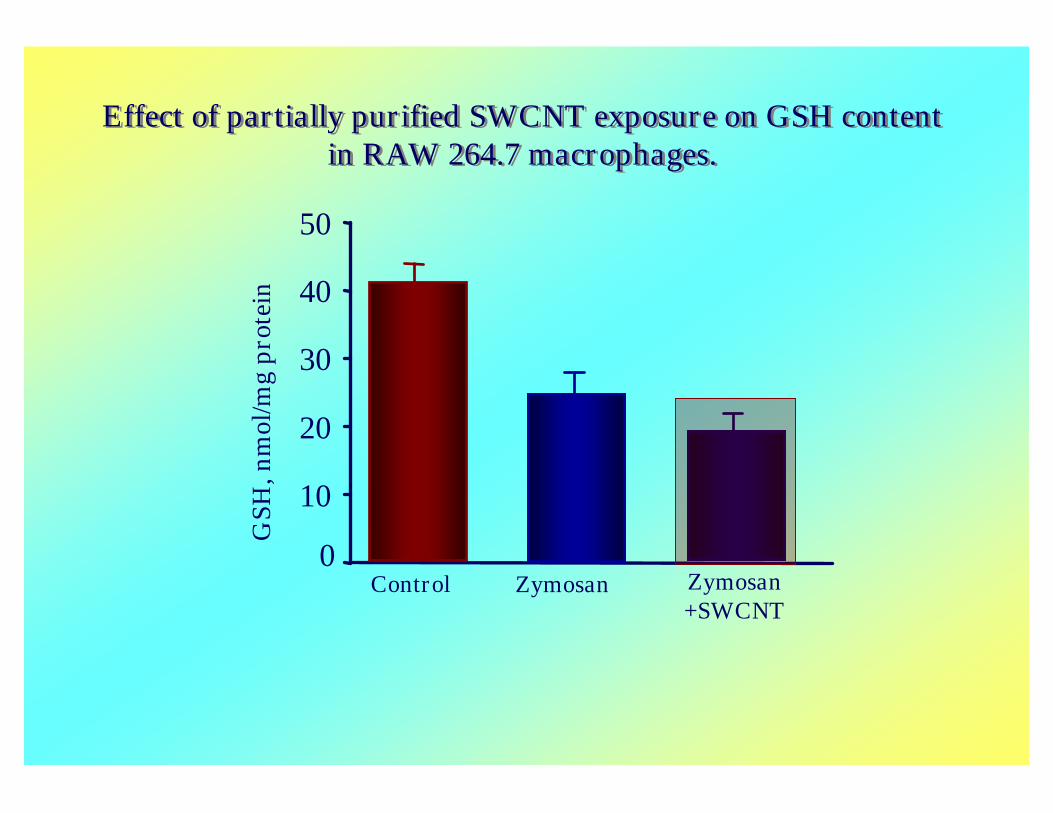
Effect of partially purified SWCNT exposure on GSH contentin RAW 264.7 macrophages.
Effect of partially purified SWCNT exposure on GSH contentin RAW 264.7 macrophages.
0
10
20
30
40
50G
SH,n
mol
/mg
prot
ein
Zymosan Zymosan+SWCNT
Control
0
20
40
60
80
100
120
Zymosan
Cyt
okin
esre
leas
ed,
%of
zym
osan
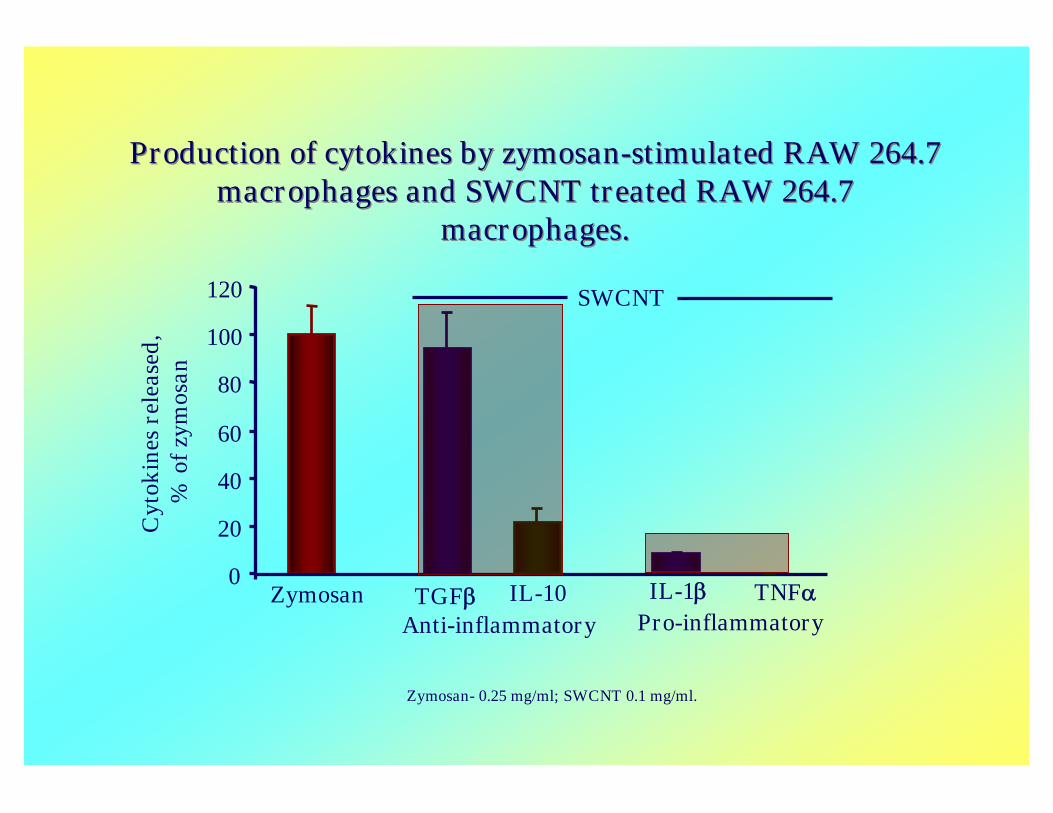
Production of cytokines by zymosan-stimulated RAW 264.7macrophages and SWCNT treated RAW 264.7
macrophages.
Production of cytokines by zymosan-stimulated RAW 264.7macrophages and SWCNT treated RAW 264.7
macrophages.
Zymosan- 0.25 mg/ml; SWCNT 0.1 mg/ml.
TGF IL-10
SWCNT
Anti-inflammatoryIL-1 TNF
Pro-inflammatory

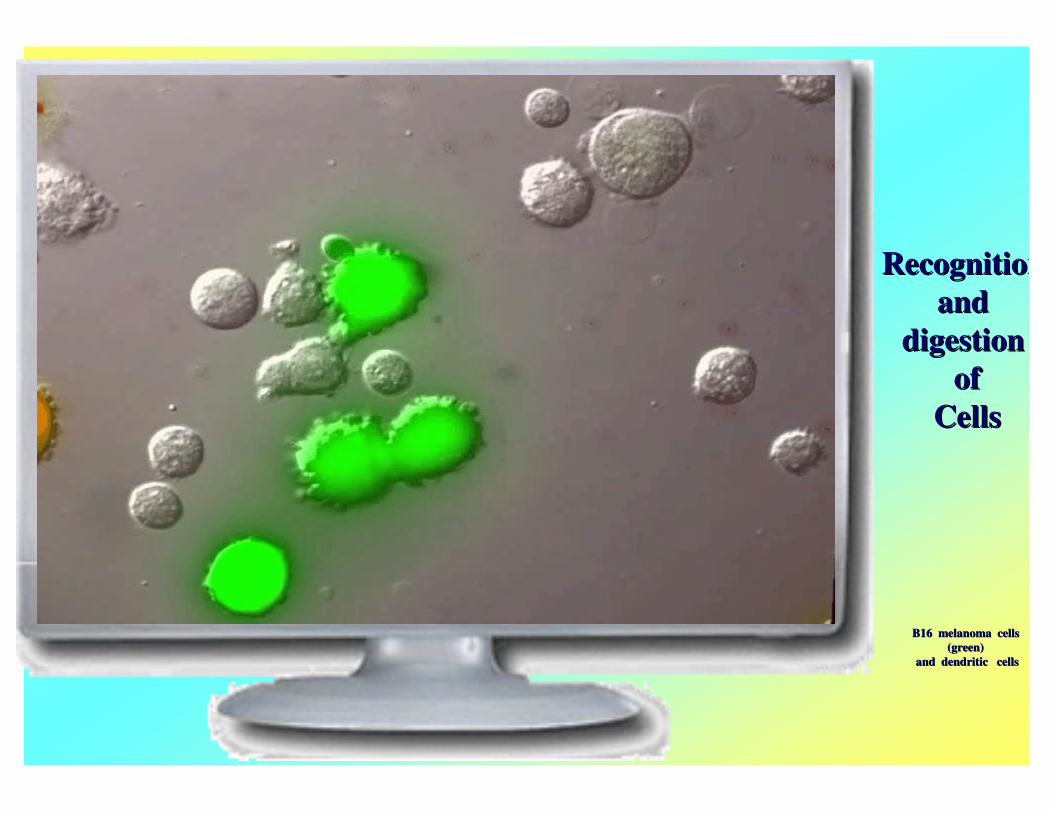
RecognitionRecognitionandand
digestiondigestionofof
CellsCells
B16 melanoma cellsB16 melanoma cells(green)(green)
andand dendriticdendritic cellscells

Can MacrophagesBe Forced
to Recognize andDigest
CarbonNanotubes
Can MacrophagesBe Forced
to Recognize andDigest
CarbonNanotubes
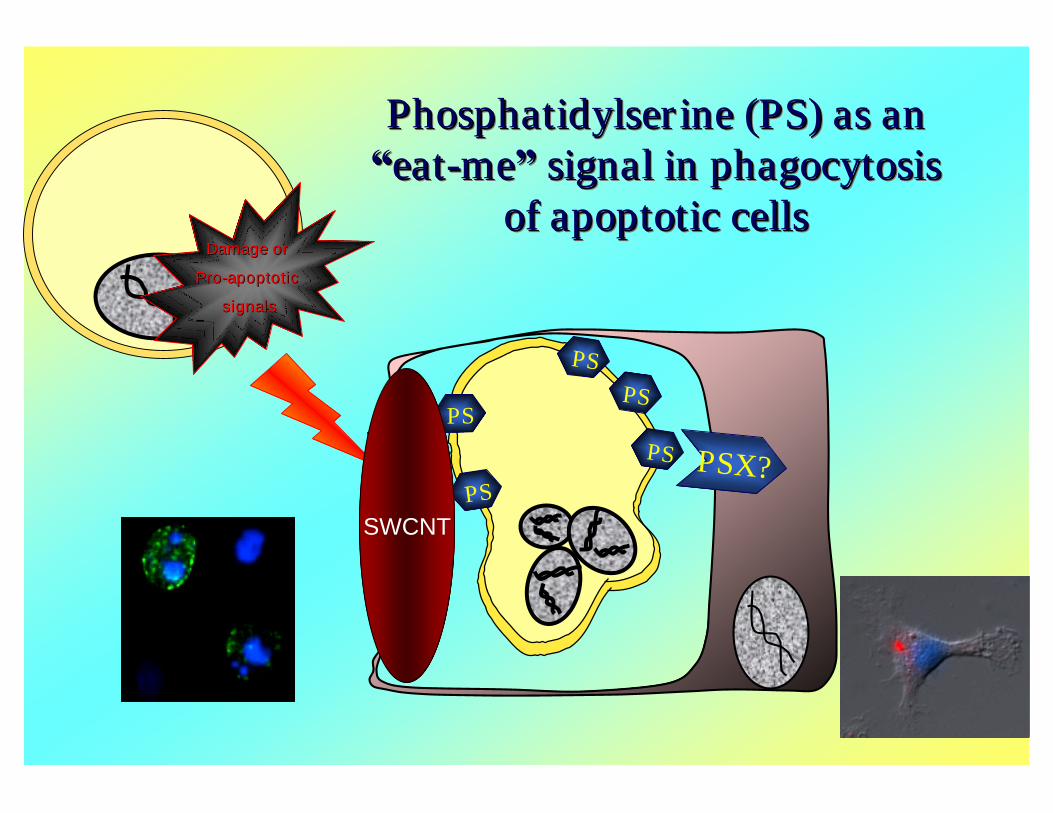
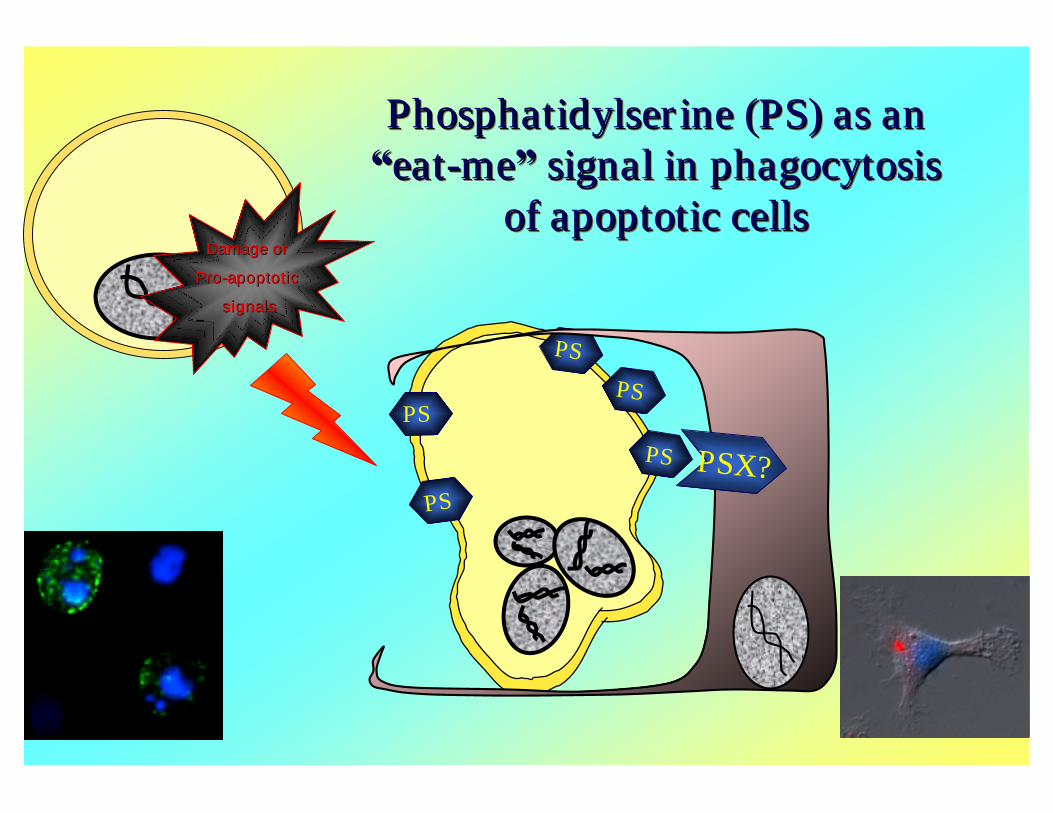
Phosphatidylserine (PS) as an“eat-me”signal in phagocytosis
of apoptotic cells
PhosphatidylserinePhosphatidylserine (PS) as an(PS) as an““eateat--meme””signal insignal in phagocytosisphagocytosis
of apoptotic cellsof apoptotic cellsDamage orDamage or
ProPro--apoptoticapoptotic
signalssignals
PS
PS
PS
PS
PS PSX?
SWCNT
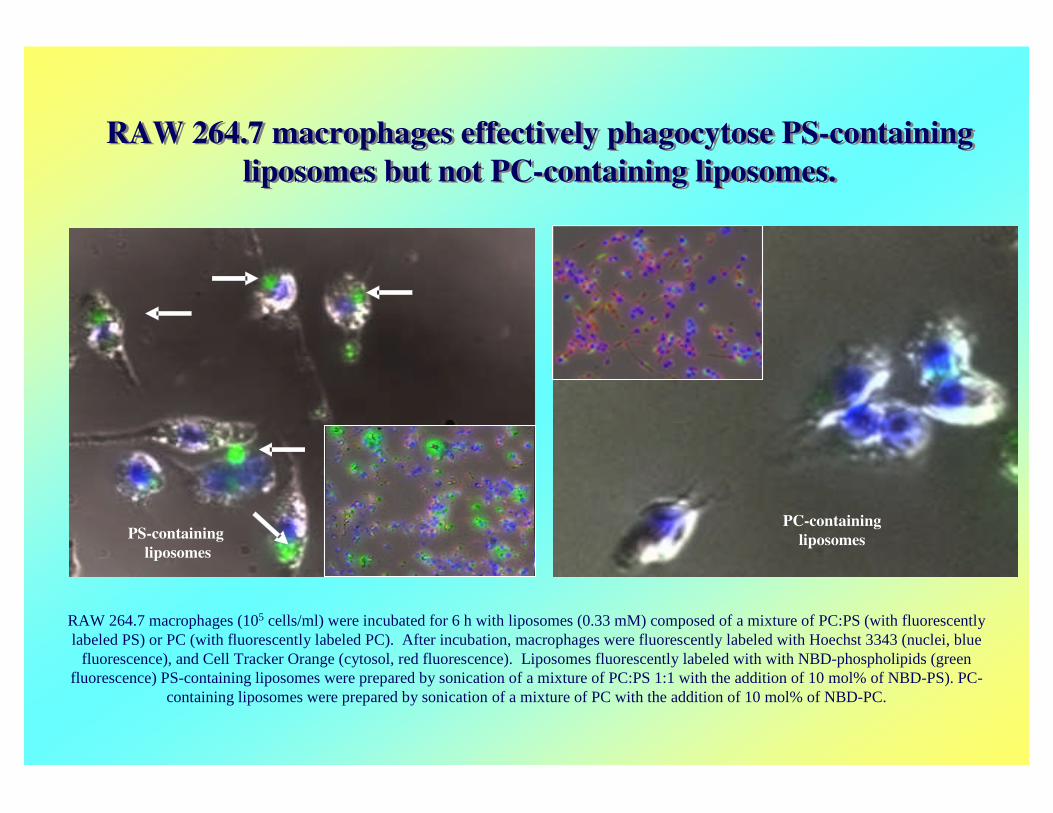
RAW 264.7 macrophages effectively phagocytose PS-containingliposomes but not PC-containing liposomes.
RAW 264.7 macrophages effectively phagocytose PS-containingliposomes but not PC-containing liposomes.
RAW 264.7 macrophages (105 cells/ml) were incubated for 6 h with liposomes (0.33 mM) composed of a mixture of PC:PS (with fluorescentlylabeled PS) or PC (with fluorescently labeled PC). After incubation, macrophages were fluorescently labeled with Hoechst 3343 (nuclei, blue
fluorescence), and Cell Tracker Orange (cytosol, red fluorescence). Liposomes fluorescently labeled with with NBD-phospholipids (greenfluorescence) PS-containing liposomes were prepared by sonication of a mixture of PC:PS 1:1 with the addition of 10 mol% of NBD-PS). PC-
containing liposomes were prepared by sonication of a mixture of PC with the addition of 10 mol% of NBD-PC.
PC-containingliposomesPS-containing
liposomes
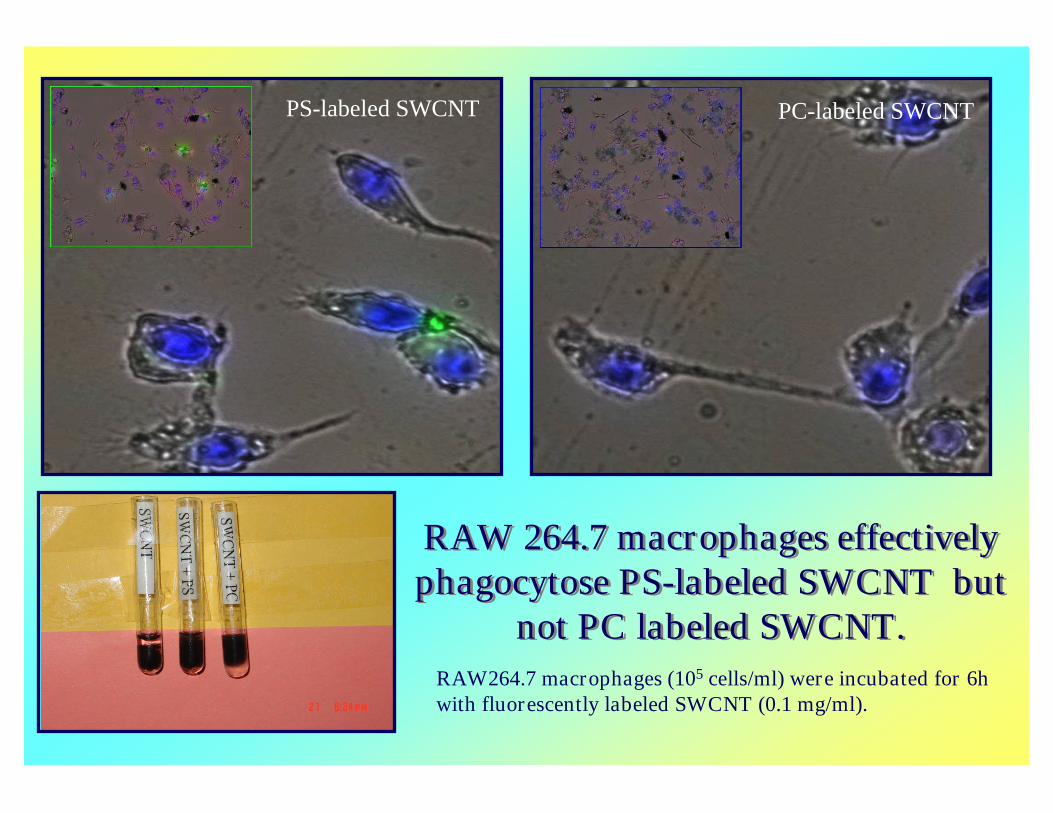
RAW264.7 macrophages (105 cells/ml) were incubated for 6hwith fluorescently labeled SWCNT (0.1 mg/ml).
RAW 264.7 macrophages effectivelyphagocytose PS-labeled SWCNT but
not PC labeled SWCNT.
RAW 264.7 macrophages effectivelyphagocytose PS-labeled SWCNT but
not PC labeled SWCNT.
PS-labeled SWCNT PC-labeled SWCNT

Kagan’s Lab:
A. ArroyoN. BelikovaG. BorisenkoJ. JiangK. KawaiV. KiniS.-X. LiuT. MatsuuraA. OsipovA. PotapovichB. SerinkanV. TyurinY. TyurinaQ. Zhao
Kagan’s Lab:
A. ArroyoN. BelikovaG. BorisenkoJ. JiangK. KawaiV. KiniS.-X. LiuT. MatsuuraA. OsipovA. PotapovichB. SerinkanV. TyurinY. TyurinaQ. Zhao
Thanks To My Collaborators:Thanks To My Collaborators:Thanks To My Collaborators:
NIOSH:A. Shvedova (Morgantown)V. Castranova (Morgantown)R. Mercer (Morgantown)E. Kisin (Morgantown)A. Maynard (Cincinnati)
NIOSH:A. Shvedova (Morgantown)V. Castranova (Morgantown)R. Mercer (Morgantown)E. Kisin (Morgantown)A. Maynard (Cincinnati)


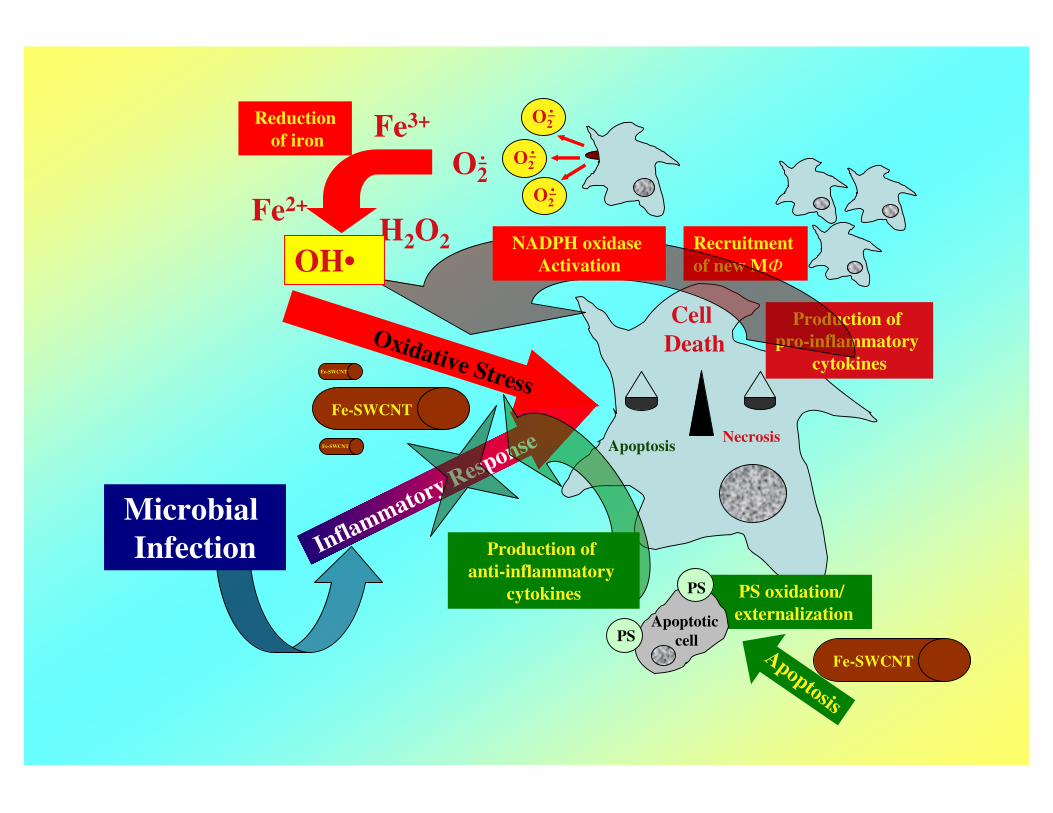
Fe-SWCNT
Fe-SWCNT
NecrosisApoptosis
CellDeath
Production ofpro-inflammatory
cytokines
Recruitmentof new M
Oxidative Stress
H2O2Fe2+
Fe3+
OH•
Reductionof iron
O2.
O2.
O2.
O2.
NADPH oxidaseActivation
Fe-SWCNT
Inflammatory Response
MicrobialInfection
PS oxidation/externalization
Apoptosis
PS
PS
Apoptoticcell
Fe-SWCNT
Production ofanti-inflammatory
cytokines
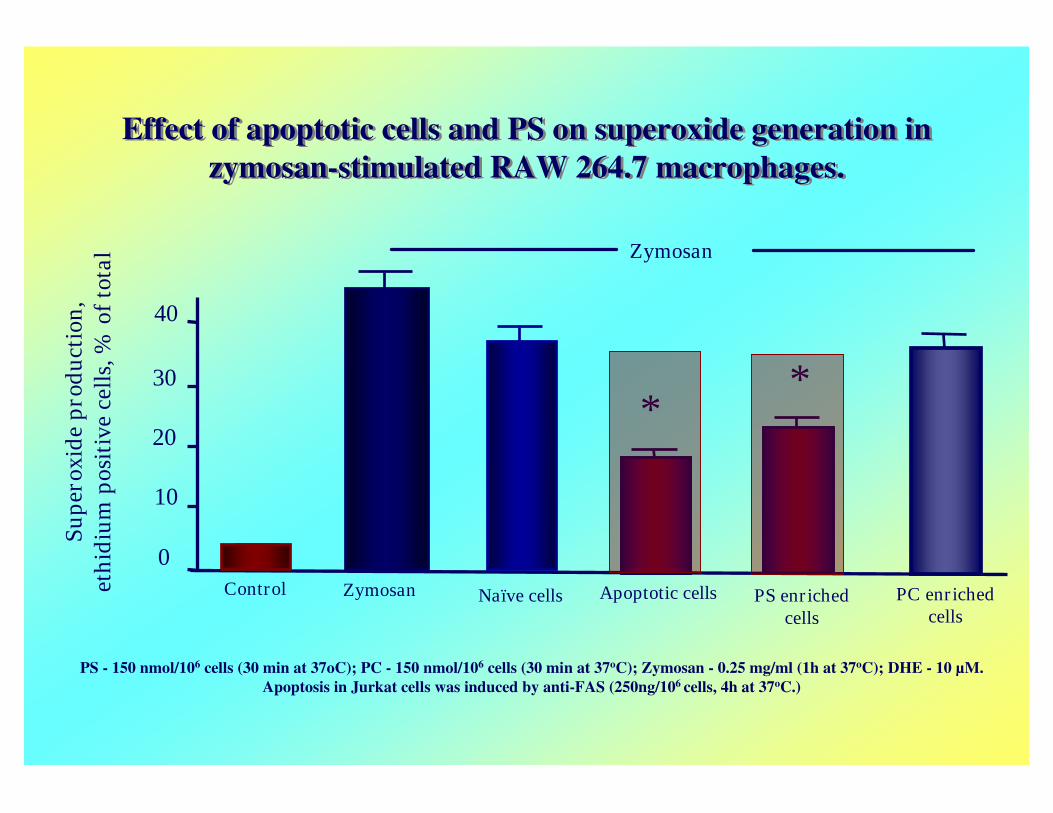
Effect of apoptotic cells and PS on superoxide generation inzymosan-stimulated RAW 264.7 macrophages.
Effect of apoptotic cells and PS on superoxide generation inzymosan-stimulated RAW 264.7 macrophages.
PS - 150 nmol/106 cells (30 min at 37oC); PC - 150 nmol/106 cells (30 min at 37oC); Zymosan - 0.25 mg/ml (1h at 37oC); DHE - 10 µM.Apoptosis in Jurkat cells was induced by anti-FAS (250ng/106 cells, 4h at 37oC.)
Zymosan
0
10
20
30
40
Control
**
Zymosan
Supe
roxi
depr
oduc
tion
,et
hidi
umpo
siti
vece
lls,%
ofto
tal
PC enrichedcells
PS enrichedcells
Apoptotic cellsNaïve cells
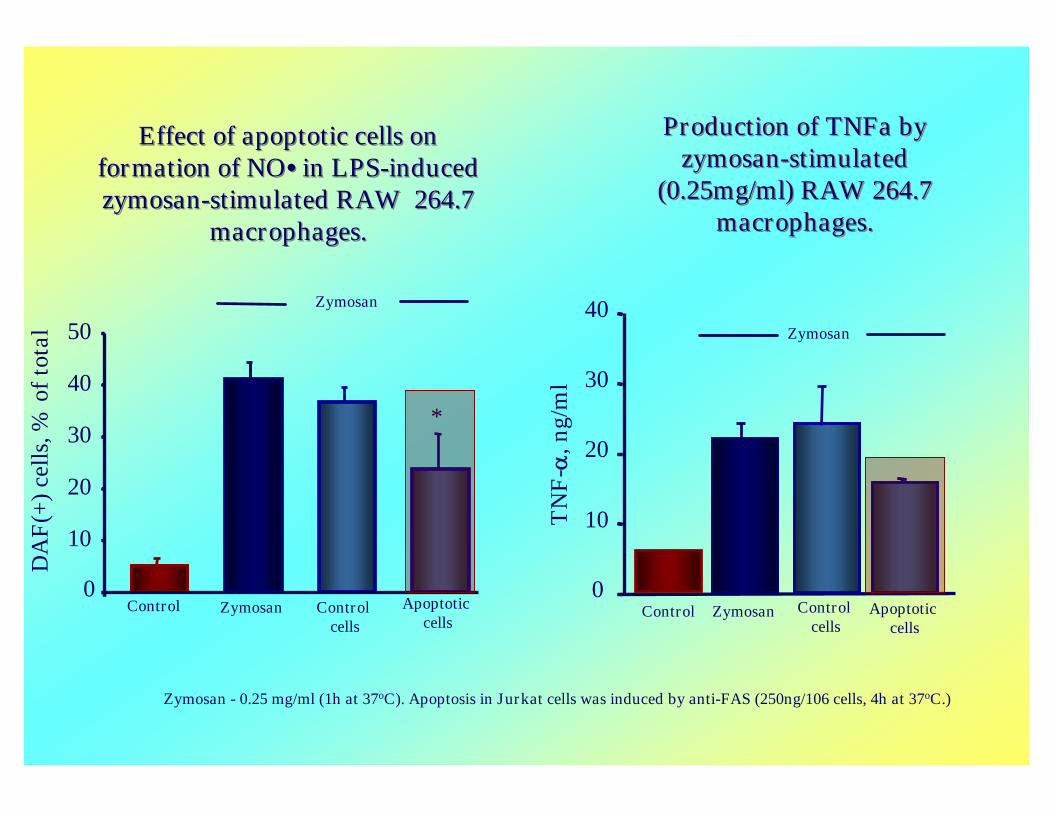
Production of TNFa byzymosan-stimulated
(0.25mg/ml) RAW 264.7macrophages.
Production of TNFa byzymosan-stimulated
(0.25mg/ml) RAW 264.7macrophages.
0
10
20
30
40
Control
Zymosan
TN
F-
,ng/
ml
Zymosan Controlcells
Apoptoticcells
Zymosan - 0.25 mg/ml (1h at 37oC). Apoptosis in Jurkat cells was induced by anti-FAS (250ng/106 cells, 4h at 37oC.)
Effect of apoptotic cells onformation of NO•in LPS-inducedzymosan-stimulated RAW 264.7
macrophages.
Effect of apoptotic cells onformation of NO•in LPS-inducedzymosan-stimulated RAW 264.7
macrophages.
0
10
20
30
40
50Zymosan
DA
F(+
)cel
ls,%
ofto
tal
*
Control Zymosan Controlcells
Apoptoticcells
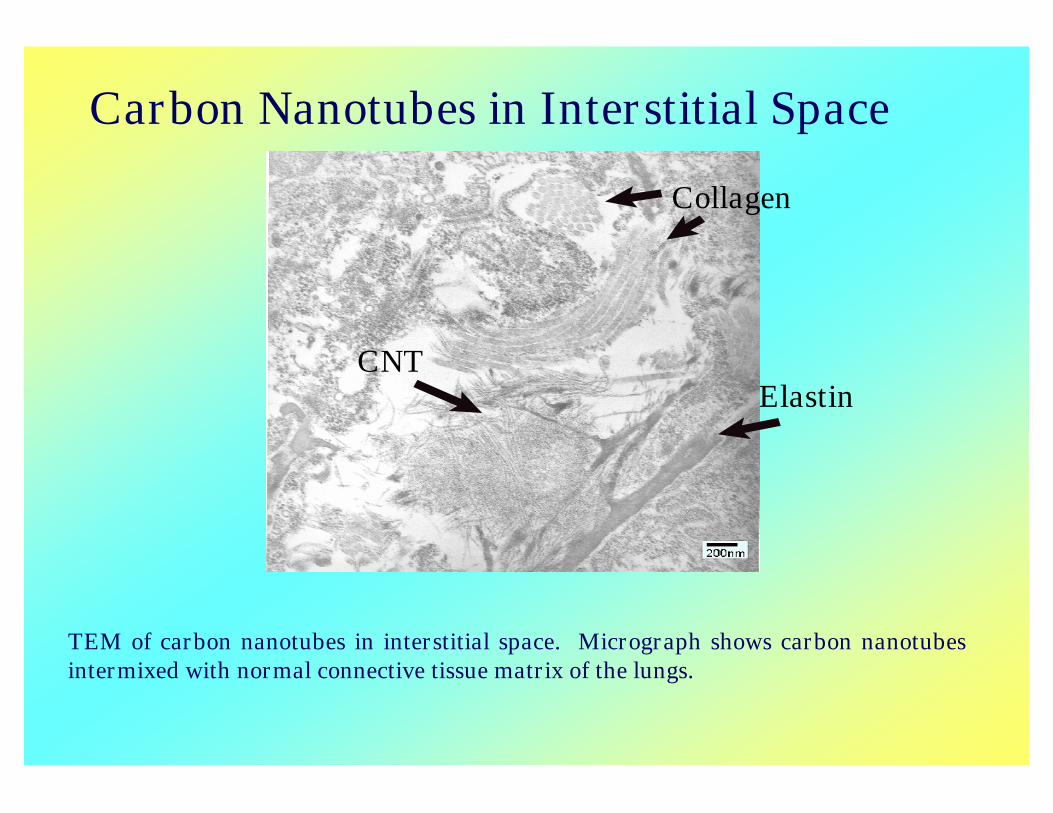
Carbon Nanotubes in Interstitial Space
Collagen
ElastinCNT
TEM of carbon nanotubes in interstitial space. Micrograph shows carbon nanotubesintermixed with normal connective tissue matrix of the lungs.
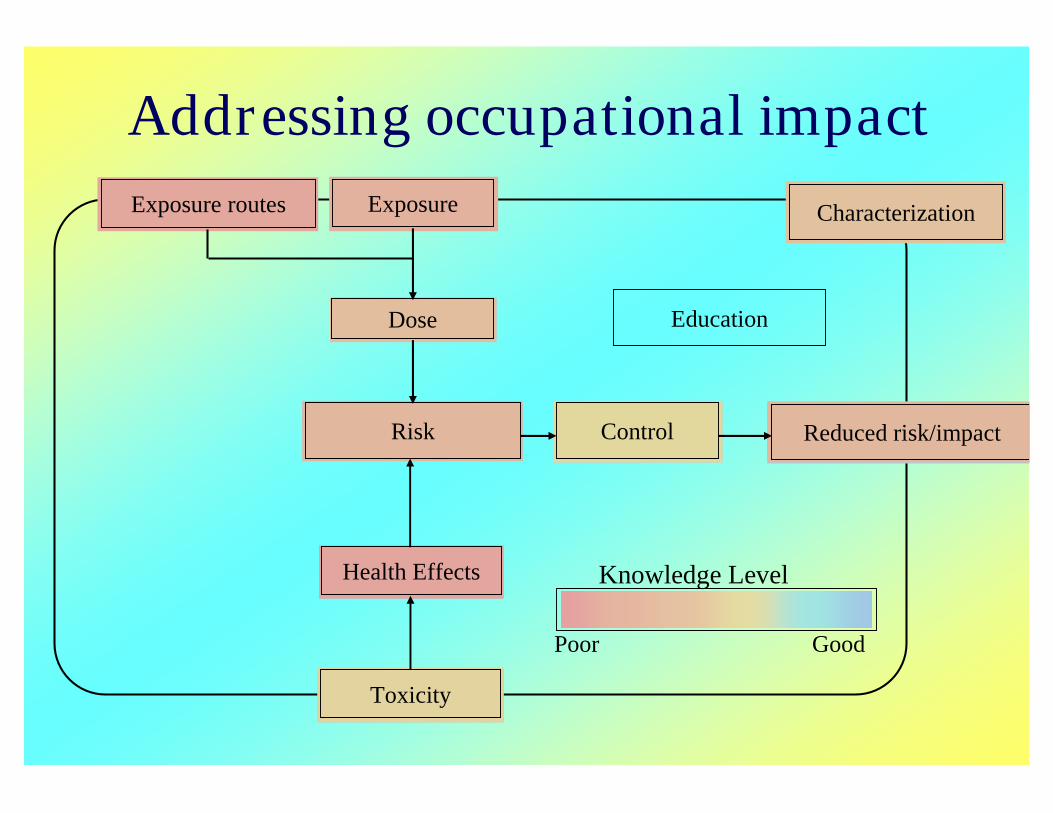
Dose
Exposure
Toxicity
Risk Control Reduced risk/impact
Exposure routes
Health Effects
Characterization
Dose
Exposure
Toxicity
Risk Control Reduced risk/impact
Exposure routes
Health Effects
Characterization
Poor Good
Knowledge Level
Education
Addressing occupational impact
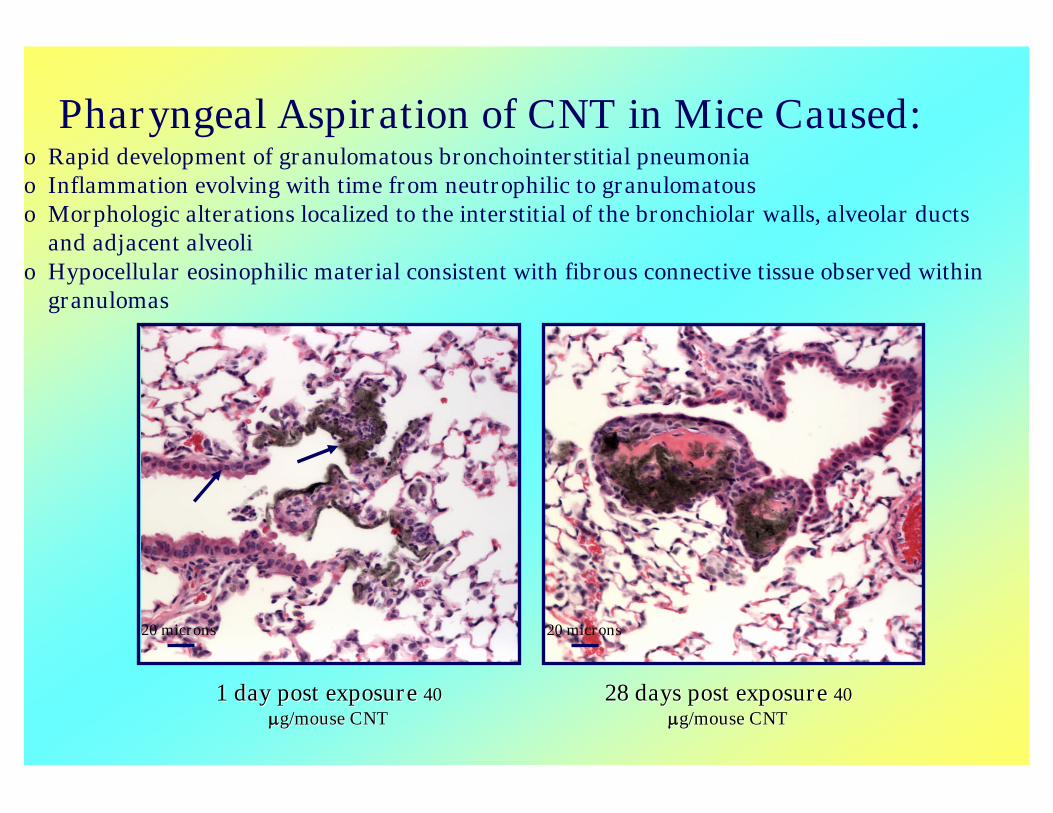
1 day post exposure1 day post exposure 4040g/mouse CNTg/mouse CNT
o Rapid development of granulomatous bronchointerstitial pneumoniao Inflammation evolving with time from neutrophilic to granulomatouso Morphologic alterations localized to the interstitial of the bronchiolar walls, alveolar ducts
and adjacent alveolio Hypocellular eosinophilic material consistent with fibrous connective tissue observed within
granulomas
20 microns
28 days post exposure28 days post exposure 4040g/mouse CNTg/mouse CNT
20 microns
Pharyngeal Aspiration of CNT in Mice Caused:
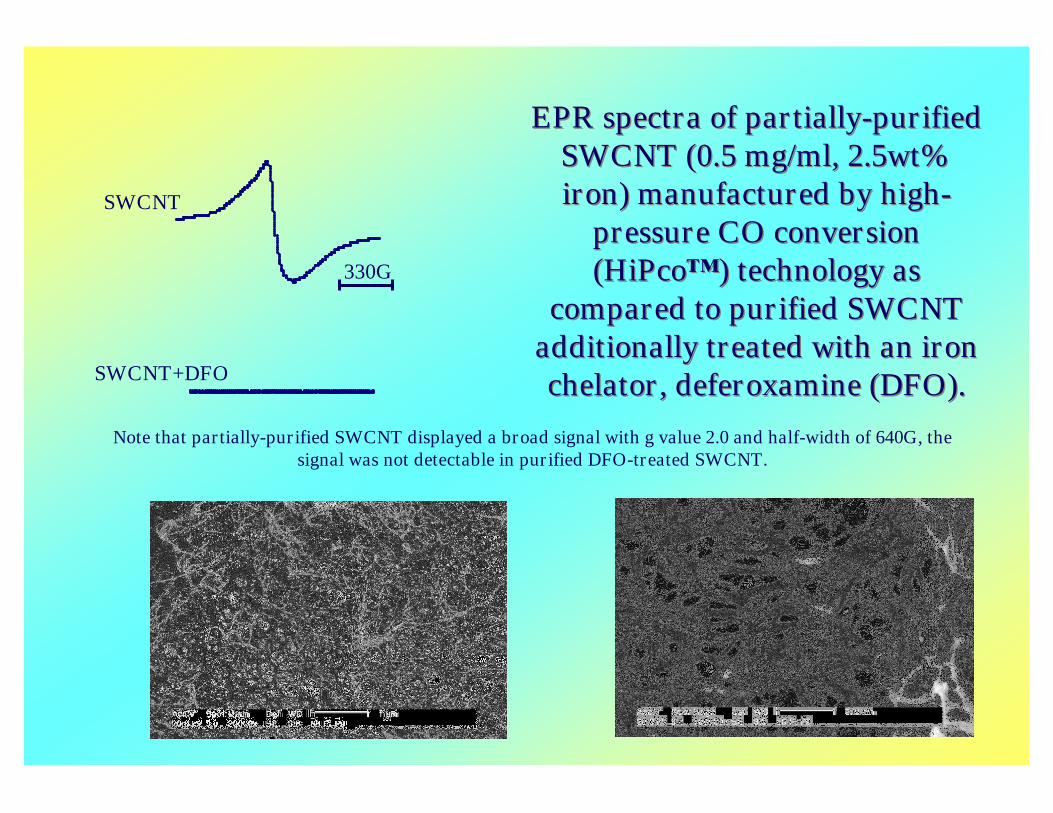
SWCNT+DFO
EPR spectra of partially-purifiedSWCNT (0.5 mg/ml, 2.5wt%iron) manufactured by high-
pressure CO conversion(HiPco™) technology as
compared to purified SWCNTadditionally treated with an ironchelator, deferoxamine (DFO).
EPR spectra of partially-purifiedSWCNT (0.5 mg/ml, 2.5wt%iron) manufactured by high-
pressure CO conversion(HiPco™) technology as
compared to purified SWCNTadditionally treated with an ironchelator, deferoxamine (DFO).
330G
SWCNT
Note that partially-purified SWCNT displayed a broad signal with g value 2.0 and half-width of 640G, thesignal was not detectable in purified DFO-treated SWCNT.
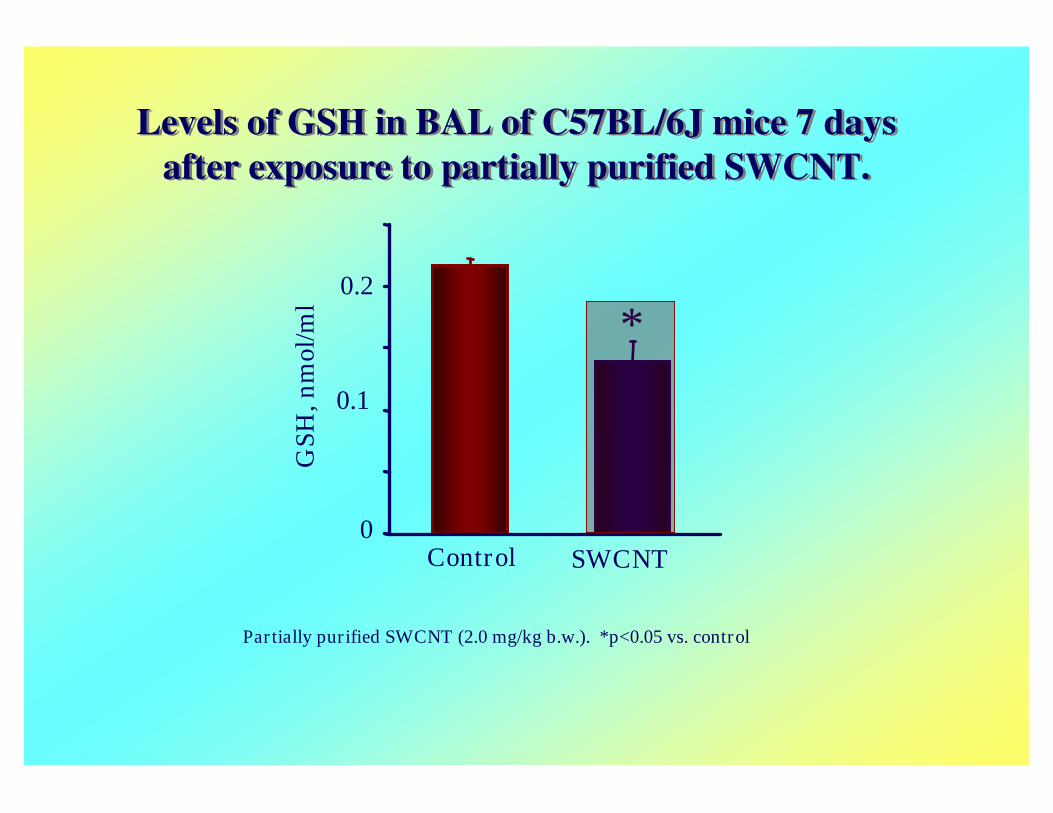
Levels of GSH in BAL of C57BL/6J mice 7 daysafter exposure to partially purified SWCNT.
Levels of GSH in BAL of C57BL/6J mice 7 daysafter exposure to partially purified SWCNT.
Partially purified SWCNT (2.0 mg/kg b.w.). *p<0.05 vs. control
0
0.1
0.2
Control SWCNT
*G
SH,n
mol
/ml
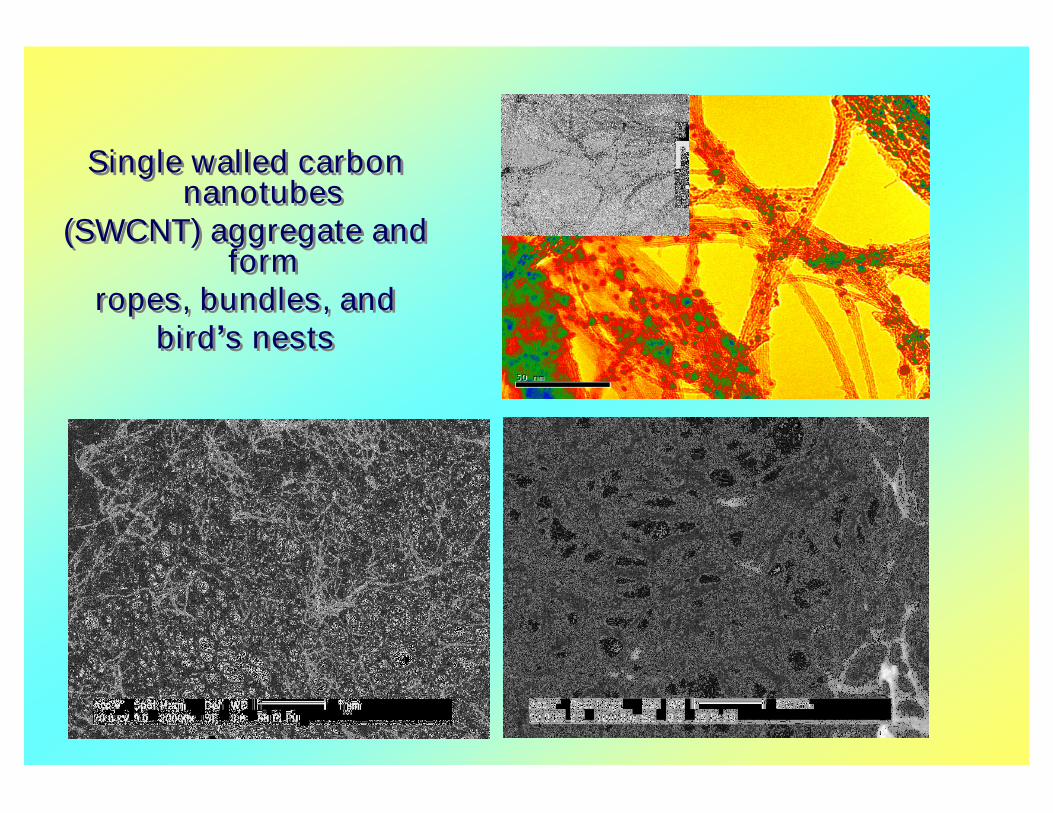
Single walled carbonnanotubes
(SWCNT) aggregate andform
ropes, bundles, andbird’s nests
Single walled carbonnanotubes
(SWCNT) aggregate andform
ropes, bundles, andbird’s nests
Phosphatidylserine (PS) as an“eat-me”signal in phagocytosis
of apoptotic cells
PhosphatidylserinePhosphatidylserine (PS) as an(PS) as an““eateat--meme””signal insignal in phagocytosisphagocytosis
of apoptotic cellsof apoptotic cellsDamage orDamage or
ProPro--apoptoticapoptotic
signalssignals
PS
PS
PS
PS
PS PSX?
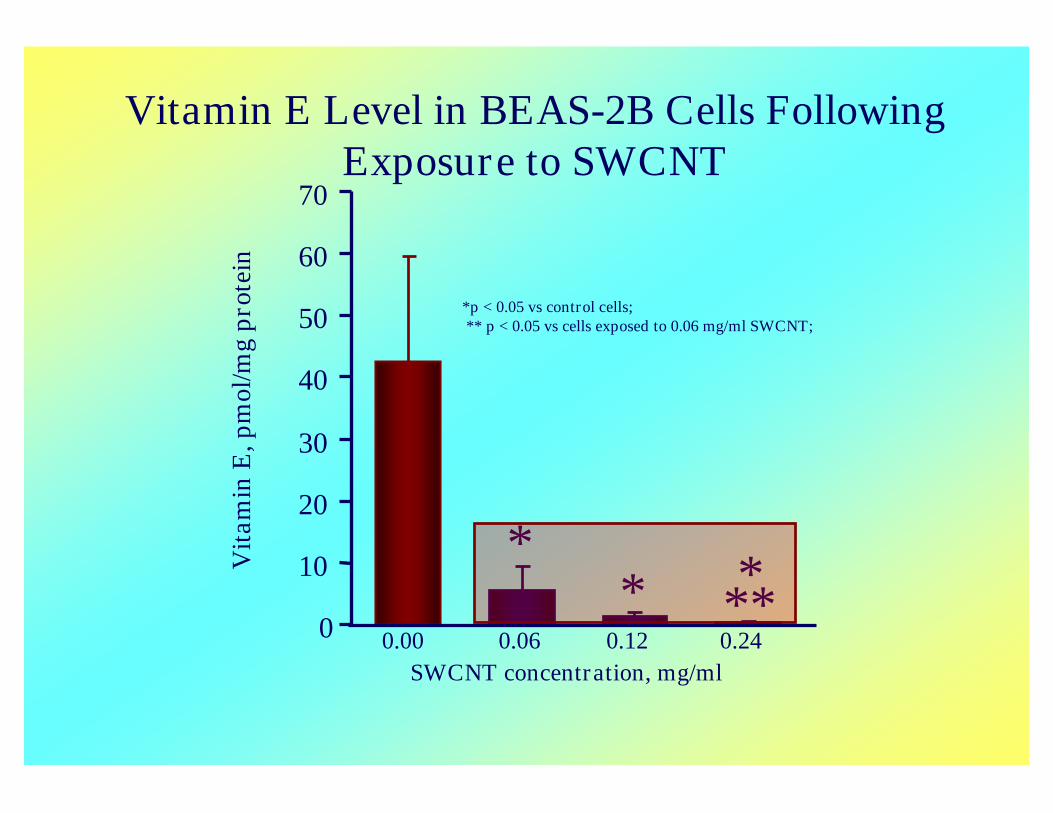
0.00SWCNT concentration, mg/ml
Vit
amin
E,p
mol
/mg
prot
ein
Vitamin E Level in BEAS-2B Cells FollowingExposure to SWCNT
*p < 0.05 vs control cells;** p < 0.05 vs cells exposed to 0.06 mg/ml SWCNT;
0
10
20
30
40
50
60
70
0.06 0.12 0.24**
** *
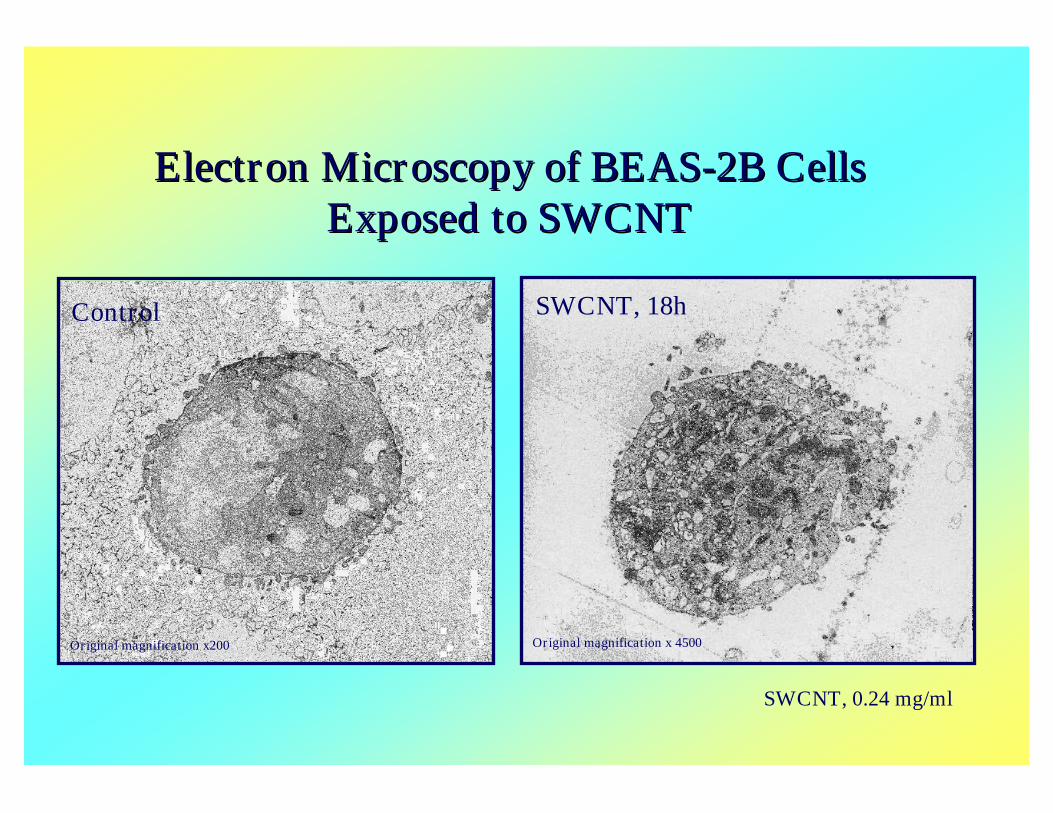
Electron Microscopy of BEASElectron Microscopy of BEAS--2B Cells2B CellsExposed to SWCNTExposed to SWCNT
SWCNT, 0.24 mg/ml
SWCNT, 18h
Original magnification x 4500
Control
Original magnification x200