Embed Size (px)
Citation preview

Vale’s Performance in 1Q18
Tubarão Pellet Plants

www.vale.com
App Vale Investors & Media
iOS: https://itunes.apple.com/us/app/vale-investor-media-portugues/id1087134066?ls=1&mt=8
Android: https://play.google.com/store/apps/details?id=com.theirapp.valeport
Tel.: (55 21) 3485-3900
Investor Relations Department
André Figueiredo
André Werner
Carla Albano Miller
Fernando Mascarenhas
Samir Bassil
Andrea Gutman
Bruno Siqueira
Clarissa Couri
Renata Capanema
BM&F BOVESPA: VALE3
NYSE: VALE
EURONEXT PARIS: VALE3
LATIBEX: XVALO
Except where otherwise indicated the operational and financial information in this release is based on the consolidated figures
in accordance with IFRS. Vale’s quarterly financial statements are reviewed by the company’s independent auditors. The main
subsidiaries that are consolidated are the following: Companhia Portuária da Baía de Sepetiba, Mineração Corumbaense
Reunida S.A., Minerações Brasileiras Reunidas S.A. PT Vale Indonesia Tbk, Salobo Metais S.A, Vale International Holdings
GMBH, Vale Canada Limited, Vale International S.A., Vale Manganês S.A., Vale Malaysia Minerals Sdn. Bhd., Vale Moçambique
S.A., Vale Nouvelle-Calédonie SAS, Vale Oman Pelletizing Company LLC and Vale Oman Distribution Center LLC.

3
Vale’s performance in 1Q18
Chief Executive Officer Mr. Fabio Schvartsman commented on the 1Q18 results: “We are well
positioned to generate significant shareholder value by leveraging our premium and flexible product
portfolio. We are pleased that Vale has shown remarkable flexibility and performance during a very
complex first quarter 2018, which was crucial to achieve the same level of EBITDA as 4Q17, despite
the challenge of seasonally lower volumes”. He concluded that: “I am committed to make Vale a
more predictable company. Thus, in any given price scenario, the market will be able to easily
forecast Vale’s performance. This will only be possible by having full control of everything other than
prices, meaning that we will have a very strict capital allocation policy, a relentless focus on
performance and constant efforts to optimize our cost structure”.1
The flexibility of Vale’s supply chain led to a record sales volume for a first quarter of iron ore
and pellets, despite the challenge of seasonally lower production. Consequently, adjusted
EBITDA totaled US$ 3.971 billion in 1Q18, remaining practically in line with 4Q17.
Vale’s operational cash flow generation in 1Q18, together with the proceeds from the sale of
fertilizer assets and the Project Finance in Mozambique, supported the increase in Free Cash
Flow vs. 4Q17, totaling US$ 5.015 billion, the best performance since 1Q11, which enabled a
substantial net debt reduction of US$ 3.242 billion quarter-on-quarter. “1Q18 was marked by
our deleveraging, with net debt achieving US$ 14.9 billion, the lowest level since 2Q11, while
paying US$ 1.4 billion in shareholder remuneration. We will reach the US$ 10 billion net debt
target in the short term and our sound balance sheet and strong cash generation will enable us
to significantly increase shareholder remuneration”, highlighted Chief Financial Officer Mr.
Luciano Siani Pires.
Consistent with Vale’s strategy to adopt a rigorous capital allocation process based on returns,
Capital Expenditures reached US$ 890 million, the lowest level for a first quarter since 1Q05,
following the trend of remaining sub US$ 1 billion per quarter and reinforcing Vale’s Capex
guidance of US$ 3.8 billion in 2018.
The Ferrous Minerals business had an outstanding result in 1Q18, with an adjusted EBITDA of
US$ 3.408 billion in 1Q18, as a result of the contributions of higher quality and average
premium, which improved Vale’s realized CFR/FOB wmt price, reflecting: (i) the flexibility of the
1 Excluding Manganese and ferroalloys.
4
operations; (ii) the active supply chain management; and (iii) the increase of premium product
share in total sales.
Vale’s premium and flexible portfolio of products is in a leading position to profit from the
structural “flight to quality” trend. In 1Q18, Vale reached another milestone towards improving
Fe content, price realization and pellets contribution that resulted in a lower iron ore fines and
pellets EBITDA breakeven2,3 of US$ 30.5/dmt in 1Q18, a reduction of US$ 1.7/t vs. 4Q17, and
in a higher adjusted EBITDA per ton for Ferrous Minerals3 that totaled US$ 39.8/t in 1Q18, an
increase of US$ 3.7/t vs. 4Q17. “Vale’s Ferrous division is following its well defined value over
volume strategy and is progressively optimizing its price realization and margins based on its
increasing proportion of premium products as well as through an active management of its
global supply chain”, commented Mr. Peter Poppinga, Executive Officer for Ferrous Minerals
and Coal.
Vale’s decision to restart Tubarão II pellet plant and the negotiation of better terms for pellet
premiums averaging US$ 60/wmt for the year, an increase of over US$ 10/wmt vs. 2017,
are reflected in its results with adjusted EBITDA for pellets amounting to US$ 763 million
in 1Q18, a 13% increase vs. 4Q17, and representing 19% of Vale’s total adjusted EBITDA.
Vale is a premium nickel player with a unique product mix and market position and was able to
benefit from the higher nickel prices in 1Q18, with an adjusted EBITDA for Base Metals of US$
644 million. “We are focused on further improving the competitiveness of the Base Metals
business optimizing margins and maintaining the optionality of nickel in the scenario of higher
demand for Class I nickel. In 1Q18 we partially compensated the unplanned production
shortcomings in the Coleman mine in Sudbury with the marketing focus on maximizing price
realization over our premium product mix with higher margins”, commented Mr. Eduardo
Bartolomeo, Executive Officer for Base Metals.
VNC registered its best result ever for the second consecutive quarter, with an adjusted EBITDA
of US$ 28 million in 1Q18, reflecting higher nickel and cobalt prices.
The results of Vale’s Coal business continued to improve in 1Q18, driven by higher realized
prices, showing Vale’s effort to increase the share of contracts linked to the index reference
price, which resulted in an increase of 41% in adjusted EBITDA for the Coal business,
amounting to US$ 104 million in 1Q18, despite lower volumes.
Vale announced a new dividend policy on March 29th, 2018, which was designed to be: (i)
both aggressive and sustainable over a long period of time, (ii) applicable in any price
scenario, and (iii) predictable as regards payment dates and the amount to be distributed.
The policy will be effective as of the results of the first half 2018. Therefore, according to
the new policy, the 1Q18 results translate into a minimum shareholder remuneration of US$
1.033 billion, which will be further increased by applying the threshold of 30% over the
adjusted EBITDA less sustaining investments to 2Q18 results, for payment in September
2018.
2 Measured by unit cash costs and expenses on a landed-in-China basis (and adjusted for quality, pellets margin differential and moisture, excluding ROM). 3 Considers the new allocation criteria for general and administrative expenses as described in the box “Managerial Allocation Changes” of this Earnings Release

5
Selected financial indicators US$ million 1Q18 4Q17 1Q17
Net operating revenues 8,603 9,167 8,515
Total costs and expenses 5,620 6,270 5,115
Adjusted EBIT 3,098 3,133 3,400
Adjusted EBIT margin (%) 36.0 34.2 39.9
Adjusted EBITDA 3,971 4,109 4,308
Adjusted EBITDA margin (%) 46.2 44.8 50.6
Iron ore - Platts' 62% IODEX 74.3 65.6 85.6
Net income (loss) 1,590 771 2,490
Underlying earnings 1,787 2,051 2,230
Underlying earnings per share on a fully diluted basis (US$ / share) 0.37 0.36 0.40
Net debt 14,901 18,143 22,777
Capital expenditures 890 977 1,113
6
Market overview
IRON ORE
Iron ore Platts IODEX 62% averaged US$ 74.3/dmt in 1Q18, an increase of 13% from 4Q17 as a
result of the continued healthy steel production worldwide.
The announcement of steel production by the National Bureau of Statistics in China for March of
74Mt is the highest level since August 2017, despite winter production restrictions in Northern
China. Looking at 1Q18 as a whole, Chinese steel production posted a strong increase of 5.4%
YoY.
China’s steel sector good performance in 1Q18 continued to be supported by strong property
construction and machinery. Besides, the extension of part of the capacity cuts in the 26+2 cities
to November 2018 provide a support not only for steel prices, but also for higher iron ore grade,
such as pellets and IOCJ, which are expected to be in good demand and commanding a premium
as production efficiency and stricter environmental policies are in emphasis in China, reinforcing
the structural change in premiums and discounts dynamics going forward.
The Short Term Range Outlook, recently published by World Steel Association, expects steel
demand in the developed world to increase by 1.8% in 2018, demand in emerging and developing
economies (excluding China) is expected to increase by 4.9% and a flat demand growth scenario
is forecast for China.
COAL
Seaborne Coking coal market started 2018 with Australian exports impacted by severe
weather, logistics constraints and lingering effects of a January derailment, which led prices to
US$ 263.0/t in the beginning of the year. As supply recovered in Australia and production grew
in China, prices corrected reaching US$ 197.5/t in March.
In thermal coal, Newcastle Fob Index peaked at US$ 110.8/t in February, from US$ 104.9/t in
early January, and has since eased back to US$ 90.7/t on the back of soft downstream demand
contributing to a build-up in inventories in China, in line with the end of the winter season.
Richards Bay Fob Index range traded between US$ 88.0/t to US$ 96.0/t, supported by healthy
demand in India and stronger prices in Asia.
NICKEL
LME nickel prices continued improving during 1Q18 to an average of US$ 13,276/t, from US$
11,584/t in 4Q17, representing the strongest pricing quarter since 1Q15.
Inventories declined indicating that the market remained in deficit in 1Q18.Total exchange
inventories (LME and SHFE) continued to decline closing at 368kt, by the end of 1Q18, down
44kt since the start of 2018. Demand for nickel in non-stainless steel applications continues to
be positive, particularly in the automotive, battery and aerospace sectors, while the oil and gas
sector continue to recover.

7
Global stainless-steel production in 1Q18 remained practically in line with 1Q17. Supply
increased approximately 3% in 1Q18 relative to 1Q17. This growth was in Class II material (e.g.
nickel pig iron NPI) (+5% YoY), while Class I material was relatively unchanged YoY. The nickel
market should remain volatile in the short-term and prices could go down from the recent high
levels that were seen in April.
Near-term outlook for nickel remains balanced, despite Indonesian ore exports continue to
increase. Demand for batteries in electric vehicles is likely to grow at an accelerated pace
relative to past years as electric vehicles penetrate the automotive market, although this still
represents a relatively small market for nickel. Overall, we expect the market to remain in deficit
in 2018, albeit smaller than 2017, given supply growth.
Capital investment for new projects and replacement volumes have been deferred within the
context of challenging economic conditions. The long-term outlook for nickel depends on the
demand evolution for electric vehicles. Nickel in electric vehicle batteries can become an
increasingly important source of demand growth particularly as battery chemistry favors higher
nickel content due to lower cost and higher energy density.
COPPER
LME copper price averaged US$ 6,961/t in 1Q18, slightly higher than the US$ 6,808/t in 4Q17,
being the strongest pricing quarter since 4Q14.
Copper inventories on the LME and COMEX both increased in 1Q18 vs. 4Q17 by 182 kt and
23 kt, respectively, while SHFE decreased 5.5 kt. Overall, inventories across all three
exchanges increased by 200 kt over the same period.
Global demand increased approximately 2% in 1Q18 vs. 1Q17. In China specifically demand
increased 2.2% in the same period and was driven primarily by higher infrastructure investment.
On the supply side, global refined copper production increased nearly 2% over 1Q18 vs. 1Q17.
A number of labor negotiations were concluded this quarter and this has reduced the potential
for supply disruption for the year, given that these settlements form precedent for the upcoming
negotiations.
Near-term outlook for copper remains balanced, with growing demand and with supply
expected to keep pace unlike in 2017, which saw supply growth lag demand given the
disruptions.
Over the long-term, copper demand is expected to grow, partly driven by the increasing
investment in renewable energy as well as infrastructure investments, while future supply
growth is challenged given declining ore grades and the need for greenfield investment.
COBALT
Cobalt price averaged US$82,238/t in 1Q18 an increase of 27% when compared to 4Q17. The
reason for this continuous run-up in price is growing demand from the electric vehicle battery market
together with anticipated future demand growth.
Cobalt is one of the key metals, besides nickel, to produce the highest energy density batteries for
use in electric vehicles. The cobalt market needs to grow significantly in order to feed into battery

8
demand – but unlike other metals, cobalt is predominantly a by-product of Nickel and Copper mine.
This means that it does not have the flexibility to respond to demand pressures as readily as other
commodities. Moreover, much of the cobalt comes and is found in the DRC.
Given views on electric vehicle demand, we remain optimistic for cobalt prices in the near term while
substitution threat from nickel has the potential to dampen expectations going into mid to long term.

9
Operating revenues
Net operating revenues in 1Q18 were US$ 8.603 billion, US$ 88 million higher than in 1Q17.
The increase in sales revenues was mainly due to higher sales volumes for Ferrous Minerals
(US$ 682 million) and higher sales prices for Base Metals (US$ 258 million), being partially
offset by lower Ferrous Minerals sales prices (US$ 652 million) and lower sales volumes for
Base Metals (US$ 221 million).
The flexibility of Vale’s supply chain led to record sales volumes for a first quarter of iron ore4
and pellets4 totaling 83.9 Mt in 1Q18, 7.7 Mt higher than in 1Q17.
Net operating revenue by destination US$ million 1Q18 % 4Q17 % 1Q17 %
North America 535 6.2 638 7.0 596 7.0
USA 334 3.9 351 3.8 284 3.3
Canada 157 1.8 269 2.9 303 3.6
Mexico 44 0.5 18 0.2 9 0.1
South America 1,016 11.8 1,307 14.3 942 11.1
Brazil 841 9.8 1,149 12.5 808 9.5
Others 175 2.0 158 1.7 134 1.6
Asia 4,944 57.5 5,473 59.7 4,996 58.7
China 3,594 41.8 3,824 41.7 3,818 44.8
Japan 605 7.0 633 6.9 511 6.0
South Korea 254 3.0 449 4.9 224 2.6
Others 491 5.7 567 6.2 443 5.2
Europe 1,468 17.1 1,260 13.7 1,500 17.6
Germany 396 4.6 374 4.1 377 4.4
Italy 102 1.2 162 1.8 123 1.4
Others 970 11.3 724 7.9 1,001 11.8
Middle East 369 4.3 301 3.3 293 3.4
Rest of the World 271 3.2 188 2.1 188 2.2
Total 8,603 100.0 9,167 100.0 8,515 100.0
4 Excludes ROM
10
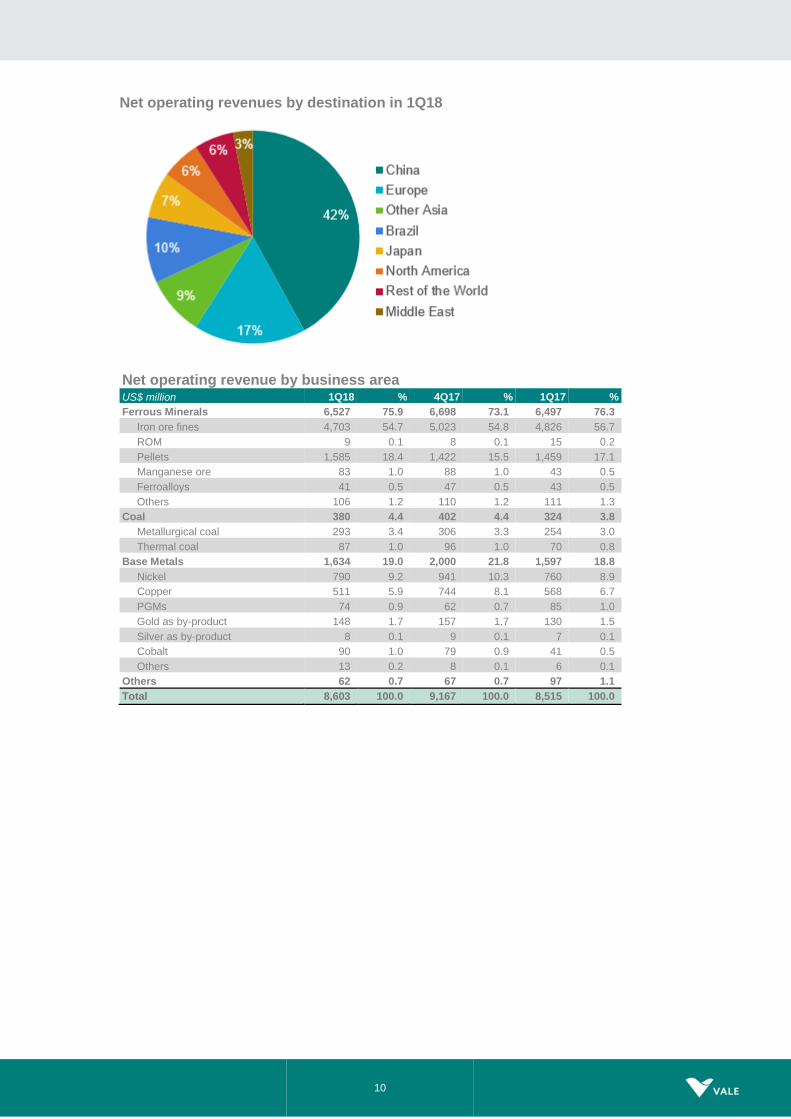
Net operating revenues by destination in 1Q18
Net operating revenue by business area US$ million 1Q18 % 4Q17 % 1Q17 %
Ferrous Minerals 6,527 75.9 6,698 73.1 6,497 76.3
Iron ore fines 4,703 54.7 5,023 54.8 4,826 56.7
ROM 9 0.1 8 0.1 15 0.2
Pellets 1,585 18.4 1,422 15.5 1,459 17.1
Manganese ore 83 1.0 88 1.0 43 0.5
Ferroalloys 41 0.5 47 0.5 43 0.5
Others 106 1.2 110 1.2 111 1.3
Coal 380 4.4 402 4.4 324 3.8
Metallurgical coal 293 3.4 306 3.3 254 3.0
Thermal coal 87 1.0 96 1.0 70 0.8
Base Metals 1,634 19.0 2,000 21.8 1,597 18.8
Nickel 790 9.2 941 10.3 760 8.9
Copper 511 5.9 744 8.1 568 6.7
PGMs 74 0.9 62 0.7 85 1.0
Gold as by-product 148 1.7 157 1.7 130 1.5
Silver as by-product 8 0.1 9 0.1 7 0.1
Cobalt 90 1.0 79 0.9 41 0.5
Others 13 0.2 8 0.1 6 0.1
Others 62 0.7 67 0.7 97 1.1
Total 8,603 100.0 9,167 100.0 8,515 100.0
11
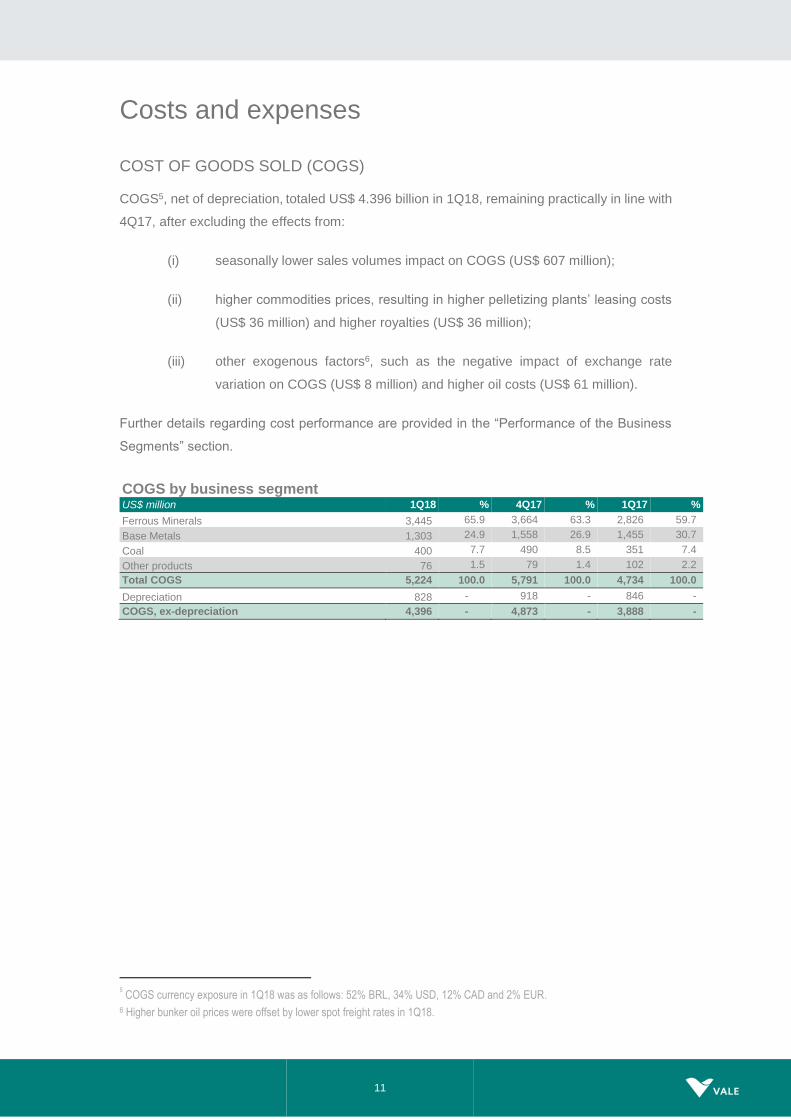
Costs and expenses
COST OF GOODS SOLD (COGS)
COGS5, net of depreciation, totaled US$ 4.396 billion in 1Q18, remaining practically in line with
4Q17, after excluding the effects from:
(i) seasonally lower sales volumes impact on COGS (US$ 607 million);
(ii) higher commodities prices, resulting in higher pelletizing plants’ leasing costs
(US$ 36 million) and higher royalties (US$ 36 million);
(iii) other exogenous factors6, such as the negative impact of exchange rate
variation on COGS (US$ 8 million) and higher oil costs (US$ 61 million).
Further details regarding cost performance are provided in the “Performance of the Business
Segments” section.
COGS by business segment US$ million 1Q18 % 4Q17 % 1Q17 %
Ferrous Minerals 3,445 65.9 3,664 63.3 2,826 59.7
Base Metals 1,303 24.9 1,558 26.9 1,455 30.7
Coal 400 7.7 490 8.5 351 7.4
Other products 76 1.5 79 1.4 102 2.2
Total COGS 5,224 100.0 5,791 100.0 4,734 100.0
Depreciation 828 - 918 - 846 -
COGS, ex-depreciation 4,396 - 4,873 - 3,888 -
5 COGS currency exposure in 1Q18 was as follows: 52% BRL, 34% USD, 12% CAD and 2% EUR.
6 Higher bunker oil prices were offset by lower spot freight rates in 1Q18.
12
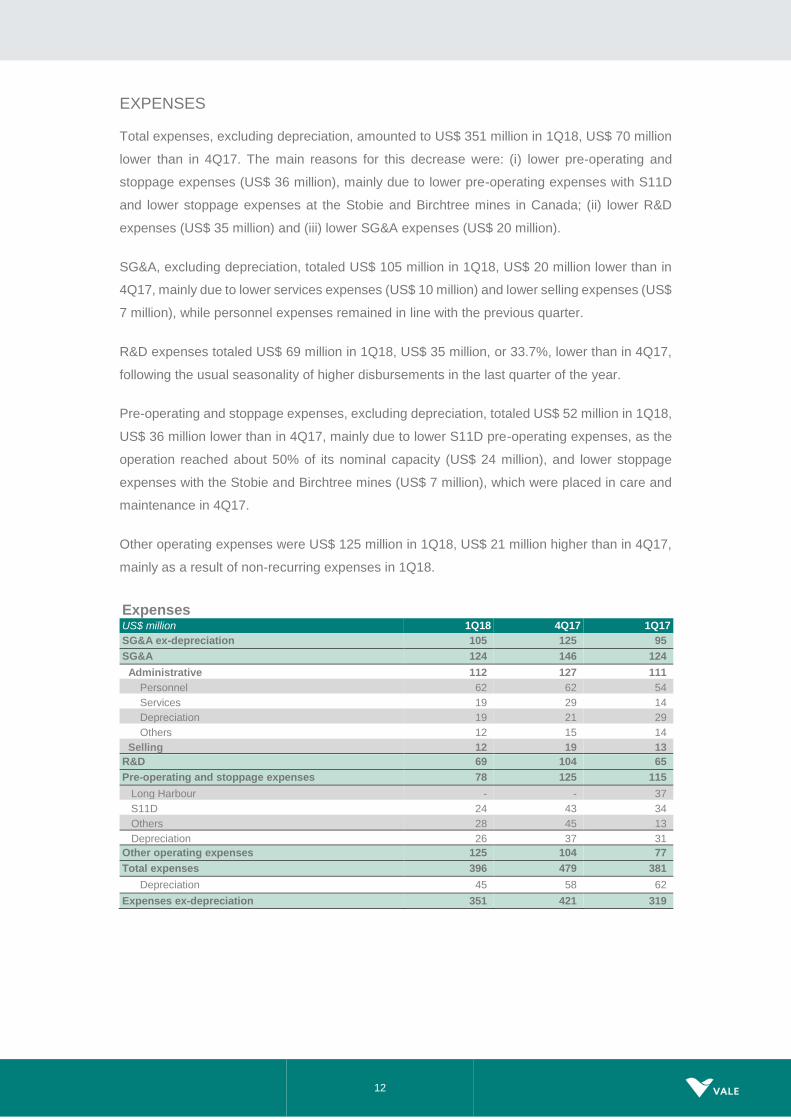
EXPENSES
Total expenses, excluding depreciation, amounted to US$ 351 million in 1Q18, US$ 70 million
lower than in 4Q17. The main reasons for this decrease were: (i) lower pre-operating and
stoppage expenses (US$ 36 million), mainly due to lower pre-operating expenses with S11D
and lower stoppage expenses at the Stobie and Birchtree mines in Canada; (ii) lower R&D
expenses (US$ 35 million) and (iii) lower SG&A expenses (US$ 20 million).
SG&A, excluding depreciation, totaled US$ 105 million in 1Q18, US$ 20 million lower than in
4Q17, mainly due to lower services expenses (US$ 10 million) and lower selling expenses (US$
7 million), while personnel expenses remained in line with the previous quarter.
R&D expenses totaled US$ 69 million in 1Q18, US$ 35 million, or 33.7%, lower than in 4Q17,
following the usual seasonality of higher disbursements in the last quarter of the year.
Pre-operating and stoppage expenses, excluding depreciation, totaled US$ 52 million in 1Q18,
US$ 36 million lower than in 4Q17, mainly due to lower S11D pre-operating expenses, as the
operation reached about 50% of its nominal capacity (US$ 24 million), and lower stoppage
expenses with the Stobie and Birchtree mines (US$ 7 million), which were placed in care and
maintenance in 4Q17.
Other operating expenses were US$ 125 million in 1Q18, US$ 21 million higher than in 4Q17,
mainly as a result of non-recurring expenses in 1Q18.
Expenses US$ million 1Q18 4Q17 1Q17
SG&A ex-depreciation 105 125 95
SG&A 124 146 124
Administrative 112 127 111
Personnel 62 62 54
Services 19 29 14
Depreciation 19 21 29
Others 12 15 14
Selling 12 19 13
R&D 69 104 65
Pre-operating and stoppage expenses 78 125 115
Long Harbour - - 37
S11D 24 43 34
Others 28 45 13
Depreciation 26 37 31
Other operating expenses 125 104 77
Total expenses 396 479 381
Depreciation 45 58 62
Expenses ex-depreciation 351 421 319

13
Costs and expenses US$ million 1Q18 4Q17 1Q17
Costs 5,224 5,791 4,734
Expenses 396 479 381
Total costs and expenses 5,620 6,270 5,115
Depreciation 873 976 908
Costs and expenses ex-depreciation 4,747 5,294 4,207
14
Adjusted earnings before interest, taxes, depreciation and amortization
Adjusted EBITDA was US$ 3.971 billion in 1Q18, remaining practically in line with 4Q17 despite
seasonally lower volumes, as a result of higher realized prices across the businesses.
Quarterly adjusted EBITDA for Ferrous Minerals was US$ 3.408 billion in 1Q18, benefiting from
contributions of higher quality and average premium, which boosted Vale’s realized CFR/FOB
wmt price, reflecting: (i) the flexibility of the operations; (ii) the active supply chain management;
and (iii) the increase of premium products share in total sales.
Adjusted EBITDA of the Base Metals business segment was US$ 644 million in 1Q18, mainly
as a result of higher nickel realized prices. Realized prices reflected Vale’s positioning on nickel
products with higher margins and the optimization of the production lines, leading to higher
premiums. That, along with the overall increase of the LME nickel benchmark price, resulted in
an increase in price realization compared to 4Q17.
Adjusted EBITDA of the Coal business segment was US$ 104 million in 1Q18, US$ 30 million
higher than in 4Q17, mainly due to the higher average realized price.
Other business segments Adjusted EBITDA was negative US$ 185 million, improving US$ 22
million vs. 4Q17, mainly due to lower services and R&D expenses in 1Q18.

15
Adjusted EBITDA US$ million 1Q18 4Q17 1Q17
Net operating revenues 8,603 9,167 8,515
COGS (5,224) (5,791) (4,734)
SG&A (124) (146) (124)
Research and development (69) (104) (65)
Pre-operating and stoppage expenses (78) (125) (115)
Other operational expenses (80) (104) (77)
Dividends and interests on associates and JVs 70 236 -
Adjusted EBIT 3,098 3,133 3,400
Depreciation, amortization & depletion 873 976 908
Adjusted EBITDA 3,971 4,109 4,308
Iron ore - Platts' 62% IODEX 74.3 65.6 85.6
Adjusted EBITDA by business area US$ million 1Q18 4Q17 1Q17
Ferrous Minerals 3,408 3,427 4,048
Coal 104 74 69
Base Metals 644 815 442
Others (185) (207) (251)
Total 3,971 4,109 4,308
Iron ore - Platts' 62% IODEX 74.3 65.6 85.6
16
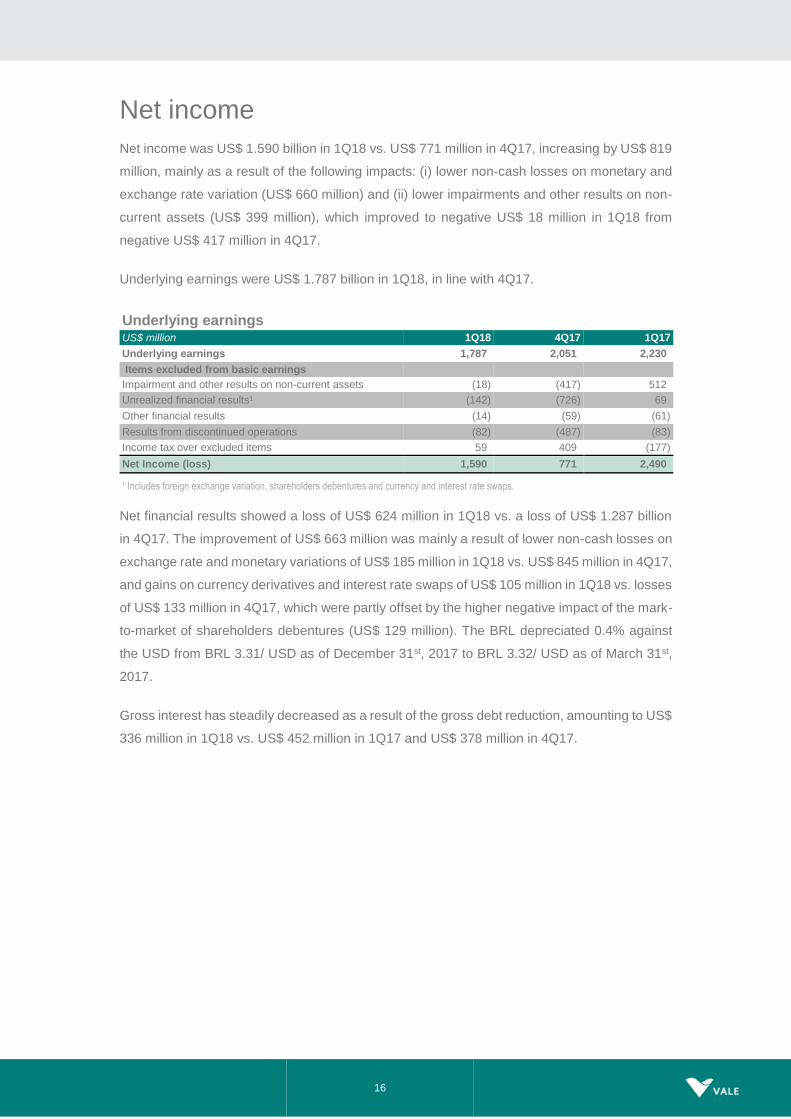
Net income
Net income was US$ 1.590 billion in 1Q18 vs. US$ 771 million in 4Q17, increasing by US$ 819
million, mainly as a result of the following impacts: (i) lower non-cash losses on monetary and
exchange rate variation (US$ 660 million) and (ii) lower impairments and other results on non-
current assets (US$ 399 million), which improved to negative US$ 18 million in 1Q18 from
negative US$ 417 million in 4Q17.
Underlying earnings were US$ 1.787 billion in 1Q18, in line with 4Q17.
Underlying earnings US$ million 1Q18 4Q17 1Q17
Underlying earnings 1,787 2,051 2,230
Items excluded from basic earnings
Impairment and other results on non-current assets (18) (417) 512
Unrealized financial results¹ (142) (726) 69
Other financial results (14) (59) (61)
Results from discontinued operations (82) (487) (83)
Income tax over excluded items 59 409 (177)
Net Income (loss) 1,590 771 2,490
¹ Includes foreign exchange variation, shareholders debentures and currency and interest rate swaps.
Net financial results showed a loss of US$ 624 million in 1Q18 vs. a loss of US$ 1.287 billion
in 4Q17. The improvement of US$ 663 million was mainly a result of lower non-cash losses on
exchange rate and monetary variations of US$ 185 million in 1Q18 vs. US$ 845 million in 4Q17,
and gains on currency derivatives and interest rate swaps of US$ 105 million in 1Q18 vs. losses
of US$ 133 million in 4Q17, which were partly offset by the higher negative impact of the mark-
to-market of shareholders debentures (US$ 129 million). The BRL depreciated 0.4% against
the USD from BRL 3.31/ USD as of December 31st, 2017 to BRL 3.32/ USD as of March 31st,
2017.
Gross interest has steadily decreased as a result of the gross debt reduction, amounting to US$
336 million in 1Q18 vs. US$ 452 million in 1Q17 and US$ 378 million in 4Q17.

17
Financial results US$ million 1Q18 4Q17 1Q17
Financial expenses (647) (562) (1,115)
Gross interest (336) (378) (452)
Capitalization of interest 60 73 103
Tax and labor contingencies 9 (10) (18)
Shareholder debentures (183) (54) (412)
Others (139) (124) (210)
Financial expenses (REFIS) (58) (69) (126)
Financial income 118 149 64
Derivatives¹ 90 (29) 209
Currency and interest rate swaps 105 (133) 247
Others² (bunker oil, commodities, etc) (15) 104 (38)
Foreign Exchange (64) (540) 236
Monetary variation (121) (305) (7)
Financial result, net (624) (1,287) (613)
¹The net derivatives gain of US$ 90 million in 1Q18 is comprised of settlement losses of US$ 25 million and mark-to-market gain of US$ 115 million.
² Other derivatives include bunker oil derivatives which, for 1Q18 were 0 (zero).
Equity income from affiliated companies
Equity income from affiliated companies showed a gain of US$ 85 million in 1Q18 vs. a loss of
US$ 66 million in 4Q17. The main contributors to equity income were the leased pelletizing
companies in Tubarão (US$ 77 million), CSI (US$ 21 million), Aliança Geração de Energia (US$
19 million), MRS (US$ 12 million), and Aliança Norte Energia (US$ 7 million), which were partly
offset by losses from CSP (US$ 42 million), partly due to the non-cash impact of the BRL
depreciation on its USD denominated debt, and VLI (US$ 13 million), due to seasonally lower
volumes.
18
Shareholders’ remuneration
Vale paid in March 2018 R$ 4.7 billion (US$ 1.4 billion) of shareholder remuneration in the form
of interest on capital. Vale’s Board of Directors approved the distribution of R$ 2.2 billion in
December 2017 and R$ 2.5 billion in February 2018, which is equivalent to the minimum
established by Brazilian corporate law. The decision to pay the minimum requirement is
consistent with Vale’s primary focus to reduce its net debt to US$ 10 billion7
Following Vale’s deleveraging path, on March 29th, 2018 Vale announced a new shareholder
remuneration policy that was designed to be both aggressive and sustainable over a long period
of time, to be applied in any price scenario, allowing further predictability regarding the payment
dates and the amount to be distributed. The new policy will be effective as of the results of the
first half 2018. Therefore, according to the new policy, the 1Q18 result translate into a minimum
shareholder remuneration of US$ 1.033 billion, which will be further increased by applying the
threshold of 30% over adjusted EBITDA less sustaining investments to 2Q18 results, for
payment in September 2018.
7 Net of dividend payment.

19
Investments8
Capital expenditures have reached the lowest level for a first quarter since 2005, totaling US$
890 million in 1Q18 with US$ 361 million in project execution and US$ 529 million in sustaining
capital.
Capital expenditures decreased US$ 87 million when compared to the US$ 977 million spent
in 4Q17, mainly due to a lower sustaining capex following the usual seasonality of
disbursements.
The guidance for investments remains as announced at the last Vale Day at US$ 3.8 billion for
2018, with CLN S11D as the main capital project being developed.
Project Execution and Sustaining by business area US$ million 1Q18 4Q17 1Q17
Ferrous Minerals 655 680 830
Coal 33 33 56
Base Metals 197 259 208
Power generation 4 6 14
Others 1 - 5
Total 890 977 1,113
Project execution
Investment in project execution totaled US$ 361 million in 1Q18, in line with 4Q17.
Ferrous Minerals accounted for about 92% of the total investment in project execution in 1Q18.
About 98% of the US$ 333 million invested in Ferrous Minerals in 1Q18 relates to the S11D
project and the expansion of its associated infrastructure (US$ 325 million).
Project execution by business area US$ million 1Q18 4Q17 1Q17
Ferrous Minerals 333 315 528
Coal 9 5 32
Base Metals 15 23 10
Power generation 4 5 13
Others 1 0 5
Total 361 347 587
S11D (including mine, plant and associated logistics – CLN S11D) achieved combined physical
progress of 95% in 1Q18 with the mine site concluded and 91% progress at the logistic
infrastructure sites.
8 Does not include investments in Fertilizers

20
The duplication of the railway reached 85% physical progress with 542 Km duplicated and
together with the successful S11D mine and plant ramp-up enabled 1Q18 production volume
to reach more than half of the total 2017 production.
S11D Logistics – Duplication of the railway
Progress indicator9
Sustaining capex
Sustaining capital expenditure totaled US$ 529 million in 1Q18, decreasing 16.2% when
compared to 4Q17, mainly due to the usual seasonality in 4Q17. The Ferrous Minerals and
Base Metals business segments accounted for 61% and 34%, respectively, of total sustaining
capex in 1Q18.
9 Pre-operating expenses were not included in the estimated capex for the year, although included in the total estimated capex
column, in line with Vale’s Board of Directors approvals. Estimated capex for the year is only reviewed once a year.
Project Capacity
(Mtpy)
Estimated
start-up
Executed capex
(US$ million)
Estimated capex
(US$ million) Physical
progress 2018 Total 2018 Total
Ferrous Minerals projects
CLN S11D 230 (80)a 1H14 to 2H19 277 6,852 647 7,850b 91%
a Net additional capacity. b Original capex budget of US$ 11.582 billion .

21
Vale’s strategy to adopt a rigorous capital allocation process based on returns was translated
into: (i) lower nickel sustaining investments, as non-performing assets in nickel were placed in
care and maintenance, and (ii) higher investment in Ferrous Minerals due to the restart of the
pelletizing plants, leveraging on the higher pellet premium, as shown in the evolution of
sustaining investments by business.
Evolution of sustaining capital by business
Sustaining capex in the Base Metals business segment was mainly for: (i) operational
improvements (US$ 107 million); (ii) enhancement in the current standards of health and safety
and environmental protection (US$ 60 million); and (iii) maintenance improvements and
expansion of tailings dams (US$ 9 million).
Sustaining capital for the Ferrous Minerals business segment included, among others: (i)
enhancements and replacements in operations (US$ 226 million); (ii) improvement in the
current standards of health and safety, social and environmental protection (US$ 43 million);
and (iii) maintenance, improvement and expansion of tailings dams (US$ 38 million).
Maintenance of railways and ports in Brazil and Malaysia accounted for US$ 77 million.
In 1Q18, Vale’s Executive Board approved a multi-year program on digital transformation and
automation of its iron ore and logistics operations. In 2018, the first phase of the program will
focus on: (i) asset performance, with autonomous trucks; (ii) maintenance, with predictive
analysis as well as automation in inspection and maintenance; (iii) workforce effectiveness, with
planning and process optimizations; and (iv) supply chain, with real-time performance
monitoring and optimization. These investments will be charged to sustaining capex and will be
disbursed from 2018 until 2023, totaling US$ 250 million. The objective of the program is circa
US$ 0,50/t cost reductions.

22
The projects for restarting pellet plants are on schedule, with the start-ups of the Tubarão I and
São Luis pellet plants envisioned for 2Q18 and 3Q18, respectively. The Tubarão II pellet started
up in January 2018 ahead of time and on budget. The three projects total US$ 150 million, and
involve mainly revitalization work at the pellet plants and will be charged to sustaining
investments.
Sustaining capex by type - 1Q18
US$ million Ferrous Minerals
Coal Base Metals TOTAL
Operations 226 18 107 351
Waste dumps and tailing dams 38 - 9 47
Health and Safety 37 1 11 49
Social investments and environmental protection 6 4 49 59
Administrative & Others 16 1 5 22
Total 323 24 181 529
Sustaining capex by business area US$ million 1Q18 4Q17 1Q17
Ferrous Minerals 322 365 302
Coal 24 28 25
Base Metals 181 236 198
Power generation 0 1 1
Others 0 0 -
Total 529 631 526
Corporate social responsibility
Investments in corporate social responsibility totaled US$ 114 million in 1Q18, of which US$ 79
million dedicated to environmental protection and conservation and US$ 35 million to social
projects.
Portfolio Management
Vale concluded and received the proceeds for the Project Finance for the Nacala Logistics
Corridor (NLC) in March. The amount totaled US$ 2.6 billion as a takeout of part of the
shareholder loans conceded for the construction of NLC, net of certain related premiums and
fees paid or to be paid by NLC.
Vale concluded the sale of its Fertilizer business, excluding the assets in Cubatão, to The
Mosaic Company in January 2018.
The sale of Vale Cubatão to Yara, for a total consideration of US$ 255 million, is still subject to
approval by Brazilian antitrust authorities.

23
Free cash flow
Free cash flow was US$ 5.015 billion in 1Q18.
Cash generated from operations was US$ 2.943 billion in 1Q18, US$ 1.028 billion lower than
the adjusted EBITDA, mainly due to disbursements in 1Q18 related to profit sharing and
suppliers, already provisioned during 2017, thus not affecting EBITDA in 1Q18.
Free Cash Flow 1Q18
US$ million
24
Debt indicators Vale delivered a substantial reduction in net debt down to US$ 14.901 billion as of March 31st,
2018, equivalent to a net debt to LTM adjusted EBITDA ratio of 1.0x. The debt decrease was
supported by strong cash generation and cash inflows of US$ 3.7 billion from the conclusion of
the Fertilizers deal with Mosaic and from the Project Finance at Nacala Corridor in 1Q18,
reinforcing Vale’s goal to reach the US$ 10 billion net debt mark in the short term. The
significant debt reduction was achieved despite payment of shareholders’ remuneration of US$
1.4 billion on March 15th, 2018.
Gross debt amounted to US$ 20.276 billion as of March 31st, 2018, decreasing by US$ 2.213
billion from December 31st, 2017 and by US$ 9.294 billion from March 31st, 2017. The decrease
in gross debt against the end of last quarter was mainly due to net debt repayments10 of US$
2.546 billion in 1Q18.
In March, 2018, Vale Overseas Limited (Vale Overseas) exercised the right to redeem all the
outstanding 4.625% guaranteed notes due 2020 and commenced an offer to purchase its
5.875% guaranteed notes due 2021 and its outstanding 4.375% guaranteed notes due 2022.
The offers to purchase the 2021 and 2022 notes, totaling a principal amount of US$ 1.750
billion, were concluded in 1Q18 and the redemption of the 2020 notes, with a principal amount
of US$ 499 million, was concluded on April 17th, 2018. Considering the redemption of the 2020
notes, Vale’s gross debt is equivalent to a pro forma value of US$ 19.8 billion.
10 Debt repayments less debt additions. Include interest payments.
25
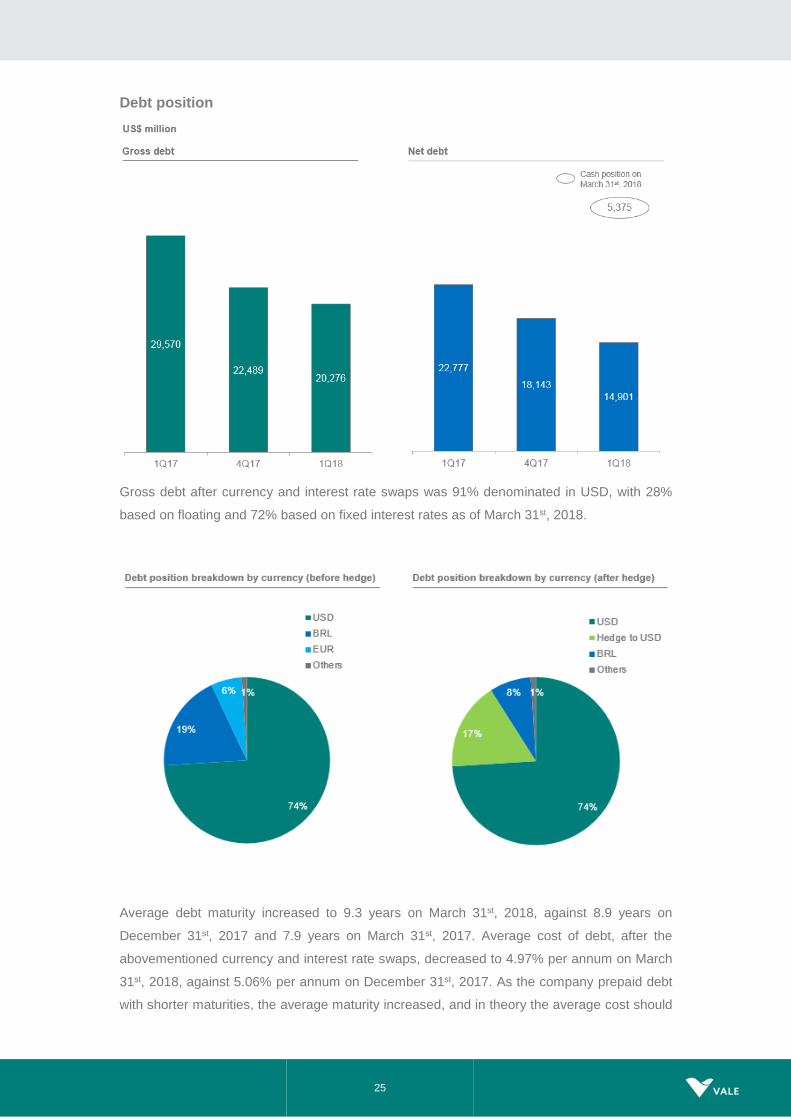
Debt position
Gross debt after currency and interest rate swaps was 91% denominated in USD, with 28%
based on floating and 72% based on fixed interest rates as of March 31st, 2018.
Average debt maturity increased to 9.3 years on March 31st, 2018, against 8.9 years on
December 31st, 2017 and 7.9 years on March 31st, 2017. Average cost of debt, after the
abovementioned currency and interest rate swaps, decreased to 4.97% per annum on March
31st, 2018, against 5.06% per annum on December 31st, 2017. As the company prepaid debt
with shorter maturities, the average maturity increased, and in theory the average cost should

26
have increased. However, the average cost was actually reduced due to refinancing of bank
loans at lower interest rates.
Interest coverage, measured by the ratio of LTM11 adjusted EBITDA to LTM gross interest, was
9.5x in 1Q18, higher than the 9.0x in 4Q17 and 7.9x in 1Q17.
Leverage, measured by gross debt to LTM adjusted EBITDA, decreased to 1.4x as of March
31st, 2018 from 1.5x as of December 31st, 2017 and from 2.1x as of March 31st, 2017. Measuring
by net debt to LTM adjusted EBITDA, leverage decreased to 1.0x as of March 31st, 2018 from
1.2x as of December 31st, 2017 and from 1.6x as of March 31st, 2017.
Debt indicators US$ million 1Q18 4Q17 1Q17
Total debt 20,276 22,489 29,570
Net debt 14,901 18,143 22,777
Total debt / adjusted LTM EBITDA (x) 1.4 1.5 2.1
Net debt / adjusted LTM EBITDA (x) 1.0 1.2 1.6
Adjusted LTM EBITDA / LTM gross interest (x) 9.5 9.0 7.9
11 Last twelve months

27
Changes in managerial allocation
Vale conducted a benchmark study with its peers to determine the practices for allocating corporate expenses and
classifying special events. As a result, Vale decided to promote changes in its reporting so investors would be able
to better compare Vale’s adjusted EBITDA to its peers. According to market practices, general & administrative
(G&A) expenses are not attributable to any operational segment and do not impact performance of the business
areas. Special events are usually non-recurring and non-operational events and should not impact the adjusted
EBITDA.
Vale’s changes are supported by market practices and are also intended to exclude the volatility of non- recurring
events on its results, in order to reflect the proper operational result of each business. Details on the proposed
changes are as follows:
(i) G&A expenses
From 1Q18 onwards, Vale allocates general and administrative expenses in "Others", because these expenses are
not directly related to the performance of each business segment. The new allocation criterion is in line with the one
adopted by other companies in the industry, allowing a better comparison of Vale’s business segments performance
with its peers. The prior periods were restated to reflect this allocation change and the tables considering the former
and new allocation criteria are presented in Annex 4 of this performance report.
(ii) Special events
From 1Q18 onwards, Vale classifies non-recurring and non-operational effects on the performance of the company
as special events, not impacting its adjusted EBITDA. In 1Q18, Vale identified as a special event the provision for
litigation of US$ 45 million, as Vale’s assessment of the likelihood of loss for various litigations have been updated.
In the opposite direction, in 1Q17, Vale concluded the equity transaction with Mitsui to sell 15% of its stake in Vale
Mozambique and 50% of its stake in the Nacala Logistics Corridor and recognized a gain in the income statement
of US$ 515 million. This transaction was non-recurring and, therefore, classified as a special event, not affecting
Vale’s adjusted EBITDA.
Additionally, there were slight adjustments in the calculation of the iron ore fines and pellets EBITDA break-even.
Starting in 1Q18, sustaining investments for pellets are added to the iron ore fines sustaining investments component,
instead in the pellet adjustment component. As a result, the iron ore fines and pellets EBITDA break-even changed
but the iron ore fines and pellets cash break-even landed in China, including the sustaining investments, remained
the same. The prior periods were restated to reflect this allocation change.

28
Performance of the business segments
Segment information ― 1Q18, as per footnote of financial statements Expenses
US$ million Net
Revenues Cost¹
SG&A and others1,2
R&D¹ Pre operating
& stoppage¹
Dividends and interests on associates
and JVs
Adjusted EBITDA
Ferrous Minerals 6,527 (3,038) (18) (25) (38) - 3,408
Iron ore fines 4,703 (2,078) (13) (20) (35) - 2,557
ROM 9 - - - - - 9
Pellets 1,585 (813) (1) (5) (3) - 763
Others ferrous 106 (73) (3) - - - 30
Mn & Alloys 124 (74) (1) - - - 49
Coal 380 (335) 2 (3) - 60 104
Base Metals 1,634 (953) (16) (13) (8) - 644
Nickel3 1,132 (705) (15) (9) (8) - 395
Copper4 502 (248) (1) (4) - - 249
Others 62 (70) (153) (28) (6) 10 (185)
Total 8,603 (4,396) (185) (69) (52) 70 3,971
¹ Excluding depreciation and amortization 2 General and administrative expenses are allocated in “Others”
3 Including copper and by-products from Vale’s nickel operations
4 Including by-products from our copper operations

29
Ferrous Minerals
Adjusted EBITDA of the Ferrous Minerals business segment was US$ 3.408 billion in 1Q18,
due to contributions of higher quality and better average premium, which boosted Vale’s
realized CFR/FOB wmt price, reflecting: (i) the flexibility of the operations; (ii) the active supply
chain management; and (iii) the increase of premium products share in total sales. Additionally,
Vale’s realized CFR/FOB wmt price was also supported by strong market premiums.
Adjusted EBITDA remained practically in line with 4Q17, despite the impact of seasonally lower
sales volumes (US$ 341 million), mainly as a result of higher premiums (US$ 85 million of iron
ore fines and US$ 138 million of pellets) and of the net effect of the 13% increase of the Platts
IODEX in revenues and the related pro-cyclical effect in costs (US$ 152 million).
Some of Vale’s costs vary with iron ore prices and increased by US$ 86 million in line with a
stronger price environment, such as: (i) pelletizing plant leasing costs, which are adjusted
based on pellet premiums; (ii) iron ore royalties; and (iii) third party purchased products.
However, Vale was able to capture the benefits of the higher iron ore prices, with a much greater
impact on revenues, which increased by US$ 238 million, resulting in the abovementioned net
effect of US$ 152 million.
EBITDA variation 4Q17 vs. 1Q18 – Ferrous Minerals business segment

30
Ferrous Minerals EBITDA margin12
Adjusted EBITDA per ton for Ferrous Minerals, excluding Manganese and Ferroalloys, was
US$ 39.8/t in 1Q18, 10.3% higher than the US$ 36.1/t recorded in 4Q17, mainly as a result of
Vale’s sales mix improvement and higher pellet premiums.
Iron ore fines (excluding Pellets and ROM)
EBITDA13
Adjusted EBITDA of iron ore fines was US$ 2.557 billion in 1Q18, remaining practically in line
with 4Q17, despite seasonally lower sales volumes (US$ 302 million), which were partially
offset by higher IODEX (US$ 143 million) and higher quality and premiums (US$ 85 million).
SALES REVENUES AND VOLUME
Net sales revenues of iron ore fines, excluding pellets and Run of Mine (ROM), decreased to
US$ 4.703 billion in 1Q18 vs. US$ 5.023 billion in 4Q17, as a result of the seasonally lower
sales volumes (US$ 548 million) which were partially offset by higher sales prices (US$ 228
million).
Sales volumes of iron ore fines totaled 70.8 Mt in 1Q18, achieving the best first quarter ever,
as a result of the flexibility and active supply chain management. Sales were 11.0% lower than
in 4Q17, but nonetheless offset the usual seasonality in production volumes, which decreased
12.2%.
CFR sales of iron ore fines totaled 50.0 Mt in 1Q18, representing 71% of all iron ore fines sales
volumes in 1Q18, remaining in line with the share of CFR sales in 4Q17.
Vale’s sales mix improved substantially year-on-year, as a result of S11D’s ramp-up and the
decision to progressively reduce low grade ore production. The share of pellets, Carajás and
blended ores increased to 76% in 1Q18 from 67% of total sales in 1Q17 and 70% in 4Q17.
Consequently, Vale’s product sales mix leveraged the impact of rising market premiums, driving
the increase in the contributions of quality and average premium to Vale’s realized CFR/FOB
wmt price that amounted to US$ 5.2/t in 1Q18 vs. US$ 2.3/t in 1Q17 and US$ 3.9/t in 4Q17.
12 Excluding Manganese and Ferroalloys.
13 Considers the new allocation criteria for general and administrative expenses as described in the box “Managerial Allocation Changes” of this
Earnings Release.

31
Sales composition
Net operating revenue by product US$ million 1Q18 4Q17 1Q17
Iron ore fines 4,703 5,023 4,826
ROM 9 8 15
Pellets 1,585 1,422 1,459
Manganese & Ferroalloys 124 135 86
Others 106 110 111
Total 6,527 6,698 6,497
Volume sold
‘000 metric tons 1Q18 4Q17 1Q17
Iron ore fines 70,811 79,603 63,682
ROM 410 355 1,636
Pellets 13,125 13,579 12,582
Manganese ore 338 740 196
Ferroalloys 34 34 30
REALIZED PRICES
Pricing system breakdown

32
Price realization – iron ore fines
Vale’s CFR dmt reference price for iron ore fines (ex-ROM) was US$ 76.3/t, US$ 2.0/t higher
than the IODEX, as a result of higher quality and premiums (US$ 5.2/t), despite the negative
effect of the pricing system adjustments (US$ 3.1/t).
Vale’s CFR/FOB wmt price for iron ore fines (ex-ROM) increased 5.2% (US$ 3.3/t), after
adjusting for moisture and the effect of FOB sales, which accounted for 29% of total sales
volumes in 1Q18. CFR/FOB wmt price increase in 1Q18 vs. 4Q17 was lower than the IODEX
variation during the same period due to the negative net impact of the pricing system
adjustments of US$ 6.3/t (adjustments were a positive of US$ 3.1/t in 4Q17 vs. a negative of
US$ 3.2/t in 1Q18).
The ‘Premiums/Discounts and commercial conditions’ increased by US$ 1.2/t, from US$ 1.9/t
in 4Q17 to US$ 3.1/t in 1Q18, mainly as a result of the abovementioned improvement in the
sales mix.
Price realization in 1Q18 was impacted by:
Provisional prices set at the end of 4Q17 at US$ 72.8/t, which were later adjusted based
on the price of delivery in 1Q18, and positively impacted prices in 1Q18 by US$ 1.2/t
compared to a negative impact of US$ 0.5/t in 4Q17 as a result of higher realized prices
of the indexes in 1Q18 compared to the indexes anticipated in the forward curve and
provisioned in 4Q17.
33
Provisional prices set at the end of 1Q18 at US$ 64.8/t vs. the IODEX average of US$
74.3/t in 1Q18, which negatively impacted prices in 1Q18 by US$ 3.3/t compared to a
positive impact of US$ 2.4/t in 4Q17.
Quarter-lagged contracts, priced at US$ 65.3/t based on the average prices for Sep-
Oct-Nov, which negatively impacted prices in 1Q18 by US$ 0.8/t compared to a positive
impact of US$ 0.2/t in 4Q17.
Iron ore sales of 24.8 Mt, or 35% of Vale’s sales mix, were recorded under the provisional
pricing system, which was set at the end of 1Q18 at US$ 64.8/t. The final prices of these sales
and the required adjustment to sales revenues will be determined and recorded in 2Q18.
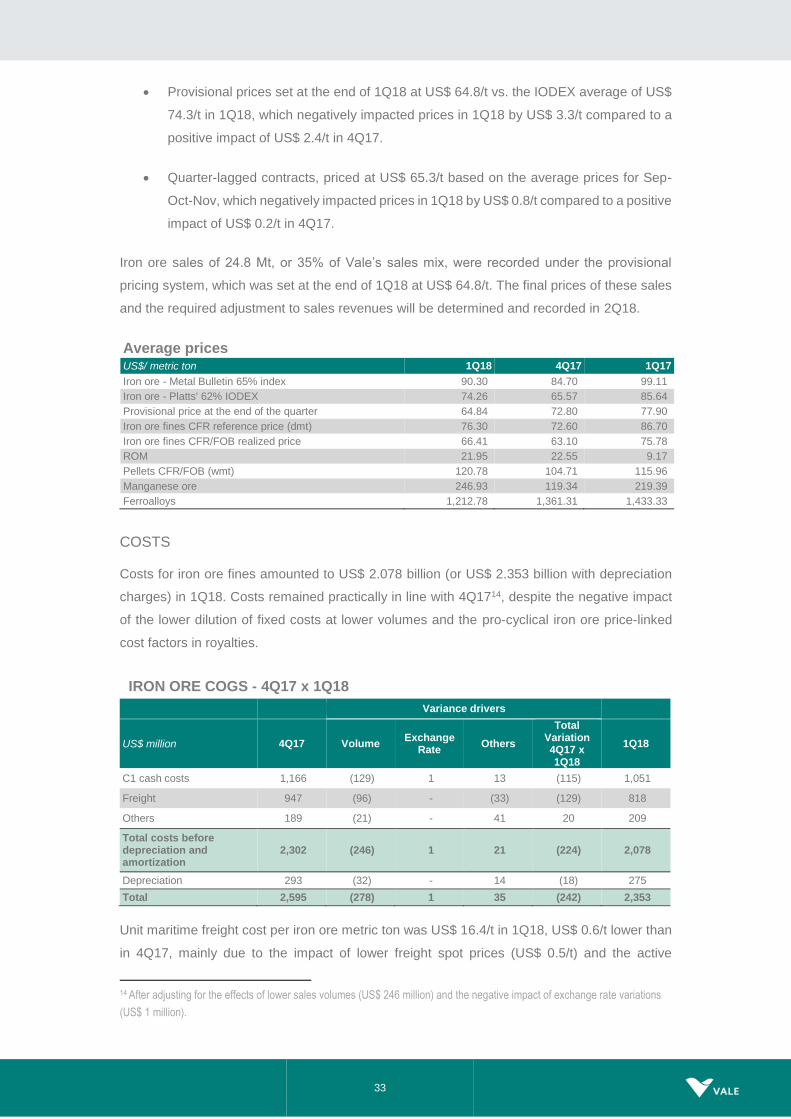
Average prices US$/ metric ton 1Q18 4Q17 1Q17
Iron ore - Metal Bulletin 65% index 90.30 84.70 99.11
Iron ore - Platts' 62% IODEX 74.26 65.57 85.64
Provisional price at the end of the quarter 64.84 72.80 77.90
Iron ore fines CFR reference price (dmt) 76.30 72.60 86.70
Iron ore fines CFR/FOB realized price 66.41 63.10 75.78
ROM 21.95 22.55 9.17
Pellets CFR/FOB (wmt) 120.78 104.71 115.96
Manganese ore 246.93 119.34 219.39
Ferroalloys 1,212.78 1,361.31 1,433.33
COSTS
Costs for iron ore fines amounted to US$ 2.078 billion (or US$ 2.353 billion with depreciation
charges) in 1Q18. Costs remained practically in line with 4Q1714, despite the negative impact
of the lower dilution of fixed costs at lower volumes and the pro-cyclical iron ore price-linked
cost factors in royalties.
IRON ORE COGS - 4Q17 x 1Q18
Variance drivers
US$ million 4Q17 Volume Exchange
Rate Others
Total Variation 4Q17 x 1Q18
1Q18
C1 cash costs 1,166 (129) 1 13 (115) 1,051
Freight 947 (96) - (33) (129) 818
Others 189 (21) - 41 20 209
Total costs before depreciation and amortization
2,302 (246) 1 21 (224) 2,078
Depreciation 293 (32) - 14 (18) 275
Total 2,595 (278) 1 35 (242) 2,353
Unit maritime freight cost per iron ore metric ton was US$ 16.4/t in 1Q18, US$ 0.6/t lower than
in 4Q17, mainly due to the impact of lower freight spot prices (US$ 0.5/t) and the active
14 After adjusting for the effects of lower sales volumes (US$ 246 million) and the negative impact of exchange rate variations
(US$ 1 million).

34
management of the supply chain (US$ 0.4/t), which were partially offset by higher bunker oil
prices (US$ 0.5/t)15. Supply chain management has consistently improved, resulting in
smoother process interfaces and better allocation of the fleet at Vale’s disposal, thus reducing
freight costs.
C1 CASH COST
C1 cash cost FOB port per metric ton for iron ore fines ex-royalties remained practically in line
with 4Q17 at US$ 14.8/t in 1Q18, despite the negative impacts of fixed cost dilution at lower
volumes, which were practically offset by the successful ramp-up of S11D.
C1 cash cost FOB port per metric ton of iron ore fines ex-royalties in BRL remained practically
in line at R$ 48.3/t in 1Q18, as the exchange rate remained stable vs. 4Q17 and also due to
the abovementioned effects.
Expenses per ton in BRL increased to R$ 3.1/t in 1Q18 from the R$ 2.7/t recorded in 4Q17 due
to the effect of dilution on seasonally lower sales volumes.
Iron Ore Fines Costs and Expenses in BRL
R$/t 1Q18 4Q17 1Q17
C1 Cash Costs¹ 48.3 47.7 46.1
Expenses1,2 3.1 2.7 (0.5)3
Total 51.4 50.4 45.6
¹ Net of depreciation. 2 Considers the new allocation criteria for general and administrative expenses as described in the box “Managerial Allocation Changes” of this Earnings Release. 3 Expenses per ton totaled a positive amount in 1Q17, mainly due to the recovery of the insurance associated with the disassembly of the “Fábrica Nova – Timbopeba” long distance belt conveyor.
Iron ore fines cash cost and freight
1Q18 4Q17 1Q17
Costs (US$ million)
COGS, less depreciation and amortization 2,078 2,301 1,677
Distribution costs 53 54 25
Maritime freight costs 818 947 608
FOB at port costs (ex-ROM) 1,207 1,300 1,044
FOB at port costs (ex-ROM and ex-royalties) 1,051 1,166 937
Sales volumes (Mt)
Total iron ore volume sold 71.2 80.0 65.3
Total ROM volume sold 0.4 0.4 1.6
Volume sold (ex-ROM) 70.8 79.6 63.7
Vale's iron ore cash cost (ex-ROM, ex-royalties), FOB (US$ /t) 14.8 14.6 14.7
Freight
Maritime freight costs 818 947 608
% of CFR sales 71% 70% 67%
Volume CFR (Mt) 50.0 55.6 42.8
Vale's iron ore unit freight cost (US$/t) 16.4 17.0 14.2
15 The average bunker oil price in Vale’s freight portfolio increased from US$ 342/t in 4Q17 to US$ 364/t in 1Q18.

35
EXPENSES16
Iron ore expenses, net of depreciation, amounted to US$ 68 million in 1Q18, 29.2% lower than
in 4Q17. Sales and other expenses totaled US$ 13 million in 1Q18, decreasing US$ 3 million
vs. 4Q17, mainly due to lower expenses with Vale’s commercial offices abroad. R&D amounted
to US$ 20 million, 25.9% lower than in 4Q17, following the usual seasonality of disbursements.
Pre-operating and stoppage expenses, net of depreciation, amounted to US$ 35 million,
decreasing US$ 18 million vs. 4Q17, mainly as a result of lower S11D pre-operating expenses.
Evolution of iron ore fines cash cost, freight and expenses
Expenses and royalties per ton increased to US$ 3.2/t in 1Q18 from US$ 2.5/t in 4Q17, mainly
as a result of higher royalties and the effect of seasonally lower sales volumes on the expenses
dilution. Royalties increased as a result of the pro-cyclical effect of higher iron ore prices and
higher royalty rates, effective as of November 17th, 2017, as established in the new Brazilian
mining code.
Iron ore pellets
Adjusted EBITDA for pellets in 1Q18 was US$ 763 million, 13.0% higher than the US$ 675
million recorded in 4Q17. The increase of US$ 88 million was mainly a result of higher prices
16 Considers the new allocation criteria for general and administrative expenses as described in the box “Managerial Allocation
Changes” of this Earnings Release.

36
and premiums (US$ 206 million), which were partially offset by lower dividends received17 in
1Q18 (US$ 44 million) and higher costs18 (US$ 57 million).
Net sales revenues for pellets amounted to US$ 1.585 billion in 1Q18, increasing US$ 163
million from the US$ 1.422 billion recorded in 4Q17 as a result of higher premiums (US$ 138
million) and IODEX (US$ 68 million). Realized prices increased from an average CFR/FOB of
US$ 104.7/t in 4Q17 to US$ 120.8/t in 1Q18 mainly due to the increase of US$ 10.6/dmt in
pellet premiums. The effect of higher prices was partially offset by slightly lower sales volumes
(US$ 42 million), which marginally decreased from 13.6 Mt in 4Q17 to 13.1 Mt in 1Q18.
CFR pellet sales of 3.3 Mt in 1Q18 represented 25% of total pellet sales, in line with 4Q17. FOB
pellet sales amounted to 9.8 Mt in 1Q18, slightly lower than the 10.3 Mt recorded in 4Q17.
Pellet costs totaled US$ 813 million (or US$ 917 million with depreciation charges) in 1Q18.
After adjusting for the effects of lower volumes (US$ 22 million), costs increased by US$ 57
million vs. 4Q17, mainly due to higher leasing costs (US$ 36 million) and fuel costs (US$ 19
million). The reason for increased leasing costs was higher premiums impacting the pre-
determined formula of the leasing contracts.
EBITDA unit margin for pellets was US$ 58.1/t in 1Q18, 16.9% higher than in 4Q17.
Pellets - EBITDA
1Q18 4Q17
US$
million US$/wmt
US$ million
US$/wmt
Net Revenues / Realized Price 1,585 120.8 1,422 104.7
Dividends Received (Leased pelletizing plants) - - 44 3.2
Cash Costs (Iron ore, leasing, freight, overhead, energy and other) (813) (61.9) (779) (57.4)
Expenses (SG&A, R&D and other) (9) (0.7) (12) (0.9)
EBITDA 763 58.1 675 49.7
Iron ore fines and pellets cash break-even19
Vale’s premium and flexible portfolio of products is best positioned to lead and profit from the
structural “flight to quality” trend. In 1Q18, Vale reached another milestone towards improving
Fe content and price realization by decreasing its iron ore fines and pellets EBITDA breakeven20
to US$ 30.5/dmt in 1Q18. The reduction of US$ 1.7/t, when compared to 4Q17, was mainly a
result of the abovementioned higher quality and premiums for iron ore fines (US$ 1.3/t) and a
better pellets performance (US$ 0.6/t).
17 Dividends from leased pelletizing plants, which are usually paid every 6 months (in 2Q and 4Q).
18 After adjusting for the effects of lower volumes (US$ 20 million) and exchange rate variations (US$ 0.5 million).
19 Please see the new allocation criteria for general and administrative expenses as described in the box “Managerial Allocation Changes” of this Earnings Release. 20 Measured by unit cash costs and expenses on a landed-in-China basis (and adjusted for quality, pellets margin differential
and moisture, excluding ROM).

37
Quarterly iron ore and pellets cash break-even on a landed-in-China basis, including sustaining
capex per ton of US$ 3.9/dmt, decreased from US$ 36.1/dmt in 4Q17 to US$ 34.5/dmt in 1Q18.
Iron ore and pellets cash break-even landed in China¹ US$/t 1Q18 4Q17 1Q17 2017
Vale's iron ore cash cost (ex-ROM, ex-royalties), FOB (US$ /t) 14.8 14.6 14.7 14.8
Iron ore fines freight cost (ex-bunker oil hedge) 16.4 17.0 14.2 15.4
Iron ore fines distribution cost² 0.7 0.7 0.4 0.6
Iron ore fines expenses³ & royalties 3.2 2.5 1.5 2.4
Iron ore fines moisture adjustment 3.1 3.0 2.8 2.9
Iron ore fines quality adjustment (5.2) (3.9) (2.4) (3.4)
Iron ore fines EBITDA break-even (US$/dmt) 33.0 34.0 31.3 32.6
Iron ore fines pellet adjustment (2.4) (1.8) (2.3) (1.9)
Iron ore fines and pellets EBITDA break-even (US$/dmt) 30.5 32.2 29.1 30.8
Iron ore fines sustaining investments 3.9 4.0 4.0 3.6
Iron ore fines and pellets cash break-even landed in China (US$/dmt) 34.5 36.1 33.1 34.3
¹ Measured by unit cost + expenses + sustaining investment adjusted for quality
² Distribution cost per ton calculation method has been revised and adjusted retroactively, now dividing by total sales volume instead of CFR sales volume
³ Net of depreciation and includes dividends received
Manganese and ferroalloys
Adjusted EBITDA of manganese ore and ferroalloys was US$ 49 million in 1Q18, remaining in
line with 4Q17, as higher realized prices (US$ 21 million) were offset by lower volumes (US$
20 million). Costs and expenses in 1Q18 remained practically in line with 4Q17.
Volume sold by destination – Iron ore and pellets ‘000 metric tons 1Q18 4Q17 1Q17
Americas 9,875 9,995 11,974
Brazil 6,844 7,232 10,100
Others 3,031 2,763 1,874
Asia 58,439 68,105 54,158
China 47,285 54,182 44,199
Japan 6,853 7,518 6,283
Others 4,301 6,405 3,676
Europe 11,548 11,460 8,971
Germany 4,517 4,747 3,988
France 1,403 1,795 936
Others 5,628 4,918 4,047
Middle East 2,627 2,351 1,901
Rest of the World 1,857 1,626 896
Total 84,346 93,537 77,900

38
Selected financial indicators - Ferrous Minerals US$ million 1Q18 4Q17 1Q17
Net Revenues 6,527 6,698 6,497
Costs¹ (3,038) (3,239) (2,449)
Expenses¹ (18) (22) 65
Pre-operating and stoppage expenses¹ (38) (56) (45)
R&D expenses (25) (34) (20)
Dividends and interests on associates and JVs - 80 -
Adjusted EBITDA 3,408 3,427 4,048
Depreciation and amortization (432) (454) (399)
Adjusted EBIT 2,976 2,973 3,649
Adjusted EBIT margin (%) 45.6 44.4 56.2
¹ Net of depreciation and amortization
Selected financial indicators - Iron ore fines
US$ million 1Q18 4Q17 1Q17
Adjusted EBITDA (US$ million) 2,557 2,654 3,161
Volume Sold (Mt) 70.8 79.6 63.7
Adjusted EBITDA (US$/t) 36.1 33.3 49.6
Selected financial indicators - Pellets US$ million 1Q18 4Q17 1Q17
Adjusted EBITDA (US$ million) 763 675 803
Volume Sold (Mt) 13.1 13.6 12.6
Adjusted EBITDA (US$/t) 58.1 49.7 63.8
Selected financial indicators - Ferrous ex Manganese and Ferroalloys US$ million 1Q18 4Q17 1Q17
Adjusted EBITDA (US$ million) 3,359 3,378 4,010
Volume Sold (Mt)¹ 84.3 93.5 77.9
Adjusted EBITDA (US$/t) 39.8 36.1 51.5
¹ Volume including iron ore fines, pellets and ROM.

39
Base Metals
NICKEL PRIMER: A PREMIUM AND FLEXIBLE BUSINESS, READY FOR TOMORROW
Vale is not only a premium iron ore producer; it is also a premium player in the nickel market,
with a unique product mix and market position.
Vale’s nickel products are predominately used in specialty applications where high quality
and purity are required. On the other hand, more than 50% of the nickel produced, and
consumed, in the world is classified as Class II nickel, typically used in the production of
stainless steel, a market that does not seek, nor require, higher quality material with high
levels of purity and minimal levels of deleterious elements.
The forecast for the global nickel market is a continuing deficit in the medium to long term.
The deficit is stronger for higher quality nickel, given the decline in world supplies of Class I
nickel (down 7% 2017 vs. 2016) and demand from specialty / higher quality nickel product
markets, which remains robust.
Most of Vale’s products are high quality nickel products, highlighting that Vale is the
producer of choice for specialty nickel applications, serving the market when there are
stringent chemical and physical specifications, requiring high purity levels and low quantities
of deleterious elements. All these markets pay a premium over the LME benchmark.

40
At the moment, given that Vale is a premium producer with about 65% of its supply being
Class I nickel products and over 20% being Class II battery-suitable nickel products, it still
sells part of its high-quality and battery-suitable nickel products to the stainless-steel market.
This means that Vale’s nickel business does not yet capture the full premium for the high
quality it produces. However, if more and more car manufacturers trend towards batteries
for electric vehicles (EVs), the upside will be there for Vale.
Battery applications require high purity chemicals which are made with high purity feed stock
or battery-suitable nickel that requires purification. This creates an opportunity for Vale to
capture higher premiums for a significant part of its sales volumes in the coming years with
reduced costs of production, low investments and no significant change in the flowsheet. In
fact, in operations such as VNC and PTVI, the advent of electric vehicles has potential to
reduce costs – through the elimination of stages in the beneficiation process – and avoid
capex disbursements in refining.
Vale sells high quality Class I nickel in the form of nickel powders, cathodes, rounds, plating
pellets and commodity pellets / discs. The rigorous quality standards of those Class I
products allows their use in numerous high-end industries, including aircraft, aerospace,
chemicals, batteries and underwater industrial machinery.
Vale will capture more premiums as it stops selling Class I nickel to Class II markets, and,
in the longer term, if demand for EVs picks up, Vale will be ready to capture a pricing upside
for over 85% of its product mix, fully benefiting from its high-quality assets and premium
product portfolio.
41
BUSINESS PERFORMANCE21
1Q18 marked a shift in Base Metals management through the optimization of production and
sales while focusing on a premium nickel product mix with higher margins. This shift led to
increased levels of premiums in Vale’s product mix, reaching US$ 38 million22 in 1Q18 as Vale’s
Class I products earned nearly double the amount of premium obtained in 1Q17.
21 Considers the new allocation criteria for general and administrative expenses as described in the box “Managerial Allocation
Changes” of this Earnings Release. 22 Net effect of premiums and discounts according to their respective share in the mix of products.
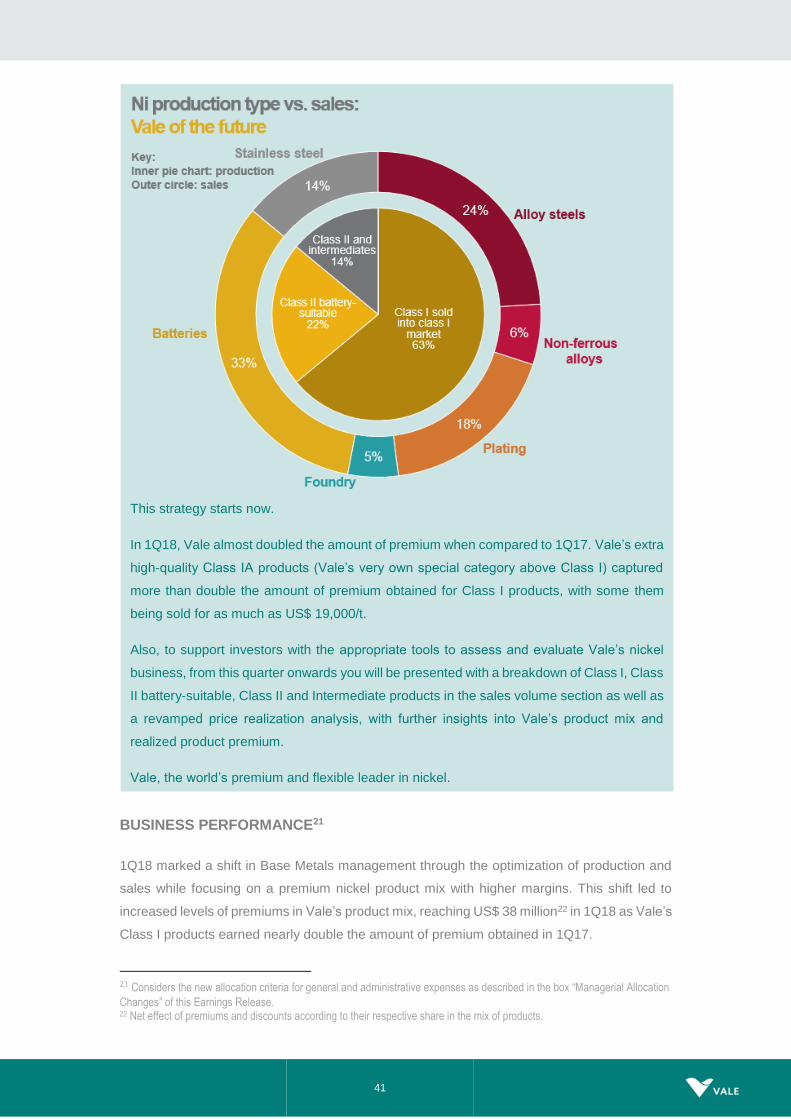
This strategy starts now.
In 1Q18, Vale almost doubled the amount of premium when compared to 1Q17. Vale’s extra
high-quality Class IA products (Vale’s very own special category above Class I) captured
more than double the amount of premium obtained for Class I products, with some them
being sold for as much as US$ 19,000/t.
Also, to support investors with the appropriate tools to assess and evaluate Vale’s nickel
business, from this quarter onwards you will be presented with a breakdown of Class I, Class
II battery-suitable, Class II and Intermediate products in the sales volume section as well as
a revamped price realization analysis, with further insights into Vale’s product mix and
realized product premium.
Vale, the world’s premium and flexible leader in nickel.

42
Adjusted EBITDA was US$ 644 million in 1Q18, a decrease of US$ 171 million vs. 4Q17, mainly
as a result of lower nickel and copper sales volumes (US$ 153 million), reflecting Vale’s
optimization of the production lines, and higher costs23 (US$ 81 million), which were partially
offset by the better price realization (US$ 108 million) due to the higher levels of premiums and
increase in the LME nickel benchmark price.
SALES REVENUES AND VOLUMES
Nickel sales revenues were US$ 790 million in 1Q18, decreasing US$ 151 million vs. 4Q17 as a
result of lower sales volumes (US$ 258 million) which were partially offset by higher nickel realized
prices (US$ 108 million). Sales volumes totaled 58 kt in 1Q18, 22 kt lower than in 4Q17.
Copper sales revenues were US$ 511 million in 1Q18, decreasing US$ 233 million vs. 4Q17
as a result of lower sales volumes (US$ 158 million) and lower copper realized prices (US$ 75
million). Sales volumes were 88 kt in 1Q18, 23 kt lower than in 4Q17.
Cobalt sales revenues totalled US$ 90 million in 1Q18, increasing US$ 11 million vs. 4Q17, as
a result of higher cobalt prices (US$ 19 million) partially offset by lower sales volumes (US$ 8
million) in the quarter. Sales volumes of cobalt by-product amounted to 1,276 t in 1Q18, 92 t
lower than in 4Q17.
Sales revenues from gold contained as a by-product in nickel and copper concentrates
amounted to US$ 148 million in 1Q18, decreasing by US$ 9 million vs. 4Q17 as a result of
lower gold by-product realized prices (US$ 14 million), partially offset by higher sales volumes
(US$ 5 million). Sales volumes of gold as a by-product amounted to 112,000 oz in 1Q18, 4,000
oz higher than in 4Q17.
PGMs (platinum group metals) sales revenues totalled US$ 74 million in 1Q18, increasing US$
12 million vs. 4Q17. Sales volumes were 73,000 oz in 1Q18 vs. 68,000 oz in 4Q17. The PGMs
sales volume increased mainly due to higher sales volumes of palladium which were partially
offset by lower sales volumes of platinum.
Net operating revenue by product US$ million 1Q18 4Q17 1Q17
Nickel 790 941 760
Copper 511 744 568
Gold as by-product 148 157 130
Silver as by-product 8 9 7
PGMs 74 62 85
Cobalt 90 79 41
Others 13 8 6
Total 1,634 2,000 1,597
23 Costs net of volume effect.

43
REALIZED NICKEL PRICES
Vale’s nickel products are classified as Class I, Class II battery-suitable, Class II and
Intermediates. In 1Q18, 63% of Vale’s sales was high-quality Class I, and when considering
Class II products that can be used in the production of batteries, 85% of Vale’s current sales
has an upside with the advent of EVs.
Nickel sales product mix - % change
Class I nickel products accounted for 63% of total nickel sales in 1Q18. Part of the Class I nickel
products is being sold at increasing premiums for the specialties/high-quality markets but part
of it is sold to Class II markets, with lower premiums. As demand for specialty products and
batteries for EVs increases, a larger portion of Vale’s high-quality Class I nickel products will
be sold to Class I markets, capturing a larger share of premiums among its products. Also, with
demand for EVs, the value of premiums is set to increase due to the rising scarcity of Class I
nickel in the market.
Class II battery-suitable nickel products accounted for 22% and, though these products are not
classified as Class I, they are suitable, at reduced costs and avoiding capex disbursements in
refining, for application in EV batteries. Battery suitable is composed of Utility Nickel and NHC
from VNC and Tonimet from PTVI.
The business case for VNC is linked with the upside potential of EVs as both nickel oxide and NHC
can be used for the batteries market. Currently, NHC is sold to the market with a discount whilst the
nickel oxide is sent to be refined into Utility Nickel in Dalian. Both products can be used for EV
batteries. Therefore, as demand for batteries increases, Vale will be able to not only reduce costs
but also to avoid capex disbursements in refining by cutting stages of production and selling nickel
oxide at better margins.
Likewise, PTVI has an upside with the advent of EVs as, currently, its nickel matte is
transformed into nickel oxide to be refined into Tonimet at Matsusaka. In the future, Vale can

44
also cut production costs by only selling nickel oxide at better margins instead of incurring extra
production costs and investments with refining.
The other Class II nickel products and Intermediates are not suitable for electric vehicles,
accounting for 14% of total nickel sales.
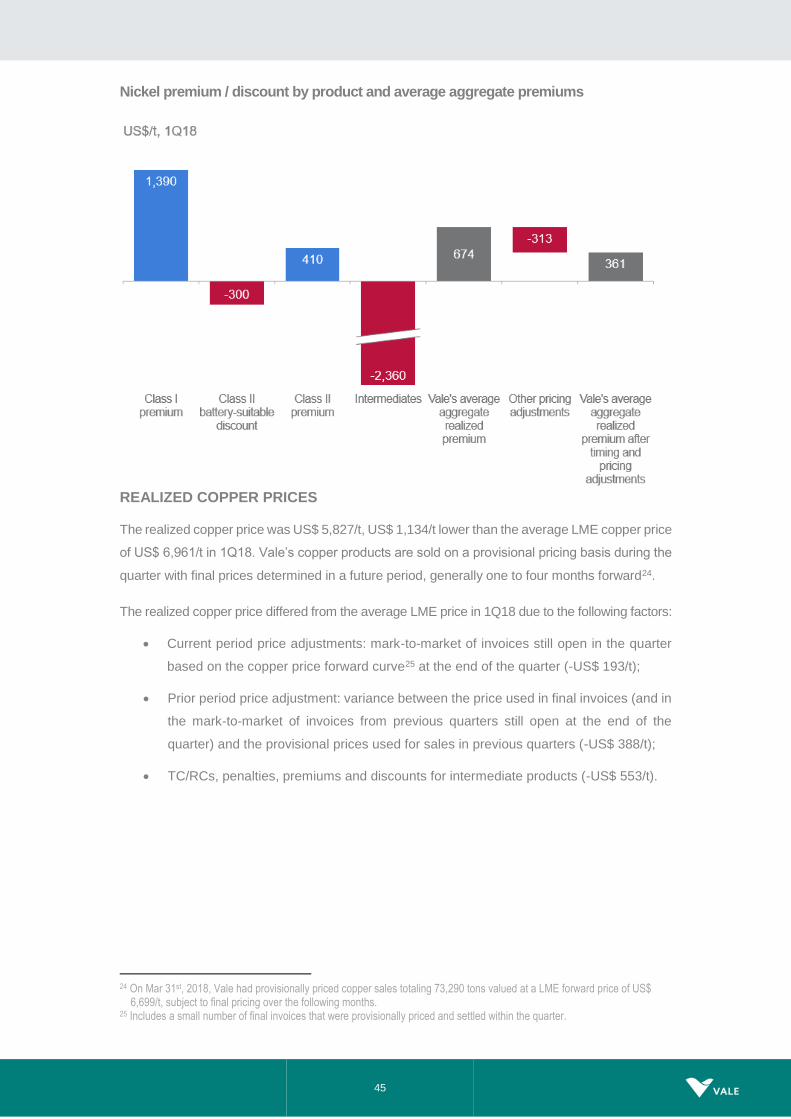
Premiums / discount by nickel product
Premiums for Class I nickel products have reached US$ 1,390/t in 1Q18, an increase of 48%
and 90% when compared to 4Q17 and 1Q17, respectively. The increase is mainly due to a
combination of renegotiation of contracts to more favourable terms as well as the flight to quality
in the specialty applications market.
The average nickel realized price was US$ 13,637/t, US$ 361/t higher than the average LME
nickel price of US$ 13,276/t in 1Q18. The aggregate impact of the aforementioned premiums
and discounts (considering their respective volumes in the sales mix) was:
Premium for Class I nickel products for 63% of sales, leading to an aggregate impact
of US$ 876/t;
Discount for Class II battery-suitable nickel products for 22% of sales, leading to an
aggregate impact of -US$ 66/t;
Premium for Class II nickel products for 7% of sales, with aggregate impact of US$ 29/t;
Discount for Intermediates for 7% of sales, leading to an aggregate impact of -US$
165/t; and,
Other timing and pricing adjustments, mainly due to the differences between the LME
price at the moment of sale and the quarterly LME average, along with the negative
impact of fixed forward price sales under rising LME prices, leading to an aggregate
impact of -US$ 313/t.
US$/t 1Q18 4Q17 1Q17
Class I nickel 1,390 940 730
Class II battery-suitable nickel (300) (230) (180)
Class II nickel 410 200 190
Intermediates (2,360) (1,370) (1,570)
45
Nickel premium / discount by product and average aggregate premiums
REALIZED COPPER PRICES
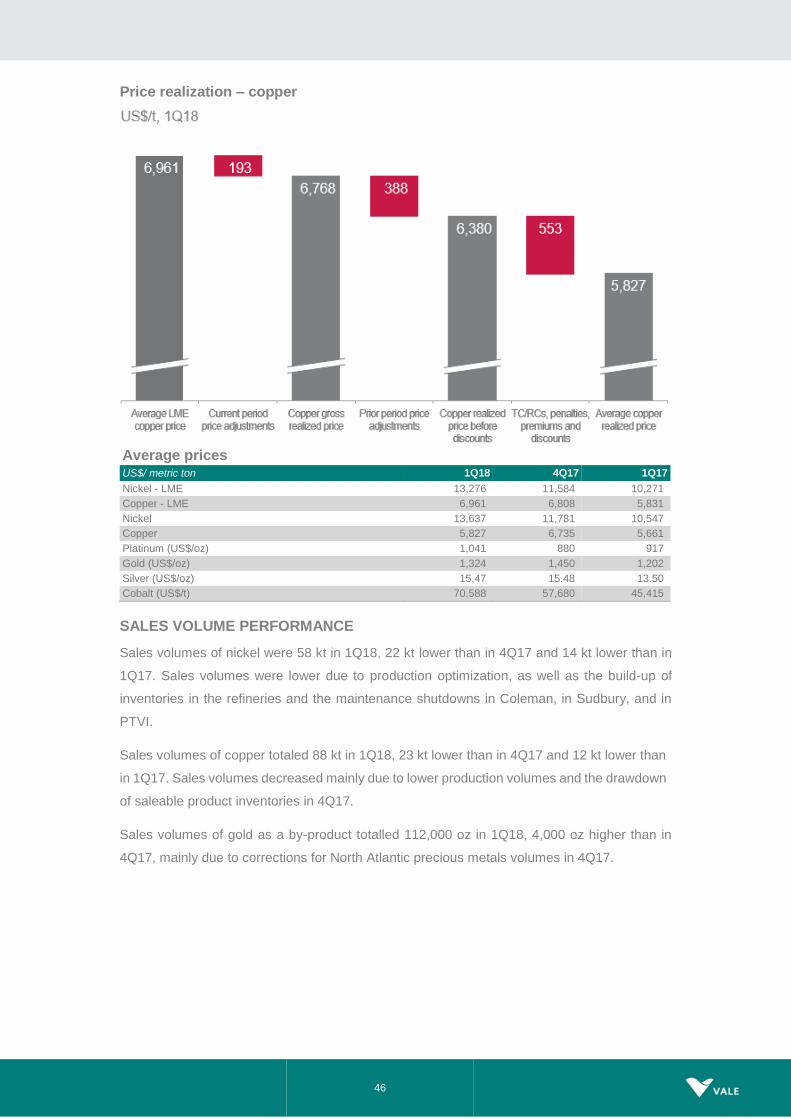
The realized copper price was US$ 5,827/t, US$ 1,134/t lower than the average LME copper price
of US$ 6,961/t in 1Q18. Vale’s copper products are sold on a provisional pricing basis during the
quarter with final prices determined in a future period, generally one to four months forward24.
The realized copper price differed from the average LME price in 1Q18 due to the following factors:
Current period price adjustments: mark-to-market of invoices still open in the quarter
based on the copper price forward curve25 at the end of the quarter (-US$ 193/t);
Prior period price adjustment: variance between the price used in final invoices (and in
the mark-to-market of invoices from previous quarters still open at the end of the
quarter) and the provisional prices used for sales in previous quarters (-US$ 388/t);
TC/RCs, penalties, premiums and discounts for intermediate products (-US$ 553/t).
24 On Mar 31st, 2018, Vale had provisionally priced copper sales totaling 73,290 tons valued at a LME forward price of US$
6,699/t, subject to final pricing over the following months. 25 Includes a small number of final invoices that were provisionally priced and settled within the quarter.
46
Price realization – copper
Average prices US$/ metric ton 1Q18 4Q17 1Q17
Nickel - LME 13,276 11,584 10,271
Copper - LME 6,961 6,808 5,831
Nickel 13,637 11,781 10,547
Copper 5,827 6,735 5,661
Platinum (US$/oz) 1,041 880 917
Gold (US$/oz) 1,324 1,450 1,202
Silver (US$/oz) 15.47 15.48 13.50
Cobalt (US$/t) 70,588 57,680 45,415
SALES VOLUME PERFORMANCE
Sales volumes of nickel were 58 kt in 1Q18, 22 kt lower than in 4Q17 and 14 kt lower than in
1Q17. Sales volumes were lower due to production optimization, as well as the build-up of
inventories in the refineries and the maintenance shutdowns in Coleman, in Sudbury, and in
PTVI.
Sales volumes of copper totaled 88 kt in 1Q18, 23 kt lower than in 4Q17 and 12 kt lower than
in 1Q17. Sales volumes decreased mainly due to lower production volumes and the drawdown
of saleable product inventories in 4Q17.
Sales volumes of gold as a by-product totalled 112,000 oz in 1Q18, 4,000 oz higher than in
4Q17, mainly due to corrections for North Atlantic precious metals volumes in 4Q17.

47
Volume sold ‘000 metric tons 1Q18 4Q17 1Q17
Nickel operations & by products
Nickel 58 80 72
Class I nickel 37 44 40
Class II battery-suitable nickel 13 18 20
Class II nickel 4 8 5
Intermediates 4 10 7
Copper 26 37 38
Gold as by-product ('000 oz) 15 - 23
Silver as by-product ('000 oz) 321 383 351
PGMs ('000 oz) 73 68 104
Cobalt (metric ton) 1,276 1,368 892
Copper operations & by products
Copper 62 74 62
Gold as by-product ('000 oz) 97 108 85
Silver as by-product ('000 oz) 173 219 194
COSTS OF GOODS SOLD (COGS)
Costs totaled US$ 953 million in 1Q18 (or US$ 1.303 billion including depreciation). Costs
increased by US$ 81 million vs. 4Q17 after adjusting for the effects of lower sales volumes
(US$ 264 million) and the negative effect of exchange rate variations26 (US$ 6 million). The
increase was mainly due to increased costs in nickel operations (US$ 51 million) and in Salobo
(US$ 27 million). The increased costs in nickel operations was mainly due to pro-cyclical effects
of higher nickel prices on third-party purchased feed (US$ 41 million), which is offset by higher
nickel realized prices of the finished product, and maintenance expenses in Coleman (US$ 26
million 1Q18 vs. US$ 10 million 4Q17), whereas the increase in Salobo was mainly related to
the unfavorable impact of lower production volumes on unit costs along with higher supplies
costs.
BASE METALS COGS - 4Q17 x 1Q18
Variance drivers
US$ million 4Q17 Volume Exchange
Rate Others
Total Variation 4Q17 x 1Q18
1Q18
Nickel operations 875 (227) 6 51 (169) 705
Copper operations 255 (37) - 30 (8) 248
Total costs before depreciation and amortization
1,130 (264) 6 81 (177) 953
Depreciation 429 (112) 2 31 (79) 350
Total 1,558 (376) 8 112 (256) 1,303
26 Exchange rate variations in COGS only.

48
EXPENSES27
Sales expenses and other expenses, excluding depreciation, totalled US$ 16 million in 1Q18,
an increase of US$ 4 million when compared to the US$ 12 million in 4Q17.
Pre-operating and stoppage expenses were US$ 8 million in 1Q18, mainly due to care and
maintenance costs associated with the Stobie mine, in Sudbury, and the Birchtree mine, in
Thompson (US$ 6 million) and costs associated with the revision of the Voisey’s Bay Mine
Expansion project (US$ 2 million).
UNIT CASH COST27
North Atlantic operations unit cash cost net of by-product credits increased from the US$ 4,624/t
recorded in 4Q17 to US$ 6,756/t in 1Q18, mainly due to pro-cyclical effects of higher nickel
prices on third-party purchased feed and costs associated with the unscheduled maintenance
shutdown at the Coleman Mine in Sudbury. The mine was in a maintenance shutdown since
November 2017 and returned to production in April 2018.
PTVI unit cash cost increased from the US$ 6,609/t recorded in 4Q17 to US$ 7,246/t in 1Q18,
with lower dilution of fixed costs and higher spending with supplies.
VNC unit cost net of by-product credits increased from the US$ 8,420/t recorded in 4Q17 to
US$ 8,874/t in 1Q18, mainly due to negative inventory adjustments which were partially offset
by higher by-product credits.
Onça Puma unit cash cost increased slightly from the US$ 7,536/t recorded in 4Q17 to US$
7,685/t in 1Q18, mainly due to higher costs with maintenance services.
Sossego unit cost was US$ 3,267/t in 1Q18, in line with 4Q17.
Salobo unit costs increased from the US$ 679/t recorded in 4Q17 to US$ 1,155/t in 1Q18,
mainly due to the unfavourable impact of lower production on unit costs and higher supplies
costs.
27 Considers the new allocation criteria for general and administrative expenses as described in the box “Managerial Allocation
Changes” of this Earnings Release.

49
Base Metals – unit cash cost of sales per operation, net of by-product credits
EBITDA breakeven – nickel operations28
28 Considering only the cash effect of US$ 400/oz that Wheaton Precious Metals pays for 70% of Sudbury’s gold by-product,
nickel operations EBITDA breakeven would increase to US$ 7,394/t
US$/t 1Q18 4Q17 1Q17
NICKEL
North Atlantic operations1 6,756 4,624 6,699
PTVI 7,246 6,609 6,821
VNC 8,874 8,420 11,232
Onça Puma 7,685 7,536 9,341
COPPER
Sossego 3,267 3,270 2,941
Salobo 1,155 679 1,406
1 North Atlantic figures include Clydach and Acton refining costs.

50
EBITDA breakeven – copper operations (Salobo and Sossego)29
EBITDA breakeven considers the abovementioned unit cash cost after by-products as well as
expenses and premiums/discounts per ton of nickel and copper sales volume. In the case of
copper operations, the realized price to be used against the EBITDA breakeven should be the
copper realized price before discounts (US$ 6,380/t), given that TC/RCs and other discounts
are already part of the EBITDA breakeven build-up.
Performance by operation30
The breakdown of the Base Metals EBITDA components per operation is detailed below.
Base Metals EBITDA overview – 1Q18
US$ million North
Atlantic PTVI Site
VNC Site
Onça Puma
Sossego Salobo Others Total Base
Metals
Net Revenues 803 170 155 57 145 356 (53) 1,634
Costs (533) (125) (125) (32) (87) (160) 109 (953)
Sales and other expenses
(1) - (1) - (1) - (14) (16)
Pre-operating and stoppage (8) - - - - - - (8)
R&D (5) (2) (1) - (3) (1) - (13)
EBITDA 257 43 28 25 54 195 42 644
29 Considering only the cash effect of US$ 400/oz that Wheaton Precious Metals pays for 75% of Salobo’s gold by-product, copper operations
EBITDA breakeven would increase to US$ 3,492/t 30 Considers the new allocation criteria for general and administrative expenses as described in the box “Managerial Allocation Changes” of this Earnings Release.
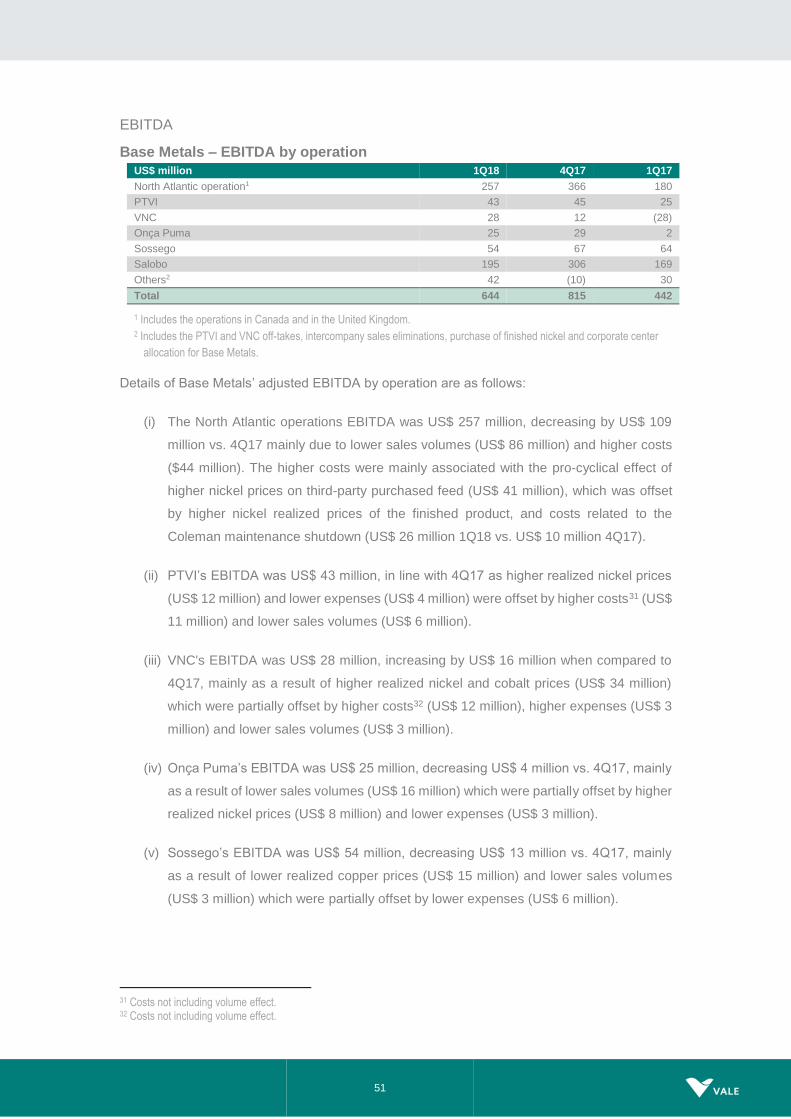
51
EBITDA
Base Metals – EBITDA by operation
Details of Base Metals’ adjusted EBITDA by operation are as follows:
(i) The North Atlantic operations EBITDA was US$ 257 million, decreasing by US$ 109
million vs. 4Q17 mainly due to lower sales volumes (US$ 86 million) and higher costs
($44 million). The higher costs were mainly associated with the pro-cyclical effect of
higher nickel prices on third-party purchased feed (US$ 41 million), which was offset
by higher nickel realized prices of the finished product, and costs related to the
Coleman maintenance shutdown (US$ 26 million 1Q18 vs. US$ 10 million 4Q17).
(ii) PTVI’s EBITDA was US$ 43 million, in line with 4Q17 as higher realized nickel prices
(US$ 12 million) and lower expenses (US$ 4 million) were offset by higher costs31 (US$
11 million) and lower sales volumes (US$ 6 million).
(iii) VNC's EBITDA was US$ 28 million, increasing by US$ 16 million when compared to
4Q17, mainly as a result of higher realized nickel and cobalt prices (US$ 34 million)
which were partially offset by higher costs32 (US$ 12 million), higher expenses (US$ 3
million) and lower sales volumes (US$ 3 million).
(iv) Onça Puma’s EBITDA was US$ 25 million, decreasing US$ 4 million vs. 4Q17, mainly
as a result of lower sales volumes (US$ 16 million) which were partially offset by higher
realized nickel prices (US$ 8 million) and lower expenses (US$ 3 million).
(v) Sossego’s EBITDA was US$ 54 million, decreasing US$ 13 million vs. 4Q17, mainly
as a result of lower realized copper prices (US$ 15 million) and lower sales volumes
(US$ 3 million) which were partially offset by lower expenses (US$ 6 million).
31 Costs not including volume effect. 32 Costs not including volume effect.
US$ million 1Q18 4Q17 1Q17
North Atlantic operation1 257 366 180
PTVI 43 45 25
VNC 28 12 (28)
Onça Puma 25 29 2
Sossego 54 67 64
Salobo 195 306 169
Others2 42 (10) 30
Total 644 815 442
1 Includes the operations in Canada and in the United Kingdom. 2 Includes the PTVI and VNC off-takes, intercompany sales eliminations, purchase of finished nickel and corporate center
allocation for Base Metals.

52
(vi) Salobo’s EBITDA was US$ 195 million, decreasing US$ 111 million vs. 4Q17, mainly
as a result of lower sales volumes (US$ 51 million), lower realized prices (US$ 33
million) and higher costs (US$ 27 million).
Selected financial indicators - Nickel operations
US$ million 1Q18 4Q17 1Q17
Net Revenues 1,132 1,358 1,132
Costs¹ (705) (875) (862)
Expenses¹ (15) (3) (14)
Pre-operating and stoppage expenses¹ (8) (25) (38)
R&D expenses (9) (15) (9)
Dividends and interests on associates and JVs - - -
Adjusted EBITDA 395 440 209
Depreciation and amortization (296) (377) (323)
Adjusted EBIT 99 63 (114)
Adjusted EBIT margin (%) 9 5 (10)
1 Net of depreciation and amortization.
The margin of nickel operations (defined as net revenues minus costs divided by net revenues)
increased to 37.7% in 1Q18, vs. 35.6% in 4Q17 and 23.9% in 1Q17. This was a direct result of
Vale’s deliberate decision to reduce volumes through the optimization of production lines, which
led not only to higher margins, but also a higher realized nickel premiums.
Selected financial indicators - Copper operations
US$ million 1Q18 4Q17 1Q17
Net Revenues 502 642 465
Costs¹ (248) (255) (230)
Expenses¹ (1) (9) -
Pre-operating and stoppage expenses¹ - - -
R&D expenses (4) (3) (2)
Dividends and interests on associates and JVs - - -
Adjusted EBITDA 249 375 233
Depreciation and amortization (54) (54) (51)
Adjusted EBIT 195 321 182
Adjusted EBIT margin (%) 39 50 39
¹ Net of depreciation and amortization.
The margin of copper operations (defined as net revenues minus costs divided by net revenues)
decreased to 50.6% in 1Q18, vs. 60.1% in 4Q17, mainly due to the unfavorable impact of lower
Salobo production volumes on unit costs and lower copper realized prices.

53
Coal
EBITDA
The results of Vale’s Coal business continued to improve in 1Q18, mainly driven by higher
realized prices. Vale’s average realized price increased US$ 15.6/t from US$ 136.6/t in 4Q17
to US$ 152.2/t in 1Q18, showing Vale’s effort to increase the share of contracts linked to market
index pricing, leveraging on metallurgical and thermal coal market prices as they reached their
highest quarterly average levels since 4Q16 and 1Q12, respectively.
As a result, adjusted EBITDA for the Coal business increased 41% in 1Q18, reaching US$ 104
million, despite lower volumes. The result was US$ 30 million higher than the US$ 74 million
recorded in 4Q1733, mainly due to higher average realized prices (US$ 42 million).
METALLURGICAL COAL
In 1Q18, 92% of the metallurgical coal sales were priced based on market index, including
index-lagged prices, vs. 77% in the previous quarter, while 8% were sold based on fixed prices
(spot shipments and trial cargos) vs. 19% in 4Q17, thus improving commercial conditions.
The metallurgical coal realized price increased US$ 26.2/t in the quarter while the seaborne
index price increased US$ 23.8/t in the same period. The better price realization was mainly
due to a higher concentration in sales linked to current and lagged index prices in 1Q18, which
was partially offset by higher provisional prices for previous and current quarters.
33 Considers the new allocation criteria for general and administrative expenses as described in the box “Managerial Allocation Changes” of
this Earnings Release.
Coal prices US$/ metric ton 1Q18 4Q17 1Q17
Metallurgical coal index price1 228.5 204.7 168.2
Vale’s metallurgical coal realized price 204.6 178.4 165.2
Thermal coal index price2 94.4 92.4 82.4
Vale’s thermal coal realized price 82.0 78.6 68.2
Vale’s average realized price 152.2 136.6 126.2
¹ Platts Premium Low Vol Hard Coking Coal FOB Australia. 2 Argus API4 FOB Richards Bay 6000 kg/kcal Nar
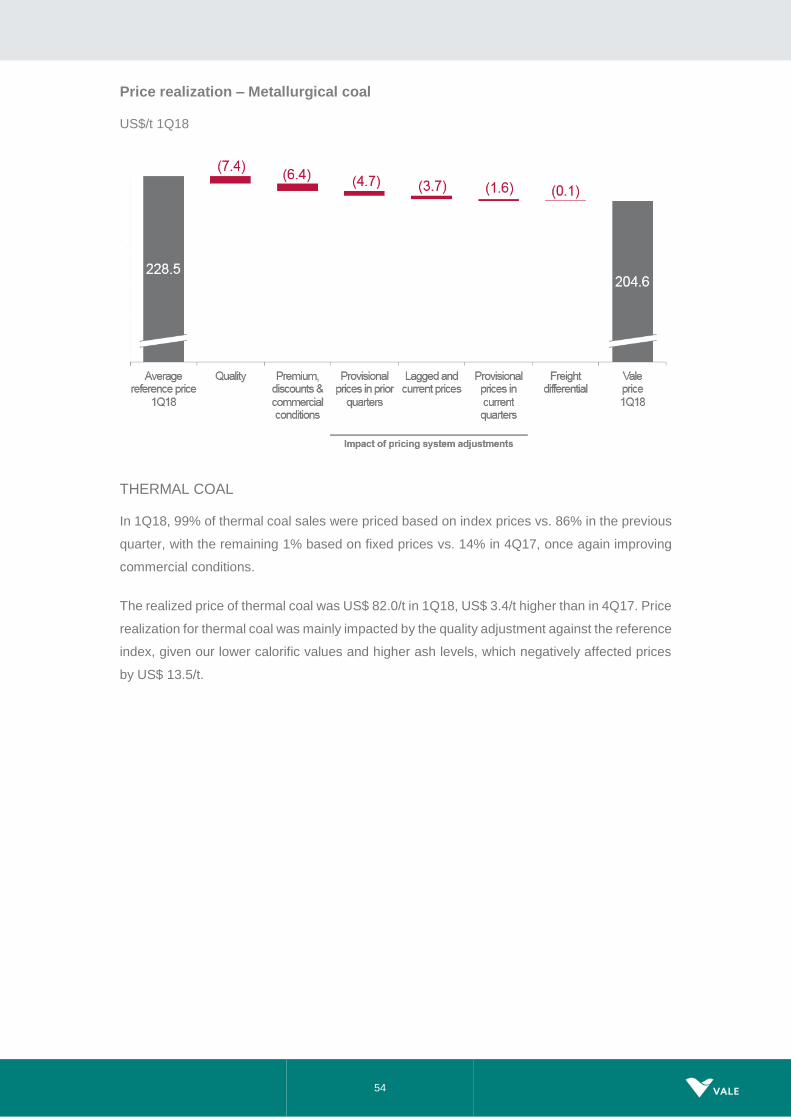
54
Price realization – Metallurgical coal
US$/t 1Q18
THERMAL COAL
In 1Q18, 99% of thermal coal sales were priced based on index prices vs. 86% in the previous
quarter, with the remaining 1% based on fixed prices vs. 14% in 4Q17, once again improving
commercial conditions.
The realized price of thermal coal was US$ 82.0/t in 1Q18, US$ 3.4/t higher than in 4Q17. Price
realization for thermal coal was mainly impacted by the quality adjustment against the reference
index, given our lower calorific values and higher ash levels, which negatively affected prices
by US$ 13.5/t.

55
Price realization – Thermal coal
US$/t, 1Q18
COSTS AND EXPENSES
Coal pro-forma cash cost is composed of: (i) the mine and handling facilities operational costs,
(ii) the logistics tariff paid by Vale to Nacala Logistics Corridor (NLC), which is set annually to
cover mainly operational and financial costs of NLC, and (iii) the interest received by Vale on
the outstanding shareholder loans to NLC.
Pro-forma cash cost through Nacala was US$ 104.5/t in 1Q18, in line with 4Q17.
Cost at port decreased US$ 16.1/t, from US$ 144.6 /t in 4Q17 to US$ 128.0/t in 1Q18, despite
US$ 8.9/t higher operational costs of mine, plants and logistics due to lower dilution of fixed
costs, as production was affected by severe weather conditions in 1Q18 and labor actions in
4Q17. The lower cost at port results from the lower NLC tariff set for 2018, considering the
higher forecast production volume and the lower interest charge, as the Project Finance
substitutes the previous shareholder loan.
Cash cost through Nacala US$ / metric ton 1Q18 4Q17 1Q17
Mine and logistics operational cost (A) 101.5 92.6 84.2
NLC net tariff (B) 27.0 52.0 -
Cost at Nacala Port (C = A+B) 128.5 144.6 84.2
NLC’s debt service to Vale (D) 24.0 40.2 -
Pro-forma cash cost (E = C – D) 104.5 104.4 84.2
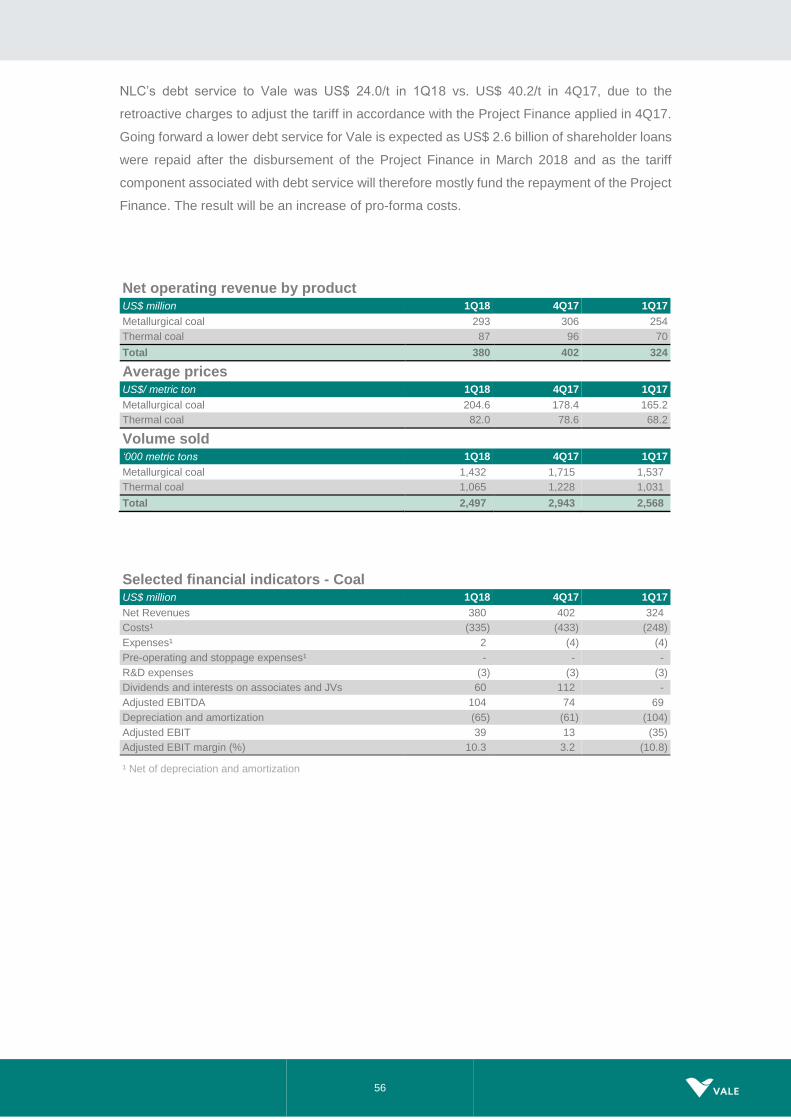
56
NLC’s debt service to Vale was US$ 24.0/t in 1Q18 vs. US$ 40.2/t in 4Q17, due to the
retroactive charges to adjust the tariff in accordance with the Project Finance applied in 4Q17.
Going forward a lower debt service for Vale is expected as US$ 2.6 billion of shareholder loans
were repaid after the disbursement of the Project Finance in March 2018 and as the tariff
component associated with debt service will therefore mostly fund the repayment of the Project
Finance. The result will be an increase of pro-forma costs.
Net operating revenue by product US$ million 1Q18 4Q17 1Q17
Metallurgical coal 293 306 254
Thermal coal 87 96 70
Total 380 402 324
Average prices US$/ metric ton 1Q18 4Q17 1Q17
Metallurgical coal 204.6 178.4 165.2
Thermal coal 82.0 78.6 68.2
Volume sold ‘000 metric tons 1Q18 4Q17 1Q17
Metallurgical coal 1,432 1,715 1,537
Thermal coal 1,065 1,228 1,031
Total 2,497 2,943 2,568
Selected financial indicators - Coal US$ million 1Q18 4Q17 1Q17
Net Revenues 380 402 324
Costs¹ (335) (433) (248)
Expenses¹ 2 (4) (4)
Pre-operating and stoppage expenses¹ - - -
R&D expenses (3) (3) (3)
Dividends and interests on associates and JVs 60 112 -
Adjusted EBITDA 104 74 69
Depreciation and amortization (65) (61) (104)
Adjusted EBIT 39 13 (35)
Adjusted EBIT margin (%) 10.3 3.2 (10.8)
¹ Net of depreciation and amortization

57
Financial indicators of non-consolidated companies
For selected financial indicators of the main non-consolidated companies, see Vale’s quarterly
financial statements on www.vale.com / investors / information to the market / financial
statements.
Conference call and webcast
Vale will host two conference calls and webcasts on Thursday, April 26th, to discuss its 1Q18
performance. The first, in Portuguese (non-translated), will begin at 10:00 a.m. Rio de Janeiro
time. The second, in English, at 12:00 p.m. Rio de Janeiro time (11:00 a.m. US Eastern
Standard Time, 4:00 p.m. British Standard Time).
Dial in to conference calls/webcasts:
In Portuguese:
Participants from Brazil: (55 11) 3193-1001 or (55 11) 2820-4001
Participants from the US: (1 800) 492-3904
Participants from other countries: (1 646) 828-8246
Access code: VALE
In English:
Participants from Brazil: (55 11) 3193-1001 or (55 11) 2820-4001
Participants from the U.S.: (1 866) 262-4553
Participants from other countries: (1 412) 317-6029
Access code: VALE
Instructions for participation will be available on the website: www.vale.com/investors. A
podcast will be available on Vale’s Investor Relations website.
This press release may include statements that present Vale’s expectations about future events or results. All statements, when based upon
expectations about the future, involve various risks and uncertainties. Vale cannot guarantee that such statements will prove correct. These
risks and uncertainties include factors related to the following: (a) the countries where we operate, especially Brazil and Canada; (b) the global
economy; (c) the capital markets; (d) the mining and metals prices and their dependence on global industrial production, which is cyclical by
nature; and (e) global competition in the markets in which Vale operates. To obtain further information on factors that may lead to results
different from those forecast by Vale, please consult the reports Vale files with the U.S. Securities and Exchange Commission (SEC), the
Brazilian Comissão de Valores Mobiliários (CVM) and the French Autorité des Marchés Financiers (AMF), and in particular the factors discussed
under “Forward-Looking Statements” and “Risk Factors” in Vale’s annual report on Form 20-F.

58
ANNEX 1 – SIMPLIFIED FINANCIAL STATEMENTS
Income statement US$ million 1Q18 4Q17 1Q17
Net operating revenue 8,603 9,167 8,515
Cost of goods sold (5,224) (5,791) (4,734)
Gross profit 3,379 3,376 3,781
Gross margin (%) 39.3 36.8 44.4
Selling, general and administrative expenses (124) (146) (124)
Research and development expenses (69) (104) (65)
Pre-operating and stoppage expenses (78) (125) (115)
Other operational expenses (125) (104) (77)
Impairment and others results in non-current assets (18) (417) 512
Operating profit 2,965 2,480 3,912
Financial revenues 118 149 64
Financial expenses (647) (562) (1,115)
Gains (losses) on derivatives, net 90 (29) 209
Monetary and exchange variation (185) (845) 229
Equity results in associates and joint ventures 85 (66) 73
Impairment and others results in associates and joint ventures
(14) (59) (61)
Income (loss) before taxes 2,412 1,068 3,311
Current tax (93) 243 (501)
Deferred tax (628) (85) (222)
Net Earnings (loss) from continuing operations 1,691 1,226 2,588
Loss attributable to noncontrolling interest (19) 32 (15)
Gain (loss) from discontinued operations (82) (487) (83)
Net earnings (attributable to the Company's stockholders)
1,590 771 2,490
Earnings (loss) per share (attributable to the Company's stockholders - US$)
0.31 0.15 0.48
Diluted earnings (loss) per share (attributable to the Company's stockholders - US$)
0.31 0.15 0.48
Equity income (loss) by business segment US$ million 1Q18 % 4Q17 % 1Q17 %
Ferrous Minerals 77 91 77 (117) 57 78
Coal 4 5 - - 10 14
Base Metals 1 1 - - 1 1
Logistics - - - - - -
Steel (21) (25) (115) 174 (1) (1)
Others 24 28 (28) 42 6 8
Total 85 100 (66) 100 73 100

59
Balance sheet US$ million 3/31/2018 12/31/2017 3/31/2017
Assets
Current assets 15,239 18,954 22,421
Cash and cash equivalents 5,368 4,328 6,716
Accounts receivable 2,689 2,600 3,237
Other financial assets 376 2,022 2,114
Inventories 3,967 3,926 3,641
Prepaid income taxes 722 781 73
Recoverable taxes 1,055 1,172 1,553
Others 602 538 568
Non-current assets held for sale and discontinued operation
460 3,587 4,519
Non-current assets 12,682 13,291 13,125
Judicial deposits 1,993 1,986 990
Other financial assets 3,047 3,232 3,379
Recoverable income taxes 587 530 538
Recoverable taxes 667 638 767
Deferred income taxes 6,106 6,638 7,127
Others 282 267 324
Fixed assets 66,463 66,939 67,462
Total assets 94,384 99,184 103,008
Liabilities
Current liabilities 9,990 13,114 11,825
Suppliers and contractors 3,598 4,041 3,647
Loans and borrowing 1,966 1,703 2,407
Other financial liabilities 1,008 986 1,248
Taxes payable 703 697 687
Provision for income taxes 227 355 120
Provisions 868 1,394 651
Dividends and interest on capital - 1,441 821
Liabilities related to associates and joint ventures 369 326 284
Others 1,038 992 921
Liabilities directly associated with non-current assets held for sale and discontinued operations
213 1,179 1,039
Non-current liabilities 38,587 41,298 47,612
Loans and borrowing 18,310 20,786 27,163
Other financial liabilities 2,901 2,894 3,194
Taxes payable 4,796 4,890 5,098
Deferred income taxes 1,704 1,719 1,677
Provisions 6,984 7,027 5,938
Liabilities related to associates and joint ventures 633 670 787
Gold stream transaction 1,793 1,849 2,032
Others 1,466 1,463 1,723
Total liabilities 48,577 54,412 59,437
Stockholders' equity 45,807 44,772 43,571
Total liabilities and stockholders' equity 94,384 99,184 103,008
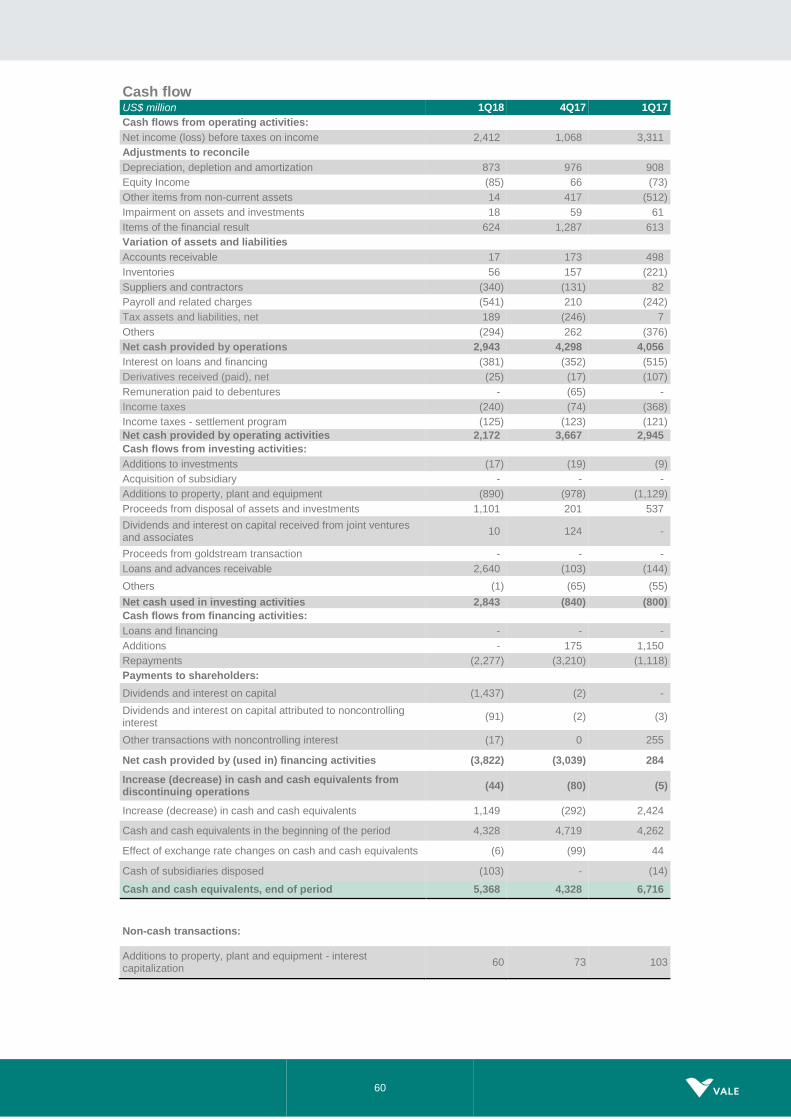
60
Cash flow US$ million 1Q18 4Q17 1Q17
Cash flows from operating activities:
Net income (loss) before taxes on income 2,412 1,068 3,311
Adjustments to reconcile
Depreciation, depletion and amortization 873 976 908
Equity Income (85) 66 (73)
Other items from non-current assets 14 417 (512)
Impairment on assets and investments 18 59 61
Items of the financial result 624 1,287 613
Variation of assets and liabilities
Accounts receivable 17 173 498
Inventories 56 157 (221)
Suppliers and contractors (340) (131) 82
Payroll and related charges (541) 210 (242)
Tax assets and liabilities, net 189 (246) 7
Others (294) 262 (376)
Net cash provided by operations 2,943 4,298 4,056
Interest on loans and financing (381) (352) (515)
Derivatives received (paid), net (25) (17) (107)
Remuneration paid to debentures - (65) -
Income taxes (240) (74) (368)
Income taxes - settlement program (125) (123) (121)
Net cash provided by operating activities 2,172 3,667 2,945
Cash flows from investing activities:
Additions to investments (17) (19) (9)
Acquisition of subsidiary - - -
Additions to property, plant and equipment (890) (978) (1,129)
Proceeds from disposal of assets and investments 1,101 201 537
Dividends and interest on capital received from joint ventures and associates
10 124 -
Proceeds from goldstream transaction - - -
Loans and advances receivable 2,640 (103) (144)
Others (1) (65) (55)
Net cash used in investing activities 2,843 (840) (800)
Cash flows from financing activities:
Loans and financing - - -
Additions - 175 1,150
Repayments (2,277) (3,210) (1,118)
Payments to shareholders:
Dividends and interest on capital (1,437) (2) -
Dividends and interest on capital attributed to noncontrolling interest
(91) (2) (3)
Other transactions with noncontrolling interest (17) 0 255
Net cash provided by (used in) financing activities (3,822) (3,039) 284
Increase (decrease) in cash and cash equivalents from discontinuing operations
(44) (80) (5)
Increase (decrease) in cash and cash equivalents 1,149 (292) 2,424
Cash and cash equivalents in the beginning of the period 4,328 4,719 4,262
Effect of exchange rate changes on cash and cash equivalents (6) (99) 44
Cash of subsidiaries disposed (103) - (14)
Cash and cash equivalents, end of period 5,368 4,328 6,716
Non-cash transactions:
Additions to property, plant and equipment - interest capitalization
60 73 103

61
ANNEX 2 – VOLUMES SOLD, PRICES AND MARGINS
Volume sold - Minerals and metals ‘000 metric tons 1Q18 4Q17 1Q17
Iron ore fines 70,811 79,603 63,682
ROM 410 355 1,636
Pellets 13,125 13,579 12,582
Manganese ore 338 740 196
Ferroalloys 34 34 30
Thermal coal 1,065 1,228 1,031
Metallurgical coal 1,432 1,715 1,537
Nickel 58 80 72
Copper 88 111 100
Gold as by-product ('000 oz) 112 108 108
Silver as by-product ('000 oz) 494 602 545
PGMs ('000 oz) 73 68 104
Cobalt (metric ton) 1,276 1,368 892
Average prices
US$/ton 1Q18 4Q17 1Q17
Iron ore fines CFR reference price (dmt) 76.30 72.60 86.70
Iron ore fines CFR/FOB realized price 66.41 63.10 75.78
ROM 21.95 22.55 9.17
Pellets CFR/FOB (wmt) 120.78 104.71 115.96
Manganese ore 246.93 119.34 219.39
Ferroalloys 1,212.78 1,361.31 1,433.33
Thermal coal 82.00 78.57 68.16
Metallurgical coal 204.60 178.38 165.17
Nickel 13,637 11,781 10,547
Copper 5,827 6,735 5,661
Platinum (US$/oz) 1,041 880 917
Gold (US$/oz) 1,324 1,450 1,202
Silver (US$/oz) 15.47 15.48 13.50
Cobalt (US$/t) 70,588 57,680 45,415
Operating margin by segment (EBIT adjusted margin)
% 1Q18 4Q17 1Q17
Ferrous Minerals 45.6 44.4 56.2
Coal 10.3 3.2 (10.8)
Base Metals 18.0 19.2 4.3
Total¹ 36.0 34.2 39.9
¹ excluding non-recurring effects

62
ANNEX 3 – RECONCILIATION OF IFRS AND “NON-GAAP” INFORMATION (a) Adjusted EBIT¹
US$ million 1Q18 4Q17 1Q17
Net operating revenues 8,603 9,167 8,515
COGS (5,224) (5,791) (4,734)
SG&A (124) (146) (124)
Research and development (69) (104) (65)
Pre-operating and stoppage expenses (78) (125) (115)
Other operational expenses (80) (104) (77)
Dividends and interests on associates and JVs 70 236 -
Adjusted EBIT 3,098 3,133 3,400
¹ Excluding non-recurring effects.
(b) Adjusted EBITDA
EBITDA defines profit or loss before interest, tax, depreciation and amortization. Vale uses the term adjusted EBITDA to reflect exclusion of gains and/or losses on sale of assets, non-recurring expenses and the inclusion of dividends received from non-consolidated affiliates. However Vale’s adjusted EBITDA is not the measure defined as EBITDA under IFRS, and may possibly not be comparable with indicators with the same name reported by other companies. Adjusted EBITDA should not be considered as a substitute for operational profit or as a better measure of liquidity than operational cash flow, which are calculated in accordance with IFRS. Vale provides its adjusted EBITDA to give additional information about its capacity to pay debt, carry out investments and cover working capital needs. The following table shows the reconciliation between adjusted EBITDA and operational cash flow, in accordance with its statement of changes in financial position:
Reconciliation between adjusted EBITDA and operational cash flow US$ million 1Q18 4Q17 1Q17
Adjusted EBITDA 3,971 4,109 4,308
Working capital: - - -
Accounts receivable 17 173 498
Inventories 56 157 (221)
Suppliers (340) (131) 82
Payroll and related charges (541) 210 (242)
Others (105) 16 (369)
Adjustment for non-recurring items and other effects (115) (236) -
Cash provided from operations 2,943 4,298 4,056
Income taxes paid - current (240) (74) (368)
Income taxes paid - settlement program (125) (123) (121)
Interest paid for third parties (381) (352) (515)
Participative stockholders' debentures paid - (65) -
Derivatives received (paid), net (25) (17) (107)
Net cash provided by (used in) operating activities 2,172 3,667 2,945
(c) Net debt US$ million 1Q18 4Q17 1Q17
Total debt 20,276 22,489 29,570
Cash and cash equivalents¹ 5,375 4,346 6,793
Net debt 14,901 18,143 22,777
¹ Including financial investments
(d) Total debt / LTM Adjusted EBITDA
US$ million 1Q18 4Q17 1Q17
Total debt / LTM Adjusted EBITDA (x) 1.4 1.5 2.1
Total debt / LTM operational cash flow (x) 1.7 1.8 3.0
(e) LTM Adjusted EBITDA / LTM interest payments
US$ million 1Q18 4Q17 1Q17
Adjusted LTM EBITDA / LTM gross interest (x) 9.5 9.0 7.9
LTM adjusted EBITDA / LTM interest payments (x) 9.7 9.1 8.3
LTM operational profit / LTM interest payments (x) 7.1 6.7 5.4

63
ANNEX 4 – MANAGERIAL ALLOCATION CHANGES
Adjusted EBITDA US$ million 1Q17 2Q17 3Q17 4Q17 2017
Before managerial allocation changes
Ferrous Minerals 3,967 2,232 3,674 3,319 13,192
Coal 61 157 46 66 330
Base Metals 410 386 561 782 2,139
Others (130) (46) (89) (58) (323)
After managerial allocation changes
Ferrous Minerals 4,048 2,315 3,763 3,427 13,553
Coal 69 166 53 74 362
Base Metals 442 412 587 815 2,256
Others (251) (164) (211) (207) (833)
Pellets - EBITDA 1Q17 2Q17 3Q17 4Q17
US$
million US$/wmt
US$ million
US$/wmt US$
million US$/wmt
US$ million
US$/wmt
Before managerial allocation changes
Expenses (SG&A, R&D and other)
-16 -1.3 -16 -1.3 -29 -2.2 -30 -2.2
EBITDA 791 63 640 51 679 52 657 48
After managerial allocation changes
Expenses (SG&A, R&D and other)
-4 -0.3 -3 -0.2 -16 -1.2 -12 -0.9
EBITDA 803 63.9 653 52.4 692 52.7 675 49.7
Selected financial indicators - Ferrous Minerals
US$ million 1Q17 2Q17 3Q17 4Q17 2017
Before managerial allocation changes
Expenses¹ (16) (94) (116) (130) (356)
Adjusted EBITDA 3,967 2,232 3,674 3,319 13,192
Depreciation and amortization (417) (427) (456) (466) (1,766)
Adjusted EBIT 3,550 1,768 3,205 2,773 11,296
Adjusted EBIT margin (%) 55 35 47 41 45
After managerial allocation changes
Expenses¹ 65 (11) (27) (22) 5
Depreciation and amortization (399) (414) (442) (454) (1,709)
Adjusted EBIT 3,649 1,901 3,321 2,973 11,844
Adjusted EBIT margin (%) 56 37 49 44 47
¹ Net of depreciation and amortization
Selected financial indicators - Iron ore fines
US$ million 1Q17 2Q17 3Q17 4Q17 2017
Before managerial allocation changes
Adjusted EBITDA (US$ million) 3,094 1,502 2,888 2,567 10,051
Adjusted EBITDA (US$/t) 49 22 38 32 35
After managerial allocation changes
Adjusted EBITDA (US$ million) 3,161 1,570 2,961 2,654 10,346
Adjusted EBITDA (US$/t) 50 23 39 33 36

64
Selected financial indicators - Pellets
US$ million 1Q17 2Q17 3Q17 4Q17 2017
Before managerial allocation changes
Adjusted EBITDA (US$ million) 791 640 679 657 2,767
Adjusted EBITDA (US$/t) 63 51 52 48 53
After managerial allocation changes
Adjusted EBITDA (US$ million) 803 653 692 675 2,823
Adjusted EBITDA (US$/t) 64 52 53 50 55
Selected financial indicators - Ferrous ex Manganese and Ferroalloys
US$ million 1Q17 2Q17 3Q17 4Q17 2017
Before managerial allocation changes
Adjusted EBITDA (US$ million) 3,930 2,199 3,617 3,271 13,017
Adjusted EBITDA (US$/t) 50 27 40 35 38
After managerial allocation changes
Adjusted EBITDA (US$ million) 4,010 2,281 3,705 3,378 13,374
Adjusted EBITDA (US$/t) 51 28 41 36 39
Iron ore and pellets cash break-even landed in China¹ US$/t 1Q17 2Q17 3Q17 4Q17 2017
Before managerial allocation changes
Iron ore fines expenses³ & royalties 2.6 3.9 3.5 3.6 3.4
Iron ore fines EBITDA break-even (US$/dmt) 32.4 36.4 31.0 35.2 33.8
Iron ore fines pellet adjustment (2.1) (1.9) (1.0) (1.3) (1.5)
Iron ore fines and pellets EBITDA break-even (US$/dmt) 30.4 34.4 30.0 33.9 32.2
Iron ore fines sustaining investments 3.8 2.8 2.9 3.4 3.2
Iron ore fines and pellets cash break-even landed in China (US$/dmt)
34.2 37.2 32.9 37.3 35.5
After managerial allocation changes
Iron ore fines expenses³ & royalties 1.5 2.9 2.5 2.5 2.4
Iron ore fines EBITDA break-even (US$/dmt) 31.3 35.3 29.9 34.0 32.6
Iron ore fines pellet adjustment (2.3) (2.2) (1.2) (1.8) (1.9)
Iron ore fines and pellets EBITDA break-even (US$/dmt) 29.1 33.1 28.7 32.2 30.8
Iron ore fines sustaining investments 4.0 3.1 3.2 4.0 3.6
Iron ore fines and pellets cash break-even landed in China (US$/dmt)
33.1 36.1 31.8 36.1 34.3
¹ Measured by unit cost + expenses + sustaining investment adjusted for quality
³ Net of depreciation and includes dividends received
Iron Ore Fines Costs and Expenses in BRL R$/t 1Q17 2Q17 3Q17 4Q17 2017
Before managerial allocation changes
Expenses¹ 2.7 7.3 6.6 6.2 5.8
After managerial allocation changes
Expenses¹ (0.5) 4.1 3.5 2.7 2.5
¹ Net of depreciation
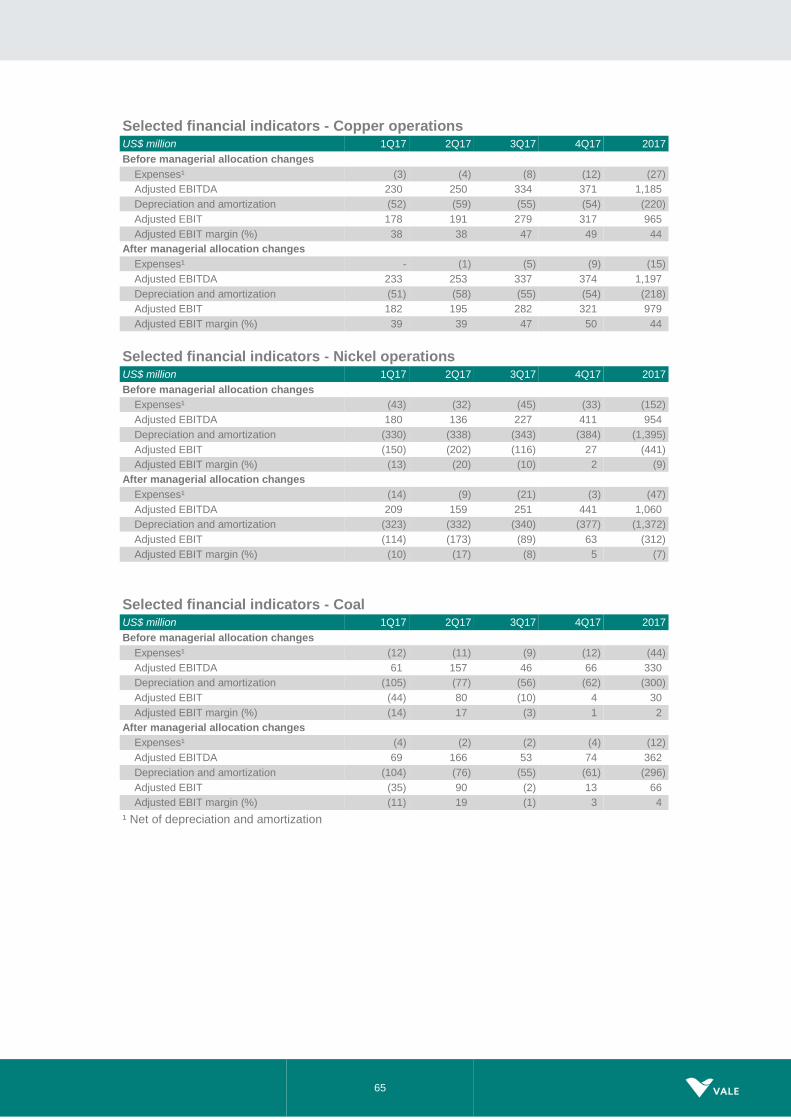
65
Selected financial indicators - Copper operations US$ million 1Q17 2Q17 3Q17 4Q17 2017
Before managerial allocation changes
Expenses¹ (3) (4) (8) (12) (27)
Adjusted EBITDA 230 250 334 371 1,185
Depreciation and amortization (52) (59) (55) (54) (220)
Adjusted EBIT 178 191 279 317 965
Adjusted EBIT margin (%) 38 38 47 49 44
After managerial allocation changes
Expenses¹ - (1) (5) (9) (15)
Adjusted EBITDA 233 253 337 374 1,197
Depreciation and amortization (51) (58) (55) (54) (218)
Adjusted EBIT 182 195 282 321 979
Adjusted EBIT margin (%) 39 39 47 50 44
Selected financial indicators - Nickel operations US$ million 1Q17 2Q17 3Q17 4Q17 2017
Before managerial allocation changes
Expenses¹ (43) (32) (45) (33) (152)
Adjusted EBITDA 180 136 227 411 954
Depreciation and amortization (330) (338) (343) (384) (1,395)
Adjusted EBIT (150) (202) (116) 27 (441)
Adjusted EBIT margin (%) (13) (20) (10) 2 (9)
After managerial allocation changes
Expenses¹ (14) (9) (21) (3) (47)
Adjusted EBITDA 209 159 251 441 1,060
Depreciation and amortization (323) (332) (340) (377) (1,372)
Adjusted EBIT (114) (173) (89) 63 (312)
Adjusted EBIT margin (%) (10) (17) (8) 5 (7)
Selected financial indicators - Coal US$ million 1Q17 2Q17 3Q17 4Q17 2017
Before managerial allocation changes
Expenses¹ (12) (11) (9) (12) (44)
Adjusted EBITDA 61 157 46 66 330
Depreciation and amortization (105) (77) (56) (62) (300)
Adjusted EBIT (44) 80 (10) 4 30
Adjusted EBIT margin (%) (14) 17 (3) 1 2
After managerial allocation changes
Expenses¹ (4) (2) (2) (4) (12)
Adjusted EBITDA 69 166 53 74 362
Depreciation and amortization (104) (76) (55) (61) (296)
Adjusted EBIT (35) 90 (2) 13 66
Adjusted EBIT margin (%) (11) 19 (1) 3 4
¹ Net of depreciation and amortization