Embed Size (px)
Citation preview
Validating the Organizational Climate Measure for Norwegian Universities and
Colleges (NOCM_UH)
Marita Nordgård
Master of Philosophy in Psychology
Department of Psychology
University of Oslo
May 2011

1
Validating the Norwegian Organizational Climate Measure for Universities and
Colleges (NOCM_UH)
Marita Nordgård
Department of Psychology
University of Oslo, Norway
Abstract: Organizational climate predicts individual and organizational outcomes.
One established measure of organizational climate is the organizational climate measure
(OCM) developed by Patterson et al. (2005). However, Patterson and colleagues argue that
climate measures have little descriptive power and that respondents often are confused when
answering climate questionnaires as to which target they should answer according to. To
ensure the questionnaire’s descriptive power and applicability in the educational sector, Hoff
(2010) adjusted the existing OCM resulting in 7 additional sub-dimensions that aimed to
capture the uniqueness of the organizational structure and objectives (research, teaching, and
societal gains). One new dimension that was related to team and teamwork was also added.
This article investigates the validity of the NOCM_UH. A sample of 470 employees at 20
different institutes and departments within the education sector completed the questionnaire.
Results from confirmatory factor analysis indicated good levels of fit, supporting both the
adjustments implemented by Hoff (2010) and the 22-latent factor structure model. However,
values of interrater agreement did not yield acceptable results, indicating that the current
sample results should not be aggregated to the organizational level. However, as the
confirmatory factor analysis achieved acceptable fit, it was concluded that the NOCM_UH is
applicable in the Norwegian educational sector.
2
Introduction
Factors that contribute to an organization‟s success have for long been of interest for
social scientists (Pickle & Friedlander, 1967). Extensive research has shown the importance
of employee contribution at the work place and its effect on organizational outcome (De
Cuyper, Van der Heijden, & De Witte, 2011). One contribution that is indicated to correlate
positively with organizational success is the employees‟ shared perception of practices and
procedures at the work place such as handling innovative ideas, the extent of performance
feedback given, and their perception of autonomy; these perceptions are often described as the
organizational climate of the organization (Patterson et al., 2005).
Organizational climate is defined as the employees‟ perceptions of the work place
practices, events, and procedures (Schneider & Reichers, 1983; e.g. Ashkenasy, Wilderom, &
Peterson, 2000; Schneider, 1990) and claims to predict future employee outcomes such as
compliance with safety procedures and regulations (Neal, Griffin, & Hart, 2000), job
satisfaction (Johnson & McIntye, 1998), and organizational outcomes such as service quality
(Ehrhart, Schneider, Witt, & Perry, 2011) and organizational efficiency (Arnetz, Lucas, &
Arnetz, 2011).
Research on organizational climate has existed since the beginning of the 1940s
(Schneider, Ehrhart, & Macey, 2011). Consequently several approaches to measure
organizational climate exist. Questionnaires are the most frequent method to measure climate
(Patterson et al., 2005). Some of these questionnaires have been locally developed, while
others are more standardized measurements (Hunter, Bedell, & Mumford, 2007). Patterson
and colleagues (2005) argued that because of all the inconsistencies in the measurements, it
was not possible to draw clear research conclusions regarding proper measurements on
organizational climate. For example, Patterson et al. (2005) argued that Goodman and
Svyantek (1999) used their Organizational Climate Questionnaire to measure dimensions of
culture; a related topic often confused with climate (Rentsch, 1990; Payne, 2000). In order to
solve such problems, Patterson and colleagues (2005) decided to develop a more thoroughly
validated questionnaire that would measure the global organizational climate. This resulted in
the development of the Organizational Climate Measure (OCM).
OCM consists of 17 dimensions that cover different aspects of organizational
efficiency such as employees‟ perception of supervisory support (e.g. Nijman & Gelissen,
2011), the organization‟s emphasis on training (e.g. Almeida-Santos, Chzhen, & Mumford,
2010), the organization‟s orientation towards change (e.g. Zhou & Wu, 2009; West & Farr,
1990), and employee welfare (e.g. Jiao, 2010). Based on the Competing Values Model
3
framework (CVM) by Quinn and colleagues (Quinn & Rohrbaugh, 1983; Quinn & McGrath,
1982; Quinn, 1988) the OCM has received support as a solid theoretical model (Bernstrøm,
Lone, Bjørkli, Ulleberg, & Hoff, 2011; Lamond, 2003; Kwan & Walker, 2004; Howard
1998). (For more about CVM see Patterson et al., 2005). OCM is argued to be a
comprehensive and general model of organizational efficiency, and is therefore said to be a
valid model across sectors and countries (Bernstrøm et al., 2011; Patterson et al., 2005).
However, because OCM is meant to be applicable to many sectors, it is reasonable to assume
that it is a general model rather than a specific model. Thus the OCM might be general
enough to be applicable to every sector, but it might also be too general to be able to capture
contextual aspects specific for a particular sector.
Patterson and colleagues (2005) pointed out that climate measures might yield a
contextual problem. They argued that climate measures show little descriptive power
(Patterson et al., 2005) as a result of too general phrases and targets (e.g. Howe, 1977;
Schneider & Reichers, 1983). This means that when answering climate measure
questionnaires, the respondents are not completely sure as to which target they should answer
according to (team, department, or organization). When speaking of the development of the
OCM instrument Patterson and colleagues (2005) argued: “The content and wording of such
measures should therefore be relevant and comprehensible to all organizational members “ (p.
383). However, to develop the OCM instrument to be a general model that it is applicable to
every employee and every sector might decrease the model‟s ability to consider contextual
aspects within most sectors. Is it possible to make a general model like OCM considerate of
contextual aspects within a specific organization or sector? The current article aims to explore
this issue.
The Norwegian Organizational Climate Measure for Universities and Colleges
(NOCM_UH)
Hoff (2010) attempted to consider the contextual aspects within a sector and tailored
the OCM to the educational sector (i.e. universities and colleges). Hoff (2010) adjusted the
original OCM to fit local and contextual aspects of the educational sector and thereby
simplified which target to answer according to. As the OCM is argued to be an established
model (Bernstrøm el al., 2011), the original dimensions are assumed to be fairly valid for the
educational sector as well as any other sector; therefore the original dimensions in OCM were
believed to be applicable to universities. However, Hoff (2010) considered other studies with
empirical results that led Hoff to argue one dimension was missing from the OCM instrument

4
(Hønsen, 2010). This dimension consisted of factors important within the educational sector;
factors related to team and teamwork.
Content Adjustments
By focusing on the content captured by the OCM, a thorough qualitative analysis of
open, unstructured interviews regarding aspects of organizational climate at universities was
carried out by Hønsen (2010). Statements were categorized according to the OCM dimensions
by way of thematic analysis. Statements that did not fit OCM dimensions were content
analyzed. The result of the content analysis revealed that 30.42% of the residual statements
were related to teamwork issues and that the original OCM categories only explained 50% of
the data. Based on the results by Hønsen (2010), Hoff (2010) therefore developed a „Team‟
dimension in addition to the 17 dimensions in the original OCM. With the additional
dimension, the model explained 65.18% of the data. Consequently, empirical results
supported the addition of a team dimension to the OCM instrument (Hønsen, 2010). Because
teamwork clearly was an important topic in the organizational climate of universities, the
team dimension consisted of 7 questions aimed at covering central aspects of team dynamics.
The dimension covered team aspects like efficiency, effectiveness, a joint focus on task and
human relation issues, and cohesiveness.
Besides the team dimension, the original OCM dimensions had received extensive
support and were believed to be valid and applicable to all sectors including the educational
sector. Since the empirical study conducted by Hønsen (2010) only argued for the addition of
one new dimension, Hoff (2010) made no further attempt to investigate whether there were
additional factors that should be considered. Therefore, the following adjustments to fit the
context and structure of the educational sector were only adjustments on the original 17 OCM
dimensions (Hoff, 2010). By focusing on the original dimensions there were several
adjustments implemented by Hoff (2010) that targeted structural aspects within the
educational sector.
Structural Adjustments
One central topic in Scandinavian universities and colleges is the distinction between
scientific staff (teaching and research) and support staff (HR, IT, maintenance, finance, and
others) (Hoff, 2010). When asked about integration (an OCM dimension tapping the internal
communication of a division or department), there is potentially a big difference between
internal communication among scientific staff, and internal communication between scientific
and support staff. Hence, Hoff (2010) split the integration dimension into two separate
5
dimensions. (For more on organizational climate in relation to structure and context see e.g.
Payne & Mansfield, 1973).
Furthermore, universities produce three types of products that might be rather different
in nature: research, teaching, and societal benefits (Hoff, 2010). Because they are fairly
different, it is quite conceivable to have a high score for research and a low score for teaching,
or vice versa. Hence, Hoff (2010) split the outward focus dimension of OCM into the three
aforementioned dimensions: research, teaching, and societal benefits, respectively. Because
the product is split into three different functions, the quality dimension in the original OCM
should be split accordingly. However, Hoff (2010) only splits this dimension into quality of
research and quality of teaching, and gave no explanation as to why societal benefits were not
measured as a separate quality dimension. Based on the structural and content changes of the
original OCM, the NOCM_UH consisted of 22 dimensions, as opposed to the original 17. See
Table 1 on the following page for description of the new dimensions of NOCM_UH (Hoff,
2010).
Moreover, as the distinction between support staff and scientific staff is profound,
Hoff (2010) conducted an additional split. This split was a partition of the questionnaire in its
whole. Patterson et al. (2005) argued that the wordings and content of the climate
questionnaire should be relevant and comprehensive by all employees, therefore one part was
tailored at scientific employees while the other part targeted support staff. The differences
between the questionnaires could the insertion of a specific name to a target in a statement.
For instance, in the questionnaire for support staff, a statement was “ways of improving the
communication with society in general is not given much thought in the technical
/administrative unit”, whereas a scientific employee would be given a similar statement
“ways of improving the communication with society in general is not given much thought”.
(For a more detailed presentation on how the NOCM_UH items were adjusted, see Sample
and Procedure in the methods section). An overview of the questionnaire for scientific staff is
found in Appendix A and for support staff in Appendix B.

6
Table 1. New NOCM_UH Dimensions Adjusted From Previous OCM Dimensions.
Previous
Dimensions
New Dimensions Content
Integration
Integration within the group (among support
staff or within the scientific staff).
The level of interdepartmental
communication and trust within the closest
group.
Integration between groups (between the
support staff and scientific staff).
The level of interdepartmental
communication and trust between groups.
None Team
Level of cooperation, cohesiveness,
effectiveness, sharing of information, group
support, and flexibility in permanent or
semi-permanent work groups.
Outward focus
Outward focus – Teaching. The level of communication and responsiveness to students‟ needs.
Outward focus - Research
The level of communication and
responsiveness to the external research
community.
Outward focus - Society The level of communication and
responsiveness to societal needs.
Quality
Quality – Research
The focus on the research quality and the
perception of importance of delivering high
quality research.
Quality – Teaching
The focus on the teaching quality and the
perception of importance of delivering high
quality teaching.
Aim of This Study
To test the new climate instrument, the present article investigated whether statistical
analysis would support the 22-latent factor structure. If the 22-latent factor structure was
supported, the new dimensions would be seen as factorially distinct and thus providing the
OCM with additional information. If the results indicated that to be the case, then Hoff‟s
(2010) contribution and adjustments to the OCM instrument might provide new solutions on
how to increase descriptive power within climate questionnaires. Therefore, the aim of the
current article was to carry out an empirical validation of the NOCM_UH developed by Hoff
(2010) by way of confirmatory factor analysis (CFA). Hoff (2010) made several adjustments
and all of these adjustments should be extensively tested.
Firstly, one should investigate if the new team dimension is factorial distinct and
belongs in a climate measure targeting/for universities. Further, even though there are
theoretical reasons to partitioning the three original dimensions (integration, outward focus,
and quality), empirical research should be conducted to see if empirical results also would
support such a partitioning. In other words, does the 7 new dimensions (integration*2,

7
outward focus*3, and quality*2) contain more information than the original 3? By including
the team dimension the current article tests if the 8-factor model indicates a better fit than the
4-factor model. Assuming that the new adjustments have only increased descriptive power,
the author assumes that the 8-factor model will convey a better fit. Therefore, the current
article hypothesize the following:
Hypothesis 1a: Confirmatory factor analysis finds a better model fit for the 8-factor
model than for the 4-factor model.
Secondly, even though scientific staff and support staff were given somewhat different
questionnaires, the aim was to only add contextual aspects and not to ask different questions.
In other words, if the NOCM_UH adjustments only differed according to context, then the
factor structure should remain stable for both groups. Therefore, the current article
hypothesize the following:
Hypothesis 1b: Confirmatory factor analysis finds a better model fit for the 8-factor
model than for the 4-factor model among scientific staff.
Hypothesis 1c: Confirmatory factor analysis finds a better model fit for the 8-factor
model than for the 4-factor model among support staff.
Thirdly, based on the theoretical assumption that OCM can be generalized across
organizational sectors and countries, the current article assumed the OCM‟s 17 original
dimensions to also be applicable to the educational sector. This includes the new adjustments
because the adjustments on the OCM instrument was only adjusted to increase descriptive
power as recommended by Patterson et al. (2005). Statistical analysis should therefore support
the 22-latent factor structure (Costello & Osborne, 2005). Previous results on the OCM‟s
factor structure (Bernstrøm et al., 2011; Patterson et al., 2005) have found support for a 17-
latent factor structure. Therefore; this article attempted to investigate whether the original
OCM also could be generalized to the educational sector. Based on the original 17 dimensions
alongside with Hoff‟s (2010) new adjustments to increase the instruments‟ descriptive power,
the present article investigated whether the overall 22-latent factor structure would receive
support within Norwegian universities and colleges. Therefore, the current article hypothesize
the following:
Hypothesis 2a: Confirmatory factor analysis supports the new 22-latent factor
structure constituting NOCM_UH.

8
Fourthly, assuming that support staff had received and answered the same
questionnaire as scientific staff, the current article assumed to find indications of the same
factor structure among support staff (HR, IT, maintenance, finance, and others) and among
scientific staff. Therefore, the current article hypothesize the following two:
Hypothesis 2b: Confirmatory factor analysis supports a 22-latent factor structure
among technical/administrative staff.
Hypothesis 2c: Confirmatory factor analysis supports a 22-latent factor structure
among scientific staff.
Method
Sample and Procedure
To ensure the continued contextual adaptations of the NOCM_UH, the current article
did some continued adjustments on the NOCM_UH. By use of four university employees
(two employees from support staff and two employees from scientific staff) the research team
(three master students, including this article‟s author, and two researchers) conducted a
Think-Aloud (TA) pilot of the questionnaire, in an attempt to discover where the
questionnaires‟ descriptive power was weak. A TA is a pragmatic approach where a sample of
respondents from an equivalent sample of the target sample (in this case employees at a
university or college), answers the whole questionnaire while speaking out loud about
thoughts, future actions, analytical resonance, and questions. (e.g. Oort, Schröder, and French,
2011). While speaking out loud a member of the research team took notes of the comments or
constraints reported by the respondent. The positive outcome of conducting a TA was that it
gave immediate feedback on how an actual respondent or user perceived and believed the
content and relevance of the NOCM_UH. Mainly, which target the respondent was answering
about and according to what perspective. After going through the results, the research team
added “here” to most statements, in order to specify that respondents should answer according
to their closest department or institute and not to different parts within the organization
(Rousseau, 1988). Insertion of specific target names were also implemented, as the majority
of respondents were unsure whether to answer according to the institute, the faculty level, or
the university as a whole.
Further procedures within the questionnaire were a replication of the Bernstrøm et al.
study (2011) as the items were not randomly arranged, but rather arranged by their attachment
to a scale. It is argued that researchers probably want to extract scales relevant to the aim of
their study. Therefore, the scales presented with their items attached will be more similar to
9
the way they will be used in later studies. Hence, they were not randomized (Bernstrøm et al.,
2011; Patterson et al., 2005). See Appendix A and B for an overview of the item order.
The NOCM_UH questionnaire was administered to 808 employees from twenty
different departments or institutes at three different universities and colleges (høgskoler) in
Norway. In return for their participation, most schools were promised individual reports at
faculty level. The questionnaire was sent through an online service (Questback) and answered
via e-mail. The respondents were asked to answer questions regarding their work climate
where they would answer according to their perception of their work place in general and not
according to specific events. All respondents were ensured that the data would not be used for
other purposes than this current study and that the data would be deleted after analysis.
Respondents were also assured that their responses were anonymous and would not be linked
back to them.
Management in each department briefed their employees on the matter and asked all
employees to participate. The employees were separated by type of job-position consisting of
two groups. Group one was scientific employees, such as professors and researchers. Group
two was comprised of support staff, such as technical and administrative staff. In all, 470
employees completed the questionnaire, resulting in a 58% response rate. This is a very high
response percentage for this type of studies (Baruch & Holtom, 2008). Scientific staff
consisted of 67,23% of the sample (N=316) and technical/administrative staff consisted
32,77% (N=154).
To check for response biases, logistic regression was conducted between the
respondents that answered after the first e-mail invitation and those who did not respond till
after the first reminder. There were no significant difference between the groups (p<.01)
regarding the 22 dimensions.
Two items were deleted from the questionnaire as they were only given to one of the
groups (scientific staff). The items correlated with the other items, item1: r=.518 and item2:
r=.491, within the same dimension, assumed to reveal no new information. The items were at
the very end of the questionnaire and therefore not believed to affect the answers to other
questions. Consequently, these two items were excluded from all further analysis. (See
Appendix A to see which items were deleted, items are marked in bold).
There were no missing values as it was made mandatory to answer all questions
resulting in less bias and no loss of information (Sterne et al., 2009). On the other hand, by
giving respondents no choice but to answer all questions, information about the questions‟
relevance may be lost. In other words, if a question seem irrelevant to a respondent, they must
10
answer it anyway, giving no feedback to researchers about redundant or misplaced questions.
Data were collected from November 4, 2010 to March 22, 2011.
Questionnaire
The questionnaire was a renewed version of OCM, re-named NOCM_UH. For a full
version see Appendix A and B. The questionnaire was administered in both Norwegian and
English, as some of the employees did not speak Norwegian. The questions in Norwegian
were from the Norwegian organizational climate measure (NOCM) questionnaire by
Bernstrøm and colleagues (2011), which was a translated and back translated version of the
original OCM. The additional dimensions and items were developed by Hoff (2010) and
implemented by the research team.
The NOCM_UH consisted of 106 items in total, spread on the 22 scales. The number
of items per scale varied from 3 to 7. The response format was a four point Likert scale,
ranging from 1: „agree’, to 4: ‘disagree’.
Results
Confirmatory Factor Analysis
Hypothesis 1a argued that the new adjustments have only increased the instruments‟
descriptive power by adding contextual adjustments and therefore assumed that the 8-factor
(integration*2, outward focus*3, and quality*2, and team) model would convey a better
model fit than the 4-factor model (integration, outward focus, and quality, and team). By
using Structural Equation Modeling (SEM) the 8-factor model and the 4-factor model were
compared. All models were estimated using AMOS 16.0 (Arbuckle, 1997-2007). The results
from the confirmatory factor analysis are shown in Table 2. Included are the chi-square and
the degrees of freedom, as the model fits are a function of these numbers (Curran, Bollen,
Chen, Paxton, Kirby, 2003).
There are several ways to interpret the model fit and there is no overall agreement on
one analysis that yields better values than the others (Fan & Sivo, 2007). Some statistical tests
are highly sensitive to sample size, some are dependent on the sample being normally
distributed (e.g. McIntosh, 2007), while others are affected by the number of parameters (e.g.
Hooper, Coughlan, & Mullen, 2008). Therefore, several indices of model fit are included.
However, even though Patterson et al. (2005) utilized the Tucker-Lewis Index (TLI) (also
known as Non-Normed Fit Index, NNFI), the current article will not discuss this value as it
prefers simpler models, similar to the RMSEA (Hooper et al., 2008).
11
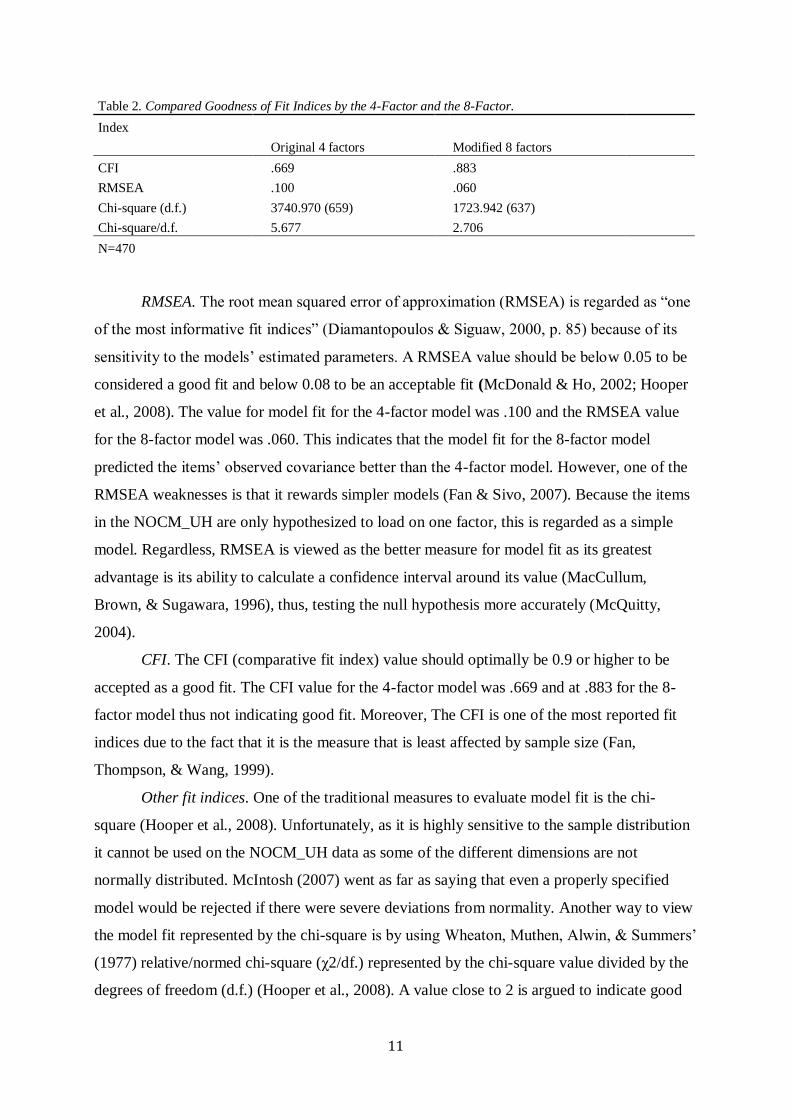
Table 2. Compared Goodness of Fit Indices by the 4-Factor and the 8-Factor.
Index
Original 4 factors Modified 8 factors
CFI .669 .883
RMSEA .100 .060
Chi-square (d.f.) 3740.970 (659) 1723.942 (637)
Chi-square/d.f. 5.677 2.706
N=470
RMSEA. The root mean squared error of approximation (RMSEA) is regarded as “one
of the most informative fit indices” (Diamantopoulos & Siguaw, 2000, p. 85) because of its
sensitivity to the models‟ estimated parameters. A RMSEA value should be below 0.05 to be
considered a good fit and below 0.08 to be an acceptable fit (McDonald & Ho, 2002; Hooper
et al., 2008). The value for model fit for the 4-factor model was .100 and the RMSEA value
for the 8-factor model was .060. This indicates that the model fit for the 8-factor model
predicted the items‟ observed covariance better than the 4-factor model. However, one of the
RMSEA weaknesses is that it rewards simpler models (Fan & Sivo, 2007). Because the items
in the NOCM_UH are only hypothesized to load on one factor, this is regarded as a simple
model. Regardless, RMSEA is viewed as the better measure for model fit as its greatest
advantage is its ability to calculate a confidence interval around its value (MacCullum,
Brown, & Sugawara, 1996), thus, testing the null hypothesis more accurately (McQuitty,
2004).
CFI. The CFI (comparative fit index) value should optimally be 0.9 or higher to be
accepted as a good fit. The CFI value for the 4-factor model was .669 and at .883 for the 8-
factor model thus not indicating good fit. Moreover, The CFI is one of the most reported fit
indices due to the fact that it is the measure that is least affected by sample size (Fan,
Thompson, & Wang, 1999).
Other fit indices. One of the traditional measures to evaluate model fit is the chi-
square (Hooper et al., 2008). Unfortunately, as it is highly sensitive to the sample distribution
it cannot be used on the NOCM_UH data as some of the different dimensions are not
normally distributed. McIntosh (2007) went as far as saying that even a properly specified
model would be rejected if there were severe deviations from normality. Another way to view
the model fit represented by the chi-square is by using Wheaton, Muthen, Alwin, & Summers‟
(1977) relative/normed chi-square (χ2/df.) represented by the chi-square value divided by the
degrees of freedom (d.f.) (Hooper et al., 2008). A value close to 2 is argued to indicate good
12
fit (Wheaton et al., 1977; Tabachnick & Fidell, 2007). The value obtained for the 4-factor
model was at 5.677 and at 2.706 for the 8-factor model. Thus, the 8-factor model indicated a
better fit.
Results for Hypothesis 1a summarized. Based on the results from the CFA the model
fit indices for the 8-factor model were significantly better than for the 4-factor model
indicating that the 8-factor model fits the data better. Therefore hypothesis 1a was confirmed.
Hypothesis 1b predicted that the confirmatory factor analysis would support the 8-
factor model among scientific staff. Confirmatory factor analysis compared the model fit of
both the 4-factor and the 8-factor structure. Table 3 depicts the values for the scientific staff.
Table 3. Goodness of Fit Indices of the 4 Factors and the 8 Factors Between Scientific Staff.
Index
Original 4 factors Modified 8 factors
CFI .656 .863
RMSEA .106 .068
Chi-square (d.f.) 2987.987 (659) 1562.878 (637)
Chi-square/d.f. 4.534 2.453
N=316
RMSEA. The RMSEA value obtained for the 4-factor model was at .106 among scientific
staff, indicating a poor fit. However, the value for the modified 8-factor model indicated
acceptable fit, RMSEA=.068.
CFI. The CFI value for the 4-factor model was at .656 indicating poor fit. Moreover,
the CFI value for the modified 8-factor model was at .863 also indicating poor fit.
Other fit indices. The relative chi-square (CMIN/d.f.) had a value of 4.534 for the 4-
factor model and a value at 2.453 for the 8-factor model. This indicates a better fit for the 8-
factor model.
Results for Hypothesis 1b summarized. Based on these results the 8-factor model
indicated a better model fit between the scientific employees, implying that the 8-factor model
describes the data better. Hence hypothesis 1b was confirmed.
Hypothesis 1c predicted that the results from the CFA would support the 8-factor
model among support staff. Confirmatory factor analysis compared the model fit of both the
4-factor and the 8-factor structure. See Table 4 for goodness of fit indices for both the original
4-factor model and the modified 8-factor model among support staff.
13
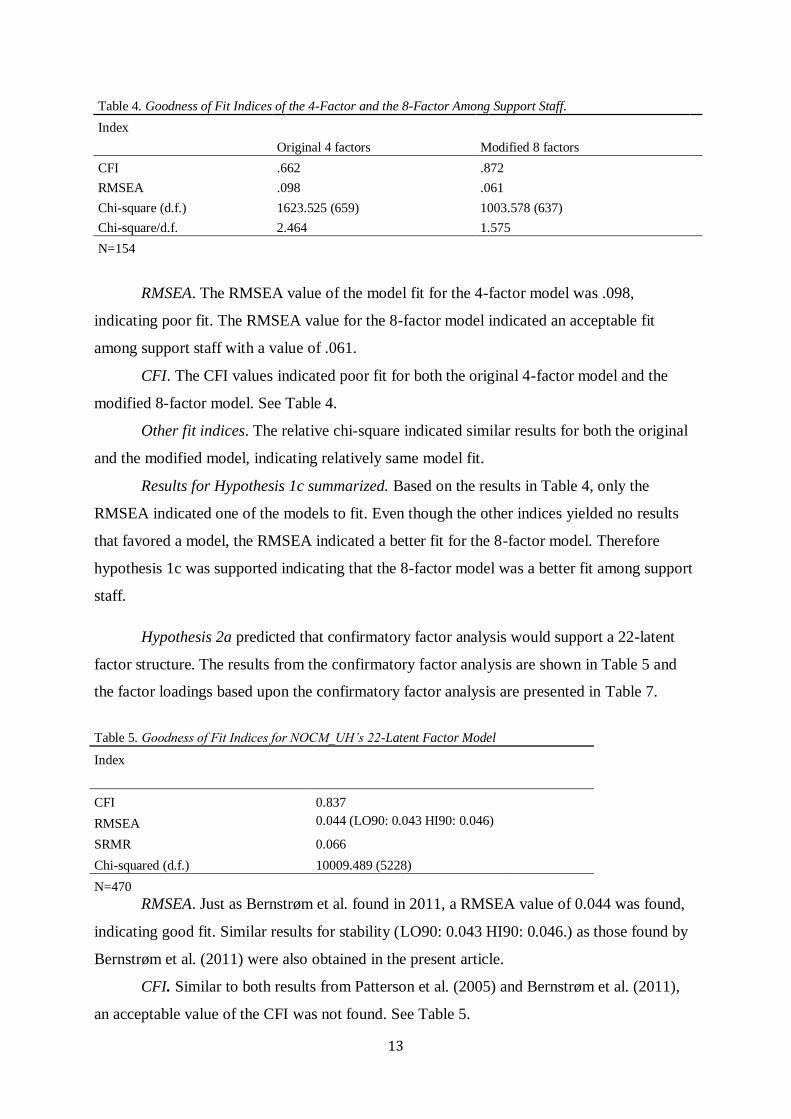
Table 4. Goodness of Fit Indices of the 4-Factor and the 8-Factor Among Support Staff.
Index
Original 4 factors Modified 8 factors
CFI .662 .872
RMSEA .098 .061
Chi-square (d.f.) 1623.525 (659) 1003.578 (637)
Chi-square/d.f. 2.464 1.575
N=154
RMSEA. The RMSEA value of the model fit for the 4-factor model was .098,
indicating poor fit. The RMSEA value for the 8-factor model indicated an acceptable fit
among support staff with a value of .061.
CFI. The CFI values indicated poor fit for both the original 4-factor model and the
modified 8-factor model. See Table 4.
Other fit indices. The relative chi-square indicated similar results for both the original
and the modified model, indicating relatively same model fit.
Results for Hypothesis 1c summarized. Based on the results in Table 4, only the
RMSEA indicated one of the models to fit. Even though the other indices yielded no results
that favored a model, the RMSEA indicated a better fit for the 8-factor model. Therefore
hypothesis 1c was supported indicating that the 8-factor model was a better fit among support
staff.
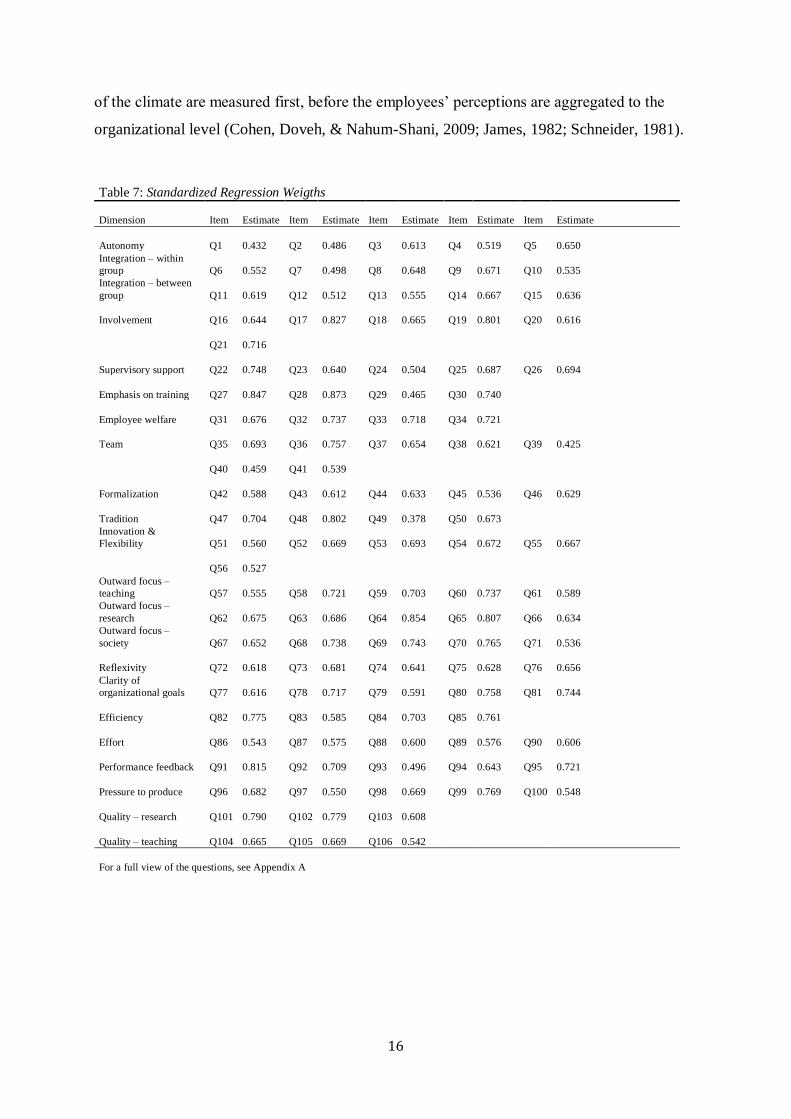
Hypothesis 2a predicted that confirmatory factor analysis would support a 22-latent
factor structure. The results from the confirmatory factor analysis are shown in Table 5 and
the factor loadings based upon the confirmatory factor analysis are presented in Table 7.
Table 5. Goodness of Fit Indices for NOCM_UH’s 22-Latent Factor Model
Index
CFI 0.837
RMSEA 0.044 (LO90: 0.043 HI90: 0.046)
SRMR 0.066
Chi-squared (d.f.) 10009.489 (5228)
N=470
RMSEA. Just as Bernstrøm et al. found in 2011, a RMSEA value of 0.044 was found,
indicating good fit. Similar results for stability (LO90: 0.043 HI90: 0.046.) as those found by
Bernstrøm et al. (2011) were also obtained in the present article.
CFI. Similar to both results from Patterson et al. (2005) and Bernstrøm et al. (2011),
an acceptable value of the CFI was not found. See Table 5.

14
SRMR. The standardized root mean square residual (SRMR) measures the differences
between the predicted covariance and the observed variance. The values for the SRMR range
from 0 to 1, where 0 indicates perfect fit. Acceptable levels should be below 0.08 (Hu &
Bentler, 1999). The current article received a value of 0.066, indicating a good fit. However, it
is important to know that the SRMR value will decrease as the number of parameters increase
(Hooper et al., 2008). With a model like the NOCM_UH regarding number of items, the
SRMR value might have been influenced by this.
Other fit indices. The relative chi-square value was close to 2, value=1.914, that is
argued to indicate good fit (Wheaton et al., 1977; Tabachnick & Fidell, 2007).
Other indicators. Similar to the result of Bernstrøm et al. (2011) the results from the
confirmatory factor analysis indicated high factor loadings between the items and the
respective dimensions (factor loadings above .50 for most items) which further supported the
22-factor model. See Table 7 for a full overview of factor loadings for all items in each
dimension. However, the current article found a Cronbach‟s alpha above 0.70 for all factors
including autonomy (most dimensions exceeded .80), which differed from the findings of
Patterson et al. (2005) and Bernstrøm et al. (2011) as autonomy had previously not exceeded
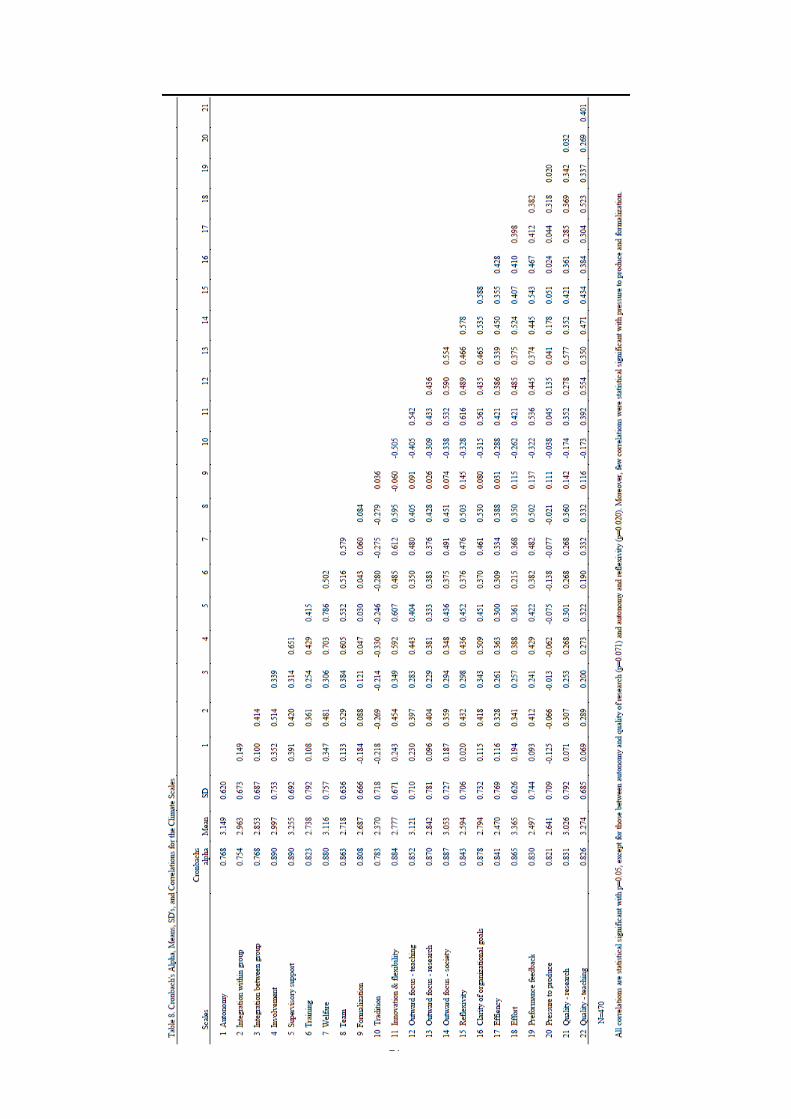
.70. This further supported the model in the present article. Some factors correlated highly
with each other (welfare and supervisory support had a correlation of .786 and welfare and
involvement had a correlation of .703). However, modification indices in SEM suggested no
further modifications would improve the model fit significantly. For a more detailed version
see descriptive statistics and inter-correlations for the 22 NOCM_UH dimensions in Table 8.
Results for Hypothesis 2a summarized. Based on the results from the CFA all fit
indices (except the CFI) indicated a good fit. Hence hypothesis 2a was confirmed.
Hypothesis 2b and 2c. To investigate differences between support staff and scientific
staff a CFA was conducted on these groups separately. Hypothesis 2b and 2c predicted that
these would both find support for a 22-latent factor structure. Table 6 shows the results from
this analysis.
15
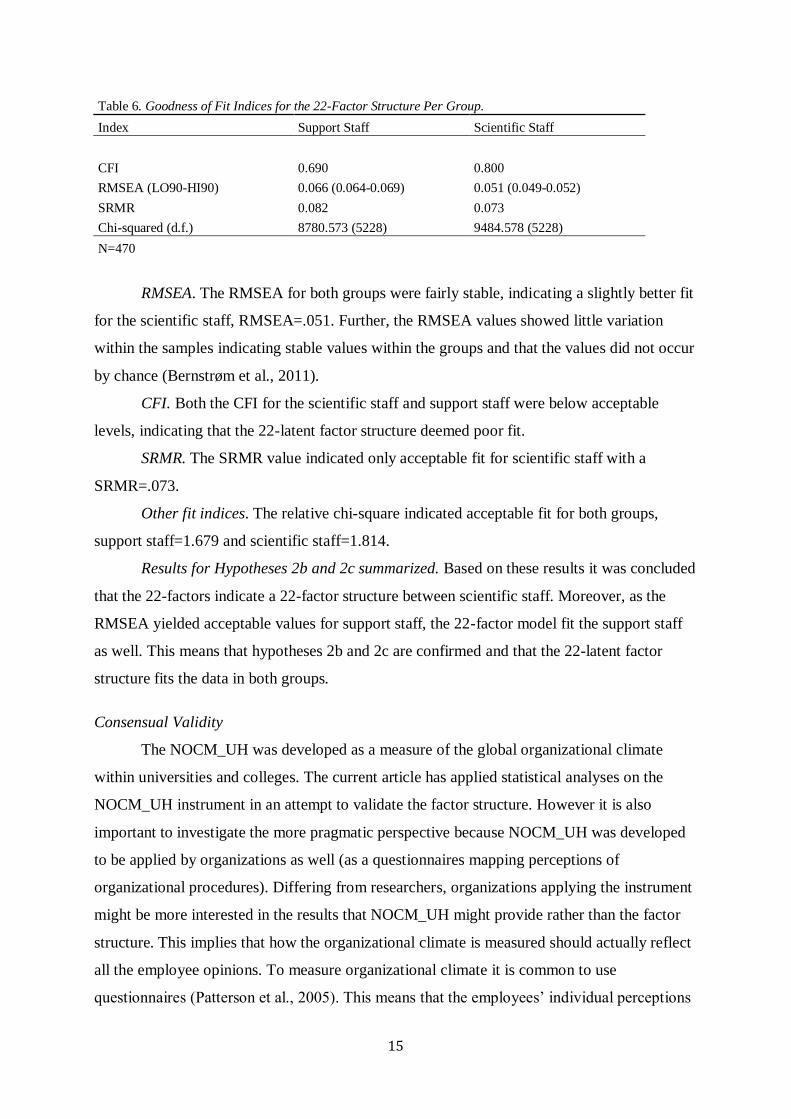
Table 6. Goodness of Fit Indices for the 22-Factor Structure Per Group.
Index Support Staff Scientific Staff
CFI 0.690 0.800
RMSEA (LO90-HI90) 0.066 (0.064-0.069) 0.051 (0.049-0.052)
SRMR 0.082 0.073
Chi-squared (d.f.) 8780.573 (5228) 9484.578 (5228)
N=470
RMSEA. The RMSEA for both groups were fairly stable, indicating a slightly better fit
for the scientific staff, RMSEA=.051. Further, the RMSEA values showed little variation
within the samples indicating stable values within the groups and that the values did not occur
by chance (Bernstrøm et al., 2011).
CFI. Both the CFI for the scientific staff and support staff were below acceptable
levels, indicating that the 22-latent factor structure deemed poor fit.
SRMR. The SRMR value indicated only acceptable fit for scientific staff with a
SRMR=.073.
Other fit indices. The relative chi-square indicated acceptable fit for both groups,
support staff=1.679 and scientific staff=1.814.
Results for Hypotheses 2b and 2c summarized. Based on these results it was concluded
that the 22-factors indicate a 22-factor structure between scientific staff. Moreover, as the
RMSEA yielded acceptable values for support staff, the 22-factor model fit the support staff
as well. This means that hypotheses 2b and 2c are confirmed and that the 22-latent factor
structure fits the data in both groups.
Consensual Validity
The NOCM_UH was developed as a measure of the global organizational climate
within universities and colleges. The current article has applied statistical analyses on the
NOCM_UH instrument in an attempt to validate the factor structure. However it is also
important to investigate the more pragmatic perspective because NOCM_UH was developed
to be applied by organizations as well (as a questionnaires mapping perceptions of
organizational procedures). Differing from researchers, organizations applying the instrument
might be more interested in the results that NOCM_UH might provide rather than the factor
structure. This implies that how the organizational climate is measured should actually reflect
all the employee opinions. To measure organizational climate it is common to use
questionnaires (Patterson et al., 2005). This means that the employees‟ individual perceptions
16
of the climate are measured first, before the employees‟ perceptions are aggregated to the
organizational level (Cohen, Doveh, & Nahum-Shani, 2009; James, 1982; Schneider, 1981).
Table 7: Standardized Regression Weigths
Dimension Item Estimate Item Estimate Item Estimate Item Estimate Item Estimate
Autonomy Q1 0.432 Q2 0.486 Q3 0.613 Q4 0.519 Q5 0.650
Integration – within
group Q6 0.552 Q7 0.498 Q8 0.648 Q9 0.671 Q10 0.535
Integration – between
group Q11 0.619 Q12 0.512 Q13 0.555 Q14 0.667 Q15 0.636
Involvement Q16 0.644 Q17 0.827 Q18 0.665 Q19 0.801 Q20 0.616
Q21 0.716
Supervisory support Q22 0.748 Q23 0.640 Q24 0.504 Q25 0.687 Q26 0.694
Emphasis on training Q27 0.847 Q28 0.873 Q29 0.465 Q30 0.740
Employee welfare Q31 0.676 Q32 0.737 Q33 0.718 Q34 0.721
Team Q35 0.693 Q36 0.757 Q37 0.654 Q38 0.621 Q39 0.425
Q40 0.459 Q41 0.539
Formalization Q42 0.588 Q43 0.612 Q44 0.633 Q45 0.536 Q46 0.629
Tradition Q47 0.704 Q48 0.802 Q49 0.378 Q50 0.673
Innovation &
Flexibility Q51 0.560 Q52 0.669 Q53 0.693 Q54 0.672 Q55 0.667
Q56 0.527
Outward focus –
teaching Q57 0.555 Q58 0.721 Q59 0.703 Q60 0.737 Q61 0.589
Outward focus –
research Q62 0.675 Q63 0.686 Q64 0.854 Q65 0.807 Q66 0.634
Outward focus –
society Q67 0.652 Q68 0.738 Q69 0.743 Q70 0.765 Q71 0.536
Reflexivity Q72 0.618 Q73 0.681 Q74 0.641 Q75 0.628 Q76 0.656
Clarity of
organizational goals Q77 0.616 Q78 0.717 Q79 0.591 Q80 0.758 Q81 0.744
Efficiency Q82 0.775 Q83 0.585 Q84 0.703 Q85 0.761
Effort Q86 0.543 Q87 0.575 Q88 0.600 Q89 0.576 Q90 0.606
Performance feedback Q91 0.815 Q92 0.709 Q93 0.496 Q94 0.643 Q95 0.721
Pressure to produce Q96 0.682 Q97 0.550 Q98 0.669 Q99 0.769 Q100 0.548
Quality – research Q101 0.790 Q102 0.779 Q103 0.608
Quality – teaching Q104 0.665 Q105 0.669 Q106 0.542
For a full view of the questions, see Appendix A
17
18
To be able to aggregate one must imply a reasonable level of agreement within each
organization. Consequently, if one cannot find a reasonable level of agreement within
employees working in the same department, there would be no „organizational‟ climate
(James et al., 2008), only a mix of individual perceptions of the organizations‟ climate.
Therefore, to ensure that the NOCM_UH investigated the employees‟ common perceptions
and not perceptions at random, the current article included the level of interrater agreement
(IRA). The estimated agreement was provided by values of the rWG(j) index (James, Demaree,
& Wolf, 1984).
For the rWG(j) index, values above .70 are indicated as acceptable levels of agreement
(Richardson, 2010; James et al., 2008). The index ranges from 0 (complete lack of agreement)
to 1 (complete agreement). However, the rWG(j) index is based upon variation obtained
through the complete lack of agreement, a so-called theoretical null distribution. This means
that the index is predicted based on the assumption that there is one true score of every
construct, and that all variance beyond this true score is caused by error variance (LeBreton &
Senter, 2007). Because of this the rWG(j) index would be highly affected by the existence of
sub-groups of judges within a department (respondents that disagree), that would each try to
assign a true score (LeBreton & Senter, 2007). In other words, if there exists two groups of
employees that disagree on many scores the rWG(j) will compute a meaningless true score,
either a negative value or values exceeding normal psychometric properties. Because of this,
the IRA in the current article might unveil the existence of such sub-groups. The rWG(j) mean
score seen in Table 9 is a computation of the mean rWG(j) index within each department. The
rWG(j) was originally not provided for the two different groups, scientific and support staff.
However, Hoff (2010) argued for a divisional split based on theory among support staff and
scientific staff. Consequently, there was an a priori assumption that the rWG(j) would be
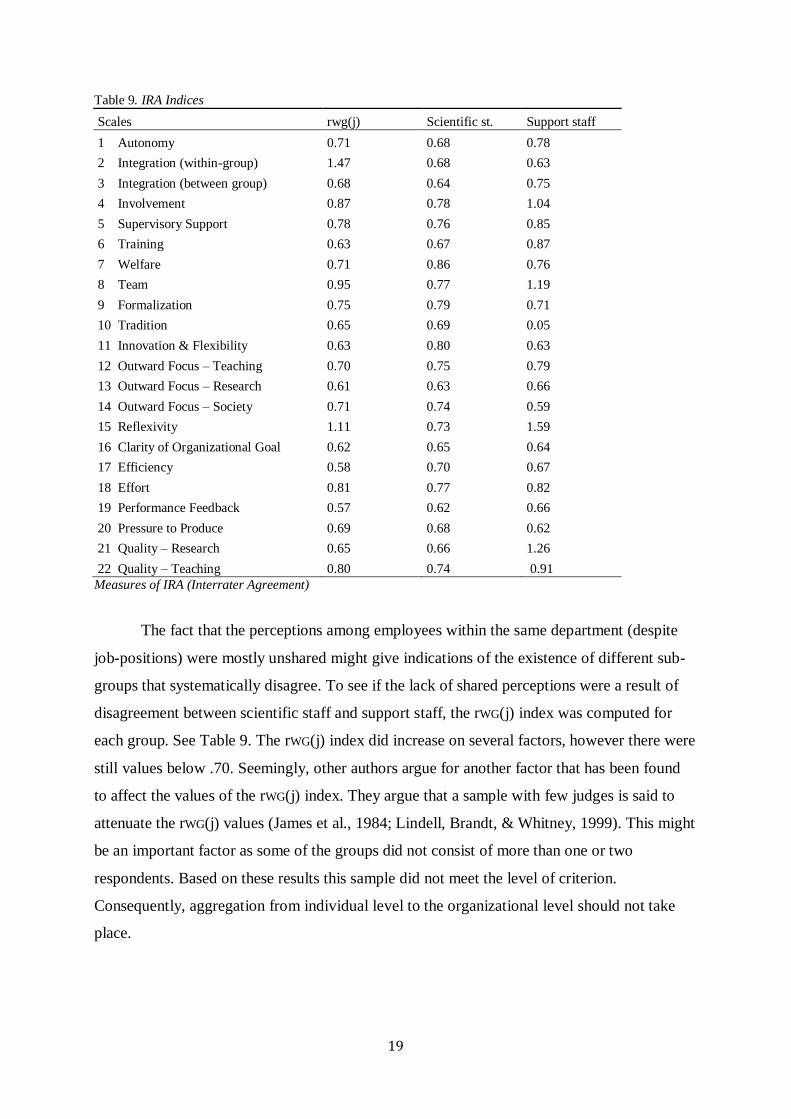
attenuated. By viewing the results in Table 9, we see some values that exceed psychometric
properties (integration within group and reflexivity) and very few values exceeding the
criterion of .70.
19
Table 9. IRA Indices
Scales rwg(j) Scientific st. Support staff
1 Autonomy 0.71 0.68 0.78
2 Integration (within-group) 1.47 0.68 0.63
3 Integration (between group) 0.68 0.64 0.75
4 Involvement 0.87 0.78 1.04
5 Supervisory Support 0.78 0.76 0.85
6 Training 0.63 0.67 0.87
7 Welfare 0.71 0.86 0.76
8 Team 0.95 0.77 1.19
9 Formalization 0.75 0.79 0.71
10 Tradition 0.65 0.69 0.05
11 Innovation & Flexibility 0.63 0.80 0.63
12 Outward Focus – Teaching 0.70 0.75 0.79
13 Outward Focus – Research 0.61 0.63 0.66
14 Outward Focus – Society 0.71 0.74 0.59
15 Reflexivity 1.11 0.73 1.59
16 Clarity of Organizational Goal 0.62 0.65 0.64
17 Efficiency 0.58 0.70 0.67
18 Effort 0.81 0.77 0.82
19 Performance Feedback 0.57 0.62 0.66
20 Pressure to Produce 0.69 0.68 0.62
21 Quality – Research 0.65 0.66 1.26
22 Quality – Teaching 0.80 0.74 0.91
Measures of IRA (Interrater Agreement)
The fact that the perceptions among employees within the same department (despite
job-positions) were mostly unshared might give indications of the existence of different sub-
groups that systematically disagree. To see if the lack of shared perceptions were a result of
disagreement between scientific staff and support staff, the rWG(j) index was computed for
each group. See Table 9. The rWG(j) index did increase on several factors, however there were
still values below .70. Seemingly, other authors argue for another factor that has been found
to affect the values of the rWG(j) index. They argue that a sample with few judges is said to
attenuate the rWG(j) values (James et al., 1984; Lindell, Brandt, & Whitney, 1999). This might
be an important factor as some of the groups did not consist of more than one or two
respondents. Based on these results this sample did not meet the level of criterion.
Consequently, aggregation from individual level to the organizational level should not take
place.

20
Discussion
The OCM is an established measure of organizational climate, as has because of its
theoretical foundation received extensive support within the climate research (Bernstrøm et
al., 2011; Patterson et al., 2005; Lamond, 2003; Kwan & Walker, 2004; Howard 1998).
However, as Patterson and colleagues argue that there is a problem with weak descriptive
power of climate measures, Hoff (2010) made some adjustments on the OCM instrument to
increase this power by adding contextual aspects. This article was conducted to examine
whether Hoff‟s (2010) Norwegian Organizational Climate Measure for Universities and
Colleges (Høgskoler) (NOCM_UH) is an adequate measure of organizational climate in
Norwegian universities and university colleges. If so, the contextual adjustments implemented
by Hoff (2010) to increase descriptive power was successful. Results from CFA indicate that
the NOCM_UH could be used on the Norwegian sample.
The 8-Factor Model Versus the 4-Factor Model
Hypothesis 1a-c stated that the new adjustments made by Hoff (2010) would provide a
better model fit than the original (integration, outward focus, and quality) and team, and that
the factor structure would remain stable across scientific and support staff. According to the
results from the CFA hypothesis 1a, 1b, and 1c were all supported. The 8-factor model
received model fit values that were significantly better than those of the 4-factor model, in
both groups separately and both groups together. Even though the CFI were somewhat below
acceptable levels, the RMSEA and the relative chi-square indicated acceptable fit. In other
words, the partitioning of the original dimensions was supported and that this would be
supported among scientific staff and among support staff as well.
Even though the 8-factor model indicated better results than the 4-factor model, this
only implies that the 8-factor model is deemed better than the 4-factor model. It does not
imply the 8-factor model to be the true dimensions of the educational sector. However this
problem is not only exclusive to climate research. To be able to investigate this, one would
have to conduct an exploratory factor analysis (EFA) on all dimensions assumed to be
associated with the educational sector. However, this might provide a random picture of
related topics as related topics is bound to correlate somehow, hence they are related. But it is
impossible to use an EFA to determine whether the correlations single out important aspects
contributing to organizational efficiency or just topics that are correlated. Therefore, when
topics or phenomenon are based on a theoretical foundation (such as OCM and NOCM_UH),
the chosen topics are already deemed important. In this way, statistical analyses provide an
21
overall picture of important aspects and not just correlations in general. Consequently, as the
NOCM_UH dimensions are based on a theoretical foundation, the dimensions received
further support and deemed a sufficient CFA. Thus, hypotheses 1a, 1b, and 1c were
supported.
Consequently, the results from the CFA support the empirical results from Hønsen‟s
study (2010) and indicate the team dimension to be a distinct dimension that belongs in a
climate measure for Norwegian universities and colleges. Moreover, by comparing the 8-
factor model with the 4-factor model, the current article has attempted to provide empirical
evidence in support of Hoff‟s (2010) adjustments to OCM. Because the 8-factor model
received better indices of fit, there are now empirical reasons to support the contextual
adjustments, and because the 8-factor model had the best fit in both employee groups, this is
assumed to be valid for both scientific staff and support staff.
Confirmatory Factor Analysis of the 22-Latent Factor Structure
Hypothesis 2a stated that all 22 dimensions would be factorial distinct and thus
provide unique information, while hypotheses 2b and 2c assumed that this would remain the
same among scientific staff and support staff. However, the results from the CFA were
somewhat contradicting.
Just as Bernstrøm et al. found in 2011, the current article found a RMSEA, indicating
good fit and also the same results for stability, which means that the value is quite stable.
However, one of the RMSEA weaknesses is that it rewards simpler models (Fan & Sivo,
2007). As the 106 items are only assumed to have factor loadings on one factor, the model is
assumed to be a fairly simple model. This may have caused the RMSEA value to be
artificially low and thus giving the impression that the model fit is better than it actually is.
According to the results, the CFA found support for a 22-factor structure, indicating
that NOCM_UH provides a good model for measuring university climate. Although some of
the findings were contradictory, this article found similar results as previous OCM studies.
The RMSEA indicated good fit but a CFI value below the acceptable level. However, in the
previous OCM research, Bernstrøm et al. (2011) and Patterson et al. (2005) both disregarded
the CFI value because of its weakness to achieve high values when there are many observed
values (such as in the case of OCM and NOCM_UH). However, in accordance with
Bernstrøm et al. (2011) one should stay hesitant to only rely on the RMSEA value, because it
is suggested to favor models with many items (Fan & Sivo, 2007), which might have
contributed to the low RMSEA value. Nevertheless, if accepting the argument by Blunch
22
(2008) and Bernstrøm et al. (2011) that one can assume a good model fit as long as the
RMSEA is good and that the CFI is above 0.8, then one can conclude in favor of confirming
hypothesis 2a. Therefore, the current article conclude in favor of hypothesis 2a, indicating that
the 22-latent structure fits the data very well. This means that the NOCM_UH in its whole is
applicable to Norwegian universities and colleges.
Hypotheses 2b and 2c investigated the differences in factor structure between the
scientific staff and support staff. If the adjustments implemented by Hoff (2010) only
increased NOCM_UH‟s descriptive power, then the factor structure should remain stable
independent of groups and suggest support for a 22-latent factor structure. Results from the
CFA supports hypothesis 2b, but only partially supports hypothesis 2c. The model fit for the
support staff were lower for all the model fit indices than compared to scientific staff,
indicating that the NOCM_UH fits scientific employees better than for support staff.
However, the low values could also be a result of the low sample size (N=154). Nevertheless,
acceptable levels were found by all indices, again excluding the CFI value. Scientific staff
received an acceptable RMSEA value and a CFI value above 0.8, which was Blunch‟s (2008)
criterion, meaning that hypothesis 2c was confirmed. Conversely, the support staff received
model fit indices acceptable for the 22-factor structure, but the CFI was below 0.8, thus
hypothesis 2c was only partially supported.
Interestingly, the model fit indices for the 8-factor model among the support staff
received acceptable values, while also receiving a CFI value above 0.8. If one accepts the
argument by Blunch (2008), then the 8-factor model should indicate an acceptable fit among
the support staff. This is also reflected by hypothesis 1c being supported. Consequently, as the
8-factor model were the results of Hoff‟s (2010) adjustments, then the remaining dimensions
would originate from the original OCM. Because the OCM has received extensive support as
a good theoretical model (Bernstrøm et al., 2011; Patterson et al., 2005; Lamond, 2003; Kwan
& Walker, 2004; Howard 1998) and because the new adjustments were supported (the 8-
factor model) then the same factor structure for all 22 factors should also be found among
support staff. As it is not, one can argue that the model fit indices received for the overall 22-
latents factor structure would have to be a consequence of a small sample size. Therefore,
based on a RMSEA value indicating a good fit and because of a small sample size, hypothesis
2c was partially supported.
23
Consensual Validity
To be able to aggregate from individual responses to organizational climate one must
imply a certain level of agreement (Cohen, Doveh, & Nahum-Shani, 2009). However, in this
article the values of interrater agreement (IRA) did not exceed their criterion, implying that
one should not aggregate to a higher level. In other words, as the organizational climate is
defined as the employees‟ perceptions of the work place practices, events, and procedures
(Schneider & Reichers, 1983) these perceptions must be shared to be utilized as an overall
view of the organizational climate (Chan, 1998; James et al., 2008). It is argued that if there
are no shared perceptions, the measure taps the psychological climate of every employee
instead (James et al., 2008). However, as the level of agreement increased on some factors
when computing the rWG(j) for both groups (see Table 9) this might give empirical reasons for
supporting Hoff‟s (2010) partition between support and scientific staff.
Conversely, as the results also included values that exceeded the normal limit among
support staff (see involvement, team, reflexivity, and quality - research in Table 9), this might
actually indicate a further sub-division within the administrative and technical department
(that two groups within the support staff disagree). However, as a result of the small sample
within the group of support staff there were difficulties with either rejecting or confirming any
of these assumptions. Further research investigating the organizational climate within the
educational sector, should focus on attaining larger samples within the groups and to further
inspect interdepartmental sub-divisions.
Limitations and Further Research
In this article there were several aspects that should be considered when viewing the
results:
Firstly, only 470 respondents within three universities and university colleges in
Norway completed the questionnaire, which might overrate NOCM_UHs generalizability to
other universities and colleges. Therefore, extensive research is needed to validate the
NOCM_UH‟s generalizability to other countries, universities, and colleges.
Secondly, as scientific and support staff got somewhat different wordings in their
questionnaire, it is possible that they answered somewhat differently than had they received
the same questionnaire, even though it was modified to increase the NOCM_UHs descriptive
power. Moreover, the model fit indices indicated better fit for the scientific staff than for the
support staff which might be a consequence of the small sample of support staff, or it might
indicate that the NOCM_UH is more appropriate for scientific staff. Future research should
24
focus on the differences between these two groups and investigate the relevance of the
NOMC_UH among support staff.
Thirdly, two items were deleted from the analysis as they were only given to the
scientific staff. They were at the very end of the questionnaire and therefore not assumed to
significantly affect the final answers. However, these questions might reveal important
answers from the scientific department. Further, if the items were kept then the analyses
conducted would have had to deal with missing values. However, the items deleted might
have been a positive contribution in explaining the quality focus on research and teaching
within the educational sector.
Fourthly, as it was mandatory to rate all statements, respondents were not able to give
information about non-relevant statements. Even more, they also had to answer on a Likert-
scale ranging from 1-4, hence a lack of a middle value. This forces each respondent to make a
statement, no-matter if they agree or do not. By not including a middle value for each
statement, the variation within the sample might be artificially high (Garland, 1991). Further,
as the NOCM_UH is a work climate measure with the purpose of viewing the overall
organizational functioning, the actual results might be artificially high or low as it is
impossible to take a neutral position. Consequently, the results may provide the incorrect
climate profiles of organizations due to inflated respondent answers.
As all statements in the questionnaire were made mandatory, the current article had no
problems with missing values. Even though use of several statistical methods can cope with
missing values, the actual responses from respondents is preferable (Sterne et al., 2009).
However, the use of a 4-point Likert-scale when answering items is mandatory can be
problematic. This forces the respondents to take a stand on organizational procedures that
they might not agree nor disagree with. The research team did get some feedback from
frustrated respondents on this topic. Because of the 4-point Likert-scale the current sample
may include some overrated variance that might have affected the results. However, Garland
(1991) found that when they eliminated the neutral point from a 5 to 4-point Likert scale, the
response bias decreased. This means that the respondents who actually disagree but that want
to appear helpful and positive, rate at the middle value. However, respondents who did not
agree nor disagree were forced into answering. As Garland (1991, p. 67) states, “Resorting to
a scale without a mid-point seems to help alleviate this social desirability bias without
changing the direction of opinion but, of course, it can alter the intensity of the opinion held”.
This means that the consequences of having this type of scale might be severe for the
NOCM_UHs‟ actual purpose, a work climate measure, as it might give overrated results to
25
organizations using it.
Finally, as argued by Bernstrøm (2009), even though both this and previous studies
give support to the OCM and the NOCM_UH as a way of measuring organizational climate, it
is not known for certain that the items comprising the OCM and the NOCM_UH capture the
latent structures better than other items would. As Bernstrøm (2009, p. 20) states very well:
“When describing the development of OCM, Patterson et al. (2005) give good theoretical
explanations for the latent factors included…but say little of how they arrived at the
definitions…”. Further studies should consider the item development and investigate whether
there are other items that might be more appropriate for measuring the dimensions.
Implications of the Findings
Theoretical implications. The results from the current article have certain implications
regarding the theoretical framework of the Organizational Climate Measure (OCM). As
previous studies have indicated that the OCM have showed good generalizability (Bernstrøm
et al., 2011; Patterson et al., 2005) this article only further supports this assumption. And
based on the results of the CFA conducted, the current article found a support for a 22-latent
factor structure, and thereby also the original 17 dimensions. This means that this article
found continued support of OCM as a good model that is generalizable to other businesses
and countries.
Moreover, the 8-latent factor structure model was supported, which lends support to
the adjustments implemented by Hoff (2010) as well. This indicates that the new dimensions
are factorially distinct, and the new dimensions seemed to reveal unique information that was
not covered by the original dimensions. This further supports considering contextual aspects
in future climate research so as to increase descriptive power.
Practical implications. The results indicate that the new dimensions in NOCM_UH
developed by Hoff (2010) are factorially distinct and display additional information.
Consequently, the NOCM_UH is argued to be generalizable and can be utilized as an
instrument to measure organizational climate in Norwegian universities and colleges.
Moreover, as the new dimensions were supported this means that team and teamwork
related topics are important aspects within the educational sector and that team should be
included when measuring organizational climate within this sector.
The 8-factor model indicated best model fit for both the scientific staff and support
staff, which gives further support of the partitioning of certain types of job-positions within a
particular sector. As the results indicate, it was only the questionnaires‟ descriptive power that
26
increased while the questions were still revealing the same information. The practical
implication of this finding is that similar adjustments to a measure do not destroy the
underlying factor structure. Instead it can increase the chance of respondents understanding
what they are answering and thereby give you the actual answer you seek.
Finally, as the NOCM_UH is utilized as a work climate measure of organizations, it is
important to inspect levels of agreement alongside with descriptive statistics. In doing so,
employers can see the actual employee perceptions before utilizing the results. As the current
article wanted to investigate the factor structure, it was not a major issue that it did not find
acceptable levels of interrater agreement. However, if future organizations wish to utilize the
NOCM_UH as a work climate measure, they should include this measure. By doing so, they
can determine whether their sample is suited for aggregation from the individual employee
perceptions to the organizational climate.
Concluding Remarks
The current article found support for a 22-latent factor structure and that the new
adjustments implemented by Hoff (2010) seemed reasonable. This indicates that the
NOCM_UH seems to be an appropriate instrument for measuring organizational climate
within Norwegian universities and colleges. The most interesting results are the contextual
adjustments‟ power to reveal distinctly new information about different aspect of
organizational goals, structure, and interdepartmental cooperation (Hoff, 2010). Hence
implying that the original OCM could be generalized to different sectors and countries, but
maybe not as concerned with context-specific information such as descriptive power. The
results from this current article indicate that context-specific adjustments can be useful within
climate research and points out that future research should take descriptive power more into
account.
27
References
Almeida-Santos, F., Chzhen, Y., Mumford, K. (2010). Employee training and wage
dispersion:White and blue collar workers in Britain. Research In Labor Economics,
30, 35-60.
Arbuckle, J.L. (1997-2007). Amos 16.0 User’s Guide. AMOS Development Coropration.
Arnetz, B.B., Lucas, T., & Arnetz, J.E. (2011). Organizational climate, occupational stress,
and employee mental health: mediating effects of organizational efficiency. Journal of
Occupational and Environmental Medicine, 53, 34-42.
Ashkenasy, N. M., Wilderom, C. P. M., & Peterson, M. F. (Eds.) (2000). Handbook of
organizational culture and climate. London: Sage.
Baruch, Y., & Holtom, B. C. (2008). Survey response rate levels and trends in organizational
research. Human Relations, 61, 1139-1160.
Bernstrøm, V. H. (2009). Investigating the Organizational Climate Measure's
generalizability. M.Phil, Universitetet i Oslo.
Bernstrøm, V.H., Lone, J.A., Bjørkli, C.A., Ulleberg, P., & Hoff, T. (2011). Assessing the
psychometric properties of the Norwegian version of the organizational climate
measure. Manuscript submitted for publication.
Blunch, N. J. (2008). Introduction to structural equation modelling using SPSS and AMOS.
Introduction to structural equation modelling using SPSS and AMOS, vii, pp. 270.
Thousand Oaks, CA: Sage Publications Ltd.
Cohen, A., Doveh, E., & Nahum-Shani, I. (2009). Testing agreement for multi-item scales
with the indices rWG(J) and ADM(J). Organizational Research Methods, 12, 148-164.
Costello, A.B. & Osborne, J.W. (2005). Best practices in exploratory factor analysis: four
recommendations for getting the most from your analysis. Practical Assessment
Research & Evaluation, 10.
Curran, P.T., Bollen, K.A., Chen, F., Paxton, P. & Kirby, J.B. (2003). Finite sampling
properties of the point estimates and confidence intervals of the RMSEA. Sociological
Methods & Research, 32, 208-252.
De Cuyper, N., Van der Heijden, B.I.J.M., & De Witte, H. (2011). Associations between
perceived employability, employee well-being, and its contribution to organizational
success: a matter of psychological contracts? The International Journal of Human
Resource Management, 22, 1486-1503.
Diamantopoulos, A. & Siguaw, J.A. (2000). Introducing LISREL: A guide for the uninitiated.
London: Sage Publications.
28
Ehrhart, K.H., Schneider, B., Witt, L.A., & Perry, S.J. (2011). Service employees give as
they get: Internal service as a moderator of the service climate–service outcomes link.
Journal of Applied Psychology, 96, 423–431.
Fan, X., & Sivo, S. A. (2007). Sensitivity of fit indices to model misspecification and model
types. Multivariate Behavioral Research, 42, 509-529.
Fan, X., Thompson, B., & Wang, L. (1999). Effects of sample size, estimation, methods, and
model specification on structural equation modeling fit indexes. Structural Equation
Modeling, 6, 56–83.
Garland, R. (1991). The mid-point on a rating scale: Is it desirable? Marketing Bulletin, 2,
66-70.
Goodman, S. A., & Svyantek, D. J. (1999). Person–organization fit and contextual
performance: Do shared values matter? Journal of Vocational Behavior, 55, 254–275.
Hoff, T. (2010). Personal- og organisasjonsutvikling for offentlig sektor. Unpublished
manuscript.
Hooper, D., Coughlan, J., & Mullen, M.R. (2008). Structural Equation Modelling: Guidelines
for Determining Model Fit. Electronic Journal of Business Research Methods, 6,
53-60.
Howard, L. W. (1998). Validating the competing values model as a representation of
organizational culture. The International Journal of Organizational Analysis, 6,
231-250.
Howe, J. G. (1977). Group climate: An exploratory analysis of construct validity.
Organizational Behavior and Human Performance, 19, 106–125.
Hu, L., & Bentler, P. M. (1999). Cutoff criteria for fit indices in covariance structure analysis:
Conventional criteria versus new alternatives. Structural Equation Modeling, 61,
1–55.
Hunter, S. T., Bedell, K. E., & Mumford, M. D. (2007). Climate for creativity: A quantitative
review. Creativity Research Journal, 19, 69-90.
Hønsen, L. (2010). Arbeidsmiljø i en kunnskapsintensiv organisasjon: en analyse av
organizational climate measure gjennom SWOT-intervjuer. M.Phil, Universitetet I
Oslo.
James, L.R., Choi, C.C., Ko, C.H.E., McNeil, P.K., Minton, M.K., Wright, M.A. et al (2008).
Organizational and psychological climate: A review of theory and research. European
Journal of Work and Organizational Psychology, 17, 5-32.
29
James, L. R. (1982). Aggregation bias in estimates of perceptual agreement. Journal of
Applied Psychology, 67, 219 – 229.
James, L.R., Demaree, R.G., & Wolf, G. (1984). Estimating within-group interrater reliability
with and without response bias. Journal of Applied Psychology, 17, 5-32.
Jiao, Yawen (2010). Stakeholder welfare and firm value. Journal of Banking & Finance, 34,
2549-2561.
Johnson, J. J., & McIntye, C. L. (1998). Organizational culture and climate correlates of job
satisfaction. Psychological Reports, 82, 843-850.
Kwan, P., & Walker, A. (2004). Validating the competing values model as a representation of
organizational culture through inter-institutional comparisons. Organizational
Analysis, 12, 21-37.
Lamond, D. (2003). The value of Quinn's competing values model in an Australian context.
Journal of Managerial Psychology, 18, 46-59.
LeBreton, J. M., & Senter, J. L. (2007). Answers to 20 questions about interrater reliability
and interrater agreement. Organizational Research Methods, 11, 815-852.
Lindell, M. K., Brandt, C. J., & Whitney, D. J. (1999). A revised index of interrater agreement
for multi-item ratings of a single target. Applied Psychological Measurement, 23,
127-135.
MacCallum, R.C., Browne, M.W. & Sugawara, H., M. (1996). Power analysis and
determination of sample size for covariance structure modeling. Psychological
Methods, 1, 130-49.
McDonald, R. P., & Ho, M. H. R. (2002). Principles and practice in reporting structural
equation analyses. Psychological Methods, 7, 64-82.
McIntosh, C.N. (2007). Rethinking fit assessment in structural equation modelling: A
commentary and elaboration on Barrett (2007). Personality and Individual Differences,
42, 859-67.
McQuitty, S. (2004). Statistical power and structural equation models in business research.
Journal of Business Research, 57, 175-83.
Neal, A., Griffin, M. A., & Hart, P. M. (2000). The impact of organizational climate on safety
climate and individual behavior. Safety Science, 34, 99-109.
Nijman, D.J. & Gelissen, J. (2011). Direct and indirect effects of supervisor support on
transfer of training. In R.F. Poell, M. van Woerkom (eds.), Supporting Workplace
Learning, Professional 89 and Practice-based Learning, 5.

30
Oort, L.V., Schröder, C., & French, D.P. (2011). What do people think about when they
answer the brief illness perception questionnaire? A „think-aloud‟ study. British
Journal of Health Psychology, 16, 231–245.
Patterson, M. G., West, M. A., Shackleton, V. J., Dawson, J. F., Lawthom, R., Maitlis, S., et
al. (2005). Validating the organizational climate measure: Links to managerial
practices, productivity and innovation. Journal of Organizational Behavior, 26,
379-408.
Payne, R. L. (2000). Climate and culture: how close can they get? In N. M. Ashkenasy, C. P.
M. Wilderom, & M. F. Peterson (Eds.), Handbook of organizational culture and
climate pp. 163–176. London: Sage.
Payne, R. L. & Mansfield, R. (1973). Relationships of perceptions of organizational climate
to organizational structure, context, and hierarchical position. Administrative
Science Quarterly, 18, 515-526.
Pickle, H. & Friedlander, F. (1967). Seven societal criteria of organizational success.
Personnel Psychology, 20, 165-178.
Quinn, R. E. (1988). Beyond rational management: Mastering the paradoxes and competing
demands of high performance. San Francisco: Jossey-Bass.
Quinn, R. E., & McGrath, M. R. (1982). Moving beyond the single-solution perspective: The
competing values approach as a diagnostic tool. Journal of Applied Behavioral
Science, 18, 463-472.
Quinn, R. E., & Rohrbaugh, J. (1983). A spatial model of effectiveness criteria: Towards a
competing values approach to organizational analysis. Management Science, 29,
363-377.
Rentsch, J. (1990). Climate and culture: Interaction and qualitative differences in
organizational meanings. Journal of Applied Psychology, 75, 668–681.
Richardson, J. T. E. (2010). Perceived academic quality and approaches to studying in
higher education: Evidence from Danish students of occupational therapy.
Scandinavian Journal of Educational Research, 54, 189–203.
Rousseau, D. M. (1988). The construction of climate in organizational research. In C. L.
Cooper, & I. T. Robertson (Eds.), International Review of Industrial and
Organizational Psychology, 3,139–158. New York: Wiley.
Schneider, B. (1981). Work climates: An interactionist perspective. Research Report, 81 – 2.
East Lansing, MI: Michigan State University, Department of Psychology.
31
Schneider, B. (Ed.) (1990). Organizational climate and culture. San Francisco,
CA: Jossey-Bass.
Schneider, B., Ehrhart, M.G., & Macey, W.H. (2011). Perspectives on organizational climate
and culture. In Zedeck, Sheldon (Eds.), APA handbook of industrial and
organizational psychology, p. 373-414. Washington, DC, US: American Psychological
Association.
Schneider, B., & Reichers, A. E. (1983). On the etiology of climates. Personnel Psychology,
36, 19–39.
Sterne, J.A.C., White, I.R., Carlin, J.B., Spratt, M., Royston, P., Kenward, M.G. et al. (2009).
Multiple imputation for missing data in epidemiological and clinical research:
Potential and pitfalls. British Medical Journal. 338:b2393.
Tabachnick, B. G., & Fidell, L. S. (2007). Using multivariate statistics (5th ed.) p. 980.
Boston, MA: Allyn & Bacon/Pearson Education.
West, M. A. and Farr, J. L. (1990). Innovation and creativity at work: Psychological and
organizational strategies (Eds). Wiley: Chichester.
Wheaton, B., Muthen, B., Alwin, D., F., & Summers, G. (1977). Assessing reliability and
stability in panel models. Sociological Methodology, 8, 84-136.
Zhou, K. Z. & Wu, F. (2009). Technology capability, strategic flexibility, and product
innovation. Strategic Management Journal, 31, 547–561.
32
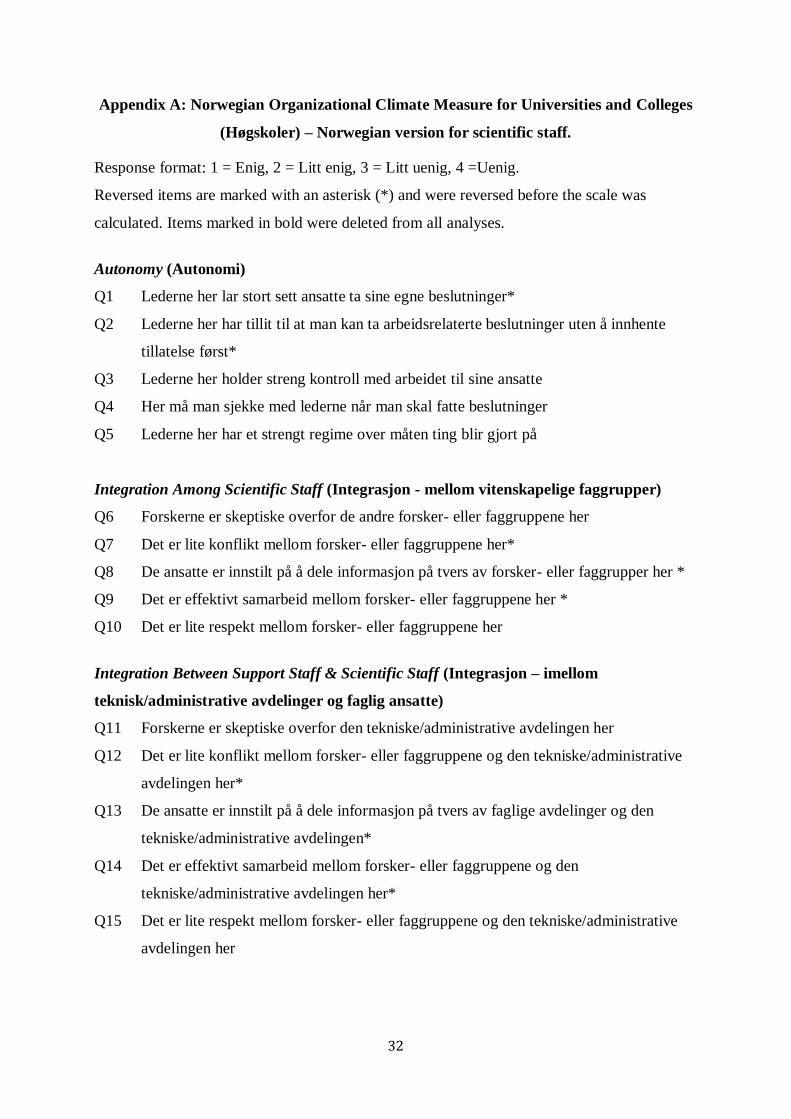
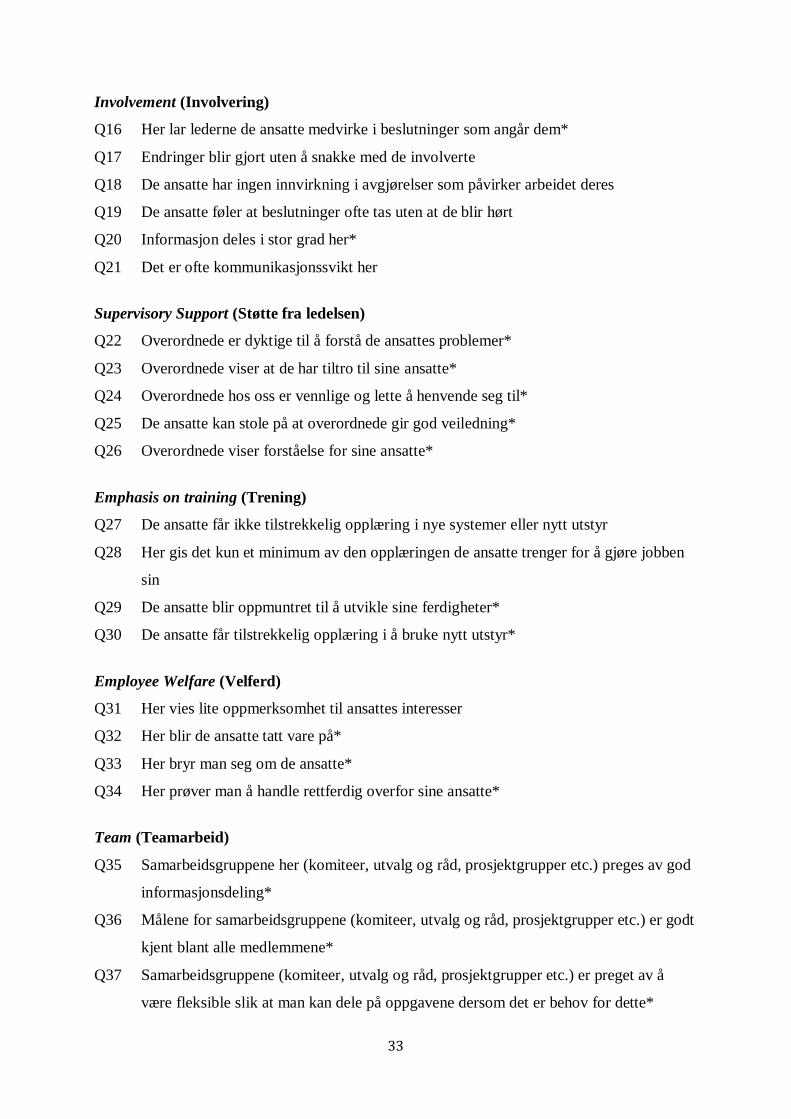
Appendix A: Norwegian Organizational Climate Measure for Universities and Colleges
(Høgskoler) – Norwegian version for scientific staff.
Response format: 1 = Enig, 2 = Litt enig, 3 = Litt uenig, 4 =Uenig.
Reversed items are marked with an asterisk (*) and were reversed before the scale was
calculated. Items marked in bold were deleted from all analyses.
Autonomy (Autonomi)
Q1 Lederne her lar stort sett ansatte ta sine egne beslutninger*
Q2 Lederne her har tillit til at man kan ta arbeidsrelaterte beslutninger uten å innhente
tillatelse først*
Q3 Lederne her holder streng kontroll med arbeidet til sine ansatte
Q4 Her må man sjekke med lederne når man skal fatte beslutninger
Q5 Lederne her har et strengt regime over måten ting blir gjort på
Integration Among Scientific Staff (Integrasjon - mellom vitenskapelige faggrupper)
Q6 Forskerne er skeptiske overfor de andre forsker- eller faggruppene her
Q7 Det er lite konflikt mellom forsker- eller faggruppene her*
Q8 De ansatte er innstilt på å dele informasjon på tvers av forsker- eller faggrupper her *
Q9 Det er effektivt samarbeid mellom forsker- eller faggruppene her *
Q10 Det er lite respekt mellom forsker- eller faggruppene her
Integration Between Support Staff & Scientific Staff (Integrasjon – imellom
teknisk/administrative avdelinger og faglig ansatte)
Q11 Forskerne er skeptiske overfor den tekniske/administrative avdelingen her
Q12 Det er lite konflikt mellom forsker- eller faggruppene og den tekniske/administrative
avdelingen her*
Q13 De ansatte er innstilt på å dele informasjon på tvers av faglige avdelinger og den
tekniske/administrative avdelingen*
Q14 Det er effektivt samarbeid mellom forsker- eller faggruppene og den
tekniske/administrative avdelingen her*
Q15 Det er lite respekt mellom forsker- eller faggruppene og den tekniske/administrative
avdelingen her
33
Involvement (Involvering)
Q16 Her lar lederne de ansatte medvirke i beslutninger som angår dem*
Q17 Endringer blir gjort uten å snakke med de involverte
Q18 De ansatte har ingen innvirkning i avgjørelser som påvirker arbeidet deres
Q19 De ansatte føler at beslutninger ofte tas uten at de blir hørt
Q20 Informasjon deles i stor grad her*
Q21 Det er ofte kommunikasjonssvikt her
Supervisory Support (Støtte fra ledelsen)
Q22 Overordnede er dyktige til å forstå de ansattes problemer*
Q23 Overordnede viser at de har tiltro til sine ansatte*
Q24 Overordnede hos oss er vennlige og lette å henvende seg til*
Q25 De ansatte kan stole på at overordnede gir god veiledning*
Q26 Overordnede viser forståelse for sine ansatte*
Emphasis on training (Trening)
Q27 De ansatte får ikke tilstrekkelig opplæring i nye systemer eller nytt utstyr
Q28 Her gis det kun et minimum av den opplæringen de ansatte trenger for å gjøre jobben
sin
Q29 De ansatte blir oppmuntret til å utvikle sine ferdigheter*
Q30 De ansatte får tilstrekkelig opplæring i å bruke nytt utstyr*
Employee Welfare (Velferd)
Q31 Her vies lite oppmerksomhet til ansattes interesser
Q32 Her blir de ansatte tatt vare på*
Q33 Her bryr man seg om de ansatte*
Q34 Her prøver man å handle rettferdig overfor sine ansatte*
Team (Teamarbeid)
Q35 Samarbeidsgruppene her (komiteer, utvalg og råd, prosjektgrupper etc.) preges av god
informasjonsdeling*
Q36 Målene for samarbeidsgruppene (komiteer, utvalg og råd, prosjektgrupper etc.) er godt
kjent blant alle medlemmene*
Q37 Samarbeidsgruppene (komiteer, utvalg og råd, prosjektgrupper etc.) er preget av å
være fleksible slik at man kan dele på oppgavene dersom det er behov for dette*
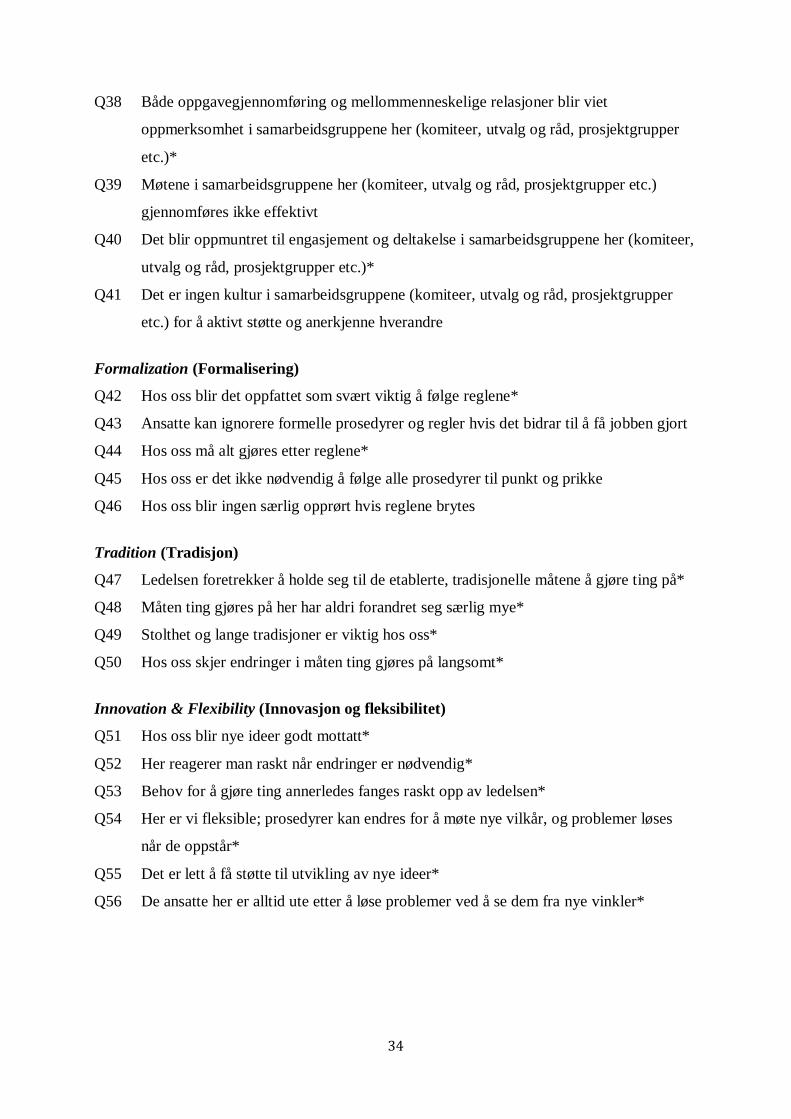
34
Q38 Både oppgavegjennomføring og mellommenneskelige relasjoner blir viet
oppmerksomhet i samarbeidsgruppene her (komiteer, utvalg og råd, prosjektgrupper
etc.)*
Q39 Møtene i samarbeidsgruppene her (komiteer, utvalg og råd, prosjektgrupper etc.)
gjennomføres ikke effektivt
Q40 Det blir oppmuntret til engasjement og deltakelse i samarbeidsgruppene her (komiteer,
utvalg og råd, prosjektgrupper etc.)*
Q41 Det er ingen kultur i samarbeidsgruppene (komiteer, utvalg og råd, prosjektgrupper
etc.) for å aktivt støtte og anerkjenne hverandre
Formalization (Formalisering)
Q42 Hos oss blir det oppfattet som svært viktig å følge reglene*
Q43 Ansatte kan ignorere formelle prosedyrer og regler hvis det bidrar til å få jobben gjort
Q44 Hos oss må alt gjøres etter reglene*
Q45 Hos oss er det ikke nødvendig å følge alle prosedyrer til punkt og prikke
Q46 Hos oss blir ingen særlig opprørt hvis reglene brytes
Tradition (Tradisjon)
Q47 Ledelsen foretrekker å holde seg til de etablerte, tradisjonelle måtene å gjøre ting på*
Q48 Måten ting gjøres på her har aldri forandret seg særlig mye*
Q49 Stolthet og lange tradisjoner er viktig hos oss*
Q50 Hos oss skjer endringer i måten ting gjøres på langsomt*
Innovation & Flexibility (Innovasjon og fleksibilitet)
Q51 Hos oss blir nye ideer godt mottatt*
Q52 Her reagerer man raskt når endringer er nødvendig*
Q53 Behov for å gjøre ting annerledes fanges raskt opp av ledelsen*
Q54 Her er vi fleksible; prosedyrer kan endres for å møte nye vilkår, og problemer løses
når de oppstår*
Q55 Det er lett å få støtte til utvikling av nye ideer*
Q56 De ansatte her er alltid ute etter å løse problemer ved å se dem fra nye vinkler*
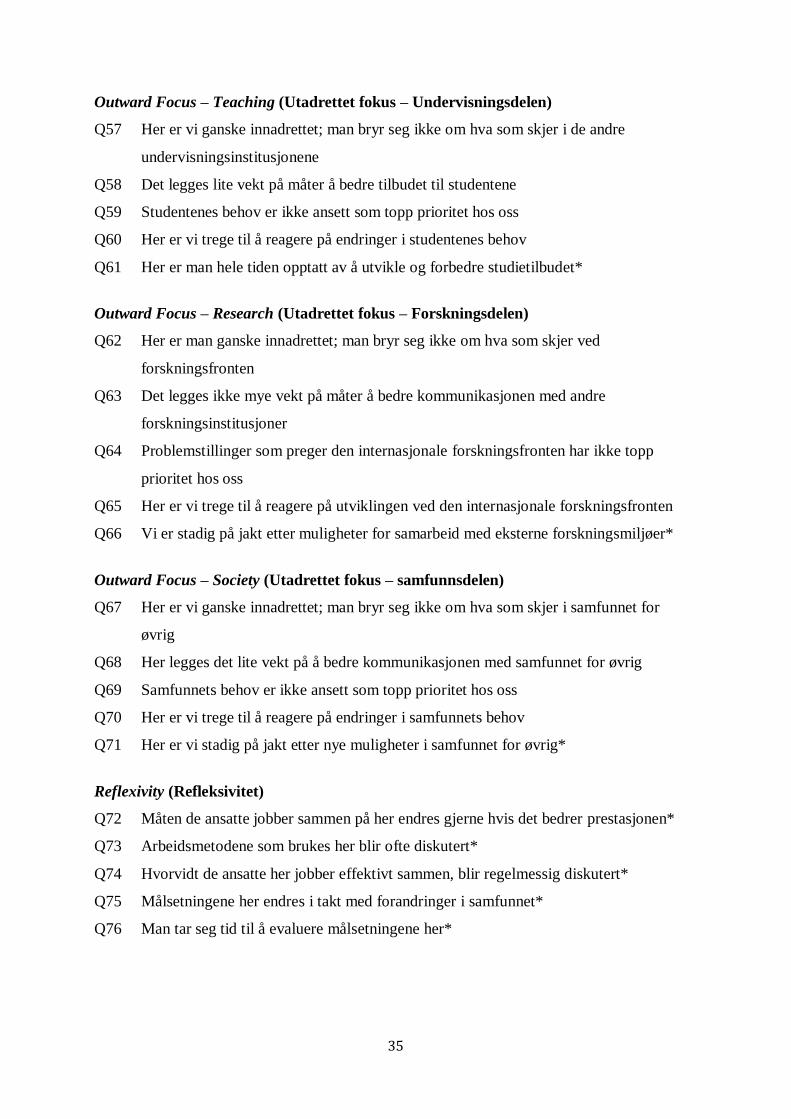
35
Outward Focus – Teaching (Utadrettet fokus – Undervisningsdelen)
Q57 Her er vi ganske innadrettet; man bryr seg ikke om hva som skjer i de andre
undervisningsinstitusjonene
Q58 Det legges lite vekt på måter å bedre tilbudet til studentene
Q59 Studentenes behov er ikke ansett som topp prioritet hos oss
Q60 Her er vi trege til å reagere på endringer i studentenes behov
Q61 Her er man hele tiden opptatt av å utvikle og forbedre studietilbudet*
Outward Focus – Research (Utadrettet fokus – Forskningsdelen)
Q62 Her er man ganske innadrettet; man bryr seg ikke om hva som skjer ved
forskningsfronten
Q63 Det legges ikke mye vekt på måter å bedre kommunikasjonen med andre
forskningsinstitusjoner
Q64 Problemstillinger som preger den internasjonale forskningsfronten har ikke topp
prioritet hos oss
Q65 Her er vi trege til å reagere på utviklingen ved den internasjonale forskningsfronten
Q66 Vi er stadig på jakt etter muligheter for samarbeid med eksterne forskningsmiljøer*
Outward Focus – Society (Utadrettet fokus – samfunnsdelen)
Q67 Her er vi ganske innadrettet; man bryr seg ikke om hva som skjer i samfunnet for
øvrig
Q68 Her legges det lite vekt på å bedre kommunikasjonen med samfunnet for øvrig
Q69 Samfunnets behov er ikke ansett som topp prioritet hos oss
Q70 Her er vi trege til å reagere på endringer i samfunnets behov
Q71 Her er vi stadig på jakt etter nye muligheter i samfunnet for øvrig*
Reflexivity (Refleksivitet)
Q72 Måten de ansatte jobber sammen på her endres gjerne hvis det bedrer prestasjonen*
Q73 Arbeidsmetodene som brukes her blir ofte diskutert*
Q74 Hvorvidt de ansatte her jobber effektivt sammen, blir regelmessig diskutert*
Q75 Målsetningene her endres i takt med forandringer i samfunnet*
Q76 Man tar seg tid til å evaluere målsetningene her*

36
Clarity of Organizational Goals (Klarhet i organisasjonens mål)
Q77 De ansatte har en god forståelse av denne organisasjonens formål*
Q78 Organisasjonens fremtidige retning blir klart og tydelig kommunisert til alle*
Q79 De ansatte har ikke en klar forståelse av hva som er organisasjonens mål
Q80 Alle som jobber her er bevisste på vår fremtidsplan og retning*
Q81 Det finnes en klar oppfatning her angående hvilken retning vi går i*
Efficiency (Effektivitet)
Q82 Tid og penger kunne blitt spart dersom arbeidet her var bedre organisert
Q83 Ting kunne blitt gjort mer effektivt her hvis de ansatte tok seg tid til å tenke seg om
Q84 Her resulterer dårlig planlegging ofte i at man ikke når sine målsetninger
Q85 Produktiviteten kunne blitt forbedret her om arbeidet ble bedre organisert og planlagt
Effort (Innsats)
Q86 Hos oss ønsker de ansatte alltid å prestere så godt de kan*
Q87 De ansatte er entusiastiske i forhold til jobben sin*
Q88 Her slipper de ansatte unna med å gjøre så lite som mulig
Q89 De ansatte er innstilt på å gjøre en ekstra innsats for å utføre en god jobb*
Q90 Her legger ikke de ansatte mer innsats i arbeidet sitt enn det de må
Performance Feedback (Feedback på prestasjon)
Q91 De ansatte får som regel tilbakemelding i forhold til kvaliteten på det arbeidet de gjør*
Q92 De ansatte har ingen anelse om hvorvidt de gjør en god jobb
Q93 Det er generelt vanskelig for ansatte å vurdere kvaliteten på det de presterer
Q94 De ansattes prestasjoner måles regelmessig*
Q95 Måten de ansatte gjør jobben sin på blir sjelden evaluert
Pressure to Produce (Produksjonspress)
Q96 Det forventes for mye av de ansatte i løpet av en dag*
Q97 Vanligvis er ikke de ansattes arbeidsbelastning spesielt krevende
Q98 Ledelsen krever at de ansatte jobber ekstremt hardt*
Q99 De ansatte er under sterkt tidspress for å nå målsetninger*
Q100 Arbeidstempoet her er ganske avslappet
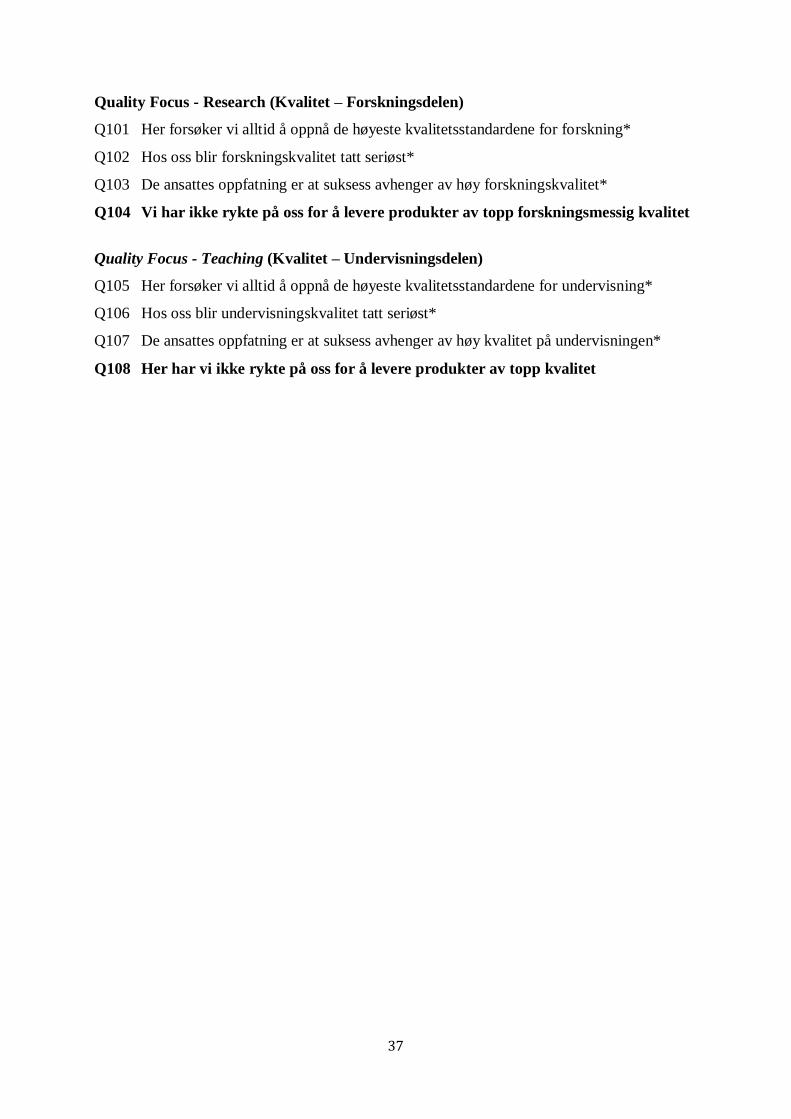
37
Quality Focus - Research (Kvalitet – Forskningsdelen)
Q101 Her forsøker vi alltid å oppnå de høyeste kvalitetsstandardene for forskning*
Q102 Hos oss blir forskningskvalitet tatt seriøst*
Q103 De ansattes oppfatning er at suksess avhenger av høy forskningskvalitet*
Q104 Vi har ikke rykte på oss for å levere produkter av topp forskningsmessig kvalitet
Quality Focus - Teaching (Kvalitet – Undervisningsdelen)
Q105 Her forsøker vi alltid å oppnå de høyeste kvalitetsstandardene for undervisning*
Q106 Hos oss blir undervisningskvalitet tatt seriøst*
Q107 De ansattes oppfatning er at suksess avhenger av høy kvalitet på undervisningen*
Q108 Her har vi ikke rykte på oss for å levere produkter av topp kvalitet
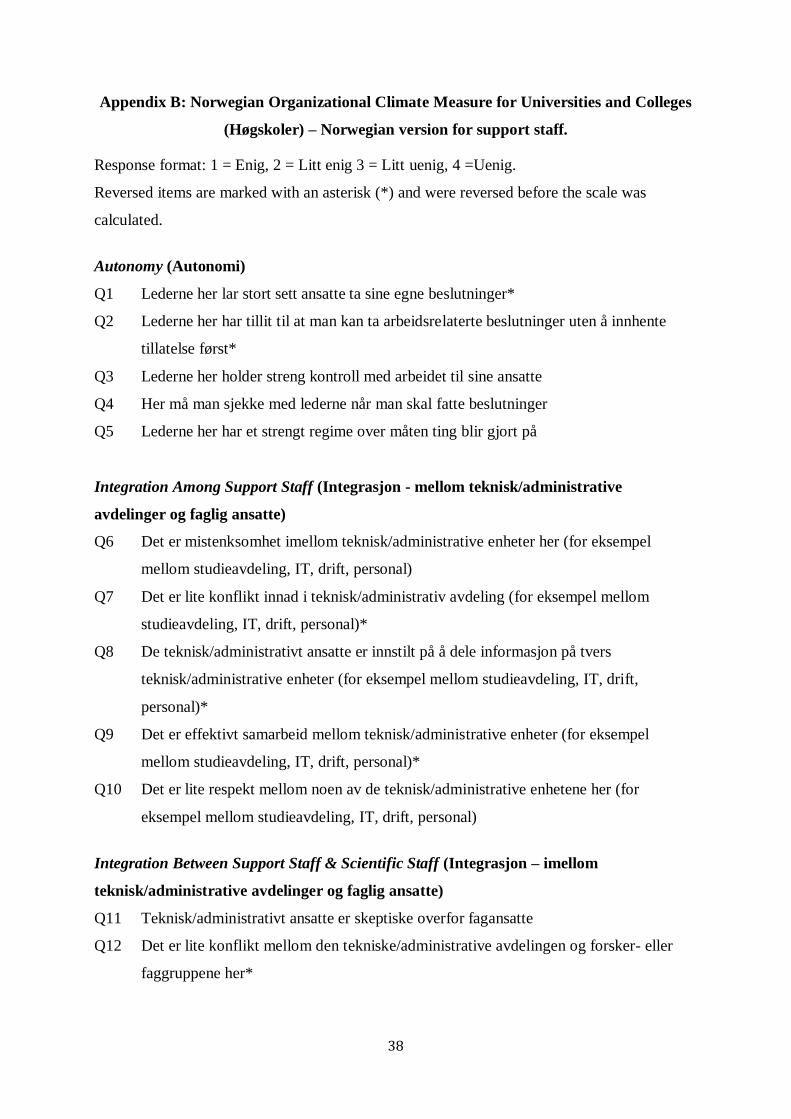
38
Appendix B: Norwegian Organizational Climate Measure for Universities and Colleges
(Høgskoler) – Norwegian version for support staff.
Response format: 1 = Enig, 2 = Litt enig 3 = Litt uenig, 4 =Uenig.
Reversed items are marked with an asterisk (*) and were reversed before the scale was
calculated.
Autonomy (Autonomi)
Q1 Lederne her lar stort sett ansatte ta sine egne beslutninger*
Q2 Lederne her har tillit til at man kan ta arbeidsrelaterte beslutninger uten å innhente
tillatelse først*
Q3 Lederne her holder streng kontroll med arbeidet til sine ansatte
Q4 Her må man sjekke med lederne når man skal fatte beslutninger
Q5 Lederne her har et strengt regime over måten ting blir gjort på
Integration Among Support Staff (Integrasjon - mellom teknisk/administrative
avdelinger og faglig ansatte)
Q6 Det er mistenksomhet imellom teknisk/administrative enheter her (for eksempel
mellom studieavdeling, IT, drift, personal)
Q7 Det er lite konflikt innad i teknisk/administrativ avdeling (for eksempel mellom
studieavdeling, IT, drift, personal)*
Q8 De teknisk/administrativt ansatte er innstilt på å dele informasjon på tvers
teknisk/administrative enheter (for eksempel mellom studieavdeling, IT, drift,
personal)*
Q9 Det er effektivt samarbeid mellom teknisk/administrative enheter (for eksempel
mellom studieavdeling, IT, drift, personal)*
Q10 Det er lite respekt mellom noen av de teknisk/administrative enhetene her (for
eksempel mellom studieavdeling, IT, drift, personal)
Integration Between Support Staff & Scientific Staff (Integrasjon – imellom
teknisk/administrative avdelinger og faglig ansatte)
Q11 Teknisk/administrativt ansatte er skeptiske overfor fagansatte
Q12 Det er lite konflikt mellom den tekniske/administrative avdelingen og forsker- eller
faggruppene her*

39
Q13 De ansatte er innstilt på å dele informasjon på tvers av den tekniske/administrative
avdelingen og forsker- eller faggruppene her*
Q14 Det er effektivt samarbeid mellom den tekniske/administrative avdelingen og
forsker- eller faggruppene her*
Q15 Det er lite respekt mellom den tekniske/administrative avdelingen og forsker- eller
faggruppene her
Involvement (Involvering)
Q16 Her lar lederne de ansatte medvirke i beslutninger som angår dem*
Q17 Endringer blir gjort uten å snakke med de involverte
Q18 De ansatte har ingen innvirkning i avgjørelser som påvirker arbeidet deres
Q19 De ansatte føler at beslutninger ofte tas uten at de blir hørt
Q20 Informasjon deles i stor grad her*
Q21 Det er ofte kommunikasjonssvikt her
Supervisory Support (Støtte fra ledelsen)
Q22 Overordnede er dyktige til å forstå de ansattes problemer*
Q23 Overordnede viser at de har tiltro til sine ansatte*
Q24 Overordnede hos oss er vennlige og lette å henvende seg til*
Q25 De ansatte kan stole på at overordnede gir god veiledning*
Q26 Overordnede viser forståelse for sine ansatte*
Emphasis on Training (Trening)
Q27 De ansatte får ikke tilstrekkelig opplæring i nye systemer eller nytt utstyr
Q28 Her gis det kun et minimum av den opplæringen de ansatte trenger for å gjøre jobben
sin
Q29 De ansatte blir oppmuntret til å utvikle sine ferdigheter*
Q30 De ansatte får tilstrekkelig opplæring i å bruke nytt utstyr*
Employee Welfare (Velferd)
Q31 Her vies lite oppmerksomhet til ansattes interesser
Q32 Her blir de ansatte tatt vare på*
Q33 Her bryr man seg om de ansatte*
Q34 Her prøver man å handle rettferdig overfor sine ansatte*
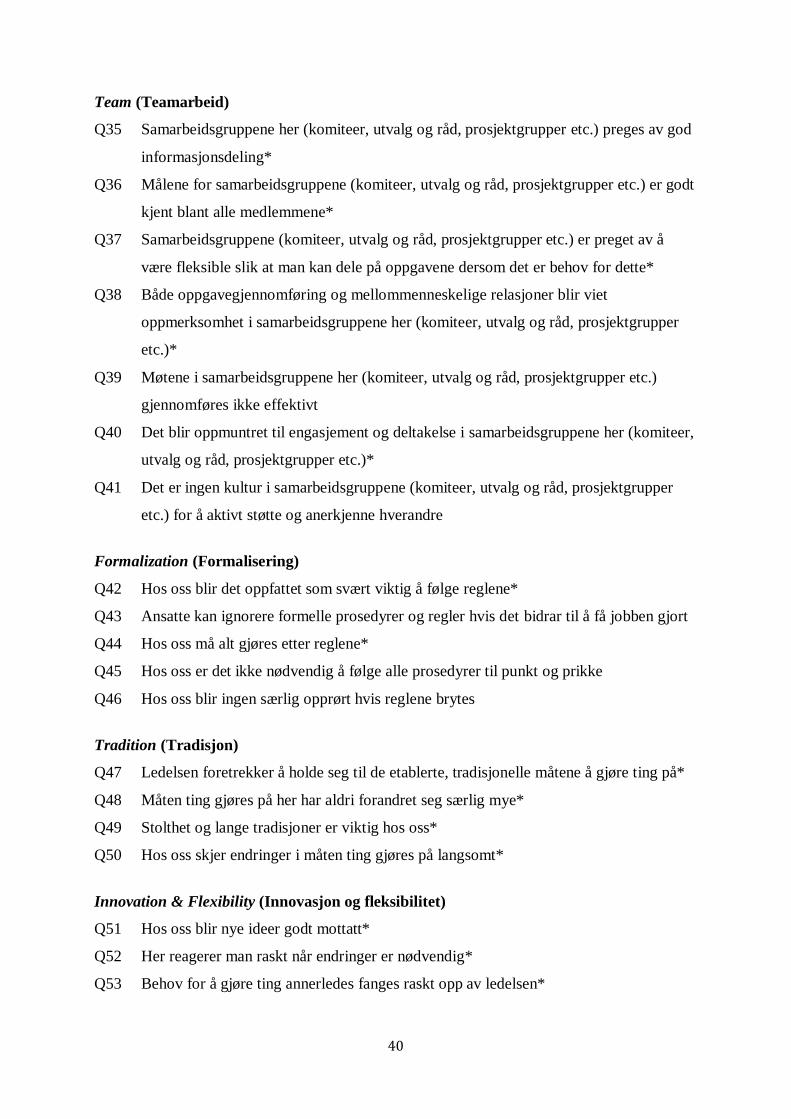
40
Team (Teamarbeid)
Q35 Samarbeidsgruppene her (komiteer, utvalg og råd, prosjektgrupper etc.) preges av god
informasjonsdeling*
Q36 Målene for samarbeidsgruppene (komiteer, utvalg og råd, prosjektgrupper etc.) er godt
kjent blant alle medlemmene*
Q37 Samarbeidsgruppene (komiteer, utvalg og råd, prosjektgrupper etc.) er preget av å
være fleksible slik at man kan dele på oppgavene dersom det er behov for dette*
Q38 Både oppgavegjennomføring og mellommenneskelige relasjoner blir viet
oppmerksomhet i samarbeidsgruppene her (komiteer, utvalg og råd, prosjektgrupper
etc.)*
Q39 Møtene i samarbeidsgruppene her (komiteer, utvalg og råd, prosjektgrupper etc.)
gjennomføres ikke effektivt
Q40 Det blir oppmuntret til engasjement og deltakelse i samarbeidsgruppene her (komiteer,
utvalg og råd, prosjektgrupper etc.)*
Q41 Det er ingen kultur i samarbeidsgruppene (komiteer, utvalg og råd, prosjektgrupper
etc.) for å aktivt støtte og anerkjenne hverandre
Formalization (Formalisering)
Q42 Hos oss blir det oppfattet som svært viktig å følge reglene*
Q43 Ansatte kan ignorere formelle prosedyrer og regler hvis det bidrar til å få jobben gjort
Q44 Hos oss må alt gjøres etter reglene*
Q45 Hos oss er det ikke nødvendig å følge alle prosedyrer til punkt og prikke
Q46 Hos oss blir ingen særlig opprørt hvis reglene brytes
Tradition (Tradisjon)
Q47 Ledelsen foretrekker å holde seg til de etablerte, tradisjonelle måtene å gjøre ting på*
Q48 Måten ting gjøres på her har aldri forandret seg særlig mye*
Q49 Stolthet og lange tradisjoner er viktig hos oss*
Q50 Hos oss skjer endringer i måten ting gjøres på langsomt*
Innovation & Flexibility (Innovasjon og fleksibilitet)
Q51 Hos oss blir nye ideer godt mottatt*
Q52 Her reagerer man raskt når endringer er nødvendig*
Q53 Behov for å gjøre ting annerledes fanges raskt opp av ledelsen*
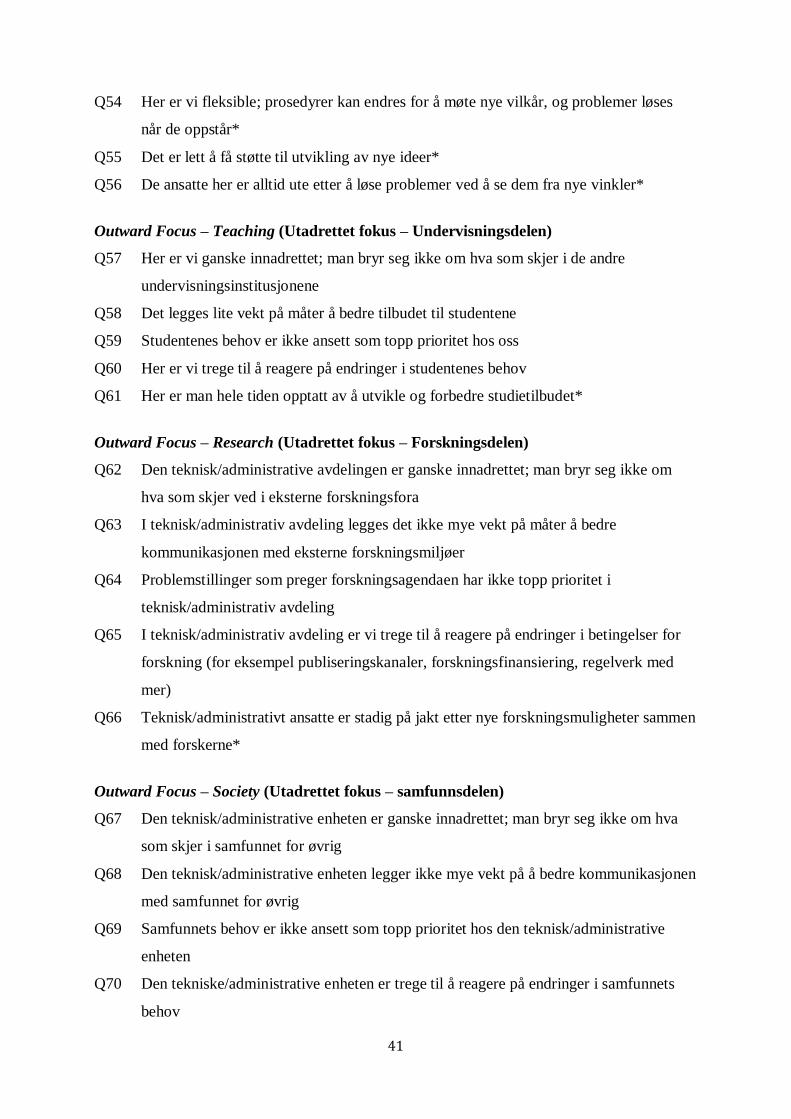
41
Q54 Her er vi fleksible; prosedyrer kan endres for å møte nye vilkår, og problemer løses
når de oppstår*
Q55 Det er lett å få støtte til utvikling av nye ideer*
Q56 De ansatte her er alltid ute etter å løse problemer ved å se dem fra nye vinkler*
Outward Focus – Teaching (Utadrettet fokus – Undervisningsdelen)
Q57 Her er vi ganske innadrettet; man bryr seg ikke om hva som skjer i de andre
undervisningsinstitusjonene
Q58 Det legges lite vekt på måter å bedre tilbudet til studentene
Q59 Studentenes behov er ikke ansett som topp prioritet hos oss
Q60 Her er vi trege til å reagere på endringer i studentenes behov
Q61 Her er man hele tiden opptatt av å utvikle og forbedre studietilbudet*
Outward Focus – Research (Utadrettet fokus – Forskningsdelen)
Q62 Den teknisk/administrative avdelingen er ganske innadrettet; man bryr seg ikke om
hva som skjer ved i eksterne forskningsfora
Q63 I teknisk/administrativ avdeling legges det ikke mye vekt på måter å bedre
kommunikasjonen med eksterne forskningsmiljøer
Q64 Problemstillinger som preger forskningsagendaen har ikke topp prioritet i
teknisk/administrativ avdeling
Q65 I teknisk/administrativ avdeling er vi trege til å reagere på endringer i betingelser for
forskning (for eksempel publiseringskanaler, forskningsfinansiering, regelverk med
mer)
Q66 Teknisk/administrativt ansatte er stadig på jakt etter nye forskningsmuligheter sammen
med forskerne*
Outward Focus – Society (Utadrettet fokus – samfunnsdelen)
Q67 Den teknisk/administrative enheten er ganske innadrettet; man bryr seg ikke om hva
som skjer i samfunnet for øvrig
Q68 Den teknisk/administrative enheten legger ikke mye vekt på å bedre kommunikasjonen
med samfunnet for øvrig
Q69 Samfunnets behov er ikke ansett som topp prioritet hos den teknisk/administrative
enheten
Q70 Den tekniske/administrative enheten er trege til å reagere på endringer i samfunnets
behov
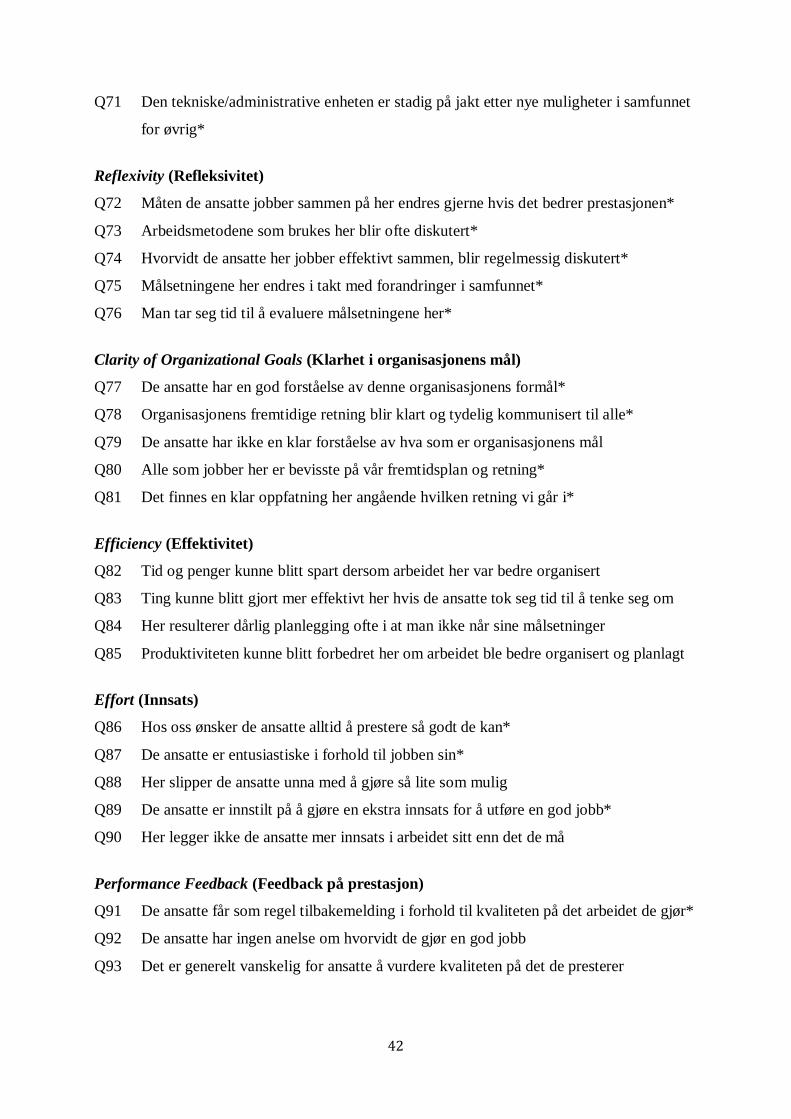
42
Q71 Den tekniske/administrative enheten er stadig på jakt etter nye muligheter i samfunnet
for øvrig*
Reflexivity (Refleksivitet)
Q72 Måten de ansatte jobber sammen på her endres gjerne hvis det bedrer prestasjonen*
Q73 Arbeidsmetodene som brukes her blir ofte diskutert*
Q74 Hvorvidt de ansatte her jobber effektivt sammen, blir regelmessig diskutert*
Q75 Målsetningene her endres i takt med forandringer i samfunnet*
Q76 Man tar seg tid til å evaluere målsetningene her*
Clarity of Organizational Goals (Klarhet i organisasjonens mål)
Q77 De ansatte har en god forståelse av denne organisasjonens formål*
Q78 Organisasjonens fremtidige retning blir klart og tydelig kommunisert til alle*
Q79 De ansatte har ikke en klar forståelse av hva som er organisasjonens mål
Q80 Alle som jobber her er bevisste på vår fremtidsplan og retning*
Q81 Det finnes en klar oppfatning her angående hvilken retning vi går i*
Efficiency (Effektivitet)
Q82 Tid og penger kunne blitt spart dersom arbeidet her var bedre organisert
Q83 Ting kunne blitt gjort mer effektivt her hvis de ansatte tok seg tid til å tenke seg om
Q84 Her resulterer dårlig planlegging ofte i at man ikke når sine målsetninger
Q85 Produktiviteten kunne blitt forbedret her om arbeidet ble bedre organisert og planlagt
Effort (Innsats)
Q86 Hos oss ønsker de ansatte alltid å prestere så godt de kan*
Q87 De ansatte er entusiastiske i forhold til jobben sin*
Q88 Her slipper de ansatte unna med å gjøre så lite som mulig
Q89 De ansatte er innstilt på å gjøre en ekstra innsats for å utføre en god jobb*
Q90 Her legger ikke de ansatte mer innsats i arbeidet sitt enn det de må
Performance Feedback (Feedback på prestasjon)
Q91 De ansatte får som regel tilbakemelding i forhold til kvaliteten på det arbeidet de gjør*
Q92 De ansatte har ingen anelse om hvorvidt de gjør en god jobb
Q93 Det er generelt vanskelig for ansatte å vurdere kvaliteten på det de presterer

43
Q94 De ansattes prestasjoner måles regelmessig*
Q95 Måten de ansatte gjør jobben sin på blir sjelden evaluert
Pressure to Produce (Produksjonspress)
Q96 Det forventes for mye av de ansatte i løpet av en dag*
Q97 Vanligvis er ikke de ansattes arbeidsbelastning spesielt krevende
Q98 Ledelsen krever at de ansatte jobber ekstremt hardt*
Q99 De ansatte er under sterkt tidspress for å nå målsetninger*
Q100 Arbeidstempoet her er ganske avslappet
Quality Focus - Research (Kvalitet – Forskningsdelen)
Q101 De teknisk/administrativt ansatte forsøker alltid å oppnå de høyeste
kvalitetsstandardene for forskning*
Q102 I teknisk/administrativ avdeling blir støtte til forskningskvalitet tatt seriøst*
Q103 De teknisk/administrative ansattes oppfatning er at suksess avhenger av
teknisk/administrativ støtte for å oppnå forskningskvalitet*
Quality Focus - Teaching (Kvalitet – Undervisningsdelen)
Q105 De teknisk/administrativt ansatte forsøker alltid å oppnå de høyeste
kvalitetsstandardene for undervisning*
Q106 Blant de teknisk/administrativt ansatte blir undervisningskvalitet tatt seriøst*
Q107: De teknisk/administrativt ansattes oppfatning er at suksess avhenger av høy kvalitet på
undervisningen*