Embed Size (px)
Citation preview

1
Validation and Disease Risk Assessment of Previously Reported Genome-
Wide Genetic Variants Associated with Brugada Syndrome:
SADS-TW BrS Registry
Running titles: Juang et al.; Validation of BrS-associated Variants in Taiwan
Jyh-Ming Jimmy Juang, MD, PhD1; Yen-Bin Liu, MD, PhD1; Ching-Yu Julius Chen, MD, PhD1;
Qi-You Yu, MS2; Amrita Chattopadhyay, PhD2; Lian-Yu Lin, MD, PhD1; Wen-Jone Chen, MD,
PhD1; Chih-Chien Yu, MD, PhD1; Hui-Chun Huang, MD, PhD1; Li-Ting Ho, MD1; Ling-Ping
Lai, MD, PhD1; Juey-Jen Hwang, MD, PhD3; Ting-Tse Lin, MD, PhD4; Ming-Chun Liao, MD4;
Jien-Jiun Chen, MD3; Shih-Fan Sherri Yeh, MD5; Jing-Yuan Chuang, PhD6; Dun-Hui Yang,
MD7; Jiunn-Lee Lin, MD, PhD8; Tzu-Pin Lu, Ph.D2; Eric Y. Chuang, ScD9;
Michael J. Ackerman, MD, PhD10
1Cardiovascular Center & Division of Cardiology, Dept of Internal Medicine, National Taiwan Univ Hospital & National Taiwan Univ College of Medicine; 2Inst of Epidemiology & Preventive Medicine, Dept of Public Health, 9Graduate Inst of Biomedical Electronics & Bioinformatics, National Taiwan Univ; 3Division of Cardiology, Dept of Internal Medicine, National Taiwan Univ
Hospital, Yun-Lin branch; 4Division of Cardiology, Dept of Internal Medicine, 5Dept of Environmental & Occupational Medicine, National Taiwan Univ Hospital Hsin-Chu branch, Taipei; 6Dept of Medical Laboratory Science & Biotechnology, China Medical Univ, Taichung;7 Dept of Radiology, Tainan Municipal Hospital, Tainan; 8 Division of Cardiology, Dept of Internal
Medicine, Taipei Medical Univ Hospital, Taipei, Taiwan; 10 Depts of Cardiovascular Medicine (Division of Heart Rhythm Services), Pediatric & Adolescent Medicine (Division of Pediatric Cardiology), Molecular Pharmacology & Experimental Therapeutics (Windland Smith Rice Sudden Death Genomics Laboratory), Mayo Clinic, Rochester, MN
Correspondence:
Tzu-Pin Lu, PhD
Institute of Epidemiology and Preventive Medicine
Department of Public Health, College of Public Health
National Taiwan University
Room 518, No. 17, Xu-Zhou Road
Taipei 100, Taiwan
Tel: +886-2-3366-8042
Fax: +886-2—3322-4179
E-mail: [email protected]
Journal Subject Terms: Arrhythmias; Sudden Cardiac Death; Computational Biology; Translational Studies; Genetics
Dow
nloaded from http://ahajournals.org by alice@
sads.org on June 5, 2020

2
Abstract:
Background - Brugada syndrome (BrS) is an oligogenic arrhythmic disease with increased risk
of sudden cardiac arrest (SCA). Several BrS or ECG traits-related single nucleotide
polymorphisms (SNPs) were identified through previous genome-wide association studies in
Caucasian patients. We aimed to validate these SNPs in BrS patients in the Taiwanese
population, assessing the cumulative effect of risk alleles and the BrS polygenic risk score (BrS-
PRS) in predicting cardiac events.
Methods - We genotyped 190 unrelated BrS patients using the TWB Array, and Taiwan
Biobank was used as controls. SNPs not included in the array were imputed by IMPUTE2. Cox’s
proportional hazards model was utilized to evaluate the associations between each particular
SNP, the collective BrS-PRS, and clinical outcomes.
Results - Of the 88 previously reported SNPs, 22 were validated in Taiwanese BrS patients
(P<0.05). Of the 22 SNPs, 2 (rs10428132, rs9388451) were linked with susceptibility to BrS, 10
were SNPs previously reaching genome-wide significance, and 10 were SNPs associated with
electrocardiogram traits. For the 3 most commonly reported SNPs, disease risk increased
consistently with the number of risk alleles (OR 3.54, Ptrend = 1.38 * 10-9 for 5 risk alleles
versus 1). Similar patterns were observed in both SCN5A mutation+ (OR 3.66, Ptrend = 0.049)
and SCN5A mutation- (OR 3.75, Ptrend = 8.54 * 10-9) subgroups. Furthermore, BrS patients
without SCN5A mutations had more risk alleles than BrS patients with SCN5A mutations
regardless of the range of PRS. Three SNPs (rs4687718, rs7784776, rs2968863) showed
significant associations with the composite outcome (SCA plus syncope, HR 2.13, 1.48, 0.41;
P=0.02, 0.006, 0.008, respectively).
Conclusions - Our findings suggested that some SNPs associated with BrS or electrocardiogram
traits exist across multiple populations. The cumulative risk of the BrS-related SNPs is similar to
that in Caucasian BrS patients, but it appears to correlate with the absence of SCN5A mutations.
Key words: bioinformatics; Brugada syndrome; genetic polymorphism; genetics; genotype; ethnic differences; allele frequency; disease risk
Dow
nloaded from http://ahajournals.org by alice@
sads.org on June 5, 2020

3
Nonstandard abbreviations and Acronyms:
BrS: Brugada Syndrome
SCA: Sudden Cardiac Arrest
BrS-PRS: Brugada Syndrome-polygenic risk score
Introduction
Brugada syndrome (BrS), an oligogenic arrhythmic disease responsible for sudden cardiac arrest
(SCA) in patients with structurally normal hearts, was first reported by Brugada et al. in 1992.1
BrS accounts for 4% of all sudden deaths and for up to 20% of sudden deaths in patients without
structural cardiac disease.2 The prevalence of BrS is estimated to be 1–5 per 10,000 people in
Caucasians3, but is higher in Southeast Asians (12 per 10,000).4,5
In 1998, the SCN5A-encoded alpha-subunit of the voltage-gated Nav1.5 cardiac sodium
channel was first associated with BrS.6 Although SCN5A is the most common BrS-susceptibility
gene, it is responsible for only 20% of BrS cases in Caucasian populations7, 8 and even less, 7.5–
8% of BrS cases, in the Han Chinese population.9 BrS is generally considered a Mendelian
disorder with autosomal dominant transmission and incomplete penetrance. Priori et al.
estimated that the overall disease penetrance across 4 small BrS families harboring mutations in
the SCN5A gene was 16% (range 12.5% to 50%) based on their electrocardiograms (ECGs).10, 11
In the past 2 decades, several BrS-associated genes and modifier genes have been reported, and
most of these primarily encode sodium, potassium, and calcium channels or the proteins
associated with these channels. However, disease-causing genes remain unknown in
approximately 80-85% of BrS patients. Additionally, the disease is sporadic in many patients.12,
13 These observations suggest a more complex inheritance model.
Dow
nloaded from http://ahajournals.org by alice@
sads.org on June 5, 2020

4
To identify new genetic variants, Dr. Bezzina et al. conducted a large-scale genome-wide
association study (GWAS) with 312 BrS cases in the European populations and replicated the
results in 594 cases from Europe and 208 cases from Japan.14 They reported 3 common SNPs
associated with BrS: rs11708996 in SCN5A, rs10428132 in SCN10A, and rs9388451 near HEY2.
Furthermore, they analyzed the cumulative effect of these 3 SNPs on susceptibility to BrS with a
BrS-polygenic risk score (BrS-PRS), and found that likelihood of BrS increased consistently
with the number of risk alleles. However, it is unclear whether the previously identified SNPs are
relevant in other racial groups such as the Taiwanese or whether population-specific SNPs
influence BrS. In this study, we first aimed to validate the previously identified BrS-related SNPs
in patients with BrS in Taiwan and assessed the cumulative risk of these SNPs on susceptibility
to BrS. We then analyzed additional SNPs, including those reaching genome-wide significance
in the GWAS from Dr. Bezzina et al. and those associated with ECG traits (ex. PR interval, QRS
duration and QT interval). Since clinical outcomes of identified BrS-related common variants in
the previous GWAS from Dr. Bezzina et al. were not investigated, we further investigated the
association between the BrS-PRS and clinical outcomes, and then compared them between BrS
patients with and without pathogenic SCN5A variants.
Methods
This study was approved by the local ethical committee of National Taiwan University Hospital,
and all participants gave informed consent before participating. The imputation workflow is
illustrated in Figure 1 and the details of the methods are shown in the supplemental data. The
data that support the findings of this study are available from the corresponding author upon
reasonable request.
Dow
nloaded from http://ahajournals.org by alice@
sads.org on June 5, 2020

5
Results
Patient population
The basic demographic and clinical presentation of the 190 Taiwanese patients with BrS is
shown in Table 1. The mean age of the patients with BrS was 45.6 ± 15.7 years and 87.4% of
the patients were male. Regarding their symptoms, 62.6 % of the study patients were
symptomatic (either SCA or unexplained syncope), and 71.2% presented with spontaneous type
1 Brugada ECG.
Validation of the imputation method by in silico approaches and direct sequencing
To ensure high quality of the imputed genotyping calls of the variants in this study, we verified
the accuracy of the imputation method by using it on sequences for which microarray data were
available. We found that the concordance of genotypes obtained by the imputation algorithm and
the actual microarray was more than 90%. In addition to the in silico analyses, we performed
direct sequencing to validate the genotyping calls obtained by imputation. We randomly selected
3 SNP loci in 20 samples for this validation, and all of the genotypes were the same as those
obtained by using the imputation approach. These results indicate that imputation is a feasible
and efficient approach to obtain genotyping calls for the SNP loci that were originally not
detectable in the microarrays.
Comparisons of the variants with significance in BrS patients between Caucasian and
Taiwanese populations
Among the 3 SNPs previously shown to cause susceptibility to Brugada syndrome (set 1), only
rs9388451 was available on the Affymetrix TWB chip. As shown in Table 2, the allele
frequency of rs9388451 was significantly higher in the Taiwanese BrS patients than the healthy
controls (P=0.003). We obtained the genotyping calls of the other 2 SNPs (rs11708996,
Dow
nloaded from http://ahajournals.org by alice@
sads.org on June 5, 2020

6
rs10428132) by using the imputation approach which was validated by Sanger sequencing. Only
rs10428132 showed significant differences between BrS patients and controls (P=5.92*10-8).
Among the 12 SNPs reaching genome-wide significance in the previous GWAS from Dr.
Bezzina et al. (set 2), most of them are located in SCN10A.14 As shown in Table 2, 10 out of the
12 SNPs had significantly higher allele frequencies in Taiwanese BrS patients than in the healthy
controls. In general, the results were similar to those reported in the Caucasian BrS patients.
Among the 75 SNPs associated with ECG traits (set 3), 10 showed significant differences in
Taiwanese BrS patients versus healthy controls (Table 2). Among the 10 SNPs, only 4—
rs11129795, rs6795970, rs6798015, and rs314370—reached significance in the GWAS
significance threshold (< 5* 10-8). In conclusion, the results suggested that the general patterns of
the important SNPs in BrS patients were similar between Caucasian and Taiwanese populations,
but the low number of replicated SNPs associated with ECG traits implied they were not
important targets for BrS in Taiwanese patients.
Comparisons of the PRS between BrS patients and the healthy controls from Taiwan
In addition to the single marker tests, we developed PRS models using the 3 sets of SNPs. The
weighting for the PRS models was obtained by using all BrS patients in Taiwan versus the
healthy controls. The healthy controls were classified into 5 subgroups with equal PRS ranges.
The group with the lowest PRS (0%-20%) was utilized as the reference to calculate the ORs of
disease risk. We calculated the ORs by dividing the number of BrS patients by the number of
healthy controls in each subgroup. The results are summarized in Table 3. For the 3 SNPs in set
1 (BrS-PRS14), the BrS patients with the relatively higher PRS (61%-80%) had a significantly
higher risk of disease (OR 2.03) than the healthy controls, but this OR was not the highest. For
the 12 SNPs reaching genome-wide significance (set 2), only rs10428132 and rs12638572
Dow
nloaded from http://ahajournals.org by alice@
sads.org on June 5, 2020

7
showed a high correlation (R2 > 0.7) in the LD calculation. We selected rs10428132 for further
analyses because rs10428132 has lower p-value in Table 2. After excluded rs12638572, other
SNPs in set 2 were left for further analyses. To further address the issue of genomic inflation, we
performed a condition analysis for each SNP set 2 by conditioning on rs10428132, which was
the leading SNP reported by the previous GWAS. The results of the conditional analyses are
summarized in Table S1. Consequently, we used the 7 significant SNPs in Table S1 along with
rs10428132 to develop the PRS model. As shown in Table 3, the BrS patients with the highest
PRS (81%-100%) showed significantly higher disease risk (likelihood of BrS diagnosis) than
controls (OR: 3.61 (2.14-6.10)). For the 75 SNPs associated with ECG traits (set 3), the BrS
patients with relatively higher scores (41%-100%) reported significantly higher disease risk
(ORs 4.83-11.67). Similar to the second set, the BrS patients with the highest PRS (81%-100%)
displayed the highest OR (11.67). In summary, the results of the three different PRS models
demonstrated that the cumulative effects of the reported SNPs, as reflected in the PRSs, were
effective markers in distinguishing Taiwanese BrS patients and healthy controls.
Cumulative effects of the 3 major risk alleles (set 1, BrS-PRS14) on susceptibility to BrS in
Taiwanese BrS patients
To compare the cumulative effect of the 3 previously reported major risk alleles in Taiwanese
BrS patients, the allele frequencies of these 3 SNPs were evaluated between BrS patients and
healthy controls. The result is illustrated in Figure 2. First, we compared the disease risk
between all BrS patients and healthy controls and found that the risk increased consistently with
the number of risk alleles present (Ptrend=1.38 * 10-9), with the estimated OR reaching 3.54 in
the presence of more than 4 risk allele copies versus only 1 risk allele (Figure 2A). Second, we
divided the BrS patients into two groups based on the presence or absence of SCN5A mutations.
Dow
nloaded from http://ahajournals.org by alice@
sads.org on June 5, 2020
8
Similar patterns were observed in both SCN5A mutation+ (OR=3.66, Ptrend=0.049) and SCN5A
mutation- (OR=3.75, Ptrend=8.54 * 10-9) subgroups (Figure 2B and Figure 2C). However,
some discrepancies of the ORs can be observed between the SCN5A mutation+ and SCN5A
mutation- subgroups, suggesting some genetic differences may exist in the 2 subgroups.
Comparisons of the previously reported SNPs in BrS patients with and without SCN5A
mutations
Since SCN5A has been reported as the most dominant gene in BrS, albeit still accounting for
only 20% of BrS in Caucasians, we divided the BrS patients into two subgroups accordingly
(SCN5A mutation+ versus SCN5A mutation-). The results are shown in Table 4. In set 1 SNPs,
rs10428132 was significant in BrS patients in both subgroups (P<0.05). However, rs9388451
was only significant in the SCN5A mutation- BrS patients. In set 2 SNPs, the 10 SNPs which
were significant in all combined BrS patients were still significant in the SCN5A mutation- BrS
patients. Intriguingly, 3 SNPs (rs6599240, rs1268070, rs9388451) were only significant in the
SCN5A mutation- BrS patients but not in the SCN5A mutation+ BrS patients. Similar patterns
were observed in the 75 SNPs associated with ECG traits (set 3 SNPs). Among the 10 significant
SNPs of set 3 in Table 2, all of them were significant in the SCN5A mutation- BrS patients, but
only 3 were significant in the SCN5A mutation+ BrS patients. Notably, two SNPs (rs37062 and
rs7784776) were significant in the SCN5A mutation+ BrS patients alone, which were not in the
10 significant SNPs, and intriguingly they were both protective SNPs in the SCN5A mutation+
BrS patients. In addition, rs2074518 was not significant in all combined BrS patients, but it was
significant in both BrS mutation+ and mutation- patients. However, rs2074518 was a risk allele
in BrS SCN5A mutation- patients but a protective allele in BrS SCN5A mutation+ patients.
Therefore, these differences between the SCN5A mutation+ and SCN5A mutation-BrS patients
Dow
nloaded from http://ahajournals.org by alice@
sads.org on June 5, 2020

9
hinted that future investigations should classify the patients into subgroups instead of combining
them into one unit.
In addition to the single marker tests, we examined the cumulative proportions of the 3
BrS-associated SNPs (set 1, BrS-PRS14) in the Taiwanese BrS patients after being stratified by
the presence/absence of SCN5A pathogenic variants (Figure 3). Notably, the SCN5A mutation-
BrS patients had more risk alleles (at least 4 risk alleles). Furthermore, we developed the PRS
models using weighting schemes generated from the SCN5A mutation-BrS patients versus
healthy controls. The results are summarized in Figure 4 and Table S2. Using the PRS model
generated from the 3 SNPs in set 1 (BrS-PRS14), the ORs of the disease risk showed differences
in BrS patients with and without SCN5A variants (Figure 4A) in the 21%-80% PRS groups.
However, the results have negative ORs in the 21%-40% PRS group whereas positive ORs in the
41%-80% PRS groups. These fluctuating ORs may result from the low number of SNPs
analyzed in the PRS model. Alternatively, obvious differences were observed in the ORs
obtained from the PRS models generated from set 2 SNPs or set 3 SNPs (Figure 4B and Figure
4C). In general, most ORs were higher in the SCN5A mutation- BrS patients than in the SCN5A
mutation+ BrS patients, regardless of the high or low range of PRS. These results further
indicated that the genetic markers differ between BrS1 patients with a pathogenic SCN5A variant
and those patients diagnosed with BrS who are SCN5A negative.
Associations of the previously reported SNPs and PRS with clinical outcomes
We evaluated whether these SNPs were able to predict clinical outcomes (SCA or unexplained
syncope or both) in BrS patients. First, a single marker test was utilized for all previously
reported SNPs (set 1-3) in Table S3. Of these SNPs, 3 SNPs (rs4687718 in TKT, rs7784776 in
IGFBP3, rs2968863 in KCNH2) showed significant associations with the composite clinical
Dow
nloaded from http://ahajournals.org by alice@
sads.org on June 5, 2020

10
outcome (SCA plus syncope) (P<0.05, Table S4). Notably, rs7784776 was only significant in
the SCN5A mutation- BrS patients, whereas rs4687718 was significant only in the SCN5A
mutation+ BrS patients. Only the SNP, rs2968863, showed protective effects in all BrS patients
no matter whether they had a SCN5A variant or not. We also examined whether the PRS models
generated from the 3 sets of previously reported SNPs were able to predict the clinical outcomes
or not. Unfortunately, none of the results of the 3 PRS models were significant, and thus they
cannot serve as a predictor for the clinical outcomes in Taiwanese BrS patients.
Discussion
In this study, we successfully validated 22 of the 88 previously identified BrS- or ECG traits-
related SNPs in patients with BrS in Taiwan. We assessed the cumulative effects of the SNPs on
the risk of BrS and their association with clinical outcomes.
In 2013, Bezzina and colleagues reported 3 important common SNPs associated with BrS,
including rs11708996 in SCN5A, rs10428132 in SCN10A, and rs9388451 near HEY2,14 and
found that disease risk (likelihood of BrS diagnosis) increased consistently with the number of
risk alleles. In the current study, rs10428132 and rs9388451 were successfully validated in
Taiwanese BrS patients, demonstrating that the same variants can affect BrS across different
populations. Intriguingly, the MAF difference of rs9388451 between the cases and controls was
only 0.08 in the Taiwanese population, which was lower than that in both the Japanese (0.11)
and Caucasian populations (0.15),14 suggesting that racial differences should be taken into
consideration because of the differing allele frequencies in the BrS patients with different ethnic
backgrounds.
Dow
nloaded from http://ahajournals.org by alice@
sads.org on June 5, 2020
11
In addition, the cumulative effect of the 3 major risk alleles on susceptibility to BrS
increased with the number of risk alleles present in the Taiwanese BrS patients, consistent with
the results in Caucasian BrS patients.14 However, the cumulative effect was smaller in Taiwanese
BrS patients than in Caucasian BrS patients; this might be caused by the smaller sample size of
our study cohort or by ethnic differences.
Validation of the 12 SNPs reaching genome-wide significance in Caucasian BrS patients
Among the 12 SNPs which reached genome-wide significance in Caucasian BrS patients (set 2),
10 were successfully validated in Taiwanese BrS patients, providing further evidence that
SCN10A and HEY2 are highly associated with BrS. The P-values were relatively higher in the
Taiwanese population, which may have resulted from the limited sample size of BrS patients or
from genetic differences between the two populations.
Comparisons of the reported SNPs (set 1, 2 and 3) and PRS between the BrS patients with
SCN5A mutation and the BrS patients without SCN5A mutations
SCN5A is the major BrS-causing gene, but is responsible for only 20% of BrS cases in Caucasian
populations7, 8 and even less in the BrS patients in Japanese and Taiwanese population. (7.5–
8%)9,15, which might imply that the genetic background of BrS is partly different in different
populations. In this study, we found that BrS patients without SCN5A mutations had more risk
alleles (4 or 5 risk alleles) in the BrS-PRS14 than BrS patients with SCN5A mutations. In addition,
the cumulative effect of the 3 common SNPs on susceptibility to BrS was larger in the BrS
patients without SCN5A mutations than in BrS patients with SCN5A mutations. This may suggest
that SCN5A mutations are dominant drivers of BrS whereas other minor variants/genes need
higher quantities to display their effects. However, when the PRS generated by the 3 common
SNPs was applied, there was no significant difference in disease risk between the two groups.
Dow
nloaded from http://ahajournals.org by alice@
sads.org on June 5, 2020

12
This discrepancy might be explained by the limited number of the SNPs in this 3-SNP model or
the assumption that the genetic effect of each SNP is the same. When the PRS generated by more
SNPs (10 SNPs (set 2) or 75 SNPs (set 3), all ORs of disease risk were consistently higher in the
BrS patients without SCN5A mutations than in the BrS patients with SCN5A mutations,
regardless of the range of PRS. Furthermore, we found that more SNPs reaching genome-wide
significance in the GWAS threshold in this study (set 2) and more SNPs associated with ECG
traits (set 3) were validated in the BrS patients without SCN5A mutations than in the BrS patients
with SCN5A mutations, although some of the SNPs were overlapped. These results indicated that
it is necessary to consider the effects of the SNPs in BrS patients in the context of SCN5A
variants, because the genetic architecture between BrS patients with SCN5A mutations and
without SCN5A mutations may be different. In addition, the cumulative effects of SNP set 2
from Dr. Bezzina et al., which were mostly located on chromosome 3, showed different ORs
between SCN5A (+) and SCN5A (-) BrS patients (Figure 4B). This indicated that a SCN5A (-)
BrS patient tends to have more risk alleles in SNP set 2. However, due to the limitations of the
experimental techniques utilized in this study, we could only consider the effects of multiple
SNPs by an additive model instead of a haplotype. Therefore, further investigations are
warranted to explore whether chromosome 3 haplotype can provide synergetic effects in BrS
patients.
Limitations
Some limitations exist in this study. First, although the sample size for all BrS patients was
almost 200, it may still have lacked sufficient power to do the patient stratification by SCN5A
mutations. It is well known that only around 20% of the BrS patients have pathogenic SCN5A
variants, which resulted in less than 50 patients with SCN5A variants in this study. However, the
Dow
nloaded from http://ahajournals.org by alice@
sads.org on June 5, 2020
13
current data indicated huge differences in MAFs between BrS patients with and without SCN5A
mutations, suggest that it is worth doing stratification in future investigations. Second, we used
the 1000 Genomes East Asian population as the reference in the imputation approach. This
reference is perhaps not the best one, because the genetics of the Taiwanese population may be
closer to the Han Chinese population. However, the sample size would be relatively limited if we
used the Han Chinese population only, and thus we decided to use all East Asian populations to
include more diverse haplotypes in the reference. Based on the high accuracy values validated by
the imputation algorithm and the PCR experiment, we believe this is not a critical issue in this
study. In addition to the validations of DNA variants associated with BrS from a previous
GWAS, we performed the analysis of all SNPs examined in the TWB chip in the current dataset
containing 190 BrS cases and around 16,000 healthy Taiwanese controls in Taiwan. The
preliminary results of our primary GWAS were summarized in Table S5. However, notably
some of the p-values were very low (Table S5). We were afraid that these astounding findings
may be too good to be true. These extremely low p-values may be the result of the probe design,
technical issues in the GWAS chip or the hugely imbalanced sample sizes in our GWAS (190
cases vs. 16,000 controls). Therefore, validations of these DNA loci in independent cohorts are
prerequisite to further apply them into advanced researchers and/or applications.
Conclusions
Of the 88 previously reported SNPs, 22 SNPs were validated in Taiwanese BrS patients, and 3
SNPs (rs4687718, rs7784776, rs2968863) were associated with composite clinical outcomes
(SCA plus syncope). The cumulative effect of the 3 major risk alleles on susceptibility to BrS
was larger in BrS patients than in healthy controls. Furthermore, this effect was also larger in
SCN5A genotype negative BrS patients than those with SCN5A-mediated BrS (BrS1). PRSs
Dow
nloaded from http://ahajournals.org by alice@
sads.org on June 5, 2020

14
showed that all ORs of disease risk were consistently higher in BrS patients without SCN5A
mutations than in those with SCN5A mutations, regardless of the range of PRS.
Acknowledgments: We are sincerely grateful to the staff of the Sixth Core Lab, Department of
Medical Research, National Taiwan University Hospital and National Center of Genome
Medicine for technical support in the genotyping, and all doctors participated the SADS-TW BrS
registry (see supplementary data). We thank Melissa Stauffer, of Scientific Editing Solutions, for
editing the manuscript.
Sources of Funding: Financial support for this research was provided partially through grants
NTUH 106-S3469, NTUH106-S3458, NTUH 106-018, UN 103-018, and UN104-001 from
National Taiwan University Hospital, Taiwan Health Foundation, and NSC 101-2314-B-002-
168-MY2, NSC 101-2314-B-002-173-MY2, NSC 103-2314-B-002-148, MOST 104-2314-B-
002-193-MY3, MOST 106-2314-B-002-047-MY3, MOST 106-2314-B-002 -134-MY2, MOST
106-2314-B-002-206 from the Ministry of Science and Technology. MJA is supported by the
Mayo Clinic Windland Smith Rice Comprehensive Sudden Cardiac Death Program.
Disclosure: None
References: 1. Brugada P, Brugada J. Right bundle branch block, persistent st segment elevation and sudden cardiac death: A distinct clinical and electrocardiographic syndrome. A multicenter report. J Am Coll Cardiol. 1992;20:1391-1396 2. Antzelevitch C, Brugada P, Borggrefe M, Brugada J, Brugada R, Corrado D, Gussak I, LeMarec H, Nademanee K, Perez Riera AR, et al. Brugada syndrome: Report of the second consensus conference: Endorsed by the heart rhythm society and the european heart rhythm association. Circulation. 2005;111:659-670 3. Berne P, Brugada J. Brugada syndrome 2012. Circ J. 2012;76:1563-1571 4. Mizusawa Y, Wilde AA. Brugada syndrome. Circ Arrhythm Electrophysiol. 2012;5:606-616 5. Juang JM, Chen CY, Chen YH, Wu IC, Hsu CC, Chen LN, Tang FC, Wang CC, Juan CC, Chiu HC, et al. Prevalence and prognosis of brugada electrocardiogram patterns in an elderly han
Dow
nloaded from http://ahajournals.org by alice@
sads.org on June 5, 2020

15
chinese population: A nation-wide community-based study (halst cohort). Europace. 2015;17 Suppl 2:ii54-62 6. Chen Q, Kirsch GE, Zhang D, Brugada R, Brugada J, Brugada P, Potenza D, Moya A, Borggrefe M, Breithardt G, et al. Genetic basis and molecular mechanism for idiopathic ventricular fibrillation. Nature. 1998;392:293-296 7. Kapplinger JD, Tester DJ, Alders M, Benito B, Berthet M, Brugada J, Brugada P, Fressart V, Guerchicoff A, Harris-Kerr C, et al. An international compendium of mutations in the scn5a-encoded cardiac sodium channel in patients referred for brugada syndrome genetic testing. Heart rhythm : the official journal of the Heart Rhythm Society. 2010;7:33-46 8. Crotti L, Marcou CA, Tester DJ, Castelletti S, Giudicessi JR, Torchio M, Medeiros-Domingo A, Simone S, Will ML, Dagradi F, et al. Spectrum and prevalence of mutations involving brs1- through brs12-susceptibility genes in a cohort of unrelated patients referred for brugada syndrome genetic testing: Implications for genetic testing. J Am Coll Cardiol. 2012;60:1410-1418 9. Juang JM, Tsai CT, Lin LY, Liu YB, Yu CC, Hwang JJ, Chen JJ, Chiu FC, Chen WJ, Tseng CD, et al. Unique clinical characteristics and scn5a mutations in patients with brugada syndrome in taiwan. J Formos Med Assoc. 2015;114:620-626 10. Priori SG, Napolitano C, Gasparini M, Pappone C, Della Bella P, Brignole M, Giordano U, Giovannini T, Menozzi C, Bloise R, et al. Clinical and genetic heterogeneity of right bundle branch block and st-segment elevation syndrome: A prospective evaluation of 52 families. Circulation. 2000;102:2509-2515 11. Juang JJ, Horie M. Genetics of brugada syndrome. J Arrhythm. 2016;32:418-425 12. Schulze-Bahr E, Eckardt L, Breithardt G, Seidl K, Wichter T, Wolpert C, Borggrefe M, Haverkamp W. Sodium channel gene (scn5a) mutations in 44 index patients with brugada syndrome: Different incidences in familial and sporadic disease. Hum Mutat. 2003;21:651-652 13. Hermida JS, Dassonvalle E, Six I, Amant C, Coviaux F, Clerc J, Herent D, Hermida A, Rochette J, Jarry G. Prospective evaluation of the familial prevalence of the brugada syndrome. Am J Cardiol. 2010;106:1758-1762 14. Bezzina CR, Barc J, Mizusawa Y, Remme CA, Gourraud JB, Simonet F, Verkerk AO, Schwartz PJ, Crotti L, Dagradi F, et al. Common variants at scn5a-scn10a and hey2 are associated with brugada syndrome, a rare disease with high risk of sudden cardiac death. Nat Genet. 2013;45:1044-1049 15. Yamagata K, Horie M, Aiba T, Ogawa S, Aizawa Y, Ohe T, Yamagishi M, Makita N, Sakurada H, Tanaka T, et al. Genotype-phenotype correlation of scn5a mutation for the clinical and electrocardiographic characteristics of probands with brugada syndrome: A japanese multicenter registry. Circulation. 2017;135:2255-2270
Dow
nloaded from http://ahajournals.org by alice@
sads.org on June 5, 2020

16
Table 1. Demographic data and clinical manifestations of the BrS patients
BrS patients (n = 190)
Male, n (%) 166 (87.4)
Mean age, years ± SD 45.6 ± 15.7
Asymptomatic, n (%) 30 (15.8)
Palpitation or chest pain, n (%) 41 (21.6)
Unexplained syncope, n (%) 70 (36.8)
SCD, n (%) 49 (25.8)
Family history of SCD, n (%) 32 (16.8)
Spontaneous type 1 Brugada ECG, n (%) 136 (71.2)
BrS = Brugada syndrome; ECG = electrocardiogram; SCD = sudden cardiac death; SD = standard deviation.
Dow
nloaded from http://ahajournals.org by alice@
sads.org on June 5, 2020

17
Table 2. Validation of the previously reported SNPs in the Taiwanese BrS patients
Chr. Position (Build 37)
Imputed or
original
Gene or nearest
gene
Risk allele
Protective allele
RAF (190 cases
/15,981 controls) in Taiwanese
MAF (case/control) in Caucasians
All BrS patients in Taiwan vs. Healthy
controls
OR in the previous GWAS1
SNPs causing susceptibility to Brugada syndrome (set 1) P-value* OR OR
rs11708996 Chr3:38633923 original SCN5A C G 0.011/0.007 0.23/0.15 4.27E-01 1.5 (0.46-3.57)
1.64 (1.30–2.07)
rs10428132 Chr3:38777554 imputed SCN10A T G 0.305/0.193 0.69/0.41 5.92E-08† 1.84 (1.47-2.29)
3.00 (2.45–3.69)
rs9388451 Chr6:126090377 original HEY2, NCOA7 C T 0.818/0.742 0.65/0.50 7.94E-04† 1.56
(1.21-2.05) 1.83
(1.51–2.22) SNPs reaching genome-wide significance in the GWAS threshold in this study (set 2)
rs6599240 Chr3:38738717 original SCN10A A G 0.195/0.138 NA/0.435 1.65E-03† 1.51 (1.16-1.94)
2.07 [1.71-2.51]
rs11129801 Chr3:38750375 imputed SCN10A G A 0.645/0.535 NA/0.72 8.91E-06† 1.56 (1.28-1.89)
2.00 [1.56-2.55]
rs9874633 Chr3:38771994 imputed SCN10A A G 0.789/0.784 NA/NA 9.94E-01 1.00 (0.79-1.28)
2.70 [2.07-3.52]
rs10428132 Chr3:38777554 imputed SCN10A T G 0.305/0.193 NA/NA 5.92E-08† 1.84 (1.47-2.29)
3.00 [2.45-3.69]
rs7428167 Chr3:38778191 original SCN10A T C 0.521/0.396 NA/NA 1.08E-06† 1.66 (1.35-2.03)
2.86 [2.32-3.53]
rs10428168 Chr3:38780059 original SCN10A T C 0.663/0.669 NA/NA 8.08E-01 0.97 (0.79-1.21)
2.62 [2.06-3.32]
rs12638572 Chr3:38787797 original SCN10A A G 0.318/0.205 NA/NA 9.04E-08† 1.81 (1.45-2.25)
2.12 [1.68-2.67]
rs7641844 Chr3:38802251 original SCN10A A G 0.447/0.318 NA/NA 1.05E-07† 1.74 (1.42-2.13)
2.02 [1.57-2.59]
rs7430439 Chr3:38803639 original SCN10A G A 0.418/0.294 NA/NA 1.91E-07† 1.73 (1.4-2.12)
1.75 [1.45-2.13]
rs6599257 Chr3:38804588 original SCN10A C T 0.226/0.13 NA/NA 4.78E-08† 1.97 (1.54-2.5)
2.17 [1.79-2.65]
rs1268070 Chr6:126041164 imputed HEY2 C T 0.853/0.804 NA/NA 3.79E-02† 1.33 (1.02-1.75)
1.80 [1.48-2.20]
rs9388451 Chr6:126090377 original HEY2, NCOA7 C T 0.818/0.742 NA/0.49 7.94E-04† 1.56
(1.21-2.05) 1.83
[1.51-2.22] SNPs previously associated with ECG traits (set 3)†
rs17020136 Chr2:37248015 imputed HEATR5B, STRN T C 0.443/0.509 0.213/0.182 7.36E-03† 0.76
(0.62-0.93) NA
Dow
nloaded from http://ahajournals.org by alice@
sads.org on June 5, 2020

18
rs10865355 Chr2:66764997 imputed MEIS1 A G 0.221/0.174 0.402/0.377 1.62E-02† 1.35 (1.05-1.72) NA
rs11897119 Chr2:66772000 original MEIS1 T C 0.779/0.825 0.401/0.377 1.14E-02† 0.73 (0.58-0.94) NA
rs11129795 Chr3:38589163 original SCN5A, SCN10A G A 0.932/0.91 0.284/0.233 1.77E-17† 3.89
(2.91-5.46) NA
rs6795970 Chr3:38766675 original SCN5A, SCN10A A G 0.263/0.152 0.668/0.410 5.10E-09† 1.98
(1.57-2.49) NA
rs6798015 Chr3:38798836 imputed SCN5A, SCN10A C T 0.315/0.194 0.607/0.364 3.96E-09† 1.92
(1.54-2.39) NA
rs314370 Chr7:100453208 original SLC12A9, UFSP1 T C 0.928/0.955 0.176/0.189 2.65E-09† 2.33
(1.8-3.15) NA
rs7342028 Chr10:114479262 original VTI1A G T 0.405/0.461 0.260/0.277 3.56E-02† 0.80 (0.65-0.98) NA
rs1896312 Chr12:115346424 original TBX3,TBX5 C T 0.611/0.553 0.303/0.286 2.35E-02† 1.27 (1.03-1.56) NA
rs10850409 Chr12:115381740 original TBX3,TBX5 G A 0.382/0.441 0.278/0.269 2.69E-02† 0.79 (0.64-0.97) NA
OR: odds ratio; NA: not available; 1. Bezzina et. al. Nat Genet. 2013 Sep;45(9):1044-9 BrS: Brugada Syndrome, MAF: minor allele frequency, OR: Odds Ratio, RAF: risk allele frequency, SNP: single nucleotide polymorphism NA: only one genotype exists *P-value was obtained by using logistic regression. Red color indicates statistical significance. † indicates statistical significance (p < 0.05). ‡Only significant SNPs are listed (for all SNPs, please refer to Table S6).
Dow
nloaded from http://ahajournals.org by alice@
sads.org on June 5, 2020

19
Table 3. Comparisons of disease risk using the PRS models generated by the 3 sets of SNPs
PRS range Odds ratio Set 1 SNPs
0%-20%* 1 21%-40% 0.16 (0.06-0.42) 41%-60% 2.10 (1.36-3.22) ‡ 61%-80% 2.03 (1.32-3.13) ‡ 81%-100% 0.77 (0.45-1.32)
Set 2 SNPs † 0%-20%* 1 21%-40% 1.67 (0.93-3.00) 41%-60% 1.67 (0.93-3.00) 61%-80% 1.56 (0.86-2.82) 81%-100% 3.61 (2.14-6.1) ‡
Set 3 SNPs 0%-20%* 1 21%-40% 2.17 (0.82-5.74) 41%-60% 4.83 (1.99-11.72) ‡ 61%-80% 5.84 (2.44-13.98) ‡ 81%-100% 11.67 (5.03-27.04) ‡
PRS, polygenic risk score; SNP, single nucleotide polymorphism
*Reference group †only included rs10428132, rs11129801, rs7428167, rs10428168, rs7641844 and rs7430439 on chromosome 3, and rs1268070 and rs9388451 on chromosome 6. ‡indicates statistical significance (p < 0.05).
Dow
nloaded from http://ahajournals.org by alice@
sads.org on June 5, 2020

20
Table 4. Summary of the significant previously reported SNPs in Taiwanese BrS patients with or without SCN5A mutations
Without SCN5A mutations With SCN5A mutations P-value* Odds ratio P-value* Odds ratio SNPs causing susceptibility to Brugada syndrome (set 1)
rs10428132 1.97E-06 1.79 (1.4-2.27) 6.68E-03‡ 2.16 (1.21-3.72) rs9388451 5.69E-04 1.66 (1.25-2.24) 6.57E-01 1.15 (0.64-2.22)
SNPs reaching genome-wide significance in the GWAS threshold in this study (set 2) rs6599240 3.79E-03 1.51 (1.13-1.97) 2.10E-01 1.53 (0.75-2.84) rs11129801 7.81E-05 1.53 (1.24-1.89) 3.68E-02‡ 1.73 (1.04-2.93) rs10428132 1.97E-06 1.79 (1.4-2.27) 6.68E-03‡ 2.16 (1.21-3.72) rs7428167 2.69E-05 1.6 (1.28-1.99) 8.81E-03‡ 2.03 (1.2-3.48) rs12638572 1.68E-06 1.78 (1.4-2.25) 1.47E-02‡ 2 (1.12-3.43) rs7641844 2.68E-06 1.7 (1.36-2.12) 9.60E-03‡ 2 (1.18-3.39) rs7430439 3.64E-06 1.69 (1.35-2.11) 1.41E-02‡ 1.94 (1.13-3.28) rs6599257 5.81E-07 1.96 (1.49-2.53) 2.51E-02‡ 2.04 (1.05-3.69) rs1268070 1.00E-02 1.49 (1.11-2.04) 4.21E-01 0.79 (0.45-1.47) rs9388451 5.69E-04 1.66 (1.25-2.24) 6.57E-01 1.15 (0.64-2.22)
SNPs previously associated with ECG traits (set 3) † rs17020136 2.72E-03 0.71 (0.57-0.89) 8.11E-01 1.07 (0.63-1.8) rs10865355 6.72E-03 1.44 (1.1-1.86) 7.92E-01 0.91 (0.42-1.77) rs11897119 3.99E-03 0.69 (0.54-0.89) 7.30E-01 1.13 (0.59-2.47) rs11129795 3.95E-15 3.9 (2.85-5.66) 1.06E-03‡ 3.77 (1.94-10.24) rs11708996 3.85E-02 0.49 (0.27-1.08) 9.83E-01 NA (0-Inf) { rs6795970 1.79E-07 1.94 (1.51-2.48) 6.83E-03‡ 2.22 (1.21-3.89) rs6798015 1.54E-07 1.88 (1.48-2.38) 5.98E-03‡ 2.17 (1.22-3.73) rs7784776 8.72E-01 1.02 (0.79-1.31) 4.61E-02‡ 0.45 (0.19-0.92) rs314370 1.92E-08 2.48 (1.85-3.5) 5.68E-02 1.78 (1.05-3.57)
rs7342028 2.82E-02 0.78 (0.62-0.97) 8.42E-01 0.95 (0.56-1.6) rs1896312 1.46E-02 1.32 (1.06-1.66) 9.81E-01 1.01 (0.6-1.71) rs10850409 1.95E-02 0.76 (0.61-0.96) 8.80E-01 0.96 (0.56-1.62)
rs37062 2.95E-01 0.89 (0.71-1.11) 3.30E-02‡ 0.57 (0.33-0.95) rs2074518 2.52E-02 1.34 (1.04-1.74) 3.68E-02‡ 0.57 (0.34-0.98)
SNP, single nucleotide polymorphism *P-value was obtained by using a chi-square test. Red color indicates statistical significance. †Only significant SNPs are listed. For all SNPs, please refer to Table S7. ‡indicates statistical significance (p < 0.05). {Unable to estimate due to extremely imbalanced sample distributions
Dow
nloaded from http://ahajournals.org by alice@
sads.org on June 5, 2020

21
Figure Legends:
Figure 1. The workflow for the imputation approach.
Figure 2. Cumulative effect of the 3 reported major risk alleles (set 1, BrS-PRS14) on
susceptibility to BrS in Taiwanese BrS patients. The x-axis shows the number of risk alleles in
one individual, whereas the y-axis shows the odds ratios of the BrS patients on a log scale. (A)
All BrS patients vs. controls (Ptrend=1.38x10⁻⁹); (B) SCN5A mutation-positive BrS patients vs.
controls (Ptrend=0.049); (C) SCN5A mutation-negative BrS patients vs. controls
(Ptrend=8.54x10⁻⁹)
Figure 3. The distribution of the risk alleles in the Taiwanese BrS patients and healthy controls.
The BrS patients were divided into two groups based on whether they possessed SCN5A
mutations or not. The x-axis shows the number of risk alleles in one individual, whereas the y-
axis shows the percentage of the people with the alleles.
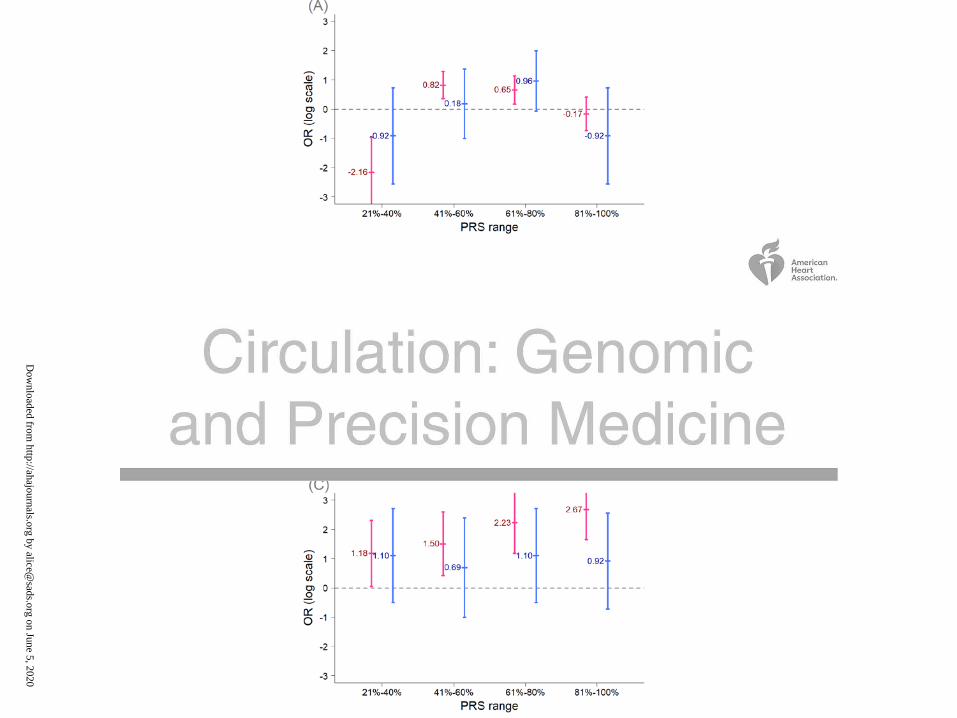
Figure 4. Comparisons of the odds ratios for the PRS models between the Taiwanese BrS
patients with and without SCN5A mutations. The x-axis shows the ranges of PRS scores in the
BrS patients, whereas the y-axis shows the odds ratios on a log scale. (A) The PRS model
developed using the 3 SNPs (set 1, BrS-PRS14); (B) The PRS model was developed using the 8
SNPs from set 2 (rs6599257, rs11129801, rs10428132, rs7428167, rs7641844 and rs7430439 in
chromosome 3, and rs1268070 and rs9388451 in chromosome 6); (C) The PRS model developed
Dow
nloaded from http://ahajournals.org by alice@
sads.org on June 5, 2020
22
using the 75 SNPs (set 3). The BrS patients were divided into two groups based on whether they
had pathogenic SCN5A mutations (blue color) or not (red color).
Dow
nloaded from http://ahajournals.org by alice@
sads.org on June 5, 2020

Dow
nloaded from http://ahajournals.org by alice@
sads.org on June 5, 2020

Dow
nloaded from http://ahajournals.org by alice@
sads.org on June 5, 2020

Dow
nloaded from http://ahajournals.org by alice@
sads.org on June 5, 2020
Dow
nloaded from http://ahajournals.org by alice@
sads.org on June 5, 2020