Embed Size (px)
Citation preview
1
Presented at the 64th Technical and Operating Conference of the Steel Founders’ Society of
America, December 9-11, 2010, Chicago, Illinois.
Richard A. Hardin and Christoph Beckermann
Department of Mechanical and Industrial Engineering
The University of Iowa, Iowa City, IA 52242
Abstract
This paper presents two studies of a new radiography standard. In Part I, a validation study of a
proposed relationship between radiographic testing (RT) acceptance criteria and the mechanical
performance of a casting in tension is performed. In the validation study, the new RT standard is
used to measure and rate radiographic indications in WCB steel tensile test plates. Then the
radiographic testing results are compared to measured tensile properties. The tensile plate
castings all contained porosity and their maximum indication fractions were from 40% to 60%.
This corresponds roughly to RT Level 4 to 5. It is found that the stiffness of the plate castings
ranged from 72% to 95% of sound material, with an average of 88% of sound material. The
yield stress is not reduced on average for the tensile test plates, and ranged from 92% to 109% of
the sound yield stress. The ultimate tensile strength also changed little from the sound material.
Ductility in the test castings was markedly reduced with the percent elongation data ranging from
12.8% to 19.6%; versus 22% elongation measured in the sound material. In Part II, a gage
repeatability and reproducibility study of the revised new radiography standard is performed.
The standard was revised following recommendations resulting from the gage R&R study
presented at last years’ SFSA T&O Conference. In the current gage R&R study, three
radiographs are rated three times each by five evaluators. The largest source of error in the gage
R&R study is the reader-to-reader reproducibility. However, it was reduced by 46% on average
compared to last years gage R&R study. The error due to reader repeatability was reduced by an
average of 30% from the previous study. Compared to the current ASTM RT standards, which
have been shown to have an average confidence interval of ±1.4 levels, the revised new RT
standard gives confidence intervals of ±0.17, ±0.38, and ±0.11 levels for the three radiographs
evaluated in the study.
I. INTRODUCTION
Two years ago, at the SFSA Technical and Operating Conference, a new radiographic inspection
standard for steel castings was first presented [1]. This standard was developed jointly by the
SFSA and the Solidification Laboratory at the University of Iowa. It was designed to provide
both a quantitative measure of the internal soundness of a casting and a method for relating this
to service performance. The need for this new standard originates from the deficiencies of the
current ASTM radiographic testing (RT) standards (ASTM E186, E280, E446). Their main
deficiencies are their subjectivity and their inability to provide any relationship between rating
level and casting performance in service.
In the current ASTM RT standards, the x-ray “reader” makes a subjective decision on the
corresponding type and level of indication severity in the test radiograph by comparing it to
standard radiographs. In this comparison, the reader is told to prorate the area of interest on the
Validation and Gage R&R Studies of a New Radiography Standard for Steel Castings
2
test radiograph to the reference radiograph, and disregard gray level. These are two of the
sources of reader-to-reader variability inherent in the current standards. It was demonstrated in a
gage repeatability and reproducibility (R&R) study that readers have difficulty distinguishing the
rating levels [2]. The average confidence interval from this gage R&R study of 128 radiographs
was ±1.4 levels. Another important source of the variability is the reference radiographs
themselves. Image analysis has shown that there are significant quantitative similarities between
the levels of the ASTM E186 reference radiographs [2].
In the new standard, the severity level for a radiograph is determined from the measurement of
the largest total length of individual indication lengths (lim) on the radiograph along a specified
direction, which is divided by a feature length (Lf) to arrive at the largest fractional length (lim
/Lf). This fractional length is termed the maximum indication fraction F (F = lim /Lf). The
specified direction is termed the “direction of interest” (DOI), and would be specified by the
casting designer. The largest fractional length found is compared with an acceptance criterion, a
maximum allowable fractional length, which is also specified by the designer of the casting. It is
up to the designer to make their own assumptions about the effects of the radiographic
indications on performance in specifying the DOI, the feature length and the maximum allowable
fractional length. By making the assumptions more or less conservative, the designer can use the
standard to ensure that the indications present on the radiographic film will not limit the
component performance to less than the designer’s requirements.
In the “Results Part I” section of the current paper, we present a study validating a relationship
between the RT acceptance criteria and mechanical performance. To accomplish this, 0.75”
thick plate test coupons were machined from 1”T x 5”W x 15”L and 18”L cast WCB plates. The
test coupons were radiographed and rated according to the new revised RT standard, and were
then pulled in tensile tests according to ASTM E8. It will be demonstrated that the assumptions
made for this tensile loading case, relating the effects of porosity on the tensile behavior and the
radiographic rating of test plate coupons, are conservative.
In “Results Part II”, a gage R&R study is presented using the revised version of the new RT
standard. The standard was revised following recommendations made after the gage R&R study
using the standard that was presented at last years’ T&O conference [3]. In order to understand
these revisions and the reasons for them, the standard and results of last years’ gage R&R are
briefly reviewed. Then the results of the current gage R&R study will be compared with the
previous study to demonstrate the degree of improvement observed using the revised standard.
II. PROCEDURES
Revised New Standard Procedure for Radiograph Rating
The procedure used to apply the revised new RT standard is given below, taken from the
standard itself. From section 6 of [4]:
6. Procedure for Evaluation
3
6.1 All relevant indications present within the area of interest on a radiographic film shall be
evaluated. The radiographic density of indications in comparison with the background density
(i.e., the contrast) shall not be taken into account when evaluating indications.
6.2 The length (li) of an indication shall be measured along a straight line that is oriented in the
direction of interest. The straight line shall have a width of 1/4th
in (6.4 mm).
6.3 The total indication length for a single straight line shall be determined by summing the
lengths of all indications along the line.
6.4 The maximum total indication length (lim) shall be determined by finding the largest value of
the total indication length for any duly oriented single straight line within the area of interest.
6.5 The maximum indication fraction (F) shall be calculated by dividing the maximum total
indication length (lim) by the specified feature length (Lf): F = lim /Lf.
In 6.1 above, relevant indications are indications exceeding 1/16th
inch (1.6 mm) in length. Also,
no distinction is made between different types of discontinuities (porosity, holes, shrinkage,
inclusions, etc.). Cracks, defined as an indication on the radiographic film with a length that
exceeds 10 times the width, are unacceptable. The RT evaluation is made on an area of interest
specified in the order, and this area may be just a portion of, or the entire test radiograph.
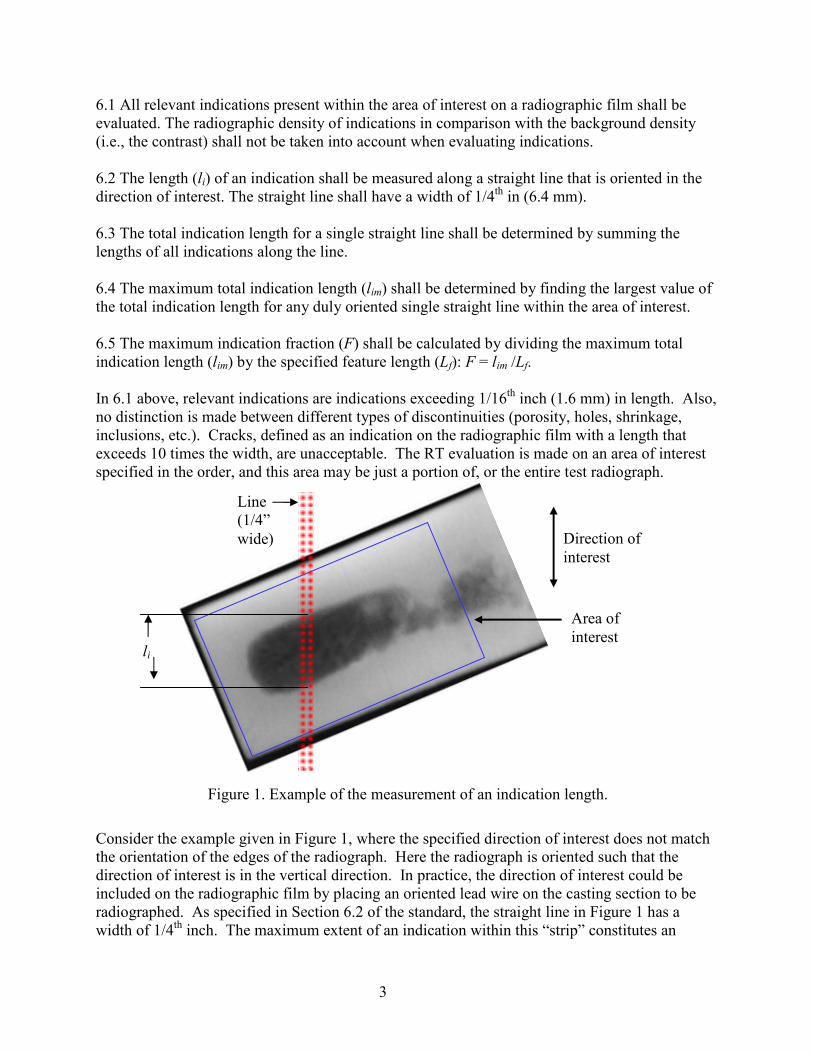
Consider the example given in Figure 1, where the specified direction of interest does not match
the orientation of the edges of the radiograph. Here the radiograph is oriented such that the
direction of interest is in the vertical direction. In practice, the direction of interest could be
included on the radiographic film by placing an oriented lead wire on the casting section to be
radiographed. As specified in Section 6.2 of the standard, the straight line in Figure 1 has a
width of 1/4th
inch. The maximum extent of an indication within this “strip” constitutes an
Figure 1. Example of the measurement of an indication length.
Direction of
interest
Area of
interest
Line
(1/4”
wide)
li
4
indication length, li. In practice, it is recommended to perform the measurement using a
transparent ruler that has a width of 1/4th
inch.
In Figure 1 there is a single indication, and the measured indication length represents the total
indication length for this placement of the straight line. The maximum total indication length,
lim, is obtained by shifting the straight line horizontally, in order to keep it oriented in the
direction of interest, until the maximum value of the indication length, within in the area of
interest, is obtained. The placement of the straight line in Figure 1 corresponds approximately to
this maximum value. If the straight line were shifted to the left or the right, a smaller indication
length would be measured. Note that the direction of interest matters. For example, the
maximum total indication length would be much larger if the direction of interest in Figure 1
were horizontal rather than vertical.
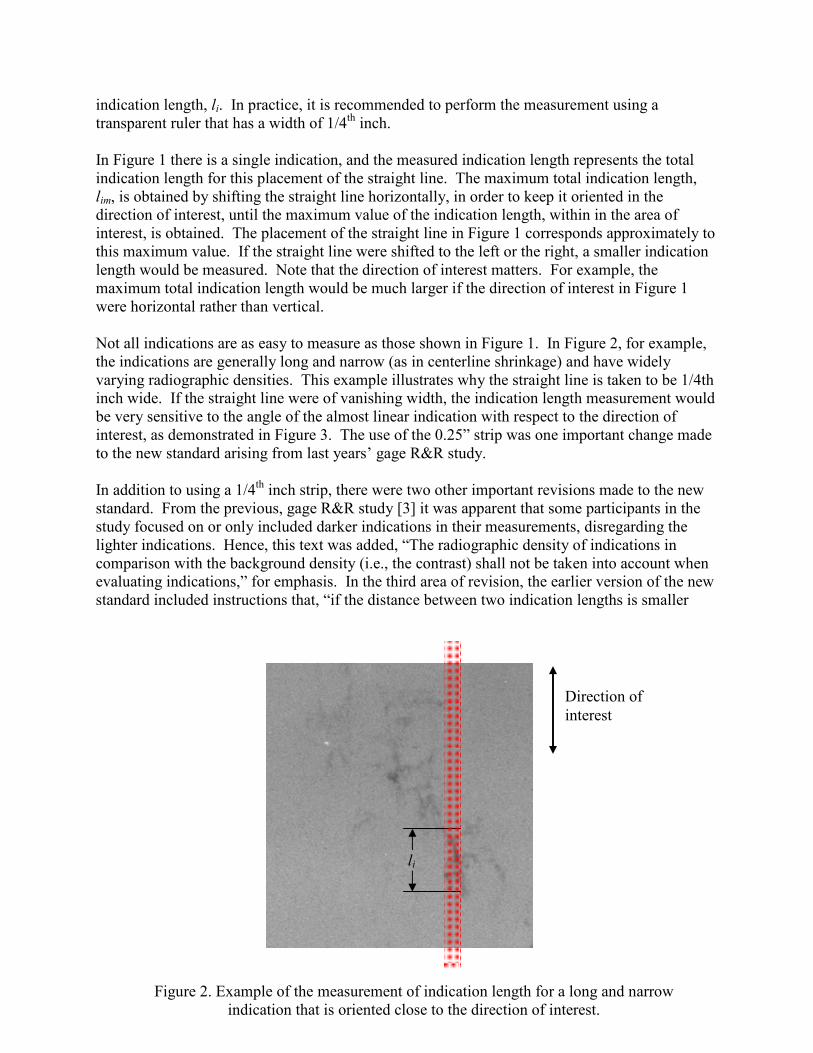
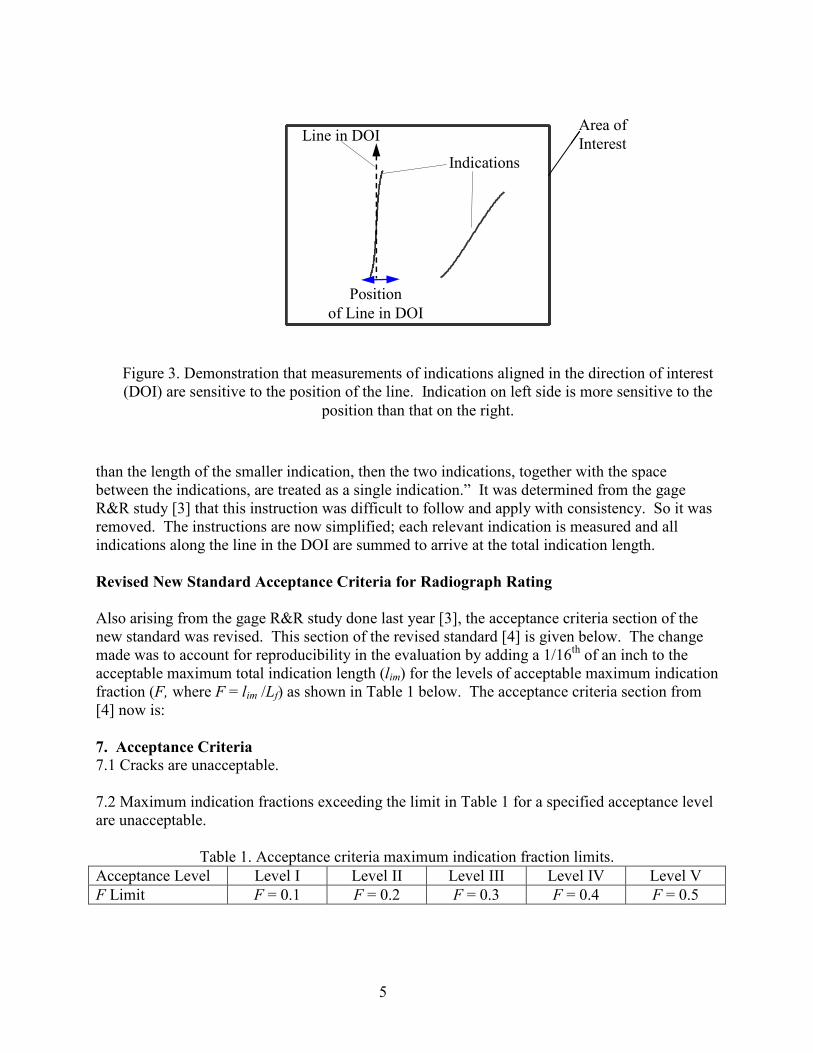
Not all indications are as easy to measure as those shown in Figure 1. In Figure 2, for example,
the indications are generally long and narrow (as in centerline shrinkage) and have widely
varying radiographic densities. This example illustrates why the straight line is taken to be 1/4th
inch wide. If the straight line were of vanishing width, the indication length measurement would
be very sensitive to the angle of the almost linear indication with respect to the direction of
interest, as demonstrated in Figure 3. The use of the 0.25” strip was one important change made
to the new standard arising from last years’ gage R&R study.
In addition to using a 1/4th
inch strip, there were two other important revisions made to the new
standard. From the previous, gage R&R study [3] it was apparent that some participants in the
study focused on or only included darker indications in their measurements, disregarding the
lighter indications. Hence, this text was added, “The radiographic density of indications in
comparison with the background density (i.e., the contrast) shall not be taken into account when
evaluating indications,” for emphasis. In the third area of revision, the earlier version of the new
standard included instructions that, “if the distance between two indication lengths is smaller
Figure 2. Example of the measurement of indication length for a long and narrow
indication that is oriented close to the direction of interest.
li
Direction of
interest
5
than the length of the smaller indication, then the two indications, together with the space
between the indications, are treated as a single indication.” It was determined from the gage
R&R study [3] that this instruction was difficult to follow and apply with consistency. So it was
removed. The instructions are now simplified; each relevant indication is measured and all
indications along the line in the DOI are summed to arrive at the total indication length.
Revised New Standard Acceptance Criteria for Radiograph Rating
Also arising from the gage R&R study done last year [3], the acceptance criteria section of the
new standard was revised. This section of the revised standard [4] is given below. The change
made was to account for reproducibility in the evaluation by adding a 1/16th
of an inch to the
acceptable maximum total indication length (lim) for the levels of acceptable maximum indication
fraction (F, where F = lim /Lf) as shown in Table 1 below. The acceptance criteria section from
[4] now is:
7. Acceptance Criteria
7.1 Cracks are unacceptable.
7.2 Maximum indication fractions exceeding the limit in Table 1 for a specified acceptance level
are unacceptable.
Table 1. Acceptance criteria maximum indication fraction limits.
Acceptance Level Level I Level II Level III Level IV Level V
F Limit F = 0.1 F = 0.2 F = 0.3 F = 0.4 F = 0.5
Area of
Interest
Figure 3. Demonstration that measurements of indications aligned in the direction of interest
(DOI) are sensitive to the position of the line. Indication on left side is more sensitive to the
position than that on the right.
Position
of Line in DOI
Line in DOI
Indications
Position
of Line in DOI
Line in DOI
Indications
6
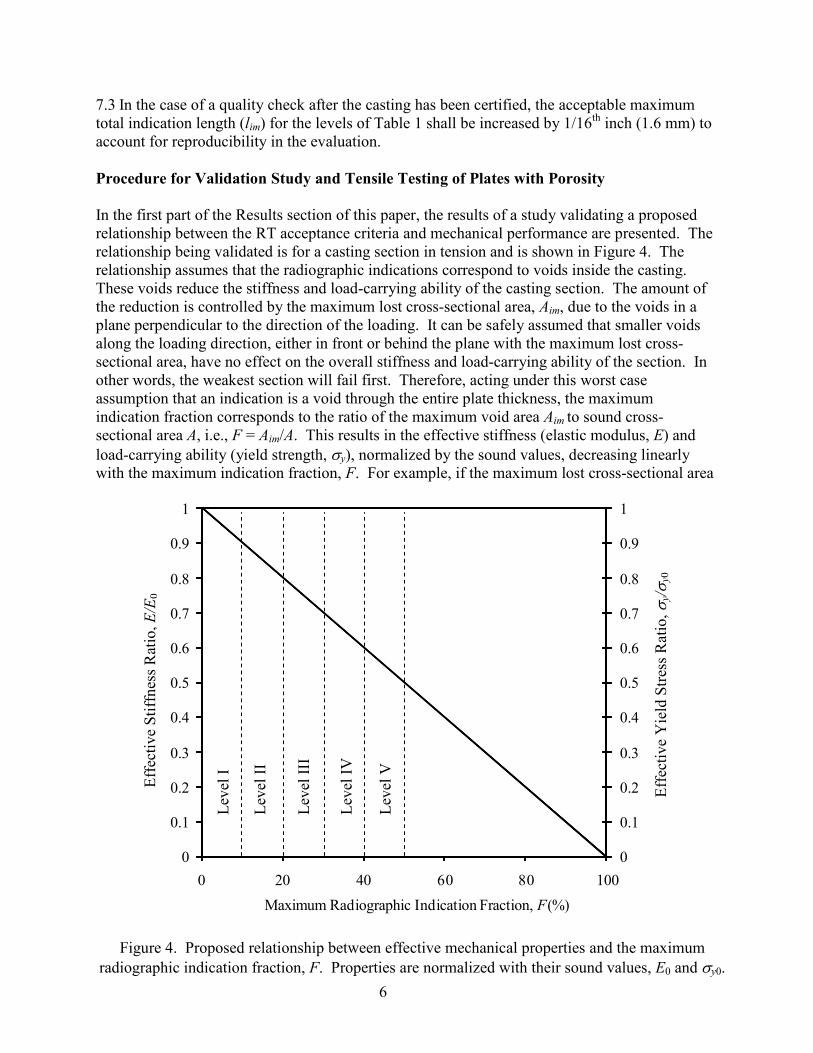
Figure 4. Proposed relationship between effective mechanical properties and the maximum
radiographic indication fraction, F. Properties are normalized with their sound values, E0 and σy0.
0
0.1
0.2
0.3
0.4
0.5
0.6
0.7
0.8
0.9
1
0
0.1
0.2
0.3
0.4
0.5
0.6
0.7
0.8
0.9
1
0 20 40 60 80 100
Effective Yield Stress Ratio (�y/�y0)
Effective Stiffness Ratio (E/E0)
Maximum Radiographic Indication Fraction, F(%)
Eff
ecti
ve
Sti
ffn
ess
Rat
io, E
/E0
Eff
ecti
ve
Yie
ld S
tres
s R
atio
, σ
y/σ
y0
Lev
el I
Lev
el I
I
Lev
el I
II
Lev
el I
V
Lev
el V
7.3 In the case of a quality check after the casting has been certified, the acceptable maximum
total indication length (lim) for the levels of Table 1 shall be increased by 1/16th
inch (1.6 mm) to
account for reproducibility in the evaluation.
Procedure for Validation Study and Tensile Testing of Plates with Porosity
In the first part of the Results section of this paper, the results of a study validating a proposed
relationship between the RT acceptance criteria and mechanical performance are presented. The
relationship being validated is for a casting section in tension and is shown in Figure 4. The
relationship assumes that the radiographic indications correspond to voids inside the casting.
These voids reduce the stiffness and load-carrying ability of the casting section. The amount of
the reduction is controlled by the maximum lost cross-sectional area, Aim, due to the voids in a
plane perpendicular to the direction of the loading. It can be safely assumed that smaller voids
along the loading direction, either in front or behind the plane with the maximum lost cross-
sectional area, have no effect on the overall stiffness and load-carrying ability of the section. In
other words, the weakest section will fail first. Therefore, acting under this worst case
assumption that an indication is a void through the entire plate thickness, the maximum
indication fraction corresponds to the ratio of the maximum void area Aim to sound cross-
sectional area A, i.e., F = Aim/A. This results in the effective stiffness (elastic modulus, E) and
load-carrying ability (yield strength, σy), normalized by the sound values, decreasing linearly
with the maximum indication fraction, F. For example, if the maximum lost cross-sectional area
7
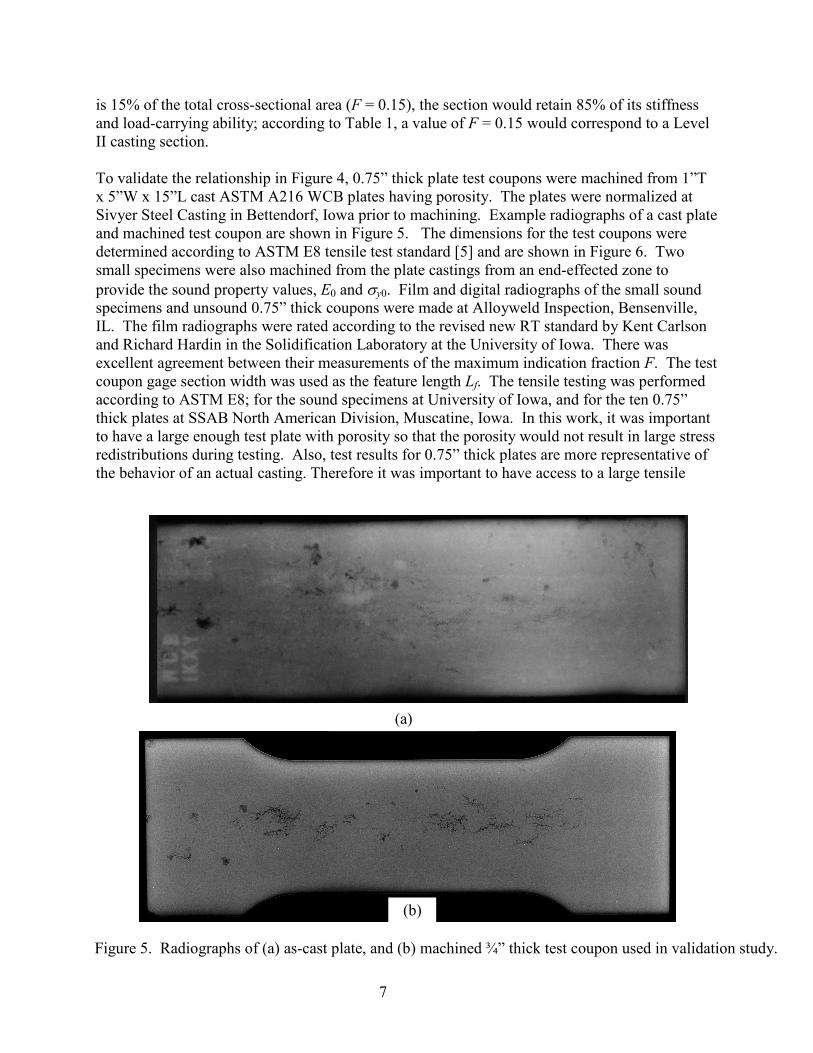
Figure 5. Radiographs of (a) as-cast plate, and (b) machined ¾” thick test coupon used in validation study.
is 15% of the total cross-sectional area (F = 0.15), the section would retain 85% of its stiffness
and load-carrying ability; according to Table 1, a value of F = 0.15 would correspond to a Level
II casting section.
To validate the relationship in Figure 4, 0.75” thick plate test coupons were machined from 1”T
x 5”W x 15”L cast ASTM A216 WCB plates having porosity. The plates were normalized at
Sivyer Steel Casting in Bettendorf, Iowa prior to machining. Example radiographs of a cast plate
and machined test coupon are shown in Figure 5. The dimensions for the test coupons were
determined according to ASTM E8 tensile test standard [5] and are shown in Figure 6. Two
small specimens were also machined from the plate castings from an end-effected zone to
provide the sound property values, E0 and σy0. Film and digital radiographs of the small sound
specimens and unsound 0.75” thick coupons were made at Alloyweld Inspection, Bensenville,
IL. The film radiographs were rated according to the revised new RT standard by Kent Carlson
and Richard Hardin in the Solidification Laboratory at the University of Iowa. There was
excellent agreement between their measurements of the maximum indication fraction F. The test
coupon gage section width was used as the feature length Lf. The tensile testing was performed
according to ASTM E8; for the sound specimens at University of Iowa, and for the ten 0.75”
thick plates at SSAB North American Division, Muscatine, Iowa. In this work, it was important
to have a large enough test plate with porosity so that the porosity would not result in large stress
redistributions during testing. Also, test results for 0.75” thick plates are more representative of
the behavior of an actual casting. Therefore it was important to have access to a large tensile
(a)
(b)
8
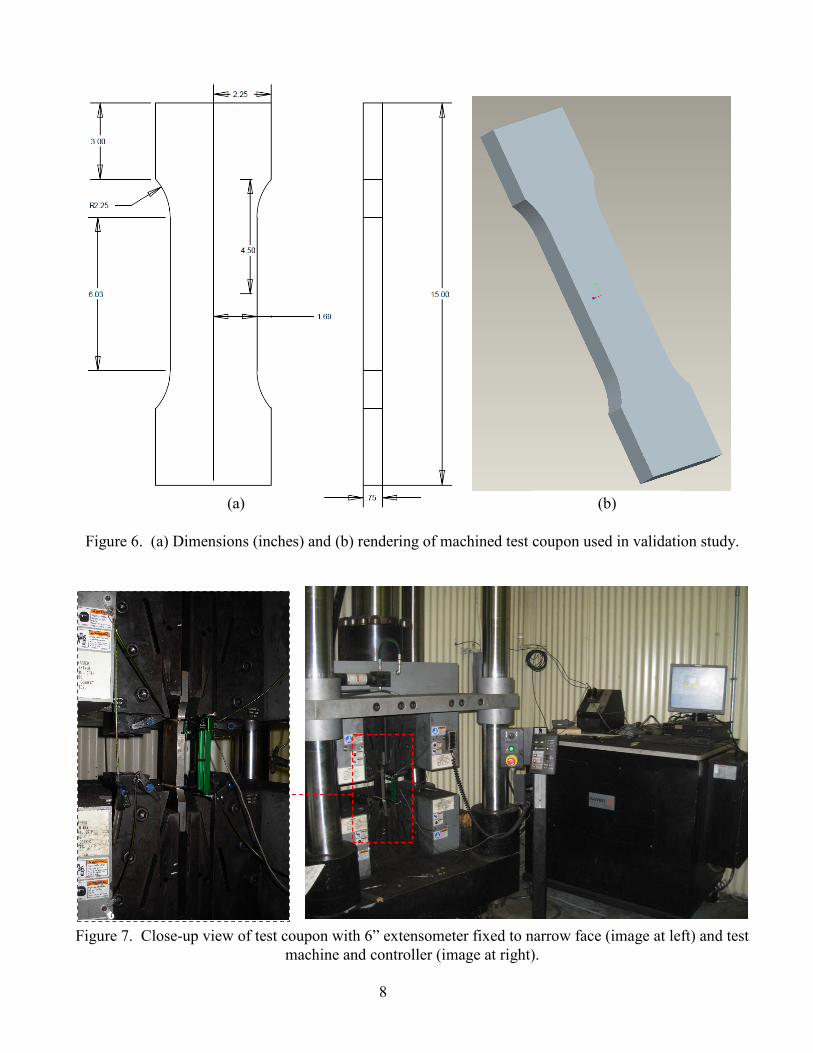
Figure 6. (a) Dimensions (inches) and (b) rendering of machined test coupon used in validation study.
(b) (a)
Figure 7. Close-up view of test coupon with 6” extensometer fixed to narrow face (image at left) and test
machine and controller (image at right).
9
testing machine. As shown in Figure 7, an Instron 3500KN (800,000 lb) Tensile Test machine
with Instron 5500 Control Unit controlled by Instron Partner Software was used at SSAB to
perform the tests. Note in Figure 7 that the 6” extensometer had to be mounted on the narrow
face (thickness edge) of the test coupons because of the configuration of the machine and grips.
Procedure for Gage R&R Study of Revised Radiographic Standard
The purpose of the gage R&R was to measure the variability in the measurements and ratings
resulting from applying the revised standard. In the current study errors due to reproducibility
and repeatability errors are calculated [6]. In addition, analysis of variance (ANOVA) is used to
test whether the proportion of the “between readers” variation to “within all readers” variation is
statistically significant [7]. The method of data reduction used in this study are identical to that
given in detail in the 2009 study [3], and will not be repeated here. Please refer to the earlier
gage R&R study for those details.
Factors affecting variability in applying the new standard are:
• Measurement device (ruler) used: 1/16th inch resolution, does it obscure the indications
and is it kept aligned with the DOI?
• Reader-to-reader variability or “operator error”: a reader’s (or evaluator’s) ability to
make accurate measurements, read, understand and follow the standard.
• How measurements are made: alignment of measurement device, lighting of the
radiographs and room used, fixture used for radiographs and measurement devices, how
the data is recorded.
• Radiographs themselves: some are easier to read than others, rating can be sensitive to
the alignment of the indications relative to the DOI, also it can be difficult to disregard
the relative grey levels of the indications.
The goal here is to establish the overall repeatability and reproducibility errors resulting from
typical applications of the revised standard and compare them with the results from the 2009
study [3]. In this study, five members of the Solidification Laboratory at the University of Iowa
evaluated three radiographs according to the new standard. Each radiograph was evaluated three
times measuring maximum indication lengths and recording their positions. In this study the
radiograph width direction was used as the direction of interest and the width dimension was
used as the feature length Lf.
III. RESULTS
Results Part I: Validation Study of a Proposed Relationship between RT Acceptance
Criteria and Mechanical Performance
The radiographs of each plate tested in the validation study, and photographs of the plate taken
after tensile testing are shown in Figures 8 through 17. The ten plates are identified by a letter
10
Location of maximum F
Location of fracturePlate after testing
Location of maximum F
Location of fracturePlate after testing
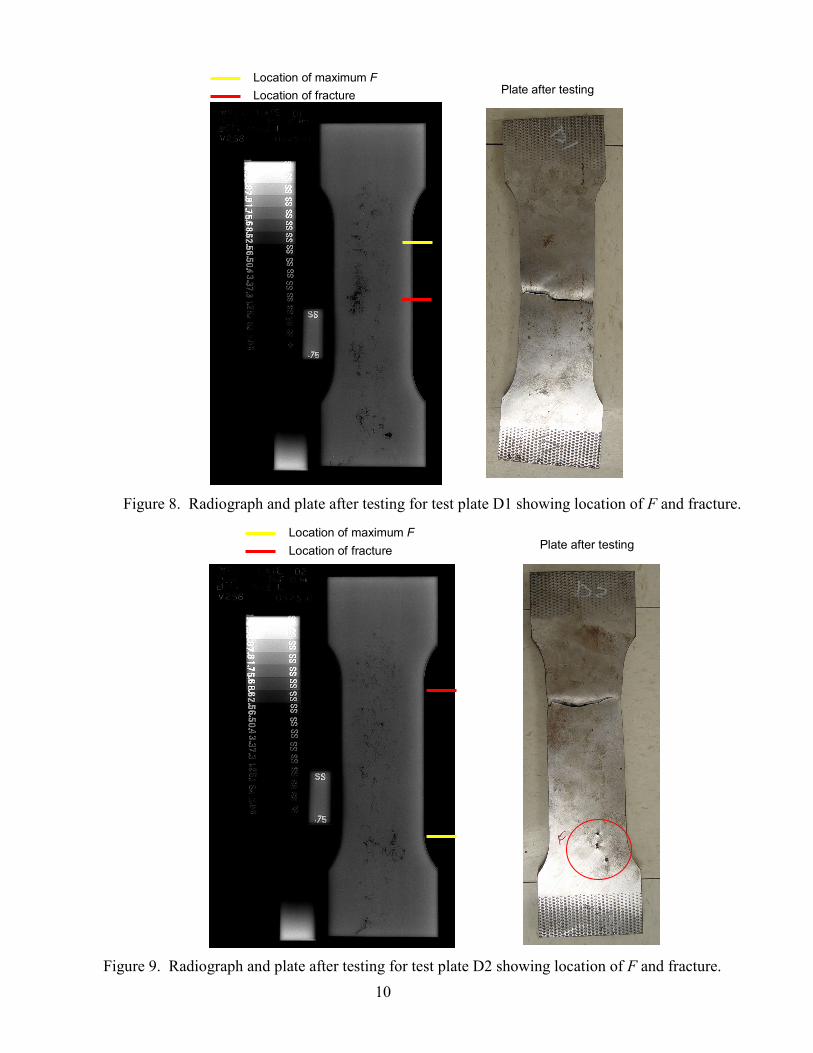
Figure 8. Radiograph and plate after testing for test plate D1 showing location of F and fracture.
Figure 9. Radiograph and plate after testing for test plate D2 showing location of F and fracture.
11
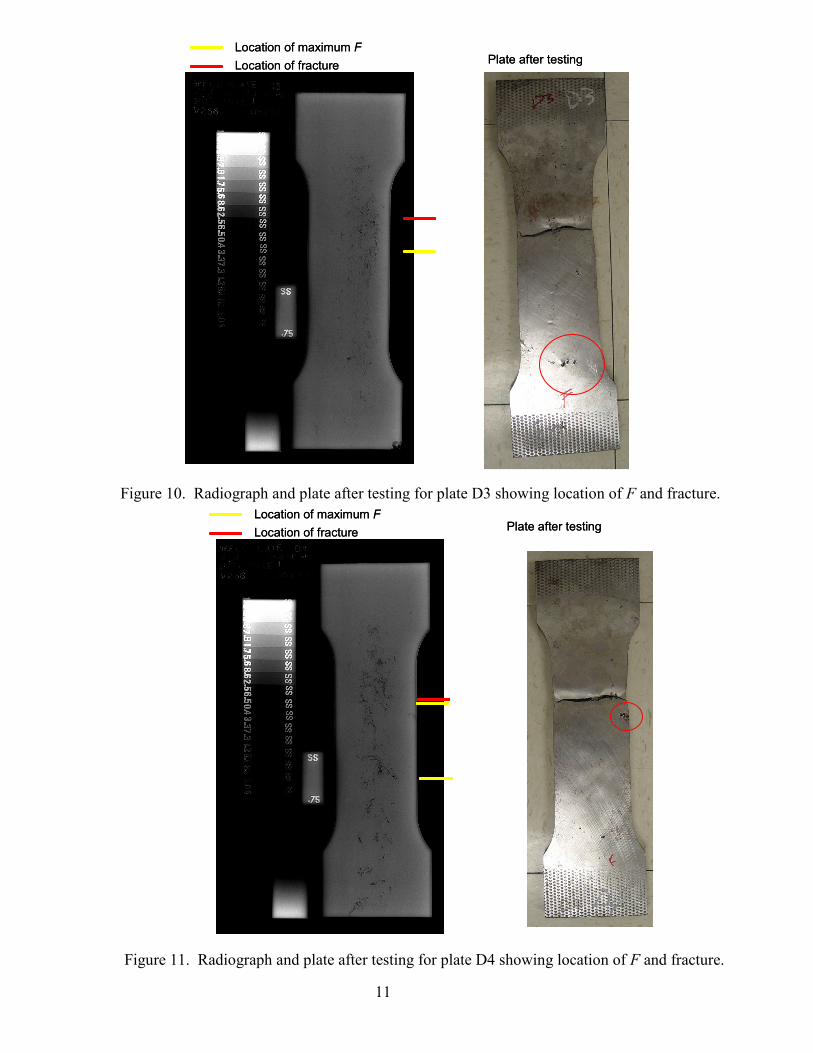
Figure 10. Radiograph and plate after testing for plate D3 showing location of F and fracture.
Figure 11. Radiograph and plate after testing for plate D4 showing location of F and fracture.
Location of maximum F
Location of fracturePlate after testing
Location of maximum F
Location of fracturePlate after testing
Location of maximum F
Location of fracturePlate after testing
Location of maximum F
Location of fracturePlate after testing
12
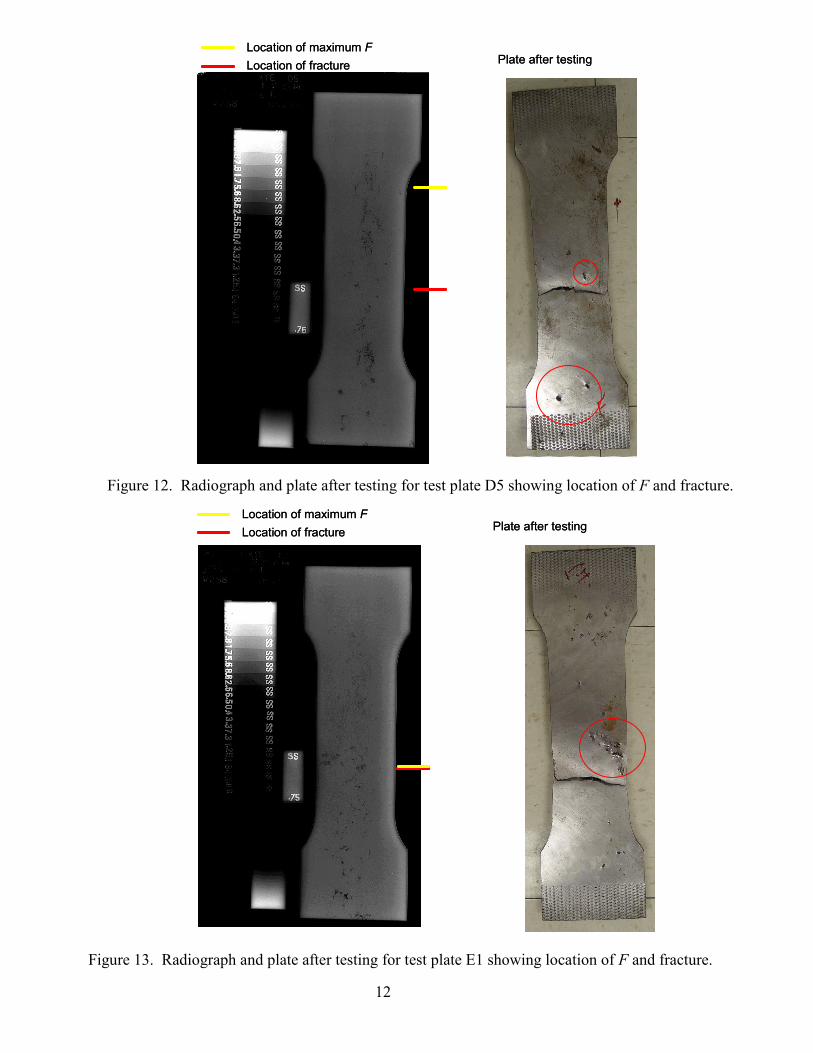
Figure 12. Radiograph and plate after testing for test plate D5 showing location of F and fracture.
Figure 13. Radiograph and plate after testing for test plate E1 showing location of F and fracture.
Location of maximum F
Location of fracturePlate after testing
Location of maximum F
Location of fracturePlate after testing
Location of maximum F
Location of fracturePlate after testing
Location of maximum F
Location of fracturePlate after testing
13
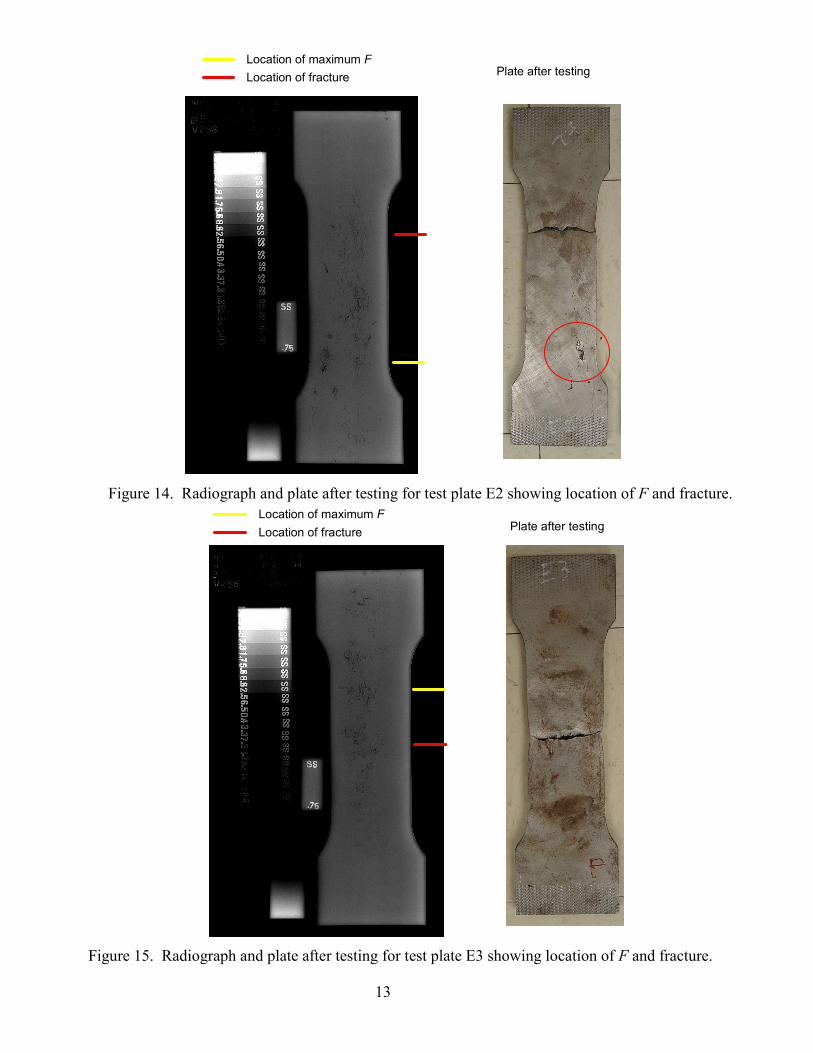
Figure 14. Radiograph and plate after testing for test plate E2 showing location of F and fracture.
Figure 15. Radiograph and plate after testing for test plate E3 showing location of F and fracture.
Location of maximum F
Location of fracturePlate after testing
Location of maximum F
Location of fracturePlate after testing
14
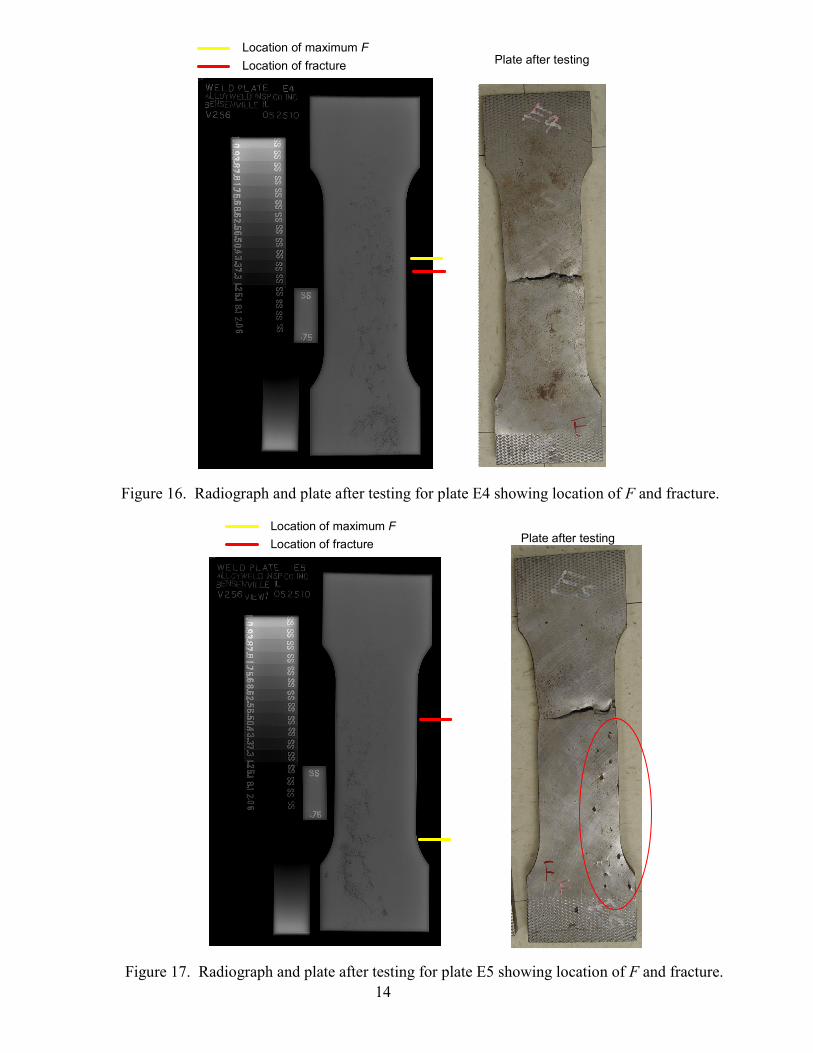
Figure 16. Radiograph and plate after testing for plate E4 showing location of F and fracture.
Figure 17. Radiograph and plate after testing for plate E5 showing location of F and fracture.
Location of maximum F
Location of fracturePlate after testing
Location of maximum F
Location of fracturePlate after testing
15
0
10
20
30
40
50
60
70
D1 D2 D3 D4 D5 E1 E2 E3 E4 E5
Plate ID
Maximum Indication Fraction (%)
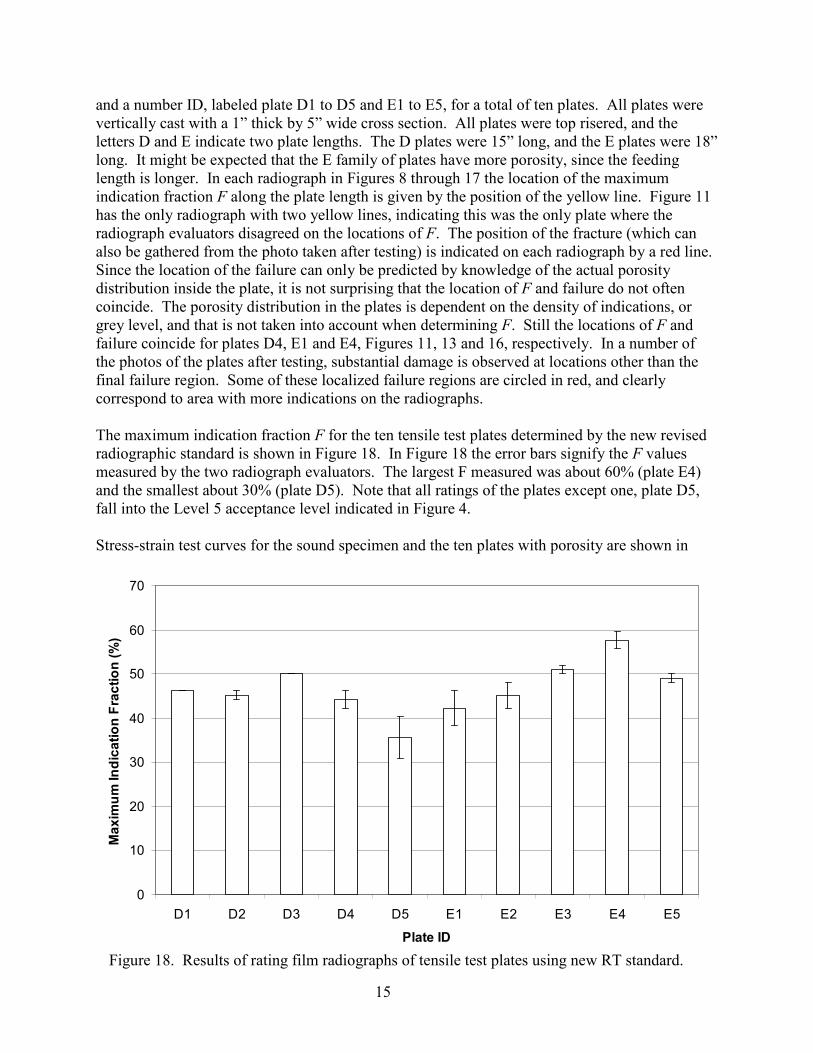
Figure 18. Results of rating film radiographs of tensile test plates using new RT standard.
and a number ID, labeled plate D1 to D5 and E1 to E5, for a total of ten plates. All plates were
vertically cast with a 1” thick by 5” wide cross section. All plates were top risered, and the
letters D and E indicate two plate lengths. The D plates were 15” long, and the E plates were 18”
long. It might be expected that the E family of plates have more porosity, since the feeding
length is longer. In each radiograph in Figures 8 through 17 the location of the maximum
indication fraction F along the plate length is given by the position of the yellow line. Figure 11
has the only radiograph with two yellow lines, indicating this was the only plate where the
radiograph evaluators disagreed on the locations of F. The position of the fracture (which can
also be gathered from the photo taken after testing) is indicated on each radiograph by a red line.
Since the location of the failure can only be predicted by knowledge of the actual porosity
distribution inside the plate, it is not surprising that the location of F and failure do not often
coincide. The porosity distribution in the plates is dependent on the density of indications, or
grey level, and that is not taken into account when determining F. Still the locations of F and
failure coincide for plates D4, E1 and E4, Figures 11, 13 and 16, respectively. In a number of
the photos of the plates after testing, substantial damage is observed at locations other than the
final failure region. Some of these localized failure regions are circled in red, and clearly
correspond to area with more indications on the radiographs.
The maximum indication fraction F for the ten tensile test plates determined by the new revised
radiographic standard is shown in Figure 18. In Figure 18 the error bars signify the F values
measured by the two radiograph evaluators. The largest F measured was about 60% (plate E4)
and the smallest about 30% (plate D5). Note that all ratings of the plates except one, plate D5,
fall into the Level 5 acceptance level indicated in Figure 4.
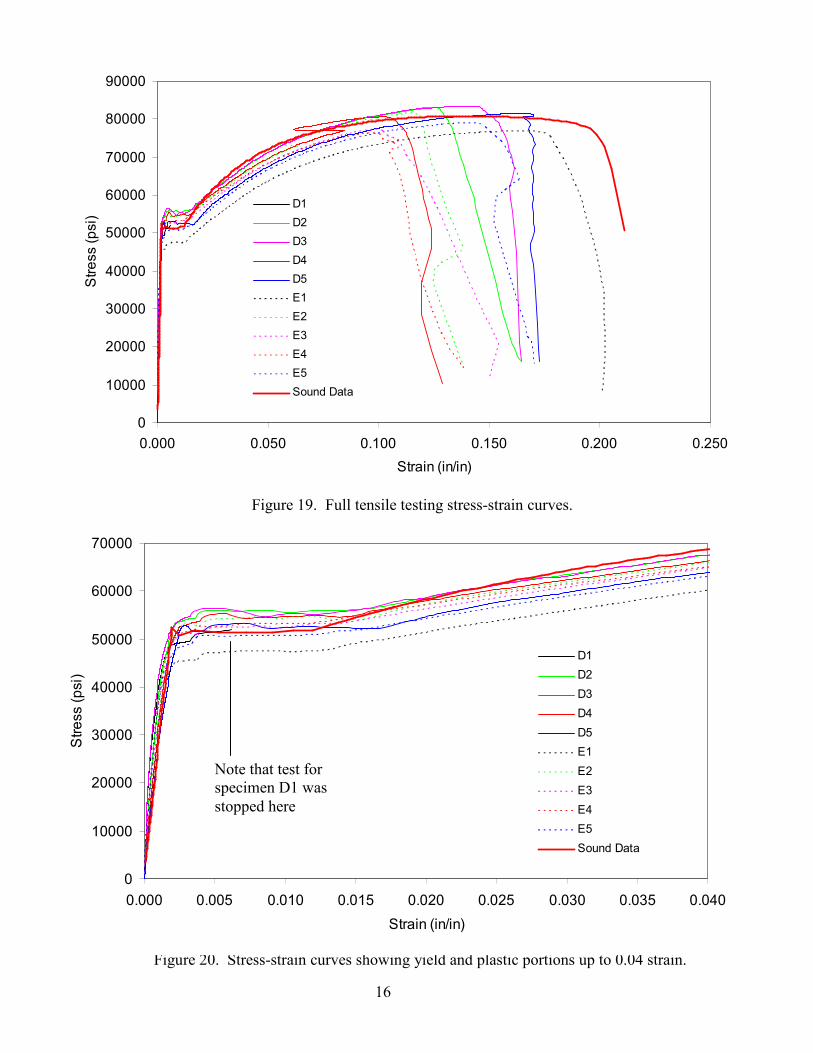
Stress-strain test curves for the sound specimen and the ten plates with porosity are shown in
16
Figure 19. Full tensile testing stress-strain curves.
0
10000
20000
30000
40000
50000
60000
70000
80000
90000
0.000 0.050 0.100 0.150 0.200 0.250
Strain (in/in)
Stress (psi)
D1
D2
D3
D4
D5
E1
E2
E3
E4
E5
Sound Data
Figure 20. Stress-strain curves showing yield and plastic portions up to 0.04 strain.
.
0
10000
20000
30000
40000
50000
60000
70000
0.000 0.005 0.010 0.015 0.020 0.025 0.030 0.035 0.040
Strain (in/in)
Stress (psi)
D1
D2
D3
D4
D5
E1
E2
E3
E4
E5
Sound Data
Note that test for
specimen D1 was
stopped here
17
0
10000
20000
30000
40000
50000
60000
0.000 0.001 0.002 0.003 0.004 0.005
Strain (in/in)
Stress (psi)
D1
D2
D3
D4
D5
E1
E2
E3
E4
E5
Sound Data
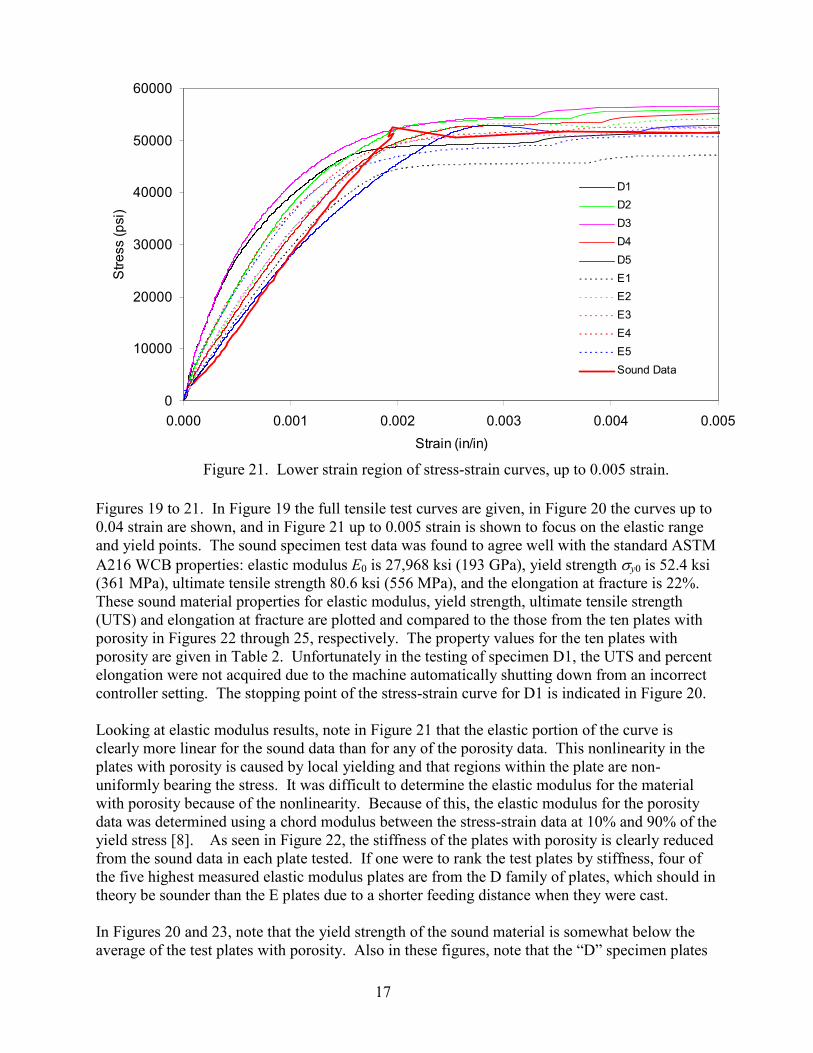
Figure 21. Lower strain region of stress-strain curves, up to 0.005 strain.
Figures 19 to 21. In Figure 19 the full tensile test curves are given, in Figure 20 the curves up to
0.04 strain are shown, and in Figure 21 up to 0.005 strain is shown to focus on the elastic range
and yield points. The sound specimen test data was found to agree well with the standard ASTM
A216 WCB properties: elastic modulus E0 is 27,968 ksi (193 GPa), yield strength σy0 is 52.4 ksi
(361 MPa), ultimate tensile strength 80.6 ksi (556 MPa), and the elongation at fracture is 22%.
These sound material properties for elastic modulus, yield strength, ultimate tensile strength
(UTS) and elongation at fracture are plotted and compared to the those from the ten plates with
porosity in Figures 22 through 25, respectively. The property values for the ten plates with
porosity are given in Table 2. Unfortunately in the testing of specimen D1, the UTS and percent
elongation were not acquired due to the machine automatically shutting down from an incorrect
controller setting. The stopping point of the stress-strain curve for D1 is indicated in Figure 20.
Looking at elastic modulus results, note in Figure 21 that the elastic portion of the curve is
clearly more linear for the sound data than for any of the porosity data. This nonlinearity in the
plates with porosity is caused by local yielding and that regions within the plate are non-
uniformly bearing the stress. It was difficult to determine the elastic modulus for the material
with porosity because of the nonlinearity. Because of this, the elastic modulus for the porosity
data was determined using a chord modulus between the stress-strain data at 10% and 90% of the
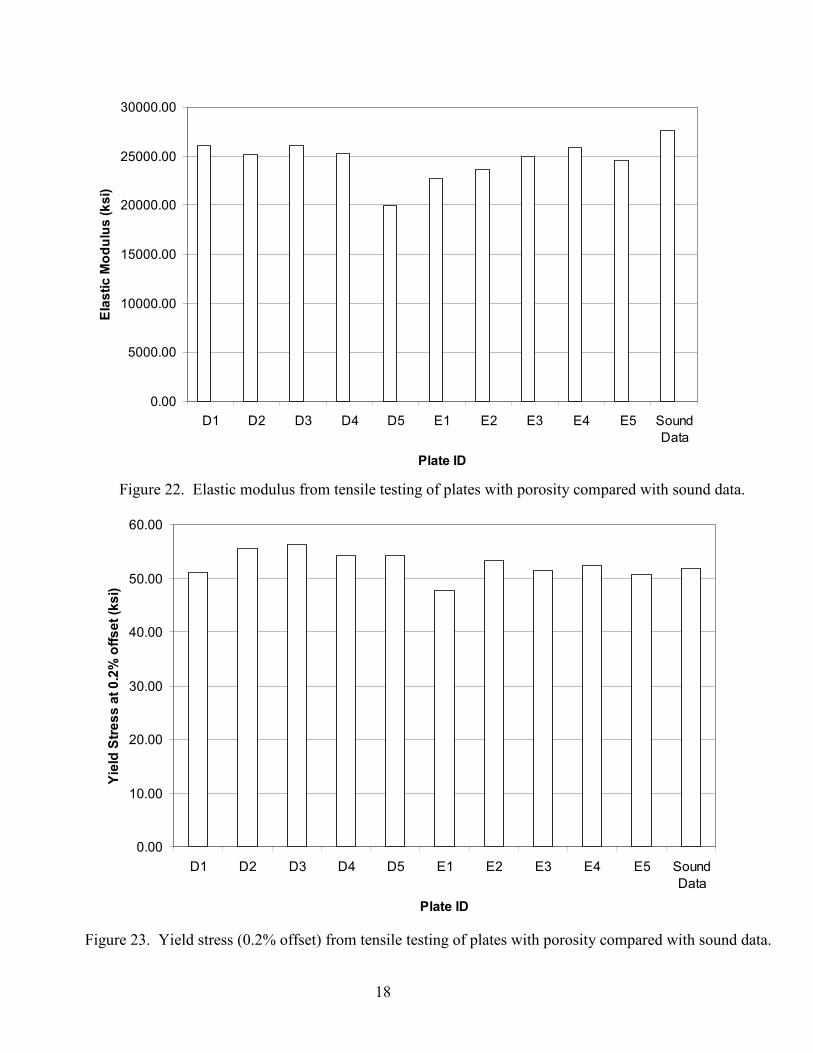
yield stress [8]. As seen in Figure 22, the stiffness of the plates with porosity is clearly reduced
from the sound data in each plate tested. If one were to rank the test plates by stiffness, four of
the five highest measured elastic modulus plates are from the D family of plates, which should in
theory be sounder than the E plates due to a shorter feeding distance when they were cast.
In Figures 20 and 23, note that the yield strength of the sound material is somewhat below the
average of the test plates with porosity. Also in these figures, note that the “D” specimen plates
18
Figure 23. Yield stress (0.2% offset) from tensile testing of plates with porosity compared with sound data.
0.00
5000.00
10000.00
15000.00
20000.00
25000.00
30000.00
D1 D2 D3 D4 D5 E1 E2 E3 E4 E5 Sound
Data
Plate ID
Elastic Modulus (ksi)
Figure 22. Elastic modulus from tensile testing of plates with porosity compared with sound data.
0.00
10.00
20.00
30.00
40.00
50.00
60.00
D1 D2 D3 D4 D5 E1 E2 E3 E4 E5 Sound
Data
Plate ID
Yield Stress at 0.2% offset (ksi)
19
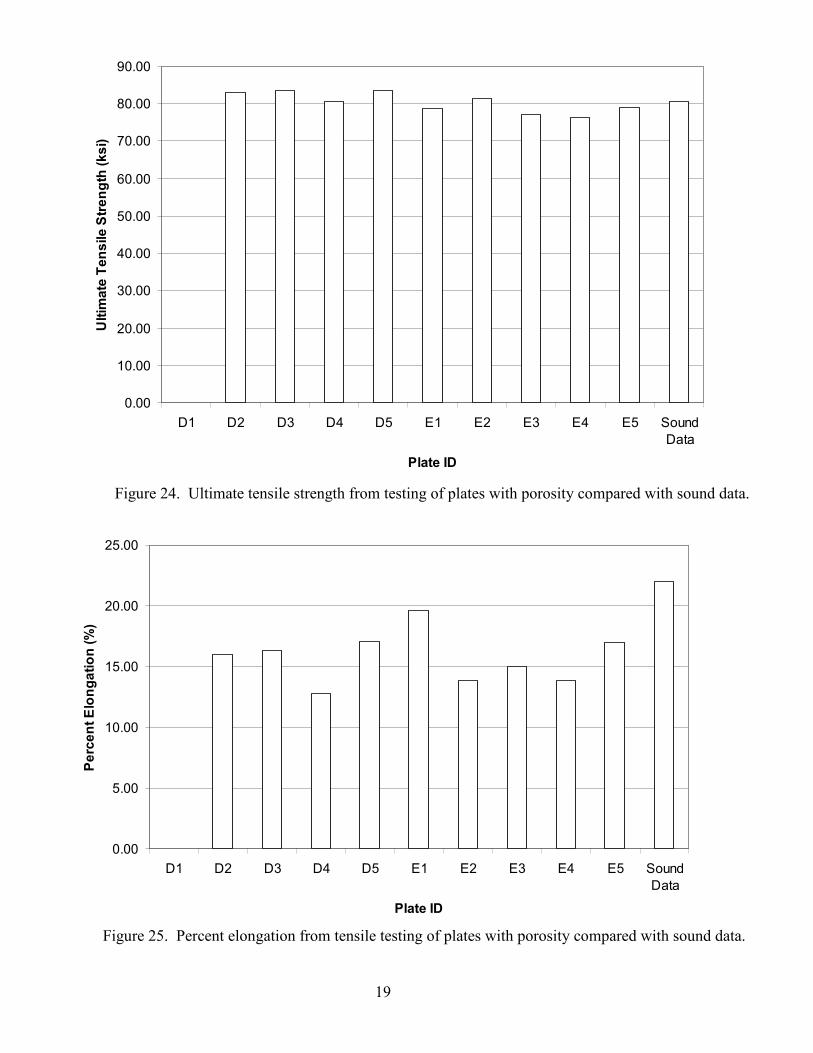
Figure 25. Percent elongation from tensile testing of plates with porosity compared with sound data.
Figure 24. Ultimate tensile strength from testing of plates with porosity compared with sound data.
0.00
5.00
10.00
15.00
20.00
25.00
D1 D2 D3 D4 D5 E1 E2 E3 E4 E5 Sound
Data
Plate ID
Percent Elongation (%)
0.00
10.00
20.00
30.00
40.00
50.00
60.00
70.00
80.00
90.00
D1 D2 D3 D4 D5 E1 E2 E3 E4 E5 Sound
Data
Plate ID
Ultimate Tensile Strength (ksi)
20
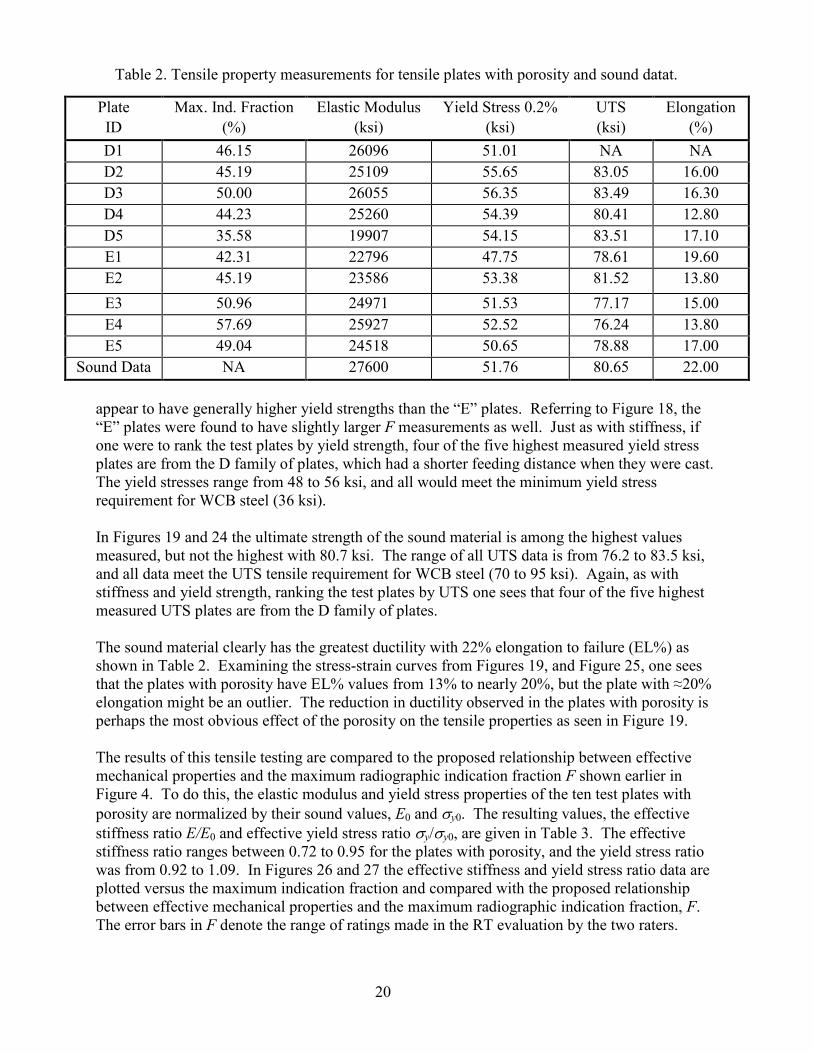
Table 2. Tensile property measurements for tensile plates with porosity and sound datat.
appear to have generally higher yield strengths than the “E” plates. Referring to Figure 18, the
“E” plates were found to have slightly larger F measurements as well. Just as with stiffness, if
one were to rank the test plates by yield strength, four of the five highest measured yield stress
plates are from the D family of plates, which had a shorter feeding distance when they were cast.
The yield stresses range from 48 to 56 ksi, and all would meet the minimum yield stress
requirement for WCB steel (36 ksi).
In Figures 19 and 24 the ultimate strength of the sound material is among the highest values
measured, but not the highest with 80.7 ksi. The range of all UTS data is from 76.2 to 83.5 ksi,
and all data meet the UTS tensile requirement for WCB steel (70 to 95 ksi). Again, as with
stiffness and yield strength, ranking the test plates by UTS one sees that four of the five highest
measured UTS plates are from the D family of plates.
The sound material clearly has the greatest ductility with 22% elongation to failure (EL%) as
shown in Table 2. Examining the stress-strain curves from Figures 19, and Figure 25, one sees
that the plates with porosity have EL% values from 13% to nearly 20%, but the plate with ≈20%
elongation might be an outlier. The reduction in ductility observed in the plates with porosity is
perhaps the most obvious effect of the porosity on the tensile properties as seen in Figure 19.
The results of this tensile testing are compared to the proposed relationship between effective
mechanical properties and the maximum radiographic indication fraction F shown earlier in
Figure 4. To do this, the elastic modulus and yield stress properties of the ten test plates with
porosity are normalized by their sound values, E0 and σy0. The resulting values, the effective
stiffness ratio E/E0 and effective yield stress ratio σy/σy0, are given in Table 3. The effective
stiffness ratio ranges between 0.72 to 0.95 for the plates with porosity, and the yield stress ratio
was from 0.92 to 1.09. In Figures 26 and 27 the effective stiffness and yield stress ratio data are
plotted versus the maximum indication fraction and compared with the proposed relationship
between effective mechanical properties and the maximum radiographic indication fraction, F.
The error bars in F denote the range of ratings made in the RT evaluation by the two raters.
Plate Max. Ind. Fraction Elastic Modulus Yield Stress 0.2% UTS Elongation
ID (%) (ksi) (ksi) (ksi) (%)
D1 46.15 26096 51.01 NA NA
D2 45.19 25109 55.65 83.05 16.00
D3 50.00 26055 56.35 83.49 16.30
D4 44.23 25260 54.39 80.41 12.80
D5 35.58 19907 54.15 83.51 17.10
E1 42.31 22796 47.75 78.61 19.60
E2 45.19 23586 53.38 81.52 13.80
E3 50.96 24971 51.53 77.17 15.00
E4 57.69 25927 52.52 76.24 13.80
E5 49.04 24518 50.65 78.88 17.00
Sound Data NA 27600 51.76 80.65 22.00
21
0.00
0.10
0.20
0.30
0.40
0.50
0.60
0.70
0.80
0.90
1.00
1.10
0 10 20 30 40 50 60 70 80 90 100
Maximum Indication Fraction, f(%)
Eff
ecti
ve
Sti
ffn
ess
Rat
io,
E/E
0
Maximum Indication Fraction, F(%)
Eff
ecti
ve
Sti
ffn
ess
Rat
io,
E/E
0
Lev
el I
Lev
el I
I
Lev
el I
II
Lev
el I
V
Lev
el V
0.00
0.10
0.20
0.30
0.40
0.50
0.60
0.70
0.80
0.90
1.00
1.10
0 10 20 30 40 50 60 70 80 90 100
Maximum Indication Fraction, f(%)
Eff
ecti
ve
Sti
ffn
ess
Rat
io,
E/E
0
Maximum Indication Fraction, F(%)
Eff
ecti
ve
Sti
ffn
ess
Rat
io,
E/E
0
Lev
el I
Lev
el I
I
Lev
el I
II
Lev
el I
V
Lev
el V
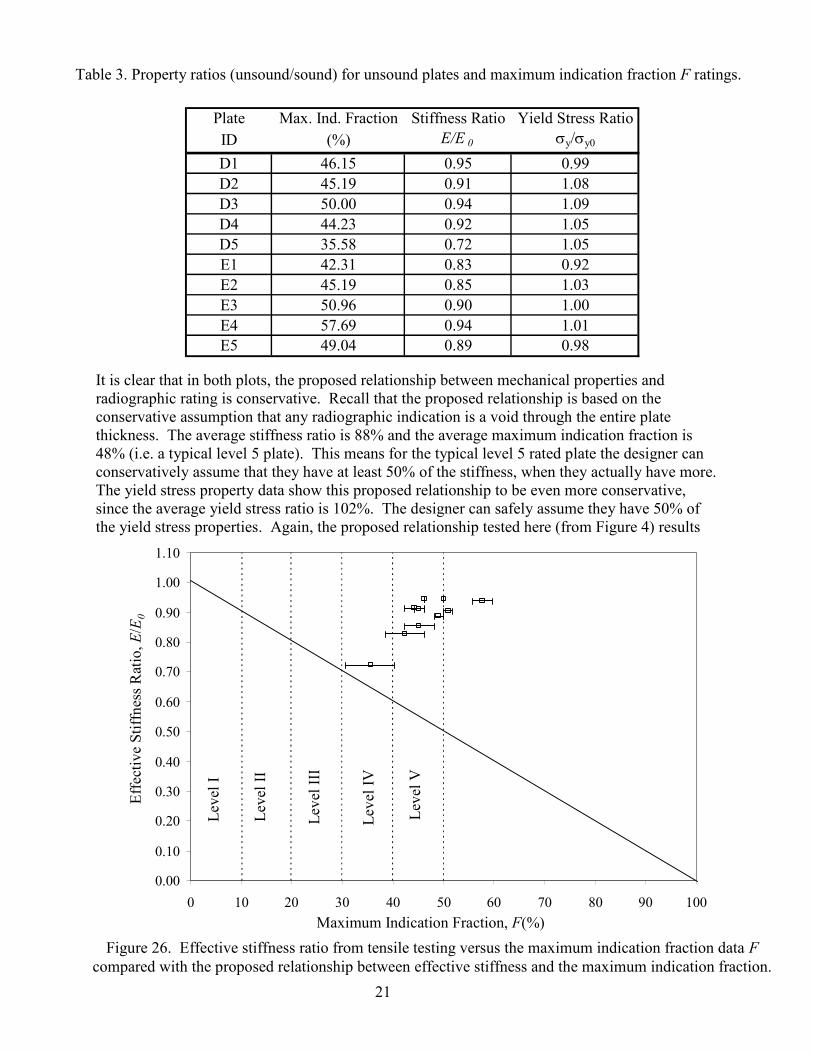
Table 3. Property ratios (unsound/sound) for unsound plates and maximum indication fraction F ratings.
Figure 26. Effective stiffness ratio from tensile testing versus the maximum indication fraction data F
compared with the proposed relationship between effective stiffness and the maximum indication fraction.
Plate Max. Ind. Fraction Stiffness Ratio Yield Stress Ratio
ID (%) E/E 0 σy/σy0
D1 46.15 0.95 0.99
D2 45.19 0.91 1.08
D3 50.00 0.94 1.09
D4 44.23 0.92 1.05
D5 35.58 0.72 1.05
E1 42.31 0.83 0.92
E2 45.19 0.85 1.03
E3 50.96 0.90 1.00
E4 57.69 0.94 1.01
E5 49.04 0.89 0.98
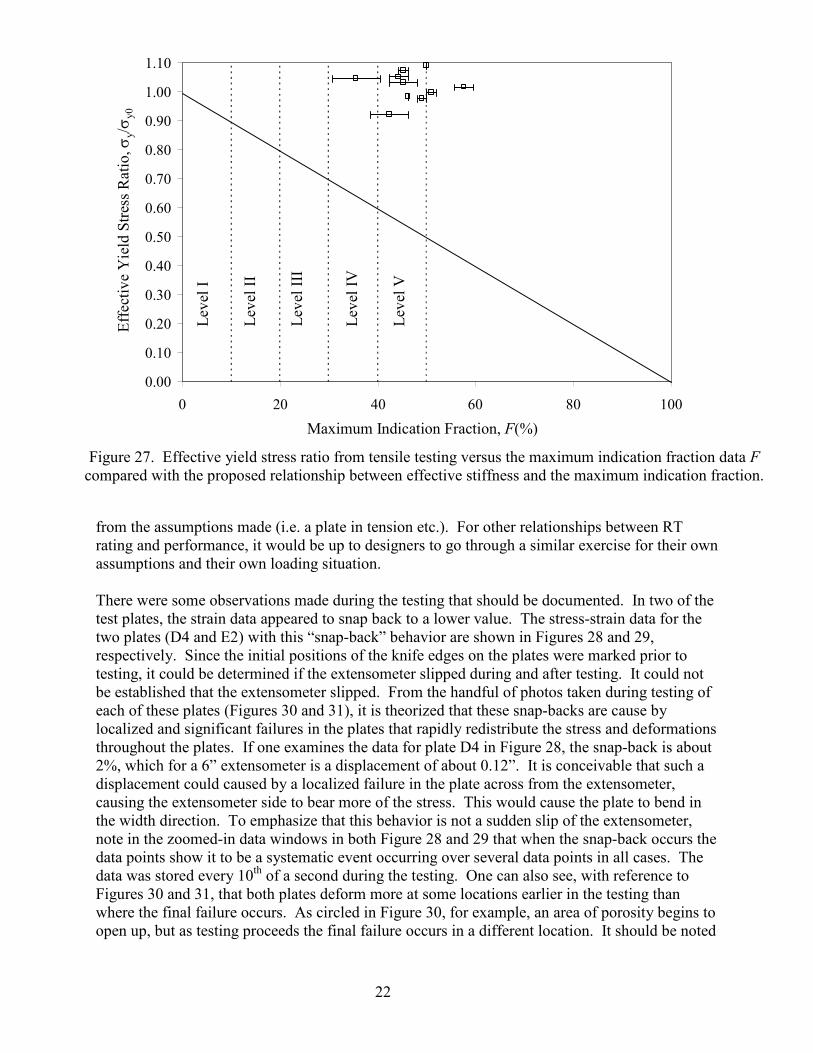
It is clear that in both plots, the proposed relationship between mechanical properties and
radiographic rating is conservative. Recall that the proposed relationship is based on the
conservative assumption that any radiographic indication is a void through the entire plate
thickness. The average stiffness ratio is 88% and the average maximum indication fraction is
48% (i.e. a typical level 5 plate). This means for the typical level 5 rated plate the designer can
conservatively assume that they have at least 50% of the stiffness, when they actually have more.
The yield stress property data show this proposed relationship to be even more conservative,
since the average yield stress ratio is 102%. The designer can safely assume they have 50% of
the yield stress properties. Again, the proposed relationship tested here (from Figure 4) results
22
0.00
0.10
0.20
0.30
0.40
0.50
0.60
0.70
0.80
0.90
1.00
1.10
0 20 40 60 80 100
Maximum Indication Fraction, f(%)
Eff
ecti
ve
Sti
ffn
ess
Rat
io,
E/E
0
Maximum Indication Fraction, F(%)
Eff
ect
ive
Yie
ld S
tres
s R
ati
o, σ
y/σ
y0
Lev
el I
Lev
el I
I
Lev
el I
II
Lev
el I
V
Lev
el V
0.00
0.10
0.20
0.30
0.40
0.50
0.60
0.70
0.80
0.90
1.00
1.10
0 20 40 60 80 100
Maximum Indication Fraction, f(%)
Eff
ecti
ve
Sti
ffn
ess
Rat
io,
E/E
0
Maximum Indication Fraction, F(%)
Eff
ect
ive
Yie
ld S
tres
s R
ati
o, σ
y/σ
y0
Lev
el I
Lev
el I
I
Lev
el I
II
Lev
el I
V
Lev
el V
Figure 27. Effective yield stress ratio from tensile testing versus the maximum indication fraction data F
compared with the proposed relationship between effective stiffness and the maximum indication fraction.
from the assumptions made (i.e. a plate in tension etc.). For other relationships between RT
rating and performance, it would be up to designers to go through a similar exercise for their own
assumptions and their own loading situation.
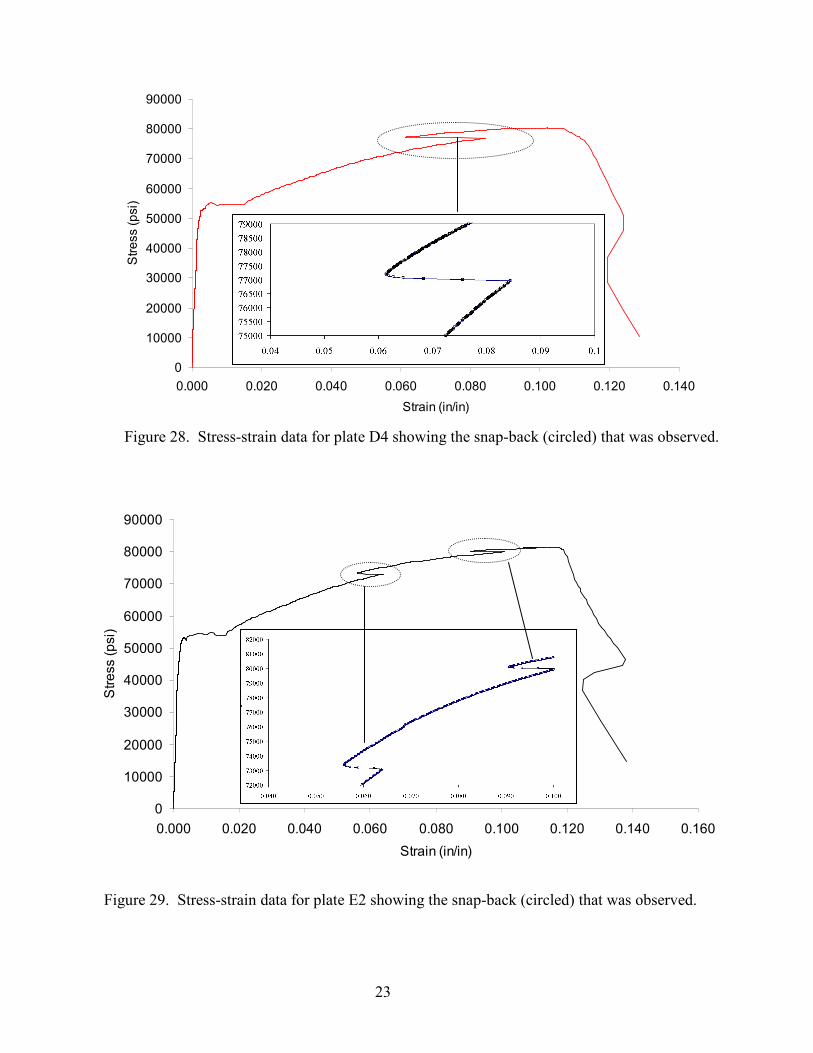
There were some observations made during the testing that should be documented. In two of the
test plates, the strain data appeared to snap back to a lower value. The stress-strain data for the
two plates (D4 and E2) with this “snap-back” behavior are shown in Figures 28 and 29,
respectively. Since the initial positions of the knife edges on the plates were marked prior to
testing, it could be determined if the extensometer slipped during and after testing. It could not
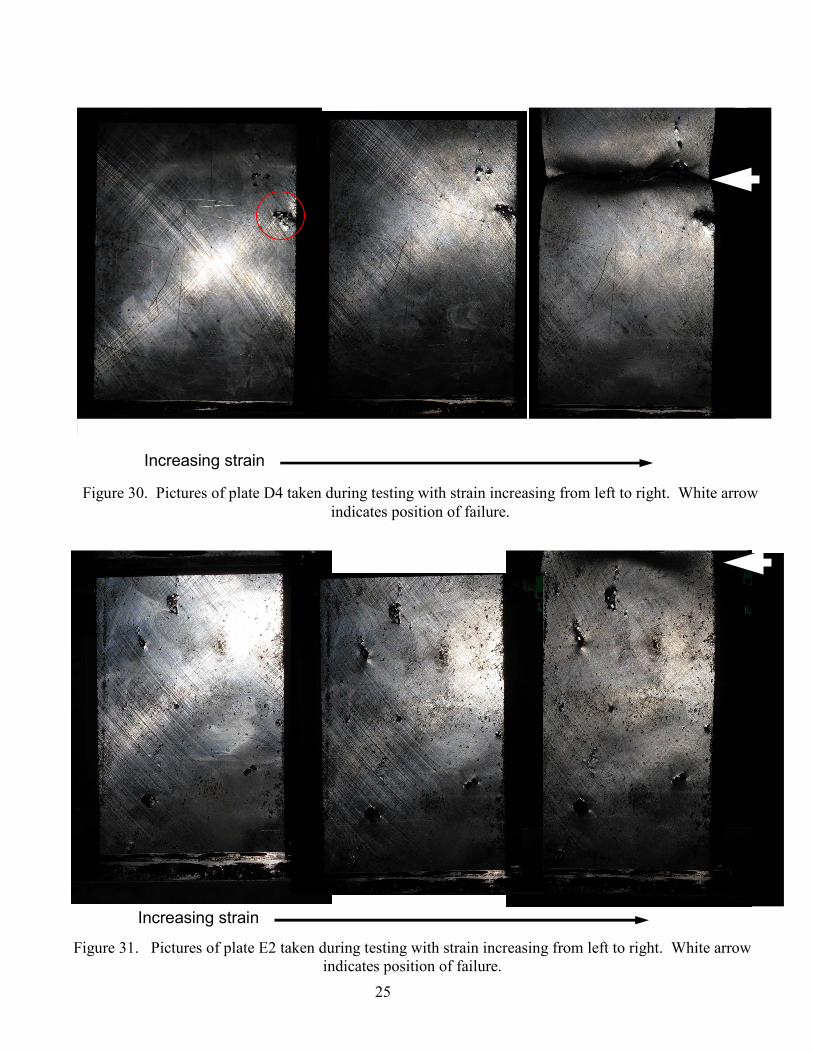
be established that the extensometer slipped. From the handful of photos taken during testing of
each of these plates (Figures 30 and 31), it is theorized that these snap-backs are cause by
localized and significant failures in the plates that rapidly redistribute the stress and deformations
throughout the plates. If one examines the data for plate D4 in Figure 28, the snap-back is about
2%, which for a 6” extensometer is a displacement of about 0.12”. It is conceivable that such a
displacement could caused by a localized failure in the plate across from the extensometer,
causing the extensometer side to bear more of the stress. This would cause the plate to bend in
the width direction. To emphasize that this behavior is not a sudden slip of the extensometer,
note in the zoomed-in data windows in both Figure 28 and 29 that when the snap-back occurs the
data points show it to be a systematic event occurring over several data points in all cases. The
data was stored every 10th
of a second during the testing. One can also see, with reference to
Figures 30 and 31, that both plates deform more at some locations earlier in the testing than
where the final failure occurs. As circled in Figure 30, for example, an area of porosity begins to
open up, but as testing proceeds the final failure occurs in a different location. It should be noted
23
0
10000
20000
30000
40000
50000
60000
70000
80000
90000
0.000 0.020 0.040 0.060 0.080 0.100 0.120 0.140
Strain (in/in)
Stress (psi)
D4
Figure 28. Stress-strain data for plate D4 showing the snap-back (circled) that was observed.
0
10000
20000
30000
40000
50000
60000
70000
80000
90000
0.000 0.020 0.040 0.060 0.080 0.100 0.120 0.140 0.160
Strain (in/in)
Stress (psi)
E2
Figure 29. Stress-strain data for plate E2 showing the snap-back (circled) that was observed.
24
that “snap-forward” is difficult to determine from the data, because it appears (or would appear)
to be the expected behavior of yielding and failing material data. Therefore, no clear
determination of snap-forward can be made. The prediction of the rather complex failure of
these plates could only be made by careful and accurate mapping of their porosity distribution
into a finite element stress analysis that uses porosity dependent properties, damage and failure
models.
Results Part II: Results of the Gage R&R Study of the Revised Radiographic Standard
The results of the gage R&R for the revised radiographic standard will now be presented. As
mentioned earlier, three radiographs were rated by five readers three times each. The three
radiographs used in the study were the same used in the 2009 gage R&R study. This way a fair
comparison could be made between results for the earlier version and the revised version of the
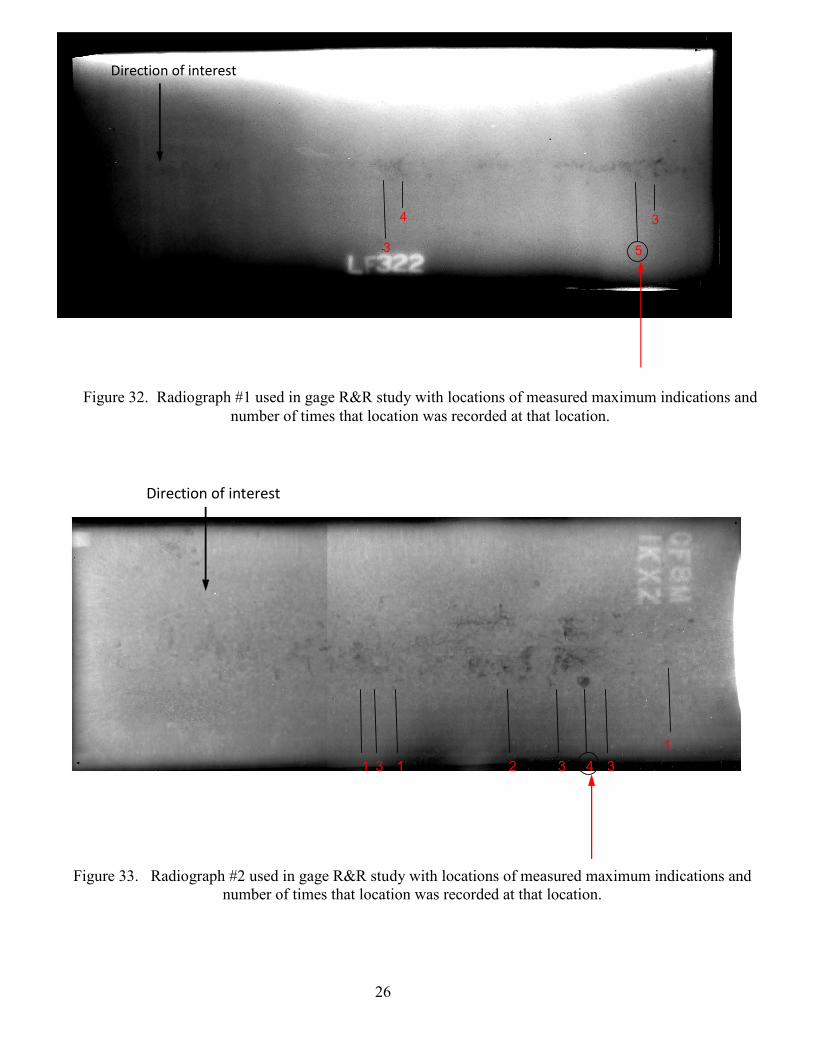
new RT standard. The three radiographs rated are given in Figures 32 to 34. Here the direction
of interest (DOI) for the rating is the width of the radiograph.
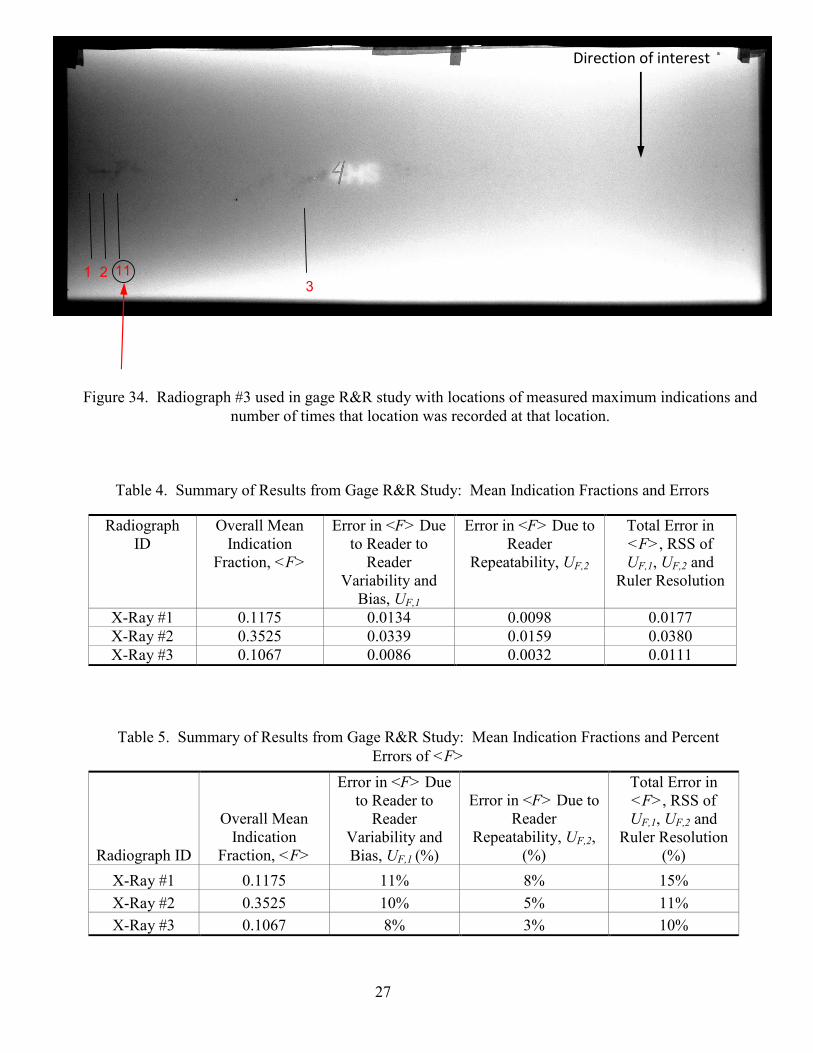
The number of times a maximum indication fraction F was measured using the 0.25” wide ruler
oriented in the DOI at a given position is given by the red numbers in Figures 32 to 34. Given
that there are five RT “inspectors” with three evaluations each, there are at least fifteen Fs
indicated in Figures 32 to 34. In some cases there are more fifteen, which means there was more
than one location having the same F value in an inspector’s measurement. Figure 33 has
eighteen maximum indication fraction positions, and Figure 34, has sixteen F positions. The
position with the largest number of agreements in F in Figures 32 and 33 are 5 and 4,
respectively. In these two figures there is more scatter in the number of agreements about the
position of F. In particular, radiograph #2 has eight different positions where F was measured;
five times in four of these positions. Radiograph #2 (in Figure 33) was perhaps the most difficult
to evaluate and measure. In contrast, radiograph #3 (in Figure 34) was perhaps the easiest to
measure. Here for radiograph #3 there was one position which stood out in number of
agreements on the measured F, with 11.
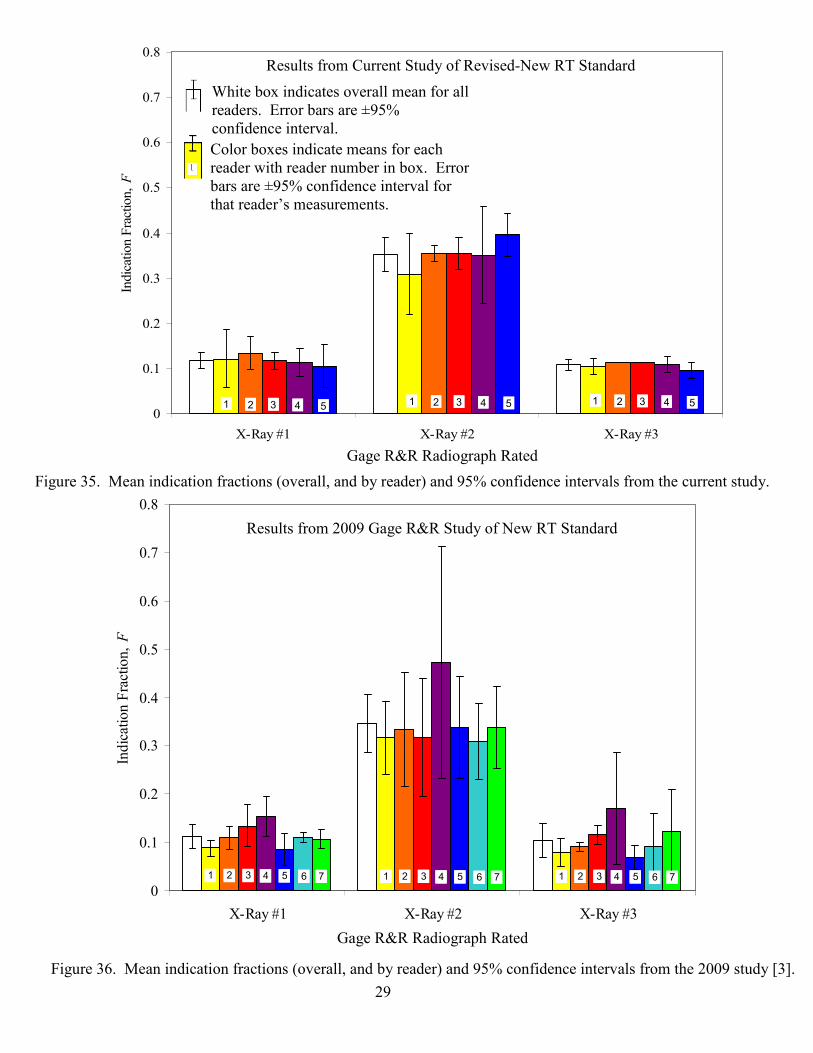
The mean indication fraction <F> is plotted in the left side white box histogram in Figure 35 for
each radiograph, and the error bars give the interval for the total error from Table 4. The color
histogram boxes in Figure 35 denote the mean ratings made by the individual radiograph
evaluators and the error bars there denote the individual’s confidence interval. The analogous
plot from last year’s gage R&R is shown in Figure 36, where there were seven evaluators in the
study. The number in each histogram box denotes a different evaluator. Note that evaluator
numbers in the two plots do not coincide to the same evaluator. In each radiograph the overall
error is clearly reduced from last year’s study, especially for radiograph #3. The revised
standard appears to have properly addressed shortcomings in the earlier version of the new
standard.
In Table 4 are given the overall mean indication fractions <F>, the reader-to-reader
reproducibility error UF,1, the error in <F> due to reader repeatability, UF,2, and the total error for
<F> which includes UF,1, UF,2 and the ruler resolution for each radiograph. Since the errors
appear to increase with the value of <F>, it is interesting to express the errors in terms of
percentage of <F>. The errors in terms of percentage of <F> are given in Table 5, where the
total errors range between 10% and 15% of the <F> value. Returning to Table 4, note that for
25
Figure 30. Pictures of plate D4 taken during testing with strain increasing from left to right. White arrow
indicates position of failure.
Figure 31. Pictures of plate E2 taken during testing with strain increasing from left to right. White arrow
indicates position of failure.
Increasing strain
Increasing strain
26
Direction of interest
3
4
5
3
Direction of interest
1 3 32
1
341
Figure 32. Radiograph #1 used in gage R&R study with locations of measured maximum indications and
number of times that location was recorded at that location.
Figure 33. Radiograph #2 used in gage R&R study with locations of measured maximum indications and
number of times that location was recorded at that location.
27
Direction of interest
1 23
11
Figure 34. Radiograph #3 used in gage R&R study with locations of measured maximum indications and
number of times that location was recorded at that location.
Table 4. Summary of Results from Gage R&R Study: Mean Indication Fractions and Errors
Table 5. Summary of Results from Gage R&R Study: Mean Indication Fractions and Percent
Errors of <F>
Radiograph
ID
Overall Mean
Indication
Fraction, <F>
Error in <F> Due
to Reader to
Reader
Variability and
Bias, UF,1
Error in <F> Due to
Reader
Repeatability, UF,2
Total Error in
<F>, RSS of
UF,1, UF,2 and
Ruler Resolution
X-Ray #1 0.1175 0.0134 0.0098 0.0177
X-Ray #2 0.3525 0.0339 0.0159 0.0380
X-Ray #3 0.1067 0.0086 0.0032 0.0111
Radiograph ID
Overall Mean
Indication
Fraction, <F>
Error in <F> Due
to Reader to
Reader
Variability and
Bias, UF,1 (%)
Error in <F> Due to
Reader
Repeatability, UF,2,
(%)
Total Error in
<F>, RSS of
UF,1, UF,2 and
Ruler Resolution
(%)
X-Ray #1 0.1175 11% 8% 15%
X-Ray #2 0.3525 10% 5% 11%
X-Ray #3 0.1067 8% 3% 10%
28
all radiographs in this gage R&R, the total error is less than ½ of a rating level of F (since a level
of F is 0.1 and half a level is 0.05, and the largest error is 0.038). The largest source of error in
this gage R&R study is the reader-to-reader reproducibility error UF,1. This was also the case in
the previous gage R&R [3], but here UF,1 has been reduced by 35%, 32% and 70%, for
radiographs #1, #2 and #3, respectively, from the previous gage R&R study. The error in <F>
due to reader repeatability UF,2 is either unchanged or greatly reduced from the previous study,
where UF,2 was 0.0073, 0.0319 and 0.0155 for radiographs #1, #2 and #3, respectively. In the
current study UF,2 was 0.0098, 0.0159 and 0.0032 for radiographs #1, #2 and #3, respectively.
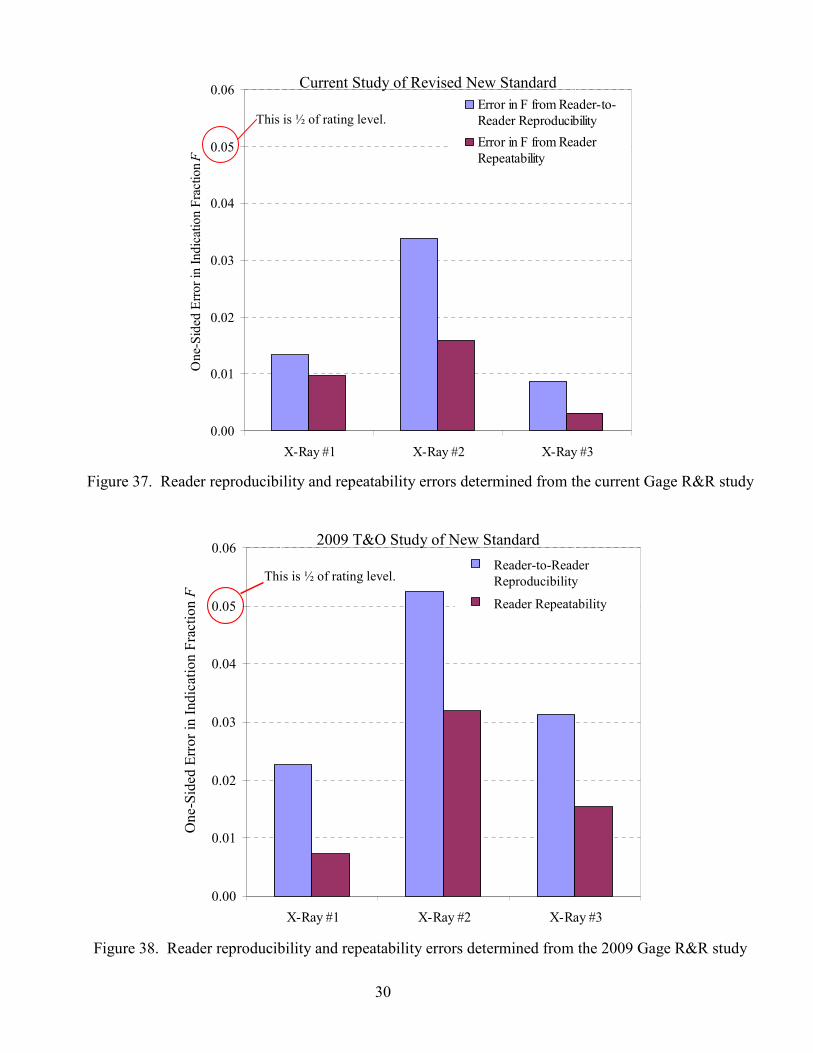
To visualize the reductions in the errors observed with use of the revised standard, compare the
one-sided errors in <F> due to the reader-to-reader reproducibility and reader repeatability
plotted for the three radiographs in Figure 37 for the current study with those in Figure 38 for the
2009 study. Here it is apparent that all errors are substantially reduced in the current study
except for the repeatability error for x-ray #1, which is essentially unchanged as previously
mentioned.
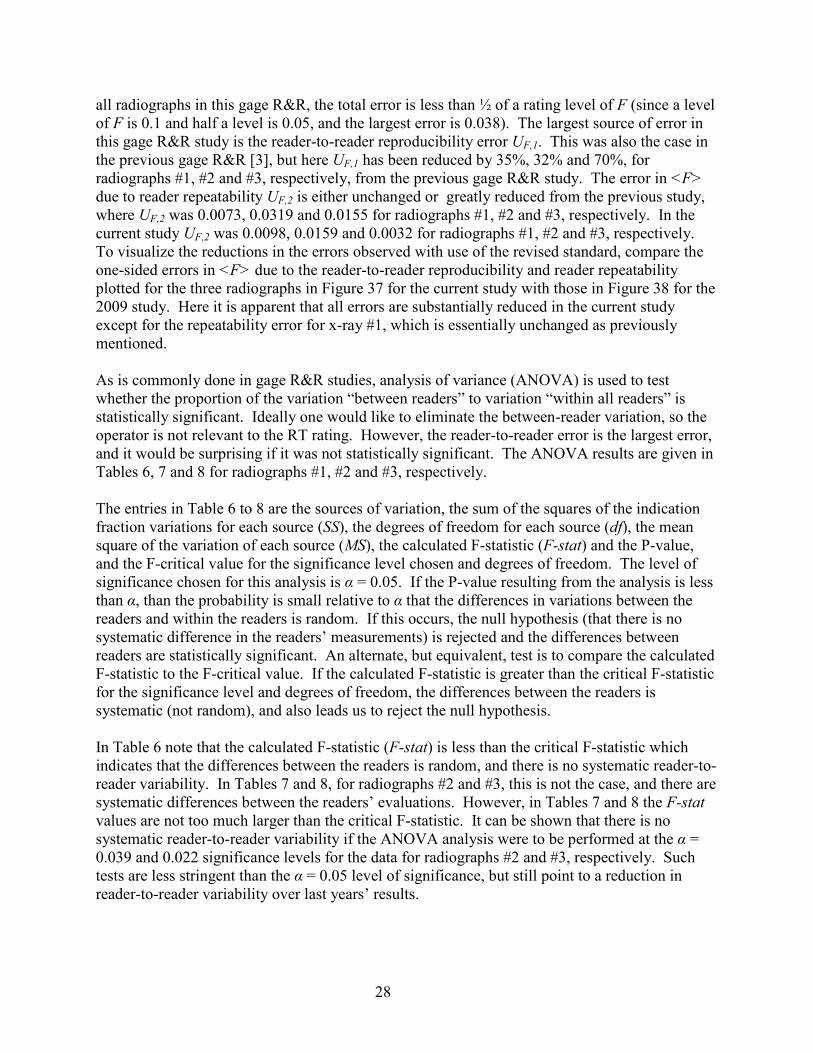
As is commonly done in gage R&R studies, analysis of variance (ANOVA) is used to test
whether the proportion of the variation “between readers” to variation “within all readers” is
statistically significant. Ideally one would like to eliminate the between-reader variation, so the
operator is not relevant to the RT rating. However, the reader-to-reader error is the largest error,
and it would be surprising if it was not statistically significant. The ANOVA results are given in
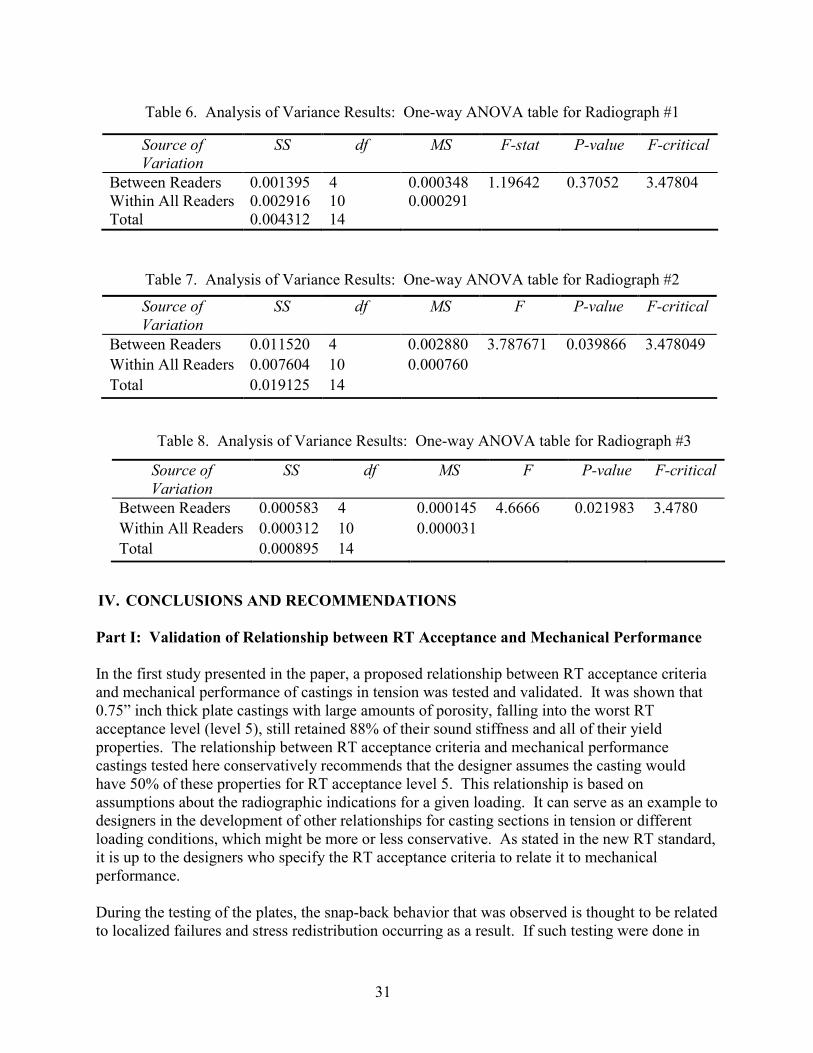
Tables 6, 7 and 8 for radiographs #1, #2 and #3, respectively.
The entries in Table 6 to 8 are the sources of variation, the sum of the squares of the indication
fraction variations for each source (SS), the degrees of freedom for each source (df), the mean
square of the variation of each source (MS), the calculated F-statistic (F-stat) and the P-value,
and the F-critical value for the significance level chosen and degrees of freedom. The level of
significance chosen for this analysis is α = 0.05. If the P-value resulting from the analysis is less
than α, than the probability is small relative to α that the differences in variations between the
readers and within the readers is random. If this occurs, the null hypothesis (that there is no
systematic difference in the readers’ measurements) is rejected and the differences between
readers are statistically significant. An alternate, but equivalent, test is to compare the calculated
F-statistic to the F-critical value. If the calculated F-statistic is greater than the critical F-statistic
for the significance level and degrees of freedom, the differences between the readers is
systematic (not random), and also leads us to reject the null hypothesis.
In Table 6 note that the calculated F-statistic (F-stat) is less than the critical F-statistic which
indicates that the differences between the readers is random, and there is no systematic reader-to-
reader variability. In Tables 7 and 8, for radiographs #2 and #3, this is not the case, and there are
systematic differences between the readers’ evaluations. However, in Tables 7 and 8 the F-stat
values are not too much larger than the critical F-statistic. It can be shown that there is no
systematic reader-to-reader variability if the ANOVA analysis were to be performed at the α =
0.039 and 0.022 significance levels for the data for radiographs #2 and #3, respectively. Such
tests are less stringent than the α = 0.05 level of significance, but still point to a reduction in
reader-to-reader variability over last years’ results.
29
0
0.1
0.2
0.3
0.4
0.5
0.6
0.7
0.8
X-Ray #1 X-Ray #2 X-Ray #3
Gage R&R Radiograph Rated
Indic
atio
n F
ract
ion, F
1 2 3 4 5 1 2 3 4 5 1 2 3 4 50
0.1
0.2
0.3
0.4
0.5
0.6
0.7
0.8
X-Ray #1 X-Ray #2 X-Ray #3
Gage R&R Radiograph Rated
Indic
atio
n F
ract
ion, F
1 2 3 4 51 2 3 4 5 1 2 3 4 51 2 3 4 5 1 2 3 4 51 2 3 4 5
Figure 35. Mean indication fractions (overall, and by reader) and 95% confidence intervals from the current study.
Gage R&R Radiograph Rated
Results from Current Study of Revised-New RT Standard
Figure 36. Mean indication fractions (overall, and by reader) and 95% confidence intervals from the 2009 study [3].
0
0.1
0.2
0.3
0.4
0.5
0.6
0.7
0.8
X-Ray #1 X-Ray #2 X-Ray #3
In-House Gage R&R Radiograph Rated
Ind
icat
ion
Fra
ctio
n,
F
1 2 3 4 5 6 7 1 2 3 4 5 6 7 1 2 3 4 5 6 7
White box indicates mean fraction of all four
evaluations with and without transparency for all
readers. Error bars are ±95% confidence interval.
Color boxes indicate mean fraction of all four
evaluations with and without transparency
for the reader number in the box. Error bars are
±95% confidence interval for that reader’s four
evaluations.
0
0.1
0.2
0.3
0.4
0.5
0.6
0.7
0.8
X-Ray #1 X-Ray #2 X-Ray #3
In-House Gage R&R Radiograph Rated
Ind
icat
ion
Fra
ctio
n,
F
1 2 3 4 5 6 71 2 3 4 5 6 7 1 2 3 4 5 6 71 2 3 4 5 6 7 1 2 3 4 5 6 71 2 3 4 5 6 7
White box indicates mean fraction of all four
evaluations with and without transparency for all
readers. Error bars are ±95% confidence interval.
Color boxes indicate mean fraction of all four
evaluations with and without transparency
for the reader number in the box. Error bars are
±95% confidence interval for that reader’s four
evaluations.
Gage R&R Radiograph Rated
White box indicates overall mean for all
readers. Error bars are ±95%
confidence interval.
Color boxes indicate means for each
reader with reader number in box. Error
bars are ±95% confidence interval for
that reader’s measurements.
Results from 2009 Gage R&R Study of New RT Standard
30
0.00
0.01
0.02
0.03
0.04
0.05
0.06
X-Ray #1 X-Ray #2 X-Ray #3
One-
Sid
ed E
rro
r in
Ind
icat
ion
Fra
ctio
n F
Error in F from Reader-to-
Reader Reproducibility
Error in F from Reader
Repeatability
Reproducibility and Repeatability Errors Compared
This is ½ of rating level.Reader-to-Reader
Reproducibility
Reader Repeatability
On
e-S
ided
Err
or
in I
nd
icat
ion F
ract
ion F
2009 T&O Study of New Standard
Figure 38. Reader reproducibility and repeatability errors determined from the 2009 Gage R&R study
Figure 37. Reader reproducibility and repeatability errors determined from the current Gage R&R study
0.00
0.01
0.02
0.03
0.04
0.05
0.06
X-Ray #1 X-Ray #2 X-Ray #3
On
e-S
ided
Err
or
in I
nd
icat
ion
Fra
ctio
n
F
Error in F from Reader-to-
Reader Reproducibility
Error in F from Reader
Repeatability
Current Study of Revised New Standard
This is ½ of rating level.
31
Source of
Variation
SS df MS F P-value F-critical
Between Readers 0.011520 4 0.002880 3.787671 0.039866 3.478049
Within All Readers 0.007604 10 0.000760
Total 0.019125 14
Table 7. Analysis of Variance Results: One-way ANOVA table for Radiograph #2
Source of
Variation
SS df MS F P-value F-critical
Between Readers 0.000583 4 0.000145 4.6666 0.021983 3.4780
Within All Readers 0.000312 10 0.000031
Total 0.000895 14
Table 8. Analysis of Variance Results: One-way ANOVA table for Radiograph #3
IV. CONCLUSIONS AND RECOMMENDATIONS
Part I: Validation of Relationship between RT Acceptance and Mechanical Performance
In the first study presented in the paper, a proposed relationship between RT acceptance criteria
and mechanical performance of castings in tension was tested and validated. It was shown that
0.75” inch thick plate castings with large amounts of porosity, falling into the worst RT
acceptance level (level 5), still retained 88% of their sound stiffness and all of their yield
properties. The relationship between RT acceptance criteria and mechanical performance
castings tested here conservatively recommends that the designer assumes the casting would
have 50% of these properties for RT acceptance level 5. This relationship is based on
assumptions about the radiographic indications for a given loading. It can serve as an example to
designers in the development of other relationships for casting sections in tension or different
loading conditions, which might be more or less conservative. As stated in the new RT standard,
it is up to the designers who specify the RT acceptance criteria to relate it to mechanical
performance.
During the testing of the plates, the snap-back behavior that was observed is thought to be related
to localized failures and stress redistribution occurring as a result. If such testing were done in
Source of
Variation
SS df MS F-stat P-value F-critical
Between Readers 0.001395 4 0.000348 1.19642 0.37052 3.47804
Within All Readers 0.002916 10 0.000291
Total 0.004312 14
Table 6. Analysis of Variance Results: One-way ANOVA table for Radiograph #1
32
the future, a high quality video recording of the test is recommended, since it might be able to
capture such events and clearly explain them.
The new RT standard cannot provide a prediction on the location and manner of the casting
failure (i.e. damage and strain to failure). This is because it does not consider the grey level of
indications on radiographs or provide a way to determine the porosity distribution in the casting.
Only after reconstructing the porosity distributions in the plates based on their grey level, and
mapping this porosity distribution into finite element stress analyses (FEA), and using porosity
dependent properties, damage and failure models in the FEA, can the location and manner of the
failure be predicted. While the authors recommend pursuing this to validate FEA models that
consider the effects of porosity, the results from that work will not change the outcome of this
work, a validated relationship between RT acceptance and mechanical performance.
Part II: Gage R&R Study of the Revised Radiographic Standard
When applying the new radiographic standard, measurements of the maximum indication
fraction are made. There is variability in these measurements due to the individual making the
measurements, the radiograph itself and how the measurements are made. The radiographic
standard was revised to address shortcomings observed in an earlier gage R&R study. Here it
was demonstrated that the revised standard gives lower reader-to-reader reproducibility and
reader repeatability errors in the RT ratings. The largest source of error in the gage R&R study
is the reader-to-reader reproducibility, but it was reduced by 46% on average compared to last
years gage R&R study. The error due to reader repeatability was reduced by an average of 30%
from the previous study. Compared to the current ASTM RT standards, which have been shown
to have an average confidence interval of ±1.4 levels [2], the revised new RT standard gives
confidence intervals of ±0.17, ±0.38, and ±0.11 levels for the three radiographs evaluated in the
study. In last year’s gage R&R study, the earlier version of the new RT standard gave
confidence intervals of ±0.25, ±0.62, and ±0.36 levels for the same three radiographs. The new
revised standard was also shown to reduce the between-readers variability in an AVOVA
analysis. It is not expected that the to reader-to-reader variability be eliminated, but the
reduction in reader-to-reader variability over last years’ gage R&R results reflect the
improvements made to the revised standard. It is recommended the standard be put forward to
ASTM to serve as an additional radiographic testing standard that can be used to relate RT
acceptance criteria to mechanical performance.
ACKNOWLEDGEMENTS
This research was undertaken through the American Metalcasting Consortium (AMC). AMC is
sponsored by Defense Supply Center Philadelphia (DSC, Philadelphia, PA) and the Defense
Logistics Agency (DLA, Ft. Belvoir, VA). This work was conducted under the auspices of the
Steel Founders' Society of America (SFSA) through substantial in-kind support and guidance
from SFSA member foundries. In particular, the authors gratefully appreciate the participation of
Sivyer Steel Casting for heat treating the tensile test plates. The valuable tensile test data could
not have been acquired without the 800,00 lb force capacity test machine at SSAB North
American Division, Muscatine, Iowa. The authors thank SSAB, and Brian Castillo, their
laboratory supervisor, for running the tensile tests.
33
Any opinions, findings, conclusions, or recommendations expressed herein are those of the
authors and do not necessarily reflect the views of DSC, DLA, or the SFSA and any of its
members.
REFERENCES
1. Blair, M., Monroe, R., Hardin, R.A., and Beckermann, C., "A New Standard for
Radiographic Acceptance Criteria for Steel Castings," in Proceedings of the 62nd Technical
and Operating Conference, SFSA, Chicago, IL, 2008.
2. Carlson, K., Ou, S., Hardin, R., and Beckermann, C., "Analysis of ASTM X-Ray Shrinkage
Rating for Steel Castings," Int. J. Cast Metals Research, Vol. 14, pp. 169-183, 2001.
3. Hardin, R.A., and Beckermann, C., “A New Standard for Radiographic Acceptance Criteria
for Steel Castings: Gage R&R Study,” in Proceedings of the 63rd Technical and Operating
Conference, SFSA, Chicago, IL, 2009.
4. Blair, M., Monroe, R., Hardin, R.A., and Beckermann, C., “A New Standard for
Radiographic Acceptance Criteria for Steel Castings,” revised May, 2010.
5. ASTM Standard E8/E8M-09, “Standard Test Methods for Tension Testing of Metallic
Materials,” ASTM International, West Conshohocken, PA, 2003.
6. Figliola, R., and Beasley, D., Theory and Design for Mechanical Measurements, 4th
Ed.,
Wiley, 2005.
7. Montgomery, D.C., Introduction to Statistical Quality Control, 5th
Ed., Wiley, 2005, p. 135.
8. ASM, Tensile Testing, 2nd
Ed., Edited by J.R. Davis, ASM International, Materials Park, OH,
2003, p. 43.


![Measurement system analysis in production process · nested gage R&R study [6]. Figure 3. Crossed gage R&R . Figure 4. Nested gage R&R . The three stated analyses also differ in the](https://img.pdfslide.net/doc/110x75/5e3e2d2b71c1a652170f9b1a/measurement-system-analysis-in-production-process-nested-gage-rr-study-6.jpg)