Embed Size (px)
Citation preview

Validation and verification of land cover data Selected challenges from European and national environmental land monitoring
Gergely Maucha
head, Environmental Applications
of Remote Sensing
Institute of Geodesy, Cartography & Remote Sensing 1149 Budapest, Bosnyák tér 5. - Hungary
http://www.fomi.hu

2 2
Participation in national and European land monitoring
• National segment of European CLC update & change mapping projects
• Verification & enhancement of HR land cover layers (part of European GIO Land
project)
• National 1:50.000 scale CORINE Land Cover mapping (CLC50)
• Working for European Environment Agency (EEA) as participating in European
Topic Centres since 2001 (ETC-TE, ETC-LUSI, ETC-SIA, ..)
− LC Technical Team in CLC2000, CLC2006, CLC2012 projects
− Preparation of Technical Guidelines for European projects
− Training of national teams (39+ countries), verification of CLC data
− Verification of national products
− Validation of European Land Cover products & methodological developments
• Participating in INSPIRE land cover data specification
• Participating in the development of a European land monitoring strategy (EAGLE
working group, FP7 HELM project
International LCLUC Regional Science Meeting in Central Europe
16-17.10.2014 Sopron, Hungary

3 3
Overview of quality assurance elements
Preventions issues:
- Well-defined product specification and quality criteria
- Good project plan
- Well-documented methodology
- Appropriate education, training
- High-quality instruments (sw, hw) and materials (data, maps, etc.)
- …
Control issues: Well-planned and documented quality control
- Verification – corrective purpose
- Validation – usually no corrective purpose, the aim is to create
metadata describing the quality of the product
International LCLUC Regional Science Meeting in Central Europe
16-17.10.2014 Sopron, Hungary

4
CORINE LAND COVER
• project initiated by the European Commission
• working scale - 1 : 100 000
• minimum mapping unit: 25 ha (changes: 5ha)
Applications: Land cover is a basic data
source for environmental modelling,
regional planning and orientation of the
environmental policy in Europe
Purpose: To provide quantitative, consistent
and comparable information on land cover
CORINE = Co-ordination of Information on the Environment
Land cover: biophysical coverage of the
Earth’s surface (changes > 1 year)
Periodic update (~6 years):
1st inventory: 1985-1996 (CLC1990)
2nd inventory: 2001-2004 (CLC2000)
3rd inventory: 2006-2008 (CLC2006)
4th inventory: 2012-2014 (CLC2012)
International LCLUC Regional Science Meeting in Central Europe
16-17.10.2014 Sopron, Hungary

5
CORINE LAND COVER MAPPING – METHODOLOGY (TRADITIONAL)
Input: HR satellite imagary
(scale 1 : 100 000)
Method:
Output: Digital database including 44 categories
in five groups:
- artificial surfaces
- agriculture
- forest and semi-natural vegetation
- wetlands
- water bodies
Supervision: Central (EEA)
Visual interpretation with computer
assistance, use of ancillary information
(topomaps, air-photos), field checking
International LCLUC Regional Science Meeting in Central Europe
16-17.10.2014 Sopron, Hungary

6 International LCLUC Regional Science Meeting in Central Europe
16-17.10.2014 Sopron, Hungary
Verification: Remarks on polygon level

7 International LCLUC Regional Science Meeting in Central Europe
16-17.10.2014 Sopron, Hungary
Validation example: LUCAS points vs. CLC2000
LUCAS LC/LU data displayed over CLC2000
- black dots: agreement
- pink dots: disagreement
Difficulties:
- Nomenclatures are different
semantic transformation needed
- Scale is different
(+ Blocky distribution - random or
evenly spaced grid needed)
8 8
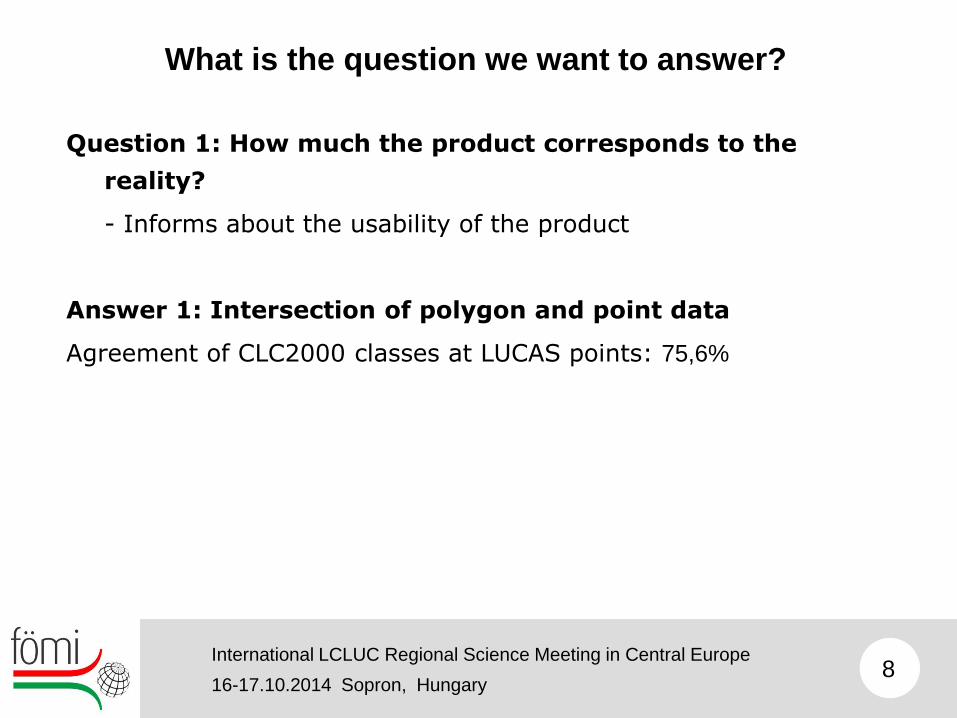
What is the question we want to answer?
International LCLUC Regional Science Meeting in Central Europe
16-17.10.2014 Sopron, Hungary
Question 1: How much the product corresponds to the
reality?
- Informs about the usability of the product
Answer 1: Intersection of polygon and point data
Agreement of CLC2000 classes at LUCAS points: 75,6%

9 9
What is the question we want to answer?
International LCLUC Regional Science Meeting in Central Europe
16-17.10.2014 Sopron, Hungary
Question 2: How much the product corresponds to the
specifications?
- Informs about the quality of the completed work
Answer 2: Reinterpretation around (the central) sample point
- Satellite image base + LUCAS LC/LU + field photos
CLC2000 overall accuracy (18 countries): 87,0% ± 0,7%

10 10
CLC status map time series (Szombathely)
International LCLUC Regional Science Meeting in Central Europe
16-17.10.2014 Sopron, Hungary

11
Mapping land cover changes
- No intersection of CLC status layers, all land cover changes are delineated manually
- Developement of a specialized software tool (InterChange) – used by 23 countries in Europe
International LCLUC Regional Science Meeting in Central Europe
16-17.10.2014 Sopron, Hungary

12 12
CLC changes (Szombathely)
CORINE felszínborítás változások Szombathely környékén 2000 - 2006 között
-250
-200
-150
-100
-50
0
50
100
150
CLC kategóriák
hektá
r
Terület növekedés 70 83 26 104 10 5 6 40 68
Terület csökkenés 0 0 0 -82 -6 -195 -13 -46 -10 -35 -26
Nettó változás 70 83 26 22 4 -190 -7 -46 -10 5 42
112 121 122 133 141 211 231 242 243 311 324
International LCLUC Regional Science Meeting in Central Europe
16-17.10.2014 Sopron, Hungary

13 13
Valid questions
International LCLUC Regional Science Meeting in Central Europe
16-17.10.2014 Sopron, Hungary
Q1: Are the delineated changes real changes?
Method: Random point sampling within change areas
Result: User’s accuracy / commission error of change area
Q2: Is the change type correct?
Method: Random point sampling within selected change type areas
Result: User’s accuracy / commission error of selected ch. type
Q3: What is the amount of omitted changes?
Method: Random point sampling outside change areas
Result: Producer’s accuracy / omission error of change area

14 14
Understanding commission and omission error
International LCLUC Regional Science Meeting in Central Europe
16-17.10.2014 Sopron, Hungary
Illustration of 15% commission / omission error relative to the target class (5%)
Commissions:
Easy to find
Omissions:
Practically impossible to find if the
class is small (too many samples
needed to get representative results)
Possible solution:
Stratification – exclusion of areas
where the probability of omissions is
very low

15 15
GIO Land High Resolution Layers
Resolution: 20m / 100m
Minimum Mapping Unit (Forest types only): 0,5 ha
Minimum width of mapped linear elements: 20 m
Time series: 2006, 2009 (Imperviousness only), 2012 (5+ layers)
5+ Thematic land cover layer:
1. Imperviousness 2012
2. Tree Cover Density+ Forest types +
additional support layer 2012
3. Permanent grasslands+ additional
support layer 2006-2009-2012
4. Wetlands 2006-2009-2012
5. Permanent Water Bodies 2006-2009-
2012
New
International LCLUC Regional Science Meeting in Central Europe
16-17.10.2014 Sopron, Hungary

16 Actual questions of Land Cover Mapping in Hungary and in Europe
Activity of the Department of Environmental Applications of Remote Sensing
17 17
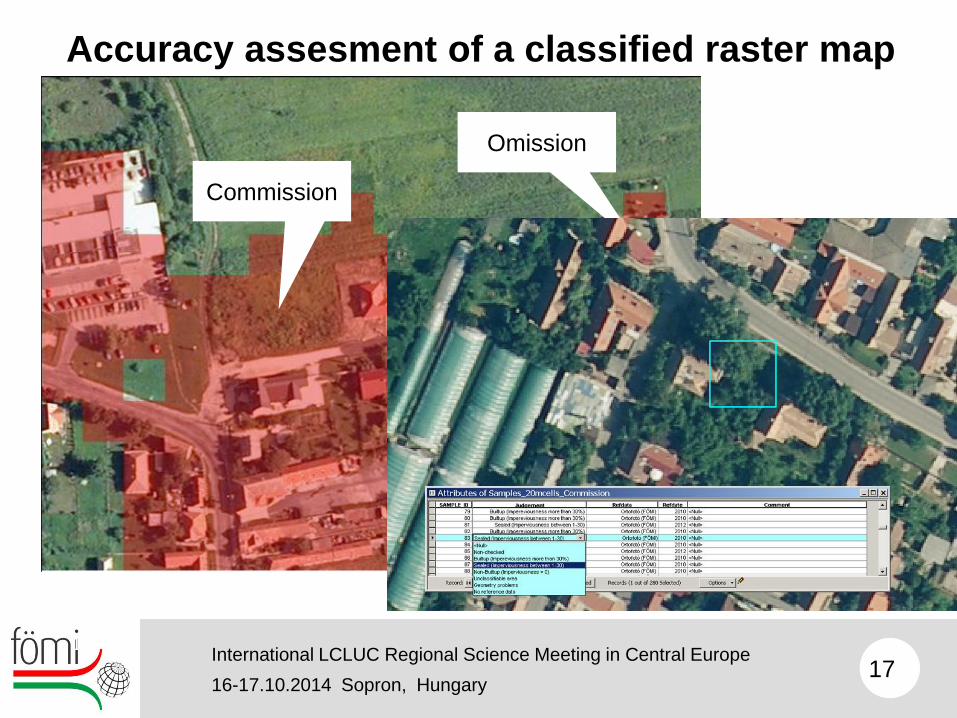
Accuracy assesment of a classified raster map
Commission
Omission
International LCLUC Regional Science Meeting in Central Europe
16-17.10.2014 Sopron, Hungary
18 18
European Level Land Use/Cover mapping activities
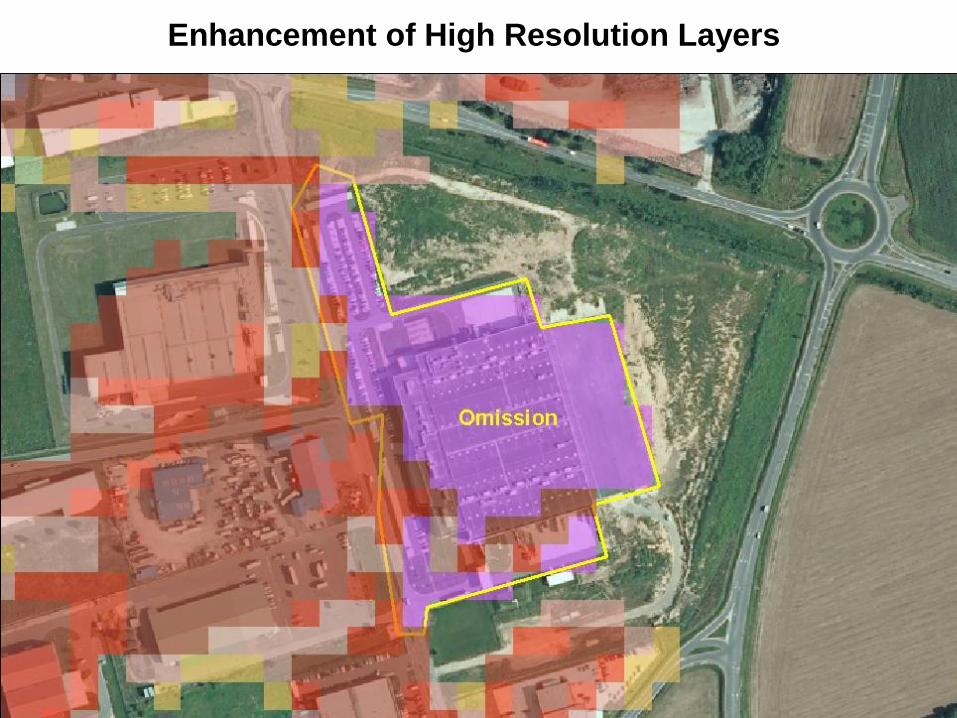
Enhancement of High Resolution Layers

19 19
Accuracy assesment of a land cover density product
Methodological developments (FÖMI)
Validation of European datasets
100x100m samples
Reference imagery: ortho-photos
Results (quantitative):
- Scatter-plot
- Parameters of fitted line
-Correlation coefficient
International LCLUC Regional Science Meeting in Central Europe
16-17.10.2014 Sopron, Hungary
20
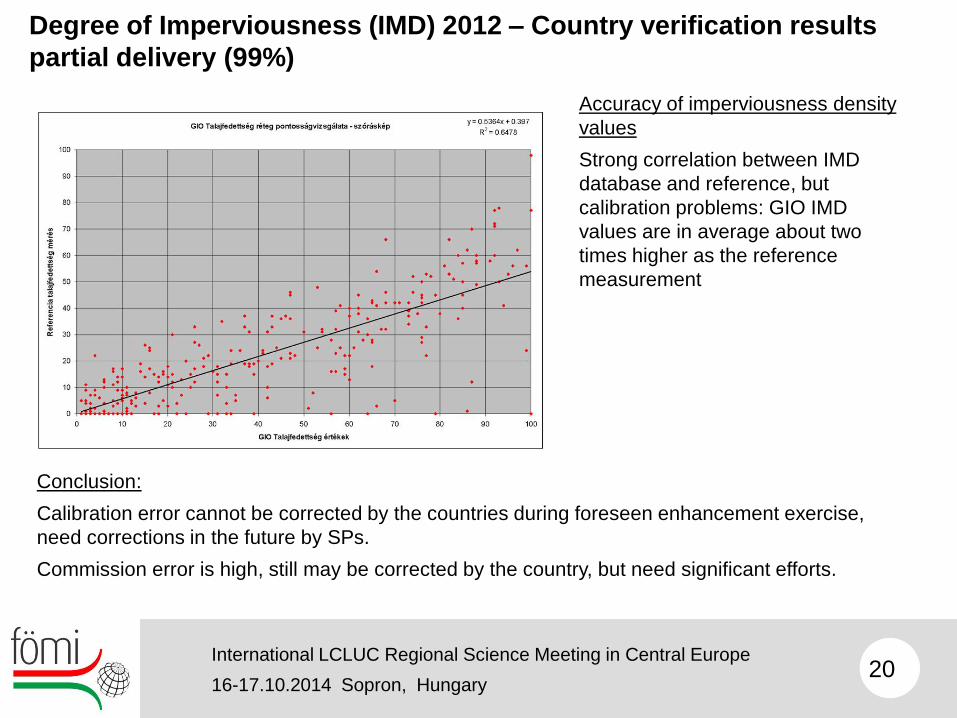
Degree of Imperviousness (IMD) 2012 – Country verification results
partial delivery (99%)
Accuracy of imperviousness density
values
Strong correlation between IMD
database and reference, but
calibration problems: GIO IMD
values are in average about two
times higher as the reference
measurement
Conclusion:
Calibration error cannot be corrected by the countries during foreseen enhancement exercise,
need corrections in the future by SPs.
Commission error is high, still may be corrected by the country, but need significant efforts.
International LCLUC Regional Science Meeting in Central Europe
16-17.10.2014 Sopron, Hungary

21 21
Degree of Imperviousness 2012
GIO IMD 2012 Hungary Value Ha %
Non impervious areas 0 8 783 173 94.43%
Imperviousness 1-9% 1-9 354 0.00%
Imperviousness 10-29% 10-29 4 208 0.05%
Imperviousness 30-100% 30-100 457 955 4.92%
Unclassifiable 254 11 479 0.12%
No data 255 43 944 0.47%
Sum 9 301 112 100.00%
Real sealing 373 396 4.01%
Look&feel results (12+13
strata, 247 sample sites):
Commission: Insufficient
Omission: Good
Average: Acceptable
Statistical verification results (2x280 samples):
Commission: 34,29% ± 2,84%
Omission: 1,42% ± 1,00%
Commission+ (100x100m): 43,71% ± 4,04%
International LCLUC Regional Science Meeting in Central Europe
16-17.10.2014 Sopron, Hungary
Result of enhancement:
Commission corrected: 9,8%
Omitted area added: 0,1%

22 22
GIO TCD 2012 Hungary Value Ha %
No tree cover 0 7 190 750 77.31%
Tree cover 1-9% 1-9 16 451 0.18%
Tree cover 10-29% 10-29 72 502 0.78%
Tree cover 30-100% 30-100 1 907 441 20.51%
Unclassifiable 254 113 958 1.23%
No data 255 9 0.00%
Sum 9 301 112 100.00%
Real tree cover 1 385 186 14.89%
Look&feel results (12+13
strata, 247 sample sites):
Commission: Insufficient
Omission: Good
Average: Acceptable
Statistical verification results (2x280 samples):
Commission: 5,71% ± 1,39%
Omission: 10,20% ± 2,09%
Result of enhancement:
Commission corrected: 12,3%
Omitted area added: 0,4%
Tree Cover Density 2012
International LCLUC Regional Science Meeting in Central Europe
16-17.10.2014 Sopron, Hungary

23 European Level Land Use/Cover mapping activities
Imperviousness temporal composit
2012, 2009, 2006 RGB
Digital Orto-photo database of Hungary

24 International LCLUC Regional Science Meeting in Central Europe
16-17.10.2014 Sopron, Hungary
Reference imagery date: 2005 Reference imagery date: 2010
Example A1.1 The largest polygon of IMD increase in Hungary: New settlement area in Dunakeszi (NE
Budapest). Justified
Reference imagery date: 2006 Reference imagery date: 2009
Example A2.1 The largest polygon of IMD increase in Europe: Berlin Schönefeld airport Justified
Examples of justified
changes in
imperviousness

25 International LCLUC Regional Science Meeting in Central Europe
16-17.10.2014 Sopron, Hungary
Reference imagery date: 2005 Reference imagery date: 2010
Example A1.5 IMD decrease in Hungary: Residential area in Budapest Not justified
Reference imagery date: 2006 Reference imagery date: 2011
Example A2.6 IMD decrease in Germany (North of Karlsruhe) Contruction site changed to football fields. Not
justified
Examples for false
signals of
imperviousness
changes

26 26
Thank you for your attention!
Contact:
Gergely Maucha
head, Environmental Applications of Remote Sensing
Institute of Geodesy, Cartography and Remote Sensing (FÖMI)
H-1149 Budapest, Bosnyák tér 5.
tel: +36 1 460 4176
mobile: +36 30 241-8096
e-mail: [email protected]
www.fomi.hu
International LCLUC Regional Science Meeting in Central Europe
16-17.10.2014 Sopron, Hungary