Embed Size (px)
Citation preview
Analytica Chimica Acta 554 (2005) 113–122
Validation of a dynamic ammonium extraction technique for thedetermination of15N at enriched abundances
Cristina Diaconu∗, Natacha Brion, Marc Elskens, Willy BaeyensVrije Universiteit Brussel, Laboratory of Analytical and Environmental Chemistry, Pleinlaan 2, 1050 Brussels, Belgium
Received 4 July 2005; accepted 8 August 2005Available online 10 October 2005
Abstract
A diffusion method for extracting ammonium from marine, estuarine and fresh waters for15N/14N isotopic ratio determinations at enrichedlevel was developed and validated. The method is based on the conversion of NH4
+ to NH3 gas under alkaline conditions, diffusion of NH3 out ofthe solution to the headspace, NH3 trapping on an acidified GF/D glass fiber filter, and subsequent15N/14N isotope ratio determination with massspectrometry. The diffusion period necessary to extract sufficient N in order to accurately measure the atom%15N was reduced to less than 15 hby bubbling the sample with a carrier gas (Air) at room temperature. The technique uses 250 mL sample volume and enables accurate atom%15N
mancetoyl (CRM:ral water
phs
thephy-ms.
uxes
n ofpen-ighly
on of
gh toHg
curyith
measurements in NH4+ pools as small as 1.25�M. A standard operating procedure for ammonium extraction is given involving method perforcriteria, such as accuracy, precision, detection limit, quantification limit and robustness. The efficiency of the NH4
+ extraction ranged from 40100%. The quantification limit of the method was estimated at around 0.26�mol% N, for an initial15N abundance of∼1%. The within-laboratorreproducibility amounted to 0.03 atom%15N. It was shown that the recovery rate obtained after extraction of the certified reference materiaIAEA-311) solution falls within the 95% confidence interval of the certified values. By applying the developed method to fortified natusamples of different conductivities, the atom%15N determinations were precise and accurate forα = 1–5%.© 2005 Elsevier B.V. All rights reserved.
Keywords: 15N; Ammonium; Diffusion; Method; Mass spectrometry
1. Introduction
Nitrogen exists in many forms and oxidation states in aquaticecosystems, but ammonium (NH4
+) has been regarded as a keyintermediate in the marine nitrogen cycle[1]. As a highly labilenitrogen compound, ammonium rarely accumulates in theaquatic ecosystems, but comprises a relatively small pool withrapid turnover rates. Processes like uptake, remineralization,nitrification and transport determine the concentration anddistribution of ammonium in a given location. Ammoniumrepresents a major nitrogen source in sustaining phytoplanktongrowth [2–7], as well as the sole energy-yielding substratefor ammonium-oxidizing bacteria[8]. Ammonium is thefirst and most reduced nitrogenous end product resultingfrom complete degradation of organic material (ammoni-fication process). Generally, ammonium is made availableto phytoplankton through direct excretion by zooplank-
∗ Corresponding author. Tel.: +32 2 629 39 68; fax: +32 2 629 32 74.E-mail address: [email protected] (C. Diaconu).
ton or degradation of organic matter by microheterotro[1,6].
Providing quantitative information on the dynamics ofammonium regeneration flux is essential for understandingtoplankton nutrition and nitrogen cycling in aquatic ecosyste
Our present knowledge of ammonium regeneration flis largely based on studies using15N tracer techniques[9].An essential step in this technique is the complete isolatioammonium from the aqueous phase with a minimum exditure of time, labour and hazardous chemicals and a hdiminished risk of contamination[10].
Several methods have been published for the extractidissolved ammonium for15N tracer studies in water[11,12]andsoil [13]. However, these methods should be sensitive enouallow accurate analysis of the often very small pools of N4
+
found in small samples[14]. Previous methods for isolatinammonium from aqueous samples prior to15N isotope ratioanalysis included:
1. The extraction of ammonium by precipitation as a mercompound[15] and by complexation in combination w
0003-2670/$ – see front matter © 2005 Elsevier B.V. All rights reserved.doi:10.1016/j.aca.2005.08.028
114 C. Diaconu et al. / Analytica Chimica Acta 554 (2005) 113–122
Nomenclature
Ninitial (�M) the initial ammonium concentration in theextraction solution
N (�mol) N quantity trapped on filterE (%) efficiency of ammonium extractiont (h) diffusion timeNsample(�mol) the gross N content on the filterNblk (�mol) the mean N content of all the analytical
blanksatom15N %net the net atom%15N value of the N on the
filter (after blank correction)atom15N %sample the gross atom%15N value of the N on
the filter corrected for truenessatom15N %blk the mean atom%15N value obtained for
all the analytical blanksDL (�mol%) detection limitQL (�mol%) quantification limitCRM = IAEA-311 2.05% (15NH4)2SO4 with
C.I. = 2.03–2.06%95% C.I. 95% confidence limits of the certified valueσ2
Nnet·15N %netthe variance on Nnet·15N %net
n number of extraction experimentssWR the within-laboratory reproducibility
solvent extraction to form the indophenol blue complex[16]or with solid phase extraction[17].
2. The cation exchange resin-based method for the extractioof ammonium from freshwater samples for on-line N-isotoperatio determination[18].
3. The distillation techniques: steam distillation[19,13], directdistillation[20,21]and distillation in combination with evap-oration[11] or microdiffusion[22].
4. The diffusion procedures from Kjeldahl digests[23,24], soilextracts[25,26]and water samples[27–29].
The most popular techniques in recent years are the diffusiotechniques. The advantages of the diffusion techniques ovethe other procedures include: (1) simplified sample preparationas they require less operator skill and time[30]; (2) no cross-contamination between samples during the diffusion procedureas disposable containers can be used.
The fundamental principles of the diffusion techniques, asoutlined by Conway[31] are the following:
(1) Diffusion rates increase with increased pH, increased temperature, reduced depth of the sample solution, increasesurface area of the sample solution and increased ionistrength of specific ions (e.g. K+, Na+, CO3
2−, OH−) inthe sample solution.
(2) The rate-limiting processes in a diffusion system are moveent
( heany
The diffusion techniques have advantages and drawbacks thatmust be weighed in experimental applications with differentsample species and sizes. However, a universal precaution thatneeds underscoring is the strict control of isotope fractionation,which could lead to the overestimation of the15N isotope dilu-tion and corresponding biological mineralization. Therefore, thepresent diffusion methods require the complete separation ofammonium from the aqueous phase in which it occurs (soilextracts, water sample), since isotope fractionation has beenreported for N recovery less than 100%. This is often achievedby treating the sample with MgO or KOH to convert ammo-nium ion (NH4
+) to NH3 (with or without addition of Devarda’salloy to reduce NO3− and NO2
− to NH4+, and sulfamic acid to
destroy NO2−), followed by the NH3 diffusion into an acidified
trap. The acid traps used to collect NH3 during diffusion experi-ments consisted of vials of concentrated H2SO4, HCl or H3BO3[32,23], capsules of acid-washed zeolite[26] or filter disks acid-ified with KHSO4, H2SO4 or H3BO3 and suspended on stainlesssteel wire above the sample[25,33–37]or sealed inside Teflontape for placement within the sample[38,37,27,28]. Diffusionprocedures have been carried out in a variety of vessels, includ-ing glass digestion tubes[32], plastic specimen containers[25]and screw-cap bottles or canning jars[34]. An especially usefuloption is to carry out diffusions with gentle heating on a hotplate, which dramatically reduces the diffusion period[39], butthis option cannot be used with a plastic specimen container.
o Ng oxi-d stioni MSi salta
andee d byNo ,w thodi s anda ch-n , andt rogenc
2
2
con-v H1 fol-lg -s imizet arrierg
ment of NH3 through the liquid sample and movemacross the gaseous layer above the sample.
3) Diffusion analysis of15N samples is complicated by tsensitivity of the isotope technique to contamination orprocess that causes isotopic fractionation[30].
n
nr,
,
-dc
-
Next, the isolated and trapped ammonium is oxidized int2as, which is finally isotopically analyzed using IRMS. Theation is performed either through high-temperature combu
n an elemental analyzer (EA) connected in-line with the IRnstrument or by Rittenberg oxidation of the ammoniumfter evaporation as an off-line preparation step.
In this paper, we developed and validated a simplefficient diffusion method for the extraction of15N-NH4
+ atnriched level from water samples currently characterizeH4
+ concentrations down to 1.25�M, within a short periodf time (5–24 h), and its subsequent atom%15N determinationhile avoiding measurable isotopic fractionation. The me
nvolves a minimum amount of labour, hazardous chemicalgreatly diminished risk of contamination. This analytical teique is applicable to a wide range of aquatic ecosystems
herefore represents an important advance in evaluating nitycle in natural marine and freshwater bodies.
. Materials and methods
.1. Description of the ammonium extraction experiment
The ammonium extraction technique is based on theersion of NH4
+ to NH3 gas under alkaline conditions (p3), diffusion of NH3 out of the solution to the headspace,
owed by the NH3 trapping on an acidified (2.5 M KHSO4) GF/Dlass fiber filter, and its subsequent15N/14N isotope ratio masspectrometric analysis. To speed up the procedure and maxhe extraction efficiency, the sample is degassed with air cas through a flow regulating system.
C. Diaconu et al. / Analytica Chimica Acta 554 (2005) 113–122 115
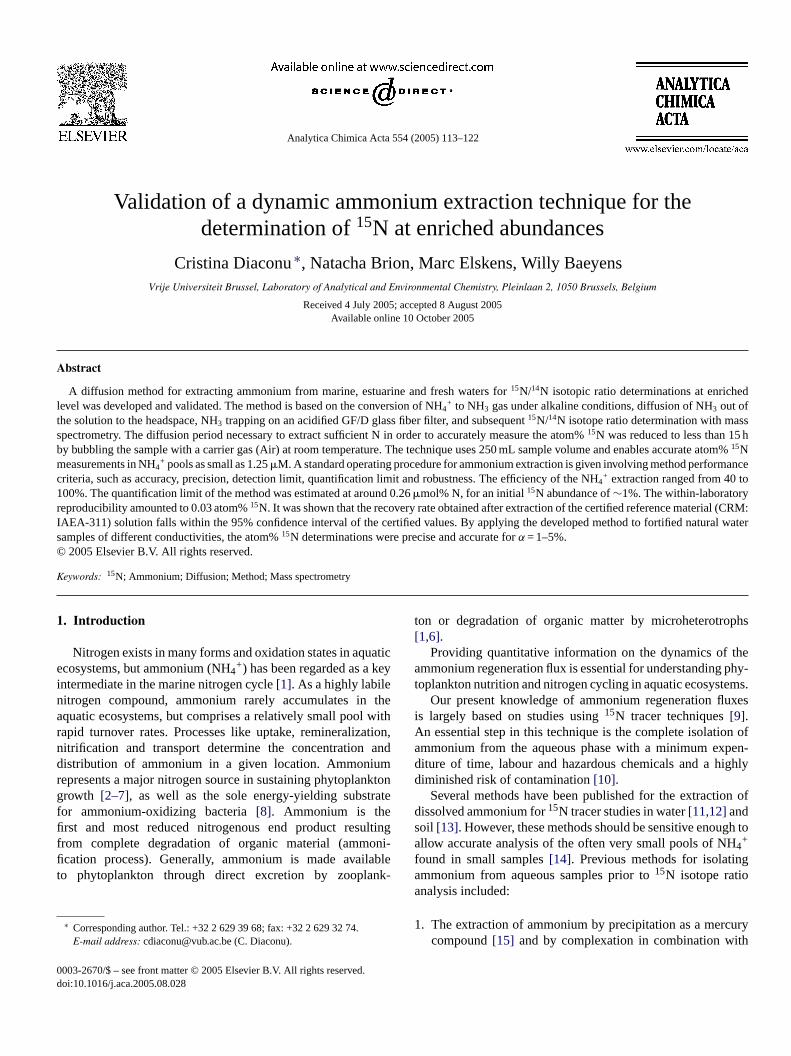
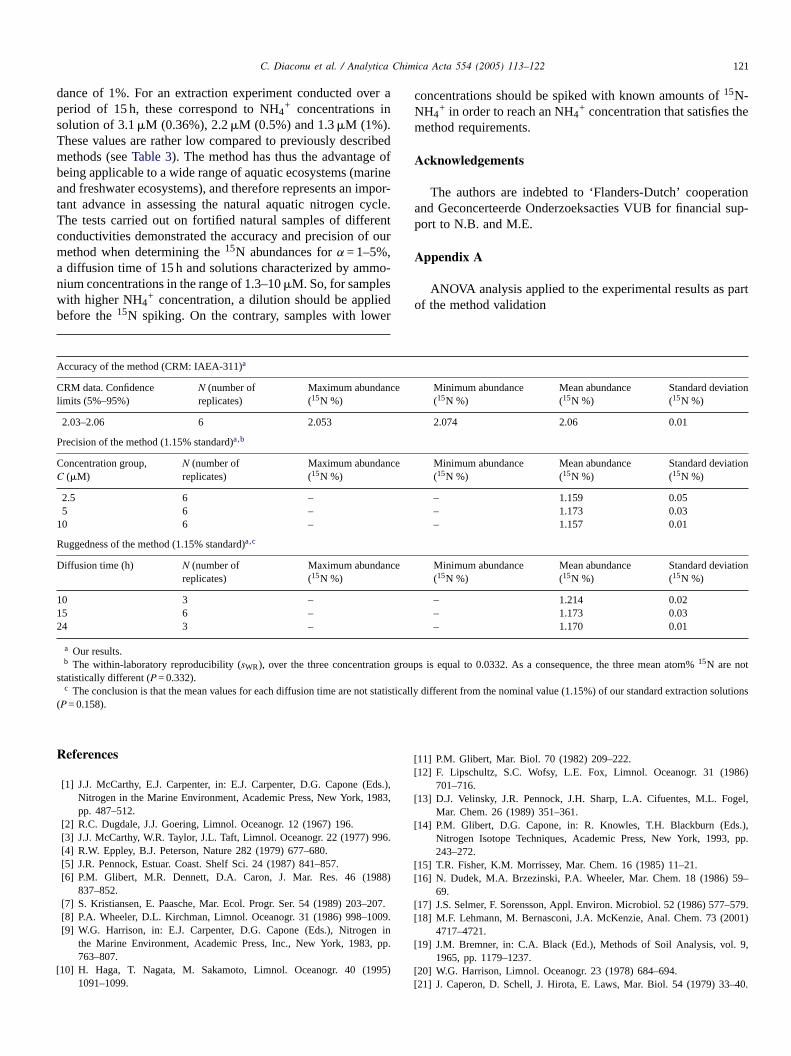
Fig. 1. Schematic representation of the ammonium extraction device: (1) flowregulator-meter system with floater connected to a pure air gas bottle; (2) siliconetubes connecting the flow regulating system to the gas-inlet of the diffusionbottle; (3) NH4
+ diffusion bottle; (4) stainless steel in-line filter holder withan acidified GF/D filter (25 mm, glass fibre) connected to the gas-outlet of thediffusion bottles.
The NH4+ extraction device is presented inFig. 1and consists
of one air (respirable air) gas bottle connected to a flow regu-lator system (Aalborg 150 mm tube, 3079 mL/min air; floaterin sapphire + stainless steel flow regulator valve + stainless steelmanifold four tubes holder system) allowing the parallel distri-bution of gas at four outlets with the same flow. Each outlet isconnected with silicone tubes to the inlet of a glass diffusion vessel. The diffusion vessel consists of 350 mL gas-wash bottle witha glass filter plate bottom allowing air bubbling (Schott Durangas-wash glass bottles, 350 mL). The gas outlet of each bottlis connected with silicone tubes to a 25 mm diameter stainlessteel in-line filter holder (Gelman Laboratory, 25 mm diameter),holding each a 25 mm acidified GF/D glass fibre filter (What-man). To avoid any ammonia gas loss out of the system duringthe diffusion procedure, PTFE (Teflon) tape is wrapped aroundall connections.
The general extraction procedure is as follows:All material used for the extraction is first decontaminated
with 5% H2SO4 solution and rinsed with ultrapure deionizedwater. The GF/D glass fibre filters are decontaminated by heatinat 450◦C during 8 h.
A known volume (250 mL) of sample is put in every extrac-tion vessel and alkalinized with the addition of 1.25 mL of 80%KOH (pH is raised up to 13). Immediately, the diffusion bottlesare closed hermetically. Compressed pure air is then injectefrom the (air) gas bottle into the flow controller and distributedw oure s-fibdt heretKt r isp8 eu ete( tra-
tion is also measured in the remaining solution according to theindophenol blue complexation method[40]. The standards areprepared at the same pH as the extracted solution.
2.2. Performed extraction experiments
1. Blank extraction experiments: Analytical blanks, using ultra-pure deionized distilled water as diffusion solution and con-taining all reagents, were processed in the same way as thesamples, i.e. from sample pre-treatment up to the measure-ment. In this way, any N contamination occurring during theextraction experiment can be taken into account.
2. Effect of diffusion time: The impact of the diffusion time onthe extraction efficiency and on the15N abundance measure-ment was assessed. Extraction experiments were performedin triplicate for each time period (5, 10, 15 and 24 h) using250 mL of 5�M, 1.15%15NH4
+ enriched standard solutions.3. Effect of NH4
+ concentration: A series of15NH4+ extraction
experiments were performed in order to assess the effect ofNH4
+ concentration on the extraction efficiency and on the15N abundance determination. For this purpose, six repli-cates of 250 mL15NH4
+ standard solutions were prepared,and subsequently submitted to diffusion for 15 h at room tem-perature. The ammonium concentration was 0.63, 1.25, 2.5,5.0, 8.5 and 10�M and the15N abundance was 1.15%.
4. Diffusion on certified reference material: To test the accu-cate
12 g11,n
5idifi-
per-Os
O
om
6 vel-waterThe
ctiv-
r torigi-etion
ary)mL)f
ith equal flows (1210 mL/min) to the gas inlets of the fxtraction vessels. The air passes through the porous glasisc, bubbles in the solution and entrains the dissolved NH3 out
o the headspace and further towards the acidified filter. The NH3 gas reacts with the acidic solution (50�L of 2.5 MHSO4 or 30�L of 4 M H2SO4) to form (NH4)2SO4 salt that is
rapped on the filter. After the diffusion experiment, the filtelaced in a clean plastic Petri dish, dried in an oven at 50◦C forh and analysed for its N-content and atom%15N abundancsing an Elemental Analyzer-Isotope Ratio Mass SpectromEA-IRMS) system (see details below). Ammonium concen
-
es
g
d
er
,
r
racy of the ammonium extraction technique, six replidiffusions were performed on 250 mL of 8.52�M, 2.05%15NH4
+ enriched solutions prepared by dissolving 0.001of 2.05% certified reference material (CRM = IAEA-32.05% (15NH4)2SO4 with 95% C.I. = 2.03–2.06%) i2000 mL ultrapure deionized water.
. Effect of the trapping agent (2.5 M KHSO4 and 4 M H2SO4):To test the influence of the trapping agent used in the accation of the GF/D filters on the efficiency of NH4
+ extractionand on the15N abundance determination, two series of eximents were performed, respectively, with 2.5 M KHS4[41,37,42]and 4 M H2SO4 [22,35,27–29]. The experimentwere performed on six replicates of 250 mL of 5�M, 1.15%15NH4
+ enriched solutions for the test with 2.5 M KHS4and on eight replicates of 250 mL of 5�M, 1.15%15NH4
+
enriched solutions for the test with 4 M H2SO4. All 15NH4+-
enriched solutions were allowed to diffuse for 15 h at rotemperature.
. Extraction of fortified estuarine water samples: The deoped technique was tested on a series of estuarinesamples collected during a spring season (April 2003).sampling stations were selected by following a conduity gradient, with values ranging from 964 to 14,050�S/cm,in the Scheldt estuary (Belgium–The Netherlands). Prioextraction, the water samples were analysed for their onal ammonium concentration[40]. Dilutions of samples werthen performed to adjust the final ammonium concentraaround 10�M, prior to15N enrichment (seeTable 1). At eachstation, 1 L of water sample (previously diluted, if necesswere taken and spiked with different volumes (0.5–1of 100�M, 99% 15N-NH4
+ solution. Next, duplicates o
116 C. Diaconu et al. / Analytica Chimica Acta 554 (2005) 113–122
Table 1Dilutions performed on the estuarine water samples in order to reach ammonium concentrations of around 10�M prior to their submission to the extraction procedure
Conductivity (�S/cm) [NH4+]ambient(�M) Dilution factor [NH4
+]diluted (�M) Amount (mL) of spikea added
964 109 10 10.9 0.831166 106 8 13.3 0.841540 102 10 10.2 0.83610 60.2 5 12 1
10450 14.8 No dilution 14.8 114050 5.9 No dilution 5.9 0.5
a 100�M, 99%15NH4+.
250 mL of each sample were transferred to the extractionvessels and extracted for NH4
+ during 5 h at room tempera-ture.
For each performed experiment, we define the efficiency ofammonium extractionE (%) as:
E (%) = 100· Ntrapped
Ninitial(1)
2.3. Determination of N (µmol) content and atom% 15N ofthe NH4
+ recovered on the GF/D filter
A Thermo Finnigan delta + XL (continuous flow type) mass-spectrometer with standard set up for N2 gas, interfaced with aFlash Carlo Erba NA1500 C/N analyser via a Conflo III interfacewas used for performing the atom%15N and N quantity analysisof the ammonia recovered on the dried GF/D filters. Severalmeasures have been taken to prevent corrosion of the reductioncolumn, as well as background contamination due to the acidtrapping agent used on the GF/D filters:
(1) Ag capsules were used to fold the dried GF/D filters priorto the mass spectrometric analysis.
(2) Silver wool has been added to the reduction column to neu-tralize the sulphur oxides formed.
(3) Water and carbon traps were attached between the reductionbonetri
T wers
g thee nks( areda
m Np d byw mgo sm s wee er ta eter-m ert an Nc
Measured gross15N % of filter samples were first correctedfor the deviation between atom%15N abundance given by themachine and true atom%15N value. This was done by compar-ison to a calibration curve relating “measured machine” atom%15N with true atom%15N, using CRM’s of different abundances(IAEA-311 corresponding to 2.05% (15NH4)2SO4 and IAEA-N1 corresponding to 0.36% (NH4)2SO4). Finally, to determinethe 15N % of N recovered on GF/D filters after the extraction,the gross15N signal is corrected for the mean N content and15N% of all analytical blanks according to the isotope dilution law(Eq.(2)):
15N %net = Nsample· 15N %sample− Nblk · 15N %blk
Nsample− Nblk(2)
where Nsample is the the gross N (�mol) content on the fil-ter; Nblk the mean N (�mol) content of all the analyticalblanks = 0.14�mol (see below);15N %net the net atom%15Nvalue of the N on the filter (after blank correction);15N %sample
the gross atom%15N value of the N on the filter corrected fortrueness;15N %blk is the mean atom%15N value obtained forall the analytical blanks = 0.364% (see below).
3. Results
3.1. Blank extraction experiments
thed ers,o erea ts,p ionc sen-t
3
weendN yi 24 h,r than1 fu-s n then 10t .21%
column and the GC column to prevent moisture and carcompounds contamination during the mass spectromanalysis.
he temperatures of the reduction and combustion columnset at 1040 and 640◦C, respectively.
For each preparation cycle, a series of blanks includinmpty Ag capsules, acidified filter blanks and analytical blaobtained by extracting deionized distilled water) were prepnd used for blank corrections.
Gross N content of filter samples were determined froeak area by comparison to a calibration curve obtaineeighing appropriate quantities (0, 0.1, 0.2, 0.4 and 0.6f CRM IAEA-311 2.05% (15NH4)2SO4 using a Sartoriuicrobalance. The peak areas measured for the standardach corrected for the mean cup blank peak area in ordvoid influence of cup blanks on the N determination. To dine the quantity of N (�mol) recovered on GF/D filter aft
he extraction, the gross N content is corrected for the meontent of all analytical blanks.
-c
e
)
reo
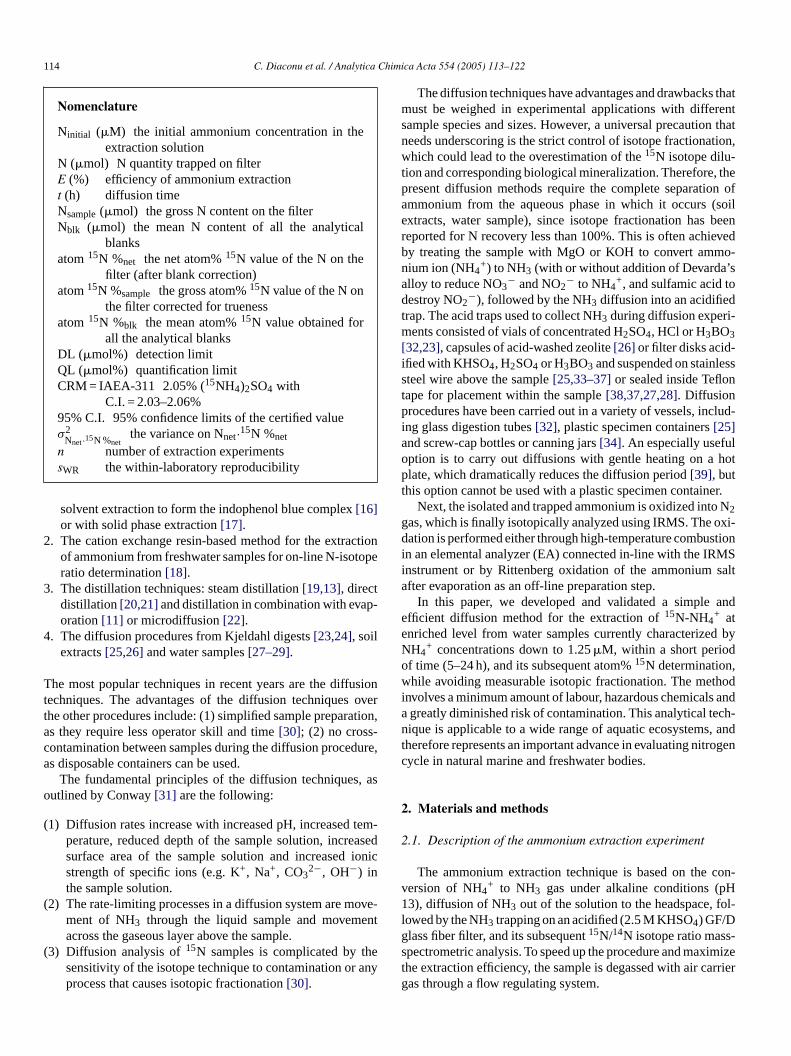
To account for the N contamination occurring duringiffusion procedure, the dried analytical blank GF/D filtbtained by extracting ultrapure deionized water (DDW) wnalyzed for the N amount and15N abundance. The resullotted inFig. 2A and B, indicate that possible N contaminatould lead to extreme values (outliers), which are not repreative for the rest of data.
.2. Effect of diffusion time
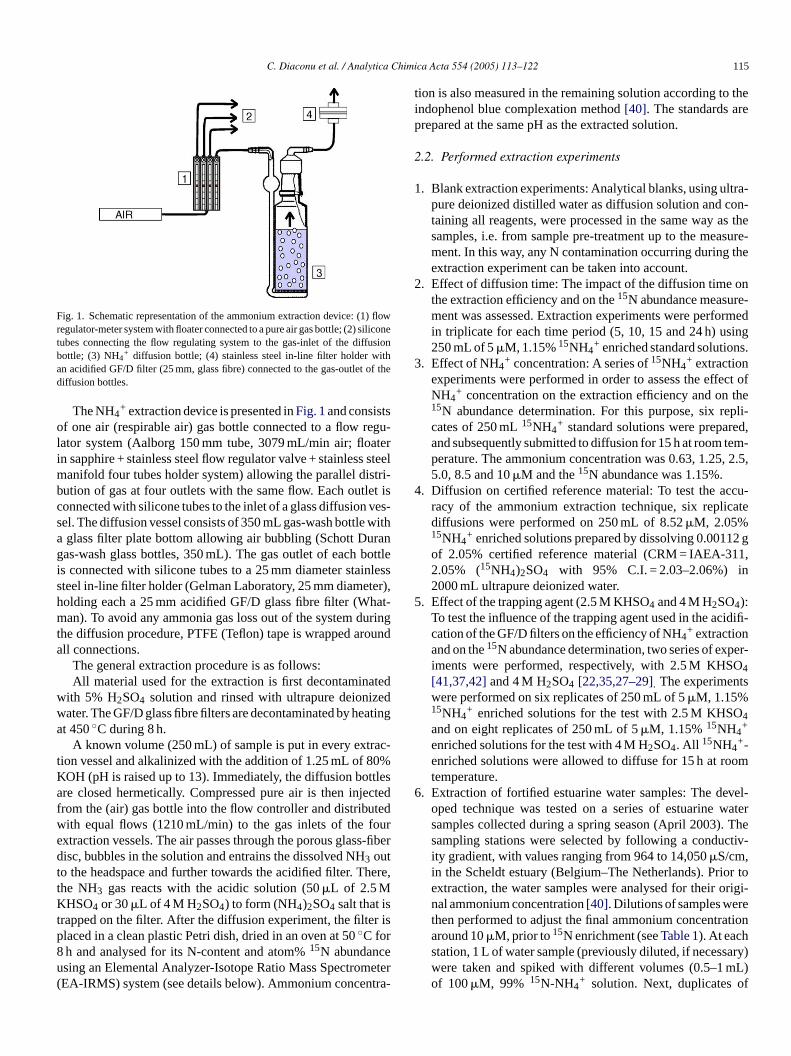
The results of the tests investigating the relationships betiffusion time, extraction efficiency and atom%15N of extractedH4
+ are plotted inFig. 3A and B. Extraction efficiencncreases from 40% (S.D. = 2) at 5 h to 112% (S.D. = 4) ateaching a plateau when diffusion was carried out for more5 h (Fig. 3A). The 15N abundance obtained after 5 h of difion averaged 1.27% (S.D. = 0.004), significantly higher thaominal value of 1.15%. As the diffusion time increased from
o 24 h, the mean values reached a plateau, ranging from 1
C. Diaconu et al. / Analytica Chimica Acta 554 (2005) 113–122 117
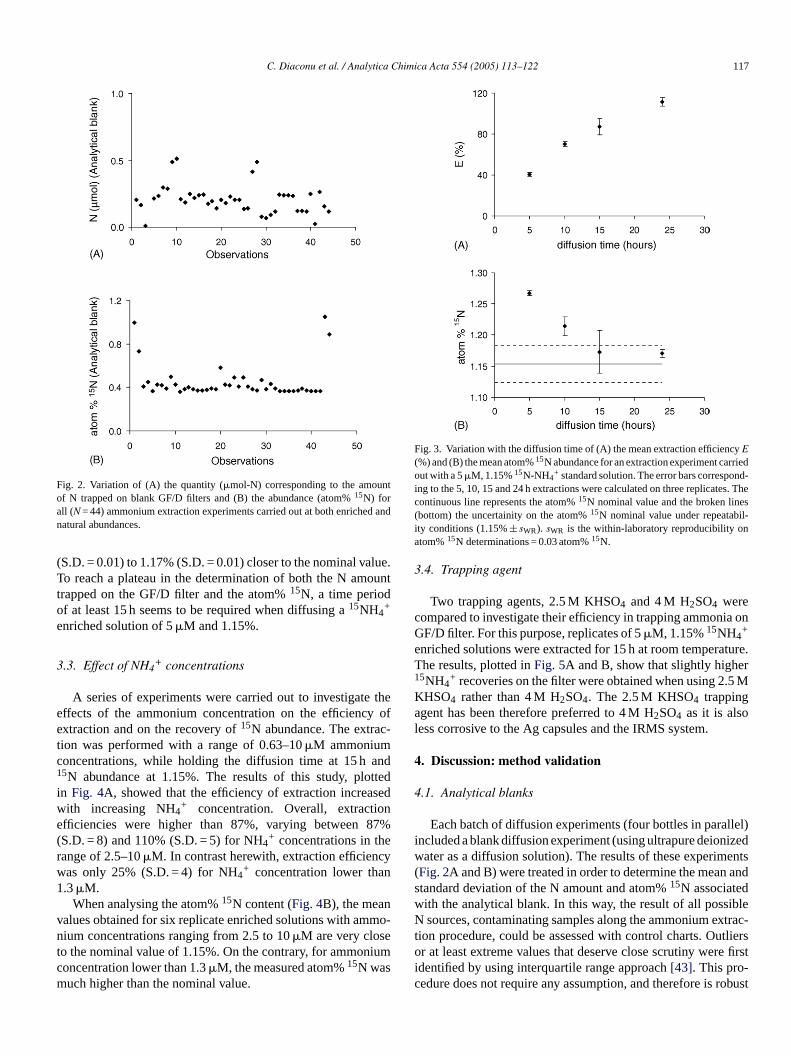
Fig. 2. Variation of (A) the quantity (�mol-N) corresponding to the amountof N trapped on blank GF/D filters and (B) the abundance (atom%15N) forall (N = 44) ammonium extraction experiments carried out at both enriched andnatural abundances.
(S.D. = 0.01) to 1.17% (S.D. = 0.01) closer to the nominal value.To reach a plateau in the determination of both the N amounttrapped on the GF/D filter and the atom%15N, a time periodof at least 15 h seems to be required when diffusing a15NH4
+
enriched solution of 5�M and 1.15%.
3.3. Effect of NH4+ concentrations
A series of experiments were carried out to investigate theeffects of the ammonium concentration on the efficiency ofextraction and on the recovery of15N abundance. The extrac-tion was performed with a range of 0.63–10�M ammoniumconcentrations, while holding the diffusion time at 15 h and15N abundance at 1.15%. The results of this study, plottedin Fig. 4A, showed that the efficiency of extraction increasedwith increasing NH4+ concentration. Overall, extractionefficiencies were higher than 87%, varying between 87%(S.D. = 8) and 110% (S.D. = 5) for NH4+ concentrations in therange of 2.5–10�M. In contrast herewith, extraction efficiencywas only 25% (S.D. = 4) for NH4+ concentration lower than1.3�M.
When analysing the atom%15N content (Fig. 4B), the meanvalues obtained for six replicate enriched solutions with ammo-nium concentrations ranging from 2.5 to 10�M are very closeto the nominal value of 1.15%. On the contrary, for ammoniumcm
Fig. 3. Variation with the diffusion time of (A) the mean extraction efficiencyE(%) and (B) the mean atom%15N abundance for an extraction experiment carriedout with a 5�M, 1.15%15N-NH4
+ standard solution. The error bars correspond-ing to the 5, 10, 15 and 24 h extractions were calculated on three replicates. Thecontinuous line represents the atom%15N nominal value and the broken lines(bottom) the uncertainity on the atom%15N nominal value under repeatabil-ity conditions (1.15%± sWR). sWR is the within-laboratory reproducibility onatom%15N determinations = 0.03 atom%15N.
3.4. Trapping agent
Two trapping agents, 2.5 M KHSO4 and 4 M H2SO4 werecompared to investigate their efficiency in trapping ammonia onGF/D filter. For this purpose, replicates of 5�M, 1.15%15NH4
+
enriched solutions were extracted for 15 h at room temperature.The results, plotted inFig. 5A and B, show that slightly higher15NH4
+ recoveries on the filter were obtained when using 2.5 MKHSO4 rather than 4 M H2SO4. The 2.5 M KHSO4 trappingagent has been therefore preferred to 4 M H2SO4 as it is alsoless corrosive to the Ag capsules and the IRMS system.
4. Discussion: method validation
4.1. Analytical blanks
Each batch of diffusion experiments (four bottles in parallel)included a blank diffusion experiment (using ultrapure deionizedwater as a diffusion solution). The results of these experiments(Fig. 2A and B) were treated in order to determine the mean andstandard deviation of the N amount and atom%15N associatedwith the analytical blank. In this way, the result of all possibleN sources, contaminating samples along the ammonium extrac-tion procedure, could be assessed with control charts. Outliersor at least extreme values that deserve close scrutiny were firstidentified by using interquartile range approach[43]. This pro-c robust
oncentration lower than 1.3�M, the measured atom%15N wasuch higher than the nominal value.
edure does not require any assumption, and therefore is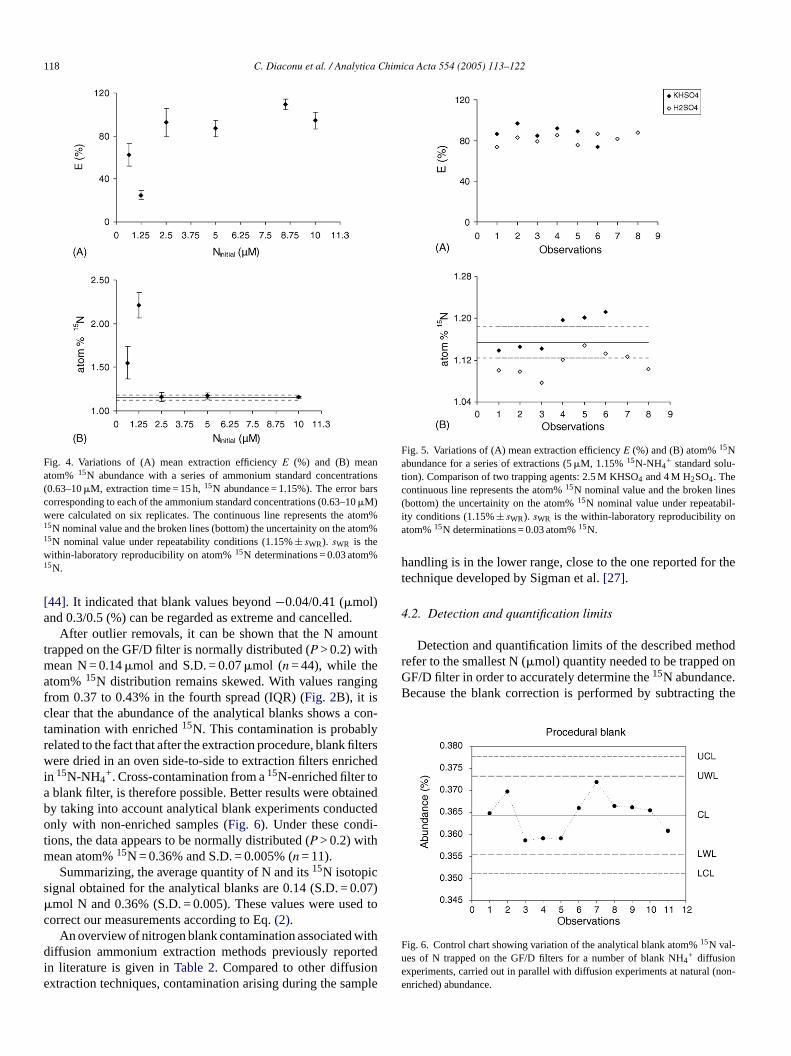
118 C. Diaconu et al. / Analytica Chimica Acta 554 (2005) 113–122
Fig. 4. Variations of (A) mean extraction efficiencyE (%) and (B) meanatom% 15N abundance with a series of ammonium standard concentrations(0.63–10�M, extraction time = 15 h,15N abundance = 1.15%). The error barscorresponding to each of the ammonium standard concentrations (0.63–10�M)were calculated on six replicates. The continuous line represents the atom%15N nominal value and the broken lines (bottom) the uncertainity on the atom%15N nominal value under repeatability conditions (1.15%± sWR). sWR is thewithin-laboratory reproducibility on atom%15N determinations = 0.03 atom%15N.
[44]. It indicated that blank values beyond−0.04/0.41 (�mol)and 0.3/0.5 (%) can be regarded as extreme and cancelled.
After outlier removals, it can be shown that the N amounttrapped on the GF/D filter is normally distributed (P > 0.2) withmean N = 0.14�mol and S.D. = 0.07�mol (n = 44), while theatom%15N distribution remains skewed. With values rangingfrom 0.37 to 0.43% in the fourth spread (IQR) (Fig. 2B), it isclear that the abundance of the analytical blanks shows a con-tamination with enriched15N. This contamination is probablyrelated to the fact that after the extraction procedure, blank filterswere dried in an oven side-to-side to extraction filters enrichedin 15N-NH4
+. Cross-contamination from a15N-enriched filter toa blank filter, is therefore possible. Better results were obtainedby taking into account analytical blank experiments conductedonly with non-enriched samples (Fig. 6). Under these condi-tions, the data appears to be normally distributed (P > 0.2) withmean atom%15N = 0.36% and S.D. = 0.005% (n = 11).
Summarizing, the average quantity of N and its15N isotopicsignal obtained for the analytical blanks are 0.14 (S.D. = 0.07)�mol N and 0.36% (S.D. = 0.005). These values were used tocorrect our measurements according to Eq.(2).
An overview of nitrogen blank contamination associated withdiffusion ammonium extraction methods previously reportedin literature is given inTable 2. Compared to other diffusionextraction techniques, contamination arising during the sampl
Fig. 5. Variations of (A) mean extraction efficiencyE (%) and (B) atom%15Nabundance for a series of extractions (5�M, 1.15%15N-NH4
+ standard solu-tion). Comparison of two trapping agents: 2.5 M KHSO4 and 4 M H2SO4. Thecontinuous line represents the atom%15N nominal value and the broken lines(bottom) the uncertainity on the atom%15N nominal value under repeatabil-ity conditions (1.15%± sWR). sWR is the within-laboratory reproducibility onatom%15N determinations = 0.03 atom%15N.
handling is in the lower range, close to the one reported for thetechnique developed by Sigman et al.[27].
4.2. Detection and quantification limits
Detection and quantification limits of the described methodrefer to the smallest N (�mol) quantity needed to be trapped onGF/D filter in order to accurately determine the15N abundance.Because the blank correction is performed by subtracting the
Fig. 6. Control chart showing variation of the analytical blank atom%15N val-ues of N trapped on the GF/D filters for a number of blank NH4
+ diffusione (non-e
experiments, carried out in parallel with diffusion experiments at naturalnriched) abundance.
C. Diaconu et al. / Analytica Chimica Acta 554 (2005) 113–122 119
Table 2Overview of the nitrogen blank contamination associated with ammoniumextraction methods previously reported in literature
Reference Sample type Reported N blankfor 250 mLsample (�mol)
This work (2005) DDW 0.14Kristiansen and Paasche[7] Coastal, oceanic
water0.12
Sorensen and Jensen[38] 2 M KCl solution 0.28Lory and Russelle[35] Kjeldahl digest 2.3Sigman et al.[27] Seawater 0.1Holmes et al.[28] DDW 0.01
mean ofn blank determinations, the variance on Nnet·15N %netis:
σ2Nnet·15N %net
=σ2
Nsample·15N %sample+ σ2
Nblk·15N %blk
n(3)
whereσ2is the variance andn is the number of blank experi-ments.
If the standard deviation is independent of the quantity(homoscedasticity):
σNnet·15N %net= σNblk·15N %blk
·√
n + 1
n
= Nblk · 15N %blk ·√√√√n + 1
n·((
σNblk
Nblk
)2
+(
σ15N %blk15N %blk
)2)
(4)
When the sample does not contain the analyte, Nsample·15N%sample= Nblk·15N %blk and their difference follows a normaldistribution with a population mean of zero and a standard devi-ation:
σ0 = σNblk·15N %blk
√n + 1
n(5)
For blank corrected measurements, detection (DL) and quan-t
D
Q
IQ ma ita-tw ,0 ela dlia at tha tiono hats
Table 3Minimum N (�M) quantities necessary to be present in the original extractionsolution, as reported by different ammonium extraction methods
Reference Range of15N %abundances
Minimum N quan-tity required (�M)
This work (2005) 1% 1.3�M in solutionThis work (2005) 0.5% 2.2�M in solutionThis work (2005) 0.36% 3.1�M in solutionBrooks et al.[25] – 28.6�M in solutionLiu and Mulvaney[33] 0.5% 14.3�M N in soil
extractHolmes et al.[28] Up to 100‰ 5�M in solutionSigman et al.[27] 0.36% 5�M in solutionSebilo et al.[29] 0.3–39.6‰ 14.3�M in solution
2.2�M (0.5%) and 1.3�M (1%) will be suitable for extractionwith the developed technique. Compared to other techniques(seeTable 3) the developed method proved to be quite sensitiveas concentrations down to 1.3�M can be extracted successfully.
4.3. Precision study
We have estimated the within-laboratory reproducibility andrepeatability in a single experiment set-up using ANOVA anal-ysis[43]. For this purpose, we used the data from the extractionof enriched15NH4
+ solutions with concentration in the range of2.5–10�M.
ANOVA table (seeAppendix A) indicates that the differ-ences in the mean values among the concentration groups arenot statistically significant (P = 0.332). ANOVA table learns alsothat the residual mean squares, which can be termed here themean squares within days is 0.00107. This represents a standarddeviationsr of 0.03% under repeatability conditions. Moreover,according to Eq.(8), the within-laboratory reproducibilitysWRwas estimated at around 0.03 atom%15N:
sWR =√
s2r + s2
between
s2between=
MSbetween− MSwithin
N
(8)
wheresWRis the within-laboratory reproducibility = 0.03 atom%1 ndi-t on-c on-c ind ntsc
4
inge fer-et eA ined( dis-t %)a lls
ification (QL) limits (�mol%) are then given by IUPAC[45]:
L = 2 · tn−1,95% · σ0 + 3.3 · σ0 (n > 30) (6)
L = 6 · tn−1,95% · σ0 + 10 · σ0 (n > 30) (7)
n our case, σ0 = 0.37, and thus DL = 0.09�mol% andL = 0.26�mol%. These results imply that the minimumounts of nitrogen trapped on GF/D filter for quant
ive atom%15N determinations should be around 0.71�molhen working at the natural background level (∼0.365%).50�mol when working at∼0.5% enriched background levnd 0.29�mol when working at∼1% enriched backgroun
evel. This amount decreases drastically to less than 0.07�moln tracer enrichment and dilution experiments, where initial15Nbundance should range between 5 and 10%. Knowing thverage efficiency of extraction is around 90% for 15 h extracf 250 mL solutions (Fig. 3A), we can reasonably estimate tamples with NH4+ concentrations down to 3.1�M (0.36%),
e
5N; sr the standard deviation under repeatability coions = 0.030%;sbetween the standard deviation between centration groups, MSbetweenthe mean squares between centration groups days, MSwithin the mean squares withays = 0.00107 andN is the number of extraction experimearried out within a concentration group.
.4. Accuracy study
Accuracy of the method was first tested by performxtraction with enriched solutions prepared from certified rence material IAEA-311 (2.05% (15NH4)2SO4). According to
he BCR [1986] recommendations[46], we verified that (seppendix A) (1) the standard error of the mean we obta
S.E. = 0.003%) is less than the standard deviation of theribution of certifying laboratory mean values (S.D. = 0.008nd (2) the mean atom%15N value we obtained (2.06%) fa
120 C. Diaconu et al. / Analytica Chimica Acta 554 (2005) 113–122
Table 4Extraction experiments carried out on IAEA-311 (CRM) NH4
+ solutions, spiked standard NH4+ solutions and spiked natural samples to test the accuracy of the
method
Type sample Nintial (�M) Ntrapped(�mol)(mean± S.D.)
Remark E (%)(mean± S.D.)
15Ninitial % 15Nfinal %(mean± sWR)
Status
CRM (IAEA-311) 8.5 2.3± 0.1 >QL 110± 5 2.05 2.06± 0.03 Unbiased
Spiked standard solutions 0.63 0.10± 0.02 <QL 62± 11 1.15 1.55± 0.03 Biased1.3 0.10± 0.01 <QL 25± 4 1.15 2.21± 0.03 Biased2.5 0.6± 0.1 >QL 93± 13 1.15 1.16± 0.03 Unbiased5 1.1± 0.1 >QL 87± 8 1.15 1.17± 0.03 Unbiased
10 2.4± 0.2 >QL 94± 8 1.15 1.16± 0.03 Unbiased
Spiked natural samplesConductivity (�S/cm)
964 11 1.6± 0.1 >QL 53± 5 1.11 1.10± 0.03 Unbiased1166 13 1± 0 >QL 27± 0 0.99 1.38± 0.03 Unbiased1540 10 1.4± 0 >QL 49± 1 1.13 1.15± 0.03 Unbiased10450 15 2.2± 0.3 >QL 54± 8 1.03 1.04± 0.03 Unbiased14050 6 1.1± 0 >QL 62± 3 1.20 1.16± 0.03 Unbiased
15N abundance after extraction is compared to initial15N abundance of the solution witht-tests. Ninitial (�M) is the initial NH4+ concentration, Ntrapped(�mol) the
N trapped on the filter after extraction,E (%) the efficiency of extraction,15Ninitial% the initial atom%15N in the solution and15Nfinal % is the final atom%15Nobtained after extraction. The quantification limit (QL) is 0.14�mol.
within the 95% confidence limits of the certified value, which is2.03–2.06%. Under the experimental conditions of the extraction(15 h diffusion) and for a restricted concentration range (8.5�Mof (15NH4)2SO4 at 2.05%), our method fulfils, therefore, theBCR requirements (seeTable 4). Being limited by the CRMavailability, we then treated the results obtained with spikedstandard solutions over a wide range of NH4
+ concentrations(0.63–10�M). Herein, the accuracy was tested by comparingthe mean obtained for the final atom%15N with the nominalvalue of the standard solution (1.15%) by means oft-tests andunder repeatability conditions. Results are shown inTable 4.Overall, it can be concluded that there are no significant differ-ences between the measured and nominal values except whenthe ammonium concentration is lower than 1.3�M, i.e. whenthe N trapped on the filter is lower than the quantification limit(see previous section).
Similar test was finally carried out on spiked natural samplesalso called fortified samples.Table 4indicated that for a levelof significance of 1%, the15N isotope ratio determinations wereall satisfactory. There is not a statistically significant differencebetween the nominal and measured atom%15N values, provingthat the developed method can be successfully applied to naturalwater samples.
4.5. Ruggedness study
udea ofO achf minal ablel iche fromF nec ete
mine the effect on a response between those two levels. FromAppendix A it can be concluded that there are not significantdifferences (P = 0.158) between the nominal value of the stan-dardized solution (1.15%) and the measurements for extractiontime ranging from 10 to 24 h and initial concentration higherthan 2.5�M. This proves that the developed method is robustwhen applied under the described conditions.
5. Conclusions
To conclude, the ammonium extraction technique herebydeveloped uses a standardized, simple and relatively cheapexperimental setup (diffusion bottles, flow regulators, filter hold-ers, glass-fibre filters and compressed air bottles). More impor-tantly, it ensures a full control of the extraction process bymonitoring the final NH4+ concentration in solution and theamount of N trapped on the filter, at the end of the diffusionexperiment. The ammonium extraction experiments are suc-cessfully conducted at room temperature, by using a small andconstant sample volume (250 mL) and extraction times’ notexceeding 15 h. This is an advantage to previously describedmethods that often used much longer diffusion times. For exam-ple, in the diffusion method of Brooks et al.[25], quantitativerecovery of NH4
+ from KCl solutions containing between 80and 800�g N was obtained by diffusing for 6 days, at roomt n eta rall,t %.A holep sure-m r of0o ed ,0 -
The term ruggedness or robustness was introduced by Yond Steiner[47] into analytical chemistry. The Associationfficial Analytical Chemists (AOAC) recommends that for e
actor one defines a nominal and an extreme level. The noevel is the level given in the procedure or the most probevel of an implicit factor, the extreme level is the one, whxceptionally might be attained in practice. For instance,ig. 3, the nominal level for the diffusion time being 15 h, oould consider that the extreme are 10 and 24 h and try to d
n
l
r-
emperature. In the diffusion method developed by Sigmal. [27], samples were incubated for 4 days or longer. Ove
he efficiency of the NH4+ extraction ranged from 40 to 100nalytical blanks, which have been taken through the wrocedure from the sample pre-treatment up to the meaent, yielded a mean N quantity trapped on the GF/D filte.14�mol (S.D. = 0.07�mol; n = 44) and a mean atom%15Nf 0.364% (S.D. = 0.004%;n = 11). The detection limits of theveloped method are of 0.7�mol for an abundance of 0.36%.5�mol for an abundance of 0.5% and 0.3�mol for an abun
C. Diaconu et al. / Analytica Chimica Acta 554 (2005) 113–122 121
dance of 1%. For an extraction experiment conducted over aperiod of 15 h, these correspond to NH4
+ concentrations insolution of 3.1�M (0.36%), 2.2�M (0.5%) and 1.3�M (1%).These values are rather low compared to previously describedmethods (seeTable 3). The method has thus the advantage ofbeing applicable to a wide range of aquatic ecosystems (marineand freshwater ecosystems), and therefore represents an impor-tant advance in assessing the natural aquatic nitrogen cycle.The tests carried out on fortified natural samples of differentconductivities demonstrated the accuracy and precision of ourmethod when determining the15N abundances forα = 1–5%,a diffusion time of 15 h and solutions characterized by ammo-nium concentrations in the range of 1.3–10�M. So, for sampleswith higher NH4
+ concentration, a dilution should be appliedbefore the15N spiking. On the contrary, samples with lower
Accuracy of the method (CRM: IAEA-311)a
CRM data. Confidencelimits (5%–95%)
N (number ofreplicates)
Maximum abundance(15N %)
Minimum abundance(15N %)
Mean abundance(15N %)
Standard deviation(15N %)
2.03–2.06 6 2.053 2.074 2.06 0.01
Precision of the method (1.15% standard)a,b
Concentration group,C (�M)
N (number ofreplicates)
Maximum abundance(15N %)
Minimum abundance(15N %)
Mean abundance(15N %)
Standard deviation(15N %)
g
a
concentrations should be spiked with known amounts of15N-NH4
+ in order to reach an NH4+ concentration that satisfies themethod requirements.
Acknowledgements
The authors are indebted to ‘Flanders-Dutch’ cooperationand Geconcerteerde Onderzoeksacties VUB for financial sup-port to N.B. and M.E.
Appendix A
ANOVA analysis applied to the experimental results as partof the method validation
2.5 6 –5 6 –
10 6 –
Ruggedness of the method (1.15% standard)a,c
Diffusion time (h) N (number ofreplicates)
Maximum abundance(15N %)
10 3 –15 6 –24 3 –
a Our results.b The within-laboratory reproducibility (sWR), over the three concentration
statistically different (P = 0.332).c The conclusion is that the mean values for each diffusion time are not st
(P = 0.158).
References
[1] J.J. McCarthy, E.J. Carpenter, in: E.J. Carpenter, D.G. Capone (EdsNitrogen in the Marine Environment, Academic Press, New York, 1983pp. 487–512.
[2] R.C. Dugdale, J.J. Goering, Limnol. Oceanogr. 12 (1967) 196.[3] J.J. McCarthy, W.R. Taylor, J.L. Taft, Limnol. Oceanogr. 22 (1977) 996.[4] R.W. Eppley, B.J. Peterson, Nature 282 (1979) 677–680.[5] J.R. Pennock, Estuar. Coast. Shelf Sci. 24 (1987) 841–857.[6] P.M. Glibert, M.R. Dennett, D.A. Caron, J. Mar. Res. 46 (1988)
837–852.[7] S. Kristiansen, E. Paasche, Mar. Ecol. Progr. Ser. 54 (1989) 203–207[8] P.A. Wheeler, D.L. Kirchman, Limnol. Oceanogr. 31 (1986) 998–1009.[9] W.G. Harrison, in: E.J. Carpenter, D.G. Capone (Eds.), Nitrogen in
the Marine Environment, Academic Press, Inc., New York, 1983, pp763–807.
[10] H. Haga, T. Nagata, M. Sakamoto, Limnol. Oceanogr. 40 (1995)1091–1099.
– 1.159 0.05– 1.173 0.03– 1.157 0.01
Minimum abundance(15N %)
Mean abundance(15N %)
Standard deviation(15N %)
– 1.214 0.02– 1.173 0.03– 1.170 0.01
roups is equal to 0.0332. As a consequence, the three mean atom%15N are not
tistically different from the nominal value (1.15%) of our standard extraction solutions
.),,
.
.
[11] P.M. Glibert, Mar. Biol. 70 (1982) 209–222.[12] F. Lipschultz, S.C. Wofsy, L.E. Fox, Limnol. Oceanogr. 31 (1986)
701–716.[13] D.J. Velinsky, J.R. Pennock, J.H. Sharp, L.A. Cifuentes, M.L. Fogel,
Mar. Chem. 26 (1989) 351–361.[14] P.M. Glibert, D.G. Capone, in: R. Knowles, T.H. Blackburn (Eds.),
Nitrogen Isotope Techniques, Academic Press, New York, 1993, pp.243–272.
[15] T.R. Fisher, K.M. Morrissey, Mar. Chem. 16 (1985) 11–21.[16] N. Dudek, M.A. Brzezinski, P.A. Wheeler, Mar. Chem. 18 (1986) 59–
69.[17] J.S. Selmer, F. Sorensson, Appl. Environ. Microbiol. 52 (1986) 577–579.[18] M.F. Lehmann, M. Bernasconi, J.A. McKenzie, Anal. Chem. 73 (2001)
4717–4721.[19] J.M. Bremner, in: C.A. Black (Ed.), Methods of Soil Analysis, vol. 9,
1965, pp. 1179–1237.[20] W.G. Harrison, Limnol. Oceanogr. 23 (1978) 684–694.[21] J. Caperon, D. Schell, J. Hirota, E. Laws, Mar. Biol. 54 (1979) 33–40.
122 C. Diaconu et al. / Analytica Chimica Acta 554 (2005) 113–122
[22] E. Paasche, S. Kristiansen, Mar. Biol. 69 (1982) 55–63.[23] C.T. Mackown, P.D. Brooks, M.S. Smith, Soil Sci. Soc. Am. J. 51 (1987)
87–90.[24] M.P. Russelle, J.A. Lory, Soil Sci. Soc. Am. J. 58 (1994) 1400–1404.[25] P.D. Brooks, J.M. Stark, B.B. McInteer, T. Preston, Soil Sci. Soc. Am.
J. 53 (1989) 1707–1711.[26] I.C. Burke, A.R. Mosier, L.K. Porter, L.A. Odeen, Soil Sci. Soc. Am.
J. 54 (1990) 1190–1192.[27] D.M. Sigman, M.A. Altabet, R. Michener, D.C. McCorkle, B. Fry, R.M.
Holmes, Mar. Chem. 57 (1997) 227–242.[28] R.M. Holmes, J.W. McClelland, D.M. Sigman, B. Fry, B.J. Peterson,
Mar. Chem. 60 (1998) 235–243.[29] M. Sebilo, B. Mayer, M. Grably, Environ. Chem. 1 (2004) 99–103.[30] R.D. Hauck, in: A.L. Page (Ed.), Agron. Monogr., vol. 9, 1982, pp.
735–779.[31] E.J. Conway, Crosby Lockwood and Son, London, 1957.[32] W.A. O’deen, L.K. Porter, Anal. Chem. 51 (1979) 586–589.[33] Y.P. Liu, R.L. Mulvaney, Soil Sci. Soc. Am. J. 56 (1992) 1185–1188.[34] N.S. Saghir, R.L. Mulvaney, F. Azam, Commun. Soil Sci. Plant Anal.
24 (1993) 1745–1762.
[35] J.A. Lory, M.P. Russelle, Soil Sci. Soc. Am. J. 58 (1994) 1400–1404.
[36] D.J. Herman, P.D. Brooks, M. Ashraf, F. Azam, R.L. Mulvaney, Com-mun. Soil Sci. Plant Anal. 26 (1995) 1675–1685.
[37] J.M. Stark, S.C. Hart, Soil Sci. Soc. Am. J. 60 (1996) 1846–1855.[38] P. Sorensen, E.S. Jensen, Anal. Chim. Acta 252 (1991) 201–203.[39] S.A. Khan, R.L. Mulvaney, P.D. Brooks, Soil Sci. Soc. Am. J. 61 (1998)
936–942.[40] F. Koroleff, Interlaboratory Report, vol. 3, International Council for the
Exploration of the Sea, Copenhagen, 1969, pp. 19–22.[41] K.R. Kelley, D.C. Ditsch, M.M. Alley, Soil Sci. Soc. Am. J. 55 (1991)
1016–1020.[42] T. Goerges, K. Dittert, Commun. Soil Sci. Plant Anal. 29 (1998)
361–368.[43] D.L. Massart, Chemom. Intell. Lab. Syst. 37 (1997) 271–280.[44] J.M. Green, Anal.Chem. News Features, 1996, 305A/309A.[45] L.A. Curie, Pure Appl. Chem. 67 (1995) 1699–1723.[46] BCR Information, Report EUR10618EN, 1986.[47] W.J. Youden, E.H. Steiner, Statistical Manual of the Association of Offi-
cial Analytical Chemists, 1975.


![nitric oxide [15N]arginine-to-[15N]citrulline - pnas.org · period, in healthy subjects receiving an adequate arginine intake. Thisinvestigation establishes anexperimentalbasisfor](https://img.pdfslide.net/doc/110x75/5d402ba788c99377448bcf7f/nitric-oxide-15narginine-to-15ncitrulline-pnasorg-period-in-healthy.jpg)


![Simultaneous and absolute quantification of nucleoside ......9]UTP, 10 μM [15N 5, 13C 10]dATP, 10 μM[15N 5, 13C 10]dGTP, 10 μM [15N 3, 13C 9]dCTP, and 10 μM[15N 2, 13C 10]dTTP)](https://img.pdfslide.net/doc/110x75/6110c5cfc90cfe531510e3b4/simultaneous-and-absolute-quantification-of-nucleoside-9utp-10-m-15n.jpg)