Embed Size (px)
Citation preview
This is a repository copy of Validation of LIRIC aerosol concentration retrievals using airborne measurements during a biomass burning episode over Athens.
White Rose Research Online URL for this paper:http://eprints.whiterose.ac.uk/105674/
Version: Accepted Version
Article:
Kokkalis, P, Amiridis, V, Allan, JD et al. (14 more authors) (2017) Validation of LIRIC aerosol concentration retrievals using airborne measurements during a biomass burning episode over Athens. Atmospheric Research, 183. pp. 255-267. ISSN 0169-8095
https://doi.org/10.1016/j.atmosres.2016.09.007
© 2016, Elsevier. Licensed under the Creative Commons Attribution-NonCommercial-NoDerivatives 4.0 International http://creativecommons.org/licenses/by-nc-nd/4.0/
[email protected]://eprints.whiterose.ac.uk/
Reuse
Unless indicated otherwise, fulltext items are protected by copyright with all rights reserved. The copyright exception in section 29 of the Copyright, Designs and Patents Act 1988 allows the making of a single copy solely for the purpose of non-commercial research or private study within the limits of fair dealing. The publisher or other rights-holder may allow further reproduction and re-use of this version - refer to the White Rose Research Online record for this item. Where records identify the publisher as the copyright holder, users can verify any specific terms of use on the publisher’s website.
Takedown
If you consider content in White Rose Research Online to be in breach of UK law, please notify us by emailing [email protected] including the URL of the record and the reason for the withdrawal request.
1
Validation of LIRIC aerosol concentration retrievals using airborne measurements during a biomass burning episode over Athens
Panagiotis Kokkalisa, Vassilis Amiridisa, James D. Allanb,c, Alexandros Papayannisd, Stavros Solomosa, Ioannis Binietogloua,l, Aikaterini Bougiatiotie,d,f, Alexandra Tsekeria, Athanasios Nenese,g,h,i, Philip D.
Rosenbergj, Franco Marencok, Eleni Marinoua,m, Jeni Vasilescul, Doina Nicolael, Hugh Coeb, Asan 5 Bacakb, Anatoli Chaikovskyn
a Institute for Astronomy, Astrophysics, Space Application and Remote Sensing, National Observatory of Athens, Greece 10 b School of Earth, Atmospheric and Environmental Sciences, The University of Manchester, Manchester, UK c National Centre for Atmospheric Science, The University of Manchester, Manchester, UK d National Technical University of Athens, Zografou, Greece e School of Earth and Atmospheric Sciences, Georgia Institute of Technology, Atlanta, GA, USA f ECPL, Department of Chemistry, University of Crete, Voutes, 71003 Heraklion, Greece 15 g School of Chemical & Biomolecular Engineering, Georgia Institute of Technology, Atlanta, GA, USA h Institute of Chemical Engineering Sciences (ICE-HT), FORTH, Patras, Greece i IERSD, National Observatory of Athens, P. Penteli 15236, Athens, Greece j School of Earth and Environment, University of Leeds, Leeds, UK k Satellite Applications, Met Office, Exeter, UK 20 l National Institute of R&D for Optoelectronics, Magurele, Romania m Department of Physics, Aristotle, University of Thessaloniki, Thessaloniki, Greece n Institute of Physics of the National Academy of Science of Belarus, Minsk, Belarus 25
*Corresponding author: Panagiotis Kokkalis, Post-Doctoral Researcher National Observatory of Athens 30 Institute for Astronomy, Astrophysics, Space Applications & Remote Sensing I.Metaxa and Vas. Paulou str. GR-15236 Penteli, GREECE Tel: +30 - 2108109183, Fax: +30 - 2106138343 e-mail: [email protected] web: http://apcg.space.noa.gr 35
40
2
Abstract
In this paper we validate the Lidar-Radiometer Inversion Code (LIRIC) retrievals of the aerosol concentration in the fine
mode, using the airborne aerosol chemical composition dataset obtained over the Greater Athens Area (GAA) in Greece,
during the ACEMED campaign. The study focuses on the 2nd of September 2011, when a long-range transported smoke 5
layer was observed in the free troposphere over Greece, in the height range from 2 to 3 km. CIMEL sun-photometric
measurements revealed high AOD (~0.4 at 532 nm) and Ångström exponent values (~ 1.7 at 440/870 nm), in agreement with
coincident ground-based lidar observations. Airborne chemical composition measurements performed over the GAA,
revealed increased CO volume concentration (~ 110 ppbv), with 57% sulphate dominance in the PM1 fraction. For this case,
we compare LIRIC retrievals of the aerosol concentration in the fine mode with the airborne Aerosol Mass Spectrometer 10
(AMS) and Passive Cavity Aerosol Spectrometer Probe (PCASP) measurements. Our analysis shows that the remote sensing
retrievals are in a good agreement with the measured airborne in-situ data from 2 to 4 km. The discrepancies observed
between LIRIC and airborne measurements at the lower troposphere (below 2 km), could be explained by the spatial and
temporal variability of the aerosol load within the area where the airborne data were averaged along with the different time
windows of the retrievals. 15
1 Introduction
According to the report of the Intergovernmental Panel on Climate Change (IPCC; Myhre et al., 2013), anthropogenic
aerosols result into a net cooling globally through their interaction with radiation and clouds, by an amount that remains
difficult to quantify accurately and which could be comparable in magnitude to the net warming effect of greenhouse gases.
Moreover, according to the World Health Organization (WHO), there is a significant linkage between suspended particles 20
and human’s mortality (WHO, 2006). Aerosol effects are determined, among others, by particle’s size, their chemical
composition, and number concentration. To understand how atmospheric particles are affecting the Earth’s climate, the
scientific community has established and operates global networks equipped with active and passive remote sensing
instrumentation. More precisely, the AErosol RObotic NETwork (AERONET) provides almost real-time columnar aerosol
optical and microphysical properties, based on the operation of more than 400 sun-sky radiometers distributed worldwide 25
(Holben et al., 1998). Several aerosol lidar networks are used for aerosol/cloud research including well established
infrastructures and networks like: the European Aerosol Research Lidar Network (EARLINET; Pappalardo et al., 2014), the
Micro Pulse Lidar Network (MPLNET; Welton and Campbell, 2002) and the Asian Dust and aerosol lidar observation
network (AD-Net; Sugimoto et al., 2014).
Depending on the capabilities of each system and the employed techniques, lidar measurements are used to retrieve the 30
vertical distribution of (a) the aerosol backscatter coefficient (ߚ), (e.g. Fernald et al., 1972; Klett, 1981); (b) the aerosol
extinction coefficient (), (Ansmann et al., 1990; Ansmann et al., 1992) and (c) the particle linear depolarization ratio ߜ (e.g. Cairo et al., 1999; Sassen 2005; Freudenthaler et al., 2009). The aerosol backscatter and extinction coefficients can
3
be retrieved from the backscatter, Raman (Ansmann et al., 1992; Whiteman et al., 1992; Whiteman, 2003), or High Spectral
Resolution Lidar (HSRL) technique (e.g. Eloranta, 2005). The selected technique defines also the accuracy of the retrieved
aerosol products. Many studies have demonstrated that the spectral information of the aforementioned aerosol optical
properties, makes feasible the provision of accurate retrievals in the fine mode, regarding aerosol microphysical parameters
namely: aerosol size distribution, aerosol effective radius, number and volume concentration (Müller et al., 1999; 5
Veselovskii et al., 2002; Veselovskii et al., 2010). In case that the aerosol extinction coefficient is provided by Raman
technique, the microphysical retrievals are typically limited to night-time measurements since their accuracy depends on the
error of the optical parameters provided as initial inputs.
During the last years, there are increased efforts to retrieve aerosol concentration profiles also during day-time. For example,
the polarization lidar photometer networking (POLIPHON) technique is capable of retrieving the concentration profiles of 10
dust and non-dust particles using single wavelength backscatter and depolarization coefficient lidar profiles (Ansmann et al.,
2011; Ansmann et al., 2012). In this technique, AERONET microphysical retrievals are used to provide columnar volume-
to-AOD values needed to convert the optical properties to concentration. On a continuation effort, Mamouri and Ansmann
(2014), have expanded the technique to separating the contribution of fine and coarse dust modes, based on laboratory
measurements of fine and coarse dust depolarization ratios. 15
In the framework of Aerosols, Clouds, and Trace gases Research Infrastructure (ACTRIS), two algorithms have been
developed for retrieving concentration profiles from the synergy of lidar and sun-photometric measurements. The
Generalized Aerosol Retrieval from Radiometer and Lidar Combined (GARRLiC; Lopatin et al., 2013) inversion algorithm
retrieves vertical profiles of both fine and coarse aerosol concentrations as well as the size distribution and complex
refractive index for each mode. Based on similar approach, the LIdar-Radiometer Inversion Code (LIRIC; Chaikovsky et al., 20
2016) considers that the fine and coarse particle intensive properties are constant with height, taken equal to the column-
integrated values provided by AERONET, with only their concentration varying along the atmospheric column. LIRIC,
GARRLiC and POLIPHON techniques have been used by many EARLINET-AERONET stations, during large and medium
scale dust events over the European continent, for evaluating dust model performance in terms of dust layer geometrical
properties (height range and centre of mass) as well as dust load (particle concentrations) (e.g. Binietoglou et al., 2015; 25
Granados-Muñoz et al., 2016). For a case study of Saharan dust outbreak over Athens, Greece, Tsekeri et al. (2013), found a
satisfactory agreement between LIRIC output and dust concentration profiles, simulated by the regional dust model BSC-
DREAM8b (Pérez et al., 2006a; Pérez et al., 2006b; Basart et al., 2012). Furthermore, comparisons of LIRIC output, with
dispersion models of other aerosol types than dust (e.g. volcanic dust), like Lagrangian dispersion model FLEXPART (Stohl
et al., 1998; Stohl et al., 2005), showed a Pearson’s coefficient (R) varying from 0.69 to 0.84 (Kokkalis et al., 2013). 30
Moreover, Wagner et al., (2013), inter-compared LIRIC and POLIPHON concentration profiles, by applying both techniques
on two case studies of irregularly shaped particles in the atmosphere (i.e. one Sahara dust outbreak and one volcanic dust
event). The comparison between the two techniques revealed acceptable agreement, however the potential of LIRIC to
retrieve optical properties, namely particle backscatter coefficient, lidar ratio and Ångström exponent, was found to
4
demonstrate systematic deviations compared to corresponding measurements obtained with a Raman lidar. In addition,
Papayannis et al. (2014) showed that the relative difference between LIRIC and POLIPHON mass concentration retrievals, is
in the range of ±20% for the case of coarse non-spherical particles.
Furthermore, LIRIC retrievals of volume concentration have been compared with aircraft in-situ measurements, by
Granados-Muñoz et al. (2016) during a Saharan dust episode over Granada, Spain. The case study of coarse mode (dust), 5
non-spherical particles, is introducing limitations regarding, the potential of in-situ instrumentation to measure size
distribution in the size range above 3 たm (diameter). Thus, during their study, they combined: in-situ depolarization
measurements from Cloud and Aerosol Spectrometer with Polarization detection (CAS-POL; Baumgardner et al., 2001),
operating at the size range 0.6-50 たm (diameter), and a Passive Cavity Aerosol Spectrometer (PCASP 100X; Rosenberg et
al., 2012; Cai et al., 2013) measuring aerosol size distribution in 0.1-3 たm diameter range. Correcting the retrieved size 10
distributions, for refractive index assumptions, they demonstrated volume concentration discrepancies less than 20 たm3 cm-3
(0.02 ppbv) and they attributed them to CAS-POL overestimation due to the asphericity of dust particles and to the possible
underestimation of LIRIC, despite the fact that the derived size distributions from CAS-POL and lidar, were found to be in a
good agreement.
In this study, we validate the volume concentration retrieved by LIRIC, with independent in-situ measurements of chemical 15
composition, for a case of predominant fine mode particles in the atmosphere, over the Greater Athens Area (GAA; Saronic
Gulf, Evoikos Gulf and Aegean), Greece. To our knowledge, this is the first time that fine mode LIRIC retrievals are
validated against airborne. The case of fine mode particles is favourable for comparing remote sensing and in-situ
observations since in this case there are fewer limitations on the instrumental side for the in-situ measurements while for
remote sensing part the Mie scattering simulations are applicable since the particles are mainly spherical. In section 2 we 20
present the instrumentation and methodology used. Section 3 presents a brief description of ACEMED campaign along with
the case study used for the evaluation of the LIRIC fine mode aerosol concertation retrieval. Our analysis contains, a
thorough characterization of the aerosol load monitored over the GAA, in terms of their optical properties and chemical
composition. In the second part of Section 3 we compare the retrieved concentrations with the independent in-situ airborne
measurements. Finally, our conclusions are given in Section 4. 25
2 Instrumentation and method
2.1 Backscatter-Depolarization lidar
At the National Technical University of Athens (NTUA, 37.97 o N, 23.79 o E, elevation: 212 m) a six-wavelength Raman-
backscatter lidar system (EOLE) operates since February 2000, as a member of the EARLINET network (Bösenberg et al.,
2003; Pappalardo et al., 2014). The emission unit is based on an Nd:YAG laser, emitting high energy laser pulses at 355, 532 30
and 1064 nm with a repetition rate of 10 Hz. The respective emitted energies per pulse are of the order of 240, 300 and 260
mJ. A Galilean type beam expander (x3) is mounted, just before the emission of the laser beam in the atmosphere, for
5
reducing the laser beam divergence and increasing the beam diameter, almost with the same efficiency for all the emitted
wavelengths. The optical receiver is based on a Cassegrainian telescope with 600 mm focal length and clear aperture
diameter 300 mm, directly coupled with an optical fiber, to the wavelength separation unit, detecting finally signals at 355,
387, 407, 532, 607 and 1064 nm.
During day time operation, the system is capable to provide aerosol backscatter profiles (ߚ) at 355, 532 and 1064 nm, 5
based on the standard backscatter lidar technique and employing the Klett inversion method (Klett, 1981). The technique
assumes, the existence of an aerosol-free region (e.g. upper troposphere), and a linear relationship between aerosol
backscatter and extinction coefficient, the so called lidar ratio ( ), constant in the laser-telescope path. A variety of studies
performed in the framework of EARLINET, revealed a wide range for the lidar ratios, covering values from 20 to 100 sr
(Ackermann, 1998; Mattis et al., 2004; Amiridis et al., 2005; Müller et al., 2007; Papayannis et al., 2008; Amiridis et al., 10
2009; Groß et al., 2011; Groß et al., 2013; Groß et al., 2015; Giannakaki et al., 2015). In elastic backscatter lidar technique,
the assumption of a constant lidar ratio value throughout the laser sounding range, is the most critical for solving the lidar
equation, while the overall uncertainty, including both statistical and systematic errors, on the retrieved ߚvalues, is of the
order of 20–30% (Bösenberg et al., 1997; Comerón et al., 2004; Rocadenbosch et al., 2010).
Next to EOLE system, a depolarization lidar system (AIAS), was also operating continuously during September 2011. AIAS 15
is capable to detect both the parallel- and perpendicular- components of the backscattered light at 532 nm, with respect to the
linear polarization plane of the initially emitted laser beam. The emission unit of AIAS is based on a Nd:YAG laser, emitting
short laser pulses at 532 nm with energy of the order of 95 mJ per pulse. The backscattered light is collected by a Dall-
Kirkham/Cassegrainian telescope with 1000 mm focal length and 200 mm clear aperture diameter, and guided to a
Polarization Beam Splitter Cube (PBSC) where the two polarization components are separated and directed to the 20
corresponding detectors (Sassen, 2005). The calibrated ratio of these two components is known as volume depolarization
ratio, and the key for deriving accurate particle linear depolarization measurements (ߜ ) lies in obtaining a reliable
calibration of the lidar system. Various calibration methods exist in the literature (e.g. Biele et al., 2000; Reichardt et al.,
2003; Alvarez et al., 2006), however the ±45o calibration technique (Freudenthaler et al., 2009), has been employed in our
case. 25
Both lidar systems are affected by the overlap height and below this region are not capable to provide trustworthy aerosol
products. The geometrical specification of EOLE system makes feasible the full overlap of the laser beam with the receiver
field of view to be reached at heights 700-900 m above ground (Kokkalis et al., 2012). Regarding the depolarization lidar
AIAS, the measured volume depolarization ratio is reliable to about 50 m above ground since overlap effects widely cancel
out due to the signal ratios needed for the calculation of the depolarization ratio. However, in this study the data are analysed 30
for heights above 850 m. Below that height we set the measured aerosol related physical quantities to height-independent
values.
6
2.2 CIMEL sun-sky radiometer
In this study, the reported columnar aerosol optical properties, have been retrieved by a CIMEL sun-sky radiometer (Holben
et al., 1998), located on the roof of the Research Center for Atmospheric Physics and Climatology of the Academy of Athens
(37.99 oN, 23.78 oE, elevation: 130 m). The radiometric station is in the city centre, approximately 10 km away from the
coastal line and 1.6 km North from the lidar station. The instrument is part of NASA’s global sun photometric network 5
AERONET, and is capable to perform automatic measurements of the direct solar irradiance at the common wavelengths of
340, 380, 440, 500, 675, 870, 940 and 1020 nm and diffuse sky radiance at 440, 675, 870 and 1020 nm, respectively. Those
measurements are further used to provide, both optical and microphysical aerosol optical properties in the atmospheric
column (Dubovik and King, 2000; Dubovik et al., 2006). The CIMEL data used in this study, are the cloud screened and
quality assured level 2.0 data products, providing information regarding the columnar aerosol optical depth (AOD), fine and 10
coarse mode fractions of AOD at 500 nm, the particle volume size distribution in the size range of 0.05 to 15 たm in terms of
particle radius, and the Ångström exponent. The separation of fine and coarse, size distribution is done by finding the
minimum concentration values in the particle’s radius range 0.194–0.576 たm. The AOD uncertainty is < ±0.02 for UV
wavelengths and < ±0.01 for wavelengths longer than 440 nm (Eck et al., 1999). The uncertainty of the aerosol size
distribution retrieved by the sky radiance measurements is based on the calibration uncertainty of each wavelength, assumed 15
to be < ±5%.
2.3 Lidar-Sun-photometric inversion algorithm (LIRIC)
The LIRIC algorithm has been developed by the Belarusian Institute of Physics in Minsk, in collaboration with the French
Laboratoire d’Optique Atmosphérique in Lille . LIRIC combines the elastically backscattered lidar signals at 355, 532 and
1064 nm, along with the radiometric measurements from CIMEL, and is capable of retrieving the fine (ܥ(ݖ)) and coarse 20
mode particle volume concentration profiles ( ܥ (ݖ)) (Chaikovsky et al., 2016), in parts per billion volume (ppbv). In case
that depolarization measurements are available, LIRIC algorithm is capable to provide also the concentration profiles of
coarse spherical and coarse spheroid modes. However, in the present study this capability has not been examined, since an
older version of the LIRIC code has been used. The threshold value for defining fine and coarse mode particles in terms of
their size, is obtained from the columnar volume size distribution retrieved by AERONET inversion algorithms. Thus, in the 25
case of LIRIC, fine mode particles, may assume to be particles with radius approximately less than 0.5 たm. Finally, the
retrieval is based on a maximum-likelihood estimation of the concentration profiles so that the lidar signals are reproduced
within their measurement uncertainty and the integral of the retrieved aerosol concentrations matches the total volume
concentration of the fine and coarse modes, derived from sun-photometric measurements.
LIRIC’s retrieval uncertainty, depends both on the regularization parameters defined by the operator, as well as on the 30
uncertainty of the input data. More precisely, for various atmospheric conditions, lidar geometrical characteristics, and
LIRIC’s regularization parameters, the uncertainties in the retrieved aerosol parameters were found to be maximum 30%, for
7
cases of complex aerosol structures, however taking values below 10%, during cases of homogeneous aerosol mixing and
simple aerosol structures (Granados-Muñoz et al., 2014). Uncertainties due to the regularization parameters were found to be
below 2%. Overall, according to Chaikovsky et al. (2016), the retrieved volume concentration profiles may be provided with
a standard deviation in the range 5–20% of the maximum aerosol layer concentration, with the concentration uncertainty to
be significant only for cases of low concentration values. In the studied case, we considered that the retrieved concentration 5
profiles are provided with an overall uncertainty of 20%.
2.4 In-situ airborne aerosol instrumentation
The size-resolved chemical composition and mass concentration, have been measured with an Aerodyne time-of-flight
Aerosol Mass Spectrometer (TOF-AMS; Allan et al., 2003; Canagaratna et al., 2007; Morgan et al., 2010). The AMS is
capable to measure the fine mode particle’s mass concentration (ܯ), of the following chemical compounds: sulphates ( ସ), 10
nitrates (ଷ), ammonium (ܪସ), chloride (ܥ) and organic matter (ܯ). Particle’s aerodynamic diameter, are related to
their physical diameters, ranging usually between 0.1-1 たm. The initially reported mass concentrations, are measured in
micrograms per standard cubic meter (たg Sm-3), at standard temperature-pressure conditions ( = 273.15 ܭ and =
1013.25 ).
Volume concentration of gaseous pollutants, have been also measured during the flights, using the following gas analysers: 15
Aero-Laser (AL) 5002 VUV Fast Fluorescence analyser, for carbon monoxide (ܥ) measurements, and a Thermo-Electron
(TE) 49C UV photometric analyser, for ozone (ଷ) measurements.
The size-resolved particle’s number density has been measured with a Passive Cavity Aerosol Spectrometer Probe (PCASP).
The instrument is capable to measure particle’s number size distribution, over the diameter range of 0.1 to 3 たm, in 30 size
bins. The principle of operation of PCASP is based on the scattering of a laser light from suspended particles. The scattered 20
radiation over an angular range of 35o - 120o (primary angle) and 60 o -145o (secondary angle), is collected by a parabolic
mirror and is focused onto a photodetector, producing an electronic pulse. The pulse height for each particle is linearly
related to a particle’s cross section and therefore nonlinearly related to the particle’s diameter. The number of pulses counted
per second is proportional to the concentration. However, since scattering cross section depends among other parameters also
on particle’s shape and refractive index, a correction regarding refractive index have to be applied. Thus, for deriving 25
calibrated particle’s number density distributions we followed the procedure demonstrated by Rosenberg et al., (2012), and
applied also by Tsekeri et al., (2016), for ACEMED campaign dataset.
Finally, temperature sensors (Rosemount/Goodrich) and hygrometers (Lyman-alpha) mounted on the aircraft, are capable to
provide measurements of temperature and relative humidity. The overall calibration uncertainties of the temperature
measurements are of the order ±0.3K. 30
8
2.5 Modelling
Source-receptor relationships between the measurement areas and the potential emission sources, are investigated with the
use of the particle dispersion model FLEXPART-WRF (Stohl et al., 2005; Brioude et al., 2013). The model is driven by
WRF_ARW (Skamarock et al., 2008) meteorological fields at a resolution of 12×12 km over the area of interest. A two-way
nested 3×3 km grid over the greater Athens area is also enabled for the description of the local sea breeze flow during the 5
experimental period. Initial and boundary conditions for WRF are from the National Center for Environmental Prediction
(NCEP) final analysis (FNL) dataset at 1°×1° resolution. The sea surface temperature (SST) is from the NCEP 1°×1°
analysis and a total of 10.000 tracer particles are assumed for each release in FLEXPART simulations. Backward trajectories
and emission sensitivity studies during the sampling period indicate the possible sources for the aerosol layers, detected both
by in-situ and remote sensing instruments. 10
3 Results from ACEMED campaign and discussion
During the period from 1st to 9th of September 2011, the European Fleet for Airborne Research (EUFAR) supported airborne
measurements over a wide domain over Greece by deploying the FAAM-BAe146 research aircraft. Two flights, one on the
2nd and one on the 9th of September were performed in the framework of the ACEMED experimental campaign, in order to
retrieve detailed information about the physical and chemical aerosol properties, along the flight track of the CALIPSO 15
satellite. ACEMED campaign, supported the collection of quality assured and coordinated ground-based, airborne in-situ and
space-borne measurements, to generate representative case studies that will be further used to study the aerosol type
classification scheme, applied on CALIPSO dataset.
This study is focused on the 2nd of September flight (FAAM flight ID number B638), where the research aircraft took-off
from Chania (Crete Island), covering areas from Southern Greece to Athens, at various heights. The flight duration was 20
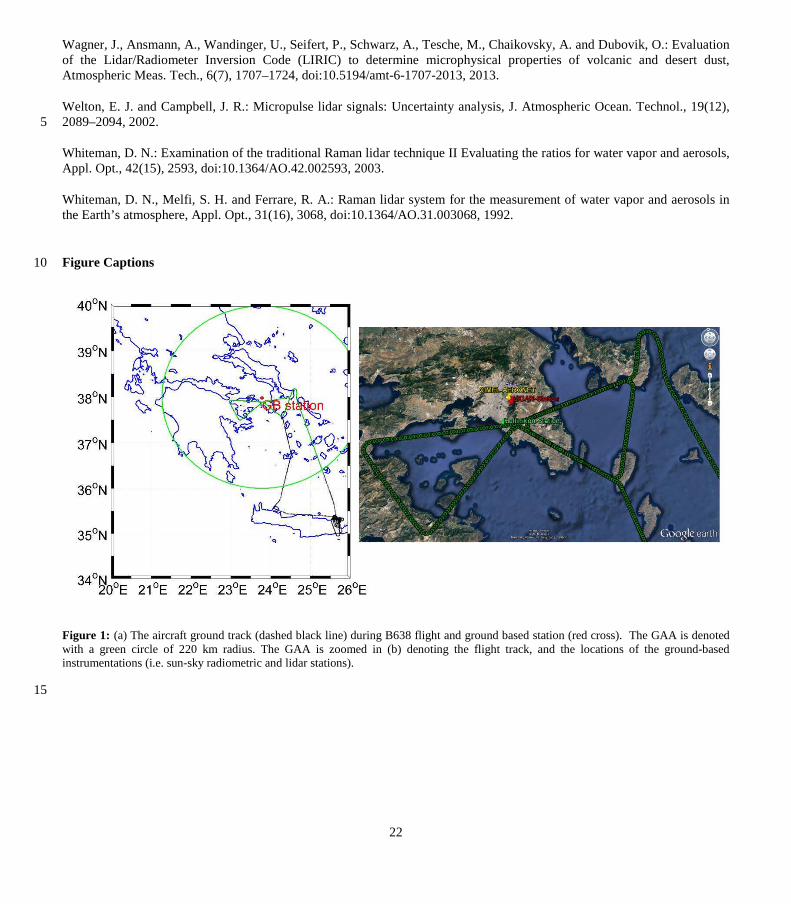
approximately 4 ½ hours (~ 08:00-12:30 UTC), and the aircraft flight track is depicted in Figure 1-a with the black dashed
line. The green circle, of 220 km radius in Figure 1-a, is depicting the GAA used for the spatial and temporal averaging of
the on-board in-situ measurements. The GAA, is further zoomed in Figure 1-b, presenting also the locations of the ground
based instrumentation (i.e. stations of sun-sky radiometer and lidar), along with the B638 flight track. Unfortunately, the
flight of 9th of September, was performed during night time, and thus cannot be used for the validation of LIRIC. Additional 25
information regarding ACEMED and concurrent campaigns (Aegean-Game and CarbonExp) may be found in Bezantakos et
al. ( 2013), Tombrou et al. (2015) and Tsekeri et al. (2016).
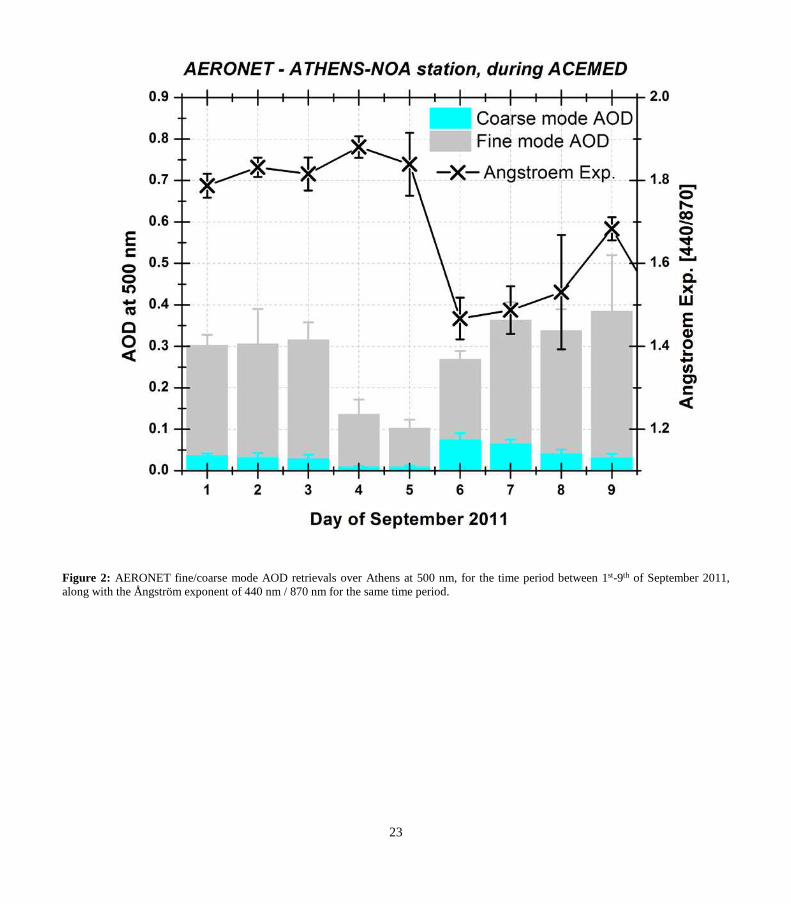
During the entire ACEMED campaign period, high values of fine mode AOD were observed by the CIMEL sun-sky
radiometer. The fine mode fraction of columnar AOD at 500 nm was more than 89%, reaching the highest values of 91%
and 93% (Figure 2), on 2nd and 3rd of September 2011, respectively. Moreover, large Ångström exponent values were 30
observed during this 8-day period, varying from 1.30 to 1.60 (Figure 2). The similarity in optical properties observed with
9
AERONET are indicative of the presence of a consistent aerosol type over Greece, during the entire campaign period,
especially between, 2nd-3rd and 7th-9th of September.
3.1 Case study description
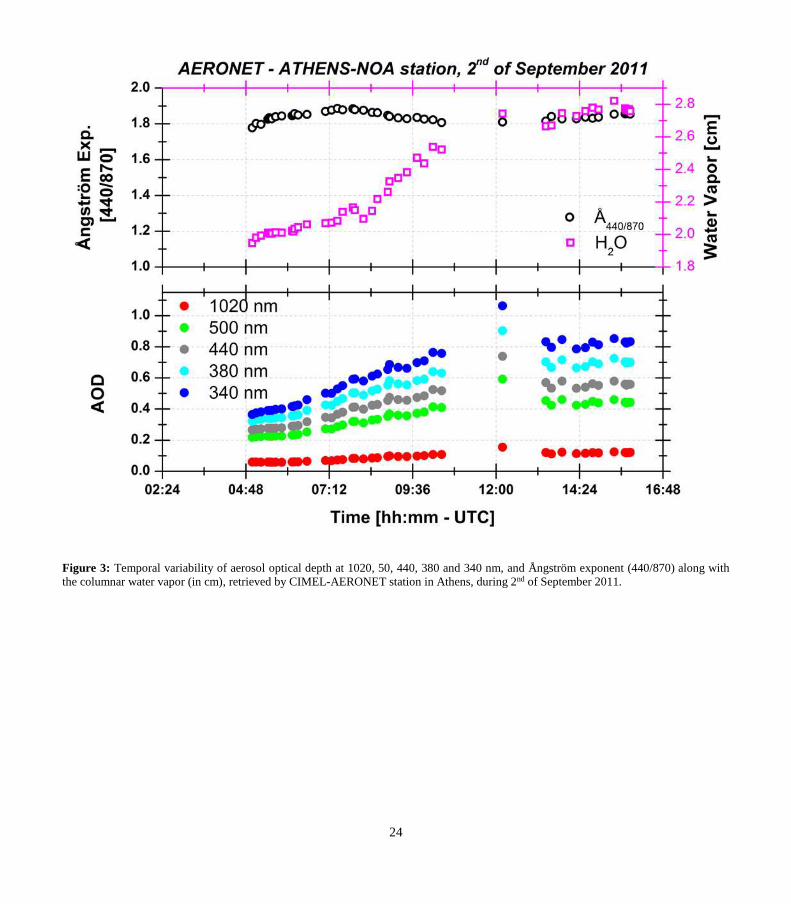
For the 2nd of September 2011 (case study examined here), we present in Figure 3, the temporal variability of the columnar
aerosol optical properties from AERONET. The Ångström exponent varied from 1.77 to 1.90 with a mean value of 5
1.84±0.02, while the AOD at 340 and 500 nm increased during morning and noon and remained constant during afternoon
hours, with mean values of 0.82±0.01 and 0.44±0.01 respectively (Figure 3). The same pattern of the AOD is followed also
by the columnar water vapor (in cm) as depicted by AERONET. An increase of the columnar water vapor is observed from
around 07:00 UTC to 14:00 UTC varying from ~2.00 to 2.80 cm, demonstrating the high temporal variability of water
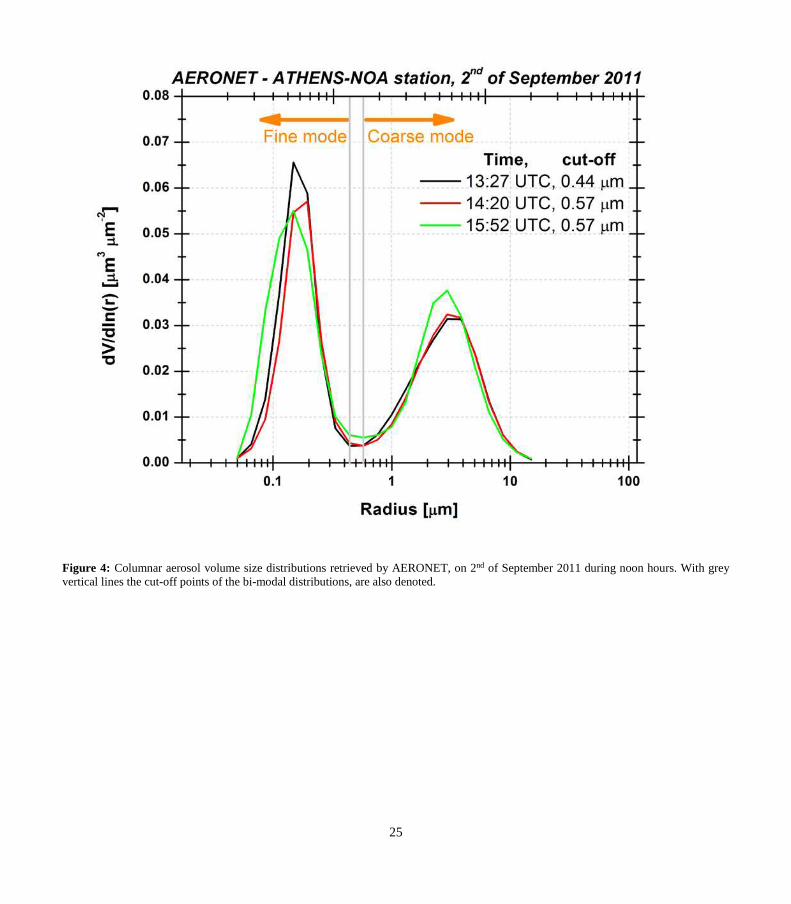
content over the atmosphere (Figure 3). Moreover, the volume size distribution retrievals from the photometric data indicate 10
the presence of rather fine mode particles in the atmospheric column (Figure 4). The dominance of fine mode particles is
highlighted by the bi-modal size distribution with separation radius ranging from 0.44 um at 13:30 UTC to 0.57 um at 14:20
and 15:52 UTC.
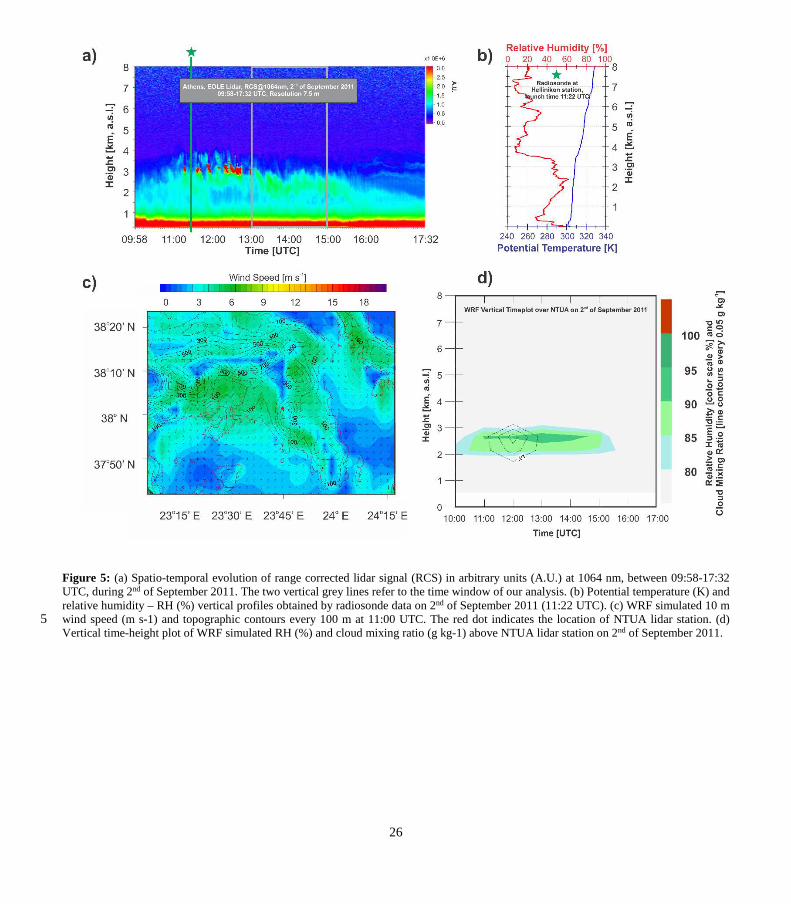
Both backscatter and depolarization lidar systems (EOLE and AIAS) were operating during that day from 09:58 to 17:32
UTC. In Figure 5-a we present the spatio-temporal evolution of the backscattered signal obtained by EOLE at 1064 nm, 15
visualizing the evolution of a distinct aerosol layer extending from 2 up to ~3.5 km over the station. Cloud formation is also
found at 3 km during 11:00-13:00 UTC. In Figure 5-b the vertical profiles of relative humidity and potential temperature are
demonstrated as obtained by radiosonde data on 2nd of September (11:22 UTC). The launching area is located at a coastal
station around 15 km south-west of the lidar station. The transport of moister marine air due to the initiation of a sea breeze
circulation results in RH increase reaching up to 60% at the layer 2-3 km. As seen also by the WRF model results in Figure 20
5-c, the sea breeze flow penetrates the Attica basin and results in SSW surface winds exceeding 7 m s-1 at 11:00 UTC.
Mechanical elevation of these marine air masses along the Attica Mountains leads in the formation of the shallow orographic
clouds that are found by the lidar measurements. This is also shown in Figure 5-d for the area of NTUA lidar station where
the model predicts RH values up to 100 % at the layer 2-3 km during the period 12:00-16:00 UTC. Condensation is also
evident in the model and the formation of a warm phase orographic cloud with a maximum mixing ratio of 0.15 g kg-1 is 25
shown in Figure 5-d around 11:00-13:00 UTC in accordance with the lidar observations.
In order to avoid the contamination of our retrievals with the presence of low altitude scattered clouds, developed at the top
of that layer from 11:30 to ~13:00 UTC, we focused our analysis in the time window 13:00-15:00 UTC, indicated with a
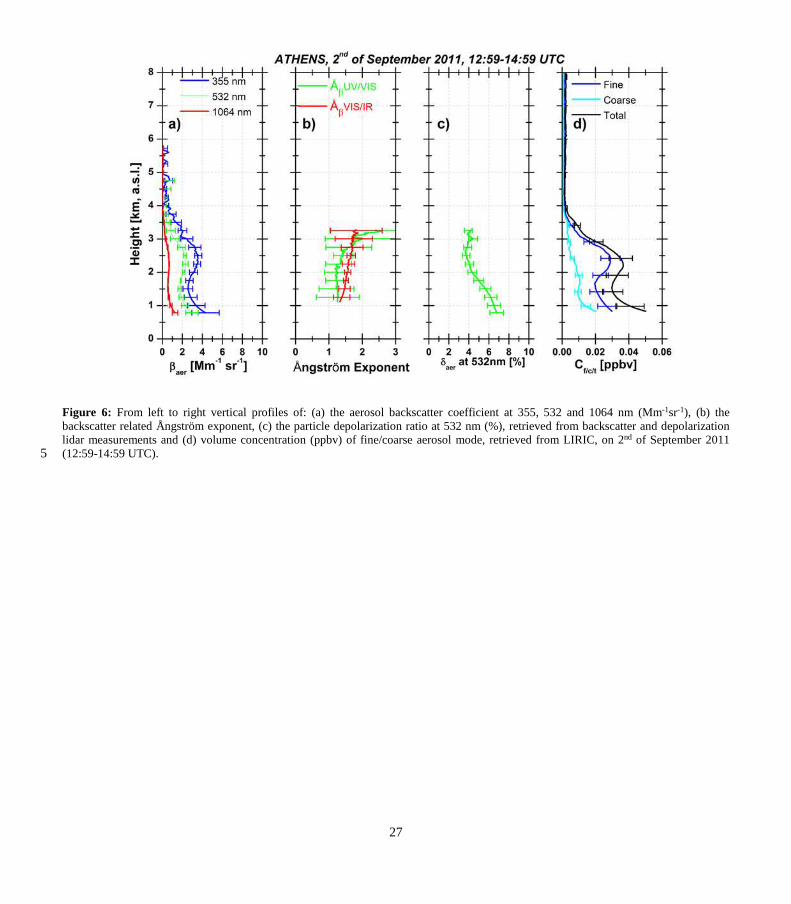
grey rectangle overlaid in Figure 5-a. For the aforementioned time period, the vertical profiles of aerosol backscatter
coefficients (ߚ(ݖ)) at 355, 532 and 1064 nm have been retrieved using the Klett inversion method (Figure 6-a), using the 30
lidar ratio value of 70 sr at 532 nm. Similar lidar ratio values pointed out by AERONET on the same day. More precisely, by
using the values of single scattering albedo ((ߣ)) and phase function at 180o ((180ఖ)), retrieved with AERONET
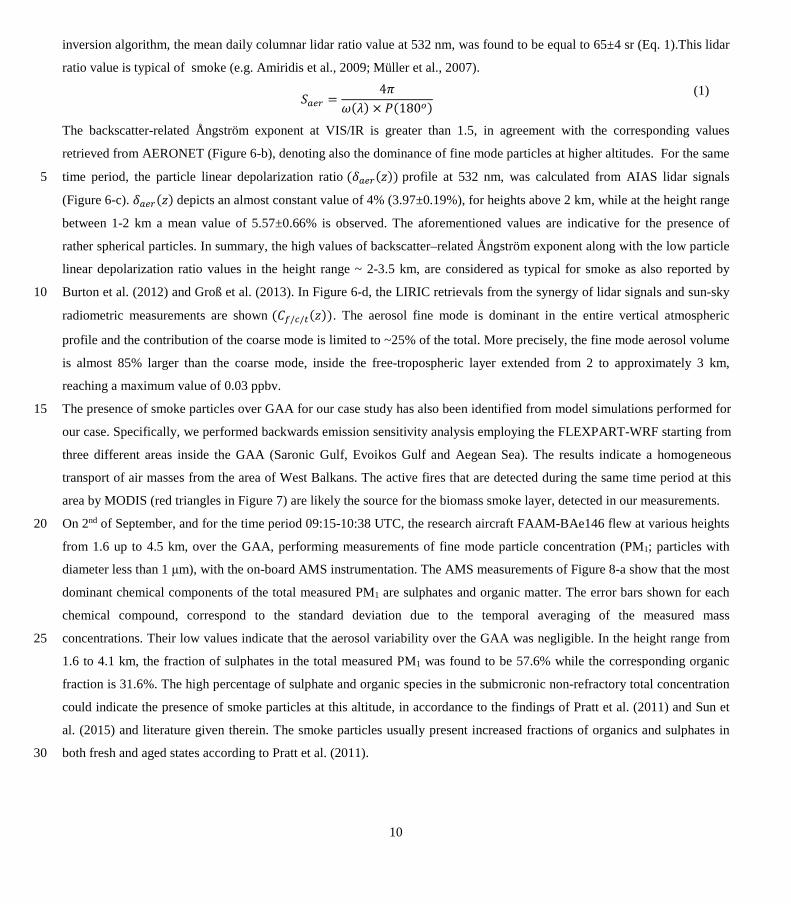
10
inversion algorithm, the mean daily columnar lidar ratio value at 532 nm, was found to be equal to 65±4 sr (Eq. 1).This lidar
ratio value is typical of smoke (e.g. Amiridis et al., 2009; Müller et al., 2007). =(ߣ)ߨ4 × (180ఖ)
(1)
The backscatter-related Ångström exponent at VIS/IR is greater than 1.5, in agreement with the corresponding values
retrieved from AERONET (Figure 6-b), denoting also the dominance of fine mode particles at higher altitudes. For the same
time period, the particle linear depolarization ratio (ߜ(ݖ)) profile at 532 nm, was calculated from AIAS lidar signals 5
(Figure 6-c). ߜ(ݖ) depicts an almost constant value of 4% (3.97±0.19%), for heights above 2 km, while at the height range
between 1-2 km a mean value of 5.57±0.66% is observed. The aforementioned values are indicative for the presence of
rather spherical particles. In summary, the high values of backscatter–related Ångström exponent along with the low particle
linear depolarization ratio values in the height range ~ 2-3.5 km, are considered as typical for smoke as also reported by
Burton et al. (2012) and Groß et al. (2013). In Figure 6-d, the LIRIC retrievals from the synergy of lidar signals and sun-sky 10
radiometric measurements are shown (ܥ//௧(ݖ)). The aerosol fine mode is dominant in the entire vertical atmospheric
profile and the contribution of the coarse mode is limited to ~25% of the total. More precisely, the fine mode aerosol volume
is almost 85% larger than the coarse mode, inside the free-tropospheric layer extended from 2 to approximately 3 km,
reaching a maximum value of 0.03 ppbv.
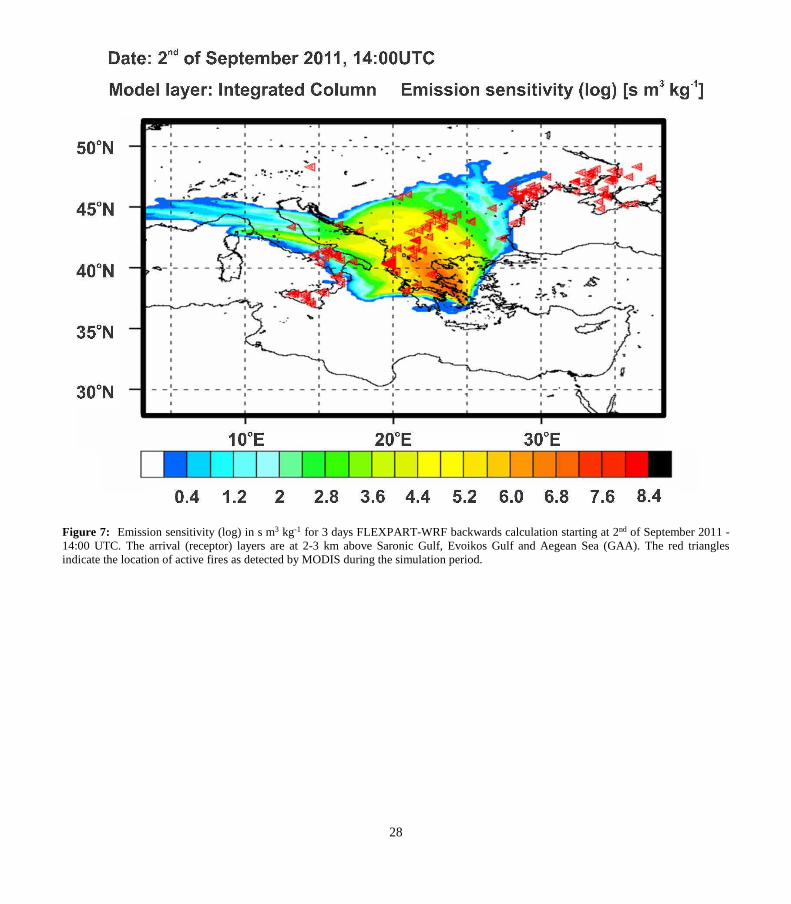
The presence of smoke particles over GAA for our case study has also been identified from model simulations performed for 15
our case. Specifically, we performed backwards emission sensitivity analysis employing the FLEXPART-WRF starting from
three different areas inside the GAA (Saronic Gulf, Evoikos Gulf and Aegean Sea). The results indicate a homogeneous
transport of air masses from the area of West Balkans. The active fires that are detected during the same time period at this
area by MODIS (red triangles in Figure 7) are likely the source for the biomass smoke layer, detected in our measurements.
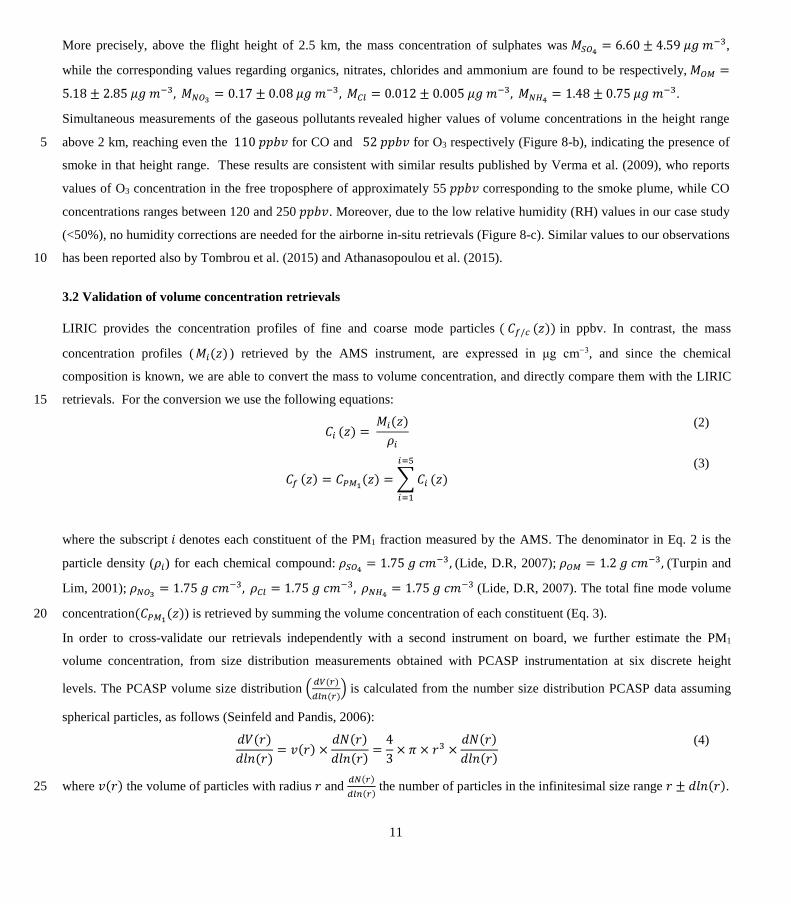
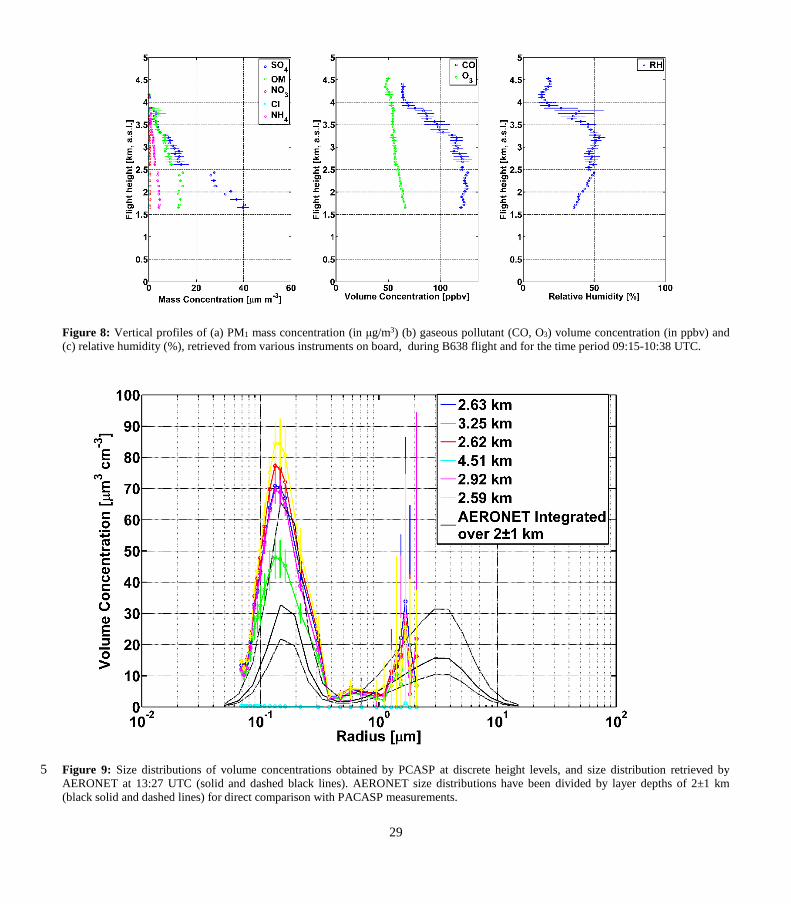
On 2nd of September, and for the time period 09:15-10:38 UTC, the research aircraft FAAM-BAe146 flew at various heights 20
from 1.6 up to 4.5 km, over the GAA, performing measurements of fine mode particle concentration (PM1; particles with
diameter less than 1 たm), with the on-board AMS instrumentation. The AMS measurements of Figure 8-a show that the most
dominant chemical components of the total measured PM1 are sulphates and organic matter. The error bars shown for each
chemical compound, correspond to the standard deviation due to the temporal averaging of the measured mass
concentrations. Their low values indicate that the aerosol variability over the GAA was negligible. In the height range from 25
1.6 to 4.1 km, the fraction of sulphates in the total measured PM1 was found to be 57.6% while the corresponding organic
fraction is 31.6%. The high percentage of sulphate and organic species in the submicronic non-refractory total concentration
could indicate the presence of smoke particles at this altitude, in accordance to the findings of Pratt et al. (2011) and Sun et
al. (2015) and literature given therein. The smoke particles usually present increased fractions of organics and sulphates in
both fresh and aged states according to Pratt et al. (2011). 30
11
More precisely, above the flight height of 2.5 km, the mass concentration of sulphates was ܯௌைర = 6.60 ± ,ଷ ߤ 4.59while the corresponding values regarding organics, nitrates, chlorides and ammonium are found to be respectively, ܯைெ =
5.18 ± ,ଷ ߤ 2.85 ேைయܯ = 0.17 ± ,ଷ ߤ 0.08 ܯ = 0.012 ± ,ଷ ߤ 0.005 ேுరܯ = 1.48 ± .ଷ ߤ 0.75Simultaneous measurements of the gaseous pollutants revealed higher values of volume concentrations in the height range
above 2 km, reaching even the 110 ݒ for CO and 52 ݒ for O3 respectively (Figure 8-b), indicating the presence of 5
smoke in that height range. These results are consistent with similar results published by Verma et al. (2009), who reports
values of O3 concentration in the free troposphere of approximately 55 ݒ corresponding to the smoke plume, while CO
concentrations ranges between 120 and 250 ݒ. Moreover, due to the low relative humidity (RH) values in our case study
(<50%), no humidity corrections are needed for the airborne in-situ retrievals (Figure 8-c). Similar values to our observations
has been reported also by Tombrou et al. (2015) and Athanasopoulou et al. (2015). 10
3.2 Validation of volume concentration retrievals
LIRIC provides the concentration profiles of fine and coarse mode particles ( ܥ/ (ݖ)) in ppbv. In contrast, the mass
concentration profiles (ܯ(ݖ) ) retrieved by the AMS instrument, are expressed in たg cm−3, and since the chemical
composition is known, we are able to convert the mass to volume concentration, and directly compare them with the LIRIC
retrievals. For the conversion we use the following equations: 15 ܥ (ݖ) = ߩ(ݖ)ܯ
(2)
(ݖ) ܥ = (ݖ)ெభܥ = ܥ (ݖ)
ୀହୀଵ
(3)
where the subscript denotes each constituent of the PM1 fraction measured by the AMS. The denominator in Eq. 2 is the
particle density (ߩ) for each chemical compound: ߩௌைర = 1.75 ଷ, (Lide, D.R, 2007); ߩைெ = 1.2 ଷ, (Turpin and
Lim, 2001); ߩேைయ = 1.75 ଷ, ߩ = 1.75 ଷ, ேுరߩ = 1.75 ଷ (Lide, D.R, 2007). The total fine mode volume
concentration(ܥெభ(ݖ)) is retrieved by summing the volume concentration of each constituent (Eq. 3). 20
In order to cross-validate our retrievals independently with a second instrument on board, we further estimate the PM1
volume concentration, from size distribution measurements obtained with PCASP instrumentation at six discrete height
levels. The PCASP volume size distribution ቀௗ()ௗ()ቁ is calculated from the number size distribution PCASP data assuming
spherical particles, as follows (Seinfeld and Pandis, 2006): (ݎ)(ݎ)= (ݎ)ݒ ×
(ݎ)(ݎ)=
4
3× ߨ × ଷݎ ×
(ݎ)(ݎ)
(4)
where (ݎ)ݒ the volume of particles with radius ݎ and ௗே()ௗ()
the number of particles in the infinitesimal size range ݎ ± 25 .(ݎ)
12
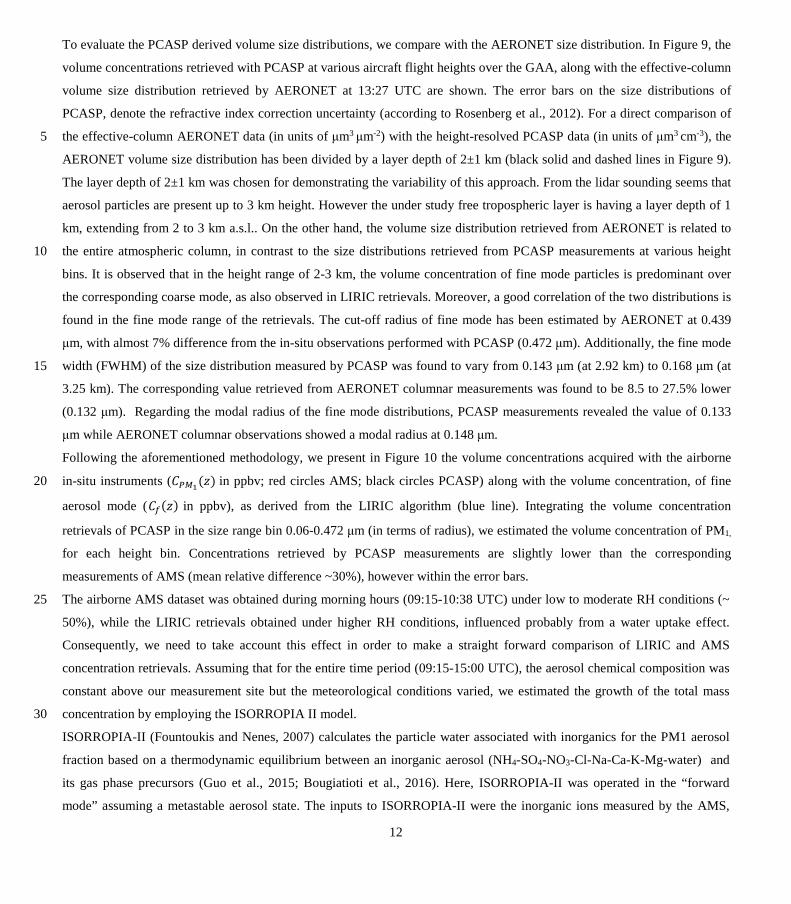
To evaluate the PCASP derived volume size distributions, we compare with the AERONET size distribution. In Figure 9, the
volume concentrations retrieved with PCASP at various aircraft flight heights over the GAA, along with the effective-column
volume size distribution retrieved by AERONET at 13:27 UTC are shown. The error bars on the size distributions of
PCASP, denote the refractive index correction uncertainty (according to Rosenberg et al., 2012). For a direct comparison of
the effective-column AERONET data (in units of たm3 たm-2) with the height-resolved PCASP data (in units of たm3 cm-3), the 5
AERONET volume size distribution has been divided by a layer depth of 2±1 km (black solid and dashed lines in Figure 9).
The layer depth of 2±1 km was chosen for demonstrating the variability of this approach. From the lidar sounding seems that
aerosol particles are present up to 3 km height. However the under study free tropospheric layer is having a layer depth of 1
km, extending from 2 to 3 km a.s.l.. On the other hand, the volume size distribution retrieved from AERONET is related to
the entire atmospheric column, in contrast to the size distributions retrieved from PCASP measurements at various height 10
bins. It is observed that in the height range of 2-3 km, the volume concentration of fine mode particles is predominant over
the corresponding coarse mode, as also observed in LIRIC retrievals. Moreover, a good correlation of the two distributions is
found in the fine mode range of the retrievals. The cut-off radius of fine mode has been estimated by AERONET at 0.439
たm, with almost 7% difference from the in-situ observations performed with PCASP (0.472 たm). Additionally, the fine mode
width (FWHM) of the size distribution measured by PCASP was found to vary from 0.143 たm (at 2.92 km) to 0.168 たm (at 15
3.25 km). The corresponding value retrieved from AERONET columnar measurements was found to be 8.5 to 27.5% lower
(0.132 たm). Regarding the modal radius of the fine mode distributions, PCASP measurements revealed the value of 0.133
たm while AERONET columnar observations showed a modal radius at 0.148 たm.
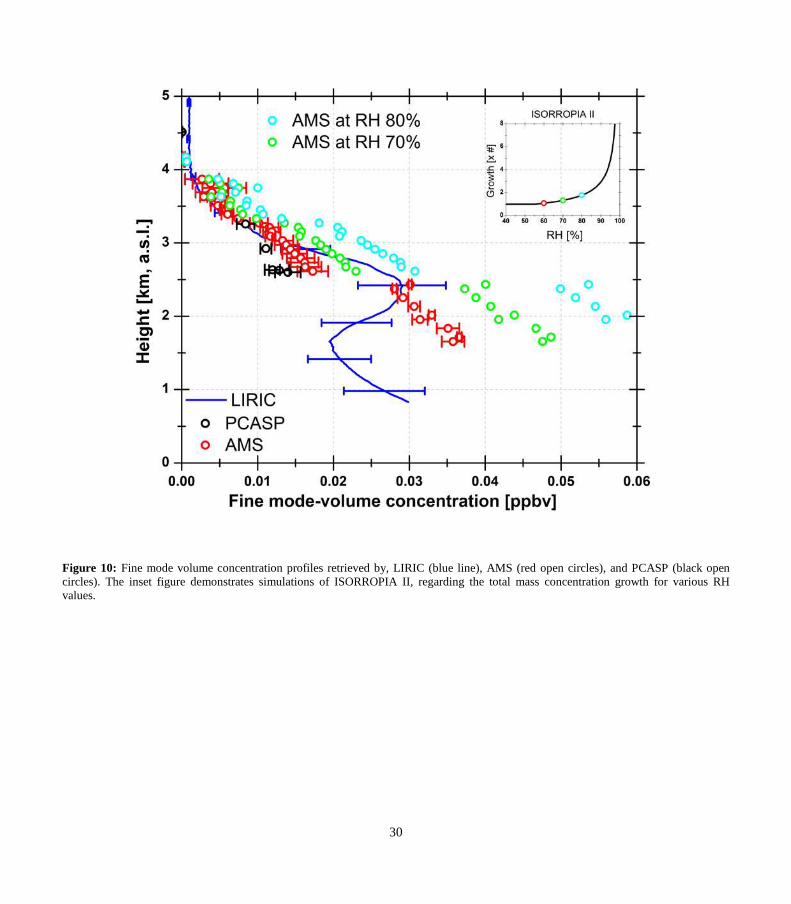
Following the aforementioned methodology, we present in Figure 10 the volume concentrations acquired with the airborne
in-situ instruments (ܥெభ(ݖ) in ppbv; red circles AMS; black circles PCASP) along with the volume concentration, of fine 20
aerosol mode (ܥ(ݖ) in ppbv), as derived from the LIRIC algorithm (blue line). Integrating the volume concentration
retrievals of PCASP in the size range bin 0.06-0.472 たm (in terms of radius), we estimated the volume concentration of PM1,
for each height bin. Concentrations retrieved by PCASP measurements are slightly lower than the corresponding
measurements of AMS (mean relative difference ~30%), however within the error bars.
The airborne AMS dataset was obtained during morning hours (09:15-10:38 UTC) under low to moderate RH conditions (~ 25
50%), while the LIRIC retrievals obtained under higher RH conditions, influenced probably from a water uptake effect.
Consequently, we need to take account this effect in order to make a straight forward comparison of LIRIC and AMS
concentration retrievals. Assuming that for the entire time period (09:15-15:00 UTC), the aerosol chemical composition was
constant above our measurement site but the meteorological conditions varied, we estimated the growth of the total mass
concentration by employing the ISORROPIA II model. 30
ISORROPIA-II (Fountoukis and Nenes, 2007) calculates the particle water associated with inorganics for the PM1 aerosol
fraction based on a thermodynamic equilibrium between an inorganic aerosol (NH4-SO4-NO3-Cl-Na-Ca-K-Mg-water) and
its gas phase precursors (Guo et al., 2015; Bougiatioti et al., 2016). Here, ISORROPIA-II was operated in the “forward
mode” assuming a metastable aerosol state. The inputs to ISORROPIA-II were the inorganic ions measured by the AMS,
13
while values for Na+, Ca2+, K+ and Mg2+ were considered to be equal to zero as their contribution to the submicron fraction is
negligible, and RH and T measured by the aircraft. Particle water concentrations were subsequently revisited by changing
the respective RH and T values to match the ambient data and the model was reinitiated, comparing finally the derived mass
concentration values with the initial ones. The results from simulations with ISORROPIA II, are demonstrated as inset figure
in Figure 10. The growth of the total mass remains constant (1) up to almost 60 % RH, taking the values of 1.33 and 1.78 at 5
70 % and 80 % RH respectively. Since in our dataset we do not have a solid information regarding the vertical variability of
RH, we consider indicative RH values of the order of 70-80%. We applied the growth factors of total mass concentration
derived from ISORROPIA II to the AMS data set (Figure 10 open turquoise and green circles). As demonstrated by the inset
figure, as the RH approaches the 100 % LIRIC assumption of a vertically uniform fine mode properties, could lead to large
errors. 10
For the fine mode concentration profiles as retrieved with LIRIC algorithm and AMS measurements, shown in Figure 10, the
mean relative difference of LIRIC retrievals from AMS measurements found to be -24.2% with a mean bias of -0.003 ppbv.
This mean bias of LIRIC concentration becomes -0.001 ppbv for data points obtained above 2 km height. The RMSE value
found to be 0.006 with mean fractional bias and mean fractional error of the order of -0.136 and 0.315 respectively.
A comparison between LIRIC retrievals and airborne measurements at specific height bins, where in-situ AMS data are 15
available, is shown in Figure 11. For this comparison we used the AMS dataset instead of the PCASP, due to the largest
availability of AMS measurements during the ACEMED campaign. The total number of data points used are 29. The
correlation coefficient between LIRIC ܥ(ݖ) and AMS ܥெభ(ݖ) is 0.85, showing the very good agreement between LIRIC
retrievals and in-situ measurements. However this correlation becomes stronger (0.97) when excluding the data points
sampled at heights below 2 km. These height bins, were found to be the most distant from the AERONET-lidar station, and 20
belong to the lowest part of troposphere which is linked mostly to anthropogenic activity, strongly contributing to the aerosol
load inside the planetary boundary layer. This load can vary significantly inside the GAA in a horizontal distance of 220 km.
Overall, the ܥ(ݖ) values present a very slight underestimation up to 0.001±0.001 ppbv compared to ܥெభ(ݖ). However this
bias should be considered negligible since as can be seen from Figure 11, is driven by the three data points sampled below
1.9 km. Beside the large spatial variability of locally produced particles up to 1.9 km in a horizontal distance of 220 km, the 25
observed discrepancies below that height may also be attributed to LIRIC limitations. According to the LIRIC retrievals and
the linear particle depolarization ratio (~ 6%) below 2 km, a mixture of fine and coarse particles is observed in the lower part
of the atmosphere, while above 2 km mostly fine particles are observed (Figure 6). The usage of constant with height
AERONET values in LIRIC retrievals may lead to high uncertainties in the retrieval of the volume concentration profiles,
especially in cases with non-homogeneous aerosol mixing (Granados-Muñoz et al., 2014), as observed in this case. 30
Moreover, LIRIC volume concentration retrievals are also affected by the incomplete overlap of the lidar systems.
The case study of fine particles described here, was an excellent case for validating LIRIC with in-situ airborne
instrumentation since there are no limitations regarding (i) the presence of non-spherical particles and (ii) the inlet size and
pipeline loses of the in-situ instruments for particles up to 1.5 たm in radius. Due to (i) it is feasible to use Mie scattering
14
calculations for estimating the number size distribution values and applying the refractive index correction (Rosenberg et al.,
2012). Under those conditions LIRIC revealed a good performance regarding the fine mode aerosol concentration retrievals,
especially for the height range above 2 km where the fine mode contribution is highly predominant, and the LIRIC code is
less influenced by the overlap height. The observed discrepancies below 2 km could be partly explained to the presence of
mixed coarse and fine particles, which introduce difficulties in LIRIC to accurately distinguish between the fine and coarse 5
particles, and to the lidar signals which are affected by the overlap height. However, our results below 1.9 km are not
conclusive since there are only three available data points below that height.
4 Summary
In this study we demonstrated a good performance for the LIRIC algorithm regarding the retrieval of the volume
concentration profile in the fine mode. The evaluation was done against high-quality and well-established in-situ airborne 10
measurements. This validation is performed for the first time, for a case of fine mode particles, specifically for a smoke case
study over Greece on 2nd of September 2011. We analysed the case study using all measurements available and characterized
the aerosol load in terms of optical and microphysical/chemical properties specifically as follows: (i) we analysed in detail
the increased values of aerosol optical properties observed in the atmospheric column, with AERONET (AOD 0.82 at 340
nm), and we estimated the range dependent aerosol optical properties, with backscatter-depolarization lidar measurements. 15
(ii) The synergistic use of passive and active remote sensing measurement made also feasible the aerosol characterization in
terms of volume concentration, demonstrating values of 0.03 ppbv regarding fine mode. (iii) The available airborne in-situ
measurements of chemical composition, revealed the presence of sulphates (57.6%) and organic carbon (31.6%) fractions of
fine mode in the atmosphere, and justified the biomass origin of the detected layer. (iv) In addition the airborne in-situ
measurements have been used for validating the fine mode volume concentration retrievals of LIRIC during the specific case 20
study. The correlation coefficient between AMS and LIRIC values was found to be 0.85 and reach even the 0.97, if we
exclude the data points at heights below ~2 km, showing a satisfactory agreement between LIRIC retrievals and in-situ
measurements. The ܥ(ݖ) values are slightly underestimated compared to ܥெభ(ݖ) up to 0.003 ppbv, with a mean relative
difference of -24.2 % and a RMSE of 0.006. However, for the height range below 2 km, higher discrepancies are observed
which may be attributed: (i) to the time difference, of around two to three hours, between LIRIC retrievals and the AMS 25
measurements, and (ii) the aerosol spatial variability over the GAA, especially for heights below 2 km which are strongly
affected by the anthropogenic activity (iii) to the lidar incomplete overlap region (iv) to LIRIC limitations due to non-
homogeneous aerosol mixing.
15
Acknowledgment
The research leading to these results has received funding from the European Union Seventh Framework Programme
ACTRIS-1 (grant agreement no. 262254), and the European Union’s Horizon 2020 Research and Innovation Programme
ACTRIS-2 (grant agreement no. 654109). Airborne data was obtained using the BAe-146-301 Atmospheric Research
Aircraft (ARA) flown by Directflight Ltd. and managed by the Facility for Airborne Atmospheric Measurements (FAAM), 5
which is a joint entity of the Natural Environment Research Council (NERC) and the Met Office. Flight hours, has been
founded by EUFAR: European Facility for Airborne Research in Environmental and Geo-sciences. The authors would like
to acknowledge also the funding from European Union Union’s Horizon 2020 Programme ECARS (grant agreement no.
692014).
10
16
References
Ackermann, J.: The extinction-to-backscatter ratio of tropospheric aerosol: A numerical study, J. Atmospheric Ocean. Technol., 15(4), 1043–1050, 1998.
Allan, J. D., Jimenez, J. L., Williams, P. I., Alfarra, M. R., Bower, K. N., Jayne, J. T., Coe, H. and Worsnop, D. R.: Quantitative sampling using an Aerodyne aerosol mass spectrometer 1. Techniques of data interpretation and error analysis, 5 J. Geophys. Res. Atmospheres, 108(D3), 4090–4100, doi:10.1029/2002JD002358, 2003.
Alvarez, J. M., Vaughan, M. A., Hostetler, C. A., Hunt, W. H. and Winker, D. M.: Calibration technique for polarization-sensitive lidars, J. Atmospheric Ocean. Technol., 23(5), 683–699, 2006.
Amiridis, V., Balis, D. S., Kazadzis, S., Bais, A., Giannakaki, E., Papayannis, A. and Zerefos, C.: Four-year aerosol observations with a Raman lidar at Thessaloniki, Greece, in the framework of European Aerosol Research Lidar Network 10 (EARLINET), J. Geophys. Res., 110(D21), doi:10.1029/2005JD006190, 2005.
Amiridis, V., Balis, D. S., Giannakaki, E., Stohl, A., Kazadzis, S., Koukouli, M. E. and Zanis, P.: Optical characteristics of biomass burning aerosols over Southeastern Europe determined from UV-Raman lidar measurements, Atmospheric Chem. Phys., 9(7), 2431–2440, doi:10.5194/acp-9-2431-2009, 2009.
Ansmann, A., Riebesell, M. and Weitkamp, C.: Measurement of atmospheric aerosol extinction profiles with a Raman lidar, 15 Opt. Lett., 15(13), 746, doi:10.1364/OL.15.000746, 1990.
Ansmann, A., Wandinger, U., Riebesell, M., Weitkamp, C. and Michaelis, W.: Independent measurement of extinction and backscatter profiles in cirrus clouds by using a combined Raman elastic-backscatter lidar, Appl. Opt., 31(33), 7113, doi:10.1364/AO.31.007113, 1992.
Ansmann, A., Tesche, M., Seifert, P., Groß, S., Freudenthaler, V., Apituley, A., Wilson, K. M., Serikov, I., Linné, H., 20 Heinold, B., Hiebsch, A., Schnell, F., Schmidt, J., Mattis, I., Wandinger, U. and Wiegner, M.: Ash and fine-mode particle mass profiles from EARLINET-AERONET observations over central Europe after the eruptions of the Eyjafjallajökull volcano in 2010, J. Geophys. Res. Atmospheres, 116(D20), D00U02, doi:10.1029/2010JD015567, 2011.
Ansmann, A., Seifert, P., Tesche, M. and Wandinger, U.: Profiling of fine and coarse particle mass: case studies of Saharan dust and Eyjafjallajökull/Grimsvötn volcanic plumes, Atmos Chem Phys, 12(20), 9399–9415, doi:10.5194/acp-12-9399-25 2012, 2012.
Athanasopoulou, E., Protonotariou, A. P., Bossioli, E., Dandou, A., Tombrou, M., Allan, J. D., Coe, H., Mihalopoulos, N., Kalogiros, J., Bacak, A., Sciare, J. and Biskos, G.: Aerosol chemistry above an extended archipelago of the eastern Mediterranean basin during strong northern winds, Atmospheric Chem. Phys., 15(14), 8401–8421, doi:10.5194/acp-15-8401-2015, 2015. 30
Basart, S., Pérez, C., Nickovic, S., Cuevas, E. and Baldasano, J. M.: Development and evaluation of the BSC-DREAM8b dust regional model over Northern Africa, the Mediterranean and the Middle East, Tellus B, 64 [online] Available from: http://www.tellusb.net/index.php/tellusb/article/view/18539 (Accessed 16 May 2016), 2012.
Baumgardner, D., Newton, R., Jonsson, H., Dawson, W. and O’Connor, D.: The cloud, aerosol and precipitation spectrometer: a new instrument for cloud investigations, [online] Available from: 35 http://calhoun.nps.edu/handle/10945/46132 (Accessed 16 May 2016), 2001.
17
Bezantakos, S., Barmpounis, K., Giamarelou, M., Bossioli, E., Tombrou, M., Mihalopoulos, N., Eleftheriadis, K., Kalogiros, J., D. Allan, J., Bacak, A., Percival, C. J., Coe, H. and Biskos, G.: Chemical composition and hygroscopic properties of aerosol particles over the Aegean Sea, Atmospheric Chem. Phys., 13(22), 11595–11608, doi:10.5194/acp-13-11595-2013, 2013.
Biele, J., Beyerle, G. and Baumgarten, G.: Polarization lidar: correction of instrumental effects, Opt. Express, 7(12), 427–5 435, 2000.
Binietoglou, I., Basart, S., Alados-Arboledas, L., Amiridis, V., Argyrouli, A., Baars, H., Baldasano, J. M., Balis, D., Belegante, L., Bravo-Aranda, J. A., Burlizzi, P., Carrasco, V., Chaikovsky, A., Comerón, A., D’Amico, G., Filioglou, M., Granados-Muñoz, M. J., Guerrero-Rascado, J. L., Ilic, L., Kokkalis, P., Maurizi, A., Mona, L., Monti, F., Muñoz-Porcar, C., Nicolae, D., Papayannis, A., Pappalardo, G., Pejanovic, G., Pereira, S. N., Perrone, M. R., Pietruczuk, A., Posyniak, M., 10 Rocadenbosch, F., Rodríguez-Gómez, A., Sicard, M., Siomos, N., Szkop, A., Terradellas, E., Tsekeri, A., Vukovic, A., Wandinger, U. and Wagner, J.: A methodology for investigating dust model performance using synergistic EARLINET/AERONET dust concentration retrievals, Atmospheric Meas. Tech., 8(9), 3577–3600, doi:10.5194/amt-8-3577-2015, 2015.
Bougiatioti, A., Nikolaou, P., Stavroulas, I., Kouvarakis, G., Weber, R., Nenes, A., Kanakidou, M. and Mihalopoulos, N.: 15 Particle water and pH in the eastern Mediterranean: source variability and implications for nutrient availability, Atmospheric Chem. Phys., 16(7), 4579–4591, 2016.
Brioude, J., Arnold, D., Stohl, A., Cassiani, M., Morton, D., Seibert, P., Angevine, W., Evan, S., Dingwell, A., Fast, J. D., Easter, R. C., Pisso, I., Burkhart, J. and Wotawa, G.: The Lagrangian particle dispersion model FLEXPART-WRF version 3.1, Geosci Model Dev, 6(6), 1889–1904, doi:10.5194/gmd-6-1889-2013, 2013. 20
Burton, S. P., Ferrare, R. A., Hostetler, C. A., Hair, J. W., Rogers, R. R., Obland, M. D., Butler, C. F., Cook, A. L., Harper, D. B. and Froyd, K. D.: Aerosol classification using airborne High Spectral Resolution Lidar measurements – methodology and examples, Atmospheric Meas. Tech., 5(1), 73–98, doi:10.5194/amt-5-73-2012, 2012.
Cai, Y., Snider, J. R. and Wechsler, P.: Calibration of the passive cavity aerosol spectrometer probe for airborne determination of the size distribution, Atmospheric Meas. Tech., 6(9), 2349–2358, doi:10.5194/amt-6-2349-2013, 2013. 25
Cairo, F., Di Donfrancesco, G., Adriani, A., Pulvirenti, L. and Fierli, F.: Comparison of various linear depolarization parameters measured by lidar, Appl. Opt., 38(21), 4425–4432, 1999.
Canagaratna, M. R., Jayne, J. T., Jimenez, J. L., Allan, J. D., Alfarra, M. R., Zhang, Q., Onasch, T. B., Drewnick, F., Coe, H., Middlebrook, A., Delia, A., Williams, L. R., Trimborn, A. M., Northway, M. J., DeCarlo, P. F., Kolb, C. E., Davidovits, P. and Worsnop, D. R.: Chemical and microphysical characterization of ambient aerosols with the aerodyne aerosol mass 30 spectrometer, Mass Spectrom. Rev., 26(2), 185–222, doi:10.1002/mas.20115, 2007.
Chaikovsky, A., Dubovik, O., Holben, B., Bril, A., Goloub, P., Tanré, D., Pappalardo, G., Wandinger, U., Chaikovskaya, L., Denisov, S., Grudo, J., Lopatin, A., Karol, Y., Lapyonok, T., Amiridis, V., Ansmann, A., Apituley, A., Allados-Arboledas, L., Binietoglou, I., Boselli, A., D'Amico, G., Freudenthaler, V., Giles, D., Granados-Muñoz, M. J., Kokkalis, P., Nicolae, D., Oshchepkov, S., Papayannis, A., Perrone, M. R., Pietruczuk, A., Rocadenbosch, F., Sicard, M., Slutsker, I., 35 Talianu, C., De Tomasi, F., Tsekeri, A., Wagner, J. and Wang, X.: Lidar-Radiometer Inversion Code (LIRIC) for the retrieval of vertical aerosol properties from combined lidar/radiometer data: development and distribution in EARLINET, Atmospheric Meas. Tech., 9(3), 1181–1205, doi:10.5194/amt-9-1181-2016, 2016.
Comerón, A., Rocadenbosch, F., López, M. A., Rodríguez, A., Muñoz, C., García-Vizcaíno, D. and Sicard, M.: Effects of noise on lidar data inversion with the backward algorithm, Appl. Opt., 43(12), 2572–2577, 2004. 40
18
Dubovik, O. and King, M. D.: A flexible inversion algorithm for retrieval of aerosol optical properties from Sun and sky radiance measurements, J. Geophys. Res., 105(20), 673–20, 2000.
Dubovik, O., Sinyuk, A., Lapyonok, T., Holben, B. N., Mishchenko, M., Yang, P., Eck, T. F., Volten, H., Muñoz, O., Veihelmann, B., van der Zande, W. J., Leon, J.-F., Sorokin, M. and Slutsker, I.: Application of spheroid models to account for aerosol particle nonsphericity in remote sensing of desert dust, J. Geophys. Res. Atmospheres, 111(D11), D11208, 5 doi:10.1029/2005JD006619, 2006.
Eck, T. F., Holben, B. N., Reid, J. S., Dubovik, O., Smirnov, A., O’Neill, N. T., Slutsker, I. and Kinne, S.: Wavelength dependence of the optical depth of biomass burning, urban, and desert dust aerosols, J. Geophys. Res. Atmospheres, 104(D24), 31333–31349, doi:10.1029/1999JD900923, 1999.
Eloranta, E. E.: High Spectral Resolution Lidar, in Lidar, edited by D. C. Weitkamp, pp. 143–163, Springer New York. 10 [online] Available from: http://link.springer.com/chapter/10.1007/0-387-25101-4_5 (Accessed 31 August 2016), 2005.
Fountoukis, C. and Nenes, A.: ISORROPIA II: a computationally efficient thermodynamic equilibrium model for K+–Ca 2+–Mg 2+–NH 4+–Na+–SO 4 2—NO 3—Cl—H 2 O aerosols, Atmospheric Chem. Phys., 7(17), 4639–4659, 2007.
Freudenthaler, V., Esselborn, M., Wiegner, M., Heese, B., Tesche, M., Ansmann, A., Müller, D., Althausen, D., Wirth, M., Fix, A., Ehret, G., Knippertz, P., Toledano, C., Gasteiger, J., Garhammer, M. and Seefeldner, M.: Depolarization ratio 15 profiling at several wavelengths in pure Saharan dust during SAMUM 2006, Tellus B, 61(1), 165–179, doi:10.1111/j.1600-0889.2008.00396.x, 2009.
Giannakaki, E., Pfüller, A., Korhonen, K., Mielonen, T., Laakso, L., Vakkari, V., Baars, H., Engelmann, R., Beukes, J. P., Van Zyl, P. G., Josipovic, M., Tiitta, P., Chiloane, K., Piketh, S., Lihavainen, H., Lehtinen, K. E. J. and Komppula, M.: One year of Raman lidar observations of free-tropospheric aerosol layers over South Africa, Atmospheric Chem. Phys., 15(10), 20 5429–5442, doi:10.5194/acp-15-5429-2015, 2015.
Granados-Muñoz, M. J., Guerrero-Rascado, J. L., Bravo-Aranda, J. A., Navas-Guzmán, F., Valenzuela, A., Lyamani, H., Chaikovsky, A., Wandinger, U., Ansmann, A., Dubovik, O., Grudo, J. O. and Alados-Arboledas, L.: Retrieving aerosol microphysical properties by Lidar-Radiometer Inversion Code (LIRIC) for different aerosol types: Microphysical properties by LIRIC, J. Geophys. Res. Atmospheres, 119(8), 4836–4858, doi:10.1002/2013JD021116, 2014. 25
Granados-Muñoz, M. J., Bravo-Aranda, J. A., Baumgardner, D., Guerrero-Rascado, J. L., Pérez-Ramírez, D., Navas-Guzmán, F., Veselovskii, I., Lyamani, H., Valenzuela, A., Olmo, F. J., Titos, G., Andrey, J., Chaikovsky, A., Dubovik, O., Gil-Ojeda, M. and Alados-Arboledas, L.: A comparative study of aerosol microphysical properties retrieved from ground-based remote sensing and aircraft in situ measurements during a Saharan dust event, Atmospheric Meas. Tech., 9(3), 1113–1133, doi:10.5194/amt-9-1113-2016, 2016a. 30
Granados-Muñoz, M. J., Navas-Guzmán, F., Guerrero-Rascado, J. L., Bravo-Aranda, J. A., Binietoglou, I., Pereira, S. N., Basart, S., Baldasano, J. M., Belegante, L., Chaikovsky, A., Comerón, A., D'Amico, G., Dubovik, O., Ilic, L., Kokkalis, P., Muñoz-Porcar, C., Nickovic, S., Nicolae, D., Olmo, F. J., Papayannis, A., Pappalardo, G., Rodríguez, A., Schepanski, K., Sicard, M., Vukovic, A., Wandinger, U., Dulac, F. and Alados-Arboledas, L.: Profiling of aerosol microphysical properties at several EARLINET/AERONET sites during the July 2012 ChArMEx/EMEP campaign, 35 Atmospheric Chem. Phys., 16(11), 7043–7066, doi:10.5194/acp-16-7043-2016, 2016b.
Groß, S., Tesche, M., Freudenthaler, V., Toledano, C., Wiegner, M., Ansmann, A., Althausen, D. and Seefeldner, M.: Characterization of Saharan dust, marine aerosols and mixtures of biomass-burning aerosols and dust by means of multi-wavelength depolarization and Raman lidar measurements during SAMUM 2, Tellus B, 63(4), doi:10.3402/tellusb.v63i4.16369, 2011. 40
19
Groß, S., Esselborn, M., Weinzierl, B., Wirth, M., Fix, A. and Petzold, A.: Aerosol classification by airborne high spectral resolution lidar observations, Atmos Chem Phys, 13(5), 2487–2505, doi:10.5194/acp-13-2487-2013, 2013.
Groß, S., Freudenthaler, V., Schepanski, K., Toledano, C., Schäfler, A., Ansmann, A. and Weinzierl, B.: Optical properties of long-range transported Saharan dust over Barbados as measured by dual-wavelength depolarization Raman lidar measurements, Atmospheric Chem. Phys., 15(19), 11067–11080, doi:10.5194/acp-15-11067-2015, 2015. 5
Guo, H., Xu, L., Bougiatioti, A., Cerully, K. M., Capps, S. L., Hite Jr, J. R., Carlton, A. G., Lee, S. H., Bergin, M. H., Ng, N. L. and others: Fine-particle water and pH in the southeastern United States, Atmos Chem Phys, 15(9), 5211–5228, 2015.
Holben, B. N., Eck, T. F., Slutsker, I., Tanré, D., Buis, J. P., Setzer, A., Vermote, E., Reagan, J. A., Kaufman, Y. J., Nakajima, T., Lavenu, F., Jankowiak, I. and Smirnov, A.: AERONET—A Federated Instrument Network and Data Archive for Aerosol Characterization, Remote Sens. Environ., 66(1), 1–16, doi:10.1016/S0034-4257(98)00031-5, 1998a. 10
Holben, B. N., Eck, T. F., Slutsker, I., Tanre, D., Buis, J. P., Setzer, A., Vermote, E., Reagan, J. A., Kaufman, Y. J. and Nakajima, T.: AERONET—A federated instrument network and data archive for aerosol characterization, Remote Sens. Environ., 66(1), 1–16, 1998b.
Klett, J. D.: Stable analytical inversion solution for processing lidar returns, Appl. Opt., 20(2), 211, doi:10.1364/AO.20.000211, 1981. 15
Kokkalis, P., Papayannis, A., Mamouri, R. E., Tsaknakis, G. and Amiridis, V.: The EOLE lidar system of the National Technical University of Athens, in Reviewed and revised papers presented at the 26th International Laser Radar Conference, pp. 25–29., 2012.
Kokkalis, P., Papayannis, A., Amiridis, V., Mamouri, R. E., Veselovskii, I., Kolgotin, A., Tsaknakis, G., Kristiansen, N. I., Stohl, A. and Mona, L.: Optical, microphysical, mass and geometrical properties of aged volcanic particles observed over 20 Athens, Greece, during the Eyjafjallajökull eruption in April 2010 through synergy of Raman lidar and sunphotometer measurements, Atmospheric Chem. Phys., 13(18), 9303–9320, doi:10.5194/acp-13-9303-2013, 2013.
Lide, D.R: CRC Handbook of Chemistry and Physics, 88th Edition, CRC Press [online] Available from: https://www.crcpress.com/CRC-Handbook-of-Chemistry-and-Physics-88th-Edition/Lide/p/book/9780849304880 (Accessed 16 May 2016), 2007. 25
Lopatin, A., Dubovik, O., Chaikovsky, A., Goloub, P., Lapyonok, T., Tanré, D. and Litvinov, P.: Enhancement of aerosol characterization using synergy of lidar and sun-photometer coincident observations: the GARRLiC algorithm, Atmospheric Meas. Tech., 6(8), 2065–2088, doi:10.5194/amt-6-2065-2013, 2013.
Mamouri, R. E. and Ansmann, A.: Fine and coarse dust separation with polarization lidar, Atmospheric Meas. Tech., 7(11), 3717–3735, doi:10.5194/amt-7-3717-2014, 2014. 30
Mattis, I., Ansmann, A., Müller, D., Wandinger, U. and Althausen, D.: Multiyear aerosol observations with dual-wavelength Raman lidar in the framework of EARLINET: MULTIYEAR AEROSOL PROFILING IN EUROPE, J. Geophys. Res. Atmospheres, 109(D13), n/a-n/a, doi:10.1029/2004JD004600, 2004.
Morgan, W. T., Allan, J. D., Bower, K. N., Highwood, E. J., Liu, D., McMeeking, G. R., Northway, M. J., Williams, P. I., Krejci, R. and Coe, H.: Airborne measurements of the spatial distribution of aerosol chemical composition across Europe 35 and evolution of the organic fraction, Atmos Chem Phys, 10(8), 4065–4083, doi:10.5194/acp-10-4065-2010, 2010.
20
Müller, D., Wandinger, U. and Ansmann, A.: Microphysical particle parameters from extinction and backscatter lidar data by inversion with regularization: theory, Appl. Opt., 38(12), 2346, doi:10.1364/AO.38.002346, 1999.
Müller, D., Ansmann, A., Mattis, I., Tesche, M., Wandinger, U., Althausen, D. and Pisani, G.: Aerosol-type-dependent lidar ratios observed with Raman lidar, J. Geophys. Res., 112(D16), doi:10.1029/2006JD008292, 2007.
Myhre, G., Shindell, D., Bréon, F.-M., Collins, W., Fuglestvedt, J., Huang, J., Koch, D., Lamarque, J.-F., Lee, D., Mendoza, 5 B., Nakajima, T., Robock, A., Stephens, G., Takemura, T. and Zhang, H.: Anthropogenic and Natural Radiative Forcing, in Climate Change 2013: The Physical Science Basis. Contribution of Working Group I to the Fifth Assessment Report of the Intergovernmental Panel on Climate Change, edited by T. F. Stocker, D. Qin, G.-K. Plattner, M. Tignor, S. K. Allen, J. Boschung, A. Nauels, Y. Xia, V. Bex, and P. M. Midgley, pp. 659–740, Cambridge University Press, Cambridge, United Kingdom and New York, NY, USA. [online] Available from: www.climatechange2013.org, 2013. 10
Papayannis, A., Amiridis, V., Mona, L., Tsaknakis, G., Balis, D., Bösenberg, J., Chaikovski, A., De Tomasi, F., Grigorov, I., Mattis, I., Mitev, V., Müller, D., Nickovic, S., Pérez, C., Pietruczuk, A., Pisani, G., Ravetta, F., Rizi, V., Sicard, M., Trickl, T., Wiegner, M., Gerding, M., Mamouri, R. E., D’Amico, G. and Pappalardo, G.: Systematic lidar observations of Saharan dust over Europe in the frame of EARLINET (2000–2002), J. Geophys. Res. Atmospheres, 113(D10), D10204, doi:10.1029/2007JD009028, 2008. 15
Papayannis, A., Nicolae, D., Kokkalis, P., Binietoglou, I., Talianu, C., Belegante, L., Tsaknakis, G., Cazacu, M. M., Vetres, I. and Ilic, L.: Optical, size and mass properties of mixed type aerosols in Greece and Romania as observed by synergy of lidar and sunphotometers in combination with model simulations: A case study, Sci. Total Environ., 500–501, 277–294, doi:10.1016/j.scitotenv.2014.08.101, 2014.
Pappalardo, G., Amodeo, A., Apituley, A., Comeron, A., Freudenthaler, V., Linné, H., Ansmann, A., Bösenberg, J., 20 D’Amico, G., Mattis, I., Mona, L., Wandinger, U., Amiridis, V., Alados-Arboledas, L., Nicolae, D. and Wiegner, M.: EARLINET: towards an advanced sustainable European aerosol lidar network, Atmos Meas Tech, 7(8), 2389–2409, doi:10.5194/amt-7-2389-2014, 2014.
Pérez, C., Nickovic, S., Baldasano, J. M., Sicard, M., Rocadenbosch, F. and Cachorro, V. E.: A long Saharan dust event over the western Mediterranean: Lidar, Sun photometer observations, and regional dust modeling, J. Geophys. Res., 111(D15), 25 doi:10.1029/2005JD006579, 2006a.
Pérez, C., Nickovic, S., Pejanovic, G., Baldasano, J. M. and Özsoy, E.: Interactive dust-radiation modeling: A step to improve weather forecasts, J. Geophys. Res., 111(D16), doi:10.1029/2005JD006717, 2006b.
Pratt, K. A., Murphy, S. M., Subramanian, R., DeMott, P. J., Kok, G. L., Campos, T., Rogers, D. C., Prenni, A. J., Heymsfield, A. J., Seinfeld, J. H. and Prather, K. A.: Flight-based chemical characterization of biomass burning aerosols 30 within two prescribed burn smoke plumes, Atmospheric Chem. Phys., 11(24), 12549–12565, doi:10.5194/acp-11-12549-2011, 2011.
Reichardt, J., Baumgart, R. and McGee, T. J.: Three-signal method for accurate measurements of depolarization ratio with lidar, Appl. Opt., 42(24), 4909, doi:10.1364/AO.42.004909, 2003.
Rocadenbosch, F., Reba, M. N. M., Sicard, M. and Comerón, A.: Practical analytical backscatter error bars for elastic one-35 component lidar inversion algorithm, Appl. Opt., 49(17), 3380–3393, 2010.
Rosenberg, P. D., Dean, A. R., Williams, P. I., Dorsey, J. R., Minikin, A., Pickering, M. A. and Petzold, A.: Particle sizing calibration with refractive index correction for light scattering optical particle counters and impacts upon PCASP and CDP data collected during the Fennec campaign, Atmos Meas Tech, 5(5), 1147–1163, doi:10.5194/amt-5-1147-2012, 2012.
21
Sassen, K.: Polarization in Lidar, in Lidar, edited by D. C. Weitkamp, pp. 19–42, Springer New York. [online] Available from: http://link.springer.com/chapter/10.1007/0-387-25101-4_2 (Accessed 29 March 2016), 2005.
Seinfeld, J. H. and Pandis, S. N.: Atmospheric Chemistry and Physics, A Wiley-Inter Science Publication, John Wiley & Sons Inc, New York., 2006.
Stohl, A., Hittenberger, M. and Wotawa, G.: Validation of the Lagrangian particle dispersion model FLEXPART against 5 large-scale tracer experiment data, Atmos. Environ., 32(24), 4245–4264, 1998.
Stohl, A., Forster, C., Frank, A., Seibert, P. and Wotawa, G.: Technical note: The Lagrangian particle dispersion model FLEXPART version 6.2, Atmos Chem Phys, 5(9), 2461–2474, doi:10.5194/acp-5-2461-2005, 2005.
Sugimoto, N., Nishizawa, T., Shimizu, A., Matsui, I. and Jin, Y.: Characterization of aerosols in East Asia with the Asian Dust and Aerosol Lidar Observation Network (AD-Net), vol. 9262, p. 92620K–92620K–9., 2014. 10
Sun, Y. L., Wang, Z. F., Du, W., Zhang, Q., Wang, Q. Q., Fu, P. Q., Pan, X. L., Li, J., Jayne, J. and Worsnop, D. R.: Long-term real-time measurements of aerosol particle composition in Beijing, China: seasonal variations, meteorological effects, and source analysis, Atmos Chem Phys, 15(17), 10149–10165, doi:10.5194/acp-15-10149-2015, 2015.
Tombrou, M., Bossioli, E., Kalogiros, J., Allan, J. D., Bacak, A., Biskos, G., Coe, H., Dandou, A., Kouvarakis, G., Mihalopoulos, N., Percival, C. J., Protonotariou, A. P. and Szabó-Takács, B.: Physical and chemical processes of air masses 15 in the Aegean Sea during Etesians: Aegean-GAME airborne campaign, Sci. Total Environ., 506–507, 201–216, doi:10.1016/j.scitotenv.2014.10.098, 2015.
Tsekeri, A., Amiridis, V., Kokkalis, P., Basart, S., Chaikovsky, A., Dubovik, O., Mamouri, R. E., Papayannis, A. and Baldasano, J. M.: Application of a synergetic lidar and sunphotometer algorithm for the characterization of a dust event over Athens, Greece, Br. J. Environ. Clim. Change, 3(4), 531, 2013. 20
Tsekeri, A., Amiridis, V., Marenco, F., Nenes, A., Marinou, E., Solomos, S., Rosenberg, P., Trembath, J., Nott, G. J., Allan, J., Le Breton, M., Bacak, A., Coe, H., Percival, C. and Mihalopoulos, N.: Profiling aerosol optical, microphysical and hygroscopic properties in ambient conditions by combining in-situ and remote sensing, Atmospheric Meas. Tech. Discuss., 1–61, doi:10.5194/amt-2016-193, 2016.
Turpin, B. J. and Lim, H.-J.: Species Contributions to PM2.5 Mass Concentrations: Revisiting Common Assumptions for 25 Estimating Organic Mass, Aerosol Sci. Technol., 35(1), 602–610, doi:10.1080/02786820119445, 2001.
Verma, S., Worden, J., Pierce, B., Jones, D. B. A., Al-Saadi, J., Boersma, F., Bowman, K., Eldering, A., Fisher, B., Jourdain, L., Kulawik, S. and Worden, H.: Ozone production in boreal fire smoke plumes using observations from the Tropospheric Emission Spectrometer and the Ozone Monitoring Instrument, J. Geophys. Res., 114(D2), doi:10.1029/2008JD010108, 2009. 30
Veselovskii, I., Kolgotin, A., Griaznov, V., Müller, D., Wandinger, U. and Whiteman, D. N.: Inversion with regularization for the retrieval of tropospheric aerosol parameters from multiwavelength lidar sounding, Appl. Opt., 41(18), 3685, doi:10.1364/AO.41.003685, 2002.
Veselovskii, I., Dubovik, O., Kolgotin, A., Lapyonok, T., Di Girolamo, P., Summa, D., Whiteman, D. N., Mishchenko, M. and Tanré, D.: Application of randomly oriented spheroids for retrieval of dust particle parameters from multiwavelength 35 lidar measurements, J. Geophys. Res. Atmospheres, 115(D21), D21203, doi:10.1029/2010JD014139, 2010.
22
Wagner, J., Ansmann, A., Wandinger, U., Seifert, P., Schwarz, A., Tesche, M., Chaikovsky, A. and Dubovik, O.: Evaluation of the Lidar/Radiometer Inversion Code (LIRIC) to determine microphysical properties of volcanic and desert dust, Atmospheric Meas. Tech., 6(7), 1707–1724, doi:10.5194/amt-6-1707-2013, 2013.
Welton, E. J. and Campbell, J. R.: Micropulse lidar signals: Uncertainty analysis, J. Atmospheric Ocean. Technol., 19(12), 2089–2094, 2002. 5
Whiteman, D. N.: Examination of the traditional Raman lidar technique II Evaluating the ratios for water vapor and aerosols, Appl. Opt., 42(15), 2593, doi:10.1364/AO.42.002593, 2003.
Whiteman, D. N., Melfi, S. H. and Ferrare, R. A.: Raman lidar system for the measurement of water vapor and aerosols in the Earth’s atmosphere, Appl. Opt., 31(16), 3068, doi:10.1364/AO.31.003068, 1992.
Figure Captions 10
Figure 1: (a) The aircraft ground track (dashed black line) during B638 flight and ground based station (red cross). The GAA is denoted with a green circle of 220 km radius. The GAA is zoomed in (b) denoting the flight track, and the locations of the ground-based instrumentations (i.e. sun-sky radiometric and lidar stations).
15
23
Figure 2: AERONET fine/coarse mode AOD retrievals over Athens at 500 nm, for the time period between 1st-9th of September 2011, along with the Ångström exponent of 440 nm / 870 nm for the same time period.
24
Figure 3: Temporal variability of aerosol optical depth at 1020, 50, 440, 380 and 340 nm, and Ångström exponent (440/870) along with the columnar water vapor (in cm), retrieved by CIMEL-AERONET station in Athens, during 2nd of September 2011.
25
Figure 4: Columnar aerosol volume size distributions retrieved by AERONET, on 2nd of September 2011 during noon hours. With grey vertical lines the cut-off points of the bi-modal distributions, are also denoted.
26
Figure 5: (a) Spatio-temporal evolution of range corrected lidar signal (RCS) in arbitrary units (A.U.) at 1064 nm, between 09:58-17:32 UTC, during 2nd of September 2011. The two vertical grey lines refer to the time window of our analysis. (b) Potential temperature (K) and relative humidity – RH (%) vertical profiles obtained by radiosonde data on 2nd of September 2011 (11:22 UTC). (c) WRF simulated 10 m wind speed (m s-1) and topographic contours every 100 m at 11:00 UTC. The red dot indicates the location of NTUA lidar station. (d) 5 Vertical time-height plot of WRF simulated RH (%) and cloud mixing ratio (g kg-1) above NTUA lidar station on 2nd of September 2011.
27
Figure 6: From left to right vertical profiles of: (a) the aerosol backscatter coefficient at 355, 532 and 1064 nm (Mm-1sr-1), (b) the backscatter related Ångström exponent, (c) the particle depolarization ratio at 532 nm (%), retrieved from backscatter and depolarization lidar measurements and (d) volume concentration (ppbv) of fine/coarse aerosol mode, retrieved from LIRIC, on 2nd of September 2011 (12:59-14:59 UTC). 5
28
Figure 7: Emission sensitivity (log) in s m3 kg-1 for 3 days FLEXPART-WRF backwards calculation starting at 2nd of September 2011 - 14:00 UTC. The arrival (receptor) layers are at 2-3 km above Saronic Gulf, Evoikos Gulf and Aegean Sea (GAA). The red triangles indicate the location of active fires as detected by MODIS during the simulation period.
29
Figure 8: Vertical profiles of (a) PM1 mass concentration (in たg/m3) (b) gaseous pollutant (CO, O3) volume concentration (in ppbv) and (c) relative humidity (%), retrieved from various instruments on board, during B638 flight and for the time period 09:15-10:38 UTC.
Figure 9: Size distributions of volume concentrations obtained by PCASP at discrete height levels, and size distribution retrieved by 5 AERONET at 13:27 UTC (solid and dashed black lines). AERONET size distributions have been divided by layer depths of 2±1 km (black solid and dashed lines) for direct comparison with PACASP measurements.
30
Figure 10: Fine mode volume concentration profiles retrieved by, LIRIC (blue line), AMS (red open circles), and PCASP (black open circles). The inset figure demonstrates simulations of ISORROPIA II, regarding the total mass concentration growth for various RH values.
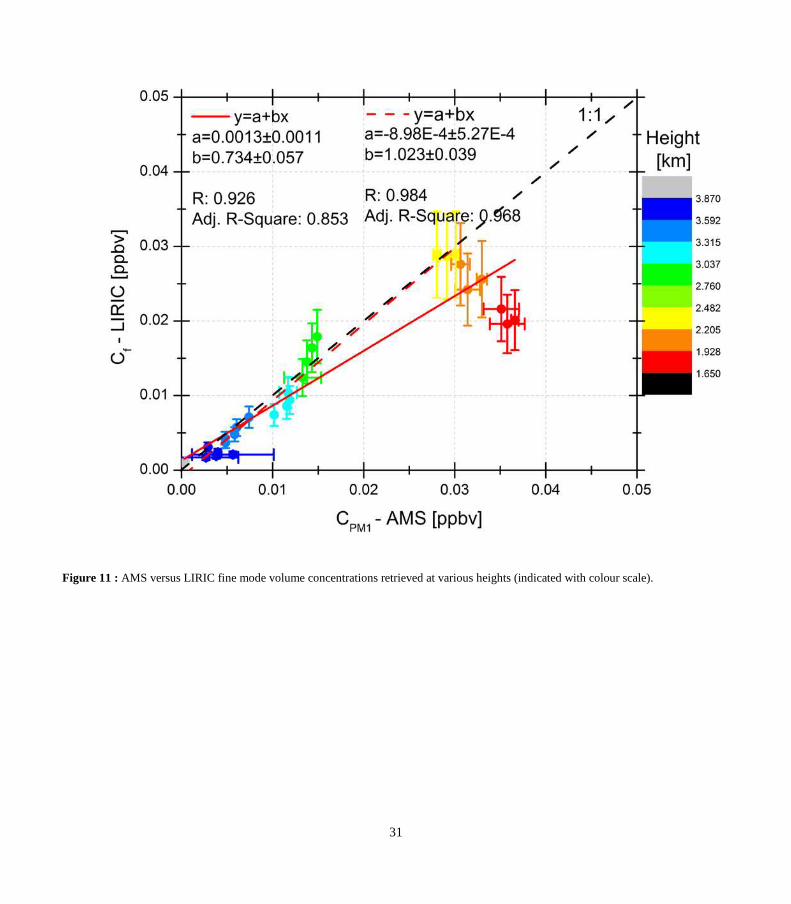
31
Figure 11 : AMS versus LIRIC fine mode volume concentrations retrieved at various heights (indicated with colour scale).


![Annual cycle of global distributions of aerosol optical .... AVHRR Two-Channel Retrievals [9] The AVHRR flown on a series of NOAA polarorbiting satellites since 1978 provides an aerosol](https://img.pdfslide.net/doc/110x75/5afc9f247f8b9a444f8c5066/annual-cycle-of-global-distributions-of-aerosol-optical-avhrr-two-channel.jpg)