Embed Size (px)
Citation preview
Intern rapport ; IR 2008-05
Validation of SAFIR/FLITS
lightning detection system
with railway-damage reports
Rutger Boonstra
De Bi l t , 2008
KNMI Interna l repor t = in tern rappor t ; IR 2008-05
De B i l t , 2008 PO Box 201 3730 AE De B i l t Wi lhe lmina laan 10 De B i l t The Nether lands ht tp ://www.knmi .n l Te lephone +31(0)30-220 69 11 Te le fax +31(0)30-221 04 07 Author: Boonstra, R.
© KNMI, De Bilt. All rights reserved. No part of this publication may be reproduced, stored in retrieval systems, or transmitted, in any form or by any means, electronic, mechanical, photocopying, recording or otherwise, without prior permission in writing from the publisher.
Validation of SAFIR/FLITS lightning detection system with railway-damage reports
Master Thesis by
Rutger Boonstra Reg.no: 840118098040
November 2007 – June 2008
Supervisors: Dr. I. Holleman Royal Netherlands Meteorological Institute (KNMI) Department Weather Observations Dr. L.J.M. Kroon Wageningen University and Research Centre Department Meteorology and Air Quality
Validation of SAFIR/FLITS lightning detection system with railway-damage reports – Rutger Boonstra – june 2008 Royal Netherlands Meteorological Institute (KNMI) – Wageningen University and Research Centre (WUR)
2
Acknowledgements This thesis-report is the result of a research project on which I have been working on the Royal Netherlands Meteorological Institute (KNMI) in ‘de Bilt’ from November 2007 until June 2008. The thesis is part of the MSc-program of Meteorology and Air Quality at Wageningen University and Research Centre. I want to thank my supervisor Iwan Holleman for his great support and help during my research. Next to that I want to thank Hans Beekhuis for his technical insights regarding lightning detection. Both persons helped me out when difficult problems occurred and came up with fresh ideas and critical response that was evident for this thesis-report as it is right now. Next to those two persons there are a lot of persons at KNMI who supported me while writing the report or gaining knowledge in certain subjects. Many thanks! Rutger Boonstra
Validation of SAFIR/FLITS lightning detection system with railway-damage reports – Rutger Boonstra – june 2008 Royal Netherlands Meteorological Institute (KNMI) – Wageningen University and Research Centre (WUR)
3
Abstract Detection of lightning in the SAFIR network used by KNMI after the replacement of the older LPATS network in 1995, has improved significantly. The introduction of a new discrimination and localization module after a software-upgrade in 2004 introduced several advantages including a new technique to localize lightning discharges. Since 2004 the system carries the name FLITS. However this new system provided a new localization method combining time-of-arrival with interferometry direction-finding, there are still some uncertainties about properties of the network regarding localization accuracy, detection probability and the false alarm ratio that need to be validated. The probability of detection of SAFIR/FLITS Lightning Detection System (LDS) has been subject to validation in this study. The false alarm ratio (Noteboom, 2006) and localization accuracy (Beekhuis and Holleman, 2004) have been addressed in the past. Results of these studies have been used in this validation study to gain more knowledge about the probability of detection of KNMI’s SAFIR/FLITS detection network. The validation study involved a comparison with independent data related to Cloud-to-Ground (CG) discharges provided by ProRail, which is the infrastructure-manager of the Dutch railroad system. Damage-reports from ProRail, which included location specific data, were compared with both original LF TOA output data from SAFIR/FLITS and a reprocessed dataset (Holleman, 2008) which included optimized Low Frequency (LF) Time-Of-Arrival (TOA) localization. A side-experiment was done to validate the ProRail damage report with VHF interferometry data to show the (in-) capability of Direction Finding (DF) to detect the CG-discharges. The validation score used in this study is the Probability Of Detection (POD) which has been corrected for the cumulative distribution to provide a result independent of the localization accuracy of the SAFIR/FLITS network. Outcomes of the validation showed that the averaged corrected POD for the original LF TOA output data of SAFIR/FLITS is 57 percent with an uncertainty of 3 percent for radiuses’ in the range 2-6 km. The uncorrected POD in the same range for the original LF TOA output data shows a POD of 41 percent with an uncertainty of 9 percent. Validation outcomes for the VHF data, which involves DF based on interferometry, shows that there is correlation between the damage reports from ProRail and the output of the VHF-data. However, while the VHF data contains both CG- and CC-discharges no solid conclusions can be drawn for this VHF-experiment about the performance regarding validation with the damage reports by ProRail. Results regarding the validation of lightning-specific damage reports by ProRail and the data output generated by the improved localization algorithm (Holleman, 2008) show an averaged POD of 63 percent with an uncertainty of 5 percent. This percentage is not approaching the manufacturer claim of a detection probability of 90 percent or more. The outcomes of the output with improved localization are not convincing. Due to the nature of the localization improvements the outcomes of the algorithm can include an increased false alarm rate, which is not determined in this validation. The improved algorithm generates as much localizations as possible from the raw-data and therefore shows the potential boundaries of the detection equipment. Based on the outcomes of the improved algorithm the detection equipment allows the detection of 63 percent of the CG-discharges.
Validation of SAFIR/FLITS lightning detection system with railway-damage reports – Rutger Boonstra – june 2008 Royal Netherlands Meteorological Institute (KNMI) – Wageningen University and Research Centre (WUR)
4
Validation with a long-term independent ground-based dataset (ProRail in this case) proved to be possible and resulted in valuable information about the detection probability of KNMI’s SAFIR/FLITS lightning detection system. The improved localization algorithm showed that the detection probability can be increased with the current system setup. However this can come at the cost of an increased false alarm rate.
Validation of SAFIR/FLITS lightning detection system with railway-damage reports – Rutger Boonstra – june 2008 Royal Netherlands Meteorological Institute (KNMI) – Wageningen University and Research Centre (WUR)
5
Abbreviations AIL Aircraft Induced Lightning ATD Arrival Time Difference CC/IC Cloud-to-Cloud lightning or Intra-Cloud CG Cloud-to-Ground lightning CSI Critical Success Index DF Direction Finding or Magnetic Direction Finding (MDF) FAR False Alarm Ratio FLITS Flash Localization by Interferometry and Time of Arrival System KMI Royal Meteorological Institute of Belgium KNMI Royal Netherlands Meteorological Institute LDS Lightning Detection System LF Low Frequency range (30-300 kHz) LINET LIghtning detection NETwork LPATS Lightning Position And Tracking System MDF Magnetic Direction Finding or Direction Finding (DF) NLDN National Lightning Detection Network of the United States POD Probability Of Detection SAFIR Surveillance et Alerte Foudre par Interférométrie Radioélectrique TOA Time Of Arrival TOTAL The sum of both CC and CG lightning events VHF Very High Frequency range (30-300 MHz) VLF Very Low Frequency range (3-30kHz)
Validation of SAFIR/FLITS lightning detection system with railway-damage reports – Rutger Boonstra – june 2008 Royal Netherlands Meteorological Institute (KNMI) – Wageningen University and Research Centre (WUR)
6
Table of contents
ABSTRACT ........................................... ...............................................................3
ABBREVIATIONS ...................................... ..........................................................5
TABLE OF CONTENTS .................................. .....................................................6
1 INTRODUCTION ...............................................................................................8
1.1 General introduction and study objective ............................................................................................ 8
1.2 Research questions ................................................................................................................................. 9
1.3 Outline of thesis report......................................................................................................................... 10
2 USAGE AND IMPORTANCE OF LIGHTNING DETECTION ...... ....................11
2.1 Meteorological Forecasting.................................................................................................................. 11
2.2 Climatologic services ............................................................................................................................ 12
2.3 Statistical forecasts ............................................................................................................................... 12
2.4 Aviation - Aircraft Induced Lightning ............................................................................................... 12
2.5 Additional usage ................................................................................................................................... 13
3 THEORY..........................................................................................................14
3.1 Lightning phenomenon and terminology ........................................................................................... 14 3.1.1 Atmospheric electricity................................................................................................................... 14 3.1.2 Lightning ........................................................................................................................................ 15
3.2 Lightning Detection Systems (LDS) .................................................................................................... 17 3.2.1 Lightning Detection – Introduction ................................................................................................ 17 3.2.2 TOA - Time Of Arrival................................................................................................................... 19 3.2.3 DF – Direction Finding................................................................................................................... 20 3.2.4 Combined techniques...................................................................................................................... 22 3.2.5 Lightning detection in the future..................................................................................................... 23
4 LIGHTNING DETECTION NETWORKS..................... .....................................25
4.1 ATD/ATDNet ........................................................................................................................................ 25
4.2 LINET.................................................................................................................................................... 26
4.3 Vaisala ................................................................................................................................................... 26
Validation of SAFIR/FLITS lightning detection system with railway-damage reports – Rutger Boonstra – june 2008 Royal Netherlands Meteorological Institute (KNMI) – Wageningen University and Research Centre (WUR)
7
4.4 Comparison........................................................................................................................................... 27
5 CURRENT LDS KNMI ................................. ....................................................29
5.1 Introduction SAFIR/FLITS................................................................................................................. 29
5.2 Localization accuracy........................................................................................................................... 30
5.3 False alarm rate .................................................................................................................................... 32
5.4 Probability of detection........................................................................................................................ 33
6 VALIDATION OF SAFIR LDS .......................... ...............................................34
6.1 Description of SAFIR/FLITS output .................................................................................................. 34
6.2 Description of ProRail output ............................................................................................................. 36
6.3 Validation method ................................................................................................................................ 40 6.3.1 Validation score.............................................................................................................................. 40 6.3.2 Radius and correction ..................................................................................................................... 41 6.3.3 Time difference............................................................................................................................... 43 6.3.4 Validation example......................................................................................................................... 44
7 RESULTS ........................................................................................................45
7.1 Original LF Vaisala output.................................................................................................................. 45
7.2 Original Vaisala VHF output .............................................................................................................. 48
7.3 Improved LF algorithm ....................................................................................................................... 50
8 CONCLUSIONS AND RECOMMENDATIONS .................. .............................53
BIBLIOGRAPHY ....................................... .........................................................55
APPENDIX .........................................................................................................58
Validation of SAFIR/FLITS lightning detection system with railway-damage reports – Rutger Boonstra – june 2008 Royal Netherlands Meteorological Institute (KNMI) – Wageningen University and Research Centre (WUR)
8
1 Introduction
1.1 General introduction and study objective Detection of lightning in the SAFIR network used by KNMI after the replacement of the older LPATS network in 1995, has improved significantly. The introduction of a new discrimination and localization module after a software-upgrade in 2004 introduced several advantages including a new technique to localize lightning discharges. Since 2004 the system carries the name FLITS. However this new system provided a new localization method combining time-of-arrival with interferometry, there are still some uncertainties about properties of the network regarding localization accuracy, detection probability and the false alarm ratio that need to be validated. The false alarm ratio (Noteboom, 2006) and localization accuracy (Beekhuis and Holleman, 2004) have been addressed in the past. The validation of the detection probability will need to be performed in order to estimate the performance of the current system. The Dutch railroad system, which is one the most densely used railroad systems in Europe (ProRail, 2008), is largely affected by weather. On days with major snowfall or winds the regular schedule of the public transport provider NS (Dutch Railroads) is likely to be disrupted or out of sync. Lightning from (severe) thunderstorms can also cause large delays or major disruption of the railroad system and its schedule. Direct or indirect lightning on the power cables, distribution boxes, switches, signs, crossings or the train itself can cause defects on the material resulting in violated safety measurements, delays or cancellations of services. In these cases repairs and sometimes replacements of the defect materials have to be performed before the system and schedule can function properly again. The disruption does not only affect the public transport sector, of course cargo-transport is held-up too. ProRail, the Dutch company that is in charge of the railinfra-managent, is responsible for the maintenance, continuity and safety of the railroads in the Netherlands. ProRail maintains an extensive dataset of reported defects on materials by all sorts of reasons and fortunately also location specific damage reports related to lightning-discharges. This dataset is valuable for a validation study of the current operational lightning detection system (LDS). The main objective of the research is to compare data of the current lightning detection system with data from ProRail and validate these. Because the damage reports of ProRail solely consists of cloud-to-ground (CG) related discharges only validation on this part of the detection system can be performed while cloud-to-ground and cloud-to-cloud discharges are measured and localized by different techniques. Since the upgrade of the current system in 2004 involved a new detection capability for the cloud-to-ground discharges this dataset is usable to validate the improvements of the upgraded SAFIR system. After comparison improvements to sustain a larger accuracy and a higher detection probability might be recommended to increase the performance of the operational LDS.
Validation of SAFIR/FLITS lightning detection system with railway-damage reports – Rutger Boonstra – june 2008 Royal Netherlands Meteorological Institute (KNMI) – Wageningen University and Research Centre (WUR)
9
1.2 Research questions As mentioned in the Introduction the current operational LDS holds uncertainties that need to be unraveled to connect conclusions to the performance of the SAFIR/FLITS system. The false alarm rate (FAR), localization accuracy and the probability of detection have been subject of uncertainty since the upgraded SAFIR system in 2004. The FAR and localization accuracy have been addressed. The probability of detection of the upgraded SAFIR/FLITS system, that provides an improved cloud-to-ground localization, is unknown and needs to be investigated. With the use of independent data provided by railway-damage reports a validation study can be done. Lightning-discharges resulting in damage-reports of the Dutch railways are localized and compared with the output of SAFIR/FLITS. Therefore the probability of detection of cloud-to-ground discharges can be estimated. Furthermore comparison between the original SAFIR/FLITS output and a modified localization algorithm (Holleman, 2008) are performed to gain knowledge in differences and their origin in detection probability. Another comparison between the original data and output data from the ATDNet is performed to compare two operational systems and their differences. The main questions can be formulated as follows:
� Is it possible to validate SAFIR/FLITS with independent ground-based data? � What is the detection probability of the operational SAFIR/FLITS LDS at KNMI for
cloud-to-ground discharges? Secondary question of this research are formulated as follows:
� What affects the detection probability of the operational SAFIR/FLITS LDS of KNMI and how can this be improved?
Validation of SAFIR/FLITS lightning detection system with railway-damage reports – Rutger Boonstra – june 2008 Royal Netherlands Meteorological Institute (KNMI) – Wageningen University and Research Centre (WUR)
10
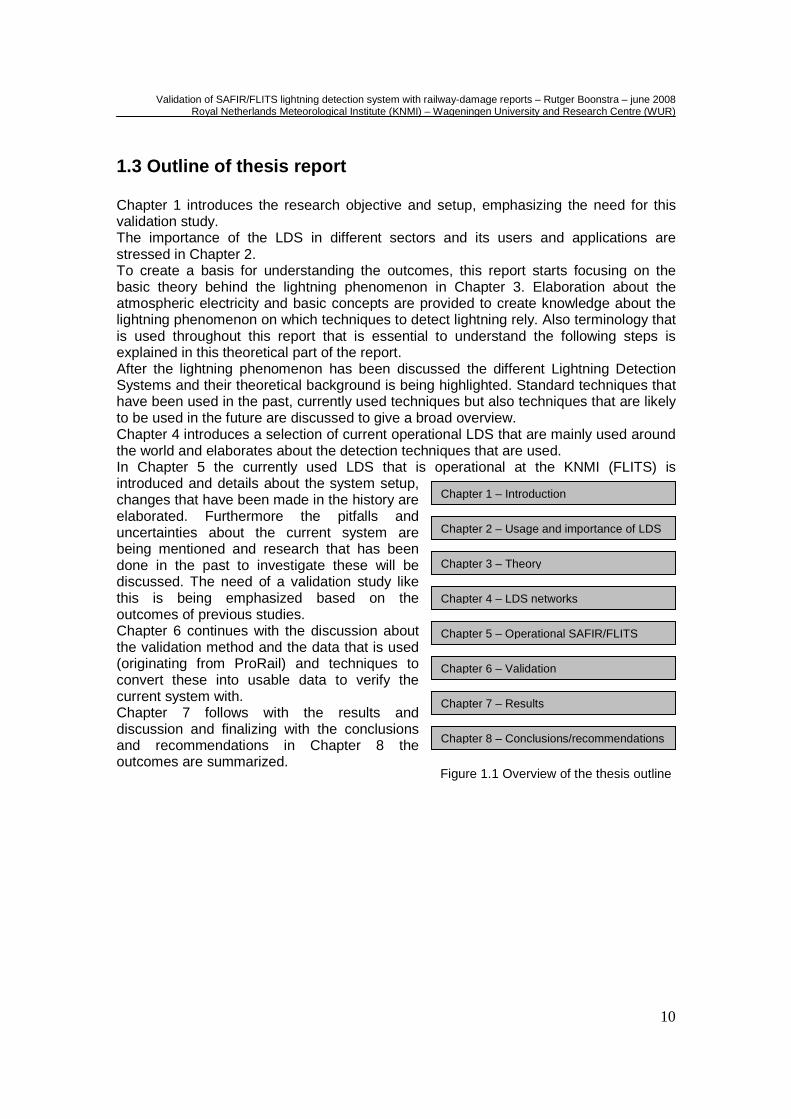
1.3 Outline of thesis report Chapter 1 introduces the research objective and setup, emphasizing the need for this validation study. The importance of the LDS in different sectors and its users and applications are stressed in Chapter 2. To create a basis for understanding the outcomes, this report starts focusing on the basic theory behind the lightning phenomenon in Chapter 3. Elaboration about the atmospheric electricity and basic concepts are provided to create knowledge about the lightning phenomenon on which techniques to detect lightning rely. Also terminology that is used throughout this report that is essential to understand the following steps is explained in this theoretical part of the report. After the lightning phenomenon has been discussed the different Lightning Detection Systems and their theoretical background is being highlighted. Standard techniques that have been used in the past, currently used techniques but also techniques that are likely to be used in the future are discussed to give a broad overview. Chapter 4 introduces a selection of current operational LDS that are mainly used around the world and elaborates about the detection techniques that are used. In Chapter 5 the currently used LDS that is operational at the KNMI (FLITS) is introduced and details about the system setup, changes that have been made in the history are elaborated. Furthermore the pitfalls and uncertainties about the current system are being mentioned and research that has been done in the past to investigate these will be discussed. The need of a validation study like this is being emphasized based on the outcomes of previous studies. Chapter 6 continues with the discussion about the validation method and the data that is used (originating from ProRail) and techniques to convert these into usable data to verify the current system with. Chapter 7 follows with the results and discussion and finalizing with the conclusions and recommendations in Chapter 8 the outcomes are summarized.
Chapter 2 – Usage and importance of LDS
Chapter 1 – Introduction
Chapter 4 – LDS networks
Chapter 5 – Operational SAFIR/FLITS
Chapter 6 – Validation
Chapter 3 – Theory
Chapter 7 – Results
Chapter 8 – Conclusions/recommendations
Figure 1.1 Overview of the thesis outline
Validation of SAFIR/FLITS lightning detection system with railway-damage reports – Rutger Boonstra – june 2008 Royal Netherlands Meteorological Institute (KNMI) – Wageningen University and Research Centre (WUR)
11
2 Usage and importance of lightning detection The LDS is used for several different applications. The first and main application of the LDS is providing real-time information on electrical activity in the atmosphere. The LDS can provide information that can be valuable to the public to plan activities. Therefore the use in weather forecasts is one of the most important applications. Also in other areas as the insurance-branch, (climatologically-) research and aviation the LDS is valuable. Based on the output of the LDS for example safety measurements are taken. In the following pages the usage and the importance of the LDS within certain areas are described. It is emphasized that for the applications derived from the LDS it is evident that the detection system is working properly. Although this statement seems logical, the continuing uncertainties about the probability of detection of the LDS that is subject to validation are ironically not known since the introduction of the system.
2.1 Meteorological Forecasting Lightning detection is used for multiple purposes and applications. Governmental institutes like KNMI in the Netherlands and commercial weather providers have a meteorological office where forecasts are made and broadcasted. Because lightning is associated with (severe) thunderstorms a many (outdoor-) activities (work, recreation, traffic, etc) can be influenced by it, resulting in a public and industrial need for warnings in these occasions. Aviation (public transport, helicopter transfers to oil-platforms, etc) and shipping are under direct influence of weather situations involving thunderstorms. Sometimes thunderstorms disrupt the society in an extraordinary way. To prevent damage and ensure safety KNMI can issue a so called ‘weather-alarm’ to attend people at the risks and possible impact of certain weather conditions. The weather-alarm is only in force under predefined circumstances when certain thresholds are exceeded (exceeded wind speeds, snowfall, rainfall, glaze and extreme amounts of lightning occurrences) (KNMI, 2008). The definition of extraordinary lightning occurrences causing a weather-alarm is based on the lightning detection system that is operational at KNMI of which also commercial service providers make use. When there are more than 500 discharges in a period of 5 minutes in an area of at least 50-50km or around a coherent line of at least 50km the weather-alarm is issued and broadcasted through many channels to reach as much people as possible. Another application of the LDS that is fed by the weather office is a warning application on Schiphol Airport (Amsterdam). Refueling of airplanes or cargo transactions by working personnel are not allowed when lightning occurrences detected by the LDS are within a range of 5km. This is done to provide safety for the working personnel (werkinstruktie elektrische ontladingen, 2006). To detect the first lightning event from a storm or count the amount of discharges within a certain amount of time it is evident that the detection system itself has to work properly. It is therefore necessary that it is known what the probability of detection of the system is.
Validation of SAFIR/FLITS lightning detection system with railway-damage reports – Rutger Boonstra – june 2008 Royal Netherlands Meteorological Institute (KNMI) – Wageningen University and Research Centre (WUR)
12
2.2 Climatologic services Insurance companies also make use of lightning strikes detected by the LDS. When lightning strikes result in damage (e.g. destruction of electronic devices, damage to all kinds of property or equipment, fire, etc) insurance companies try to verify whether there was a thunderstorm present at the time of reported occurrence and if this correlates with the output of the LDS. While insurance companies would like to rely on the LDS in practice this seems not reliable enough. Therefore, insurance companies use the LDS as a tool, not as guidance (Beekhuis, personal comment).
2.3 Statistical forecasts The thunderstorm forecasts and warnings issued by the meteorological office are based on the model output that is relying on so called predictors that have proved to be significant to indicate the possibility of lightning occurrences (CAPE, Boyden, etc). In this sense the selected predictor has a ‘history’ and proved to be relevant. Also in other longer term (climate-) forecasts, which take into account historical data, the likeliness of an occurrence within certain circumstances is estimated. The output-data from the LDS is used to produce the best results possible. Examples are the KAUW and WinterKAUW projects that are still in experimental phase (Slangen and Schmeits, 2008). These systems select the best acting predictors for lightning occurrences based on similar situations in the past and calculate a daily risk of lightning occurrence. Also the so called ‘analog-method’ tries to give the probability of lightning occurrences within certain circumstances similar to previous situations (Kok, Wolters, personal comment). These examples make use of the LDS. More research programs can benefit of the LDS data when increased reliability can be guaranteed.
2.4 Aviation - Aircraft Induced Lightning In aviation lightning also plays an important role. Aircrafts are struck by lightning every now and then. Averages of one lightning strike a year on a single aircraft have been reported. After a lightning-strike the aircraft does not necessarily have to return to the airport and might have no problems that which influence the continuation of the flight. In other cases the aircraft does have damage and has to ground as soon as possible. In both cases the aircraft has to be checked for any damage possible as soon as it is grounded. This procedure takes time and cost aviation-companies a lot of money. In the Netherlands there are typical meteorological conditions in which aircrafts are likely to be struck by lightning in the Dutch coastal area in which Amsterdam-Airport is situated. Typically in winter-conditions when a north-westerly wind advects polar air over the relatively warm North Sea towards the Netherlands there is a threat. In the winter, clouds extend to lower heights than clouds in summer-conditions. Therefore, they seem to contain no potential danger to initiate lightning. However, there can be enough build-up potential in the cloud that waits to be triggered. The moment the aircraft enters the cloud it does have a triggering effect and creates an Aircraft Induced Lightning (AIL). Research has been done to create a warning system that warns pilots for these circumstances so they can be avoided (Hemink, 2008).
Validation of SAFIR/FLITS lightning detection system with railway-damage reports – Rutger Boonstra – june 2008 Royal Netherlands Meteorological Institute (KNMI) – Wageningen University and Research Centre (WUR)
13
2.5 Additional usage Because the Dutch LDS is validated, this report mainly focuses on the Netherlands. However, a small notion has to be made for another possible application of the LDS. In the United States LDS are also used to detect forest fires initialized by lightning-storms in dry areas (Krider et al, 1980). In so called fire-weather the meteorologists can inform authorities of possible outbreaks due to lightning which proves to be useful. Another user can be the military in certain conditions to cover their activities. Furthermore the LDS can be used by power plants by gathering statistical data and use this as a tool for managing of the protection equipment (Chauzy et al, 2005). Another usage can be flood prediction while thunderstorms are correlated with heavy rain. The mentioned usage shows the need for a well functioning detection system that is being used primarily for warning- or precautional applications. The need in other related areas indicate a widespread usability and adaptability of the system.
Validation of SAFIR/FLITS lightning detection system with railway-damage reports – Rutger Boonstra – june 2008 Royal Netherlands Meteorological Institute (KNMI) – Wageningen University and Research Centre (WUR)
14
3 Theory
3.1 Lightning phenomenon and terminology
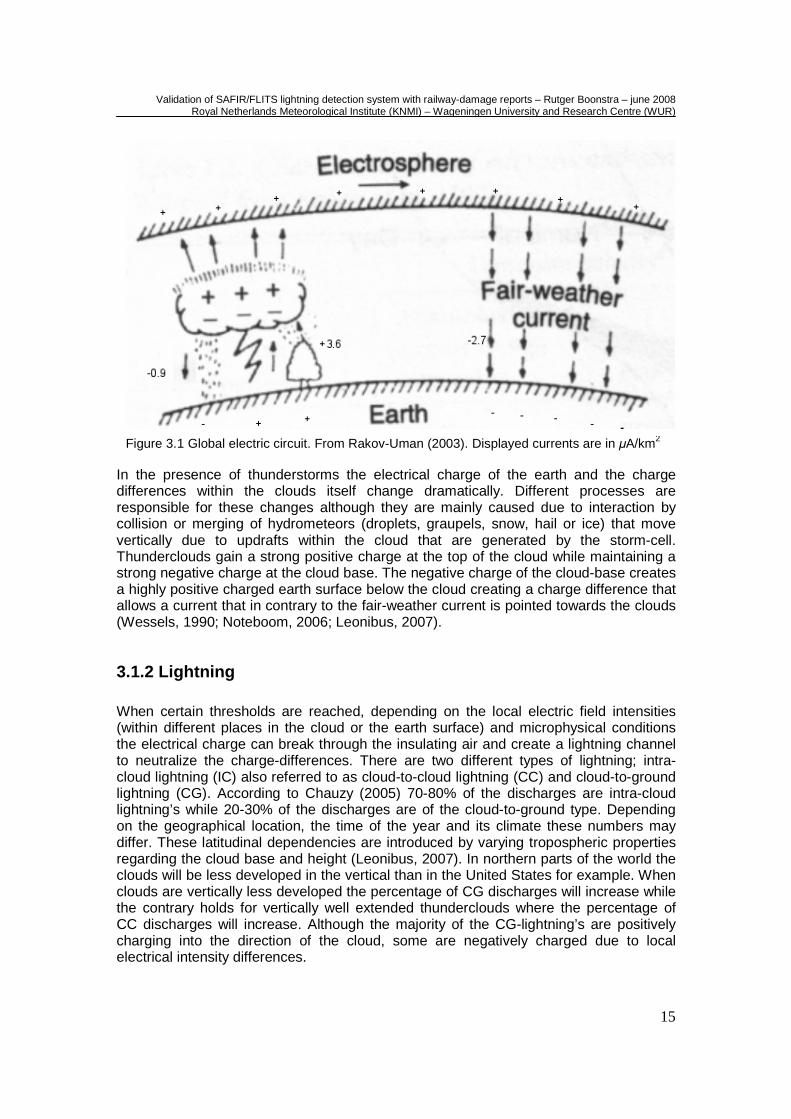
3.1.1 Atmospheric electricity Thunderstorms are part of a worldwide electrical circuit in the atmosphere in which the thunderstorms function as current generators in a cycle between the ionosphere (about 50km above the earth surface) and the earth surface. Nature is neutralizing charge differences between the positively charged ionosphere (around V5103⋅ ) relative to the
earth. Although air is a poor conductor (the breakdown voltage is about 16103 −⋅ Vm ), especially in the lower parts of the atmosphere, it allows some transport of current: the fair-weather current. Under fair-weather conditions the ground-level electric field is around 1100 −Vm . On average the fair weather current is equal to 27.2 −Akmµ and is present in all areas where storms are absent. Another process responsible of transporting charge in the direction of the earth surface is precipitation. Precipitation is responsible for a current of 29.0 −Akmµ in the direction of the earth. A neutralization of the charge difference between the ionosphere and the earth is therefore expected. In practice the charge differences are maintained over time and therefore there needs to be a mechanism that is transporting charge to the ionosphere. On average 1500 thunderstorms are present around the world at any moment responsible for this charging function of the ionosphere. In the presence of a thunderstorm the ground-level electrical field can raise up to 15104.3 −⋅ Vm due to processes in the storms that will be described. The mechanism to create the current making use of this electrical field is lightning which is responsible for a current of 26.3 −Akmµ charging the cloud-tops of the storms positive which at its turn deliver the charge to the ionosphere. In contrary to the lower part of the atmosphere the air in the upper part of the atmosphere conducts the charge in a better way caused by the availability of more free ions. By the previously described the electrical circle of the atmosphere is closed (see also figure 3.1 for a graphical representation).
Validation of SAFIR/FLITS lightning detection system with railway-damage reports – Rutger Boonstra – june 2008 Royal Netherlands Meteorological Institute (KNMI) – Wageningen University and Research Centre (WUR)
15
In the presence of thunderstorms the electrical charge of the earth and the charge differences within the clouds itself change dramatically. Different processes are responsible for these changes although they are mainly caused due to interaction by collision or merging of hydrometeors (droplets, graupels, snow, hail or ice) that move vertically due to updrafts within the cloud that are generated by the storm-cell. Thunderclouds gain a strong positive charge at the top of the cloud while maintaining a strong negative charge at the cloud base. The negative charge of the cloud-base creates a highly positive charged earth surface below the cloud creating a charge difference that allows a current that in contrary to the fair-weather current is pointed towards the clouds (Wessels, 1990; Noteboom, 2006; Leonibus, 2007).
3.1.2 Lightning When certain thresholds are reached, depending on the local electric field intensities (within different places in the cloud or the earth surface) and microphysical conditions the electrical charge can break through the insulating air and create a lightning channel to neutralize the charge-differences. There are two different types of lightning; intra-cloud lightning (IC) also referred to as cloud-to-cloud lightning (CC) and cloud-to-ground lightning (CG). According to Chauzy (2005) 70-80% of the discharges are intra-cloud lightning’s while 20-30% of the discharges are of the cloud-to-ground type. Depending on the geographical location, the time of the year and its climate these numbers may differ. These latitudinal dependencies are introduced by varying tropospheric properties regarding the cloud base and height (Leonibus, 2007). In northern parts of the world the clouds will be less developed in the vertical than in the United States for example. When clouds are vertically less developed the percentage of CG discharges will increase while the contrary holds for vertically well extended thunderclouds where the percentage of CC discharges will increase. Although the majority of the CG-lightning’s are positively charging into the direction of the cloud, some are negatively charged due to local electrical intensity differences.
Figure 3.1 Global electric circuit. From Rakov-Uman (2003). Displayed currents are in µA/km2
Validation of SAFIR/FLITS lightning detection system with railway-damage reports – Rutger Boonstra – june 2008 Royal Netherlands Meteorological Institute (KNMI) – Wageningen University and Research Centre (WUR)
16
When explaining the formation of a lightning occurrence some definitions have be clarified first. A lightning flash is a total lightning event including the initial and successive (return-) group of strokes that are needed to complete the current discharge. A stroke is part of a flash indicating a single step in the whole process of a lightning flash, for example a single discharge event out of a successive series. The formation of lightning starts with a so called bi-leader or stepped leader (lightning’s starting from elevated structures like high buildings or mountains excluded). In this phase the leader that is started due to local conditions (for example a region of low negative charge) that are hosting the event is propagating towards a region of different polarity. For a positively charged leader this means the stepped leader is propagating towards a negatively charged zone while the opposite holds for a negatively charged leader to equal or neutralize the charge. In the case of a CC-lightning the neutralization takes places within or between the cloud and once the leader discharge is finished a so called recoil-streamer or return stroke is propagating back through the previously formed ionized channel which involves high current intensities and produces the highest temperature, luminosity and thunder (Chauzy et al, 2005). The return stroke also allows small breakdown channels to be formed around the main channel (Cummings et al, 2000). In the case of a CG-discharge the stepped-leader is also propagating to the ground and at the moment the leader gets in a range of several tens of meters above the ground an upward connecting discharge is formed due to the increase electrical field under the tip of the leader (Cummings et al, 2000). In this process a connection to the earth surface is triggered. The return stroke that is formed after the bi-leader (or stepped leader) discharge creates similar to the CC-discharge an ionized lightning channel containing similar properties as described before. After the return stroke another so called dart leader can follow an initiate a successive return stroke. Multiple successive return strokes can follow after the initial return stroke using the previously formed ionized channel and can last for about 1.5 seconds until the charge around the lightning base is sufficiently depleted or replaced by an excess charge. According to Cummings et al. 2000 in roughly 30-50% of the flashes the dart leader creates a new path forming a new channel resulting in one or more ground impacts. These successive strokes result in the flickering that is often observed in the case of long-lasting lightning occurrences. The initial stepped leader consists of separate steps having a length of a few meters containing a temperature of about 10000 ˚K with a current of about 1 kA. The return stroke can have a length up to several kilometers containing an increased temperature
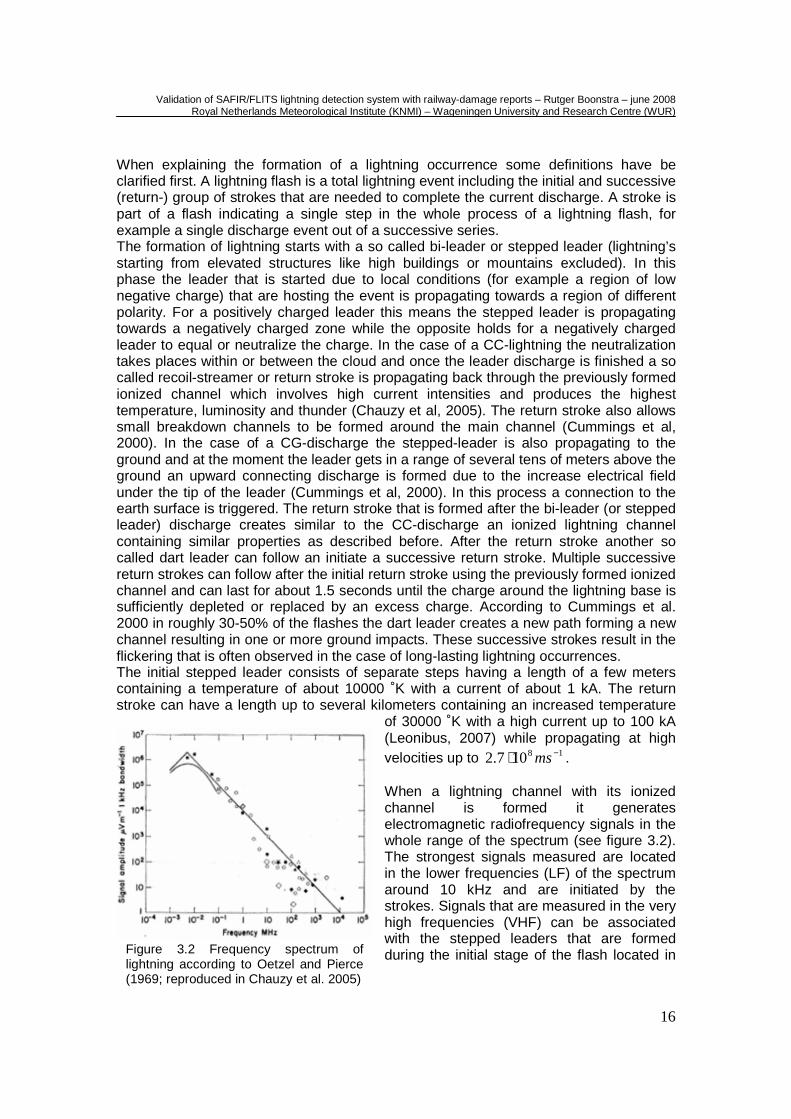
of 30000 ˚K with a high current up to 100 kA (Leonibus, 2007) while propagating at high velocities up to 18107.2 −⋅ ms . When a lightning channel with its ionized channel is formed it generates electromagnetic radiofrequency signals in the whole range of the spectrum (see figure 3.2). The strongest signals measured are located in the lower frequencies (LF) of the spectrum around 10 kHz and are initiated by the strokes. Signals that are measured in the very high frequencies (VHF) can be associated with the stepped leaders that are formed during the initial stage of the flash located in Figure 3.2 Frequency spectrum of
lightning according to Oetzel and Pierce (1969; reproduced in Chauzy et al. 2005)
Validation of SAFIR/FLITS lightning detection system with railway-damage reports – Rutger Boonstra – june 2008 Royal Netherlands Meteorological Institute (KNMI) – Wageningen University and Research Centre (WUR)
17
the clouds. These emitted frequencies are detectable by antennas and used by several detection techniques as described later in the report. Besides the electromagnetic radiation that is emitted also light emission is released which is detectable from space by satellites. This and other properties that are used to detect lightning are discussed in paragraph 3.2.
3.2 Lightning Detection Systems (LDS)
3.2.1 Lightning Detection – Introduction Various techniques to detect lightning occurrences have been developed in the second half of the 20th century. Well known characteristics of lightning strikes which can be detected by observation have been used. Besides the ancient observational capabilities of men by observing luminescent lightning or hearing the audible thunder one of the first techniques to detect lightning was based on the changes in the electrostatic field that occur very quickly within a thunderstorm. To measure the electrostatic field so called field mills were used (Chauzy et al, 2005). This technique proved to be working within a radius of 10km around the lightning strike. To determine whether the occurrence is related to an intra-cloud or a cloud-to-ground strike and to determine the location of the occurrence many field mills are required where high resolution is necessary to analyze the electric field variation corresponding to the lightning flash duration. Another method with radar detection was used. 10 and 23cm wavelength radars were used to measure the backscatter of the ionized lightning channel (Rust et al, 1981). With this method it was also possible to see relations between the precipitation-rate of a thunderstorm and the occurrence of a lightning. For a detection-network the use of radar is not sufficient while it is likely to miss occurrences. Due to the fact that the turning radar has a low sample rate and it has to be pointed in a direction and elevated to a desired height it is not likely that radar is used in a network for lightning detection. Detection based on the sound of thunder corresponding to a lightning discharge has also been used to create a detection network in the seventies (Chauzy et al, 2005). Based on an array of microphones and the time differences in the arrival of the sound wave between the microphones for the same lightning discharge the location of the occurrence can be estimated. The propagation time is calculated by the difference between the electromagnetic signal measured with an antenna and the measurement of the acoustic sound by the microphones. Disadvantage is the way sound waves propagate trough the atmosphere; they can be bend, held-up or blocked by several factors. Analogue to the method based on electrostatic differences with the field mills, this method needs a very large amount of microphones to cover a desired large area which is a major disadvantage. Besides of the fact that a lot of microphones are needed, it is hard to make the discrimination between CC and CG occurrences with a method like this and act as a TOTAL LDS in this way. TOTAL lightning systems are systems that can distinct CC and CG lightning. Lightning detection by the use of electromagnetic radiation has been developed and improved over the last decades. As seen in figure 3.2 lightning strikes produce emission over a large range of frequencies. Some frequency ranges are typical for the different phases of a lightning strike or type and can be used to characterize lightning occurrences. The radiation in the high frequencies (30-300 MHz) is typical for the leader
Validation of SAFIR/FLITS lightning detection system with railway-damage reports – Rutger Boonstra – june 2008 Royal Netherlands Meteorological Institute (KNMI) – Wageningen University and Research Centre (WUR)
18
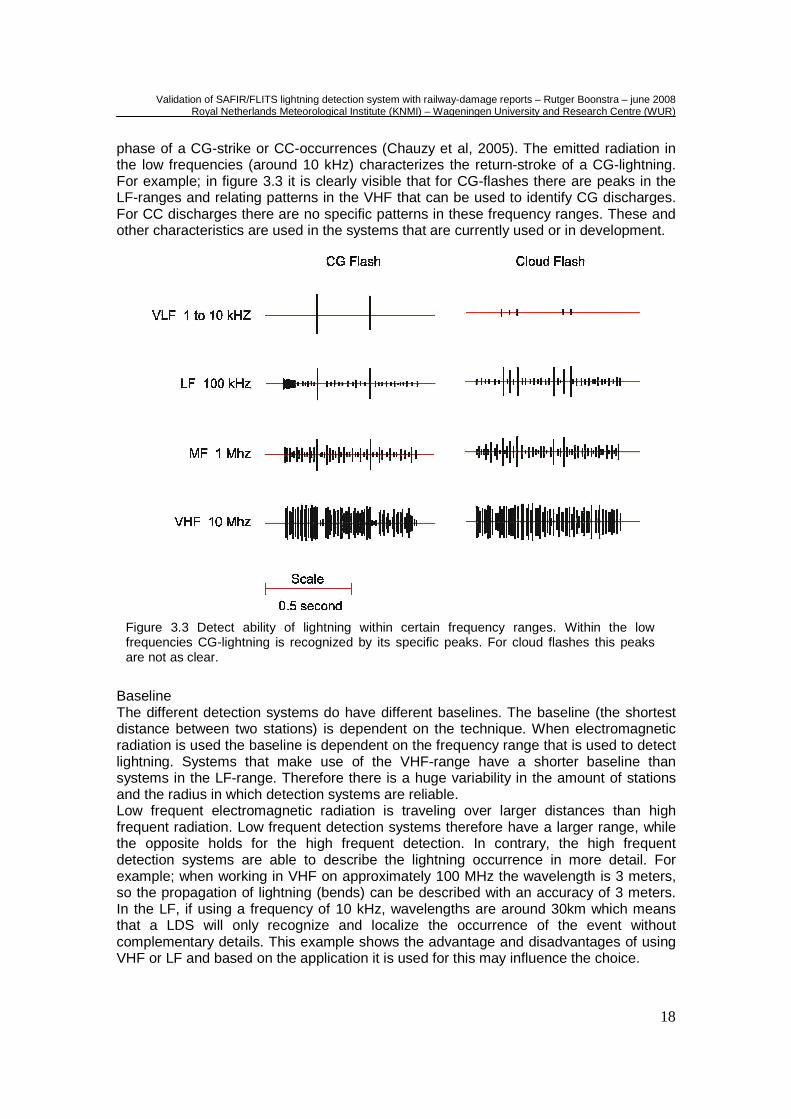
phase of a CG-strike or CC-occurrences (Chauzy et al, 2005). The emitted radiation in the low frequencies (around 10 kHz) characterizes the return-stroke of a CG-lightning. For example; in figure 3.3 it is clearly visible that for CG-flashes there are peaks in the LF-ranges and relating patterns in the VHF that can be used to identify CG discharges. For CC discharges there are no specific patterns in these frequency ranges. These and other characteristics are used in the systems that are currently used or in development.
Baseline The different detection systems do have different baselines. The baseline (the shortest distance between two stations) is dependent on the technique. When electromagnetic radiation is used the baseline is dependent on the frequency range that is used to detect lightning. Systems that make use of the VHF-range have a shorter baseline than systems in the LF-range. Therefore there is a huge variability in the amount of stations and the radius in which detection systems are reliable. Low frequent electromagnetic radiation is traveling over larger distances than high frequent radiation. Low frequent detection systems therefore have a larger range, while the opposite holds for the high frequent detection. In contrary, the high frequent detection systems are able to describe the lightning occurrence in more detail. For example; when working in VHF on approximately 100 MHz the wavelength is 3 meters, so the propagation of lightning (bends) can be described with an accuracy of 3 meters. In the LF, if using a frequency of 10 kHz, wavelengths are around 30km which means that a LDS will only recognize and localize the occurrence of the event without complementary details. This example shows the advantage and disadvantages of using VHF or LF and based on the application it is used for this may influence the choice.
Figure 3.3 Detect ability of lightning within certain frequency ranges. Within the low frequencies CG-lightning is recognized by its specific peaks. For cloud flashes this peaks are not as clear.
Validation of SAFIR/FLITS lightning detection system with railway-damage reports – Rutger Boonstra – june 2008 Royal Netherlands Meteorological Institute (KNMI) – Wageningen University and Research Centre (WUR)
19
Although there are some similarities between lightning detection systems there are also different approaches and techniques used. To gain more insight in these techniques and the associated uncertainties and pitfalls, an overview of current detection methods and upcoming systems is given.
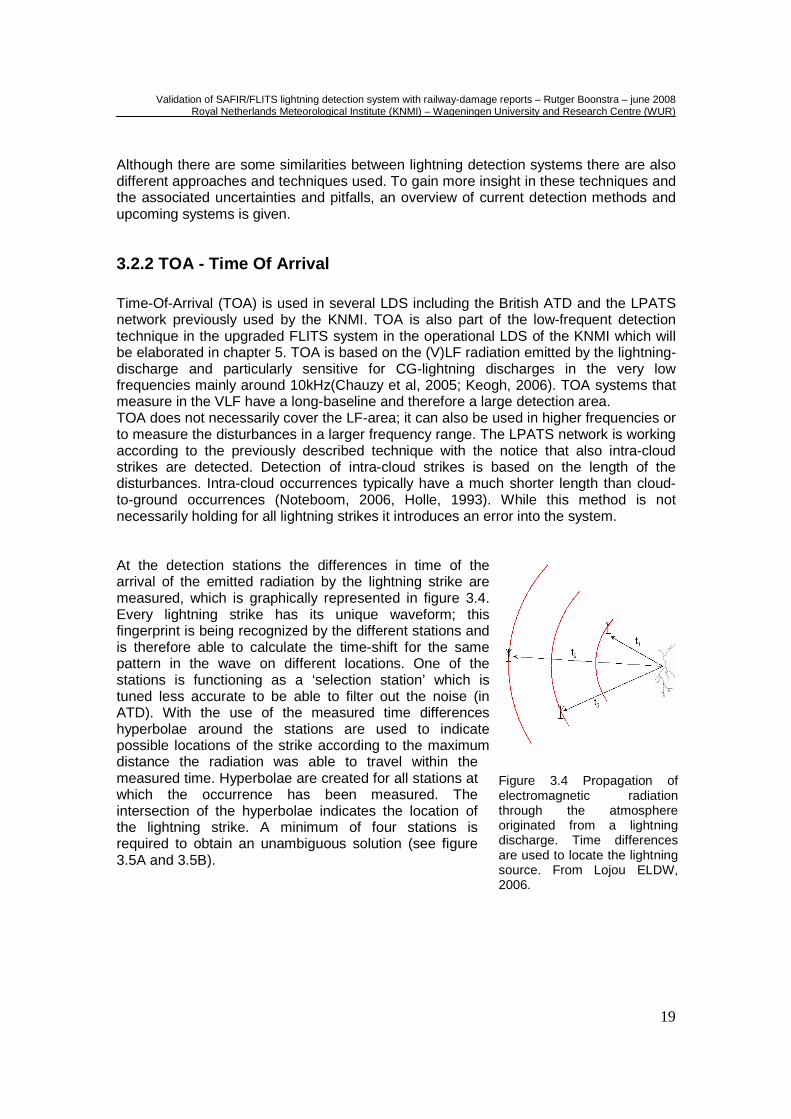
3.2.2 TOA - Time Of Arrival Time-Of-Arrival (TOA) is used in several LDS including the British ATD and the LPATS network previously used by the KNMI. TOA is also part of the low-frequent detection technique in the upgraded FLITS system in the operational LDS of the KNMI which will be elaborated in chapter 5. TOA is based on the (V)LF radiation emitted by the lightning-discharge and particularly sensitive for CG-lightning discharges in the very low frequencies mainly around 10kHz(Chauzy et al, 2005; Keogh, 2006). TOA systems that measure in the VLF have a long-baseline and therefore a large detection area. TOA does not necessarily cover the LF-area; it can also be used in higher frequencies or to measure the disturbances in a larger frequency range. The LPATS network is working according to the previously described technique with the notice that also intra-cloud strikes are detected. Detection of intra-cloud strikes is based on the length of the disturbances. Intra-cloud occurrences typically have a much shorter length than cloud-to-ground occurrences (Noteboom, 2006, Holle, 1993). While this method is not necessarily holding for all lightning strikes it introduces an error into the system. At the detection stations the differences in time of the arrival of the emitted radiation by the lightning strike are measured, which is graphically represented in figure 3.4. Every lightning strike has its unique waveform; this fingerprint is being recognized by the different stations and is therefore able to calculate the time-shift for the same pattern in the wave on different locations. One of the stations is functioning as a ‘selection station’ which is tuned less accurate to be able to filter out the noise (in ATD). With the use of the measured time differences hyperbolae around the stations are used to indicate possible locations of the strike according to the maximum distance the radiation was able to travel within the measured time. Hyperbolae are created for all stations at which the occurrence has been measured. The intersection of the hyperbolae indicates the location of the lightning strike. A minimum of four stations is required to obtain an unambiguous solution (see figure 3.5A and 3.5B).
Figure 3.4 Propagation of electromagnetic radiation through the atmosphere originated from a lightning discharge. Time differences are used to locate the lightning source. From Lojou ELDW, 2006.
Validation of SAFIR/FLITS lightning detection system with railway-damage reports – Rutger Boonstra – june 2008 Royal Netherlands Meteorological Institute (KNMI) – Wageningen University and Research Centre (WUR)
20
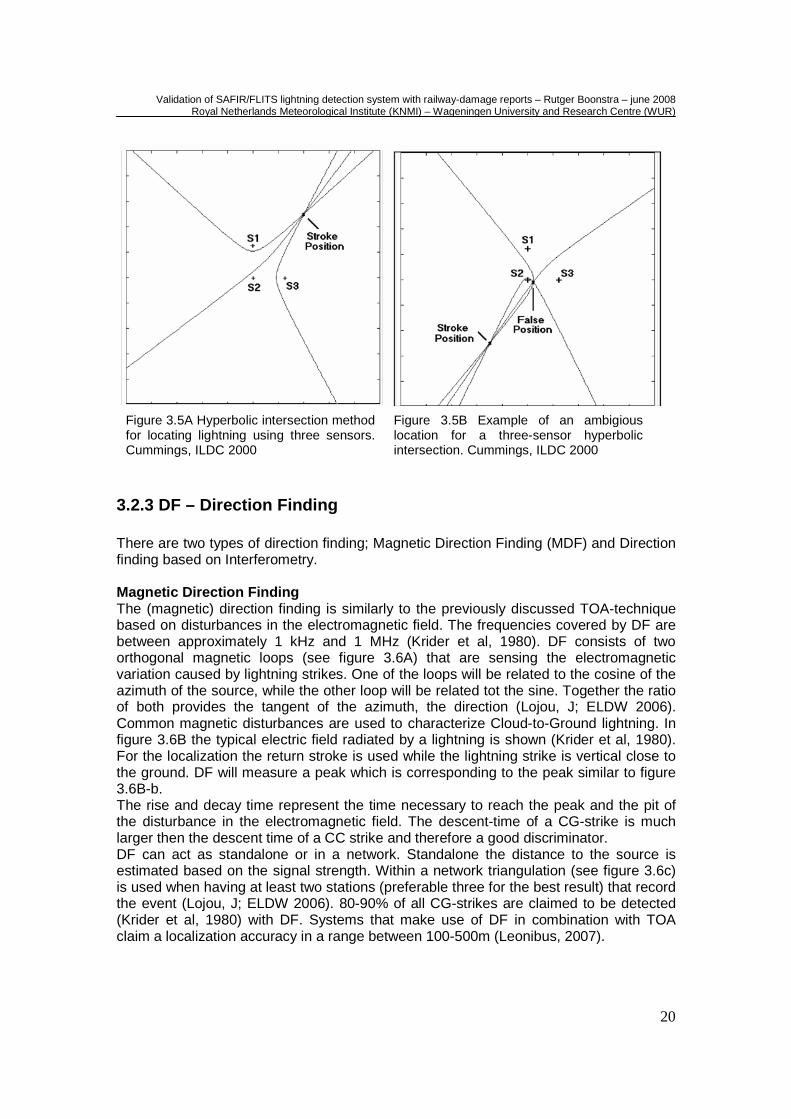
3.2.3 DF – Direction Finding There are two types of direction finding; Magnetic Direction Finding (MDF) and Direction finding based on Interferometry. Magnetic Direction Finding The (magnetic) direction finding is similarly to the previously discussed TOA-technique based on disturbances in the electromagnetic field. The frequencies covered by DF are between approximately 1 kHz and 1 MHz (Krider et al, 1980). DF consists of two orthogonal magnetic loops (see figure 3.6A) that are sensing the electromagnetic variation caused by lightning strikes. One of the loops will be related to the cosine of the azimuth of the source, while the other loop will be related tot the sine. Together the ratio of both provides the tangent of the azimuth, the direction (Lojou, J; ELDW 2006). Common magnetic disturbances are used to characterize Cloud-to-Ground lightning. In figure 3.6B the typical electric field radiated by a lightning is shown (Krider et al, 1980). For the localization the return stroke is used while the lightning strike is vertical close to the ground. DF will measure a peak which is corresponding to the peak similar to figure 3.6B-b. The rise and decay time represent the time necessary to reach the peak and the pit of the disturbance in the electromagnetic field. The descent-time of a CG-strike is much larger then the descent time of a CC strike and therefore a good discriminator. DF can act as standalone or in a network. Standalone the distance to the source is estimated based on the signal strength. Within a network triangulation (see figure 3.6c) is used when having at least two stations (preferable three for the best result) that record the event (Lojou, J; ELDW 2006). 80-90% of all CG-strikes are claimed to be detected (Krider et al, 1980) with DF. Systems that make use of DF in combination with TOA claim a localization accuracy in a range between 100-500m (Leonibus, 2007).
Figure 3.5A Hyperbolic intersection method for locating lightning using three sensors. Cummings, ILDC 2000
Figure 3.5B Example of an ambigious location for a three-sensor hyperbolic intersection. Cummings, ILDC 2000
Validation of SAFIR/FLITS lightning detection system with railway-damage reports – Rutger Boonstra – june 2008 Royal Netherlands Meteorological Institute (KNMI) – Wageningen University and Research Centre (WUR)
21
A. B. C.
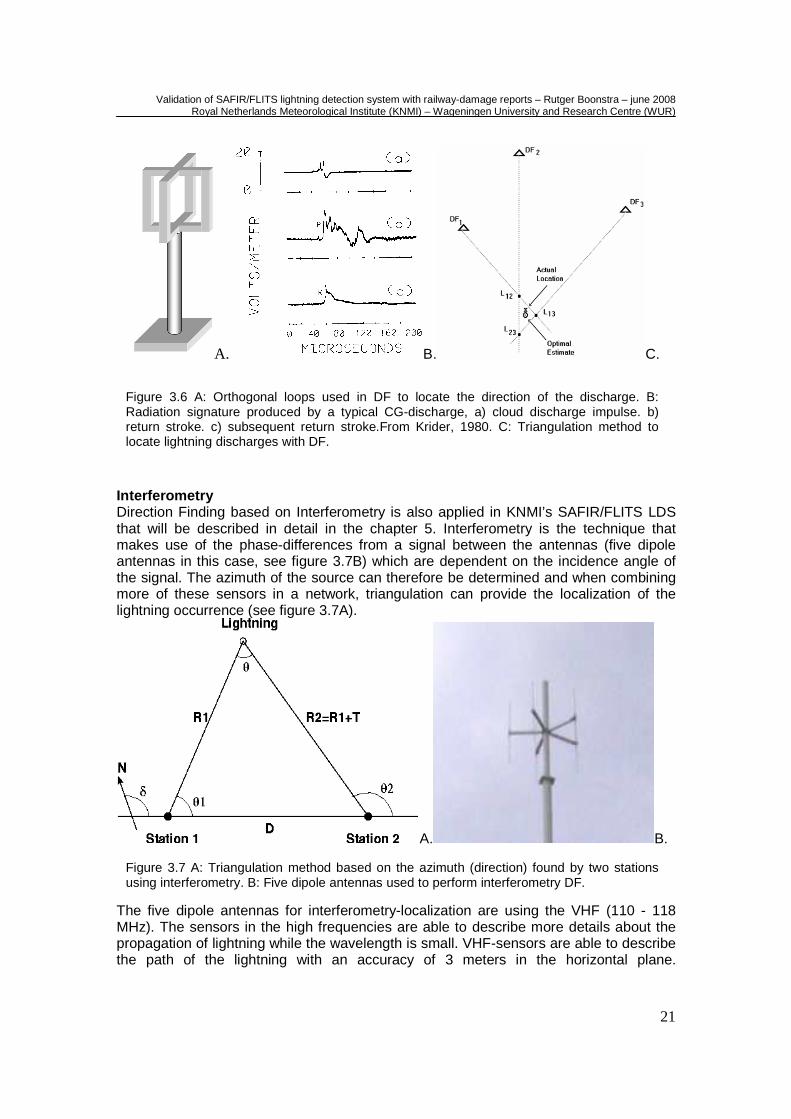
Interferometry Direction Finding based on Interferometry is also applied in KNMI’s SAFIR/FLITS LDS that will be described in detail in the chapter 5. Interferometry is the technique that makes use of the phase-differences from a signal between the antennas (five dipole antennas in this case, see figure 3.7B) which are dependent on the incidence angle of the signal. The azimuth of the source can therefore be determined and when combining more of these sensors in a network, triangulation can provide the localization of the lightning occurrence (see figure 3.7A).
A. B.
The five dipole antennas for interferometry-localization are using the VHF (110 - 118 MHz). The sensors in the high frequencies are able to describe more details about the propagation of lightning while the wavelength is small. VHF-sensors are able to describe the path of the lightning with an accuracy of 3 meters in the horizontal plane.
Figure 3.6 A: Orthogonal loops used in DF to locate the direction of the discharge. B: Radiation signature produced by a typical CG-discharge, a) cloud discharge impulse. b) return stroke. c) subsequent return stroke.From Krider, 1980. C: Triangulation method to locate lightning discharges with DF.
Figure 3.7 A: Triangulation method based on the azimuth (direction) found by two stations using interferometry. B: Five dipole antennas used to perform interferometry DF.
Validation of SAFIR/FLITS lightning detection system with railway-damage reports – Rutger Boonstra – june 2008 Royal Netherlands Meteorological Institute (KNMI) – Wageningen University and Research Centre (WUR)
22
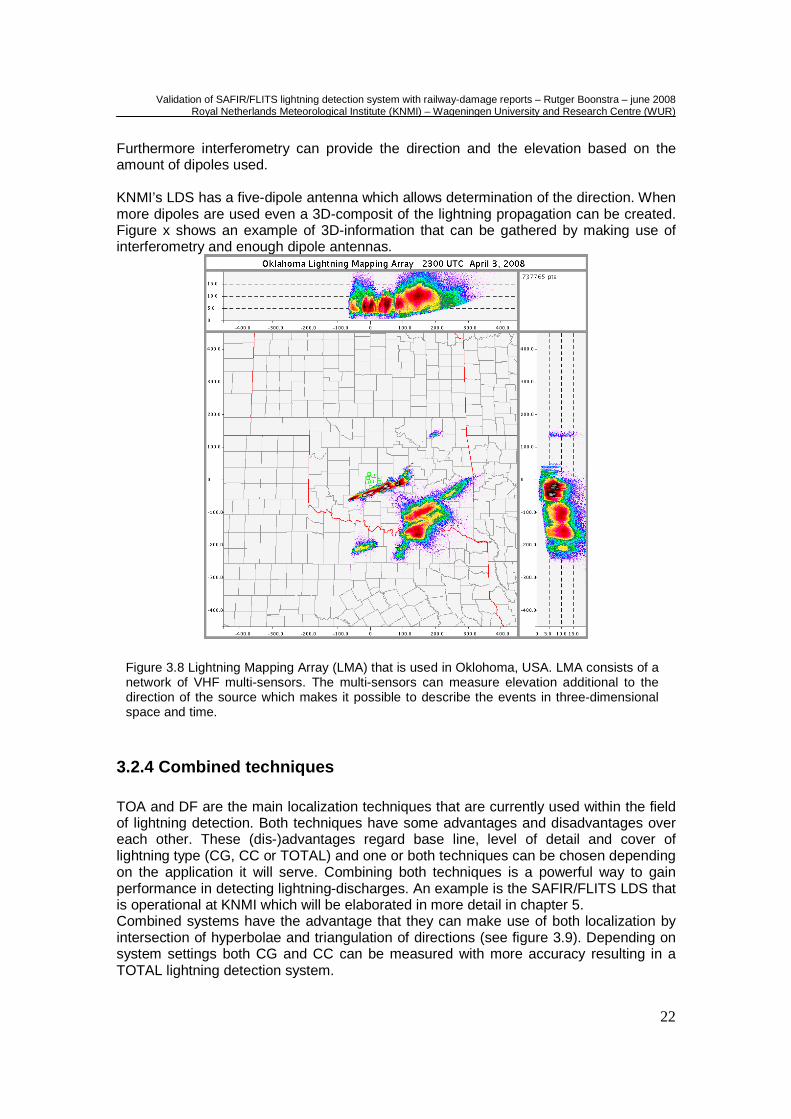
Furthermore interferometry can provide the direction and the elevation based on the amount of dipoles used. KNMI’s LDS has a five-dipole antenna which allows determination of the direction. When more dipoles are used even a 3D-composit of the lightning propagation can be created. Figure x shows an example of 3D-information that can be gathered by making use of interferometry and enough dipole antennas.
3.2.4 Combined techniques TOA and DF are the main localization techniques that are currently used within the field of lightning detection. Both techniques have some advantages and disadvantages over each other. These (dis-)advantages regard base line, level of detail and cover of lightning type (CG, CC or TOTAL) and one or both techniques can be chosen depending on the application it will serve. Combining both techniques is a powerful way to gain performance in detecting lightning-discharges. An example is the SAFIR/FLITS LDS that is operational at KNMI which will be elaborated in more detail in chapter 5. Combined systems have the advantage that they can make use of both localization by intersection of hyperbolae and triangulation of directions (see figure 3.9). Depending on system settings both CG and CC can be measured with more accuracy resulting in a TOTAL lightning detection system.
Figure 3.8 Lightning Mapping Array (LMA) that is used in Oklohoma, USA. LMA consists of a network of VHF multi-sensors. The multi-sensors can measure elevation additional to the direction of the source which makes it possible to describe the events in three-dimensional space and time.
Validation of SAFIR/FLITS lightning detection system with railway-damage reports – Rutger Boonstra – june 2008 Royal Netherlands Meteorological Institute (KNMI) – Wageningen University and Research Centre (WUR)
23
3.2.5 Lightning detection in the future LOFAR ASTRON, the Dutch institute for astronomical research is currently developing a new innovative low-frequency radio telescope LOFAR. This LF radio telescope is containing a network of approximately 7700 dipole antennas in an area covering ultimately 160 km in diameter (Holleman et al, 2006 ILDC). The sensors measure in the LF (10 – 80 MHz) and VHF (120 – 240 MHz) and collecting the phase, direction and power of the radiation received. Besides of the initial goals of the LOFAR project the mentioned variables can be used to detect lightning. Prototypes have shown some promising detection capabilities including high temporal and spatial resolution. For the Netherlands this project is an interesting opportunity in the future to detect, measure and research the lightning phenomenon with three-dimensional detail. Infrasound KNMI is operates infrasound sensors for seismological purposes. Other than the previous systems that measure electromagnetic radiation, infrasound detection is based on the propagation of sound waves through the atmosphere. Direction and intensity are measured in an array of micro-barometers. These infrasound sensors are measuring in a frequency range from 0.002 – 20 Hz and are capable to detect amplitudes of less than 0.01 Pa (Holleman et al, 2006). Infrasound is therefore able to detect sound waves released during the formation of the ionized lightning channel while they create a dominant frequency between 1-5 Hz. (Assink et al, 2008).
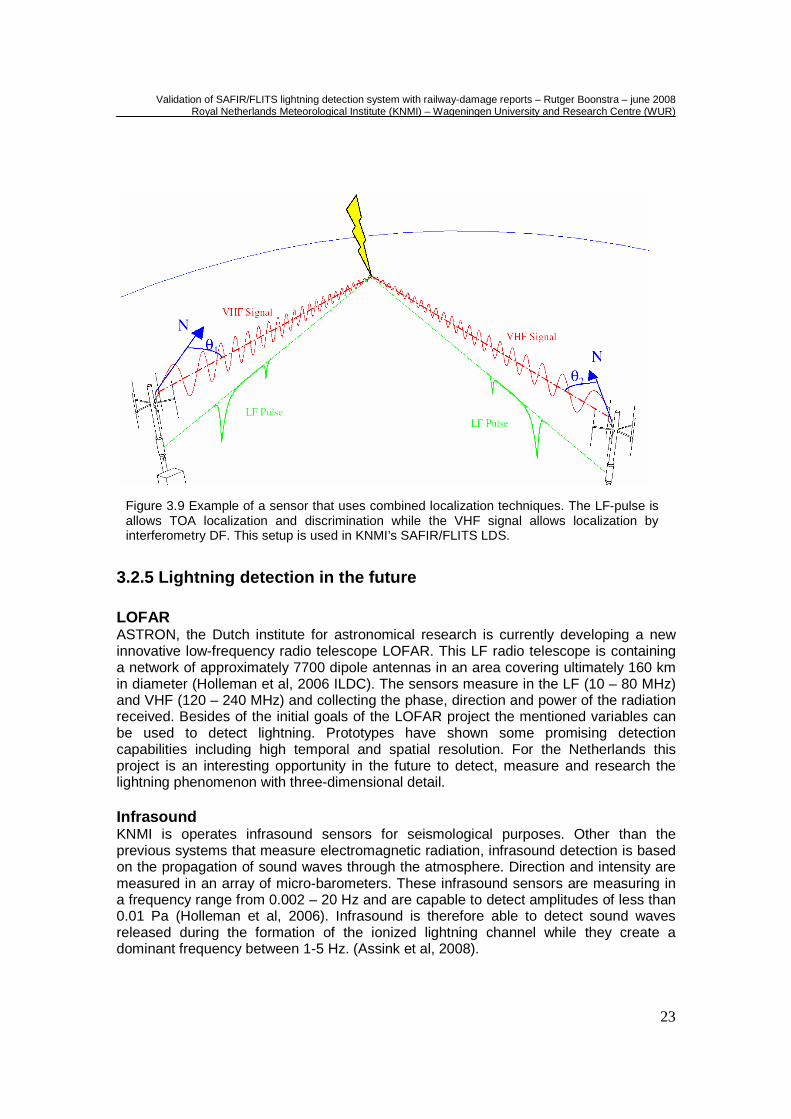
Figure 3.9 Example of a sensor that uses combined localization techniques. The LF-pulse is allows TOA localization and discrimination while the VHF signal allows localization by interferometry DF. This setup is used in KNMI’s SAFIR/FLITS LDS.
Validation of SAFIR/FLITS lightning detection system with railway-damage reports – Rutger Boonstra – june 2008 Royal Netherlands Meteorological Institute (KNMI) – Wageningen University and Research Centre (WUR)
24
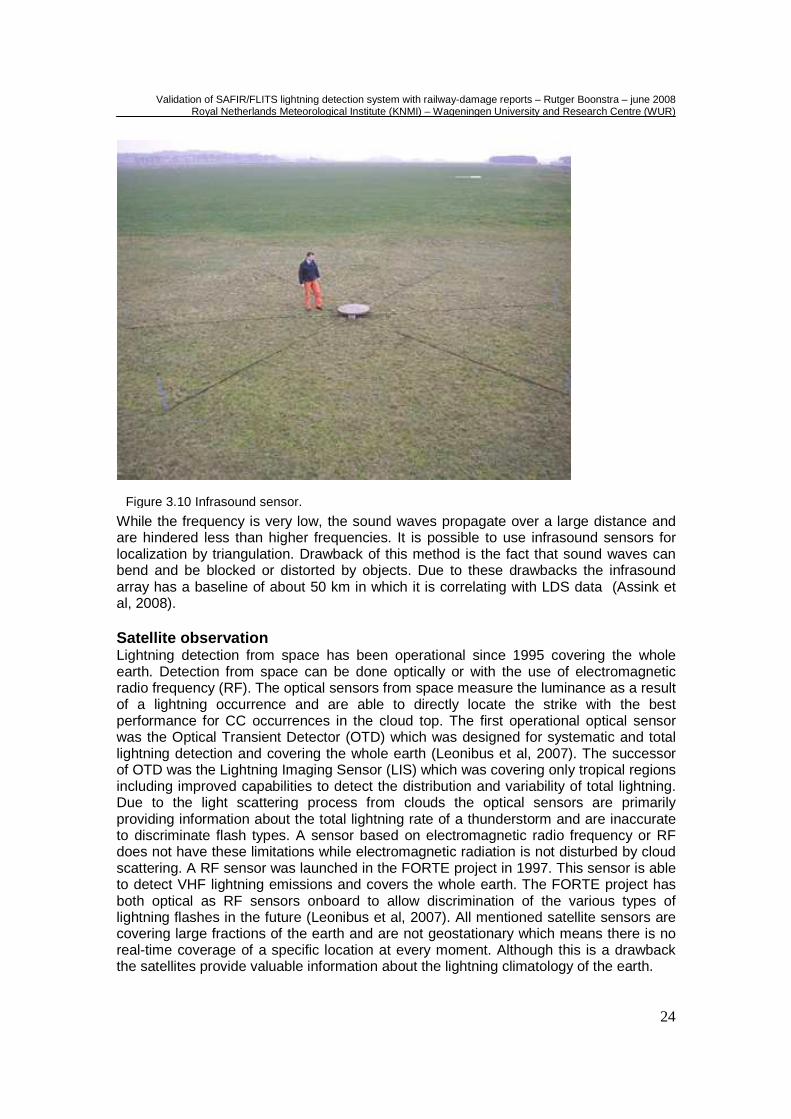
While the frequency is very low, the sound waves propagate over a large distance and are hindered less than higher frequencies. It is possible to use infrasound sensors for localization by triangulation. Drawback of this method is the fact that sound waves can bend and be blocked or distorted by objects. Due to these drawbacks the infrasound array has a baseline of about 50 km in which it is correlating with LDS data (Assink et al, 2008). Satellite observation Lightning detection from space has been operational since 1995 covering the whole earth. Detection from space can be done optically or with the use of electromagnetic radio frequency (RF). The optical sensors from space measure the luminance as a result of a lightning occurrence and are able to directly locate the strike with the best performance for CC occurrences in the cloud top. The first operational optical sensor was the Optical Transient Detector (OTD) which was designed for systematic and total lightning detection and covering the whole earth (Leonibus et al, 2007). The successor of OTD was the Lightning Imaging Sensor (LIS) which was covering only tropical regions including improved capabilities to detect the distribution and variability of total lightning. Due to the light scattering process from clouds the optical sensors are primarily providing information about the total lightning rate of a thunderstorm and are inaccurate to discriminate flash types. A sensor based on electromagnetic radio frequency or RF does not have these limitations while electromagnetic radiation is not disturbed by cloud scattering. A RF sensor was launched in the FORTE project in 1997. This sensor is able to detect VHF lightning emissions and covers the whole earth. The FORTE project has both optical as RF sensors onboard to allow discrimination of the various types of lightning flashes in the future (Leonibus et al, 2007). All mentioned satellite sensors are covering large fractions of the earth and are not geostationary which means there is no real-time coverage of a specific location at every moment. Although this is a drawback the satellites provide valuable information about the lightning climatology of the earth.
Figure 3.10 Infrasound sensor.
Validation of SAFIR/FLITS lightning detection system with railway-damage reports – Rutger Boonstra – june 2008 Royal Netherlands Meteorological Institute (KNMI) – Wageningen University and Research Centre (WUR)
25
4 Lightning detection networks In Europe there are mainly three LDS networks that provide information for all sorts of applications regarding lightning-discharges; ATDNet, LINET and national and international networks that consist of Vaisala detection equipment. These networks will be described briefly and comparison of features of the networks will be performed in the following chapter
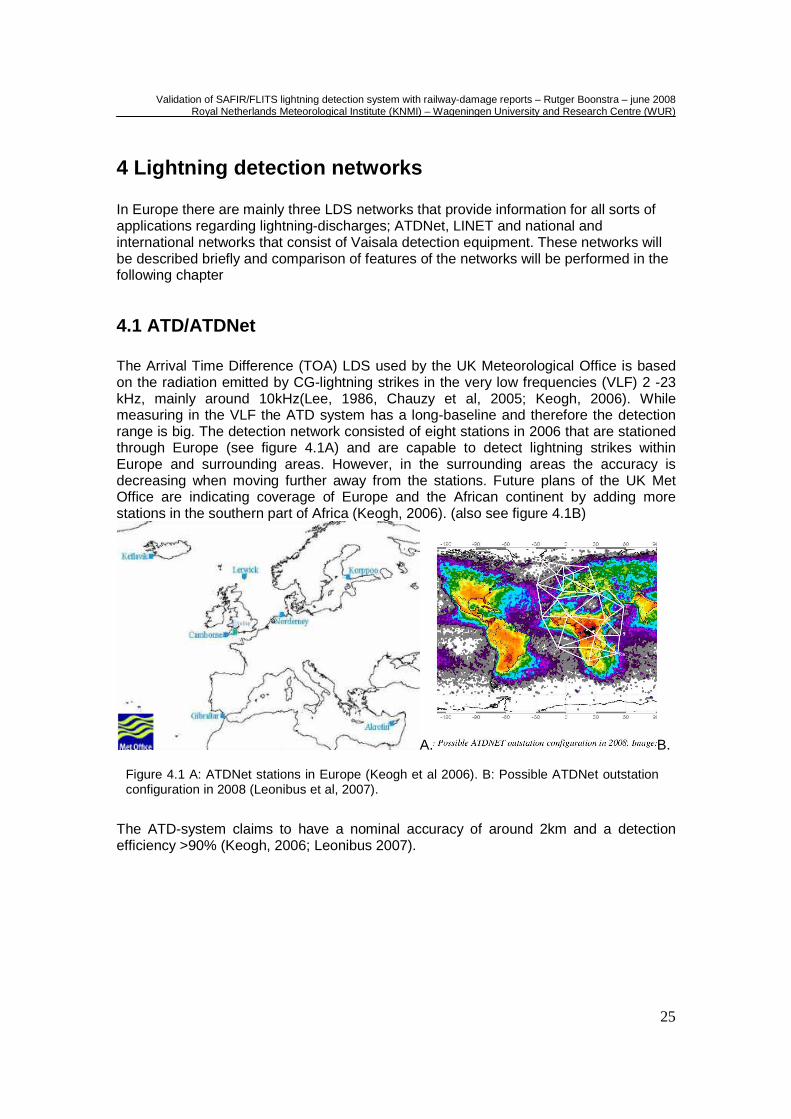
4.1 ATD/ATDNet The Arrival Time Difference (TOA) LDS used by the UK Meteorological Office is based on the radiation emitted by CG-lightning strikes in the very low frequencies (VLF) 2 -23 kHz, mainly around 10kHz(Lee, 1986, Chauzy et al, 2005; Keogh, 2006). While measuring in the VLF the ATD system has a long-baseline and therefore the detection range is big. The detection network consisted of eight stations in 2006 that are stationed through Europe (see figure 4.1A) and are capable to detect lightning strikes within Europe and surrounding areas. However, in the surrounding areas the accuracy is decreasing when moving further away from the stations. Future plans of the UK Met Office are indicating coverage of Europe and the African continent by adding more stations in the southern part of Africa (Keogh, 2006). (also see figure 4.1B)
A. B.
The ATD-system claims to have a nominal accuracy of around 2km and a detection efficiency >90% (Keogh, 2006; Leonibus 2007).
Figure 4.1 A: ATDNet stations in Europe (Keogh et al 2006). B: Possible ATDNet outstation configuration in 2008 (Leonibus et al, 2007).
Validation of SAFIR/FLITS lightning detection system with railway-damage reports – Rutger Boonstra – june 2008 Royal Netherlands Meteorological Institute (KNMI) – Wageningen University and Research Centre (WUR)
26
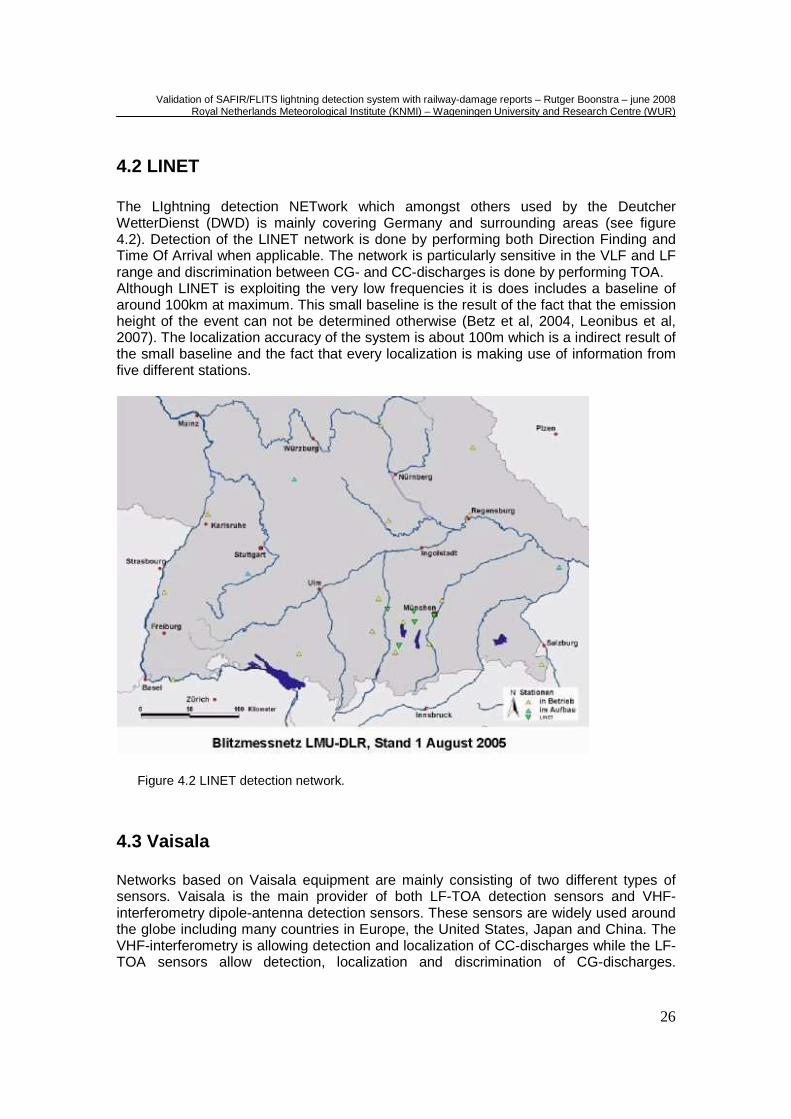
4.2 LINET The LIghtning detection NETwork which amongst others used by the Deutcher WetterDienst (DWD) is mainly covering Germany and surrounding areas (see figure 4.2). Detection of the LINET network is done by performing both Direction Finding and Time Of Arrival when applicable. The network is particularly sensitive in the VLF and LF range and discrimination between CG- and CC-discharges is done by performing TOA. Although LINET is exploiting the very low frequencies it is does includes a baseline of around 100km at maximum. This small baseline is the result of the fact that the emission height of the event can not be determined otherwise (Betz et al, 2004, Leonibus et al, 2007). The localization accuracy of the system is about 100m which is a indirect result of the small baseline and the fact that every localization is making use of information from five different stations.
4.3 Vaisala Networks based on Vaisala equipment are mainly consisting of two different types of sensors. Vaisala is the main provider of both LF-TOA detection sensors and VHF-interferometry dipole-antenna detection sensors. These sensors are widely used around the globe including many countries in Europe, the United States, Japan and China. The VHF-interferometry is allowing detection and localization of CC-discharges while the LF-TOA sensors allow detection, localization and discrimination of CG-discharges.
Figure 4.2 LINET detection network.
Validation of SAFIR/FLITS lightning detection system with railway-damage reports – Rutger Boonstra – june 2008 Royal Netherlands Meteorological Institute (KNMI) – Wageningen University and Research Centre (WUR)
27
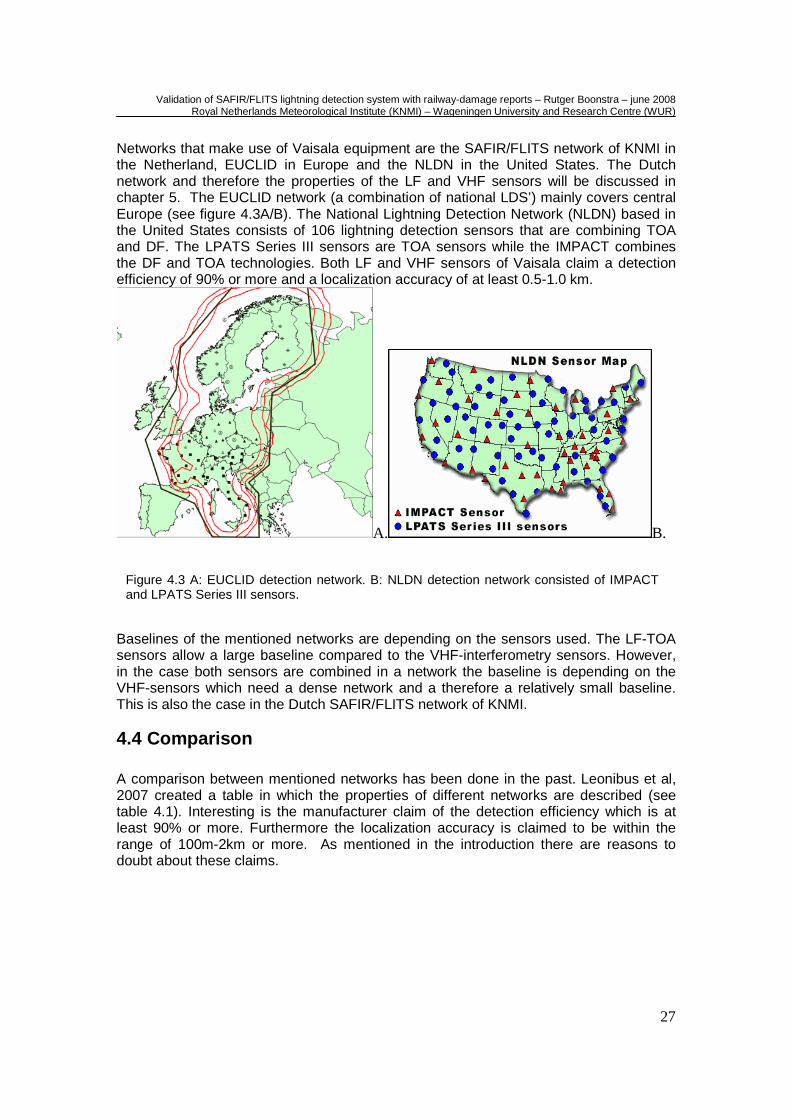
Networks that make use of Vaisala equipment are the SAFIR/FLITS network of KNMI in the Netherland, EUCLID in Europe and the NLDN in the United States. The Dutch network and therefore the properties of the LF and VHF sensors will be discussed in chapter 5. The EUCLID network (a combination of national LDS’) mainly covers central Europe (see figure 4.3A/B). The National Lightning Detection Network (NLDN) based in the United States consists of 106 lightning detection sensors that are combining TOA and DF. The LPATS Series III sensors are TOA sensors while the IMPACT combines the DF and TOA technologies. Both LF and VHF sensors of Vaisala claim a detection efficiency of 90% or more and a localization accuracy of at least 0.5-1.0 km.
A. B.
Baselines of the mentioned networks are depending on the sensors used. The LF-TOA sensors allow a large baseline compared to the VHF-interferometry sensors. However, in the case both sensors are combined in a network the baseline is depending on the VHF-sensors which need a dense network and a therefore a relatively small baseline. This is also the case in the Dutch SAFIR/FLITS network of KNMI.
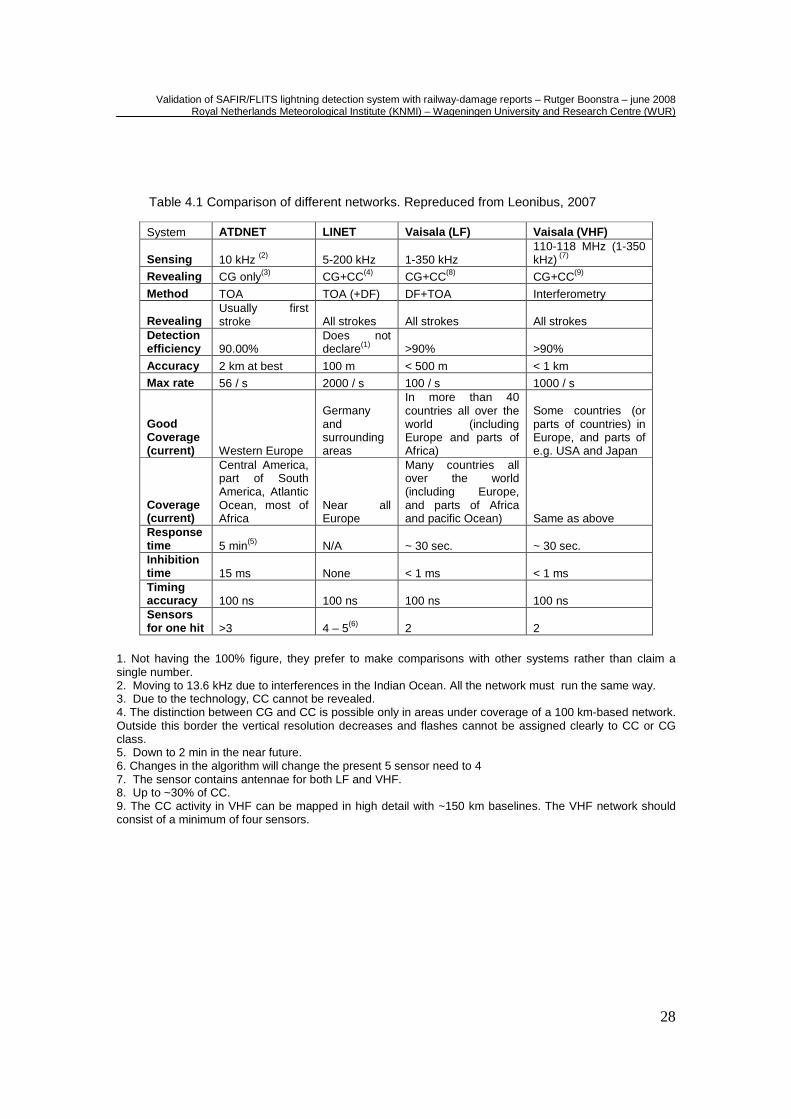
4.4 Comparison A comparison between mentioned networks has been done in the past. Leonibus et al, 2007 created a table in which the properties of different networks are described (see table 4.1). Interesting is the manufacturer claim of the detection efficiency which is at least 90% or more. Furthermore the localization accuracy is claimed to be within the range of 100m-2km or more. As mentioned in the introduction there are reasons to doubt about these claims.
Figure 4.3 A: EUCLID detection network. B: NLDN detection network consisted of IMPACT and LPATS Series III sensors.
Validation of SAFIR/FLITS lightning detection system with railway-damage reports – Rutger Boonstra – june 2008 Royal Netherlands Meteorological Institute (KNMI) – Wageningen University and Research Centre (WUR)
28
System ATDNET LINET Vaisala (LF) Vaisala (VHF)
Sensing 10 kHz (2) 5-200 kHz 1-350 kHz 110-118 MHz (1-350 kHz) (7)
Revealing CG only(3) CG+CC(4) CG+CC(8) CG+CC(9)
Method TOA TOA (+DF) DF+TOA Interferometry
Revealing Usually first stroke All strokes All strokes All strokes
Detection efficiency 90.00%
Does not declare(1) >90% >90%
Accuracy 2 km at best 100 m < 500 m < 1 km Max rate 56 / s 2000 / s 100 / s 1000 / s
Good Coverage (current) Western Europe
Germany and surrounding areas
In more than 40 countries all over the world (including Europe and parts of Africa)
Some countries (or parts of countries) in Europe, and parts of e.g. USA and Japan
Coverage (current)
Central America, part of South America, Atlantic Ocean, most of Africa
Near all Europe
Many countries all over the world (including Europe, and parts of Africa and pacific Ocean) Same as above
Response time 5 min(5) N/A ~ 30 sec. ~ 30 sec. Inhibition time 15 ms None < 1 ms < 1 ms Timing accuracy 100 ns 100 ns 100 ns 100 ns Sensors for one hit >3 4 – 5(6) 2 2
1. Not having the 100% figure, they prefer to make comparisons with other systems rather than claim a single number. 2. Moving to 13.6 kHz due to interferences in the Indian Ocean. All the network must run the same way. 3. Due to the technology, CC cannot be revealed. 4. The distinction between CG and CC is possible only in areas under coverage of a 100 km-based network. Outside this border the vertical resolution decreases and flashes cannot be assigned clearly to CC or CG class. 5. Down to 2 min in the near future. 6. Changes in the algorithm will change the present 5 sensor need to 4 7. The sensor contains antennae for both LF and VHF. 8. Up to ~30% of CC. 9. The CC activity in VHF can be mapped in high detail with ~150 km baselines. The VHF network should consist of a minimum of four sensors.
Table 4.1 Comparison of different networks. Repreduced from Leonibus, 2007
Validation of SAFIR/FLITS lightning detection system with railway-damage reports – Rutger Boonstra – june 2008 Royal Netherlands Meteorological Institute (KNMI) – Wageningen University and Research Centre (WUR)
29
5 Current LDS KNMI
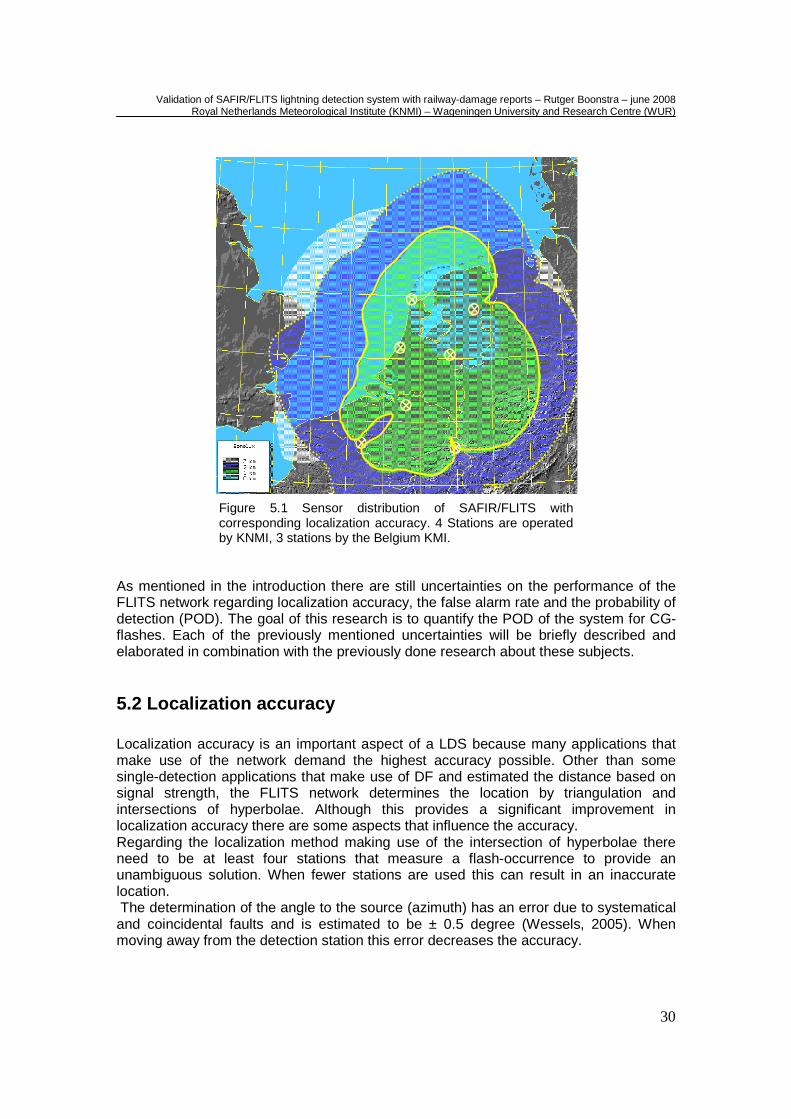
5.1 Introduction SAFIR/FLITS The LDS subject to validation in this report is the SAFIR/FLITS network. The SAFIR LDS developed by Dimensions SA in France is a TOTAL DF detection system that is working on the principle of interferometry in combination with a TOA sensor. Interferometry is the technique that makes use of the phase-differences from a signal between the antennas (five dipole antennas in this case, see figure 3.7B) which are dependent on the direction of the signal. The azimuth of the source can therefore be determined and when combining more of these sensors in a network, triangulation can provide the localization of the lightning occurrence (see figure 3.7A). The LDS works in two different frequency ranges; the five dipole antennas for interferometry-localization are using the VHF (110 - 118 MHz) while the LF TOA sensor is measuring in the LF (300 Hz - 3 MHz) (Beekhuis and Holleman ILDC 2004). As described in the introduction the sensors in the high frequencies are able to describe more details about the propagation of lightning while the wavelength is short, the opposite holds for the low frequencies. Therefore the VHF-sensors are able to describe the path of the lightning with an accuracy of 3 meters in the horizontal plane. In the old SAFIR system the localization of both CG and CC was done by interferometry-localization. The LF-sensor was decisive in the discrimination of CC and CG based on pre-defined criteria regarding amplitude, rise- and decay-time of the disruption. After a software-upgrade in December 2003 also TOA was made available with the LF-sensor and the system referred to as SAFIR/FLITS from then. In this report the SAFIR network refers to the old detection network before the upgrade whereas the SAFIR/FLITS or FLITS network is referring to the new detection network after the upgrade that is currently used. In the new setup the TOA is not only responsible for discrimination between CC and CG, it also uses TOA to override the localization that was done by interferometry for CG-strikes (Beekhuis, personal comment) while the low frequent pulse is associated and characteristic for CG-discharges. The SAFIR/FLITS system has a relatively small baseline caused by the VHF sensors installed. The SAFIR sensors are claimed to have a detection efficiency of around 90% and a localization accuracy of around 500m (Vaisala brochure, 2008). The FLITS network (Flash Localization by Interferometry and Time of arrival System) is the successor of the SAFIR network that was upgraded in December 2003. The network operated consists of 7 stations of which 3 station are operated by the Belgium KMI (see figure 5.1). The collaboration with Belgium was necessary after the initial phase of the older SAFIR network; coverage of the Netherlands was not total or not sufficient, especially in thunderstorms approaching form the south, which resulted in the need for additional stations. As can be seen in the figure there is a localization gap between the two stations on the left situated in the Belgium area. This is a result of the disability to detect lightning occurrences in a straight line between stations, while both stations are pointing at each other, which create inaccuracy when localizing the event. Additional stations covering this limited area can correct for this problem.
Validation of SAFIR/FLITS lightning detection system with railway-damage reports – Rutger Boonstra – june 2008 Royal Netherlands Meteorological Institute (KNMI) – Wageningen University and Research Centre (WUR)
30
As mentioned in the introduction there are still uncertainties on the performance of the FLITS network regarding localization accuracy, the false alarm rate and the probability of detection (POD). The goal of this research is to quantify the POD of the system for CG-flashes. Each of the previously mentioned uncertainties will be briefly described and elaborated in combination with the previously done research about these subjects.
5.2 Localization accuracy Localization accuracy is an important aspect of a LDS because many applications that make use of the network demand the highest accuracy possible. Other than some single-detection applications that make use of DF and estimated the distance based on signal strength, the FLITS network determines the location by triangulation and intersections of hyperbolae. Although this provides a significant improvement in localization accuracy there are some aspects that influence the accuracy. Regarding the localization method making use of the intersection of hyperbolae there need to be at least four stations that measure a flash-occurrence to provide an unambiguous solution. When fewer stations are used this can result in an inaccurate location. The determination of the angle to the source (azimuth) has an error due to systematical and coincidental faults and is estimated to be ± 0.5 degree (Wessels, 2005). When moving away from the detection station this error decreases the accuracy.
Figure 5.1 Sensor distribution of SAFIR/FLITS with corresponding localization accuracy. 4 Stations are operated by KNMI, 3 stations by the Belgium KMI.
Validation of SAFIR/FLITS lightning detection system with railway-damage reports – Rutger Boonstra – june 2008 Royal Netherlands Meteorological Institute (KNMI) – Wageningen University and Research Centre (WUR)
31
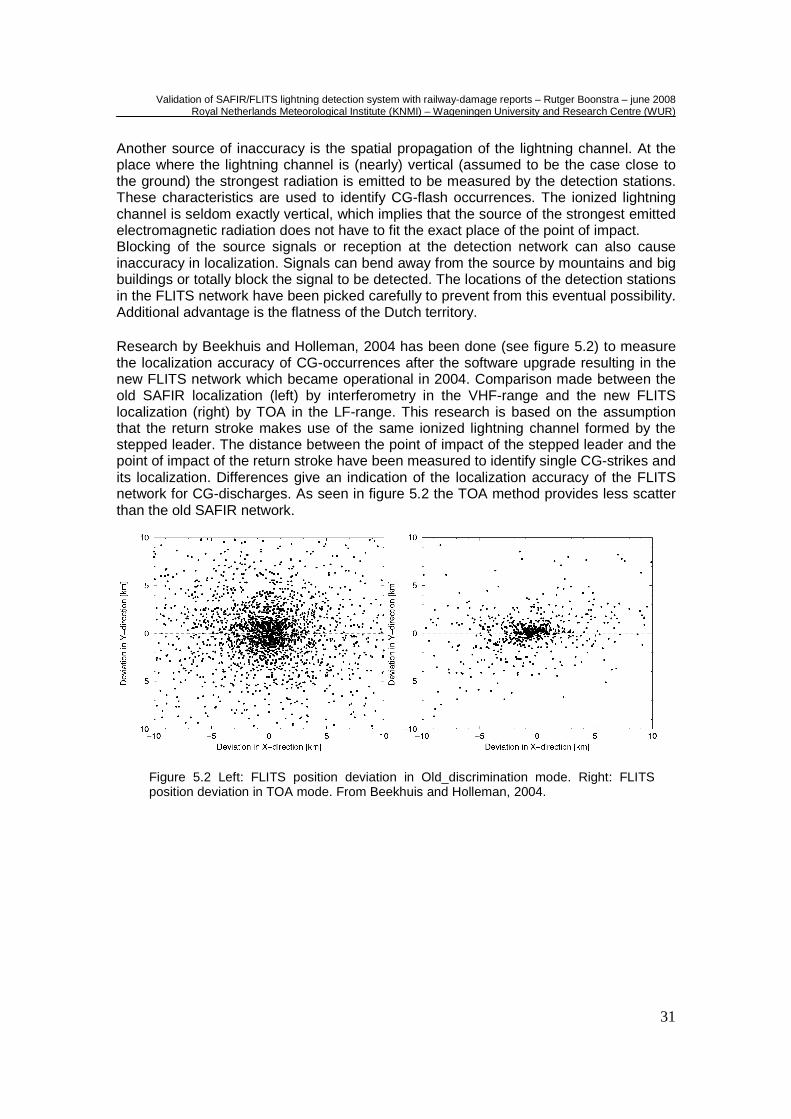
Another source of inaccuracy is the spatial propagation of the lightning channel. At the place where the lightning channel is (nearly) vertical (assumed to be the case close to the ground) the strongest radiation is emitted to be measured by the detection stations. These characteristics are used to identify CG-flash occurrences. The ionized lightning channel is seldom exactly vertical, which implies that the source of the strongest emitted electromagnetic radiation does not have to fit the exact place of the point of impact. Blocking of the source signals or reception at the detection network can also cause inaccuracy in localization. Signals can bend away from the source by mountains and big buildings or totally block the signal to be detected. The locations of the detection stations in the FLITS network have been picked carefully to prevent from this eventual possibility. Additional advantage is the flatness of the Dutch territory. Research by Beekhuis and Holleman, 2004 has been done (see figure 5.2) to measure the localization accuracy of CG-occurrences after the software upgrade resulting in the new FLITS network which became operational in 2004. Comparison made between the old SAFIR localization (left) by interferometry in the VHF-range and the new FLITS localization (right) by TOA in the LF-range. This research is based on the assumption that the return stroke makes use of the same ionized lightning channel formed by the stepped leader. The distance between the point of impact of the stepped leader and the point of impact of the return stroke have been measured to identify single CG-strikes and its localization. Differences give an indication of the localization accuracy of the FLITS network for CG-discharges. As seen in figure 5.2 the TOA method provides less scatter than the old SAFIR network.
Figure 5.2 Left: FLITS position deviation in Old_discrimination mode. Right: FLITS position deviation in TOA mode. From Beekhuis and Holleman, 2004.
Validation of SAFIR/FLITS lightning detection system with railway-damage reports – Rutger Boonstra – june 2008 Royal Netherlands Meteorological Institute (KNMI) – Wageningen University and Research Centre (WUR)
32
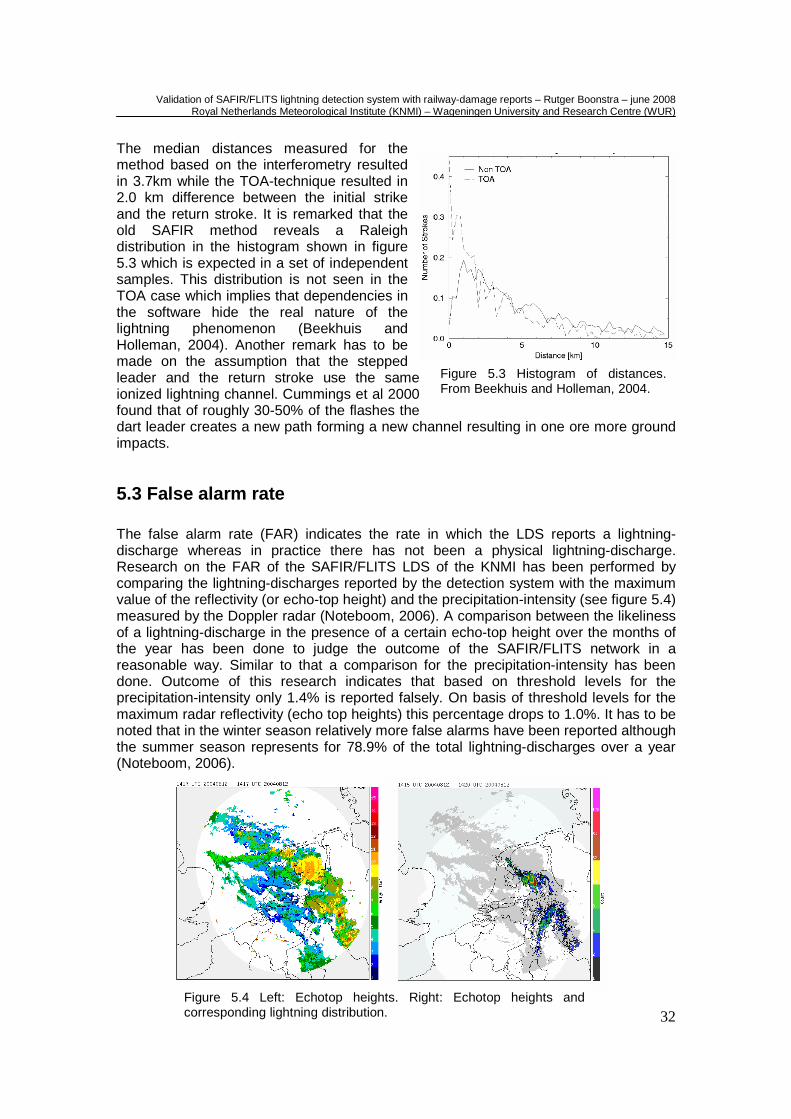
The median distances measured for the method based on the interferometry resulted in 3.7km while the TOA-technique resulted in 2.0 km difference between the initial strike and the return stroke. It is remarked that the old SAFIR method reveals a Raleigh distribution in the histogram shown in figure 5.3 which is expected in a set of independent samples. This distribution is not seen in the TOA case which implies that dependencies in the software hide the real nature of the lightning phenomenon (Beekhuis and Holleman, 2004). Another remark has to be made on the assumption that the stepped leader and the return stroke use the same ionized lightning channel. Cummings et al 2000 found that of roughly 30-50% of the flashes the dart leader creates a new path forming a new channel resulting in one ore more ground impacts.
5.3 False alarm rate The false alarm rate (FAR) indicates the rate in which the LDS reports a lightning-discharge whereas in practice there has not been a physical lightning-discharge. Research on the FAR of the SAFIR/FLITS LDS of the KNMI has been performed by comparing the lightning-discharges reported by the detection system with the maximum value of the reflectivity (or echo-top height) and the precipitation-intensity (see figure 5.4) measured by the Doppler radar (Noteboom, 2006). A comparison between the likeliness of a lightning-discharge in the presence of a certain echo-top height over the months of the year has been done to judge the outcome of the SAFIR/FLITS network in a reasonable way. Similar to that a comparison for the precipitation-intensity has been done. Outcome of this research indicates that based on threshold levels for the precipitation-intensity only 1.4% is reported falsely. On basis of threshold levels for the maximum radar reflectivity (echo top heights) this percentage drops to 1.0%. It has to be noted that in the winter season relatively more false alarms have been reported although the summer season represents for 78.9% of the total lightning-discharges over a year (Noteboom, 2006).
Figure 5.3 Histogram of distances. From Beekhuis and Holleman, 2004.
Figure 5.4 Left: Echotop heights. Right: Echotop heights and corresponding lightning distribution.
Validation of SAFIR/FLITS lightning detection system with railway-damage reports – Rutger Boonstra – june 2008 Royal Netherlands Meteorological Institute (KNMI) – Wageningen University and Research Centre (WUR)
33
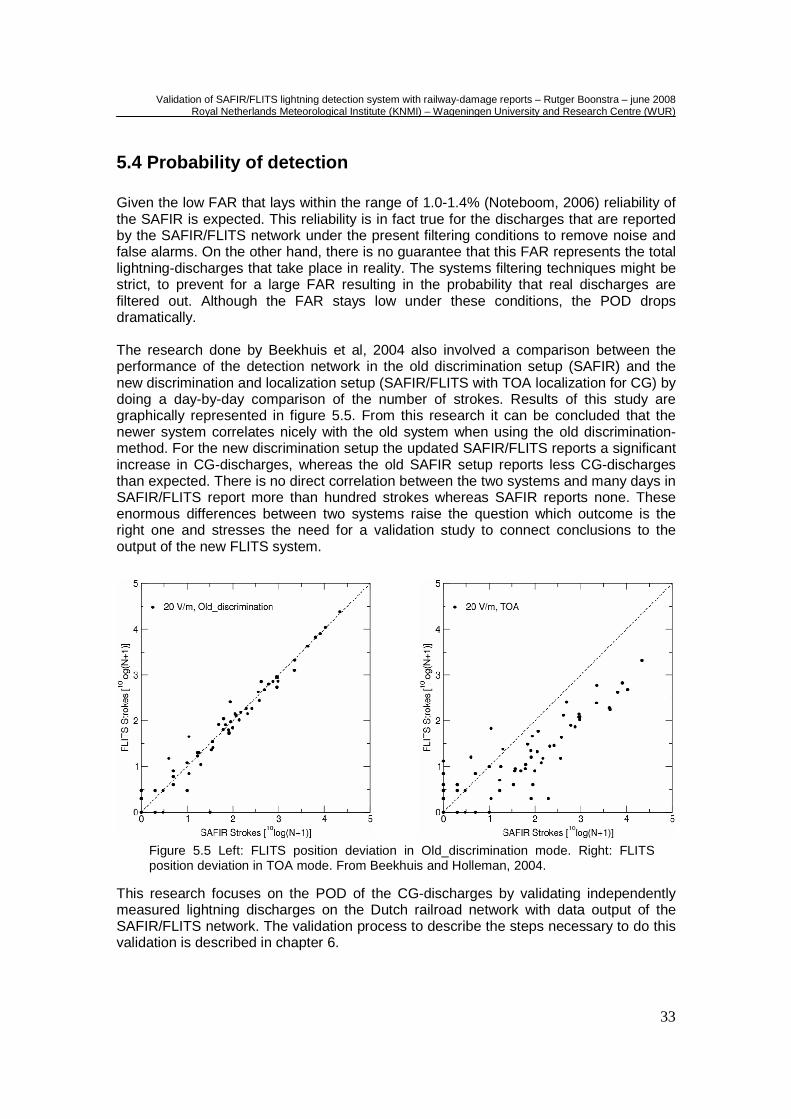
5.4 Probability of detection Given the low FAR that lays within the range of 1.0-1.4% (Noteboom, 2006) reliability of the SAFIR is expected. This reliability is in fact true for the discharges that are reported by the SAFIR/FLITS network under the present filtering conditions to remove noise and false alarms. On the other hand, there is no guarantee that this FAR represents the total lightning-discharges that take place in reality. The systems filtering techniques might be strict, to prevent for a large FAR resulting in the probability that real discharges are filtered out. Although the FAR stays low under these conditions, the POD drops dramatically. The research done by Beekhuis et al, 2004 also involved a comparison between the performance of the detection network in the old discrimination setup (SAFIR) and the new discrimination and localization setup (SAFIR/FLITS with TOA localization for CG) by doing a day-by-day comparison of the number of strokes. Results of this study are graphically represented in figure 5.5. From this research it can be concluded that the newer system correlates nicely with the old system when using the old discrimination-method. For the new discrimination setup the updated SAFIR/FLITS reports a significant increase in CG-discharges, whereas the old SAFIR setup reports less CG-discharges than expected. There is no direct correlation between the two systems and many days in SAFIR/FLITS report more than hundred strokes whereas SAFIR reports none. These enormous differences between two systems raise the question which outcome is the right one and stresses the need for a validation study to connect conclusions to the output of the new FLITS system.
This research focuses on the POD of the CG-discharges by validating independently measured lightning discharges on the Dutch railroad network with data output of the SAFIR/FLITS network. The validation process to describe the steps necessary to do this validation is described in chapter 6.
Figure 5.5 Left: FLITS position deviation in Old_discrimination mode. Right: FLITS position deviation in TOA mode. From Beekhuis and Holleman, 2004.
Validation of SAFIR/FLITS lightning detection system with railway-damage reports – Rutger Boonstra – june 2008 Royal Netherlands Meteorological Institute (KNMI) – Wageningen University and Research Centre (WUR)
34
6 Validation of SAFIR LDS
6.1 Description of SAFIR/FLITS output This validation study is based on data output of the SAFIR/FLITS system in the period 2001-2006. As described in chapter 5 the system has been subject to several upgrades within this period that involved replacement of sensors and a software-upgrade allowing measurement and localization with both interferometry and TOA. These changes resulted in the use of data that is originated from two different systems in this validation study. Although the systems are different they are both generating similar output that can be used for the validation study. Furthermore it provides the opportunity to compare the differences between the old discrimination method used in the SAFIR setup with the discrimination method from the new SAFIR/FLITS setup. The raw output files provided by both systems have to be processed before they are of use for performing the validation. The processing done for the raw output files from SAFIR and FLITS is similar, although for FLITS there are some extra steps. The creation of the raw-output involves a few steps of which the first step includes the combination of data from a single detection station into a ‘burst’ originated by one flash. After the ‘bursts’ are created for all stations separately the bursts are tried to be associated with a single event. When this association process is resulting in a detected event taking into account time-differences due to travelling properties of electromagnetic waves, it can be localized by triangulation. Stations that deliver the most accurate data are used in the triangulation process defined by the estimated error. The information about bursts and triangulations is stored in the raw-output data. From the raw-output data the data is divided into ‘traces’. Traces are all signals corresponding to a certain stage of a lightning-occurrence. For CC-discharges the corresponding traces are including the starting-point (1), transitional point (2), ending point (3) or isolated discharge (0) within the cloud. For CG-discharges two types of traces are defined; the CG-discharge (4) and the return stroke (5). The discrimination of the traces for CG-discharges is performed by the discrimination algorithm that makes use of the LF-antenna. Next to the discrimination between CC- and CG –discharges the new FLITS-processing also localizes the CG-discharges with the TOA-principle (explained in chapter 3) making use of the LF-data. For traces associated to CG-discharges also the current, sign of the discharge, the rise-time and decay-time are calculated or measured. An example of output data after the processing is shown in table 6.1. The output data are finally stored in a HDF5-file with an interval of 5 minutes and 24 hours which allows usage for both operational forecasting and climatologically usage. HDF5 is a data format that is widely used that allows storage of both data and metadata (Noteboom, 2006; Beekhuis and Holleman 2004).
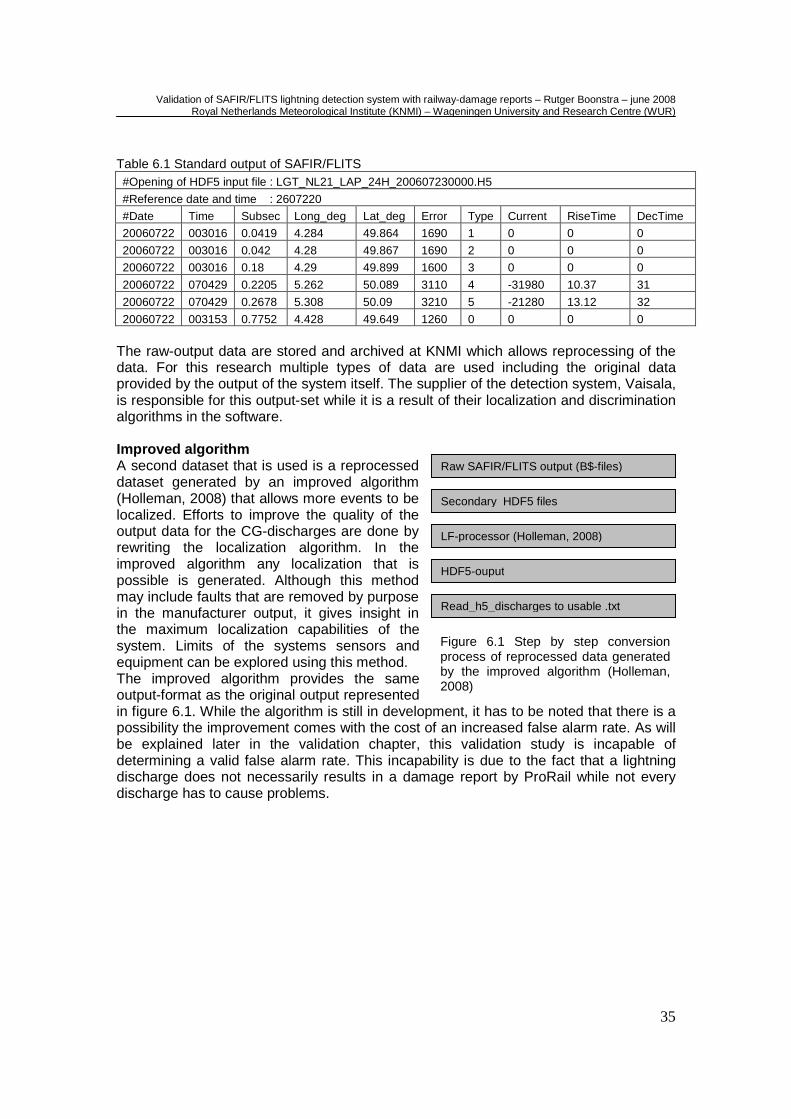
Validation of SAFIR/FLITS lightning detection system with railway-damage reports – Rutger Boonstra – june 2008 Royal Netherlands Meteorological Institute (KNMI) – Wageningen University and Research Centre (WUR)
35
Table 6.1 Standard output of SAFIR/FLITS #Opening of HDF5 input file : LGT_NL21_LAP_24H_200607230000.H5
#Reference date and time : 2607220
#Date Time Subsec Long_deg Lat_deg Error Type Current RiseTime DecTime
20060722 003016 0.0419 4.284 49.864 1690 1 0 0 0
20060722 003016 0.042 4.28 49.867 1690 2 0 0 0
20060722 003016 0.18 4.29 49.899 1600 3 0 0 0
20060722 070429 0.2205 5.262 50.089 3110 4 -31980 10.37 31
20060722 070429 0.2678 5.308 50.09 3210 5 -21280 13.12 32
20060722 003153 0.7752 4.428 49.649 1260 0 0 0 0 The raw-output data are stored and archived at KNMI which allows reprocessing of the data. For this research multiple types of data are used including the original data provided by the output of the system itself. The supplier of the detection system, Vaisala, is responsible for this output-set while it is a result of their localization and discrimination algorithms in the software. Improved algorithm A second dataset that is used is a reprocessed dataset generated by an improved algorithm (Holleman, 2008) that allows more events to be localized. Efforts to improve the quality of the output data for the CG-discharges are done by rewriting the localization algorithm. In the improved algorithm any localization that is possible is generated. Although this method may include faults that are removed by purpose in the manufacturer output, it gives insight in the maximum localization capabilities of the system. Limits of the systems sensors and equipment can be explored using this method. The improved algorithm provides the same output-format as the original output represented in figure 6.1. While the algorithm is still in development, it has to be noted that there is a possibility the improvement comes with the cost of an increased false alarm rate. As will be explained later in the validation chapter, this validation study is incapable of determining a valid false alarm rate. This incapability is due to the fact that a lightning discharge does not necessarily results in a damage report by ProRail while not every discharge has to cause problems.
Raw SAFIR/FLITS output (B$-files)
LF-processor (Holleman, 2008)
HDF5-ouput
Read_h5_discharges to usable .txt
Secondary HDF5 files
Figure 6.1 Step by step conversion process of reprocessed data generated by the improved algorithm (Holleman, 2008)
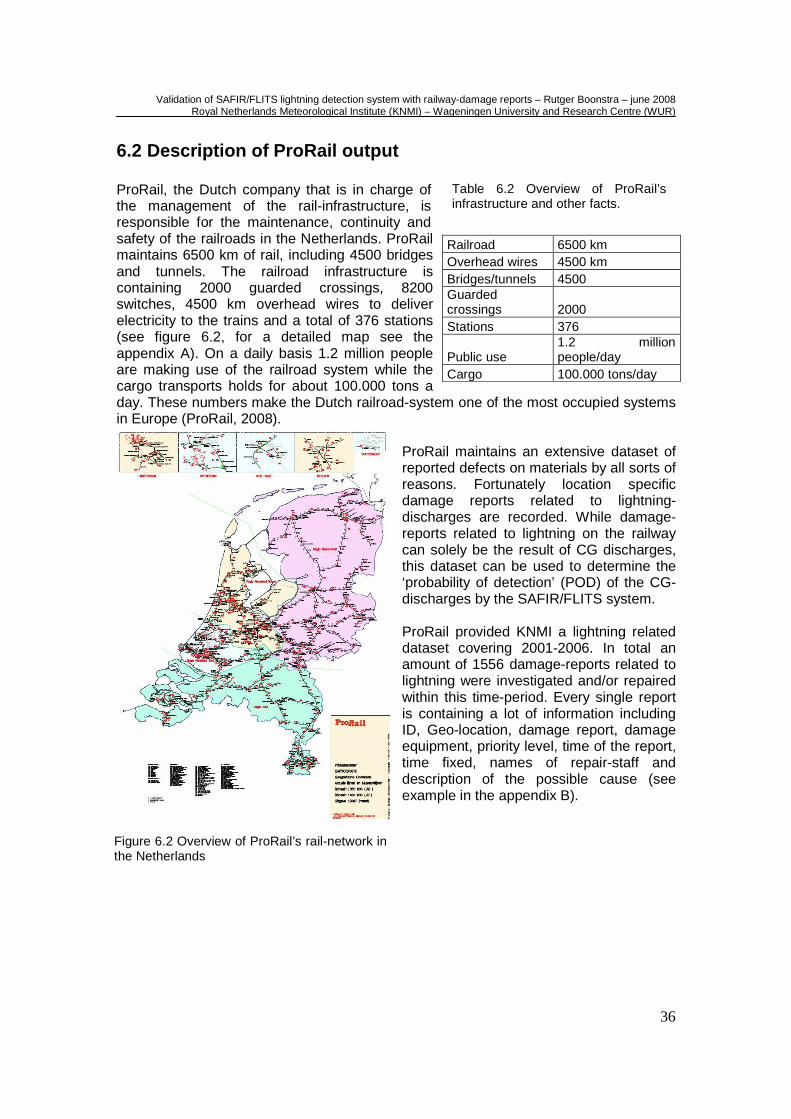
Validation of SAFIR/FLITS lightning detection system with railway-damage reports – Rutger Boonstra – june 2008 Royal Netherlands Meteorological Institute (KNMI) – Wageningen University and Research Centre (WUR)
36
6.2 Description of ProRail output ProRail, the Dutch company that is in charge of the management of the rail-infrastructure, is responsible for the maintenance, continuity and safety of the railroads in the Netherlands. ProRail maintains 6500 km of rail, including 4500 bridges and tunnels. The railroad infrastructure is containing 2000 guarded crossings, 8200 switches, 4500 km overhead wires to deliver electricity to the trains and a total of 376 stations (see figure 6.2, for a detailed map see the appendix A). On a daily basis 1.2 million people are making use of the railroad system while the cargo transports holds for about 100.000 tons a day. These numbers make the Dutch railroad-system one of the most occupied systems in Europe (ProRail, 2008).
ProRail maintains an extensive dataset of reported defects on materials by all sorts of reasons. Fortunately location specific damage reports related to lightning-discharges are recorded. While damage-reports related to lightning on the railway can solely be the result of CG discharges, this dataset can be used to determine the ‘probability of detection’ (POD) of the CG-discharges by the SAFIR/FLITS system. ProRail provided KNMI a lightning related dataset covering 2001-2006. In total an amount of 1556 damage-reports related to lightning were investigated and/or repaired within this time-period. Every single report is containing a lot of information including ID, Geo-location, damage report, damage equipment, priority level, time of the report, time fixed, names of repair-staff and description of the possible cause (see example in the appendix B).
Railroad 6500 km Overhead wires 4500 km Bridges/tunnels 4500 Guarded crossings 2000 Stations 376
Public use 1.2 million people/day
Cargo 100.000 tons/day
Table 6.2 Overview of ProRail’s infrastructure and other facts.
Figure 6.2 Overview of ProRail’s rail-network in the Netherlands
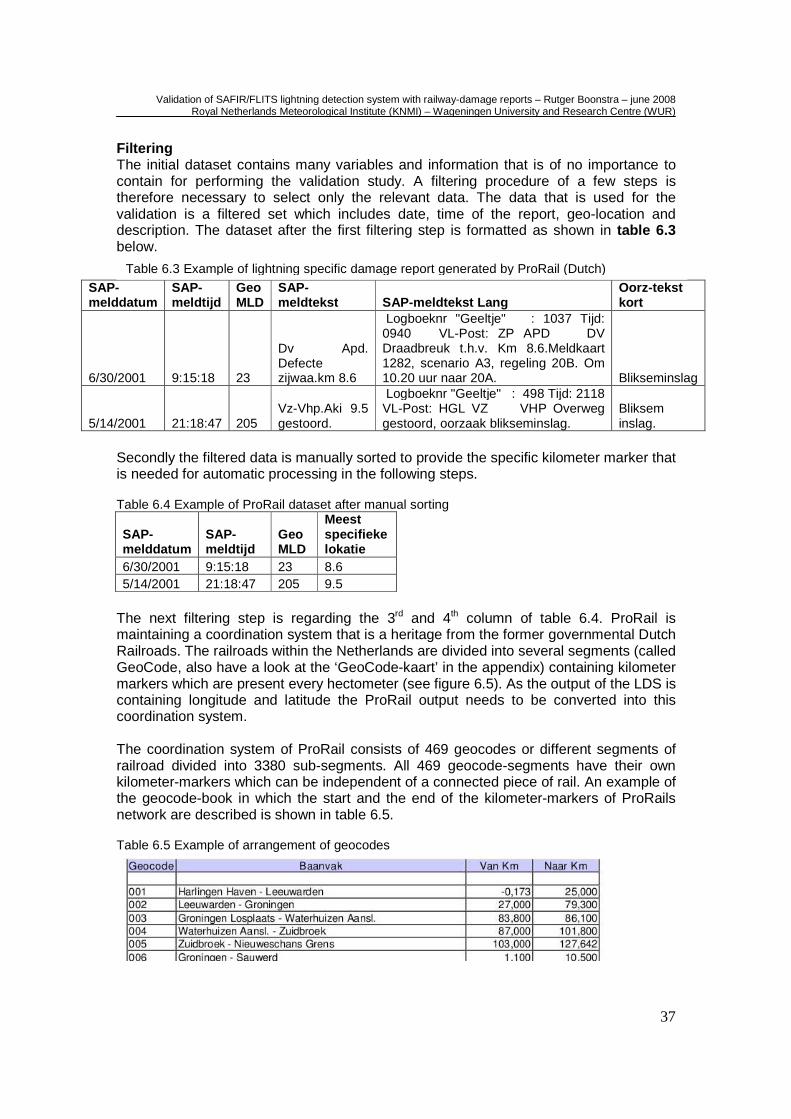
Validation of SAFIR/FLITS lightning detection system with railway-damage reports – Rutger Boonstra – june 2008 Royal Netherlands Meteorological Institute (KNMI) – Wageningen University and Research Centre (WUR)
37
Filtering The initial dataset contains many variables and information that is of no importance to contain for performing the validation study. A filtering procedure of a few steps is therefore necessary to select only the relevant data. The data that is used for the validation is a filtered set which includes date, time of the report, geo-location and description. The dataset after the first filtering step is formatted as shown in table 6.3 below.
SAP-melddatum
SAP-meldtijd
Geo MLD
SAP-meldtekst SAP-meldtekst Lang
Oorz-tekst kort
6/30/2001 9:15:18 23
Dv Apd. Defecte zijwaa.km 8.6
Logboeknr "Geeltje" : 1037 Tijd: 0940 VL-Post: ZP APD DV Draadbreuk t.h.v. Km 8.6.Meldkaart 1282, scenario A3, regeling 20B. Om 10.20 uur naar 20A. Blikseminslag
5/14/2001 21:18:47 205 Vz-Vhp.Aki 9.5 gestoord.
Logboeknr "Geeltje" : 498 Tijd: 2118 VL-Post: HGL VZ VHP Overweg gestoord, oorzaak blikseminslag.
Bliksem inslag.
Secondly the filtered data is manually sorted to provide the specific kilometer marker that is needed for automatic processing in the following steps. Table 6.4 Example of ProRail dataset after manual sorting
SAP-melddatum
SAP-meldtijd
Geo MLD
Meest specifieke lokatie
6/30/2001 9:15:18 23 8.6 5/14/2001 21:18:47 205 9.5
The next filtering step is regarding the 3rd and 4th column of table 6.4. ProRail is maintaining a coordination system that is a heritage from the former governmental Dutch Railroads. The railroads within the Netherlands are divided into several segments (called GeoCode, also have a look at the ‘GeoCode-kaart’ in the appendix) containing kilometer markers which are present every hectometer (see figure 6.5). As the output of the LDS is containing longitude and latitude the ProRail output needs to be converted into this coordination system. The coordination system of ProRail consists of 469 geocodes or different segments of railroad divided into 3380 sub-segments. All 469 geocode-segments have their own kilometer-markers which can be independent of a connected piece of rail. An example of the geocode-book in which the start and the end of the kilometer-markers of ProRails network are described is shown in table 6.5. Table 6.5 Example of arrangement of geocodes
Table 6.3 Example of lightning specific damage report generated by ProRail (Dutch)
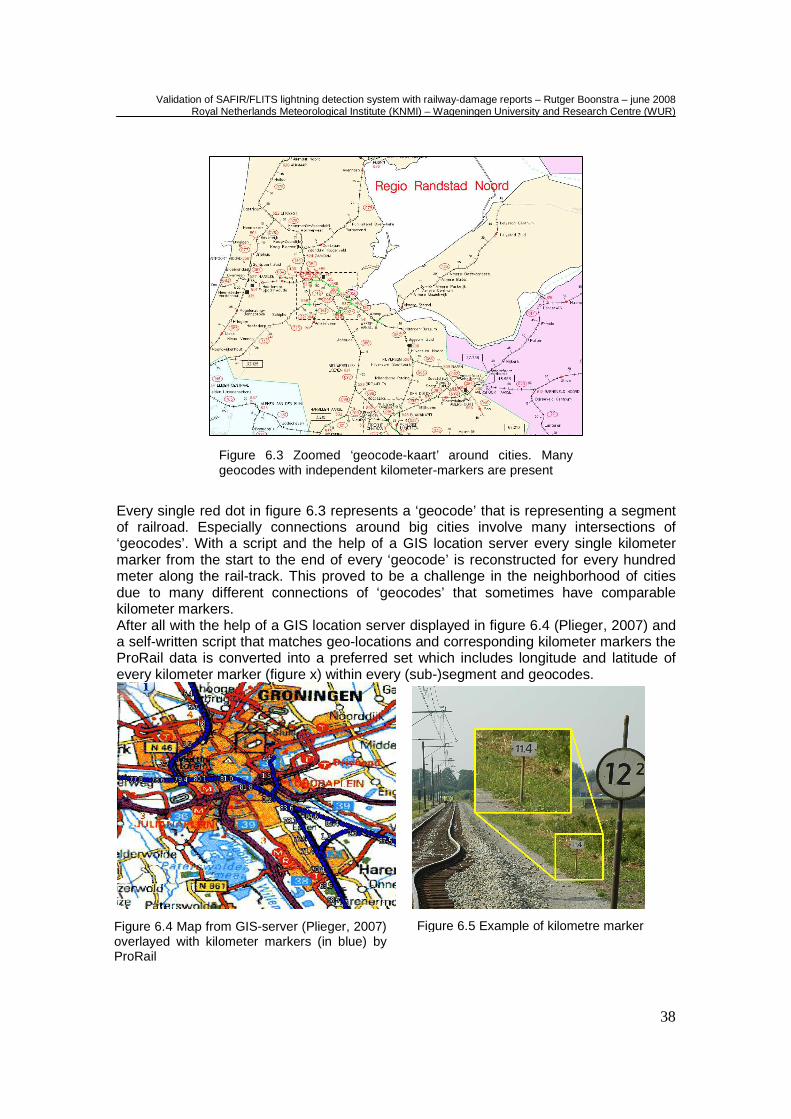
Validation of SAFIR/FLITS lightning detection system with railway-damage reports – Rutger Boonstra – june 2008 Royal Netherlands Meteorological Institute (KNMI) – Wageningen University and Research Centre (WUR)
38
Every single red dot in figure 6.3 represents a ‘geocode’ that is representing a segment of railroad. Especially connections around big cities involve many intersections of ‘geocodes’. With a script and the help of a GIS location server every single kilometer marker from the start to the end of every ‘geocode’ is reconstructed for every hundred meter along the rail-track. This proved to be a challenge in the neighborhood of cities due to many different connections of ‘geocodes’ that sometimes have comparable kilometer markers. After all with the help of a GIS location server displayed in figure 6.4 (Plieger, 2007) and a self-written script that matches geo-locations and corresponding kilometer markers the ProRail data is converted into a preferred set which includes longitude and latitude of every kilometer marker (figure x) within every (sub-)segment and geocodes.
Figure 6.4 Map from GIS-server (Plieger, 2007) overlayed with kilometer markers (in blue) by ProRail
Figure 6.3 Zoomed ‘geocode-kaart’ around cities. Many geocodes with independent kilometer-markers are present
Figure 6.5 Example of kilometre marker
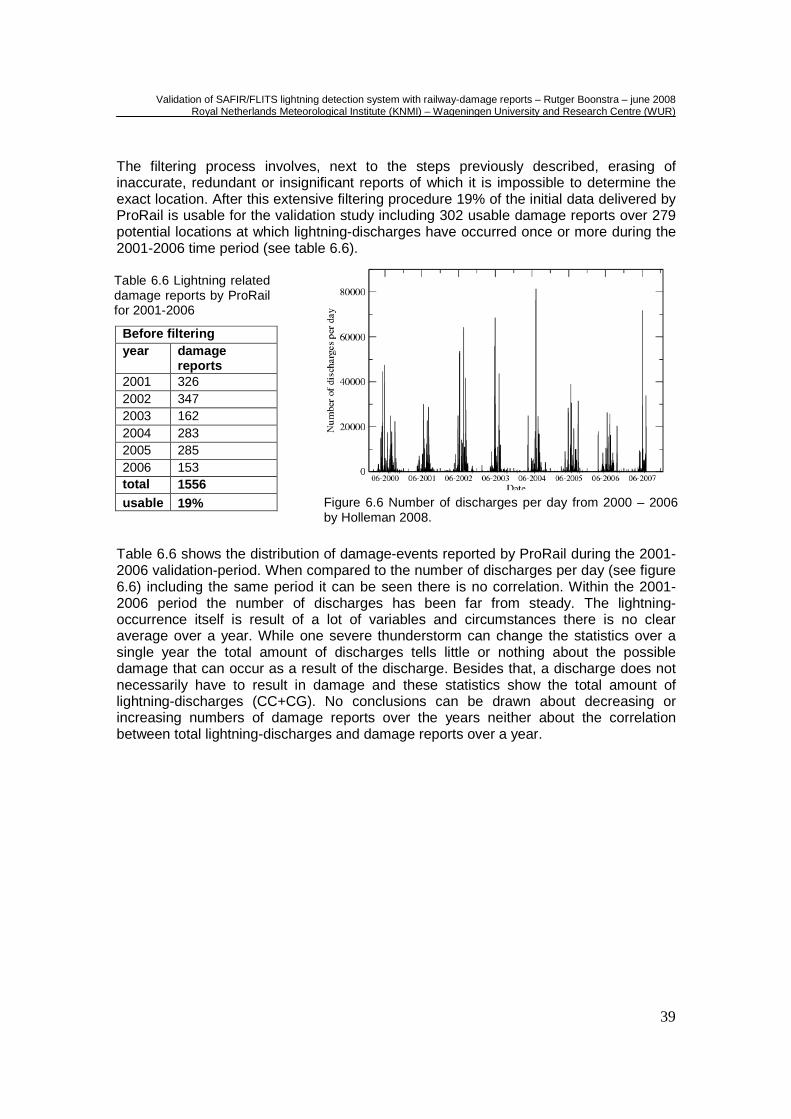
Validation of SAFIR/FLITS lightning detection system with railway-damage reports – Rutger Boonstra – june 2008 Royal Netherlands Meteorological Institute (KNMI) – Wageningen University and Research Centre (WUR)
39
Figure 6.6 Number of discharges per day from 2000 – 2006 by Holleman 2008.
The filtering process involves, next to the steps previously described, erasing of inaccurate, redundant or insignificant reports of which it is impossible to determine the exact location. After this extensive filtering procedure 19% of the initial data delivered by ProRail is usable for the validation study including 302 usable damage reports over 279 potential locations at which lightning-discharges have occurred once or more during the 2001-2006 time period (see table 6.6).
Before filtering year damage
reports 2001 326 2002 347 2003 162 2004 283 2005 285 2006 153 total 1556 usable 19%
Table 6.6 shows the distribution of damage-events reported by ProRail during the 2001-2006 validation-period. When compared to the number of discharges per day (see figure 6.6) including the same period it can be seen there is no correlation. Within the 2001-2006 period the number of discharges has been far from steady. The lightning-occurrence itself is result of a lot of variables and circumstances there is no clear average over a year. While one severe thunderstorm can change the statistics over a single year the total amount of discharges tells little or nothing about the possible damage that can occur as a result of the discharge. Besides that, a discharge does not necessarily have to result in damage and these statistics show the total amount of lightning-discharges (CC+CG). No conclusions can be drawn about decreasing or increasing numbers of damage reports over the years neither about the correlation between total lightning-discharges and damage reports over a year.
Table 6.6 Lightning related damage reports by ProRail for 2001-2006
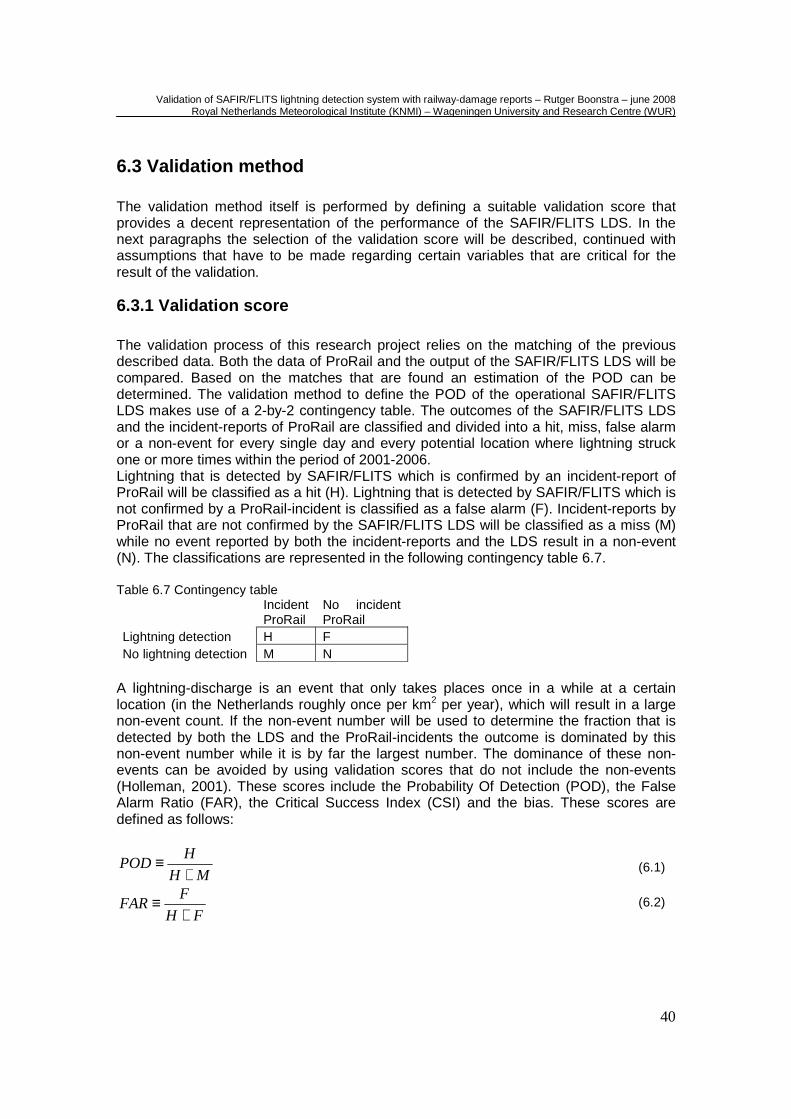
Validation of SAFIR/FLITS lightning detection system with railway-damage reports – Rutger Boonstra – june 2008 Royal Netherlands Meteorological Institute (KNMI) – Wageningen University and Research Centre (WUR)
40
6.3 Validation method The validation method itself is performed by defining a suitable validation score that provides a decent representation of the performance of the SAFIR/FLITS LDS. In the next paragraphs the selection of the validation score will be described, continued with assumptions that have to be made regarding certain variables that are critical for the result of the validation.
6.3.1 Validation score The validation process of this research project relies on the matching of the previous described data. Both the data of ProRail and the output of the SAFIR/FLITS LDS will be compared. Based on the matches that are found an estimation of the POD can be determined. The validation method to define the POD of the operational SAFIR/FLITS LDS makes use of a 2-by-2 contingency table. The outcomes of the SAFIR/FLITS LDS and the incident-reports of ProRail are classified and divided into a hit, miss, false alarm or a non-event for every single day and every potential location where lightning struck one or more times within the period of 2001-2006. Lightning that is detected by SAFIR/FLITS which is confirmed by an incident-report of ProRail will be classified as a hit (H). Lightning that is detected by SAFIR/FLITS which is not confirmed by a ProRail-incident is classified as a false alarm (F). Incident-reports by ProRail that are not confirmed by the SAFIR/FLITS LDS will be classified as a miss (M) while no event reported by both the incident-reports and the LDS result in a non-event (N). The classifications are represented in the following contingency table 6.7. Table 6.7 Contingency table
Incident ProRail
No incident ProRail
Lightning detection H F No lightning detection M N
A lightning-discharge is an event that only takes places once in a while at a certain location (in the Netherlands roughly once per km2 per year), which will result in a large non-event count. If the non-event number will be used to determine the fraction that is detected by both the LDS and the ProRail-incidents the outcome is dominated by this non-event number while it is by far the largest number. The dominance of these non-events can be avoided by using validation scores that do not include the non-events (Holleman, 2001). These scores include the Probability Of Detection (POD), the False Alarm Ratio (FAR), the Critical Success Index (CSI) and the bias. These scores are defined as follows:
MH
HPOD
+≡
FH
FFAR
+≡
(6.1)
(6.2)
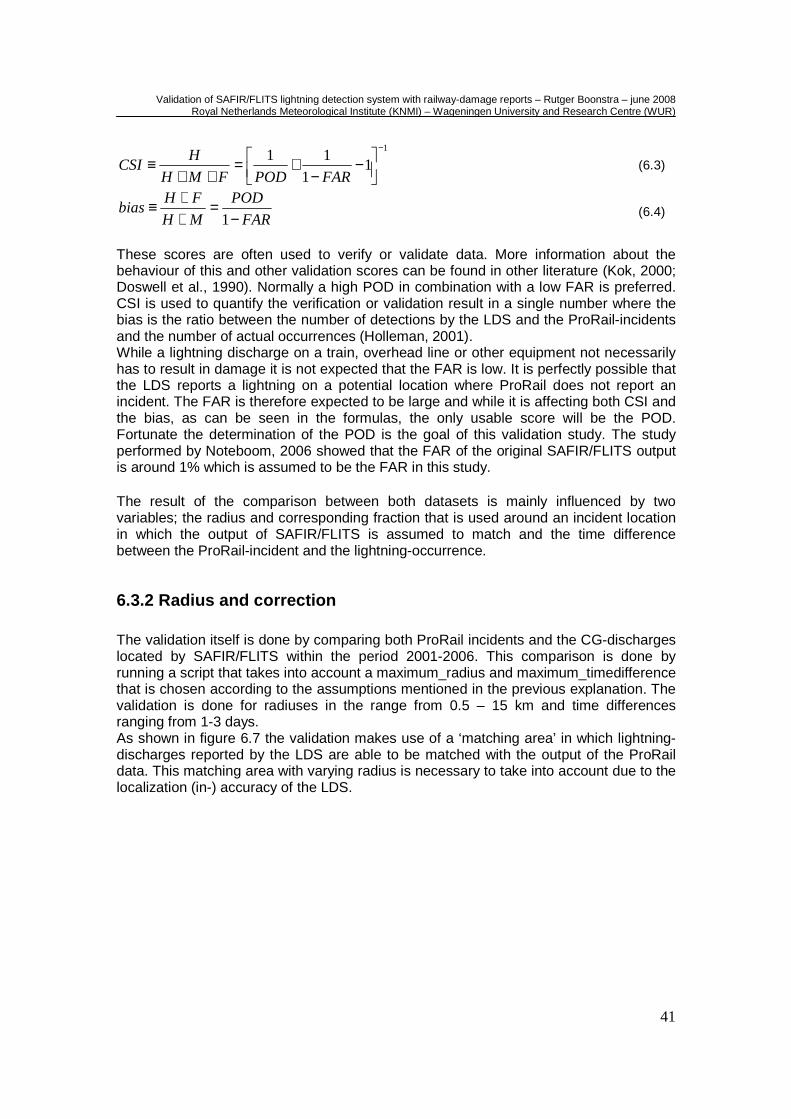
Validation of SAFIR/FLITS lightning detection system with railway-damage reports – Rutger Boonstra – june 2008 Royal Netherlands Meteorological Institute (KNMI) – Wageningen University and Research Centre (WUR)
41
1
11
11−
−−
+=++
≡FARPODFMH
HCSI
FAR
POD
MH
FHbias
−=
++≡
1
These scores are often used to verify or validate data. More information about the behaviour of this and other validation scores can be found in other literature (Kok, 2000; Doswell et al., 1990). Normally a high POD in combination with a low FAR is preferred. CSI is used to quantify the verification or validation result in a single number where the bias is the ratio between the number of detections by the LDS and the ProRail-incidents and the number of actual occurrences (Holleman, 2001). While a lightning discharge on a train, overhead line or other equipment not necessarily has to result in damage it is not expected that the FAR is low. It is perfectly possible that the LDS reports a lightning on a potential location where ProRail does not report an incident. The FAR is therefore expected to be large and while it is affecting both CSI and the bias, as can be seen in the formulas, the only usable score will be the POD. Fortunate the determination of the POD is the goal of this validation study. The study performed by Noteboom, 2006 showed that the FAR of the original SAFIR/FLITS output is around 1% which is assumed to be the FAR in this study. The result of the comparison between both datasets is mainly influenced by two variables; the radius and corresponding fraction that is used around an incident location in which the output of SAFIR/FLITS is assumed to match and the time difference between the ProRail-incident and the lightning-occurrence.
6.3.2 Radius and correction The validation itself is done by comparing both ProRail incidents and the CG-discharges located by SAFIR/FLITS within the period 2001-2006. This comparison is done by running a script that takes into account a maximum_radius and maximum_timedifference that is chosen according to the assumptions mentioned in the previous explanation. The validation is done for radiuses in the range from 0.5 – 15 km and time differences ranging from 1-3 days. As shown in figure 6.7 the validation makes use of a ‘matching area’ in which lightning-discharges reported by the LDS are able to be matched with the output of the ProRail data. This matching area with varying radius is necessary to take into account due to the localization (in-) accuracy of the LDS.
(6.3)
(6.4)
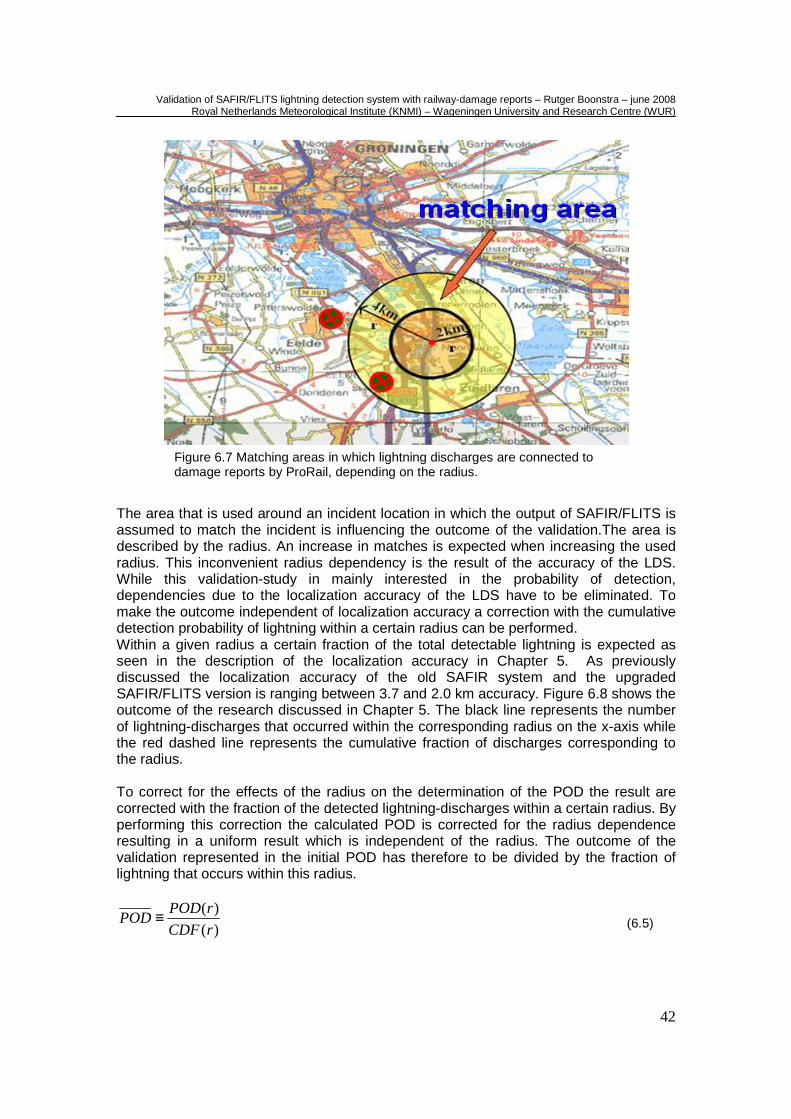
Validation of SAFIR/FLITS lightning detection system with railway-damage reports – Rutger Boonstra – june 2008 Royal Netherlands Meteorological Institute (KNMI) – Wageningen University and Research Centre (WUR)
42
The area that is used around an incident location in which the output of SAFIR/FLITS is assumed to match the incident is influencing the outcome of the validation.The area is described by the radius. An increase in matches is expected when increasing the used radius. This inconvenient radius dependency is the result of the accuracy of the LDS. While this validation-study in mainly interested in the probability of detection, dependencies due to the localization accuracy of the LDS have to be eliminated. To make the outcome independent of localization accuracy a correction with the cumulative detection probability of lightning within a certain radius can be performed. Within a given radius a certain fraction of the total detectable lightning is expected as seen in the description of the localization accuracy in Chapter 5. As previously discussed the localization accuracy of the old SAFIR system and the upgraded SAFIR/FLITS version is ranging between 3.7 and 2.0 km accuracy. Figure 6.8 shows the outcome of the research discussed in Chapter 5. The black line represents the number of lightning-discharges that occurred within the corresponding radius on the x-axis while the red dashed line represents the cumulative fraction of discharges corresponding to the radius. To correct for the effects of the radius on the determination of the POD the result are corrected with the fraction of the detected lightning-discharges within a certain radius. By performing this correction the calculated POD is corrected for the radius dependence resulting in a uniform result which is independent of the radius. The outcome of the validation represented in the initial POD has therefore to be divided by the fraction of lightning that occurs within this radius.
)(
)(
rCDF
rPODPOD ≡
Figure 6.7 Matching areas in which lightning discharges are connected to damage reports by ProRail, depending on the radius.
(6.5)
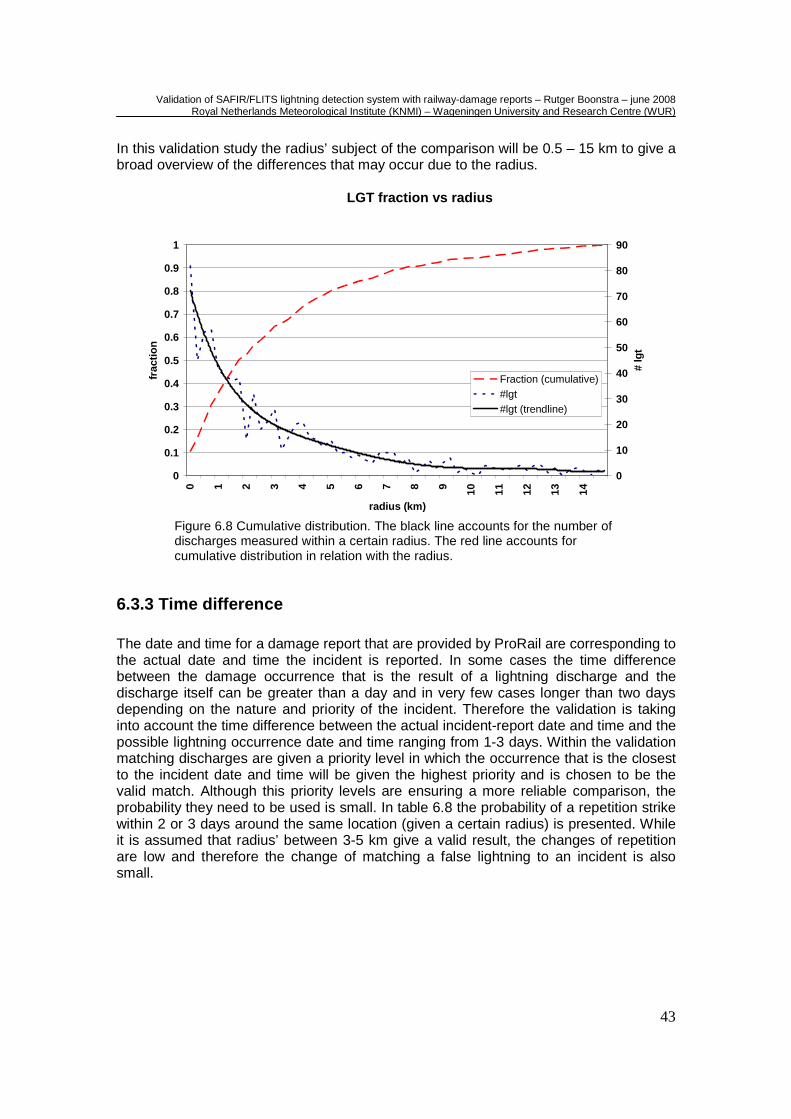
Validation of SAFIR/FLITS lightning detection system with railway-damage reports – Rutger Boonstra – june 2008 Royal Netherlands Meteorological Institute (KNMI) – Wageningen University and Research Centre (WUR)
43
In this validation study the radius’ subject of the comparison will be 0.5 – 15 km to give a broad overview of the differences that may occur due to the radius.
LGT fraction vs radius
0
0.1
0.2
0.3
0.4
0.5
0.6
0.7
0.8
0.9
1
0 1 2 3 4 5 6 7 8 9 10 11 12 13 14
radius (km)
frac
tion
0
10
20
30
40
50
60
70
80
90
# lg
t
Fraction (cumulative)#lgt#lgt (trendline)
6.3.3 Time difference The date and time for a damage report that are provided by ProRail are corresponding to the actual date and time the incident is reported. In some cases the time difference between the damage occurrence that is the result of a lightning discharge and the discharge itself can be greater than a day and in very few cases longer than two days depending on the nature and priority of the incident. Therefore the validation is taking into account the time difference between the actual incident-report date and time and the possible lightning occurrence date and time ranging from 1-3 days. Within the validation matching discharges are given a priority level in which the occurrence that is the closest to the incident date and time will be given the highest priority and is chosen to be the valid match. Although this priority levels are ensuring a more reliable comparison, the probability they need to be used is small. In table 6.8 the probability of a repetition strike within 2 or 3 days around the same location (given a certain radius) is presented. While it is assumed that radius’ between 3-5 km give a valid result, the changes of repetition are low and therefore the change of matching a false lightning to an incident is also small.
Figure 6.8 Cumulative distribution. The black line accounts for the number of discharges measured within a certain radius. The red line accounts for cumulative distribution in relation with the radius.
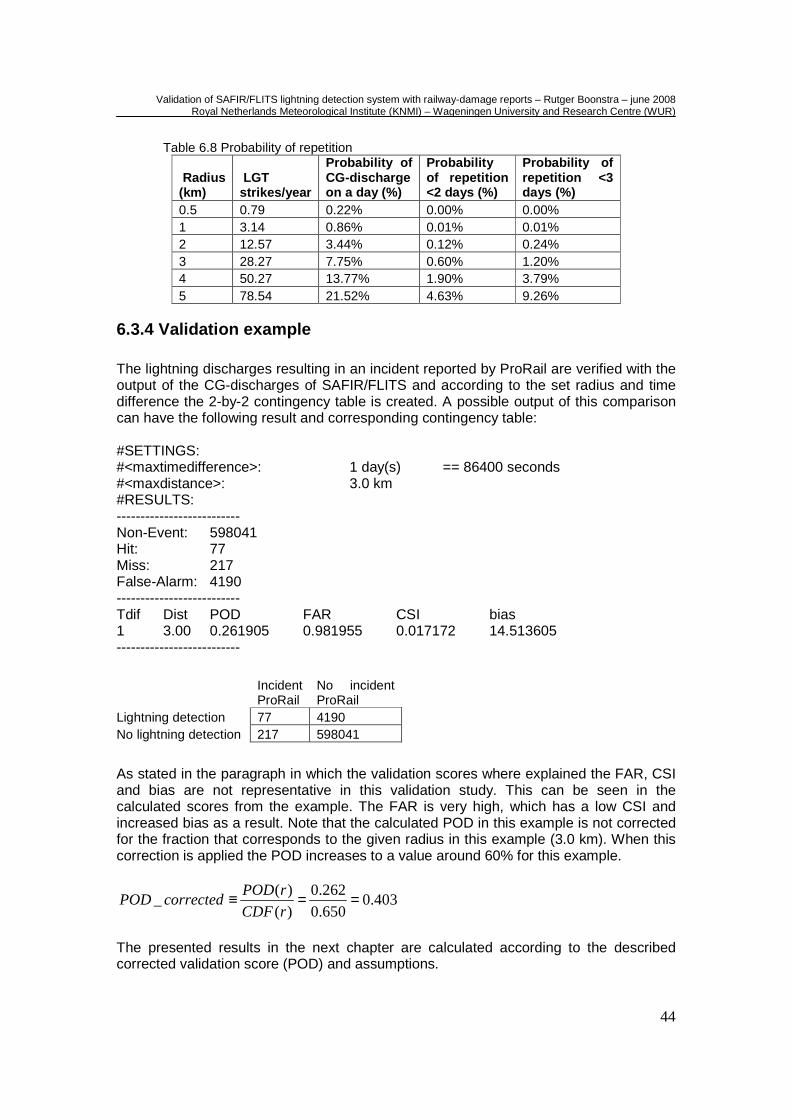
Validation of SAFIR/FLITS lightning detection system with railway-damage reports – Rutger Boonstra – june 2008 Royal Netherlands Meteorological Institute (KNMI) – Wageningen University and Research Centre (WUR)
44
Table 6.8 Probability of repetition
Radius (km)
LGT strikes/year
Probability of CG-discharge on a day (%)
Probability of repetition <2 days (%)
Probability of repetition <3 days (%)
0.5 0.79 0.22% 0.00% 0.00% 1 3.14 0.86% 0.01% 0.01% 2 12.57 3.44% 0.12% 0.24% 3 28.27 7.75% 0.60% 1.20% 4 50.27 13.77% 1.90% 3.79% 5 78.54 21.52% 4.63% 9.26%
6.3.4 Validation example The lightning discharges resulting in an incident reported by ProRail are verified with the output of the CG-discharges of SAFIR/FLITS and according to the set radius and time difference the 2-by-2 contingency table is created. A possible output of this comparison can have the following result and corresponding contingency table: #SETTINGS: #<maxtimedifference>: 1 day(s) == 86400 seconds #<maxdistance>: 3.0 km #RESULTS: -------------------------- Non-Event: 598041 Hit: 77 Miss: 217 False-Alarm: 4190 -------------------------- Tdif Dist POD FAR CSI bias 1 3.00 0.261905 0.981955 0.017172 14.513605 --------------------------
As stated in the paragraph in which the validation scores where explained the FAR, CSI and bias are not representative in this validation study. This can be seen in the calculated scores from the example. The FAR is very high, which has a low CSI and increased bias as a result. Note that the calculated POD in this example is not corrected for the fraction that corresponds to the given radius in this example (3.0 km). When this correction is applied the POD increases to a value around 60% for this example.
403.0650.0
262.0
)(
)(_ ==≡
rCDF
rPODcorrectedPOD
The presented results in the next chapter are calculated according to the described corrected validation score (POD) and assumptions.
Incident ProRail
No incident ProRail
Lightning detection 77 4190 No lightning detection 217 598041
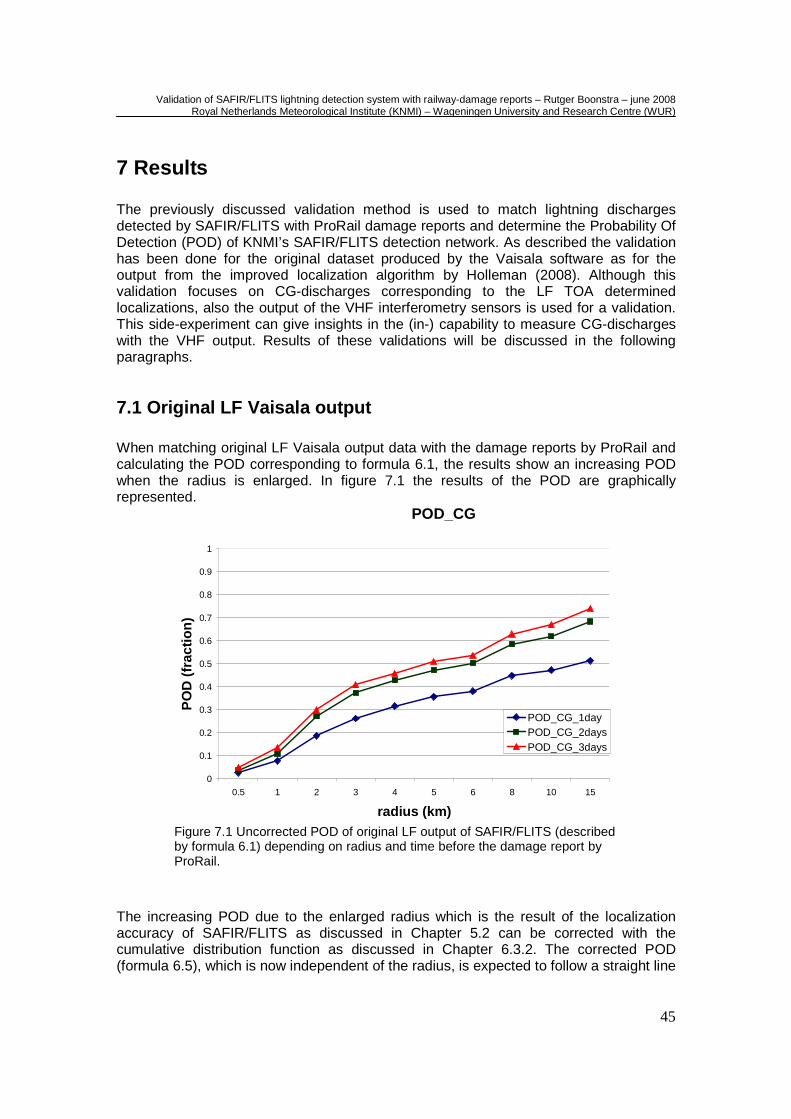
Validation of SAFIR/FLITS lightning detection system with railway-damage reports – Rutger Boonstra – june 2008 Royal Netherlands Meteorological Institute (KNMI) – Wageningen University and Research Centre (WUR)
45
7 Results The previously discussed validation method is used to match lightning discharges detected by SAFIR/FLITS with ProRail damage reports and determine the Probability Of Detection (POD) of KNMI’s SAFIR/FLITS detection network. As described the validation has been done for the original dataset produced by the Vaisala software as for the output from the improved localization algorithm by Holleman (2008). Although this validation focuses on CG-discharges corresponding to the LF TOA determined localizations, also the output of the VHF interferometry sensors is used for a validation. This side-experiment can give insights in the (in-) capability to measure CG-discharges with the VHF output. Results of these validations will be discussed in the following paragraphs.
7.1 Original LF Vaisala output When matching original LF Vaisala output data with the damage reports by ProRail and calculating the POD corresponding to formula 6.1, the results show an increasing POD when the radius is enlarged. In figure 7.1 the results of the POD are graphically represented.
POD_CG
0
0.1
0.2
0.3
0.4
0.5
0.6
0.7
0.8
0.9
1
0.5 1 2 3 4 5 6 8 10 15
radius (km)
PO
D (
frac
tion)
POD_CG_1dayPOD_CG_2daysPOD_CG_3days
The increasing POD due to the enlarged radius which is the result of the localization accuracy of SAFIR/FLITS as discussed in Chapter 5.2 can be corrected with the cumulative distribution function as discussed in Chapter 6.3.2. The corrected POD (formula 6.5), which is now independent of the radius, is expected to follow a straight line
Figure 7.1 Uncorrected POD of original LF output of SAFIR/FLITS (described by formula 6.1) depending on radius and time before the damage report by ProRail.
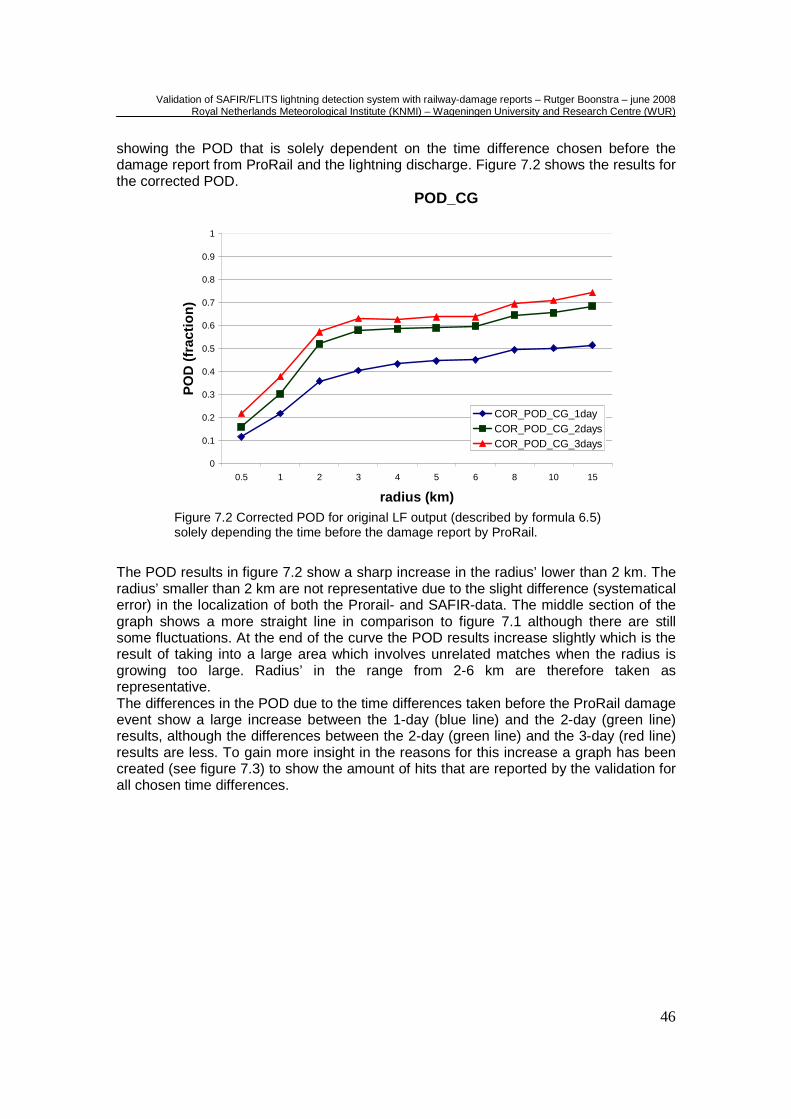
Validation of SAFIR/FLITS lightning detection system with railway-damage reports – Rutger Boonstra – june 2008 Royal Netherlands Meteorological Institute (KNMI) – Wageningen University and Research Centre (WUR)
46
showing the POD that is solely dependent on the time difference chosen before the damage report from ProRail and the lightning discharge. Figure 7.2 shows the results for the corrected POD.
POD_CG
0
0.1
0.2
0.3
0.4
0.5
0.6
0.7
0.8
0.9
1
0.5 1 2 3 4 5 6 8 10 15
radius (km)
PO
D (
frac
tion)
COR_POD_CG_1dayCOR_POD_CG_2daysCOR_POD_CG_3days
The POD results in figure 7.2 show a sharp increase in the radius’ lower than 2 km. The radius’ smaller than 2 km are not representative due to the slight difference (systematical error) in the localization of both the Prorail- and SAFIR-data. The middle section of the graph shows a more straight line in comparison to figure 7.1 although there are still some fluctuations. At the end of the curve the POD results increase slightly which is the result of taking into a large area which involves unrelated matches when the radius is growing too large. Radius’ in the range from 2-6 km are therefore taken as representative. The differences in the POD due to the time differences taken before the ProRail damage event show a large increase between the 1-day (blue line) and the 2-day (green line) results, although the differences between the 2-day (green line) and the 3-day (red line) results are less. To gain more insight in the reasons for this increase a graph has been created (see figure 7.3) to show the amount of hits that are reported by the validation for all chosen time differences.
Figure 7.2 Corrected POD for original LF output (described by formula 6.5) solely depending the time before the damage report by ProRail.
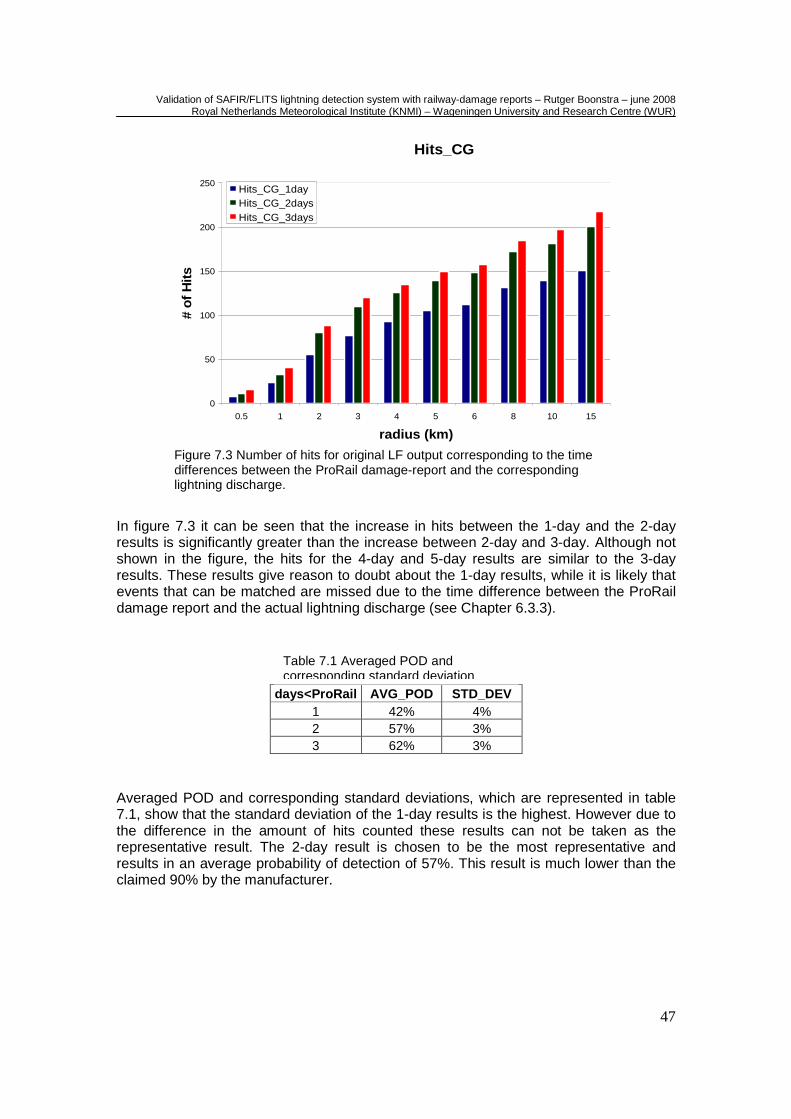
Validation of SAFIR/FLITS lightning detection system with railway-damage reports – Rutger Boonstra – june 2008 Royal Netherlands Meteorological Institute (KNMI) – Wageningen University and Research Centre (WUR)
47
Hits_CG
0
50
100
150
200
250
0.5 1 2 3 4 5 6 8 10 15
radius (km)
# of
Hits
Hits_CG_1dayHits_CG_2daysHits_CG_3days
In figure 7.3 it can be seen that the increase in hits between the 1-day and the 2-day results is significantly greater than the increase between 2-day and 3-day. Although not shown in the figure, the hits for the 4-day and 5-day results are similar to the 3-day results. These results give reason to doubt about the 1-day results, while it is likely that events that can be matched are missed due to the time difference between the ProRail damage report and the actual lightning discharge (see Chapter 6.3.3).
days<ProRail AVG_POD STD_DEV
1 42% 4% 2 57% 3% 3 62% 3%
Averaged POD and corresponding standard deviations, which are represented in table 7.1, show that the standard deviation of the 1-day results is the highest. However due to the difference in the amount of hits counted these results can not be taken as the representative result. The 2-day result is chosen to be the most representative and results in an average probability of detection of 57%. This result is much lower than the claimed 90% by the manufacturer.
Table 7.1 Averaged POD and corresponding standard deviation
Figure 7.3 Number of hits for original LF output corresponding to the time differences between the ProRail damage-report and the corresponding lightning discharge.
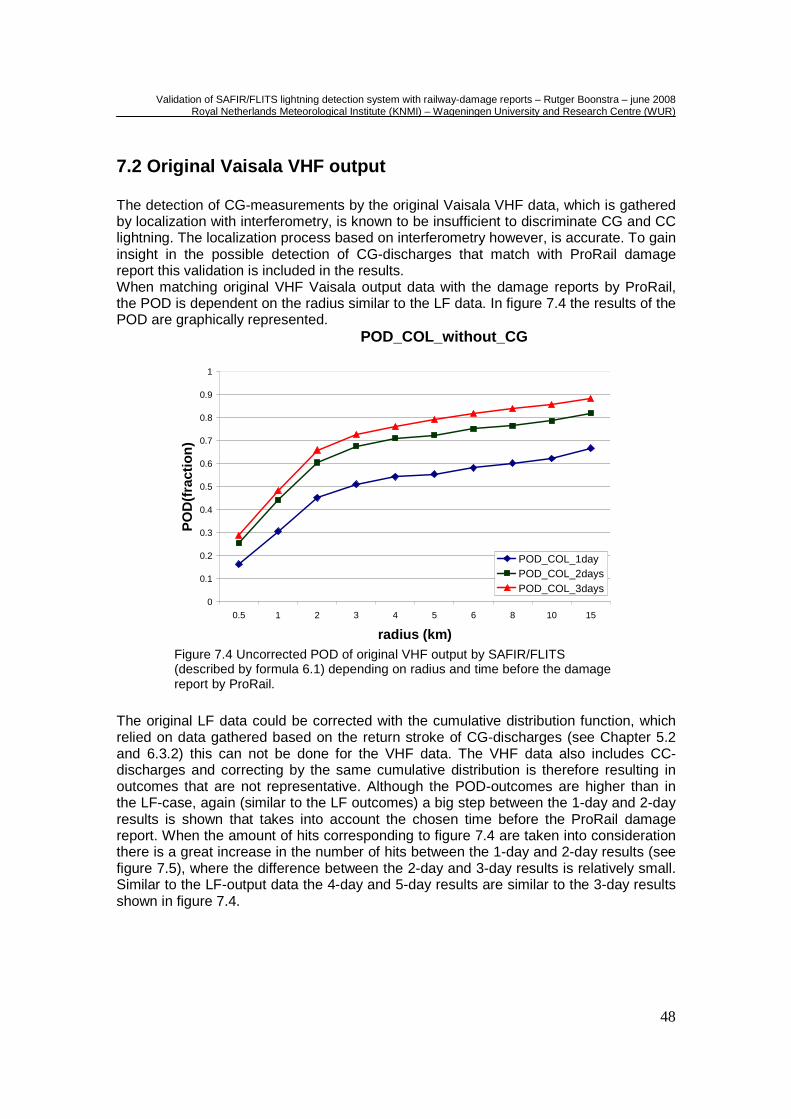
Validation of SAFIR/FLITS lightning detection system with railway-damage reports – Rutger Boonstra – june 2008 Royal Netherlands Meteorological Institute (KNMI) – Wageningen University and Research Centre (WUR)
48
7.2 Original Vaisala VHF output The detection of CG-measurements by the original Vaisala VHF data, which is gathered by localization with interferometry, is known to be insufficient to discriminate CG and CC lightning. The localization process based on interferometry however, is accurate. To gain insight in the possible detection of CG-discharges that match with ProRail damage report this validation is included in the results. When matching original VHF Vaisala output data with the damage reports by ProRail, the POD is dependent on the radius similar to the LF data. In figure 7.4 the results of the POD are graphically represented.
POD_COL_without_CG
0
0.1
0.2
0.3
0.4
0.5
0.6
0.7
0.8
0.9
1
0.5 1 2 3 4 5 6 8 10 15
radius (km)
PO
D(f
ract
ion)
POD_COL_1dayPOD_COL_2daysPOD_COL_3days
The original LF data could be corrected with the cumulative distribution function, which relied on data gathered based on the return stroke of CG-discharges (see Chapter 5.2 and 6.3.2) this can not be done for the VHF data. The VHF data also includes CC-discharges and correcting by the same cumulative distribution is therefore resulting in outcomes that are not representative. Although the POD-outcomes are higher than in the LF-case, again (similar to the LF outcomes) a big step between the 1-day and 2-day results is shown that takes into account the chosen time before the ProRail damage report. When the amount of hits corresponding to figure 7.4 are taken into consideration there is a great increase in the number of hits between the 1-day and 2-day results (see figure 7.5), where the difference between the 2-day and 3-day results is relatively small. Similar to the LF-output data the 4-day and 5-day results are similar to the 3-day results shown in figure 7.4.
Figure 7.4 Uncorrected POD of original VHF output by SAFIR/FLITS (described by formula 6.1) depending on radius and time before the damage report by ProRail.
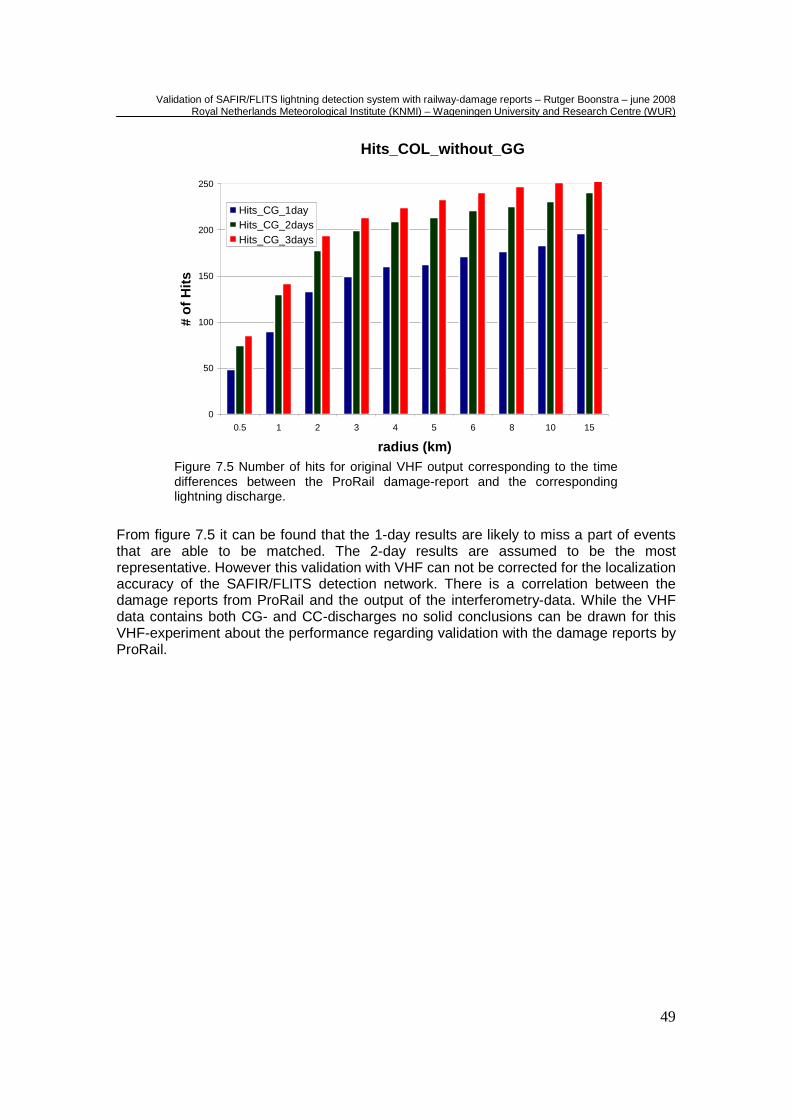
Validation of SAFIR/FLITS lightning detection system with railway-damage reports – Rutger Boonstra – june 2008 Royal Netherlands Meteorological Institute (KNMI) – Wageningen University and Research Centre (WUR)
49
Hits_COL_without_GG
0
50
100
150
200
250
0.5 1 2 3 4 5 6 8 10 15
radius (km)
# of
Hits
Hits_CG_1dayHits_CG_2daysHits_CG_3days
From figure 7.5 it can be found that the 1-day results are likely to miss a part of events that are able to be matched. The 2-day results are assumed to be the most representative. However this validation with VHF can not be corrected for the localization accuracy of the SAFIR/FLITS detection network. There is a correlation between the damage reports from ProRail and the output of the interferometry-data. While the VHF data contains both CG- and CC-discharges no solid conclusions can be drawn for this VHF-experiment about the performance regarding validation with the damage reports by ProRail.
Figure 7.5 Number of hits for original VHF output corresponding to the time differences between the ProRail damage-report and the corresponding lightning discharge.
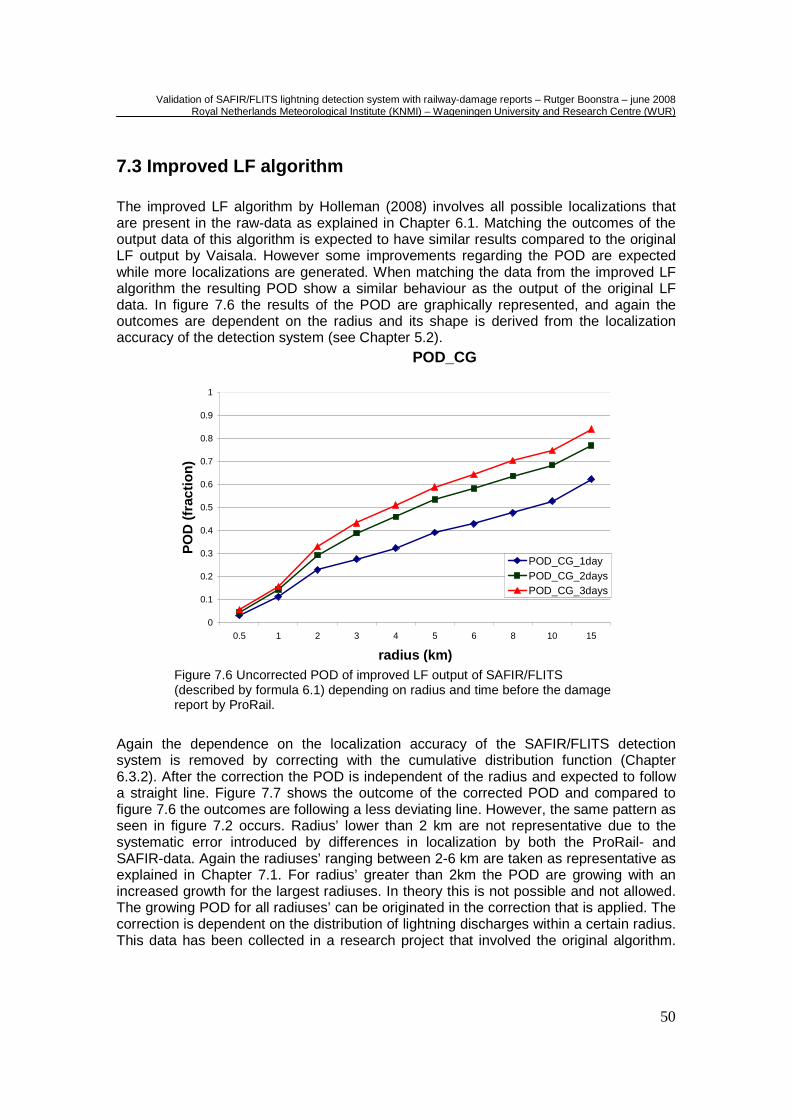
Validation of SAFIR/FLITS lightning detection system with railway-damage reports – Rutger Boonstra – june 2008 Royal Netherlands Meteorological Institute (KNMI) – Wageningen University and Research Centre (WUR)
50
7.3 Improved LF algorithm The improved LF algorithm by Holleman (2008) involves all possible localizations that are present in the raw-data as explained in Chapter 6.1. Matching the outcomes of the output data of this algorithm is expected to have similar results compared to the original LF output by Vaisala. However some improvements regarding the POD are expected while more localizations are generated. When matching the data from the improved LF algorithm the resulting POD show a similar behaviour as the output of the original LF data. In figure 7.6 the results of the POD are graphically represented, and again the outcomes are dependent on the radius and its shape is derived from the localization accuracy of the detection system (see Chapter 5.2).
POD_CG
0
0.1
0.2
0.3
0.4
0.5
0.6
0.7
0.8
0.9
1
0.5 1 2 3 4 5 6 8 10 15
radius (km)
PO
D (
frac
tion)
POD_CG_1dayPOD_CG_2daysPOD_CG_3days
Again the dependence on the localization accuracy of the SAFIR/FLITS detection system is removed by correcting with the cumulative distribution function (Chapter 6.3.2). After the correction the POD is independent of the radius and expected to follow a straight line. Figure 7.7 shows the outcome of the corrected POD and compared to figure 7.6 the outcomes are following a less deviating line. However, the same pattern as seen in figure 7.2 occurs. Radius’ lower than 2 km are not representative due to the systematic error introduced by differences in localization by both the ProRail- and SAFIR-data. Again the radiuses’ ranging between 2-6 km are taken as representative as explained in Chapter 7.1. For radius’ greater than 2km the POD are growing with an increased growth for the largest radiuses. In theory this is not possible and not allowed. The growing POD for all radiuses’ can be originated in the correction that is applied. The correction is dependent on the distribution of lightning discharges within a certain radius. This data has been collected in a research project that involved the original algorithm.
Figure 7.6 Uncorrected POD of improved LF output of SAFIR/FLITS (described by formula 6.1) depending on radius and time before the damage report by ProRail.
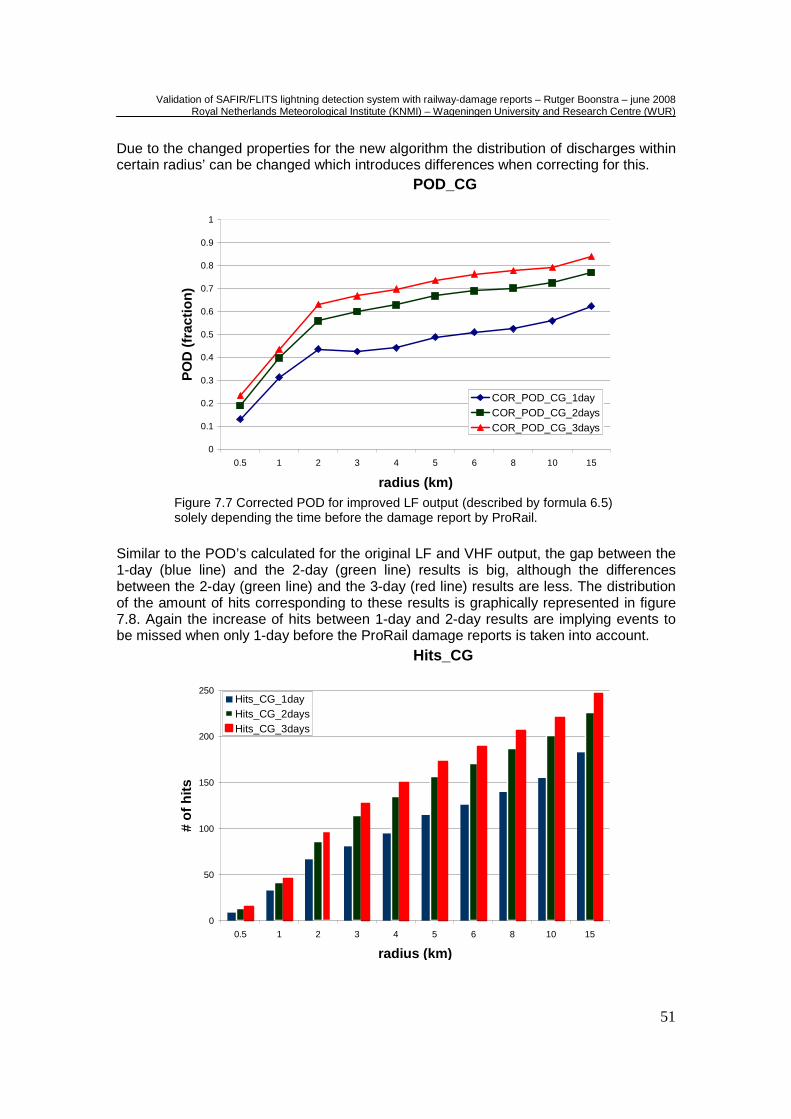
Validation of SAFIR/FLITS lightning detection system with railway-damage reports – Rutger Boonstra – june 2008 Royal Netherlands Meteorological Institute (KNMI) – Wageningen University and Research Centre (WUR)
51
Due to the changed properties for the new algorithm the distribution of discharges within certain radius’ can be changed which introduces differences when correcting for this.
POD_CG
0
0.1
0.2
0.3
0.4
0.5
0.6
0.7
0.8
0.9
1
0.5 1 2 3 4 5 6 8 10 15
radius (km)
PO
D (
frac
tion)
COR_POD_CG_1dayCOR_POD_CG_2daysCOR_POD_CG_3days
Similar to the POD’s calculated for the original LF and VHF output, the gap between the 1-day (blue line) and the 2-day (green line) results is big, although the differences between the 2-day (green line) and the 3-day (red line) results are less. The distribution of the amount of hits corresponding to these results is graphically represented in figure 7.8. Again the increase of hits between 1-day and 2-day results are implying events to be missed when only 1-day before the ProRail damage reports is taken into account.
Hits_CG
0
50
100
150
200
250
0.5 1 2 3 4 5 6 8 10 15
radius (km)
# of
hits
Hits_CG_1dayHits_CG_2daysHits_CG_3days
Figure 7.7 Corrected POD for improved LF output (described by formula 6.5) solely depending the time before the damage report by ProRail.
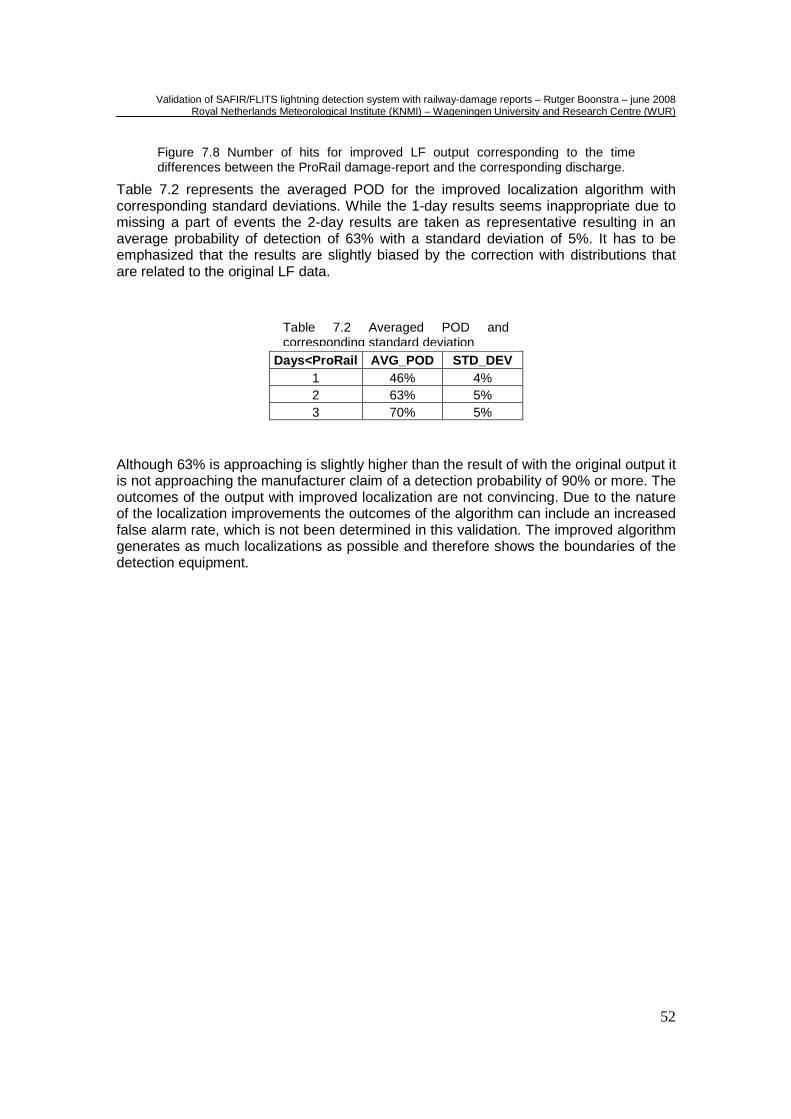
Validation of SAFIR/FLITS lightning detection system with railway-damage reports – Rutger Boonstra – june 2008 Royal Netherlands Meteorological Institute (KNMI) – Wageningen University and Research Centre (WUR)
52
Table 7.2 represents the averaged POD for the improved localization algorithm with corresponding standard deviations. While the 1-day results seems inappropriate due to missing a part of events the 2-day results are taken as representative resulting in an average probability of detection of 63% with a standard deviation of 5%. It has to be emphasized that the results are slightly biased by the correction with distributions that are related to the original LF data.
Days<ProRail AVG_POD STD_DEV
1 46% 4% 2 63% 5% 3 70% 5%
Although 63% is approaching is slightly higher than the result of with the original output it is not approaching the manufacturer claim of a detection probability of 90% or more. The outcomes of the output with improved localization are not convincing. Due to the nature of the localization improvements the outcomes of the algorithm can include an increased false alarm rate, which is not been determined in this validation. The improved algorithm generates as much localizations as possible and therefore shows the boundaries of the detection equipment.
Table 7.2 Averaged POD and corresponding standard deviation
Figure 7.8 Number of hits for improved LF output corresponding to the time differences between the ProRail damage-report and the corresponding discharge.
Validation of SAFIR/FLITS lightning detection system with railway-damage reports – Rutger Boonstra – june 2008 Royal Netherlands Meteorological Institute (KNMI) – Wageningen University and Research Centre (WUR)
53
8 Conclusions and recommendations The SAFIR/FLITS LDS has been subject to validation in this study. Uncertainties about the localization accuracy, the false alarm rate have been discussed and studied in the past. Results of these studies have been used in this validation study to gain more knowledge about the probability of detection of KNMI’s SAFIR/FLITS detection network. The validation study involved a comparison with independent data related to Cloud-to-Ground discharges provided by ProRail, which is the infrastructure-manager of the Dutch railroad system. Damage-reports from ProRail, which included location specific data, were compared with both original LF TOA output data from SAFIR/FLITS and a reprocessed dataset (Holleman, 2008) which included optimized LF TOA localization. A side-experiment was done to validate the ProRail damage report with VHF interferometry data to show the (in-) capability of DF to detect the CG-discharges. The validation score used in this study is the probability of detection (POD) which has been corrected for the cumulative distribution to provide a result independent of the localization accuracy of the SAFIR/FLITS network. Outcomes of the validation showed that the averaged corrected POD for the original LF TOA output data of SAFIR/FLITS is 57 percent with a standard deviation of 3 percent for radiuses’ in the range 2-6 km. A systematic error due to localization differences between ProRail- and SAFIR-data and increased matches for large radiuses’ are eliminated resulting in a representative range of radiuses’ which is 2-6 km. The uncorrected POD in the same range for the original LF TOA output data shows a POD of 41 percent with a standard deviation of 9 percent. The 2-day time-window before the ProRail damage-report proved to be the appropriate window that results in representative data based on the number of hits reported on which the POD relies. This 2-day time-window is used in all outcomes and assumed to be representative. Validation outcomes for the VHF data, which involves DF based on interferometry, shows that there is correlation between the damage reports from ProRail and the output of the VHF-data. However, while the VHF data contains both CG- and CC-discharges no hard conclusions can be drawn for this VHF-experiment about the performance regarding validation with the damage reports by ProRail. Results regarding the validation of lightning-specific damage reports by ProRail and the data output generated by the improved localization algorithm (Holleman, 2008) show an averaged POD of 63 percent with a standard deviation of 5 percent. This percentage is not approaching the manufacturer claim of a detection probability of 90 percent or more. The outcomes of the output with improved localization are not convincing. Due to the nature of the localization improvements the outcomes of the algorithm can include an increased false alarm rate, which is not been determined in this validation. The improved algorithm shows potential boundaries of the detection equipment which is generating as much localizations as possible. Based on the outcomes of the improved algorithm the detection equipment allows the detection of 63 percent of the CG-discharges. Validation with a long-term independent ground-based dataset (ProRail in this case) proved to be possible and resulted in valuable information about the detection probability of KNMI’s SAFIR/FLITS lightning detection system. The improved localization algorithm
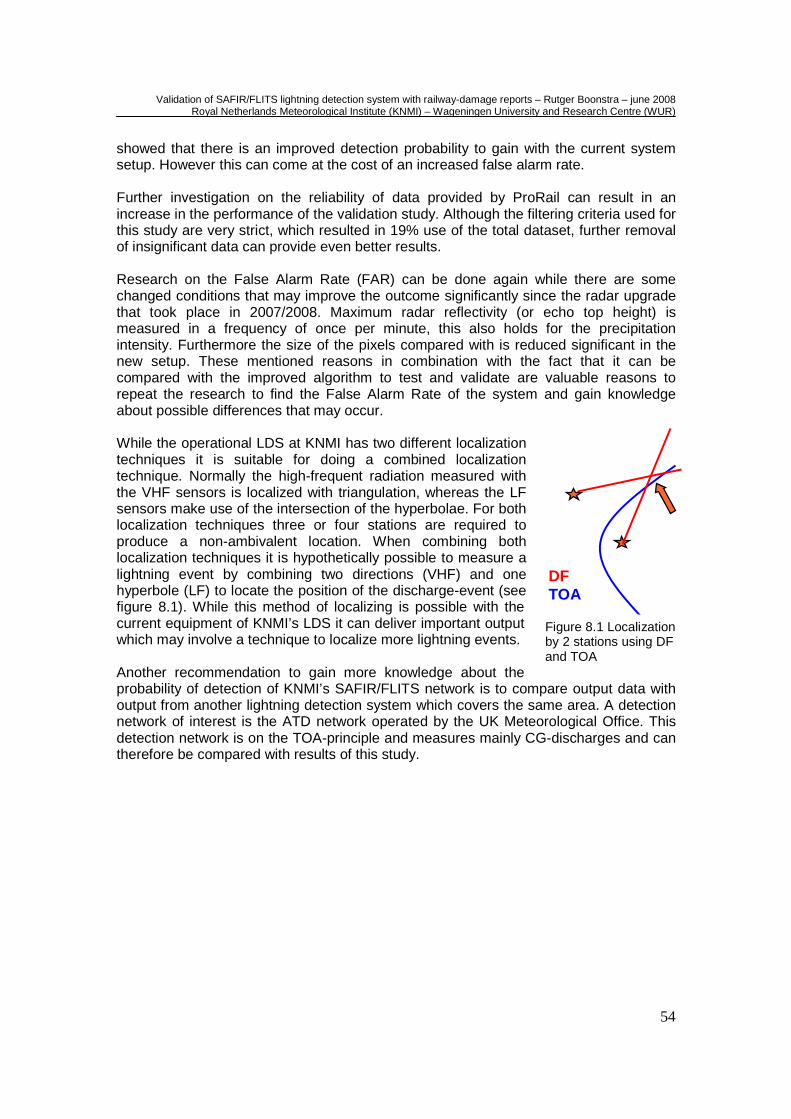
Validation of SAFIR/FLITS lightning detection system with railway-damage reports – Rutger Boonstra – june 2008 Royal Netherlands Meteorological Institute (KNMI) – Wageningen University and Research Centre (WUR)
54
showed that there is an improved detection probability to gain with the current system setup. However this can come at the cost of an increased false alarm rate. Further investigation on the reliability of data provided by ProRail can result in an increase in the performance of the validation study. Although the filtering criteria used for this study are very strict, which resulted in 19% use of the total dataset, further removal of insignificant data can provide even better results. Research on the False Alarm Rate (FAR) can be done again while there are some changed conditions that may improve the outcome significantly since the radar upgrade that took place in 2007/2008. Maximum radar reflectivity (or echo top height) is measured in a frequency of once per minute, this also holds for the precipitation intensity. Furthermore the size of the pixels compared with is reduced significant in the new setup. These mentioned reasons in combination with the fact that it can be compared with the improved algorithm to test and validate are valuable reasons to repeat the research to find the False Alarm Rate of the system and gain knowledge about possible differences that may occur. While the operational LDS at KNMI has two different localization techniques it is suitable for doing a combined localization technique. Normally the high-frequent radiation measured with the VHF sensors is localized with triangulation, whereas the LF sensors make use of the intersection of the hyperbolae. For both localization techniques three or four stations are required to produce a non-ambivalent location. When combining both localization techniques it is hypothetically possible to measure a lightning event by combining two directions (VHF) and one hyperbole (LF) to locate the position of the discharge-event (see figure 8.1). While this method of localizing is possible with the current equipment of KNMI’s LDS it can deliver important output which may involve a technique to localize more lightning events. Another recommendation to gain more knowledge about the probability of detection of KNMI’s SAFIR/FLITS network is to compare output data with output from another lightning detection system which covers the same area. A detection network of interest is the ATD network operated by the UK Meteorological Office. This detection network is on the TOA-principle and measures mainly CG-discharges and can therefore be compared with results of this study.
DF TOA
Figure 8.1 Localization by 2 stations using DF and TOA
Validation of SAFIR/FLITS lightning detection system with railway-damage reports – Rutger Boonstra – june 2008 Royal Netherlands Meteorological Institute (KNMI) – Wageningen University and Research Centre (WUR)
55
Bibliography Assink, J. Evers, E., Holleman, I., Paulssen, H. 2008. Characterization of infrasound from thunderstorms. Accepted (in press) by Geophysical Research Letters. Beekhuis, H., Holleman, I. ILDC 2004. Upgrade and evaluation of a lightning detection system. KNMI, the Netherlands. Intern rapport; 2006-01. Betz, H., Schmidt, K., Oettinger, P., Wirz, M. 2004. Lightning detection with 3-D discrimination of intracloud and cloud-to-cloud discharges. Geophysical research letters, vol. 31, L11108. Chauzy, S., Coquillat, S., Soula, S. 2005. On the relevance of Lightning Imagery from Geostationary Satellite Observation for Operational Meteorological Applications. Laboratoire dÁerologie, UMR UPS/CNRS ordered by EUMETSAT. Cummings, K., Murphy, M., ILDC 2000. Overview of Lichtning Detection in the VLF, LF and VHF Frequency Ranges. Global Atmospherics, Inc. Tucson Arizona, USA. Doswell, C., R. Davies-Jones, and D.L. Keller: 1990, On summary measures of skill in rare event forecasting based on contingency tables. Wea. And. Forecasting, 5, 576-585 Drue, C., Hauf, T., Finke, U., Keyn, S., Kreyer, O. 2007. Comparison of a SAFIR lightning detection network in northern Germany to the operational BLIDS network. Journal of Geophysical research, vol. 112, D18114. Hemink, J. 2008. Projectplan Aircraft Induced Lightning. Royal Netherlands Meteorological Institute (KNMI) Holle, R.L. and López, R.E, 1993, Overview of real-time lightning detection systems for use by Meteorological Services. World Meteorological Organization, Instruments and Observing methods, Rep.No.51., 71 pp. Holleman, I., 2001. Hail detection using single-polarization radar. KNMI, the Netherlands. Scientific report; WR-2001-01 Holleman, I., Beekhuis, H., Noteboom, S., Evers, L., Haak, H., Falcke, H. Bahren, L. ILDC/ILMC 2006. Validation of an operational lightning detection system. KNMI., Wageningen University and Research Centrum, ASTRON, Radboud University Nijmegen, the Netherlands. Keogh, S., Hibbett, E., Nash, J. Eyre, J. 2006. The Met Office Arrival Time Difference (ATD) system for thunderstorm detection and lightning location. Met. Office. Forecasting Research Technical Report No. 488
Validation of SAFIR/FLITS lightning detection system with railway-damage reports – Rutger Boonstra – june 2008 Royal Netherlands Meteorological Institute (KNMI) – Wageningen University and Research Centre (WUR)
56
Kok, C. 2000, On the behaviour of a few popular verification scores in yes/no forecasting. Scientific report 2000-04, Royal Netherlands Meteorological Institute (KNMI). Krider, E., Noggle, R., Pifer, A. Vance, D. 1980. Lightning Direction-Finding systems for forest fire detection. BAMS, Volume 61, Issue 9 (sept. 1980), pp. 980-986 Lee, A. 1986, An experimental study of the remote location of lightning flashes using a VLF arrival time difference technique. Quart. J. R. Met. Soc. (1986), 112, pp. 203-229 Lee, A. 1986, An Operational System for the Remote Location of Lightning Flashes Using a VLF Arrival Time Difference Technique. Journal of Atmospheric and Oceanic Technology, volume 3, pp. 630 Leonibus, L . De, Biron, D., Giorgi, C., Makela, A., Tuomi, T., Pylkko, P. Haapalainen, J. 2007. Study on the Present Status and Future Capabilities of Ground Based Lightning Location Networks. USAM, FMI. EUM/CO/06/1584/KJG Noteboom, S. 2006. Processing, validatie en analyse van bliksemdata uit het SAFIR/FLITS-systeem. IR 2006-01. KNMI, the Netherlands. Rakov, V. Uman, M., 2003, Lightning Physics and Effects. Department of Electrical and Computer Engineering, University of Florida. Cambridge University Press. Slangen, A., Schmeits, M., 2008. Probabilistic forecasts of winter thunderstorms around Schiphol Airport using model output statistics. Royal Netherlands Meteorological Institute (KNMI, Wageningen University and Research Centre (WUR). Vaisala LS-8000 Brochure. 2008. Vaisala Thunderstorm Total Lightning Sensor LS8000. Vaisala. PRESENTATION Lojou, J. 2006. Presentation Vaisala: Total mapping using VHF Remote sensing. ELDW 15/16 May, Vienna 2006. INTERNAL KNMI DOCUMENTS (Royal Netherlands Meteorological Institute) Handboek waarnemingen Hoofdstuk 20 KNMI, Bliksem; versie april 2005, Royal Netherlands Meteorological Institute (KNMI) Werkinstructie elektrische ontladingen op Amsterdam Airport Schiphol, Versie 1.0, 2 januari 2006, KNMI the Netherlands URL Wessels, H. KNMI, 2005. Bliksemdetectie met het KNMI KLU network, http://www.knmi.nl/kenniscentrum/klu_bliksemdetectie.html
Validation of SAFIR/FLITS lightning detection system with railway-damage reports – Rutger Boonstra – june 2008 Royal Netherlands Meteorological Institute (KNMI) – Wageningen University and Research Centre (WUR)
57
KNMI, 10-01-2008. Criterium Weeralarm (totaal overzicht) http://www.knmi.nl/VinkCMS/explained_subject_detail.jsp?id=31455 ProRail, 2008. Feiten en cijfers, http://www.prorail.nl/ProRail/Over+ProRail/Feiten+en+cijfers.htm
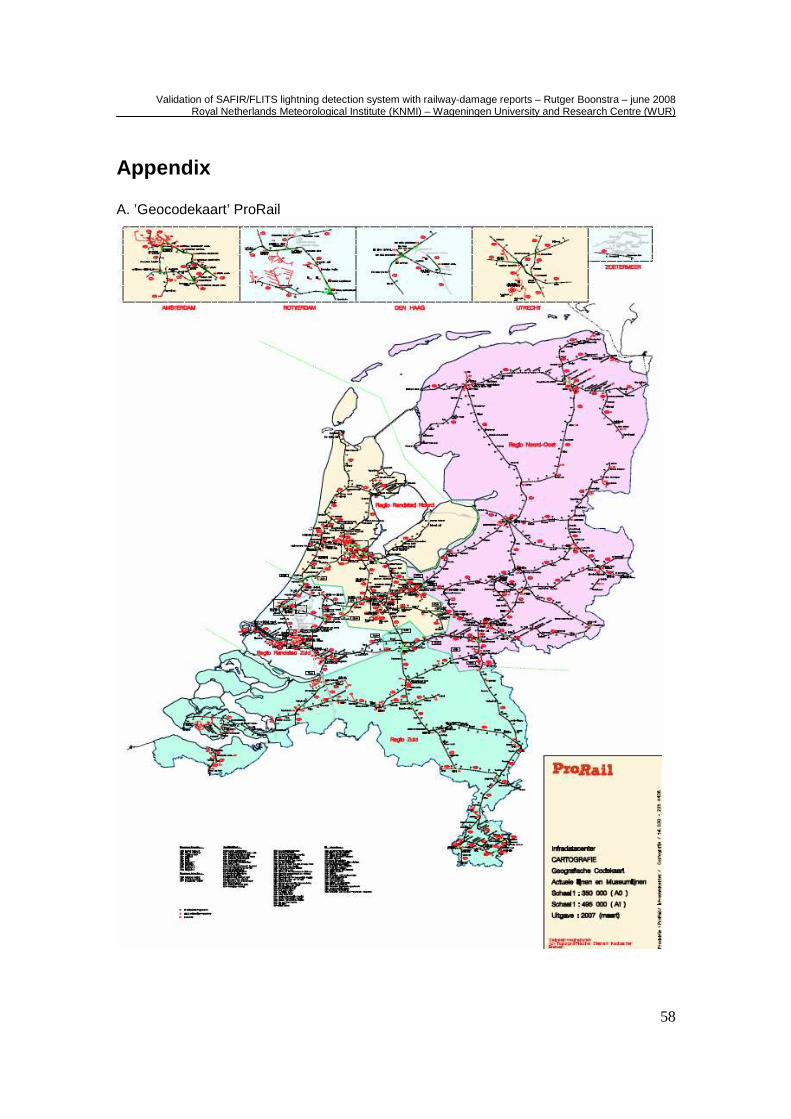
Validation of SAFIR/FLITS lightning detection system with railway-damage reports – Rutger Boonstra – june 2008 Royal Netherlands Meteorological Institute (KNMI) – Wageningen University and Research Centre (WUR)
58
Appendix A. ’Geocodekaart’ ProRail
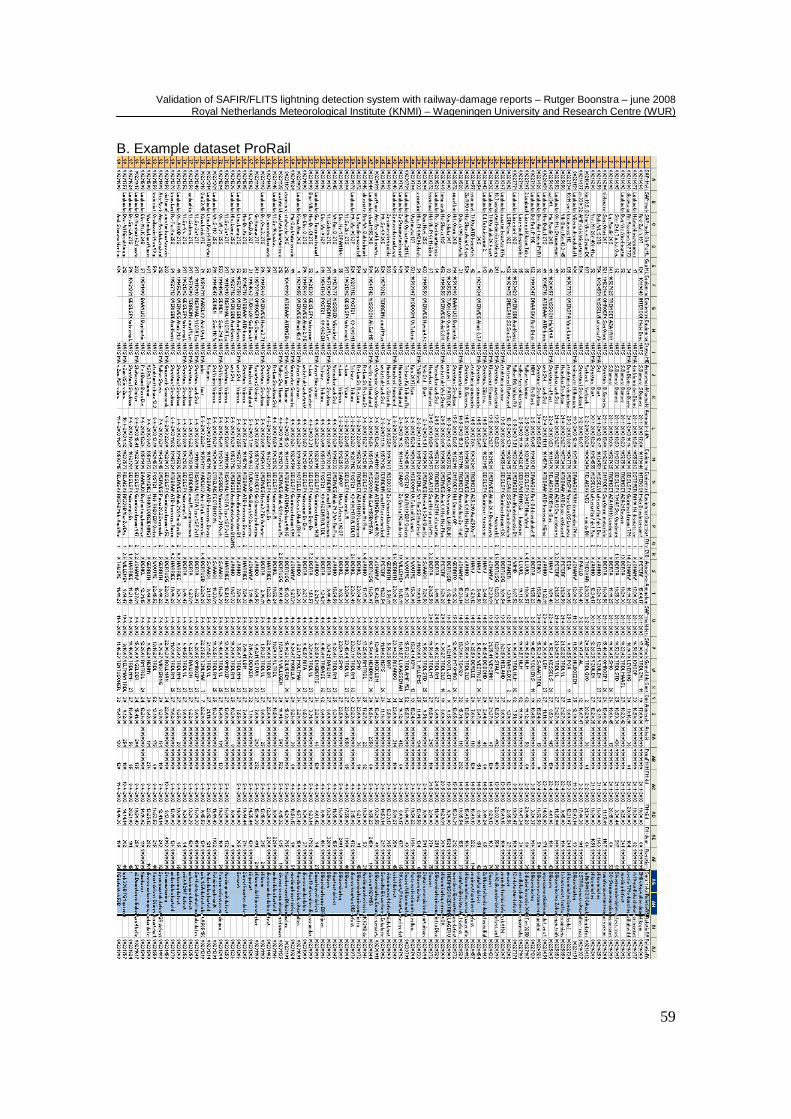
Validation of SAFIR/FLITS lightning detection system with railway-damage reports – Rutger Boonstra – june 2008 Royal Netherlands Meteorological Institute (KNMI) – Wageningen University and Research Centre (WUR)
59
B. Example dataset ProRail