Embed Size (px)
Citation preview
Department of Chemical and Biological Engineering CHALMERS UNIVERSITY OF TECHNOLOGY Gothenburg, Sweden 2014
Validation of Shelf-life Model
designed for Cold Stored Foods Characterization of spoilage flora and initial
contamination
Master’s thesis in Biotechnology
EMELIE LYSBERG

Validation of Shelf-life Model designed for Cold Stored Foods
Characterization of spoilage flora and initial contamination
EMELIE LYSBERG
Department of Chemical and Biological Engineering
CHALMERS UNIVERSITY OF TECHNOLOGY
Gothenburg, Sweden 2014
Validation of Shelf-life Model designed for Cold Stored Foods
Characterization of spoilage flora and initial contamination
EMELIE LYSBERG
© EMELIE LYSBERG, 2014.
Department of Chemical and Biological Engineering
Chalmers University of Technology
SE-412 96 Gothenburg
SWEDEN
Telephone: + 46 (0)31- 772 1000
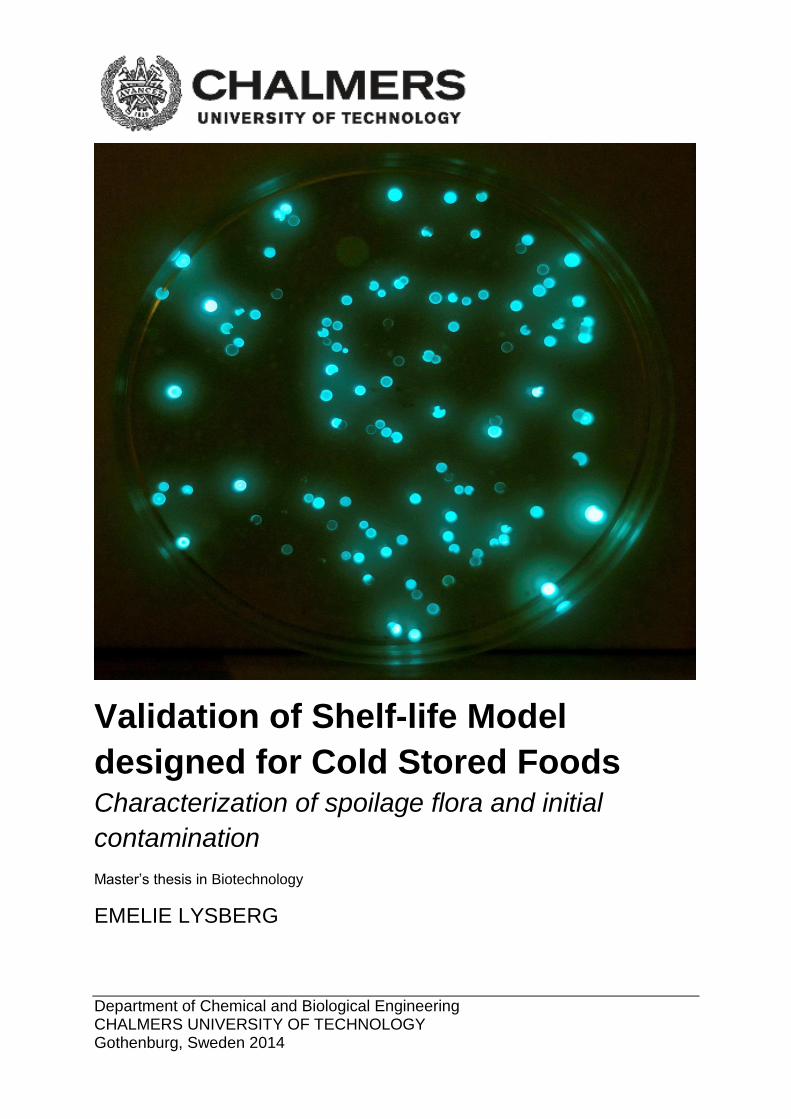
Cover:
[Luminescent Photobacterium phosphoreum cultivated on Long and Hammer´s medium at
SIK, The Swedish Institute for Food and Biotechnology, Photo: Marie Blomqvist]
[Department of Chemical and Biological Engineering]
Gothenburg, Sweden 2014

Abstract
Today large amounts of good quality cold stored foods are thrown away due to expiration of labeled
static shelf life. In order to minimize waste and improve product safety there is a need to study the
concept of a dynamic shelf life. One approach in this area is the three year Vinnova funded
innovation project DYNAHMAT (in Swedish: Dynamiskt Hållbarhetsdatum för Minimerat Svinn),
operated by Lund University together with the Swedish Institute for Food and Biotechnology (SIK)
and Malmö University. The project goal is to develop intelligent logistics- and packaging systems that
communicate and predict quality and product safety of cold stored food in real-time. Since shelf-life
of such products most often is limited by microbial action models describing growth of the specific
organism responsible for spoilage must be applied. For the models to predict time to spoilage an
input variable representing the initial amount of the specific spoilage organism (SSO) is needed.
The aim of this thesis work is to determine the initial concentration of the SSO responsible for
spoilage of modified atmosphere packed (MAP) cod, previously identified as Photobacterium
phosphoreum. With the starting concentration known, the purpose is furthermore to validate an
existing shelf-life predictive model that is ought to be applied in the DYNAHMAT project. Moreover,
the intention is to identify and characterize the general spoilage flora of MAP cod.
Initial cultivation and storage studies revealed aerobically incubated Long and Hammer plates as the
most appropriate method for determination of the initial amount of the SSO. Partial 16s rRNA gene
sequencing identified glass-like colonies growing on these plates as members of the Photobacterium
family, but was unfortunately not enough to distinguish P. phosphoreum from other closely related
Photobacterium species.
Based on the assumption that observed glass-like colonies are P. phosphoreum, performed long term
storage study resulted in an initial concentration of 2.15 log (cfu/g) for fish fillets packed in an
modified atmosphere immediately after filleting. Shelf-life model validation revealed that the model
is able to accurately illustrate growth of P. phosphoreum and based on existing sensory rejection
evaluation hence predict shelf-life of MA-packed cod.
Future studies including multi-locus gene analysis need to be performed in order to reliably conclude
that glass-like colonies aerobically cultivated on Long and Hammer plates exclusively belong to the
specie P. phosphoreum. If the outcome of these studies reveals a mixed Photobacterium flora the
respective species must be inoculated into fresh cod and spoilage development must be studied in
order to confirm P. phosphoreum as the SSO of MA-packed cod and exclude other species
contribution to fish spoilage. Last but not least, the performed long term storage study needs to be
repeated in order to find a truly representative initial concentration of the SSO that hence can be
used to accurately predict shelf-life of MA-packed cod in the DYNAHMAT project.
Keywords: dynamic shelf-life, predictive microbiology, MA-packed cod, Photobacterium
Phosphoreum.
Table of contents
1. Introduction.......................................................................................................................... 1
1.1 Background .............................................................................................................................. 1
1.2 Aim........................................................................................................................................... 1
1.3 Limitations ............................................................................................................................... 2
2. Theory .................................................................................................................................. 2
2.1 Spoilage of modified atmosphere-packed cod ........................................................................ 2
2.1.1 Photobacterium phosphoreum ........................................................................................ 3
2.2 Predictive microbial shelf-life models ..................................................................................... 4
2.2.1 Bacterial growth .............................................................................................................. 4
2.2.2 Microbial model for shelf-life prediction of MAP cod ..................................................... 4
2.2.2.1 Determination of the initial amount of P. phosphoreum in cod ..................................... 5
3. Materials and methods ......................................................................................................... 6
3.1 Initial studies for growth media and cultivation technique selection ..................................... 6
3.1.1 Media and cultivation techniques ................................................................................... 6
3.1.2 Microbial analysis and CFU determination ..................................................................... 6
3.1.3 Identification tests ........................................................................................................... 7
3.1.4 PCR and sequencing ........................................................................................................ 7
3.2 Long term storage studies ....................................................................................................... 8
4. Results and discussion ........................................................................................................... 9
4.1 Initial studies for growth media and cultivation technique selection ..................................... 9
4.1.1 Microbial analysis and CFU determination ..................................................................... 9
4.1.2 Identification tests ......................................................................................................... 10
4.1.3 PCR and sequencing ...................................................................................................... 11
4.2 Long term storage studies ..................................................................................................... 15
4.2.1 Study number one ......................................................................................................... 15
4.2.2 Study number two ......................................................................................................... 18
4.2.3 Study number three ...................................................................................................... 19
5. Conclusions ......................................................................................................................... 22
6. References .......................................................................................................................... 23

1
1. Introduction
1.1 Background Today large amounts of good quality cold stored foods are thrown away due to expiration of
labeled shelf life. In Sweden and other parts of Europe as much as a third of all
produced/imported food is discarded (WRAP 2008) and the waste of cold stored foods take place
both at the consumer level and in the food distribution chain (Karlberg & Klevås 2002). According
to WRAP (2008) and Rahelu (2009) approximately 60 % of all food that is thrown away could
have been eaten if it was possible to determine quality in real time. Furthermore, the usage of a
predetermined static shelf life is not always reliable when it comes to food quality assurance.
This since each food item in its distribution chain is subjected to specific, often varying storing
conditions that are impossible for the shelf life labeling producer to predict.
In order to minimize waste of good quality foods and improve product safety there is a need to
study the concept of a dynamic shelf life. One approach in this area is the three year Vinnova
funded innovation project DYNAHMAT (in Swedish: Dynamiskt Hållbarhetsdatum för Minimerat
Svinn), operated by Lund University together with the Swedish Institute for Food and
Biotechnology (SIK) and Malmö University. The project goal is to develop intelligent logistics- and
packaging systems that along the food chain communicate and predict quality and product safety
of cold stored food in real-time. To succeed, the plan is to identify, evaluate and develop sensors
able to measure parameters effecting food quality and then combine these with predictive
models for determination of shelf life and safety. The sensors and models can then be integrated
with distributed information systems and communication tools which will enable the delivery of
a dynamic shelf life. One possible approach is the attachment of a temperature registration
sensor directly to the food product and the subsequent utilization of e.g. a mobile phone
application for the prediction and delivery of shelf-life.
Included in the DYNAHMAT project are three cold stored food products; fresh cod packed in
modified atmosphere (MA), cottage cheese and a MA-packed ready to eat processed meat
product. Since shelf-life of these products most often are limited by microbial action models
describing growth of the specific organism responsible for spoilage must be applied. Such
mathematical models have been developed during the last decades and a few are today available
for shelf-life prediction. However, for the models to predict time to spoilage they, except for the
food storage temperature registered by the sensor, need an input variable representing the
initial amount of the specific spoilage organism (SSO). Such SSO starting concentrations must
therefore be experimentally determined and the predictive models need to be validated against
experimental data before they can be applied in future DYNAHMAT solutions.
1.2 Aim The aim of this thesis work is to determine the initial concentration of the specific spoilage
organism (SSO) responsible for spoilage of modified atmosphere packed (MAP) cod, previously
identified as Photobacterium phosphoreum. With the starting concentration known, the purpose
is furthermore to validate an existing shelf-life predictive model that is ought to be applied in the

2
DYNAHMAT project. Moreover, the general spoilage flora of MAP cod will be characterized and
identified in order to confirm the spoilage flora development reported in literature.
1.3 Limitations Although there are three cold stored food products included in the DYNAHMAT project fresh cod
packed in modified atmosphere is the only one included in this thesis work due to a limited
timeframe. In addition, the restricted availability of time only allows traditional plating
techniques to be applied for the SSO initial concentration determination. Furthermore, the
validation procedure will be limited to growth of the SSO and hence no sensory rejection
validation will be performed.
2. Theory
2.1 Spoilage of modified atmosphere-packed cod Fresh fish has due to high water activity (aw), neutral pH and presence of autolytic enzymes
limited shelf-life (Sivertsvik et al., 2002). Spoilage is according to Sivertsvik et al. among others
most often caused by microbial action and various microorganisms are naturally present on all
outer fish surfaces (i.e. skin and gills) as well as inside the fish intestines. Although the fish
muscle itself is sterile, it easily becomes infected by the surface and intestinal bacteria during
slaughtering and processing. The microbial spoilage of fresh fish depends on both intrinsic (e.g.
pH and fish quality) and extrinsic factors such as storage temperature, processing and packaging
atmosphere (Huss et al., 1997). Microbial fish spoilage is often characterized by undesirable
changes in appearance, flavour, texture and odour resulting in loss of food quality (Sperber &
Doyle, 2009). Odorous compounds normally produced towards the end of fish shelf-life due to
bacterial growth are volatile fatty acids, ammonia, low molecular weight sulphur compounds
such as hydrogen sulphide (H2S) and trimethylamine (TMA) (Sivertsvik et al., 2002). TMA is
recognized as the characteristic “fishy” odour of spoiled fish and are at chilled temperatures
produced by bacterial reduction of trimethylamine-oxide (TMAO) catalyzed by the bacterial
enzyme TMA oxidase (Ashie et al., 1996). Many spoilage bacteria can according to Sivertsvik et al.
(2002) also produce TMA when growing in oxygen limited environments by utilizing TMAO as a
terminal hydrogen acceptor.
The aim of modified atmosphere packaging is replacement of air with another fixed gas mixture
that often consists of CO2 and/or N2. N2 is an inert gas that is used for oxygen removal, thus
preventing growth of aerobic bacteria, whereas CO2 exerts bacteriostatic properties that inhibit
growth of many spoilage bacteria. The mode of inhibitory action is not completely known but
CO2 is thought to create a drop in pH and at the same time decrease enzymatic and microbial
activities (Sivertsvik et al., 2002). Devlieghere et al. (1998) have demonstrated that CO2 needs to
dissolve into the product in order to inhibit bacterial growth. Carbon dioxide is highly soluble in
water and fat and the solubility increases with decreased temperature, i.e. the inhibitory
effectiveness is greatly influenced by storage temperature and the benefits of MAP may be lost
without proper storage control (Sivertsvik et al., 2002). Furthermore, Sivertsvik et al. stresses
that in order to reach an appropriate bacterial inhibition and at the same time prevent package
collapse due to CO2- solubility the volume of gas should be at least two to three times the volume
of fish product.

3
During fish storage the bacterial microflora may develop in certain directions, i.e. some bacterial
species may grow more than others depending on surrounding conditions. Although a spoiled
fish product contains a mixture of bacterial species there is often a specific bacterial group that is
responsible for the important chemical changes coupled to fish spoilage (Huss et al., 1997). This
specific bacterial specimen is usually referred to as an SSO (Specific Spoilage Organism) and even
though the knowledge of SSOs of different fishes are still limited (Sivertsvik et al., 2002) the SSO
of both aerobically stored and MA-packed cod have been identified. Already in 1987 studies
performed by Gram et al. revealed that Shewanella putrefaciens is the main spoilage bacterium
of cod stored aerobically at chilled temperatures. The genus Shewanella belongs to the
Alteromonadaceae family and comprises Gram negative and oxidase positive straight or curved
rods that are facultatively anaerobic (Bowman, 2005). The specie S. putrefaciens produces
intensive and unpleasant off-odours, reduces TMAO to TMA and is especially well-known for its
ability to produce H2S, with a smell strongly reminiscent of rotten eggs (Sivertsvik et al., 2002). In
MAP cod S. putrefaciens is however strongly inhibited by CO2 and the organism responsible for
spoilage has been identified as P. phosphoreum (Dalgaard et al. 1993; Dalgaard 1995a).
2.1.1 Photobacterium phosphoreum
P. phosphoreum is taxonomically classified as a Gammaproteobacteria and belongs to the family
Vibrionaceae. It is a Gram negative, motile, facultative anaerobic and chemoorganotrophic
bacterium that has both a respiratory and a fermentative type of metabolism. The morphology
consists of plump, straight rods (some coccobacillary) and the bacterium is oxidase negative and
motile by means of flagella (Thyssen & Ollevier, 2005). P. phosphoreum are psychrotrophic and
widespread in the marine environment, where the most common habitat is in the intestines of
marine fishes (Dalgaard et al., 1997a). It is able to grow at 4°C but not at temperatures above
35°C (optimum growth occurs between 20-25°C) and sodium ions are required for growth
(Thyssen & Ollevier, 2005). Some strains of P. phosphoreum are bioluminescent and are thus able
to emit a blue-green light. According to Thompson et al. (2004) the bacteria can live in symbiotic
associations with marine fishes, where they colonize light organs of the host and via emission of
light play a role in communication, prey attraction and predator avoidance. The bioluminescence
is caused by an oxidation reaction that is catalyzed by the enzyme luciferase. The reaction
involves oxidation of reduced flavin mononucleotide (FMNH2) and a long chain aliphatic aldehyde
by molecular oxygen resulting in the formation of light (Thyssen & Ollevier, 2005):
FMNH2 + RCHO + O2 FMN + RCOOH + light
The fact that P. phosphoreum has been identified as the SSO of MA-packed cod is not surprising
since it has been shown to be highly resistant to CO2 and the growth rate of the bacterium is
increased under anaerobic conditions (Dalgaard, 1995b). Spoiled MAP cod is opposed to
aerobically stored cod characterized by high levels of TMA, resulting in fishy and ammonia-like
off-odours and sour off-flavours (Dalgaard, 1993). This observation can be explained by the fact
that P. phosphoreum reduces TMAO to TMA at 10-100 times the amount per cell compared to S.
putrefaciens and produces only very small amounts of the putrid H2S (Dalgaard, 1995a). The high
TMA-producing ability can according to Dalgaard (1995a) probably be due to the large cell size
(5µm in diameter) observed for P. phosphoreum.

4
2.2 Predictive microbial shelf-life models
2.2.1 Bacterial growth
In order to predict shelf-life within the food microbiology field bacterial growth needs to be
studied and modeled. Predictive microbiology involves the development of mathematical models
that can be used to describe the behavior of microorganisms under different physical or chemical
conditions, such as for example temperature. Bacterial growth is characterized by more or less
distinct subsequent phases that together form a sigmoidal curve (Zwietering et al., 1990), see
Figure 1. Before growth can occur bacteria may need some time to adjust to ambient conditions
and the growth curve therefore often consists of an initial part where the growth rate is close to
zero, represented by the lag phase (Todar, 2012). The growth then accelerates to a maximal
value within the exponential phase before a stationary phase is reached where the growth rate
again approaches zero. After some additional time the number of bacteria starts to decline,
representing the so called death phase. By defining the growth curve as the logarithm of the
number of bacteria plotted against time the maximum specific growth rate (µmax) is given by the
slope of the line when bacteria grows exponentially (Zwietering et al., 1990).
Figure 1. A typical bacteria growth curve obtained by plotting the logarithm of the number of viable bacteria cells against time (Todar, 2012).
2.2.2 Microbial model for shelf-life prediction of MAP cod
To be able to predict shelf-life of cod fillets packed in modified atmospheres with mixtures of CO2
and N2 Dalgaard et al. (1997b) applied an iterative approach to develop a microbial model based
on the SSO P. phosphoreum. The iterative approach was divided into three separate parts; initial
studies with naturally contaminated cod to determine spoilage domains and growth kinetics of
the SSO, mathematical modelling of data including quantification of extrinsic and intrinsic
parameter effects and finally model validation by comparison against data obtained from storage
experiments. The work resulted in a well-functioning spoilage model that according to Dalgaard
et al. (1997b) can be used to accurately predict shelf-life of MAP cod based on initial numbers of
P. phosphoreum, storage temperature and the level of CO2 in the modified atmosphere.
In order to determine the concentration of P. phosphoreum (Nt, in log cfu/g) at a specific time (t)
a log-transformed three- parameter logistic model is used as a primary growth model,

5
where N0 is the initial concentration of P. phosphoreum (in cfu/g), Nmax is the maximum
concentration (in cfu/g) and µmax is the specific growth rate (in h-1):
Dalgaard et al. (1997a) determined that sensory rejection of MAP cod and thus end of shelf-life
on average can be observed four generation times (tgen = ln(2)/µmax) after the inflection point of
the logistic growth curve is reached. By using a Nmax value of 7.9±0.4 log cfu/g time to spoilage
can thus be calculated from the initial concentration (N0) and maximum specific growth rate
(µmax) using the following shelf-life criterion:
The maximum specific growth rate (µmax) depends on storage temperature as well as the amount
of CO2 and a secondary quadratic polynomial growth model can be utilized to calculate its value:
where T is storage temperature in °C and %CO2 is equal to the equilibrium concentration of
carbon dioxide obtained after CO2 has dissolved into the fish flesh.
2.2.2.1 Determination of the initial amount of P. phosphoreum in cod
To be able to apply the predictive P. phosphoreum shelf-life model for MA-packed cod presented
in section 2.2.2 in the DYNAHMAT project, an initial concentration (N0) of the specific spoilage
organism needs to be experimentally determined. A couple of methods to determine the number
of P. phosphoreum in fresh fish have been presented in the scientific literature over the past
three decades. In general, there exist three distinct techniques; a real-time PCR method (Macé et
al., 2013), a conductance method (Dalgaard et al., 1996) and various traditional cultivations
methods utilizing culture plates (Dalgaard, 1995a; Dalgaard et al., 1997a; NMKL Method, 2006).
Since the timeframe of this project is restricted only one concentration determining method can
be applied and the traditional cultivation option was found as the most appropriate choice.
There are today no completely P. phosphoreum selective cultivation medium available (Macé et
al., 2013), but Iron Agar and Long and Hammer´s medium both containing 1 % NaCl have been
suggested as appropriate alternatives (Dalgaard, 1995a & Dalgaard et al., 1997a). By utilizing
spread plates of the suggested media P. phosphoreum can be distinguished and isolated as glass-
like colonies. H2S producing S. putrefaciens can on the other hand be determined as black
colonies on Iron Agar pour plates due to precipitation of iron sulphide (FeS) (Dalgaard, 1995a;
NMKL Method, 2006).

6
Although traditional plating is a reliable method for P. phosphoreum cultivation the usability for
direct determination of the initial number of bacteria may be limited. The initial bacterial flora
often consists of a mixture of various species and it seems probable that the starting
concentration of P. phosphoreum lies under the detection limit. However, by utilizing the
traditional plating technique the growth curve of P. phosphoreum can be constructed. Linear
regression of the exponential phase followed by extrapolation can then be utilized in order to
find the sought starting concentration (i.e. the point where the straight line intercepts with the y-
axis).
3. Materials and methods
3.1 Initial studies for growth media and cultivation technique selection In order to characterize the natural cod bacterial flora and try to find an appropriate P.
phosphoreum cultivation method, different media and cultivation techniques were evaluated by
microbial analysis. Identification tests followed by PCR and sequencing were then performed to
confirm the identities of isolated bacteria colonies.
3.1.1 Media and cultivation techniques
Media and cultivation methods included in the initial studies are presented in Table 1. Since P.
phosphoreum (in contrast to S. putrefaciens) is highly CO2- resistant (Dalgaard, 1995b) two
cultivation methods involving storage in an atmosphere of 100% CO2 were included.
Table 1. A summary of growth media and cultivation conditions used in initial studies.
Cultivation method Medium Plating Temperature Time
LH 1% NaCl Aer NMKL Method No. 184 (2006)
Spread 15°C 6d
LH 1% NaCl CO2 NMKL Method No. 184 (2006)
Spread 15°C 6d
IA 0.5% NaCl Aer Oxoid agar CM964
Pour 25°C 3d
IA 1% NaCl Aer Oxoid agar CM964
+ 5g NaCl/l
Spread 5°C 14d
IA 1% NaCl CO2 Oxoid agar CM964
+ 5g NaCl/l
Spread 25°C 6d
LH: Long and Hammer´s agar, IA: Iron Agar, Aer: Aerobic storage of plates, CO2: Plates stored in 100% CO2
Spread: 0.1ml sample was evenly spread on top of the agar
Pour: 1ml sample was mixed with 10-15ml agar and a thin layer of IA was spread on top of the solidified
first agar layer
3.1.2 Microbial analysis and CFU determination
Fillets from two individual cod fishes (A and B) caught in the northeast Atlantic were bought in a
local store and transported to SIK within 20 minutes. Microbial analysis was performed
immediately at day 0 and after 3 days of storage at 4°C in modified atmosphere (50 % CO2/50 %
N2 using a Henkovac vacuum packer from HFE Vacuum Systems, the Netherlands). Fish samples

7
were prepared by tenfold dilution of 10g of cod in chilled peptone water (PW) followed by
homogenization for 60 s in a Stomacher. The homogenates were further diluted in PW and
spread and pour plates were prepared according to Table 1. LH 1% NaCl CO2 and IA 1% NaCl CO2
were placed in plastic bags and packed in 100% CO2. After incubation all spread plates were
inspected for luminous colonies (performed in a dark room) and standard plate count was
utilized in order to determine the number of each phenotypic colony forming unit (cfu) as well as
total viable count (TVC).
3.1.3 Identification tests
In order to study observed colonies closer a total of 32 individual colonies were selected from LH
1% NaCl Aer, LH 1% NaCl CO2 and IA 1% NaCl CO2 from day 0 (both fillet A and B) and isolated on
LH 1% NaCl during aerobic conditions. The selection procedure was designed so that all various
phenotypic types of colonies were included in the identification. All isolated colonies were
examined for macroscopic morphology and ability to produce cytochrome C oxidases, using
Reagent Dropps (BD Oxidase, United States) whereas a total of 13 colonies were further
investigated by Gram staining and microscopy.
3.1.4 PCR and sequencing
To confirm the identities of phenotypically different colonies originally picked from LH 1% NaCl
Aer and LH 1% NaCl CO2 seven out of the 13 colonies that were studied in more detail in the
identification procedure were selected for PCR and subsequent sequencing. Moreover, to be
able to specifically identify glass-like colonies growing on LH 1% NaCl Aer and LH 1% NaCl CO2
another 42 colonies were randomly picked, isolated and subjected to PCR and sequencing. The
42 colonies consisted of 32 with origin from LH 1% NaCl CO2 (eight colonies from each cod and
storage day) whereas the remaining ten glass-like colonies were picked from LH 1% NaCl Aer
from storage day 3 (five from each cod). No glass-like colonies from LH 1% NaCl Aer storage day 0
were included due to difficulty in distinguishing these from other colonies. However, at the day
of isolation two individual colonies with distinct characteristics had appeared on LH 1% NaCl Aer
from storage day 0 and these were therefore also subjected to PCR and sequencing. In other
words, a total of 51 individual colonies were included in the PCR and sequencing procedure.
PCR was performed using primer F8 (5’- AGA GTT TGA TCC TGG CTC AG-3’) and 926R (5’-CCG TCA
ATT CCT TT R AGT TT -3’) for amplification of a 918bp fragment of the bacterial 16S rRNA.
Amplification was carried out in a 25µl reaction mixture containing 1x iProof High-Fidelity Master
Mix (Bio-Rad Laboratories, United States), 0.5µM of each primer, 2 µl pre-boiled DNA template
(made by dissolving colonies in 0.5ml deionized and sterilized water) and sterile deionized water
to reach a final volume of 25µl (due to cases with week PCR products some colonies were
directly dissolved in the PCR mixture without pre-boiling). A negative control (sample without
DNA template) was included in all experiments for contamination detection. The PCR
amplification was carried out with a thermal cycler machine (Bio Rad Laboratories) under the
following conditions: initial denaturation (3 min, 98°C) followed by 35 cycles of denaturation (10
s, 98°C), annealing (30 s, 55°C) and extension (1 min, 72°C) and a final elongation step (10 min,
72°C).
The amplified products were visualized by electrophoresis with a PowerPac Basic (Bio-Rad
Laboratories, United States) along with a Fermenta Fastruler DNA ladder of Low Range (Thermo

8
Scientific, United States) using a 1.5% (w/v) agarose gel. 4 µl PCR products together with 1 µl Gel
Red Loading Dye solution (1µl GelRed Nucleic acid stain 10,000x in DMSO from Biotium, United
States and 100µl Nucleic acid sample loading buffer 5x from Bio-Rad, United States) were added
to each well. The amplified and visualized PCR products were according to the company’s
recommendations send to Macrogen Europe (Amsterdam, the Netherlands) for DNA sequencing.
Bacteria were identified by aligning obtained sequences using the Basic Local Alignment Search
Tool, BLAST (http://blast.ncbi.nlm.nih.gov/Blast.cgi) and the Ribosomal Database Project (RDP)
Classifier (http://rdp.cme.msu.edu/classifier/classifier.jsp), respectively.
3.2 Long term storage studies To be able to construct growth curves for the SSO P. phosphoreum three separate long term
storage studies were performed using appropriate cultivation methods found in initial studies,
see Table 2. In all studies fillets from cod newly caught in the northeast Atlantic were delivered
to SIK kept on ice (for study number three fish fillets were after filleting at the fish distributor
immediately packed in a modified atmosphere (50% CO2/50% N2) and hence arrived MA-packed).
The fillets were aseptically cut into separate pieces and placed in bags made by plastic film
delivered from the fish distributor. In study number three all fish pieces were mixed in a plastic
bag to obtain an evenly distributed bacterial flora prior to placement in individual packages.
Microbial analysis was immediately performed as described in section 3.1.2. Remaining fish
pieces were packed in modified atmosphere (50 % CO2/50 % N2 with a fish to gas volume ratio of
1:2-3 using a HenkoVac vacuum packer from HFE Vacuum Systems, the Netherlands) and stored
at 2°C or 4°C. The microbial analysis procedure was repeated during different time intervals using
fish packages containing <1% O2 (the low oxygen levels and presence of carbon dioxide was
confirmed using a CheckMate II Gas analyzer from PBI Dansensor, Denmark). A limited sensory
analysis was also performed and included smell and texture observations. Plates belonging to LH
1% NaCl CO2 were packed in plastic bags with 100% CO2 and all plates were incubated according
to Table 1. After incubation the carbon dioxide level for LH 1% NaCl CO2 was controlled and all
plates were inspected for bacterial growth.
Table 2. A summary of details for the three long term storage studies performed.
Media Fillets/Replicates Storage temp Days of analysis*
Study number 1 LH 1% NaCl Aer LH 1% NaCl CO2
IA 0.5% NaCl Aer
Four fillets (A,B,C,D)
2°C and 4°C 0,1,4,6,8,11,13,15
Study number 2 LH 1% NaCl Aer
Five fillets (A,B,C,D,E)
4°C 0,3,4,5,6,7,10
Study number 3 LH 1% NaCl Aer Five biological
replicates 4°C 1,2,3,4,5,6,7,9**
*Day of MA-packing designated as day 0
**Analysis performed two times a day except for day 9

9
4. Results and discussion
4.1 Initial studies for growth media and cultivation technique selection
4.1.1 Microbial analysis and CFU determination
Results from microbial analysis and CFU determination are summarized in Table 3 and 4,
respectively. Luminescence was observed from some glass-like colonies on LH and IA spread
plates incubated aerobically, indicating that these might be strains of P. phosphoreum.
Furthermore, the number of luminescent colonies increased from day 0 to day 3. As expected, no
luminescent colonies were observed on plates incubated in CO2 since oxygen is required (see
section 2.1.1).
As can be seen in Table 4, reported numbers of cfu are regardless of cultivation technique in the
same region for fish fillets A and B. Small glass-like colonies were observed on all spread plates,
see Table 3. However, LH 1% NaCl CO2 was the only cultivation technique that displayed a
completely uniform bacterial flora, consisting of only glass-like colonies. Regarding LH plates
incubated aerobically, the numbers of glass-like colonies reported for day 0 are unsure since it
turned out to be difficult to distinguish glass-like colonies from the competing bacterial flora.
Nevertheless, the number of glass-like colonies reported for LH plates incubated aerobically
corresponds fairly well to the TVC observed for LH plates incubated in CO2. This observation
supports the suspicion that CO2 incubation inhibits all bacteria other than P. phosphoreum and
reinforces the probability that glass-like colonies indeed are P. phosphoreum.
Common for both LH cultivation techniques are the increase of glass-like colonies from day 0 to
day 3, which in combination with the fact that the same trend was observed for luminescent
colonies further supports that glass-like colonies are P. phosphoreum. An increase of H2S
producing black colonies could also be observed from IA pour plates, yet to a smaller extend
compared to growth of glass-like colonies on LH. Regarding IA spread plates incubated
aerobically the number of glass-like colonies correspond very well to the numbers found on
aerobically and CO2 incubated LH plates, indicating that these colonies probably represents the
same bacterial species. However, since a much more complex bacteria flora was observed on
these plates and the cultivation method demands a much longer incubation period (14 days
compared to 6 days), the LH-techniques seem like better cultivation options. The IA CO2 spread
plate technique also seems like a less reliable method since it was really hard to distinguish
between white and glass-like colonies. As a result only the TVC are included for IA CO2 in the
results presented in Table 4.

10
Table 3. Macroscopic characteristics of colonies observed in initial studies.
LH 1% NaCl
Aer Spread
LH 1% NaCl CO2
Spread
IA 0,5% NaCl Aer
Pour
IA 1% NaCl Aer
Spread
IA 1% NaCl CO2
Spread
Bacterial Flora
Large pink Large white Small glass-
like
Small glass-like
Small black Small white
Large white Large pink
Small glass-like
Black Yellow
Intestine-like
Small white Small glass-
like
Table 4. Number of colony forming units observed for the different cultivation techniques included in initial studies.
Day 0 Day 3
A B A B
LH 1% NaCl Aer Spread
Glass-like colonies (log cfu/g)
6.18 5.57 8.15 8.01
Total viable count (log cfu/g)
6.44 6.18 8.17 8.02
LH 1% NaCl CO2 Spread
Total viable count (log cfu/g)
6.16 5.53 7.58 7.78
IA 0,5% NaCl Aer Pour
Black colonies (log cfu/g)
5.43 5.00 6.27 6.06
Total viable count (log cfu/g)
6.21 6.03 6.46 6.21
IA 1% NaCl Aer Spread
Glass-like colonies (log cfu/g)
6.21 5.65 8.11 7.95
Total viable count (log cfu/g)
6.45 6.20 8.12 7.96
IA 1% NaCl CO2 Spread
Total viable count (log cfu/g)
5.27 4.89 6.40 6.74
4.1.2 Identification tests
Since microbial analysis revealed that both LH cultivation methods and to some extend also the
IA 1% NaCl CO2 technique could be appropriate cultivation techniques to study the growth of P.
phosphoreum, tests were performed to identify isolated bacteria in question. An overview of test
results can be found in Table 5. Unlike IA plates incubated in CO2 both LH cultivation techniques
displayed uniform results for each distinct macroscopic morphology tested. The small white
colonies on IA turned out to consist of both gram positive and gram negative bacteria whereas
the small glass-like ones appeared as oxidase positive large pink colonies when isolated on LH 1%
NaCl Aer. This fact means that the glass-like colonies found on IA CO2 cannot be P. phosphoreum
(which is oxidase negative) and that most probably only a fraction of the white colonies belong to
this specie. As a result, the IA cultivation technique could be ruled out for further studies.

11
Regarding test results for LH incubated aerobically it can be concluded that neither large pink nor
large white colonies belong to the P. phosphoreum specie. Moreover, all test results for small
glass-like colonies strengthens the suspicion that these are P. phosphoreum, regardless of LH
technique.
Table 5. Results from identification tests performed on selected colonies from day 0.
Macroscopic morphology
Oxidase test
Gram staining
Microscopic morphology
LH 1% NaCl Aer
Large pink colonies Positive G- Small/thin
elongated straight rods
Large white colonies Positive G- Small, slightly
thicker straight rods
Small glass-like colonies Negative G- Mixture of straight
rods and coccobacilli
LH 1% NaCl CO2 Small glass-like colonies Negative G- Mixture of straight
rods and coccobacilli
IA 1% NaCl CO2
Small white colonies Negative G-/G+
Mixture of straight rods and
coccobacilli/straight rods
Small glass-like colonies Positive G- Small/thin
elongated straight rods
4.1.3 PCR and sequencing
PCR and sequencing were performed in order to confirm the identities of colonies with different
macroscopic morphology found on LH Aer and LH CO2. Results from alignment of obtained
sequences using BLAST and RDP Classifier are displayed in Table 6. As can be seen, large pink and
large white colonies were regardless of cultivation technique respectively identified as members
of the Shewanella and Pseudomonas family. Since only one large pink colony from each
cultivation method was included in the sequencing procedure the specific species presented for
Shewanella cannot be regarded as representative for all colonies exerting the same morphology.
However, it seems reasonable to conclude that all large pink and large white colonies belong to
the Shewanella and Pseudomonas families, respectively. It should be noticed that one of the
glass-like colonies originally picked from LH CO2 after aerobic isolation turned pink and hence
turned out to belong to the Shewanella family. This observation might influence the reliability of
LH CO2 as a selective medium for P. phosphoreum. Regarding the single intestine-like and the
yellow colony found on LH Aer after prolonged storage at room temperature these were only
present in one copy and could be identified as members of the Psychrobacter and Arthrobacter
families, respectively.

12
Table 6. Bacteria identities obtained from alignment of sequence data using BLAST and RDP Classifier. The number of identified sequences of each macroscopic morphology is displayed in brackets.
Macroscopic morphology
Identity using BLAST and RDP Classifier
LH 1% NaCl Aer
Large pink colonies (1)
Shewanella baltica
Large white colonies (1)
Pseudomonas sp.
Small glass-like colonies (12)
Photobacterium phosphoreum Photobacterium iliopiscarium
Photobacterium kishitanii Photobacterium aquimaris
Intestine-like colonies* (1)
Psychrobacter cibarius Psychrobacter uratirovans
Yellow colonies* (1)
Arthrobacter psychrochitiniphilus
LH 1% NaCl CO2
Small glass-like colonies (34)
Photobacterim phosphoreum Photobacterium iliopiscarium
Photobacterium kishitanii Photobacterium aquimaris
Large pink colonies** (1)
Shewanella putrefaciens Shewanella morhuae
*Present first at another inspection after prolonged storage at room temperature
**Originally glass-like but turned pink after isolated in aerobic conditions
All glass-like colonies from both cultivation techniques (except for the one that turned pink at
isolation) were identified as members of the Photobacterium family. However, alignment using
BLAST and RDP Classifier did not result in the identification of any specific Photobacterium spp.,
but instead four possible species were suggested (see Table 6). It should be mentioned that
glass-like colonies, unlike the other three Photobacterium species, only were proposed as P.
aquimaris in a few cases. In an attempt to distinguish the four species from each other a
neighbor joining phylogenetic tree (including two copies of known 16s rRNA sequences of each
specie available at the National Center for Biotechnology Information, NCBI) was constructed
using the Molecular Evolutionary Genetics Analysis (MEGA) v.6 software program (available free
of charge at www.megasoftware.net). The resulting tree, with six sequences removed due to
poor quality of sequence data (3 glass-like from LH CO2, 2 glass-like from LH Aer and the large
white colony from LH Aer identified as a member of the Pseudomonas family), is displayed in
Figure 2.
As expected, glass-like colonies are branched together regardless of cultivation technique and
are clearly separated from colonies with other macroscopic morphologies. However, one glass-
like colony cultivated on LH CO2 is undoubtedly clearly distinguished from the remaining ones
(i.e. in the bottom of Figure 2). Since both good quality sequence data and reliable alignment
results were observed for this colony, it is nevertheless hard to find a reasonable explanation for
this observation. Regarding the four different species of Photobacterium it is obvious that they
are genetically closely related and it is based on presented results therefore difficult to link the
individual glass-like colonies to any specific specie. This observation is confirmed by Urbanczyk et

13
al. (2011) who managed to divide the closely related strains using multi-locus sequence analysis
including genes coding for house-keeping proteins in addition to rRNA genes. According to the
same reference Photobacterium species have multiple copies of the 16s rRNA gene and
conserved parts of the gene evolve slowly, which potentially complicates the discrimination
among recently diverged species based on single locus analysis.
Even though performed 16s rRNA sequencing turned out not to be enough to identify glass-like
colonies as P. phosphoreum the fact that this specific specie today is generally accepted as the
SSO of MA-packed cod (Dalgaard et al. 1993, Dalgaard 1995a, Macé et al. 2013 & Carrascosa et
al. 2014) strongly strengthens the possibility that the glass-like colonies belong to this specie.
Moreover, the fact that P. iliopiscarium is non luminescent and that P. aquimaris is normally
found in warmer marine waters outside Japan (Urbanczyk et al. 2011) also points to this
suspicion. Furthermore, Urbanczyk et al. stresses that P. kishitanii is known as a deep-sea fish
symbiont whereas P. phosphoreum typically occurs in colder open ocean seawaters like the
Atlantic Ocean where the fish used in this study was caught. Based on presented information and
the fact that a more detailed identification procedure was not possible to perform within the
limited timeframe of this thesis work, it was assumed that glass-like colonies present on LH
plates are P. phosphoreum and hence will be regarded as so in following studies.

14
Figure 2. A neighbor joining phylogenetic tree for colonies isolated from Long and Hammer´s medium incubated aerobically (LH Aer) and in 100% carbon dioxide (LH CO2). Two copies of known 16s rRNA sequences for the four
Photobacterium species suggested from BLAST and RDP Classifier searches are also included.
15
4.2 Long term storage studies
4.2.1 Study number one
Based on results from initial studies LH 1% NaCl Aer and LH 1% NaCl CO2 were applied in an
attempt to construct growth curves for P. phosphoreum at two storage temperatures (2°C and
4°C). To be able to also study the development of H2S producing Shewanella sp. (which occur as
black colonies on IA pour plates) IA 0.5% NaCl Aer was also included in the study.
Gas measurements of fish packages prior to microbial analysis revealed almost exclusively
oxygen levels of <0.5%. Furthermore, a general trend of decreasing oxygen levels with storage
time was observed, indicating bacterial oxygen consumption during storage. The level of carbon
dioxide varied between approximately 25-40% depending on storage time. Gas measurements of
bags containing LH 1% NaCl CO2-plates performed at packaging revealed an actual carbon dioxide
level of approximately 94-97% whereas a residual oxygen level of about 0.5-1% was observed.
The levels of CO2 remained almost intact during incubation (decreased <5%) and the oxygen
content displayed a somewhat declining trend.
Results from microbial analysis are displayed as growth curves in Figure 3-5 below. The bacterial
floras observed correspond to those found in initial studies, see Table 3 section 4.1.1.
Surprisingly, no major differences were observed between 2°C and 4°C of storage and hence only
growth curves for the latter storage temperature are included. Regarding the aerobic LH plates,
glass-like colonies were (in accordance with initial studies) difficult to distinguish from other
colonies during the first days of storage. The number of glass-like colonies for day 0 and day 1,
presented in Figure 3, must therefore be considered as estimated values. As can be seen in the
same figure both total growth and growth of glass-like colonies display the shape of a typical
bacterial growth curve without any clear lag phase. Moreover, growth appear to be fairly similar
for cod fillets A and C and glass-like colonies seem with few exceptions constitute an increasing
proportion of the bacterial flora during time of storage.

16
Figure 3. Growth of glass-like colonies as well as total viable count (TVC) in two naturally contaminated cod fillets (A and B) stored in an atmosphere of 50% CO2 and 50% N2 at 4°C. Cultivation was performed on Long and Hammer
plates (1% NaCl) incubated aerobically in 15°C for 6 days.
The number of glass-like colonies found on LH Aer is for both fish fillets throughout the whole
storage period in the same region as the total number of colonies observed on LH plates
incubated in carbon dioxide (see Figure 4), indicating an equivalence between these cultivation
techniques. However, LH Aer seem to display a higher bacterial number for day 0 and day 1
compared to LH CO2, which points to the fact that the unsure values of the first mentioned
technique probably are overestimated. On the other hand, a persistent minor trend of higher
bacterial number can be observed for LH CO2 starting from day 4, indicating the possibility of
growth of other bacteria than P. phosphoreum. This suspicion was unfortunately confirmed,
since another inspection of cultivated LH CO2 plates after a couple of days in air (i.e. in a normal
atmosphere) revealed that a significant proportion of the glass-like colonies had (in accordance
with the observation for one colony during sequencing) changed in appearance and instead
turned pink. In other words, it could be concluded that the utilized CO2 incubation of plates is not
enough to completely inhibit pink Shewanella sp. and hence this cultivation technique had to be
ruled out from further studies. Due to the high levels of CO2 utilized in the experiments (94-97%)
the lack of inhibition was unexpected, but can possibly be explained by the fact that an
atmosphere of 100% CO2 never was reached.
Based on above findings growth curves obtained from LH CO2 cannot be used to determine an
accurate initial cod concentration of P. phosphoreum. Furthermore, the growth curves for glass-
like colonies on LH-plates incubated aerobically consist of too few measurements during the
exponential phase in order to be useful for this type of calculation (since values for day 0 and day
1 must be excluded due to above discussed uncertainty and the maximum value of bacteria seem
to be reached already after six days of storage).
5
6
7
8
9
0 5 10 15
Log(
cfu
/g)
Storage time (days)
Growth of glass-like colonies and TVC on LH Aer at 4°C storage
A 4°C glass-like
B 4°C glass-like
A 4°C TVC
B 4°C TVC

17
Figure 4. Growth of glass-like colonies on Long and Hammer incubated aerobically compared to total viable count on the same medium incubated in 100% CO2. Both cod fillet A and B were stored at 4°C in a modified atmosphere
consisting of 50% CO2 and 50% N2.
Regarding cultivation on IA pour plates a clear trend is the fact that the number of black Shewanella
colonies increase in proportion during storage. As a result, almost exclusively black colonies exist
already after 4 days, see Figure 5. Furthermore, fish fillet A seems to have somewhat higher bacterial
numbers during the initial exponential growth face compared to fillet C. The maximum value
however appears to be in the same region for both fillets and seems to be somewhat lower
compared to the maximum numbers of glass-like colonies found for LH Aer in Figure 3.
Based on presented growth results it is obvious that although P. phosphoreum is characterized as the
SSO of MA-packed cod H2S-producing Shewanella sp. (identified as responsible for spoilage of
aerobically stored cod) are also present in high numbers. However, sensory analysis did not reveal
any smell of hydrogen sulphide during storage, indicating that the CO2 present is enough to prevent
these bacteria from causing spoilage of the product. On the other hand, a clear fishy character that
with time increased in intensity could be observed starting from storage day 4, testifying that P.
phosphoreum is the SSO of MAP cod. Regarding fish texture it went from tough and stringy during
the first half of the storage period to more firm and dry towards the second half, due to release of
water from day 8 and onwards. Moreover, the color of the fish pieces turned from white to more
yellow/grey during the time of storage.
4
5
6
7
8
9
0 5 10 15
Log(
cfu
/g)
Storage time (days)
Growth of glass-like colonies on LH aer and TVC on LH CO2 at 4°C storage
A 4°C LH aer
A 4°C LH CO2
B 4°C LH aer
B 4°C LH CO2

18
Figure 5. Growth of black colonies and total viable count (TVC) in two individual cod fillets packed in 50% CO2 and 50% N2 and stored at 4°C. Cultivation was performed on Iron Agar pour plates (0.5% NaCl) incubated aerobically at 25°C for 3
days.
4.2.2 Study number two
Due to lack of data during the exponential growth phase of P. phosphoreum observed in study
number one, another storage study including measurements at day 0, 3, 4, 5, 6, 7 and 10 was
performed. Since the cultivation technique involving LH plates incubated in carbon dioxide
turned out to be less reliable (see section 4.2.1) and Shewanella spp. was excluded as spoilage
bacteria of MAP cod in study number one, LH 1% NaCl Aer was the only technique included in
this study.
Measurements of oxygen and carbon dioxide in fish packages prior to microbial analysis revealed
levels in the same region as in the previous study (O2<0.5% and CO2 between 25-40%). Results of
microbial analysis for glass-like colonies found in fillets A-E are displayed in Figure 6. In
accordance with study number one glass-like colonies were difficult to distinguish from other
colonies at day 0 and the reported concentration must therefore be considered as an estimate.
As can be seen in Figure 6 the general impression is that the number of bacteria found in
different pieces from the same fillet varies in the same magnitude as for fish pieces originated
from different fillets (see the variance for one fillet within the stationary phase compared to the
variance between individual fillets) and the maximum bacterial number are reached after
approximately five days of storage.
Unfortunately, the constructed growth curves solely consist of data points representing the last
part of the exponential phase (since values for day 0 must be excluded). In other words, linear
regression cannot be used to derive a trustworthy initial concentration and data representing the
initial part of the exponential phase need to be included in order to perform an accurate
determination of the initial concentration of P. phosphoreum.
5
6
7
8
9
0 5 10 15
Log(
cfu
/g)
Storage time (days)
Growth of black colonies and TVC on IA pour plate at 4°C storage
A 4°C black
B 4°C black
A 4°C TVC
B 4°C TVC

19
Figure 6. Growth of glass-like colonies in five individual cod fillets packed in 50% CO2 and 50% stored at 4°C. The cultivation was performed using Long and Hammer´s medium incubated aerobically at 15°C for 6 days.
4.2.3 Study number three
In order to construct a P. phosphoreum growth curve that includes the total exponential growth
phase another storage study was performed, utilizing the same cultivation technique as in
previous study. Fish fillets were packed in modified atmosphere (50% CO2/50% N2) immediately
after filleting at the fish distributor one day prior to deliverance and measurements were
performed two times a day between day 1 and 7 and once at day 9. Based on the fact that
similar results were observed for individual fish fillets in the earlier study biological replicates
consisting of pieces from different fillets were utilized in this study.
Oxygen levels in fish packages prior to microbial analysis were in accordance with previous
studies in most cases <0.5% whereas the level of carbon dioxide varied between approximately
30-45%. A possible explanation for the slightly higher CO2-levels compared to earlier studies is
the fact that a somewhat larger fish to gas ratio was utilized in this study (approximately 1:3
compared to 1:2).
Results from microbial analysis of the five biological replicates are presented in Figure 7. As in
previous studies the difficulty in distinguishing glass-like colonies from other ones was observed
at the first two sampling times (i.e. at day 1) and the reported values are therefore unsure. As
can be seen in Figure 7, the deviation between replicates is small for all measurements and a
maximum value just below 8 log (cfu/g) is reached after approximately 120 hours (i.e. 5 days).
By constructing an average growth curve based on the five biological replicates presented in
Figure 7 the starting concentration of P. phosphoreum (at day 0) can be found by linear
regression of the exponential growth phase (excluding the unsure values from day 1), see Figure
8. The calculated initial concentration of P. phosphoreum of approximately 2.15 log(cfu/g) is low
compared to the values found from microbial analysis at day 0 in the two previous studies (about
3
4
5
6
7
8
9
0 2 4 6 8 10
Log(
cfu
/g)
Storage time (days)
Growth of glass-like colonies on LH Aer stored at 4°C
A
B
C
D
E

20
4-5 log(cfu/g)). One must however keep in mind that the reported values for day 0 in previous
studies are unsure, due to the difficulty in distinguish glass-like colonies from the remaining flora,
and hence may be overestimated. Moreover, it is possible that lower starting values would have
been observed in previous studies if it had been possible to utilize linear regression of the
exponential growth phases. Nevertheless, the fact that earlier studies indicate higher starting
concentrations means that more studies need to be performed in order to confirm the found
starting concentration.
Figure 7. Growth of glass-like colonies on cod fillets packed in modified atmosphere (50% CO2/50% N2) immediately after filleting. Five biological replicates were included and the fillets were stored at 4°C.
Figure 8. Linear regression of the exponential growth phase of average growth of glass-like colonies reveals a starting concentration of approximately 2.15 log (cfu/g) at day 0.
0,00
1,00
2,00
3,00
4,00
5,00
6,00
7,00
8,00
9,00
0 50 100 150 200
log(
cfu
/g)
Storage time (hours)
Growth of glass-like colonies on LH aerob stored at 4°C
A
B
C
D
E
y = 0,0509x + 2,1494 R² = 0,9904
0,00
1,00
2,00
3,00
4,00
5,00
6,00
7,00
8,00
0 50 100 150 200
log(
cfu
/g)
Storage time (hours)
Exponential phase of average growth of glass-like colonies on LH aerob stored at 4°C
Average A-E
Linjär (Average A-E)
21
Even though the reported starting concentration of 2.15 log (cfu/g) seems reliable it is important
to note that the value applies to the situation when the fish is MA-packed immediately after
filleting. Moreover, it seems probable that the initial concentration will vary from batch to batch
since the contamination of fish flesh depends on the specific filleting procedure, storage
temperature, catch location etc. Furthermore, the fact that the initial modified atmosphere
package was broken and fish fillets were repacked at arrival to SIK at day 1 is likely to exert a
negligible effect on the presented results.
In order to validate the P. phosphoreum shelf-life model for MA-packed cod the initial amount of
bacteria, storage temperature and percentage of CO2 are used as input variables (see section
2.2.2). Regarding percentage of CO2 it is important to use the concentration of carbon dioxide
present in fish packages at equilibrium. According to Rotabakk et al. (2008) over 90% of the
equilibrium concentration is dissolved in the fresh chilled fish flesh within 24 hours after
packaging. Based on measured carbon dioxide levels 24-48 hours after packaging at Sik an
average equilibrium carbon dioxide concentration of approximately 35% could be calculated for
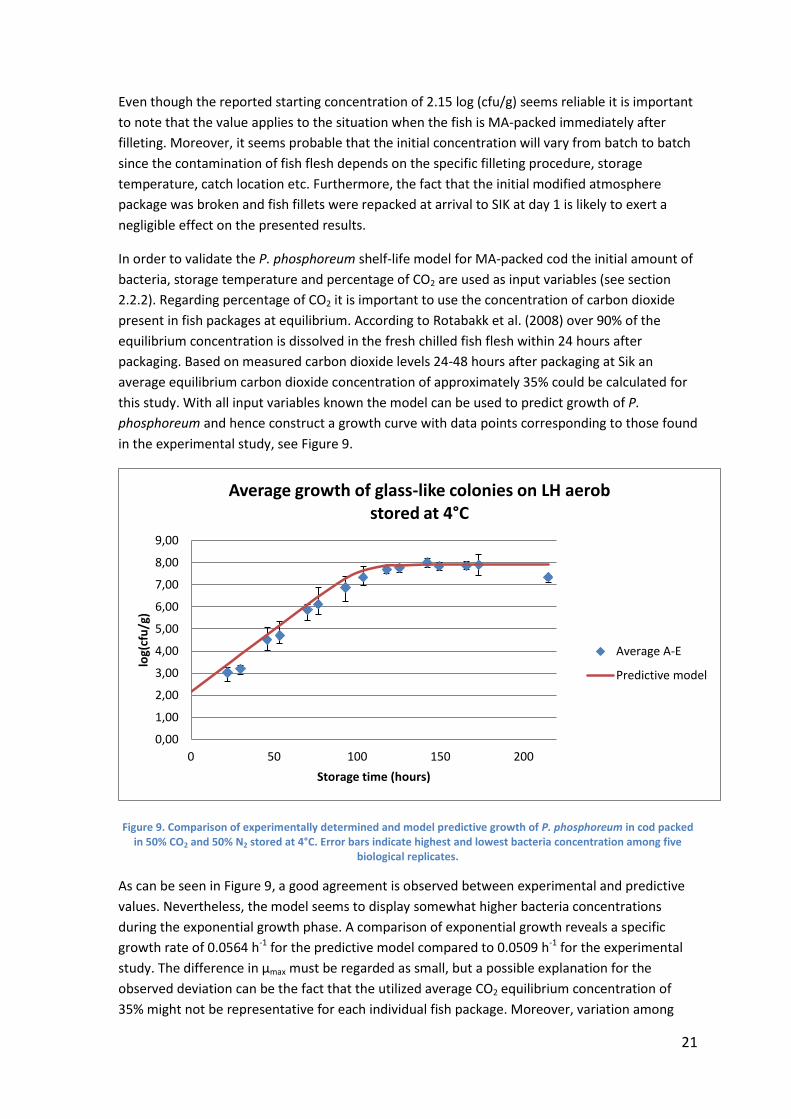
this study. With all input variables known the model can be used to predict growth of P.
phosphoreum and hence construct a growth curve with data points corresponding to those found
in the experimental study, see Figure 9.
Figure 9. Comparison of experimentally determined and model predictive growth of P. phosphoreum in cod packed in 50% CO2 and 50% N2 stored at 4°C. Error bars indicate highest and lowest bacteria concentration among five
biological replicates.
As can be seen in Figure 9, a good agreement is observed between experimental and predictive
values. Nevertheless, the model seems to display somewhat higher bacteria concentrations
during the exponential growth phase. A comparison of exponential growth reveals a specific
growth rate of 0.0564 h-1 for the predictive model compared to 0.0509 h-1 for the experimental
study. The difference in µmax must be regarded as small, but a possible explanation for the
observed deviation can be the fact that the utilized average CO2 equilibrium concentration of
35% might not be representative for each individual fish package. Moreover, variation among
0,00
1,00
2,00
3,00
4,00
5,00
6,00
7,00
8,00
9,00
0 50 100 150 200
log(
cfu
/g)
Storage time (hours)
Average growth of glass-like colonies on LH aerob stored at 4°C
Average A-E
Predictive model

22
biological replicates results in presented average values, but as can be seen in Figure 9 almost all
sampling points also include values that are higher than the once predicted by the model.
Furthermore, it is important to keep in mind that we are dealing with biology and hence
variations in bacterial growth between batches of cod caught at different times and places are
not surprising due to variation in intrinsic factors (e.g. availability of nutrients).
As presented and discussed in section 4.1.3 performed partial 16s rRNA sequencing of bacteria
growing on LH Aer and LH CO2 was not enough to confirm that glass-like colonies exclusively are
P. phosphoreum. The fact that the P. phosphoreum model accurately predicts growth of glass-like
colonies (see Figure 9) however undoubtedly strengthens the assumption that observed glass-
like colonies indeed are the same bacteria as Dalgaard et al. identified as the SSO of MA-packed
cod. Consequently, it therefore seems reasonable to conclude that the model accurately is able
to predict growth of P. phosphoreum in MAP cod. Another possible scenario can however be that
observed glass-like colonies actually consist of a mixture of Photobacterium species that hence all
contribute to fish spoilage. This idea is supported by the fact that species discrimination by gene
sequencing was not available at the 1990s when Dalgaard et al. identified P. phosphoreum as the
SSO of MA-packed cod. In any case, it is obvious that the presented model accurately predicts
growth of glass-like colonies in this study, but specie identification by multilocus gene sequencing
needs to be performed in order to bring clarity into the presented issue.
5. Conclusions The task of determining starting concentration of the specific SSO of MA-packed cod, known as P.
phosphoreum, turned out to hold a number of difficulties. Initial cultivation and storage studies
revealed aerobically incubated Long and Hammer plates as the most appropriate method for
cultivation of glass-like colonies. Partial 16s rRNA gene sequencing identified the glass-like
colonies as members of the Photobacterium family, but was unfortunately not enough to
distinguish P. phosphoreum from other closely related Photobacterium species.
Based on the assumption that observed glass-like colonies are P. phosphoreum, performed long
term storage study resulted in an initial concentration of 2.15 log (cfu/g) for fish fillets packed in
an modified atmosphere immediately after filleting. Shelf-life model validation revealed that the
model is able to accurately illustrate growth of P. phosphoreum and based on existing sensory
rejection evaluation hence predict shelf-life of MA-packed cod.
To be able to reliably conclude that glass-like colonies cultivated on Long and Hammer plates
belong to the specie P. phosphoreum future studies utilizing multilocus gene analysis needs to be
performed. If the outcome of these studies reveals a mixed Photobacterium flora the respective
species must be inoculated into fresh cod and spoilage development must be studied in order to
confirm P. phosphoreum as the SSO of MA-packed cod and exclude other species contribution to
fish spoilage. Last but not least, the performed long term storage experimental setup needs to be
repeated in order to find a truly representative initial concentration of the SSO that hence can be
used to accurately predict shelf-life of MA-packed cod in the DYNAHMAT project.

23
6. References Ashie, I.N.A., Smith, J.P. & Simpson, B.K. (1996) Spoilage and shelf-life extension of fresh fish and
shellfish. Critical Reviews in Food Science and Technology, vol. 36, pp. 87-121
Bowman, J.P (2005) Genus XIII. Shewanella MacDonell and Colwell 1986, 355VP. In Bergey´s
Manual of Systematic Bacteriology, ed. Brenner, D.J., Krieg, N.R & Staley, J.T., pp. 480-491. New
York: Springer Science
Carrascosa, C. et al. (2014) Predictive models for bacterial growth in sea bass (Dicentrarchus
labrax) stored in ice. Int. Journal of Food Science and Technology, vol. 49, pp. 354-363
Dalgaard, P. Gram, L. & Huss, H.H. (1993) Spoilage and shelf-life of cod fillets packed in vacuum
or modified atmospheres. Int. Journal of Food Microbiology, vol. 19, pp. 283-294
Dalgaard, P. (1995a) Qualitative and quantitative characterization of spoilage bacteria from
packed fish. Int. Journal of Food Microbiology, vol. 26, pp. 319-333
Dalgaard, P. (1995b) Modelling of microbial activity and prediction of shelf life for packed fresh
fish. Int. Journal of Food Microbiology, vol. 26, pp. 305-317
Dalgaard, P., Mejlholm, O. & Huss, H.H. (1996) Conductance method for quantitative
determination of Photobacterium phosphoreum in fish products. Journal of Applied Bacteriology,
vol. 81, pp. 57-64
Dalgaard, P.Mejholm, O., Christiansen, T.J & Huss, H.H. (1997a) Importance of Photobacterium
phosphoreum in relation to spoilage of modified atmosphere-packed fish products. Letters in
Applied Microbiology, vol. 24, pp. 373-378
Dalgaard, P., Mejlholm, O. & Huss, H.H. (1997b) Application of an iterative approach for
development of a microbial model predicting the shelf-life of packed fish. Int. Journal of Food
Microbiology, vol. 38, pp. 169-179
Devlighere, F., Debevere, J. & Van Impe, J. (1998) Concentration of carbon dioxide in the water-
phase as a parameter to model the effect of a modified atmosphere on micro-organisms. Int.
journal of Food Microbiology, vol. 43, pp. 105-113
Huss, H.H., Dalgaard, P. & Gram, L. (1997) Microbiology of fish and fish products. In: Seafood
from Producer to Consumer, Integrated Approach to Quality, pp. 413-430, Amsterdam: Elsevier
Karlberg, M. & Klevås, J. (2002) Kylkedjan för livsmedel - en kartläggning av den svenska
distributionen med fokus på temperaturbrister, MSc, Institutionen för Designvetenskaper,
Förpackningslogistik, Lunds Tekniska Högskola
Macé, S. et al. (2013) Development of a Rapid Real-Time PCR Method as a Tool To Quantify
Viable Photobacterium phosphoreum Bacteria in Salmon (Salmo salar) Steaks. Applied and
Environmental Microbiology, vol. 79, issue 8, pp. 2612-2619
Nordic committee on food analysis (2006) NMKL Method No. 184: Aerobic count and specific
spoilage organisms in fish and fish products

24
Rahelu, K. (2009) Data labelling on food. Nutrition Bulletin, vol. 34, issue 4, pp. 388-390
Rotabakk, B.T. et al. (2008) A mathematical method for determining equilibrium gas composition
in modified atmosphere packaging and soluble gas stabilization systems for non-respiring foods.
Journal of Food Engineering, vol. 85, pp. 479-490
Sivertsvik, M., Jeksrud, W.K., & Rosnes, J.T. (2002) A review of modified atmosphere packaging of
fish and fishery products- significance of microbial growth, activities and safety. Int. Journal of
Food Science and technology, vol. 37, pp. 107-127
Sperber, W.H. & Doyle, M.P. (2009) Compendium of the Microbiological Spoilage of Foods and
beverages. New York: Springer Science, Business Media LLC
Thompson, F.L., Iida, T., Swings, J. (2004) Biodiversity of Vibrios. Microbiology and Molecular
Biology Reviews, Vol. 68. Issue 3, pp. 403-431.
Thyssen, A. & Ollevier, F. (2005) Genus II. Photobacterium Beijernick 1889, 401AL. In Bergey´s
Manual of Systematic Bacteriology, ed. Brenner, D.J., Krieg, N.R & Staley, J.T., pp. 546-552. New
York: Springer Science
Todar, K. (2012) Todar´s Online Textbook of Bacteriology. [Electronic] University of Wisconsin:
Department of Bacteriology
Urbanczyk, H., Ast, J.C. & Dunlap, P.V. (2011) Phylogeny, genomics and symbiosis of
Photobacterium. FEMS Microbiology Reviews, vol. 35, pp. 324-342
WRAP (2008), Ed. Ventour, L. The food we waste. Food waste report version 2.
Zwietering, M.H., Jongenburger, I., Rombouts, F.M. & van´t Riet, K. (1990) Modeling of the
Bacterial Growth Curve. Applied and Environmental Microbiology, Vol. 56, Issue 6, pp. 1875-1881