Embed Size (px)
Citation preview

Validation Protocol for Digital Audio Recorders Used in Aircraft-Noise-Certification Testing
Final Report November 2010
Prepared for: Prepared by: U.S. Department of Transportation U.S. Department of Transportation Federal Aviation Administration Research and Innovative Technology Administration Office of Environment and Energy John A. Volpe National Transportation Systems Center Washington, D.C. 20590 Environmental Measurement and Modeling Division, Acoustics Facility
Cambridge, MA 02142
U.S. Department of Transportation Federal Aviation Administration
FAA-AEE-2010-05 DOT-VNTSC-FAA-11-02 NTIS No. PB2011-102068
ii
Notice
This document is disseminated under the sponsorship of the Department of Transportation in the interest of in-formation exchange. The United States Government assumes no liability for its contents or use thereof.
Notice
The United States Government does not endorse prod-ucts or manufacturers. Trade or manufacturers’ names appear herein solely because they are considered es-sential to the objective of this report.

iii
REPORT DOCUMENTATION PAGE Form Approved OMB No. 0704-0188
Public reporting burden for this collection of information is estimated to average 1 hour per response, in-cluding the time for reviewing instructions, searching existing data sources, gathering and maintaining the data needed, and completing and reviewing the collection of information. Send comments regarding this burden estimate or any other aspect of this collection of information, including suggestions for reducing this bur-den, to Washington Headquarters Services, Directorate for Information Operations and Reports, 1215 Jefferson Davis Highway, Suite 1204, Arlington, VA 22202-4302, and to the Office of Management and Budget, Paperwork Re-duction Project (0704-0188), Washington, DC 20503. 1. AGENCY USE ONLY (Leave blank)
2. REPORT DATE November 2010
3. REPORT TYPE AND DATES COVERED Final Report
4. TITLE AND SUBTITLE Validation Protocol for Digital Audio Recorders Used in Aircraft-Noise-Certification Testing
5. FUNDING NUMBERS FA4TC3 – JS889
6. AUTHOR(S) Samiljan, Robert, Fleming, Gregg, Read, David, Roof, Christopher
7. PERFORMING ORGANIZATION NAME(S) AND ADDRESS(ES) U.S. Department of Transportation Research and Innovative Technology Administration John A. Volpe National Transportation Systems Center Environmental Measurement and Modeling Division, RVT-41 Cambridge, MA 02142-1093
8. PERFORMING ORGANIZATION REPORT NUMBER DOT-VNTSC-FAA-11-02
9. SPONSORING/MONITORING AGENCY NAME(S) AND ADDRESS(ES) U.S. Department of Transportation Federal Aviation Administration Office of Environment and Energy, AEE-100 Washington, DC 20591
10.SPONSORING/MONITORING AGENCY REPORT NUMBER
FAA-AEE-2010-05
11. SUPPLEMENTARY NOTES Support provided by Raquel Girvin, Mehmet Marsan, and Joe DiPardo of FAA AEE-100, Of-fice of Environment and Energy, Noise Division. 12a. DISTRIBUTION/AVAILABILITY STATEMENT 12b. DISTRIBUTION CODE 13. ABSTRACT (Maximum 200 words) The U.S. Department of Transportation, Research and Innovative Technology Administra-tion, John A. Volpe National Transportation Systems Center, Environmental Measurement and Modeling Division (Volpe), is supporting the aircraft noise certification initia-tives of the Federal Aviation Administration (FAA), Office of Environment and Energy (AEE) by preparing the “Validation Protocol for Digital Audio Recorders Used in Air-craft-Noise-Certification Testing” (Validation Protocol). As analog and digital tape-based recording devices are becoming obsolete, this Validation Protocol has been devel-oped for applicants requesting permission from FAA/AEE to conduct aircraft noise certi-fication testing using non-tape-based recorders. Because of the significant differences between non-tape-based recording devices and all preceding technologies, this Protocol establishes a set of procedures for testing and evaluating the performance of non-tape-based digital audio recorders proposed for aircraft noise certification use. If using any of the digital audio recording devices covered by the scope of this document, it is recommended that an applicant perform tests to evaluate the characteristics of the re-cording device in accordance with the guidance in the Validation Protocol to demonstrate compliance with part 36 Title 14 of the Code of Federal Regulations (Part 36) and Inter-national Civil Aviation Organization Annex 16 Volume I (ICAO Annex 16). 14. SUBJECT TERMS Aircraft noise, noise certification, instrumentation, noise measure-ments, noise
15. NUMBER OF PAGES 33
16. PRICE CODE 17. SECURITY CLASSIFICATION OF REPORT Unclassified
18. SECURITY CLASSIFICATION OF THIS PAGE
Unclassified 19. SECURITY CLASSIFICA-TION OF ABSTRACT Unclassified
20. LIMITATION OF AB-STRACT
NSN 7540-01-280-5500 Standard Form 298 (Rev. 2-89) Prescribed by ANSI Std. 239-18
298-102

iv
METRIC/ENGLISH CONVERSION FACTORS
ENGLISH TO METRIC METRIC TO ENGLISH
LENGTH (APPROXIMATE) LENGTH (APPROXIMATE) 1 inch (in) = 2.5 centimeters (cm) 1 millimeter (mm) = 0.04 inch (in) 1 foot (ft) = 30 centimeters (cm) 1 centimeter (cm) = 0.4 inch (in)
1 yard (yd) = 0.9 meter (m) 1 meter (m) = 3.3 feet (ft) 1 mile (mi) = 1.6 kilometers (km) 1 meter (m) = 1.1 yards (yd)
1 kilometer (km) = 0.6 mile (mi)
AREA (APPROXIMATE) AREA (APPROXIMATE)
1 square inch (sq in, in2) = 6.5 square centimeters (cm2) 1 square centimeter (cm2) = 0.16 square inch (sq in, in2)
1 square foot (sq ft, ft2) = 0.09 square meter (m2) 1 square meter (m2) = 1.2 square yards (sq yd, yd2) 1 square yard (sq yd, yd2) = 0.8 square meter (m2) 1 square kilometer (km2) = 0.4 square mile (sq mi, mi2) 1 square mile (sq mi, mi2) = 2.6 square kilometers (km2) 10,000 square meters (m2) = 1 hectare (ha) = 2.5 acres
1 acre = 0.4 hectare (he) = 4,000 square meters (m2)
MASS – WEIGHT (APPROXIMATE) MASS – WEIGHT (APPROXIMATE)
1 ounce (oz) = 28 grams (gm) 1 gram (gm) = 0.036 ounce (oz) 1 pound (lb) = 0.45 kilogram (kg) 1 kilogram (kg) = 2.2 pounds (lb)
1 short ton = 2,000 pounds (lb)
= 0.9 tonne (t) 1 tonne (t)
= =
1,000 kilograms (kg) 1.1 short tons
VOLUME (APPROXIMATE) VOLUME (APPROXIMATE)
1 teaspoon (tsp) = 5 milliliters (ml) 1 milliliter (ml) = 0.03 fluid ounce (fl oz) 1 tablespoon (tbsp) = 15 milliliters (ml) 1 liter (l) = 2.1 pints (pt) 1 fluid ounce (fl oz) = 30 milliliters (ml) 1 liter (l) = 1.06 quarts (qt)
1 cup © = 0.24 liter (l) 1 liter (l) = 0.26 gallon (gal) 1 pint (pt) = 0.47 liter (l)
1 quart (qt) = 0.96 liter (l) 1 gallon (gal) = 3.8 liters (l)
1 cubic foot (cu ft, ft3) = 0.03 cubic meter (m3) 1 cubic meter (m3) = 36 cubic feet (cu ft, ft3) 1 cubic yard (cu yd, yd3) = 0.76 cubic meter (m3) 1 cubic meter (m3) = 1.3 cubic yards (cu yd, yd3)
TEMPERATURE (EXACT) TEMPERATURE (EXACT)
[(x-32)(5/9)] F = y C [(9/5) y + 32] C = x F
QUICK INCH - CENTIMETER LENGTH CONVERSION10 2 3 4 5
InchesCentimeters 0 1 3 4 52 6 1110987 1312 QUICK FAHRENHEIT - CELSIUS TEMPERATURE CONVERSION -40°-22° -4° 14° 32° 50° 68° 86° 104° 122° 140° 158° 176°194°212°
°F °C -40°-30° -20° -10° 0° 10° 20° 30° 40° 50° 60° 70° 80° 90° 100°
For more exact and or other conversion factors, see NTIS Miscellaneous Publication 286, Units of Weights and Measures.

v
Acknowledgements
The authors would like to thank Mr. Alan Marsh for sharing his extensive knowledge and experience in review of this document. His insight and attention to detail have proved in-valuable.

vi
This page intentionally left blank.

vii
CONTENTS
1.0 INTRODUCTION ............................................................................................... 1
2.0 OBJECTIVES ..................................................................................................... 2
3.0 SCOPE ................................................................................................................ 2
4.0 APPLICABLE STANDARDS .............................................................................. 2
5.0 TERMS AND DEFINITIONS .............................................................................. 3
6.0 ENVIRONMENTAL CONDITIONS FOR VALIDATION TESTS ....................... 6
7.0 TEST INSTRUMENTS ........................................................................................ 7
8.0 DEVICE UNDER TEST (DUT) ........................................................................... 8
9.0 VALIDATION TESTS ........................................................................................ 9
10.0 FEATURES AND PRACTICAL CONSIDERATIONS ....................................... 29
11.0 CHECKLIST FOR A TEST REPORT ................................................................ 31
12.0 SUBMITTAL OF TEST REPORT ..................................................................... 32
13.0 BIBLIOGRAPHY .............................................................................................. 33
TABLES
Table 1. Example data and recommended format for presentation of results from level linearity tests .................................................................................................................. 13
Table 2. Example data and recommended format for presentation of results from level- range control testing ....................................................................................................... 20
Table 3. Example data and recommended format for presentation of results from an anti-alias filter test ................................................................................................................ 23
Table 4. Example data and recommended format for presentation of results from a test of inter-channel crosstalk .................................................................................................... 27
FIGURES
Figure 1. Illustration of filter Q factor derivation ............................................................. 6
Figure 2. Example diagram of the hardware setup for determination of the starting point on the reference level range .............................................................................................. 8

viii
Figure 3. Example graphical display of the level-linearity test results given in table 2. Overload and underange points, as well as a buffered linear operating range have been indicated ........................................................................................................................ 14
Figure 4. Example Visual displays of a DUT overload condition .................................... 17
Figure 5. Example photograph of the display of a one-third-octave-band analysis of the self-generated noise of a DUT. ....................................................................................... 19
Figure 6. Example results and grapical display of the relative frequency response for a DUT .............................................................................................................................. 25
Figure 7. Comparison between one-third-octave-band sound pressure levels as recorded on a certification-compliant recorder versus the DUT .......................................................... 29
1
1.0 INT R ODUC T ION
The U.S. Department of Transportation, Research and Innovative Technology Administra-tion, John A. Volpe National Transportation Systems Center, Environmental Measurement and Modeling Division (Volpe), is supporting the aircraft noise certification initiatives of the Federal Aviation Administration (FAA), Office of Environment and Energy (AEE) by preparing the “Validation Protocol for Digital Audio Recorders Used in Aircraft-Noise-Certification Testing” (Validation Protocol). As analog and digital tape-based recording devices are becoming obsolete, this Validation Protocol has been developed for applicants requesting permission from FAA/AEE to conduct aircraft noise certification testing using non-tape-based recorders. Because of the significant differences between non-tape-based recording devices and all preceding technologies, this Protocol establishes a set of proce-dures for testing and evaluating the performance of non-tape-based digital audio recorders proposed for aircraft noise certification use.
If using any of the digital audio recording devices covered by the scope of this document, it is recommended that an applicant perform tests to evaluate the characteristics of the re-cording device in accordance with the guidance in the Validation Protocol to demonstrate compliance with part 36 Title 14 of the Code of Federal Regulations (Part 36) and Interna-tional Civil Aviation Organization Annex 16 Volume I (ICAO Annex 16).1 The results of the tests and supporting information should be presented in a candidate-recorder test report (test report) and be submitted to the Volpe Center, Environmental Measurement and Mod-eling Division, for review and evaluation. The test report may be submitted separately or included as part of the Certification Validation Package outlined in Volpe Letter Report: DTS-34-FA853-LR1.2
1. 1 B ac k ground
An audio recording device is a key component of a system for measuring aircraft noise. From the 1950s to the 1980s, the recording device was typically an analog magnetic tape recorder. During the 1990’s, analog tape recorders were largely replaced by digital audio tape (DAT) recorders. As digital technology continues to advance, a new class of audio re-cording devices has emerged. This new generation of digital audio recorders does not rely on tape-based media, but rather records data files to electronic media. Examples include hard disk drive (HDD) recorders, solid-state media recorders, and computer-based record-ing systems. Many new portable recorders feature solid-state storage media that utilize non-volatile flash technology such as Compact Flash (CF) and Secure Digital High Capaci-ty (SDHC). These technologies have quickly replaced the DAT format in the marketplace. As products and support for the DAT format become scarce, the aircraft noise certification community is searching for suitable replacements for obsolete recording devices.
Although there are many potential benefits associated with the use of electronic media (in-cluding near-instant data access, high storage capacity, and data portability), there are also new concerns (including data format compatibility and file corruption). For some features, such as random accessibility, there is a potential benefit derived from easier access to de-sired data but also a concern about ensuring proper association of calibration signals with
1 An applicant may request that tests be performed for the applicant by Volpe for a specific digital audio recording
system. Availability of test personnel affects schedule; lead times depend on Volpe work load. 2 DTS-34-FA853-LR1 is available at: http://www.volpe.dot.gov/acoustics/techinfo.html#certification

2
corresponding acoustical data. Other concerns arise because the increased flexibility of non-tape-based technologies allows manufacturers to develop unique feature sets, such as on-board editing and special effects. These powerful capabilities are targeted to the needs of specific market segments, however, could corrupt aircraft noise certification data if ac-cidently applied. The emergence of such features emphasizes the importance of establish-ing device settings and adherence to strict user protocol for the purpose of aircraft noise certification testing. As form, functionality, and data-storage formats of digital audio re-corders have evolved, a validation protocol is needed to evaluate the performance of such recording devices for use in aircraft noise certification testing.
2.0 OB J E C T IV E S
The objectives of this document are the following:
1) Provide a core set of relevant specifications and methods to evaluate the performance of digital audio recording devices to be used in aircraft noise certification testing.
2) Provide representative examples of test methods, and preferred presentation formats, for the test report.
3) Provide a list of features and operational characteristics that should be considered for reliable field operation of digital audio recording devices.
3.0 S C OP E
The Validation Protocol provides procedural guidance for testing and evaluating the per-formance of digital audio recorders intended for use in aircraft noise certification testing. Test results should verify that measurements of performance do not exceed the applicable tolerance limits stated in Part 36 and ICAO Annex 16. Test results should also serve to characterize the relevant details of the performance capabilities of a digital audio recorder intended for use in aircraft noise certification testing.
Volpe may determine that additional laboratory tests beyond those described in this Valida-tion Protocol are necessary depending on instrument configuration and operational proto-col, as supplied by the applicant in a test report.
The Validation Protocol in this document applies to any digital audio recording and play-back system capable of storing a digital representation of a continuous acoustical signal for later analysis. For the purposes of this document a digital audio recording system is any device, or combination of devices, that accepts an analog input signal, converts the analog signal to a standardized, uncompressed, digital format, such as WAV or Broadcast Wave (BWF) for storage, then reconstructs the digital representation back to an analog signal for playback and analysis.
4.0 AP P L IC AB L E S T ANDAR DS
The following standards are referenced in this document for terms, conformance specifica-tions, and test methods. Detailed information related to digital audio recording systems is available from the references in the Bibliography in Section 13.0.

3
ICAO, Annex 16 to the Convention on International Civil Aviation, “Environmental Pro-tection,” Volume I, “Aircraft Noise – Appendix 2; Evaluation Method for Noise Certifica-tion,” Section 3.6 – “Recording and Reproducing Systems” – Fourth Edition, Amendment 9, March 2008
14 CFR Part 36, Federal Aviation Regulation, “Noise Standards: Aircraft Type and Airwor-thiness Certification – Appendix A; Aircraft Noise Measurement and Evaluation,” Section A36.3.6: “Recording and Reproducing Systems,” Amendment 28, January 2006
IEC 60942, International Electrotechnical Commission, International Standard, “Electroac-oustics – Sound calibrators”
IEC 61260, International Electrotechnical Commission, International Standard, “Electroac-oustics – Octave-band and fractional-octave-band filters”
IEC 61265, International Electrotechnical Commission, International Standard, “Electroac-oustics – Instruments for Measurement of Aircraft Noise – Performance requirements for systems to measure one-third-octave-band sound pressure levels in noise certification of transport-category aeroplanes”
IEC 61672-3, International Electrotechnical Commission, International Standard, “Elec-troacoustics – Sound Level Meters”
5.0 T E R MS AND DE F INIT IONS
Definitions for additional terms can be found in clause 3 of IEC 61260 and clause 3 of IEC 61265.
5. 1 a lias spurious spectral component of an analog signal that has been reconstructed from a digital representation of an original analog signal. Occurs when the digital sampling frequency is less than twice the highest frequency component in the original signal
NOTE: If the sampling frequency is less than twice the highest frequency component of the origi-nal analog signal, then the higher-frequency components can alias to spurious lower-frequency components and may corrupt data within the bandwidth of interest.
5. 2 anti-alias filter low-pass filter placed before the analog-to-digital converter in order to limit the bandwidth of the analog input signal by removing, or substantially attenuating, the undesired aliasing components
5. 3 bit abbreviation for binary digit, represented by a 0 or a 1
5. 4 bit depth the number of bits of digital audio information recorded for each sample of a continuous signal
4
NOTE: Bit depth determines the resolution of a sample in a set of digital audio data. Increasing the bit depth permits resolution of smaller fluctuations of an audio signal. Bit depth also has a strong influence on the extent of linear operating range.
5. 5 bit rate number of bits of discrete data processed per second by a digital signal-processing system
NOTE: For a measurement system that includes a digital audio recording device, bit rate equals the product of (bit depth) times (sampling frequency) times (number of channels used for record-ing). As an example, for a bit depth of 16 bits per sample, a sampling frequency of 44000 samples per second, and a single channel, the bit rate is 704 kbits/s.
5. 6 c alibration c hec k frequenc y nominal frequency of the sinusoidal sound pressure signal produced by a sound calibrator
NOTE: Calibration check frequency is expressed in hertz (Hz).
5. 7 c alibration s ound pres s ure level sound pressure level produced in the cavity of the coupler of the sound calibrator used to establish the overall acoustical sensitivity of a measurement system at a calibration check frequency
NOTE: Calibration sound pressure level is expressed in decibels relative to the standard reference value of 20 µPa, commonly notated as dBSPL.
5. 8 devic e under tes t (DUT ) generic term referring to the device that is the subject of test and evaluation procedures
5. 9 form fac tor as used in engineering design, the geometry (or physical size and shape) of an object or de-vice
5. 10 level linearity error an indicated output signal level minus the corresponding anticipated output signal level at a stated frequency and in response to a known steady sinusoidal electrical input signal
NOTE: Level linearity error is expressed in decibels (dB).
5. 11 level range range of nominal input signal levels, expressed in dB, extending from a lower boundary to an upper boundary as determined by the setting of input level controls on a recording de-vice

5
5. 12 linear operating range on any level range and at a stated frequency, range of steady sinusoidal electrical input sig-nal levels over which level linearity errors do not exceed the applicable tolerance limits and extending from a nominal lower boundary to a nominal upper boundary
NOTE 1: Boundaries as well as the extent of a linear operating range are expressed in decibels (dB).
NOTE 2: The upper boundary of a linear operating range may be superseded by the onset of an overload condition. For example, 1% THD+N may be reached prior to the exceedance of the ap-plicable tolerance limit for level linearity errors.
5. 13 mic rophone s ys tem components of a measurement system that produce an electrical output signal in response to a sound pressure input signal and generally include a microphone, preamplifier, power supply, cables, and other devices as necessary
5. 14 notc h filter band-reject filter designed to remove a particular narrow range of frequencies from a broad-band signal
5. 15 Nyquis t frequenc y also called folding frequency. It is defined as half the sampling frequency from which dis-crete digital samples are obtained from a continuous analog input signal. The Nyquist fre-quency represents the highest frequency component of an analog input signal that can be sampled and reconstructed without aliasing
5. 16 overload describes a condition where the level of an analog input signal exceeds the capability of an analog-to–digital converter to detect further increases in input voltage. It is characterized by a sharp rise in distortion and is commonly associated with 1% THD+N
5. 17 quality fac tor (Q ) also referred to as Q factor. Defined as the ratio of the midband frequency of a filter di-vided by the bandwidth of the filter at the frequencies where attenuation equals 3 dB (half-power points). Derived by the following expression: Q = fc /(fh – fl ), where fc is the nomin-al midband frequency of a filter, fh is the upper -3 dB point, and fl is the lower -3 dB point.
For example, if a filter has a nominal midband frequency of 1000 Hz and exhibits 3 dB at-tenuation at 800 Hz and 1250 Hz, then Q = 1000 / (1250 – 800) = 2.2

6
F igure 1. I llus tra tion of Q fa c tor of a notc h fi lter. Q is deriv ed from the fo llowing ex pres s ion: Q = fc /(fh – f l )
5. 18 referenc e level range level range used for determining the acoustical sensitivity of a measurement system and containing the calibration sound pressure level
5. 19 s ampling frequenc y also called sample rate. Number of samples per second taken from a continuous signal to form a digital reconstruction of the original signal
5. 20 total harmonic dis tortion plus nois e (T HD + N) for a given sinusoidal input signal, ratio of the root-mean-square output signal with the fundamental component of the input signal removed to the root-mean-square of the output signal with the fundamental component present
NOTE: THD + N is expressed as a percentage and may be calculated from the difference between the levels, in decibels, of the two output signals. The bandwidth of the measurement device should always be stated.
6.0 E NV IR ONME NT AL C ONDIT IONS F OR V AL IDAT ION T E S T S
The recommended environmental conditions are based on the internationally standardized reference environmental conditions for acoustical instruments used in aircraft noise certifi-cation found in IEC 61625. Conditions at the time of conducting validation tests should be within the following ranges:
• Air temperature 20° C to 26 °C
• Static air pressure 80 kPa to 105 kPa

7
• Relative humidity 25 % to 70 %
Environmental conditions prevailing at the time of conducting validation tests should be measured and the results included in the test report. This is essential if any validation test-ing is performed at or near any of the stated limits.
7.0 T E S T INS T R UME NT S
7. 1 Ins trument c apabilities
Test instruments may consist of individual components or be integrated in a standalone or computer-based test system. The following devices and capabilities are recommended for tests to validate the performance of aircraft noise measurement systems that include a digi-tal audio recording device:
1) Signal Generator – for producing sinusoidal electrical test signals.
2) Step Attenuator – if calibration of the signal generator is in question, a calibrated step attenuator is recommended between the signal generator and the analog input to the digital audio recording device. The step attenuator permits the signal generator to operate at a constant signal level and thus avoid introducing unknown uncertainties. The step attenua-tor should have a range of at least 100 dB over which the level of the input signal can be attenuated in steps that include 0.1 dB, 1 dB, and 10 dB.
3) Time-Domain Analyzer – for viewing the time variation of an analog waveform at the output of the DUT, e.g., on an oscilloscope.
4) Frequency-Domain Analyzer – for determining the frequency spectrum of an analog signal at the output of a DUT. A fractional-octave-band spectrum analyzer, capable of 1/3 to 1/24-octave-band filtering, or a Fast Fourier Transform (FFT) spectrum analyzer, may be preferred, depending on the test to be performed. The fractional-octave-band spectrum analyzer should operate in “real time” for spectral components up to at least 12 kHz and should conform to the class-1 specifications of IEC 61260.
5) Broadband Filter – wide bandpass filter used to limit the influence of very low- and high-frequency components and ideally having a passband extending from 20 Hz to 20 kHz.
6) Variable Bandpass and Band-Reject Filter Set – for limiting, removing, or isolating spectral components in an analog input signal at specific frequencies or bandwidths of in-terest. Filters may be analog or digital and may be integrated into the signal analyzer or included in component hardware. The band-reject filter provides the function of a notch filter.
7) Microphone System – for use in conjunction with a sound calibrator3
3 It is recommended that the sound calibrator be referenced annually to a National Institute of Standards and Tech-
nology (NIST) traceable source.
to establish the calibration sound pressure level on the reference level range. A microphone system in compliance with IEC 61265 is recommended. If more than one level range is available, the test report should specify the reference level range.

8
8) Sound Calibrator – for generating the calibration sound pressure level at the calibration check frequency. The sound calibrator should comply with the class 1 specifications of IEC 60942 as well as those in paragraph 3.9.7 of Appendix 2 in Volume 1 of ICAO Annex 16.
NOTE: IEC 61265 provides further guidance on the recommended performance characteristics of test instruments.
7. 2 Ins trument c onfiguration
1) All hardware configurations used during testing should be documented with a diagram in the test report. Appropriate labeling with specific make and model of the test instru-ments should be included. Figure 2 shows an example diagram for a typical test setup.
2) If signal input or output adapters, or cable modifications, are required for DUT inter-face, consult with the DUT instruction manual or with the manufacturer for recommended wiring and pin assignments, e.g., when interfacing balanced and unbalanced audio connec-tions.
F igure 2. E x a mple diagra m of ha rdwa re s etup for T es t 1: S ta rting point on the referenc e lev el ra nge
8.0 DE V IC E UNDE R T E S T (DUT )
8. 1 S ettings
DUT instrument settings should be documented and included in the test report. Because DUT performance depends on device settings, validation tests should be conducted with settings anticipated for typical use during aircraft noise certification testing. Device set-
Sound Calibrator (Make/Model)
Microphone (Make/Model) Preamplifier (Make/Model)
Power Supply (Make/Model)
One-Third-Octave-Band Spectrum Analyzer (Make/Model)
Device-Under-Test (Make/Model)
Signal Generator (Make/Model)
Calibrated Stepped- Attenuator (Make/Model)

9
tings should remain consistent throughout all validation tests. Any changes from the initial settings should be documented and included in the test report.
The test report should contain all performance-relevant information including: sampling frequency and bit depth; settings of the signal generator, input-signal attenuator (if any), and level range control; channels tested; type of storage media used for the validation tests; and any additional DUT circuitry, software, or firmware choices that may be enabled. Software (if applicable) and firmware versions should also be documented in the test re-port.
Special care should be taken to ensure that all DUT features that manipulate or inherently alter the audio data should be disabled. Examples of such features include; automatic-gain control, frequency equalization, dynamic limiters, filters (with the exception of anti-alias filters), pre-emphasis, and special effects, e.g., reverberation.
8. 2 P ower S ourc e
The power source used during evaluation of the DUT should be documented and consistent throughout the testing process. The DUT should be evaluated using the power source an-ticipated for field applications. For example, if a 12 volt, 18 amp-hour battery with a DC-to-AC power inverter is typically used during the actual testing, validation tests should be performed using that power source.
8. 3 S tabilization
If no “pre-conditioning” or stabilization time is stated by the manufacturer of the digital audio recorder, a 10-minute warm-up period is recommended prior to beginning validation testing. If power is interrupted during testing, allow an additional 10 minutes for re-stabilization.
9.0 V AL IDAT ION T E S T S
The following test procedures have been designed to validate relevant performance charac-teristics for a digital audio recording device to be used in aircraft noise certification testing.
For each test, the following is provided:
1) an objective;
2) applicable performance specifications;
3) recommended step-by-step test procedures: and
4) instructions, with examples, for test-result format.
9. 1 G eneral tes t guidanc e
1) Measurable differences in performance have been known to occur when passing a sig-nal through a recorder to a spectrum analyzer in real-time, versus recording and subsequent playback of the signal. Therefore, input signals used for the validation tests should first be recorded to the storage medium of the DUT and then analyzed via playback.

10
2) If a DUT has multiple options for data storage, all types of storage media that will be used for acquiring aircraft noise certification data should be evaluated. It is important to indicate the type of storage media on all results provided in the test report. Examples of storage media include: internal hard disk drive, removable compact flash (CF) card, and external media via USB or Firewire cables.
3) Validation tests should be conducted on each input channel intended for use in aircraft noise certification testing.
4) If one is unable to undertake or to complete the validation tests due to limitations of available test instruments or time constraints,4
5) After completion of the validation tests, the applicant should prepare a test report and submit to the Volpe Center, Environmental Measurement and Modeling Division. The test report may be submitted separately or included as part of the Certification Validation Pack-age outlined in Volpe Letter Report: DTS-34-FA853-LR1. Contact information for submit-tal of the report is given in Section 12.0.
the services of a third-party test facility may be employed. Results from any third-party test facility should adhere to the protocol in this document and should be clearly identified in the test report.
6) All questions should be referred to: [email protected]
9. 2 T es t 1 — E s tablis h k nown referenc e level
9. 2.1 O bjec tive
Set the reference level range and establish the starting point for use in performance evalua-tion tests.
9. 2.2 P erformanc e s pec ific ation
No performance specification is needed for Test 1.
9. 2.3 P roc edure
1) Apply a sound level calibrator to a certification-compliant microphone system.5
2) Connect the microphone system to the analog input of the DUT.
3) Adjust the DUT level-range-control to record the calibration signal while allowing for additional operating range.
NOTE: Linear operating range, above the calibration level, acts as a safety buffer from accidental overload. It is recommended that this level be set conservatively based on the highest anticipated level that will be recorded during use.
4) Record the signal on the DUT for 30 seconds.
4 Time required to perform the complete set of validation tests and prepare the test report will be dependent upon
test equipment and user experience. A range of 40 to 60 hours is typical. 5 In compliance with IEC 61265.

11
5) Play back the recorded acoustical calibration signal to the one-third-octave-band spec-trum analyzer. Determine the 10-second averaged level of the recorded signal in the one-third-octave-band that contains the calibration check frequency, typically 250 Hz or 1000 Hz. The 10-second averaged level indicated by the spectrum analyzer establishes the start-ing point on the reference level range at the calibration check frequency for the acoustical input signal. The starting point on the reference level range should be identified by the nominal calibration sound pressure level, e.g., by 94, 114, or 124 dBSPL.
6) Replace the sound calibrator and microphone system with the sinusoidal signal genera-tor and apply to the analog input of the DUT. Set the frequency of the generator to the nominal frequency of the sound calibrator. Adjust the signal generator, and step attenuator if needed, to produce a signal level that is approximately the same as the level of the signal from the sound calibrator and record the signal on the DUT for 30 seconds. Play back the recorded signal through the spectrum analyzer and note the indicated 10-second averaged output level.
7) Iteratively adjust the signal generator level that is being input to the DUT until the in-dicated 10-second averaged output level is within 0.1 dB of the level previously noted for the sound calibrator signal. Document the settings of the signal generator and, if applica-ble, the step attenuator that yielded the desired output signal level. These settings establish the starting point on the reference level range for electrical input signals. Starting point settings should be documented on a manual log or by software and included in the test re-port.
NOTE: Some digital audio recording devices may provide an indication of, or reference to, “0 dB,” “full-scale,” or “digital full-scale.” These indications should not be confused with the upper boundary of the linear operating range.
9. 3 T es t 2 — L evel linearity
9. 3.1 O bjec tive
Evaluate level-linearity errors to determine the upper and lower boundaries and the extent of the linear operating range of the DUT at various frequencies over the range of interest for aircraft noise certification testing.
NOTE: In some digital audio recorders, it is possible for an overload condition, as defined in Sec-tion 5.9, to occur prior to the maximum allowable level-linearity error, as defined in Part 36. In such cases, the upper boundary of the level range shall be defined by the onset of an overload con-dition, not the exceedance of the applicable tolerance limit for level linearity errors (see Section 9.4 Test 3: Overload characteristics).
9. 3.2 P erformanc e s pec ific ation
At any test frequency, absolute level linearity means there is no difference between a measured output signal level and the corresponding anticipated output signal level, based on a known adjustment of the input level to the DUT. Level-linearity errors are deviations from ideal level-linearity. In accordance with Part 36, level-linearity errors should not ex-ceed ±0.5 dB over the entire extent of a linear operating range. On the reference level range, the extent of the linear operating range at a frequency of 1 kHz should be at least 70 dB. At other frequencies the extent of the linear operating range may be less than 70 dB, but must be equal to or greater than 50 dB.

12
9. 3.3 P roc edure
1) On the reference level range, or any level range intended for use in aircraft noise certi-fication testing, level linearity should be tested with sinusoidal electrical signals with fre-quencies of 50 Hz, 1 kHz, 10 kHz, and the calibration check frequency, if it is not one of the required frequencies, e.g., 250 Hz.
2) At any test frequency and for any level range, the anticipated level of a DUT output signal indicated by the one-third-octave-band spectrum analyzer should be calculated from the level of the starting point on the reference level range plus the change in the level of the input signal relative to the level of the input signal used to establish the starting point.
NOTE: Changes in the level of the input signal may be determined from changes to the setting of the signal generator or input signal attenuator. Accuracy of intended level changes may be con-firmed via direct measurement of the test signal by the one-third-octave-band spectrum analyzer.
3) At a selected test frequency, tests of level linearity begin at the starting point on the reference level range. Record the input signal, as determined in Test 1, to the DUT and play back through the spectrum analyzer. Note the 10-second averaged output signal level as indicated by the spectrum analyzer. Level linearity error is zero at the starting point on the reference level range.
4) The procedure of item (3) is then repeated with the level of the input signal increased sequentially above the starting point in steps no greater than 5 dB (preferably 1 dB) up to and beyond the indication of overload, and then down from the starting point to the first indication of under-range (if provided) and into the region where self-generated noise causes substantial level-linearity errors. On level ranges other than the reference level range, 10 dB steps in the input signal level may be used up to within 5 dB of the upper boundary and down to within 5 dB of the lower boundary.
NOTE 1: Increments or decrements in the level of the input signal may need to be less than 1 dB in the regions near the upper and the lower boundary of the linear operating range to provide ade-quate resolutions.
NOTE 2: Level-linearity tests at input signal levels up to 5 dB greater than the upper boundary, or down to 5 dB less than the lower boundary, of the linear operating range should be sufficient.
5) For each test frequency, tabulate the anticipated output signal level for a given input signal level, the corresponding measured output signal level as indicated at the one-third-octave-band spectrum analyzer, and the level-linearity error.
6) Steps 3, 4, and 5 should be repeated for all test frequencies.
9. 3.4 R es ults
Table 1 shows the preferred format for reporting results of a level-linearity test for a 10 kHz test frequency on the reference level range of an example DUT. Signal levels should be reported to 0.01 dB, if available, otherwise to 0.1 dB. The example in Table 1 indicates that the upper boundary of the linear operating range is 121 dB; the lower limit is 19 dB, and the extent of the linear operating range is 102 dB.

13
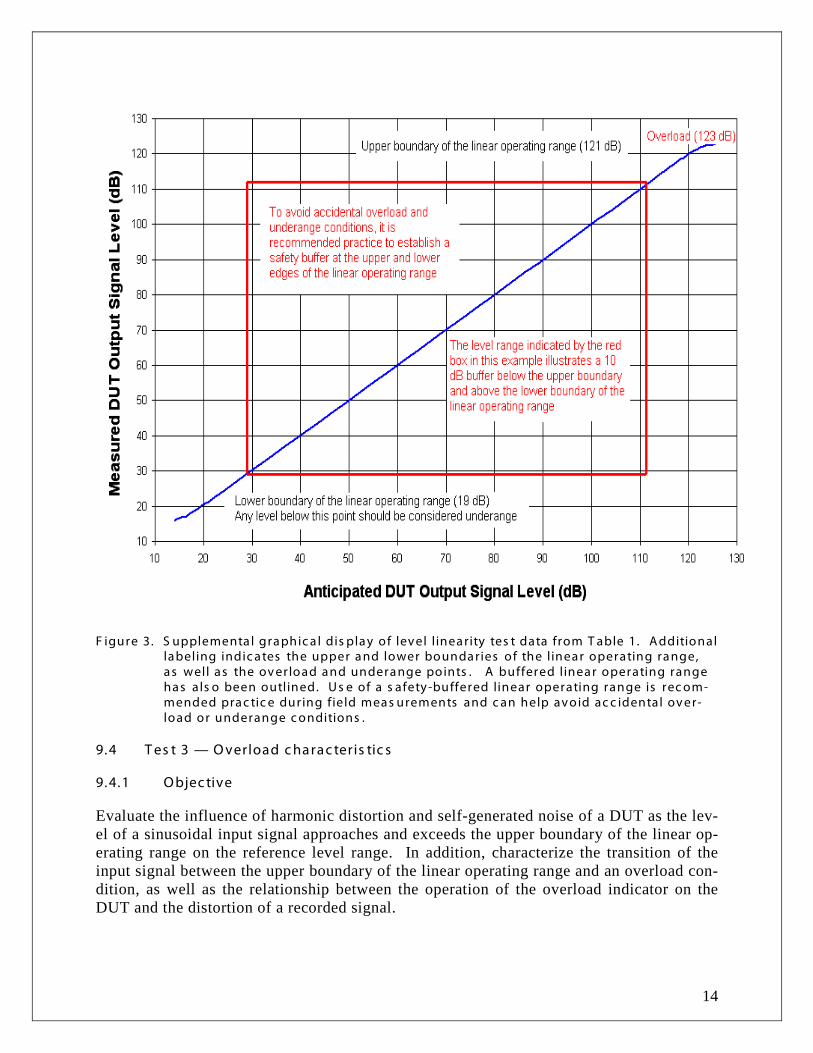
As a supplement to tabulated data, results may be shown in graphical form with the meas-ured one-third-octave-band output signal levels plotted on the Y-axis and the correspond-ing anticipated output signal levels on the X-axis. Figure 3 graphically displays the results of the level-linearity test given in Table 1. Additional text and graphics have been added to indicate the upper and lower boundaries of the linear operating range; distinguish these boundaries from overload and underange points, and outline an example “safety buffer” be-low the upper boundary and above the lower boundary of the linear operating range.
T a ble 1. R ec ommended format for lev el-linea r ity tes t res ults : 10 k Hz tes t frequenc y on the referenc e lev el range
Anticipated DUT output signal level (dB)
Measured DUT output signal level
(dB)
Level linearity error (dB)
126.00 123.19 -2.81 125.00 122.69 -2.31 124.00 122.47 -1.53 123.00 122.12 -0.88 122.00 121.46 -0.54 121.00 120.77 -0.23 120.00 119.89 -0.11 119.00 118.95 -0.05 118.00 117.98 -0.02 117.00 116.99 -0.01 116.00 115.99 -0.01 115.00 115.00 0.00 114.00 114.00 0.00 109.00 108.99 -0.01
104.00 103.99 -0.01 99.00 98.99 -0.01 94.00 94.01 0.01 89.00 89.01 0.01 84.00 83.99 -0.01 79.00 79.00 0.00 74.00 73.99 -0.01 69.00 69.01 0.01 64.00 64.02 0.02 59.00 59.02 0.02 54.00 54.02 0.02 49.00 49.03 0.03 44.00 44.03 0.03 39.00 39.08 0.08 34.00 34.11 0.11 29.00 29.23 0.23 24.00 24.32 0.32 19.00 19.37 0.37 18.00 18.51 0.51 17.00 17.67 0.67 16.00 16.73 0.73 15.00 16.66 1.66 14.00 15.85 1.85
14
F igure 3. S upplementa l gra phic a l dis pla y of lev el l inea rity tes t data from T able 1. A dditional la beling indic a tes the upper a nd lower bounda ries of the linea r operating ra nge, a s well a s the ov erload a nd undera nge points . A buffered linea r operating range ha s a ls o been outlined. U s e of a s afety -buffered linear operating range is rec om-mended pra c tic e during field mea s urements and c an help av oid ac c idental ov er-load or underange c onditions .
9. 4 T es t 3 — O verload c harac teris tic s
9. 4.1 O bjec tive
Evaluate the influence of harmonic distortion and self-generated noise of a DUT as the lev-el of a sinusoidal input signal approaches and exceeds the upper boundary of the linear op-erating range on the reference level range. In addition, characterize the transition of the input signal between the upper boundary of the linear operating range and an overload con-dition, as well as the relationship between the operation of the overload indicator on the DUT and the distortion of a recorded signal.

15
9. 4.2 P erformanc e s pec ific ations
ICAO Annex 16, Volume 1, Appendix 2, paragraph 3.6.8, includes a specification for the measurement system for aircraft noise certification testing to provide an indication of the overload that occurs during an overload condition on any relevant level range.
9. 4.3 P roc edure for T HD+N meas urement
The following steps are recommended for evaluating the influence of harmonic distortion and self-generated noise (THD + N) on measurements of sinusoidal output signals.
1) Apply a 1 kHz sinusoidal test signal, at an input signal level corresponding to 5 dB less than the upper boundary of the linear operating range on the reference level range, to the analog input of the DUT.
2) Record a 30-second sample of the signal.
3) Play back the recorded 1 kHz test signal and apply a non-attenuating 20 Hz-to-20 kHz bandpass filter.
NOTE: A nominal 20 Hz-to-20 kHz bandpass filter is recommended to limit the influence of out-of-band self-generated noise on measurements of output signal levels. The specified band-edge frequencies may vary, however, should not exhibit attenuation characteristics in the 20 Hz-to-20 kHz bandwidth commonly associated with commercial audio devices.
4) Measure the level of the bandpass filtered output signal.
5) Play back the recorded test signal again, but this time through a narrow band-reject or “notch” filter to remove the 1 kHz fundamental spectral component. The Q factor (see Figure 1) of the band-reject or notch filter should be between 1 and 5. Apply the 20 Hz-to-20 kHz bandpass filter to the remaining signal. Harmonics, self-generated noise, and other artifacts should be all that remain.
6) Measure the level of the notch-filtered and bandpass-filtered output signal.
7) Calculate the contribution of THD + N as a percentage of the root-mean-square total signal by the following expression:
2 1( )/20THD+N (100) 10 L L− =
In the above expression, L2 is the level (dB) of the notch-filtered and bandpass-filtered out-put signal from step 6 and L1 is the level (dB) of the total signal at the output of the band-pass filter from step 4. Signal levels are expressed in decibels.
NOTE: As examples, if L2 – L1 = -40 dB, THD + N = 1.00 %. If L2 – L1 = -60 dB, THD + N = 0.10 %.
8) Repeat steps 1 through 7 with input signal levels increased in 1 dB increments. Test-ing may be terminated when the influence of THD + N reaches, or exceeds, 1 % or the lev-el difference is less than -40 dB.

16
9. 4.4 P roc edure for vis ual analys is tes ts
The following steps are recommended for viewing the influence of harmonic distortion and self-generated noise on the waveform and spectrum of a sinusoidal input signal.
1) Apply the 20 Hz-to-20 kHz bandpass filter to the output of the DUT.
2) Connect the bandpass filtered output to a spectrum analyzer and, optionally, to an os-cilloscope. An FFT spectrum analyzer is recommended. If an FFT spectrum analyzer is not available, a set of one-third-octave-band, or narrower fractional-octave-band filters, may be used. Fractional-octave-band filters should conform to the class-1 specifications of IEC 61260.
3) Play back the test signal that was recorded in step 2 of the procedure for measurement of THD + N (Section 9.4.3).
4) Store the resulting spectrum analysis, or time-domain (oscilloscope) analysis, or both, and label the displays with relevant information including the result of the corresponding THD+N test and include in the test report (see Section 9.4.5 for a partial list of suitable sto-rage options).
5) Repeat steps 1 through 4 with input signal levels increased in 1 dB increments using the signals that were recorded for the THD +N test.
6) Continue the process until an overload condition is clearly observed. Testing may be terminated at the input signal level that causes THD + N = 1%.
NOTE: Special attention should be paid to the operation of the Overload Indication on the DUT. It is important to characterize the behavior of the overload indication by noting the input signal level at which it activates, and whether the indication corresponds to an actual overload condition, or is merely a warning that further increases in input signal level will cause an overload.
9. 4.5 R es ults
The THD + N results should include reference information such as the frequency and level of the input signal, the settings of the controls, the level range, and the bandwidth of the filter on the output of the DUT as well as the Q factor of the notch filter.
NOTE: An example of the reporting of THD + N results is as follows: THD + N = 0.03 % [cor-responding to a level difference, L2 – L1, = -70.5 dB] for a 1 kHz input signal recorded at 3 dB less than the upper boundary of the linear operating range on the reference level range and with a 20 Hz-to-20 kHz bandpass filter on the output of the DUT.
Visual records of overload conditions should include plots of the narrow-band harmonic components in the spectrum accompanied by the corresponding THD + N results noted above. If available, the visual records of the waveform from the oscilloscope images should be provided to supplement the spectral plots.
Image capture options will vary with the signal analyzer used. An analyzer-generated im-age is preferred; however other suitable methods include, but are not limited to: detailed photographs of the analyzer display screen, printing a screen capture, or converting numer-ical data to plot graphs in a spreadsheet.

17
Figure 4 shows an example of a DUT overload condition with superimposed plots of the spectral data from an FFT analysis and the corresponding waveform from an oscilloscope trace. The plot in Figure 4 was generated from a single analyzer capable of simultaneously displaying the results of both the frequency and time-domain analyses.
F igure 4. V is ua l dis pla y s of a DUT ov erload c ondition for a 1 k Hz input s igna l rec orded at 1 dB abov e the upper bounda ry of the linea r opera ting range on the referenc e lev el ra nge. A 20 H z-to-20 k Hz ba ndpa s s fi lter wa s a pplied to the output of the DUT . T he c orres ponding T H D + N = 1. 2 % with a lev el differenc e of -38.5 dB .
The red FFT spectrum in Figure 4 shows high-level harmonic components of the 1 kHz fundamental. The spectrum is shown in red with a matching ordinate signal-level scale in decibels and a linear abscissa frequency scale in hertz from 0 Hz to 20 kHz.
The green oscilloscope trace of the 1 kHz-waveform shows evidence of signal overload by the truncation or squaring off of the positive and negative peaks of the sinusoidal output waveform. The green waveform is shown with an ordinate scale in volts and a linear ab-scissa scale for time, in milliseconds, relative to an arbitrary start time.
An overload condition such as illustrated in Figure 4 is to be avoided because an over-loaded output waveform cannot be restored to the original waveform of the input signal.
Truncated waveforms & high harmonic content indicate an overload condition

18
9. 5 T es t 4 — S elf-generated nois e
9. 5.1 O bjec tive
Evaluate the spectrum of the self-generated electronic noise of the DUT. Ensure that the spectrum of the self-generated noise is as expected, without anomalies, and will not influ-ence recorded data in an unanticipated manner.
9. 5.2 P erformanc e s pec ific ation:
There is no specification for the level or spectrum of self-generated noise. However, be-cause the level of self-generated noise affects the lower boundary of a linear operating range and the level of self-generated noise can increase with time, it is advisable to check the self-generated noise of a DUT at least once a year.
9. 5.3 P roc edure
1) Apply a resistive termination to the analog input of the DUT and record at least 30 seconds of a “no signal” sample of self-generated noise.
NOTE: The termination may place a “dummy” load, e.g., a 50-ohm resistor, on the analog input of the DUT to exercise the electronics of the DUT without adding the electronic noise of an exter-nal device.
2) Connect the DUT output to a spectrum analyzer. A one-third-octave-band analyzer is preferred.
3) Play back the “no signal” recording to the spectrum analyzer using an averaging time of at least 20 seconds, or the maximum averaging time the recorded sample will permit. Ensure that the input range of the spectrum analyzer is properly adjusted so that the self-generated noise of the analyzer is not confused with the self-generated noise from the DUT.
4) Store the resulting spectral image displayed by the analyzer (see Section 9.4.5 for pre-ferred storage options). Identify the stored spectral image as “Self-generated noise”. Plot the level of the output signal on the Y-axis in decibels (dB) and plot frequency on the X-axis in hertz (Hz).
9. 5.4 R es ults
As an example, the spectrum of the self-generated noise from a DUT is shown in Figure 5. The DUT operated with a bit depth of 16 bits/sample and a sampling frequency of 44.1 kHz. The results are seen as one-third-octave-band signal levels covering the range of midband frequencies from 20 Hz to 12.5 kHz.

19
F igure 5. P hotograph of the dis pla y of a one-third-oc tav e-ba nd a naly s is of the s elf-genera ted nois e of a DUT with 16 bit res olution a nd 44. 1 k Hz s a mpling frequenc y .
9. 6 T es t 5 — L evel range c ontrol
9. 6.1 O bjec tive
Given a constant input signal level, determine the change in DUT output level associated with each increment/decrement of the level range control. NOTE: This test is not intended for continuously-variable level range controls.
9. 6.2 P erformanc e s pec ific ation
There is no performance specification for the level range control. However, in accordance with ICAO Annex 16, Volume 1, Appendix 2, paragraph 3.6.9, range changes shall operate in known intervals of decibel steps.
9. 6.3 P roc edure
1) Adjust the level range control of the DUT to the lowest setting (maximum attenuation). 2) Apply a 1 kHz sinusoidal test signal to the analog input of the DUT. Record a 30-second sample of the signal. NOTE: Take special care to select a signal level which will be within the linear operating range of the DUT when set at both the minimum and maximum level range settings.
3) Connect the analog output of the DUT to a spectrum analyzer and play back the recorded test signal. Note the indicated level. 4) Increment the DUT level range control to the next position while applying the 1 kHz test signal used in step 2. Record a 30-second sample.

20
5) Play back the recorded signal to the spectrum analyzer and note the indicated level. 6) Repeat steps 4 and 5 until all level range control settings have been tested. 7) Calculate the change in output level of the test signal corresponding to each increment of the level range control.
9. 6.4 R es ults
Table 2 illustrates the recommended format for displaying the change in output level cor-responding to each change in level range control setting. Include columns for level range control setting, measured DUT output level, and change in output level. Levels should be reported to 0.01 dB.
T a ble 2. R ec o mm ended fo rm a t fo r r es u lts f ro m lev el r a nge c o ntrol tes ts . R es u lts indic a te nomina l 1 dB lev el r a nge s teps a nd a 20 dB ra n ge of ga in/a ttenu a tion
9. 7 T es t 6 — Anti-alia s ing effec tivenes s
9. 7.1 O bjec tive
Determine the effectiveness of the low-pass anti-alias filtering for suppression of alias components inherent to an analog-to-digital conversion process.
DUT level range control
setting
Measured DUT output level
(dB)
Change in DUT output level
(dB) Start @ Minimum Level
Range Setting 94.01 +1 95.01 +01.00 +2 96.01 +01.00 +3 97.01 +01.00 +4 98.02 +00.99 +5 99.01 +01.01 +6 100.01 +01.00 +7 101.01 +01.00 +8 102.01 +01.00 +9 103.01 +01.00 +10 104.02 +00.99 +11 105.00 +01.02 +12 106.00 +01.00 +13 107.01 +00.99 +14 108.00 +01.01 +15 109.00 +01.00 +16 110.00 +01.00 +17 111.00 +01.00 +18 112.00 +01.00 +19 113.00 +01.00 +20 114.00 +01.00

21
9. 7.2 P erformanc e s pec ific ation
In accordance with ICAO Annex 16, Volume 1, Appendix 2, paragraph 3.3.2, any aliased spectral components or spectral artifacts shall be at least 50 dB less than the upper boun-dary of the linear operating range, for spectral components of the input signal in the fre-quency range less than 12.5 kHz. Low-pass anti-alias filtering should be provided prior to sampling by the analog-to-digital converter in the DUT.
9. 7.3 P roc edure
1) On the reference level range, apply a sinusoidal signal, at a frequency that is at least 4 kHz less than the Nyquist frequency, to the analog input of the DUT. The level of the in-put signal should be that of the upper boundary of the linear operating range at 1 kHz. Record a 30-second sample of the signal.
2) Connect the analog output of the DUT to the input of a spectrum analyzer. An FFT spectrum analyzer is preferred for detailed frequency domain analysis. However, a one-third-octave-band spectrum analyzer should provide sufficient data to indicate that the aliased frequency components have been adequately suppressed.
3) Play back the test signal and view the FFT spectrum with the best available resolution while maintaining a view of the bandwidth of interest to at least 30 kHz. For this purpose, it may be helpful to use a linear frequency scale on the X-axis instead of logarithmic.
4) Identify and note the frequency and signal level of the input signal and the correspond-ing alias component. Use caution to avoid confusing the alias artifacts with, normally present, harmonics of the test signal frequency.
NOTE: The frequency of an aliased component is calculated from the sampling frequency minus the frequency of the input signal. For example, with a 48 kHz sampling frequency, the frequency of the aliased component for an 18 kHz input signal frequency is 48 kHz – 18 kHz = 30 kHz. If the test signal is raised to 20 kHz, then the frequency of the aliased component is 48 kHz – 20 kHz = 28 kHz, etc.
5) Repeat steps (1) through (4) for the other test frequencies. The sequence of test fre-quencies will vary depending on the sampling frequency used by the DUT. The range of test frequencies should begin a few kilohertz less than the Nyquist frequency [from step (1)] and increment to at least twice the Nyquist frequency, that is, at least up to the sam-pling frequency. The recommended progression of test frequencies is as follows:
a. Begin using increments of 1 kHz above the initial test frequency.
b. Reduce the increments to 500 Hz when within ±2 kHz of the Nyquist frequency.
c. Further reduce the increments to 200 Hz when within ±1 kHz of the Nyquist fre-quency.
d. Once the test signal frequency is greater than 2 kHz above the folding frequency, continue increasing the frequency of the input signal in 2 kHz increments.
e. Use additional test frequencies to measure the aliased components at 12.5 kHz, 1 kHz, and 500 Hz.

22
f. The recommended final test frequency is twice the folding frequency, which will produce an alias artifact at 0 Hz. The level of low-frequency aliases will typically be suppressed below the level of the self-generated noise of the DUT and hence will not be measurable well before this point.
g. Testing at input signal frequencies greater than the sampling frequency is not re-quired. However, it is recommended to explore this region with input signal fre-quencies greater than the sampling frequency to ensure that no anomalies are pro-duced within the bandwidth of interest.
6) For reference, the analyzer display should be stored and printed, photographed or plot-ted, for each test frequency, with appropriate labeling. The labeling should include the bit depth, sampling frequency, and folding frequency.
9. 7.4 R es ults
Table 3 shows the preferred format for presentation of data demonstrating that the anti-alias filter produces adequate suppression of aliased spectral components in the frequency range of interest up to 12.5 kHz.
Column 1 of Table 3 lists the frequencies, in hertz, of the input sinusoidal signals. The frequencies were chosen according to the procedure described above. For this example, the DUT used a sampling frequency of 48 kHz; hence the folding frequency was 24 kHz. The example sequence begins 6 kHz below the folding frequency, i.e., at 18 kHz.
Column 2 lists the levels of the DUT output at each test frequency, in decibels, as indicated by FFT analysis.
Columns 3 and 4 of Table 3 list the frequencies and levels of the aliased components of the input signal. The levels of the aliased components in column 4 were determined from the FFT analysis.
Column 5 lists alias suppression (dB) which is calculated by subtracting each alias level from the upper boundary of the linear operating range, on the reference level range. These values will determine compliance to the performance specification cited in section 9.7.2.

23
T a ble 3. R ec o mmended fo rma t fo r r es u lts f ro m a nti-a lia s f i lter tes tin g. S uppr es s ion of a l ia s fr equen c y c o mpo nents is > 89 dB from 12. 5 k H z to 0 H z re la tiv e to th e upper bounda r y of th e lin ea r oper a tin g r a nge (121 dB ). T he fo lding fr equ en c y is 24 k H z
Input s igna l
frequenc y (Hz)
Indic a ted DU T output a t tes t
frequenc y (dB)
A l ia s
frequenc y (Hz)
A l ia s level (dB)
A l ia s
S uppres s ion (dB)
18000 121.0 30000 62.2 58.8 19000 121.0 29000 61.5 59.5 20000 120.8 28000 63.4 57.6 21000 120.7 27000 60.3 60.7 22000 120.6 26000 54.6 66.4 22500 120.4 25500 92.3 28.7 23000 120.3 25000 94.1 26.9 23200 119.5 24800 98.8 22.2 23400 118.6 24600 103.7 17.3 23600 117.2 24400 109.5 11.5 23800 115.7 24200 111.2 9.8 24000 116.4 24000 116.4 4.6 24200 106.5 23800 110.3 10.7 24400 99.3 23600 107.6 13.4 24600 89.0 23400 103.2 17.8 24800 77.8 23200 98.5 22.5 25000 69.1 23000 92.8 28.2 25500 30.7 22500 77.6 43.4 26000 28.5 22000 59.9 61.1 28000 27.6 20000 34.3 86.7 30000 28.8 18000 32.6 88.4 32000 27.3 16000 32.1 88.9 34000 29.8 14000 30.8 90.2 35500 28.2 12500 31.4 89.6 36000 29.1 12000 30.3 90.7 38000 27.4 10000 31.8 89.2 40000 28.7 8000 29.6 91.4 42000 28.9 6000 30.7 90.3 44000 27.3 4000 31.2 89.8 46000 28.6 2000 30.0 91.0 47000 27.9 1000 30.4 90.6 47500 26.3 500 29.8 91.2 48000 27.1 0 30.1 90.9

24
9. 8 T es t 7 — F requenc y res pons e
9. 8.1 O bjec tive
Characterize the ability of a DUT to record, store, and reproduce sinusoidal electrical sig-nals over a range of frequency and within specified tolerance limits.
9. 8.2 P erformanc e s pec ific ation
To satisfy the requirements of ICAO Annex 16, Volume 1, Appendix 2, paragraph 3.6.3, the relative frequency response shall not exceed ±1.5 dB over the range of nominal one-third-octave midband frequencies from 50 Hz to 10 kHz. For recordings of constant-amplitude sinusoidal input signals, relative frequency response is determined from the dev-iation of a one-third-octave-band output signal level from the one-third-octave-band output signal level at the calibration check frequency.
In addition, at any frequency over the range from 10 kHz to 11.2 kHz, the deviation of the output signal level from the output signal level at 10 kHz shall not exceed ±0.3 dB.
9. 8.3 P roc edure
1) Apply a sinusoidal electrical signal at the calibration check frequency to the analog in-put of the DUT.
2) Adjust the input signal level to be within 5 dB of the input signal level corresponding to the calibration sound pressure level on the reference level range. Record at least a 30-second sample of the signal. Note the input signal level.
3) Play back the recorded test signal to a one-third-octave-band spectrum analyzer and note the output signal level in the band containing the calibration check frequency.
4) Repeat steps (1) through (3) for recordings of sinusoidal input signals at the nominal one-third-octave midband frequencies from 50 Hz to 12.5 kHz. For each frequency, the level of the input signal should be the same as that used for the recording of the input sig-nal at the calibration check frequency.
5) The frequency response in the upper part of the passband of the 10 kHz filter may be evaluated by the procedure described above by recording additional input signals at fre-quencies spaced at 1/24th octave intervals between the 10 kHz midband frequency and the 11.2 kHz upper bandedge frequency. The following sequence of test frequencies is rec-ommended: 10 kHz, 10.3 kHz, 10.6 kHz, 10.9 kHz, and 11.2 kHz.
6) Determine the relative frequency response of the DUT, in decibels, from the one-third-octave-band levels of the output signals minus the level of the output signal in the one-third-octave-band containing the calibration check frequency. Resolution to the hundredth of a decibel is recommended for reporting the measurements of output signal levels.
9. 8.4 R es ults
A graphical presentation of the relative frequency response should be created. The plot should provide sufficient resolution to clearly determine conformance to the performance specification. Relative frequency response should be plotted on the Y-axis and nominal

25
one-third-octave midband frequency on the X-axis. The calibration check frequency and the input signal level should be stated in the figure title along with other relevant informa-tion.
A tabular presentation of the relative frequency response data may be submitted instead of, or as a supplement to, the graphical presentation. The table should list the frequency of the input signals and the corresponding output signal level relative to the output signal level at the calibration check frequency.
Figure 6 provides an example of a graphical presentation for the frequency response of a DUT. For this example, the calibration check frequency was 1 kHz. The plot indicates that the relative frequency response did not exceed the specified tolerance limits over the range of one-third-octave midband frequencies from 50 Hz to 12.5 kHz.
-0.40
-0.30
-0.20
-0.10
0.00
0.10
50 125 315 800 2000 5000 12500
One-Third-Octave Midband Frequency (Hz)
Rel
ativ
e Fr
eque
ncy
Res
pons
e (d
B)
1 kH
z =
0 dB
F igure 6. R elativ e frequenc y res pons e on the referenc e lev el range for a DUT . A n input s ig-na l lev el of 114 dB , at a frequenc y of 1 k Hz , wa s referenc ed to an output lev el of 0 dB . T he plot indic a tes a dev iation < 0. 11 dB a c ros s the ba ndwidth of interes t.
9. 9 T es t 8 — Inter-c hannel c ros s talk
9. 9.1 O bjec tive
The primary contributing mechanisms to inter-channel crosstalk are determined by circuit design and the layout geometry of circuit elements, for example, stray capacitance and in-ductive coupling. Inter-channel crosstalk is typically a function of the frequency of the in-put signals, not the signal strength.
The objective of this test is to quantify the level of signal leakage from a signal-driven channel to the other un-driven channel(s) of a multi-channel DUT.
26
9. 9.2 P erformanc e s pec ific ation
It is recommended that the level of crosstalk suppression be at least 70 dB between a sig-nal-driven channel and any un-driven channel at frequencies within the range of interest and between all input-signal channels intended for use. Although there is no formal speci-fication stated in FAR Part 36 or ICAO Annex 16 regarding inter-channel crosstalk, this level of channel isolation shall be considered sufficient in order to maintain the integrity of the required linear operating range cited in section 9.3.2.
9. 9.3 P roc edure
1) Apply a 50Hz sinusoidal electrical signal to the analog input of the DUT. The input signal level should be 10 dB less than the upper boundary of the linear operating range on the reference level range.
2) Apply a short-circuit termination to the analog input(s) of the un-driven channel(s).
3) Record at least a 30-second sample of the test signal to the DUT. Ensure that both the driven and un-driven channels are engaged in record mode.
4) Apply a 20 Hz-to-20 kHz bandpass filter to the analog output of the DUT and play back the signal from the driven channel and note the level of the output signal at the test frequency. If available, note the signal levels to the hundredth of a decibel, otherwise to the tenth of a decibel.
5) Repeat the play back of the recording and determine the level of the output signal from each un-driven channel.
6) For each un-driven channel in turn, reverse the input connections on the driven and un-driven channel and repeat steps 1 through 5.
7) Repeat the above process at test frequencies of 1 kHz, 10 kHz, and the calibration check frequency if it is not one of those previously tested.
9. 9.4 R es ults
Table 4 shows the preferred format for presentation of the results of inter-channel crosstalk tests. If the DUT has more than two analog input channels, the table should show the min-imum level of suppression of crosstalk between the channels. Separate tabulations of test results should be provided for each driven channel.
For all combinations of driven and un-driven channels and for each test frequency, the min-imum level of crosstalk suppression should conform to the specified minimum.

27
T a ble 4. R ec o mm ended fo rm a t fo r tes t r es u lts of inter-c ha nnel c ro s s ta lk for a fo ur -c h a nn el DU T
Input s igna l c ha n nel a nd min-imum c ros s ta lk
s uppres s io n
O utpu t s ig na l le vel dB
T es t frequenc y 50 H z 1000 H z 10 k H z
Driven channel 1 111.04 111.01 111.02 Un-driven channel 2 30.22 31.56 32.94 Un-driven channel 3 30.46 31.30 31.48 Un-driven channel 4 30.37 30.94 32.39
Minimum crosstalk suppression (dB) -80.58 -79.45 -78.08
NOTE 1: Crosstalk level = output signal level from an un-driven channel minus the output signal level of the driven channel
NOTE 2: Crosstalk is typically expressed as a negative value
9. 10 T es t 9 — C omparative analys is of a rec ording of a trans ient s ound
9. 10. 1 O bjec tive
Using the sound from an aircraft flyover or other transient sound source, evaluate the dif-ferences between the 0.5-second averaged one-third-octave-band sound pressure levels de-termined from recordings made on a recording device that has been previously validated for aircraft noise certification testing and on the DUT.
9. 10. 2 P erformanc e s pec ific ation
Differences greater than 1.0 dB between time-synchronized 0.5-second averaged one-third-octave-band sound pressure levels could indicate recorder anomalies or operational errors that may require additional testing.
9. 10. 3 P roc edure
1) The test setup should utilize typical instruments, configurations, settings, and protocols as used by the applicant for aircraft noise certification testing.
NOTE: When it is not feasible to record the sound from an aircraft, e.g., when no aircraft noise tests are scheduled or for a new applicant, a transient sound such as that from the passby of an au-tomobile or motorcycle may be used in lieu of the sound of an aircraft flyover.
2) Integrate the DUT into the measurement system. Ensure that the DUT and the aircraft noise certification validated recorder each receive identical input signals for acoustical data as well as time synchronization.
NOTE: Time synchronizing the recorded signals from the microphone is critical. The two record-ing devices may include the capability to record internally generated time signals or the signal from a time-code generator may be recorded on an unused channel of each recorder. An event-mark of some kind should be recorded on each recording near the time of closest approach of the aircraft or alternative motorized vehicle.
28
3) Using the applicant’s standard procedure and usual settings for the level range con-trols, record a 30-second sample of the signal from the sound calibrator applied to the mi-crophone.
4) Record the sound signal from an aircraft or alternative source on each recording device using the applicant’s usual settings for the level range controls.
5) Process the recorded signals through a one-third-octave-band spectrum analyzer that conforms to the specifications of IEC 61260 for class 1 performance. For each recording, calibrate the spectrum analyzer to the recorded calibration reference tone. Obtain 0.5-second averaged one-third-octave-band sound pressure levels, in decibels, over the range of midband frequencies from 25 Hz to 12.5 kHz. The same settings of the spectrum analyzer should be used to process the data from the two recording devices.
9. 10. 4 R es ults
Graphical presentations of the results are recommended, however, tabular data should be included in the event that graphical results are inconclusive. A diagram should also be in-cluded to illustrate the instruments used in the test setup and their connections.
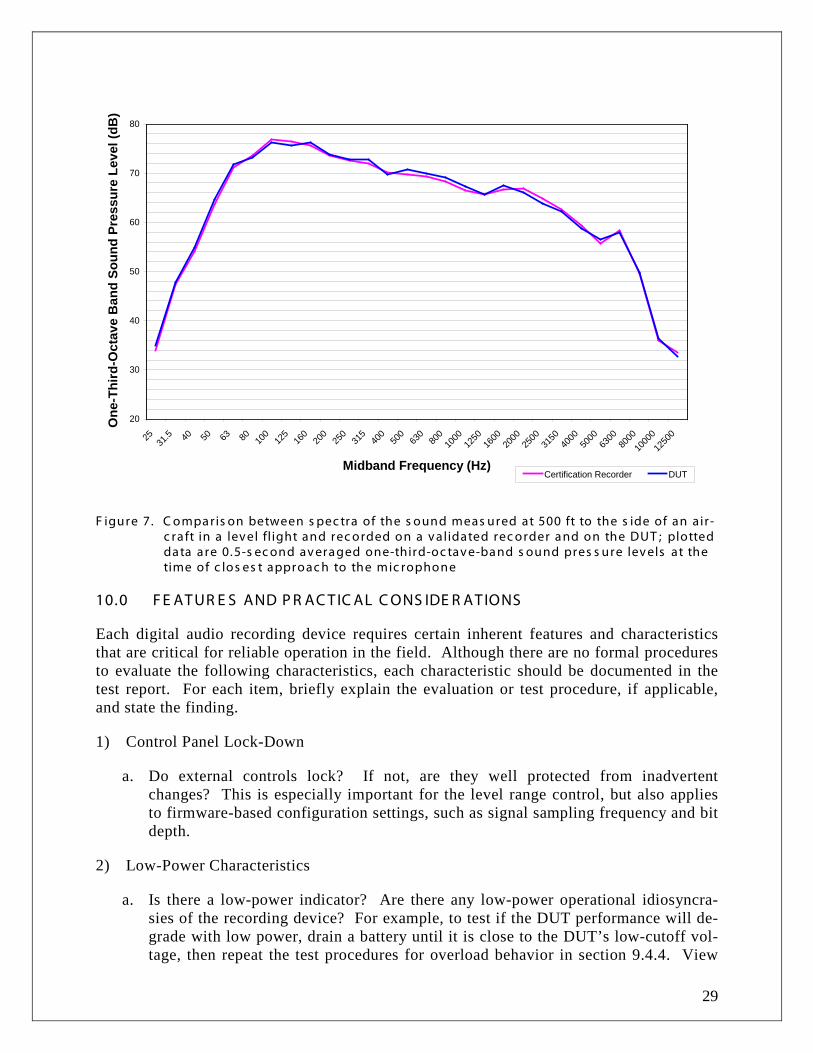
Figure 7 shows the preferred format for presentation of the test results. The Y-axis indi-cates one-third-octave-band sound pressure levels (dB). The X-axis indicates midband fre-quencies (Hz). The scale for the Y-axis should be in whole decibels with grid spacing no greater than 2 dB. The scale for the X-axis should cover the range of midband frequencies. The title for the graph should indicate relevant information about the sound source and the relative time of observation. Additionally, graphical source data should be presented in a tabular format that clearly indicates midband frequencies and corresponding one-third-octave-band sound pressure levels for each recorder.
Results should be provided at the time of closest approach, however additional results are encouraged at, both, a few seconds before the time of closest approach, and a few seconds after the time of closest approach.
29
20
30
40
50
60
70
80
25 31.5 40 50 63 80 10
012
516
020
025
031
540
050
063
080
010
0012
5016
0020
0025
0031
5040
0050
0063
0080
0010
00012
500
Midband Frequency (Hz)
One
-Thi
rd-O
ctav
e B
and
Soun
d Pr
essu
re L
evel
(dB
)
Certification Recorder DUT
F igure 7. C ompa ris on between s pec tra of the s ound meas ured at 500 ft to the s ide of an air -c ra ft in a lev el fl ight and rec orded on a v alidated rec order a nd on the DUT ; plotted da ta a re 0. 5-s ec ond av era ged one-third-oc tav e-ba nd s ound pres s ure lev els at the time of c los es t approac h to the mic rophone
10.0 F E AT UR E S AND P R AC T IC AL C ONS IDE R AT IONS
Each digital audio recording device requires certain inherent features and characteristics that are critical for reliable operation in the field. Although there are no formal procedures to evaluate the following characteristics, each characteristic should be documented in the test report. For each item, briefly explain the evaluation or test procedure, if applicable, and state the finding.
1) Control Panel Lock-Down
a. Do external controls lock? If not, are they well protected from inadvertent changes? This is especially important for the level range control, but also applies to firmware-based configuration settings, such as signal sampling frequency and bit depth.
2) Low-Power Characteristics
a. Is there a low-power indicator? Are there any low-power operational idiosyncra-sies of the recording device? For example, to test if the DUT performance will de-grade with low power, drain a battery until it is close to the DUT’s low-cutoff vol-tage, then repeat the test procedures for overload behavior in section 9.4.4. View
30
the sinusoidal signal in the time and frequency domains, and compare the results obtained with low power to the results previously observed with full power.
b. What is the typical current draw in record mode? What is the expected run time with the anticipated power source?
c. What is the consequence of a sudden power loss? Are data lost or saved to the moment of power loss?
3) Data Storage Media
a. Are there multiple data-storage options? Can data samples be recorded simulta-neously to the different storage media, e.g., internal hard disk drive and flash mem-ory card?
b. What is the nominal capacity of the available storage media? Given typical set-tings, how much recording time will this provide?
c. What happens when a data-storage volume is filled? Is there a visual or an audible warning prior to reaching full capacity?
• Are data saved to the final moment or are data lost?
• If more than one storage medium is simultaneously recording, do all other storage media continue to record without interruption if data storage on one recording medium is interrupted?
• What is the reliability of the different available data-storage media? Have you experienced errors or file corruption?
4) Time Synchronization
a. Does the DUT have an internal clock? What is the accuracy of the internal clock relative to time signals from a known source? Can the internal clock be synchro-nized from external time code? Can the clock be set to indicate the year, month, and day as well as the local time of day and with what resolution for time of day?
b. Does the DUT continuously time-stamp recordings or is time data indicated only at the beginning or end of file writing? Can the year, month, and day as well as an indication of the time of recording be displayed on playback?
NOTE: It is not necessary for a recording device to posses all of the time recording and time dis-play capabilities mentioned above, however a stable internal clock and enhanced time keeping op-tions are generally useful features.
5) Input/Output Options
a. Are inter-connections compatible with the rest of the measurement system or are adapters or customized cables, or both, required? Do balanced and unbalanced line signals need to be interfaced?

31
b. Are individual analog line inputs provided for each channel or are signal inputs shared, e.g., by means of a stereo mini-plug?
c. Are separate level range controls provided for each input, e.g., by means of sepa-rate attenuators with decibel steps for left and right channels, or is one level range control used to adjust the sensitivity of all inputs?
d. Is a commonly available PC interface provided for data download? Is there a digi-tal audio output signal suitable for recording on an external hard drive?
6) Operational Considerations
a. Ease of use: Is the DUT intuitive to operate and can it be easily deployed? Are there any apparent idiosyncrasies? Is the device easily packed and transported?
b. Durability: Is the device well constructed? Is the DUT tolerant to harsh environ-mental factors, such as heat, cold, dust, humidity, vibration, or shock?
c. Input metering and other indicators: Are input signal-level meters easy to view and clearly labeled? Are there indicators for other important parameters, e.g., data er-rors, low power, remaining storage capacity, or other indicators of potential system failure?
d. Firmware: Is it possible to store setup configurations for later use? Do all features in firmware operate as expected? Is the firmware version easily identified? Can the firmware be updated by end-user or manufacturer?
e. Number of channels or tracks: How many channels or tracks are required for the anticipated data collection? Can aircraft noise signals be recorded simultaneously on all channels and without a performance compromise?
f. Unique features: Are there any unique features that may be designed for certain market segments, but which should never be used for aircraft noise-certification testing? For example, on-board processors or effects such as; automatic-gain-control, dynamic compression, reverberation, editing features, and pitch manipula-tion.
g If pre-emphasis and subsequent de-emphasis are to be used, is there experimental evidence that such usage has no influence on measurements of one-third-octave-band sound pressure levels at any frequency of interest?
11.0 C HE C K L IS T F OR A T E S T R E P OR T
The following is a checklist of items that should be included:
1) [ ] A flow diagram, photograph, or detailed description of the interconnection for each test setup
2) [ ] The DUT make, model, and firmware version
3) [ ] The environmental test conditions prevailing at the time of the performance-validation tests
32
4) [ ] A detailed listing of DUT operational protocols intended for aircraft noise certifica-tion testing. Relevant information includes:
a. A flow diagram of measurement system clearly labeling DUT. Cable lengths and connector types should be indicated.
b. Complete DUT settings. Include all firmware-based options and hardware control settings.
c. The calibration procedure and protocol for maintaining proper association between recordings of calibration signals and recordings of data, e.g., by a file labeling sys-tem or by ensuring that each data file includes a recording of the calibration signal.
d. The procedure for handling data recorded to the DUT, e.g., what are the procedures for data download, backup and archiving?
5) [ ] The results of the tests performed using all inputs and channels intended for aircraft noise certification testing
6) [ ] The results of tests performed on all different type of storage media intended for aircraft noise certification testing
7) [ ] The results of each test provided in the recommended format
8) [ ] Analyzer display images, detailed photographs or graphic representations, where recommended
9) [ ] Documentation for all issues relevant to the items in Section 11.0 of this Validation Protocol
10) [ ] The name and e-mail address of the technical point-of-contact for questions or re-quests for additional information
12.0 S UB MIT T AL OF T E S T R E P OR T
Submit the test report by postal mail or courier service to:
Christopher Roof Chief, Environmental Measurement & Modeling, RVT-41
U.S. Department of Transportation Volpe National Transportation Systems Center
55 Broadway Cambridge, MA, 02142
Alternatively, the test report may be submitted as an e-mail attachment sent to:

33
13.0 B IB L IOG R AP HY
AES-12id-2006, “AES Information Document for Digital Audio Measurements – Jitter Per-formance Specifications,” Audio Engineering Society, New York, NY, USA, 2006
AES17-1998, “AES Standard Method for Digital Audio Engineering – Measurement of Digital Audio Equipment,” Audio Engineering Society, New York, NY, USA, 1998 (r2004)
Bohn, Dennis, “Audio Specifications,” Rane Note #145, Rane Corporation, Mukilteo, WA, USA, 2000 (r2003)
Cabot, Richard C., “Fundamentals of Modern Audio Measurement,” J. Audio Engineering Society, Vol. 47, No. 9, Audio Engineering Society, New York, NY, USA, 1999
Dunn, Julian, 2003, “Measurement Techniques for Digital Audio,” Audio Precision Appli-cation Note #5, Audio Precision, Inc., Beaverton, OR, USA, 2003
Frenzel, Louis E., “Jitter and Its Measurement,” Electronic Design (Online ID #3781), 2001
IEEE Std 1241-2000, Institute of Electronic and Electrical Engineers, “Terminology and Test Methods for Analog-to-Digital Converters,” 2000
Metzler, R.E., “Audio Measurement Handbook,” Audio Precision, Inc., Beaverton, OR, USA, 1993
Pohlmann, Ken C., “Measurement and Evaluation of Analog-to-Digital Converters Used in the Long Term Preservation of Audio Recordings,” Library of Congress & Council on Li-brary and Information Resources, Washington, D.C., USA, 2006
Pohlmann, Ken C., “Principles of Digital Audio,” (McGraw Hill Professional, 5th edition, 2005); ISBN 0071441565