Embed Size (px)
Citation preview
1
Validation study of in-venue problem gambler indicators
Dr Anna Thomas Swinburne University of Technology
Associate Professor Paul Delfabbro
The University of Adelaide
and
Dr Andrew R Armstrong Swinburne University of Technology
Report prepared for Gambling Research Australia
February 2014

2
ACRONYMS
EGM Electronic gaming Machine
GRA gambling research Australia
PGSI Problem gambling Severity Index
VLT Video Lottery Terminal
PG problem gambler
NPG Non-problem gambler
MRG Moderate risk gambler
LRG low risk gambler
U.S. United States
SOGS South Oaks Gambling Screen
SGC Saskatchewan Gaming Corporation
PGSI Problem Gambling Severity Index
ALH Australian Hospitality and Leisure Group
3
Contents Executive Summary ........................................................................................................ 10 CHAPTER 1: Literature Review ................................................................................... 15
1.1 Background: A Public Health Approach to Problem Gambling .......................... 15
1.2 Identifying Problem Gamblers in Physical Venues: Sources of Evidence and
Indicators ....................................................................................................................... 19
1.2.1 Overview ....................................................................................................... 19
1.2.2 Studies of within-venue gambling ................................................................. 20
1.2.3 Related research: Studies of online and electronic gambling ........................ 33
1.2.4 Critique of indicator studies .......................................................................... 38
1.2.5 Indicators in policy and practice contexts ..................................................... 41
1.3 Conclusions .......................................................................................................... 49
CHAPTER 2: Stage One - Statistical Validation of the Gambling Behaviour Checklist ........................................................................................................................... 53
2.1 Methodology ........................................................................................................ 53
2.1.1 Participants .................................................................................................... 53
2.1.2 Measures ........................................................................................................ 54
2.1.3 Procedure ....................................................................................................... 55
2.2 Analytical Framework .......................................................................................... 57
2.3 Results .................................................................................................................. 61
2.3.1 EGM Gambling Behaviour over the past 12 months .................................... 62
2.3.2 Problem gambling severity ............................................................................ 63
2.3.3 Common indicators of problem gambling ..................................................... 63
2.3.4 Reliability of common indicators .................................................................. 67
2.3.5 Discriminating between problem gamblers and other customers ................. 68
2.3.6 Reliability of discriminating indicators ......................................................... 74
2.3.7 Predicting problem gambling: Logistic Regression Analysis ....................... 76
2.3.8 Reliability of Predictors ................................................................................. 82
2.3.9 Refining the model and determining severity of indicators .......................... 84
2.4 Discussion and Conclusions ................................................................................. 88
2.4.1 What do problem gamblers do in venues? Common indicators .................... 88
2.4.2 How do we discriminate between problem gamblers and other customers? 89
2.4.3 Predicting gambling problems ....................................................................... 92
2.4.4 Levels of severity in indicators ..................................................................... 93
4
CHAPTER 3: Stage Two – Practical Validation of the Gambling Behaviour Checklist ........................................................................................................................... 97
3.1 Methodology ....................................................................................................... 97
3.1.1 Participants .................................................................................................... 97
3.1.2 Measures ........................................................................................................ 98
3.1.3 Procedure ..................................................................................................... 100
3.1.4 Process of analysis ....................................................................................... 103
3.2 Results ............................................................................................................... 105
3.2.1 Usefulness of the Gambling Behaviour Checklist ..................................... 105
3.2.2 Individual item analysis .............................................................................. 112
3.2.3 Impediments to identification ..................................................................... 117
3.2.4 Outcomes of identification ......................................................................... 120
3.2.5 Potential improvements to the checklist ..................................................... 130
3.2.6 Refinements to the Gambling Behaviour Checklist (GBC-EGM): The
GBC-EGM-SV for Staff in Victoria, GBC-EGM-S for Saff elsewhere, and GBC-
EGM-R for Researchers .......................................................................................... 142
3.2.7 Strategies for successful implementation ................................................... 153
3.3 Discussion and Conclusions .................................................................................. 157
3.3.1 Usefulness .................................................................................................. 158
3.3.2 Individual item analysis ............................................................................... 159
3.3.3 Practical difficulties with the checklist ....................................................... 160
3.3.4 Outcomes of identification .......................................................................... 161
3.3.5 The GBC-EGM-S, SV and R: Revised checklists for EGM staff and
researchers ............................................................................................................... 162
3.3.6 Successful implementation .......................................................................... 163
3.3.7 Limitations and future research ................................................................... 164
REFERENCES .............................................................................................................. 169 APPENDIX A: Tables of Results from Stage One ..................................................... 177
A.1 The prevalence of single indicators ................................................................... 177
A.1.1 Frequency, Duration and Intensity Indicators ............................................ 177
A.1.2 Indicators of Impaired Choice or Control .................................................. 180
A.1.3 Social Indicators of Problem Gambling ..................................................... 181
A.1.4 Indicators related to Raising Funds or Chasing Behaviour ........................ 183
A.1.5 Emotional and Physiological Indicators of Problem Gambling ................. 185
A.1.6 Other Behavioural Indicators ..................................................................... 188
5
A.2 Relative probabilities of behaviours: ................................................................. 190
A.2.1 Comparison of problem vs non-problem gamblers ................................... 190
A.2.2 Comparisons across other risk levels ......................................................... 192
A.3 Logistic Regression Analysis of Indicator Clusters .......................................... 195
A.3.1 Initial models: Predicting problem gambler status within each group of
indicators ................................................................................................................. 195
A.3.2 Further modeling: Predicting risky gambling ............................................. 197
APPENDIX B: The Gambling Behaviour Checklist .................................................. 201 The Gambling Behaviour Checklist ............................................................................ 202
Instructions for staff .................................................................................................... 202
GBC-EGM-SV: The Gambling Behaviour Checklist for EGM Staff in Victoria ...... 203
GBC-EGM-S: The Gambling Behaviour Checklist for EGM Staff ........................... 204
GBC-EGM-R: The Gambling Behaviour Checklist for EGM Researchers ............... 205
List of Tables
Table 1: Top 15 Indicators of problem gambling status ................................................ 23 Table 2: Clusters of gambling behaviour ....................................................................... 25 Table 3: Behaviours and reactions while gambling ....................................................... 26 Table 4: Probability of behaviour or indicators: Problem vs. non-problem gamblers .... 30 Table 5: Probability of a person being a problem gambler ............................................ 32 Table 6: Responsible gambling codes of practice by jurisdiction ................................. 43 Table 7: Table of Demographics ................................................................................... 53 Table 8: Frequency of EGM gambling over the past 12 months .................................. 62 Table 9: Percentage of participants in each risk category ............................................ 63 Table 10: Intensity and duration behaviours commonly displayed by problem gamblers ...................................................................................................................................... 64 Table 11: Indicators of impaired choice or control commonly displayed by problem gamblers ........................................................................................................................ 65 Table 12: Raising funds and chasing indicators commonly displayed by problem gamblers ........................................................................................................................ 65 Table 13: Emotional and physiological indicators commonly displayed by problem gamblers ........................................................................................................................ 66 Table 14: Common visible indicators in problem gamblers 2013 v 2007 ..................... 67 Table 15: Behaviours at least twice as likely to be shown in problem gamblers compared to non-problem gamblers ............................................................................. 69 Table 16: Behaviours at least twice as likely to be shown in problem gamblers compared to moderate risk gamblers ............................................................................ 72 Table 17: Behaviours at least twice as likely to be shown in high risk gamblers (PG-MRG) compared to lower risk gamblers (not previously identified) ............................... 73 Table 18: Comparative problem/ non-problem gambler risk ratios: 2013 vs 2007 study ...................................................................................................................................... 75

6
Table 19: Final model: Overall best independent predictors of problem gambler status ...................................................................................................................................... 77 Table 20: Final model: Overall best predictors of problem gambler status for males .. 78 Table 21: Final model: Overall best predictors of problem gambler status for females78 Table 22: Probability of being classified as a problem gambler (overall) ..................... 79 Table 23: Probability of being classified as a problem gambler (males only) .............. 79 Table 24: Probability of being classified as a problem gambler (females only) ........... 79 Table 25: Predictors of being currently classified as a problem gambler: Comparison of 2007 final model for males: 2007 vs 2013 data ............................................................ 82 Table 26: Predictors of being currently classified as a problem gambler: Comparison of 2007 final model for females: 2007 vs 2013 data ......................................................... 83 Table 27: Gambling Behaviour Checklist for use in EGM venues (GBC-EGM) showing item severity flags .......................................................................................................... 87 Table 28: Pilot Gambling Behaviour Checklist for EGM Staff in Victoria (Pilot GBC-EGM-SV) ....................................................................................................................... 99 Table 29: Gambling Behaviour Checklist: Items that were new to staff ...................... 110 Table 30: Gambling Behaviour Checklist: Item observability and frequency .............. 114 Table 31: Descriptive statistics for follow-up actions by staff and precipitating problem behaviours by severity classes ................................................................................... 122 Table 32: Repetitious item groupings according to staff ............................................. 132 Table 33: Gambling Behaviour Checklist: Difficult to observe items ........................... 133 Table 34: Gambling Behaviour Checklist: Additional behaviours suggested by staff for inclusion and the closest relatable existing items ....................................................... 137 Table 35: Refinement of the Pilot into the Final Gambling Behaviour Checklist for Staff in Victoria (GBC-EGM-SV) .......................................................................................... 144 Table 36: The Gambling Behaviour Checklist ............................................................. 150 Table 37: N (%) of gamblers engaging in everyday gambling ................................... 177 Table 38: N (%) of gamblers who reported they gambled for three or more hours without a proper break ................................................................................................ 177 Table 39: N (%) of gamblers who reported gambling for 5+ hours without a proper break ........................................................................................................................... 177 Table 40: N (%) of gamblers who reported gambling so intensely that they lost track of things going on around them ....................................................................................... 178 Table 41: N (%) of gamblers who reported gambling very fast ................................... 178 Table 42: N (%) of gamblers who reported betting $2.50+ per spin most of the time 178 Table 43: N (%) of gamblers who reported playing on without stopping to listen to jingle ............................................................................................................................ 178 Table 44: N (%) of gamblers who reported rushing from one machine to another .... 179 Table 45: N (%) of gamblers who reported gambling on more than one machine at a time .............................................................................................................................. 179 Table 46: N (%) of gamblers who reported gambling continuously ............................ 179 Table 47: N (%) of gamblers who reported spending more than $300 in a session of gambling ...................................................................................................................... 179 Table 48: N (%) of gamblers who reported significantly changing their expenditure pattern ......................................................................................................................... 180 Table 49: N (%) of gamblers who reported gambling when the venue was closing ... 180 Table 50: N (%) of gamblers who reported gambling through meal times ................. 180 Table 51: N (%) of gamblers who reported finding it difficult to stop at closing time .. 180 Table 52: N (%) of gambler who reported trying obsessively to win on a machine .... 181 Table 53: N (%) of gamblers who reported gambling as the venue was opening ...... 181 Table 54: N (%) of gamblers who reported asking staff to tell others they were not at venue ........................................................................................................................... 181 Table 55: N (%) of gamblers who reported having friends or relatives call into venues .................................................................................................................................... 181 Table 56: N (%) of gamblers who reported acting rudely or impolitely to staff ........... 182

7
Table 57: N (%) of gamblers who avoided social contact .......................................... 182 Table 58: N (%) of gamblers who reported staying to play while friends had left venue .................................................................................................................................... 182 Table 59: N (%) of gamblers who reported becoming angry if someone too their spot .................................................................................................................................... 182 Table 60: N (%) of gamblers who reported bragging about winning .......................... 183 Table 61: N (%) of gamblers who reported standing over other players to get spot .. 183 Table 62: N (%) of gamblers who reported getting cash out 2 or more times at venue .................................................................................................................................... 183 Table 63: N (%) of gamblers who reported changing large notes at venue ............... 183 Table 64: N (%) of gamblers who reported borrowing money from others at venue .. 184 Table 65: N (%) of gamblers who reported asking for a loan or credit at venue ........ 184 Table 66: N (%) of gamblers who reported putting large amounts back into machine .................................................................................................................................... 184 Table 67: N (%) of gamblers who reported leaving the venue to find money ............ 184 Table 68: N (%) of gamblers who reported rummaging around for more money ....... 185 Table 69: N (%) of gamblers who reported running out of all their money ................. 185 Table 70: N (%) of gambler who reported using the coin machine 4+ times .............. 185 Table 71: N (%) of gamblers who reported shaking while gambling .......................... 185 Table 72: N (%) of gamblers who reported sweating a lot while gambling ................ 186 Table 73: N (%) of gamblers who reported feeling nervous / edgy ............................ 186 Table 74: N (%) of gamblers who reported displaying their anger in venues ............. 186 Table 75: N (%) of gamblers who reported kicking or striking machines ................... 186 Table 76: N (%) of gamblers who reported feeling sad or depressed ........................ 187 Table 77: N (%) of gamblers who reported crying after losing a lot of money ........... 187 Table 78: N (%) of gamblers who reported sitting with head in hands after losing .... 187 Table 79: N (%) of gamblers who reported playing machines very roughly ............... 187 Table 80: N (%) of gamblers who reported groaning repeatedly while gambling ....... 188 Table 81: N (%) of gamblers who reported feeling a significant change in mood during sessions ...................................................................................................................... 188 Table 82: N (%) of gamblers who reported gambling after drinking a lot of alcohol ... 188 Table 83: N (%) of gamblers who reported avoiding the cashier ............................... 188 Table 84: N (%) of gamblers who reported a decline in grooming/ appearance ........ 189 Table 85: N (%) of gamblers who reported blame venues or machines for losing ..... 189 Table 86: N (%) of gamblers who complain to staff about losing ............................... 189 Table 87: N (%) of gamblers who reported that they swear at machines/ staff if they lose .............................................................................................................................. 189 Table 88: N (%) of gamblers who reported that they compulsively rub machines ..... 190 Table 89: Comparison of problem and non-problem gamblers on behaviours shown .................................................................................................................................... 190 Table 90: Self-report prevalence of indicators by risk level ........................................ 192 Table 91: Intensity and frequency indicators of problem-gambler status ................... 195 Table 92: Impaired control indicators of problem-gambler status .............................. 195 Table 93: Social behavioural indicators of problem-gambler status ............................ 196 Table 94: Raising funds indicators of problem gambler status .................................. 196 Table 95: Emotional responses as indicators of problem gambler status .................. 196 Table 96: Other behaviours as indicators of problem gambler status ........................ 196 Table 97: Intensity and frequency indicators of at least moderate risk status ............ 197 Table 98: Impaired control indicators of at least moderate risk status ....................... 197 Table 99: Social behavioural indicators of at least moderate risk status .................... 198 Table 100: Raising funds indicators of at least moderate risk status ......................... 198 Table 101: Emotional responses as indicators of at least moderate risk status ........ 198 Table 102: Other behaviours as indicators of at least moderate risk status ............. 198 Table 103: Final model: Overall best predictors of problem + moderate risk status .. 199

8
Table 104: Final model: Overall best predictors of problem + moderate risk status (males only) ................................................................................................................. 199 Table 105: Final model: Overall best predictors of problem + moderate risk status (females only) .............................................................................................................. 199 Table 106: Probability of being classified as at least a moderate risk gambler (overall) .................................................................................................................................... 200 Table 107: Probability of being classified as at least at moderate risk gambler (males only) ............................................................................................................................. 200 Table 108: Probability of being classified as at least a moderate risk gambler (females only) ............................................................................................................................. 200

9
Acknowledgements
We would like to thank Ms Ligia Yap who provided invaluable support to the project
during the recruitment for Stage One.
We would like to extend sincere thanks to the venue support workers who happily gave
their time as well as their considerable experience and expertise in training venue staff
in identifying problem gamblers using the 2007 version of the behavioural checklist.
They also provided valuable insights into some of their training techniques and were
generous in sharing some training materials. We would also like to thank them for
assisting us in identifying potential venues with staff who had not yet received their
training.
We would like to thank all the participants who contributed to the study including the
many regular gamblers who willingly gave of their time, and the staff and venue
managers who piloted the checklist and provided feedback. We would also like to thank
the Australian Hospitality and Leisure Group (ALH) for providing access to their
venues.
10
Executive Summary Overview
• The principal aims of the project were twofold and these were investigated in
two stages:
o Stage One sought to validate a set of problem gambling behavioural
indicators developed in 2007 by Delfabbro, Osborn, Nevile, Skelt and
McMillen to identify people who were experiencing problems with
gambling (in particular, with electronic gaming machines).
o Stage Two sought to assess the practical validity of a measure derived
from these findings, the Gambling Behaviour Checklist (GBC-EGM),
when applied by current EGM venue staff as a tool for identifying and
assisting at-risk customers.
• Chapter 1 of the report provides a review of the literature and policy relevant to
the identification of problem gamblers. Chapter 2 details Stage One and
Chapter 3 details Stage Two.
Key Findings from Stage One: Validation of a set of problem gambling indicators
• The Checklist of Visible Indicators, developed by Delfabbro et al. in 2007 was
validated against a 2013 sample of over 500 regular (fortnightly +) EGM
gamblers across Australia.
• Almost all 52 indicators were more likely to be reported by problem gamblers
than lower risk gamblers in both the 2007 and 2013 samples.
• The extent to which the indicators differentiated between PGSI-classified
problem gamblers and non-problem gamblers in the 2013 sample was very
highly correlated with the ratios observed in the 2007 sample;
• The strongest indicators included the rarest behaviours reported by regular
gamblers. These behaviours can be considered hallmarks of problem gambling
11
(e.g. customer asks for credit or loans; displays visible deteriorations in
personal appearance; conceals presence at venue; is rude to staff; or if friends
or relatives contact the venue looking for the customer).
• As in the 2007 study, the 2013 investigation also confirmed the existence of
other indicators that were more commonly observed amongst all players, but
which were more frequently observed amongst problem gamblers. Such
indicators were considered less definitive on their own, but were considered
indicative of problem gambling when observed in clusters. Examples included:
looking sad and depressed, leaving the venue to find money, betting relative
large sums per spin, replaying wins, or gambling through meal times.
o For men, additional indicators included avoiding contact with others,
physically shaking while gambling, and gambling for long periods
without a break.
o For women, additional indicators included avoiding the cashier, and
gambling intensely without reacting to what was going on around them.
• The presence of 4-5 indicators successfully identified of problem EGM
gamblers with a high degree of probability (80%+).
• The 52-item Likert-scored Checklist of Visible Indicators was transformed into
the briefer and quicker to use 36-item Gambling Behaviour Checklist (the GBC-
EGM) for use in situ by EGM staff.
Key Findings from Stage Two: Practical validation of the Gambling Behaviour
Checklist
• To examine the practical validity of the GBC-EGM, a version modified for staff
working the Victorian EGM environment was piloted over a three month period
in Melbourne hotels, with staff using it as part of their normal protocols to assist
in identification of possible problem gamblers.
12
• Following the three month pilot period, focus groups were conducted with
eleven gaming staff located in the three venues to explore the usefulness of the
checklist as a tool to assist in the identification of problem gamblers.
• Staff described the pilot GBC-EGM as clearly presented, relevant and
comprehensive.
• For experienced staff, the checklist facilitated quick and easy identification of
problem gamblers, reminding them at a glance of problem behaviours. For less
experienced staff (<2 years EGM experience), the checklist assisted in
proactive identification of problem behaviours, and increased confidence when
managing customers.
• Use of the checklist was linked to improved customer observation and
awareness of problem behaviours that were previously unknown to staff.
• Most checklist behaviours were considered easy to observe by almost all staff,
especially those relating to gambling intensity and duration, EFTPOS use,
customer aggression towards other customers, and superstitious rituals.
• A small number of checklist behaviours were considered more difficult to
observe. These included: the rarest behaviours (which were also the strongest
problem gambling indicators, e.g. asking for credit or loans); those less obvious
to staff without specific training (e.g. friends or relatives contacting venue to
locate customer); and those requiring greater than normal customer attention or
customer knowledge (e.g. observing a spending pattern increase).
• The observability of some behaviours were location dependent (e.g. Bets $3
per spin required staff to be on the gaming floor) or shift dependent (e.g.
observing patrons having difficulty stopping at closing time). Busy periods
limited observation of behaviours requiring sustained observation (e.g.
observing customers staying on to gamble after friends left the venue).
13
• Staff usually observed around 10 checklist behaviours in a customer before
responding with a follow-up action. Staff actions were more likely to follow
observation of multiple higher severity behaviours than lower severity
behaviours.
• Staff typically followed up with a general chat and put the customer under
further observation, which is consistent with current Victorian staff training. It
was uncommon for staff to say they consulted with senior staff about customer
behaviour, and rare for them to approach customers directly about their
problem behaviour unless the customer was threatening other patrons or
property.
• There is a clear need for formal and informal staff training in identification and
intervention as part of normal work practice. Use of the checklist within training
will increase staff awareness of the range of indicators, the need to consider the
context of behaviours, and the need to begin interventions early.
• Following analysis of staff feedback, the GBC-EGM was further refined into the
30-item GBC-EGM-SV for staff in Victoria, and the 32-item GBC-EGM-S for
staff in other jurisdictions or countries. These versions enhanced checklist
usability for staff through enhancing its brevity and simplicity as applied under
typical working conditions. The 38-item GBC-EGM-R for researchers was also
developed on the basis of the findings which prioritises breadth of behaviours
over brevity.
Conclusions
• In this evaluation, key visible problem gambling indicators were identified and
validated across multiple samples. The prevalence of these indicators in
different gambler-risk groups and the extent to which they discriminate between
them were established.
14
• This information was used to develop the Gambling Behaviour Checklist. The
checklist was shown to assist staff to observe, consolidate information and act
on customers exhibiting multiple problem gambling behaviours before they
asked for help.
• Integration of the checklist into gambling venues would appear to improve staff
capacity to identify problem gambling behaviours, and subsequently act to
minimise customer harm and enhance customer safety.
• The evaluation has provided a valuable evidence base to support the
translation of problem gambling theory into staff practice under real working
conditions.
15
CHAPTER 1: Literature Review
1.1 Background: A Public Health Approach to Problem Gambling
Despite some declines over the last decade, gambling remains a very popular leisure
activity in Australia. Around 70% of the population gambles at least once per year and
over 10% participate on a weekly basis. Australians spend over $19 billion annually on
gambling with approximately 60-70% of this attributable to electronic gaming machines
(EGMs) located in casinos, pubs and clubs (Delfabbro, 2011; Productivity Commission,
2010). At the time of writing, there were over a dozen casinos in Australia and more
than 5000 gambling venues.
Problem gambling on EGMs is especially high when compared to other forms of
gambling. Approximately 600,000 or 4% of Australian adults play EGMs at least weekly
(Productivity Commission, 2010). While survey results vary, around 15% (90,000) of
these weekly players are considered problem gamblers. An additional 15% (90,000)
are at moderate risk of becoming problem gamblers. These rates are much higher than
the prevalence of problem (0.69%) and moderate-risk (1.67%) gamblers amongst the
total population of Australian adults who gamble. Illustrating the extent of the issue,
problem and moderate-risk gamblers account for around 41% and 19% of EGM
spending respectively. This amounts to 60% or $7.2 billion of total EGM expenditure
(Productivity Commission, 1999, 2010).
Problem gambling is defined in terms of both behaviour and consequences. It is
characterised by difficulties in limiting the amount of time and/or money spent on
gambling whereby these difficulties result in harmful consequences for the gambler,
their family and friends, or for the community (Neal, Delfabbro, & O’Neil, 2005).
Adverse consequences typically involve financial problems including mortgage
foreclosure, inability to pay bills, rent or purchase essentials, such as food, and

16
relationship breakdown. These harms extend to the family and friends of people who
experience problem gambling. Work performance is often affected, resulting in
absenteeism and potential job loss. Clinical distress is frequently reported, with suicide
attempts in the worst cases. Problems can extend from legal to criminal issues when
debts remain unpaid, or when theft or domestic violence result from financial or
emotional strain (American Psychiatric Association, 2000; Productivity Commission,
2010).
In the past, the most common Government response to these documented negative
consequences has been to provide funding for treatment services. However, in
recognition of the fact that only a minority of problem gamblers (< 10%) seek formal
assistance for their problems (Delfabbro, 2011; Productivity Commission, 2010); an
increasing policy emphasis has been placed on prevention. Legislation and policy is
now more specifically directed towards finding ways to prevent harm before it occurs.
In general, this philosophy is consistent with a ‘public health’ approach to social and
health problems which are now favoured by most Governments in Western countries
(Brown, 2000; Brown and Raeburn, 2001; Griffiths, 2004; Korn and Shaffer, 1999).
Although the term ‘public health’ has different definitions, it refers to a preference
towards the development of broader or whole-of-population strategies to reduce the
risks of harmful behaviour. Public health approaches typically divide policies and
practices into three categories: primary, secondary and tertiary. Tertiary services are
those which provide assistance to those already affected by a disease or disorder and
include hospitals and the treatment services described above. Secondary interventions
assist those already involved in the behaviour likely to cause harm, whereas primary
interventions attempt to prevent the potentially problematic behaviour before it begins.
In the area of gambling policy, different State Governments have spent large amounts
of money on both tertiary and primary intervention strategies, with the latter usually
taking the form of expensive mass media campaign to warn people about the dangers

17
of problem gambling1. In recent years, however, a greater focus has been upon
secondary intervention strategies to assist those who might be at risk of gambling-
related harm. Usually described as ‘responsible gambling initiatives’, these measures
usually involve two components. The first involves an appeal to existing gamblers to
gamble in a way that minimizes harm (e.g., “Think of what you are really gambling
with’), whereas the second places an emphasis on the responsibilities of the industry to
provide products and venues that are safer and less likely to lead to harm (Griffiths,
Wood, Parke and Parke, 2007; IPART, 2005; McMillen and Pitt, 2005; Productivity
Commission, 2010).
In an industry context, such responsible gambling policies have taken many forms
ranging from corporate duty-of-care statements to stated policy guidelines, voluntary
codes to mandatory policies legislated and endorsed by State laws (Delfabbro, Osborn,
Nevile, Osborn, and Skelt, 2007). Included within these guidelines or policies have
been a variety of provisions, including restrictions on the availability of gambling to
minors, bans on credit, limitations on automatic teller machine (ATM) withdrawals, staff
training and the promotion of help service information usually via posters, flyers and
cards in venues. In many countries, gamblers can also make applications to have
themselves excluded from entry into venues if they believe that they cannot control
their gambling (Hing, Nisbet, and Nuske, 2010; McMillen and Toms, 2006; Productivity
Commission, 2010).2
1 Earlier campaigns in the 1990s usually focused on getting people to seek help, whereas more recent campaigns try to encourage greater awareness of the potential dangers of excessive gambling and the value of ‘responsible gambling’. 2 Such provisions have also extended to the provision of online gambling services (Gainsbury, 2011; Griffiths, 2003). For example, eCOGRA (e-Commerce and Online Gambling Regulation and Assurance) is an independent UK-based company that has set standards and guidelines for the responsible provision of egambling services. Online gambling providers can apply for accreditation via eCOGRA based on their inclusion of various responsible gambling provisions, including age-restrictions, links to support service websites, cooling off periods, self-exclusion and player account information.
18
Most of these provisions are reactive in the sense that the industry’s actions are
dictated largely by compliance with broader legislative requirements or responses to
gambler-initiated requests for assistance (Hancock, Schellinck, & Schrans, 2008).
However, as both Griffiths (2009), and Delfabbro, King and Borgas (2011) have
recently pointed out, there is now greater emphasis (both in policy and legislation) on
the extent to which the industry should take a proactive role in identifying and assisting
people before any action is taken by gamblers themselves. In land-based forms of
gambling, this form of proactive intervention implies that venue staff should take steps
to intervene in situations where they have reasonable grounds on which to suspect that
a person might be experiencing problems. In some situations this may be
uncontroversial - if the person is showing obvious signs of distress, acting in a violent
or destructive manner, or admits to experiencing problems with gambling. However, it
is less clear when, and if, staff should respond when they have only a suspicion that a
person has a problem with their gambling.
Accordingly, it is these more ambiguous situations that have given rise to both policy
and research interest in the extent to which venue staff might be able to identify
problem gamblers before they seek help. What sort of indicators or behaviours should
be used; how should this information be used; and, to what extent are venue staff able
to use this information to make effective early interventions? In the following sections,
we review the best available evidence concerning the behavioural profiling of problem
gamblers and how it might be used. Included in this review will be a discussion of the
logistical challenges associated with applying this information in practice as well as
examples of industry groups or venues that have attempted to incorporate indicators
into their staff training and responsible gambling policies.
19
1.2 Identifying Problem Gamblers in Physical Venues: Sources of Evidence
and Indicators
1.2.1 Overview
Most research into gambling over the last three decades have been on self-report
methods. Relatively less attention has been directed towards understanding the extent
to which gambling behaviour can be observed in situ. Despite this, there are now
several studies and reviews (e.g., Allcock, 2002; Delfabbro, Osborn, Neville, McMillen,
& Skelt, 2007; Delfabbro, Kin, & Griffiths, 2012) that have provided evidence that
gambling behaviours are often visible or observable in venue environments so that it
might be possible for staff to identify people at greater risk of gambling problems. In
the sections that follow, we summarise the contents of earlier literature produced prior
to 2007 along with a summary of the Delfabbro et al. (2007) report and other related
research that has emerged between 2007 and 2013.
In both of the earlier reviews by Delfabbro and colleagues (Delfabbro et al., 2007,
2012), it was pointed out that the literature in this area is relatively small and is
characterised by a diversity of methodologies and variables, so that it is not possible to
conduct any formal ‘critical review’ or meta-analytical analysis of the findings.
Nevertheless, following the methods employed by Delfabbro et al. (2012), literature
concerning this topic for the present review was sought using a number of search
strategies. This included: (a) A keyword search of major databases including
PsychINFO, Scopus, and ISI Web of Knowledge using terms such as ‘identifying/
identification * problem gamblers/ing, ‘behavioural profiling’, ‘detection’, ‘indicators’, and
(b) Google searches using the same key terms, and (c) The authors’ knowledge of
previous studies and reviews of the area, conference presentations and experts in the
area.
20
1.2.2 Studies of within-venue gambling
As pointed out by Delfabbro et al. (2012), the first major report relating to this topic was
developed with the support of the Australasian Gaming Council (AGC) in 2002. The
AGC review was not a research project, but a compilation of submissions from a
variety of Australian and international experts working in research or clinical practice3
(Allcock, 2002). The principal focus of the Allcock review was on behaviour in venues.
Contributors were asked to comment on whether there were observable indicators that
might reliably be used to differentiate problem gamblers from recreational gamblers in
venues. They were also asked to state their views on the practical utility of this
knowledge and how knowledge concerning the validity of indicators could be enhanced
by future research. Most of the contributors identified indicators that they believed
could be used, but most were pessimistic about how well staff could apply this
knowledge given the various practical constraints associated with working in venue
environments (Allcock, 2002; Blaszczynski, 2002; Ladouceur, 2002; Lesieur, 2002).
These concerns related principally to the (i) visibility of behaviour in larger venues, (ii)
consistency of observers, (iii) ability of staff to provide meaningful insights into
pathological behaviour, and (iv) duration of observation periods. For example, as some
authors pointed out, if staff changed shifts reasonably frequently, then concerns were
raised about whether staff could observe individual customers for a sufficient duration
to develop a good knowledge of their behaviour.
Although containing a wealth of information concerning the possible range of indicators
that might be used, the 2002 report made no attempt to consolidate this information in
way that would enable it to be used in research or in practice. Instead, this task
remained to be completed by subsequent empirical studies, each of which was to
develop and test their own comprehensive list of indicators and behaviours.
3 The contributors included experienced researchers and /or clinical including Professors Lesieur, Blaszczynski, Ladouceur, Dr. Clive Allock amongst others.
21
The first of these studies was undertaken by Schellinck and Schrans (2004) in Nova
Scotia. In this study, data was collected from a sample of 927 video lottery terminal
(VLT) gamblers, 16.5% of whom were problem gamblers on the Focal Gambling
Screen. A range of indicators were presented and respondents were asked to indicate
how often they had experienced each symptom. Gamblers were asked to indicate how
often these symptoms occurred when they gambled on a 5-point scale4. Other
questions related to the reported frequency of gambling in the four months prior to the
study and the number of venues that had been visited (Delfabbro et al., 2012).
The results in this study were prepared using a technique called association analysis.
Association analysis is a technique often used in marketing and polling research to
enable researchers to determine the probability of a given event occurring (e.g., in this
case a problem gambler being identified) based on a combination of cues being
detected at a given point in time. Each analysis requires the calculation of a number of
variables. The first of these is the relative likelihood of problem and non-problem
gamblers ever reporting a particular event. A second stage then involves weighting the
data by the percentage of occurrences on which gamblers reported having displayed
the behaviour5.
Shellinck and Schrans (2004) showed that indicators could be differentiated along two
dimensions: lift and frequency. They observed, for example, that some indicators had a
very high lift value in the sense that they were clearly factors that were much more
common in problem gamblers than other gamblers. Indicators could also vary in
relation to how often they were reported to occur when problem gamblers visited a 4 The 5-point scale was rated 0 = ‘Never’, 1 = ‘Rarely or less than 25% of occasions’, 2 = ‘Occasionally or 25-50% of the time’, 3 = ‘Frequently or 50% or more occasions’, and 4 = ‘Always or 100% of the time’. 5 Range is 0% to 100%, but based on recoding the ordinal categories described to 0-8 with 8 = 100%. The frequency of visitation to venues could be as frequent as once every four months to once every day (120 times). Accordingly, for every indicator it was therefore possible to assign a weight ranging from 8 to 960, where 8 = indicator occurred once (effectively 100% on 1 occasion) to 960 (every 120 visits). If all of these visits occurred at the one venue, a weight of 960 would be assigned, but if the person divided their regular visits equally between two venues, then the number of visits was halved on the assumption that any one location would only observe half of the instances. These weights were assigned to the percentages reporting each behaviour to calculate confidence ratings that indicated the likelihood of a person being a problem gambler if a particular indicator had been observed
22
venue (The 15 most commonly reported as summarised in Table 1). Based on their
analyses, the authors found that the most common experiences or behaviours reported
by problem gamblers in terms of frequency were spending three-quarters of their time
gambling, gambling for more than 180 minutes in one session, feeling angry, and
sweating. Feeling sick or sad or gambling for over 180 minutes in one session were the
factors that most strongly differentiated problem gamblers from other gamblers. For
example, a person was around three times more likely to be a problem gambler as
compared with the base-rate in the sample if they reported feeling sick while gambling
(as indicated by the lift value). Some indicators (using credit cards, shaking, going out
to get cash) were more commonly reported by problem gamblers, but were much less
commonly observed when non-problem gamblers played VLTs (as indicated by the
percentage of problem gambler visits during which a given indicator was likely to be
observed) (Delfabbro et al., 2012).

23
Table 1: Top 15 Indicators of problem gambling status
Indicator Confidence % PG visits Lift Feels sick to stomach/ nauseous
78.59
16.72
2.95
Feels sad/ depressed 74.50 29.08 2.80 Gambles for over 180 minutes per session
66.91 36.34 2.51
Borrows money to gamble 63.68 8.72 2.39 Gets the shakes 63.00 4.97 2.37 Has sweaty palms/ body 62.85 25.05 2.36 Feels edgy, nervous 62.53 22.72 2.35 Gets headaches 60.85 25.94 2.29 Gets out more cash to gamble with 58.67 7.93 2.21 Gambles for over 120 minutes per session
54.28 51.54 2.04
Spends ¾ of their time gambling 54.00 75.02 2.03 Uses credit card to gamble 53.64 2.52 2.02 Playing two VLTs at same time 53.03 10.16 1.99 Feels angry 52.83 32.36 1.99 Gets dry eyes 52.31 16.49 1.97 (from Schellinck & Schrans, 2004) Note: Confidence refers to the probability that a person could be classified as a problem gambler given the presence of a single self-reported indicator
The results further revealed that confidence ratings could be increased substantially by
considering more than one indicator together. For example, if one considered feeling
sick and ‘cashed a cheque’ together, the confidence rating would increase to 99%.
High ratings could also be obtained if only visible cues such as playing more than 180
minutes and cashing a cheque in combination were examined. For this combination,
the confidence ratings increased to 90%. If one combined gambling for 180+ minutes
and ‘jammed the machine for continuous play’ and gambled three-quarters of the time,
the confidence rating was 95%, and similarly high confidence ratings could be obtained
based on a variety of different variable combinations. However, as the authors pointed
out, the difficulty with these combinations was that the estimated probability of these all
occurring at the same time was quite low (usually only around 5% or less for most
24
combinations). These findings therefore suggested that the same problem gambler was
unlikely to display multiple behaviours at any one location. Despite this, the results
showed that if one could observe the best two-three indicator combinations (i.e. that
yielded confidence ratings of 90%+), one would likely to be correct on 94% of
occasions; only 6% of non-problem gamblers would be falsely approached (false
positives) based on the use of indicators.
As Delfabbro et al. (2012) point out, while these findings are of interest in that they
allow some differentiation between the behaviours of problem gamblers and other
gamblers, there are several ways in which the study could be extended and re-
examined. Only a relatively narrow range of behaviours and indicators were considered
and many of these were either not visible or not applicable to some jurisdictions (e.g.,
in Australia, the provision of credit in venues, and gambling on two machines is not
allowed6). A second issue is the assumption of the model used. While it appears very
sensible to weight the indicators based on the relative number of visits to venues and
the percentage of times with which they occur, this assumes that the likelihood of
behaviour being detected on any one occasion increases the more often a person
gambles and the more frequent the indicator. It does not consider the possibility that
some venues may be able to accumulate information about players across multiple
visits. Some indicators might be detected and noted on one occasion, whereas others
could be observed on other days. Some venues or casinos, if they have a good
knowledge of certain regular customers may be able to maintain files or logs relating to
certain players and base their identification of problem gamblers on observations
collected over an extended period.
Such a possibility was considered in a study subsequently conducted by Hafeli and
Schneider (2006) in Switzerland. In this research, qualitative interviews were
6 Although not permitted, these behaviours can sometimes still occur if venue staff are not sufficiently vigilant.
25
conducted with a sample of 28 problem gamblers, 23 casino employees and seven
regular gambling customers in an attempt to develop a range of indicators that might
be used to identify problem gamblers within Swiss casinos. Material from these
interviews was content analysed and classified into meaningful categories. Only
statements that were simple and concise, and which referred to concrete examples of
behaviour were included. The final checklist comprised 39 items (Identified, although
not the exact wording in Table 2 and 3). Each item was scored “Applicable” and “Not
applicable” and organised into six specific clusters of behaviour. Some of these were
specific to table games or electronic gaming machines (EGMs), whereas others related
to any form of gambling.
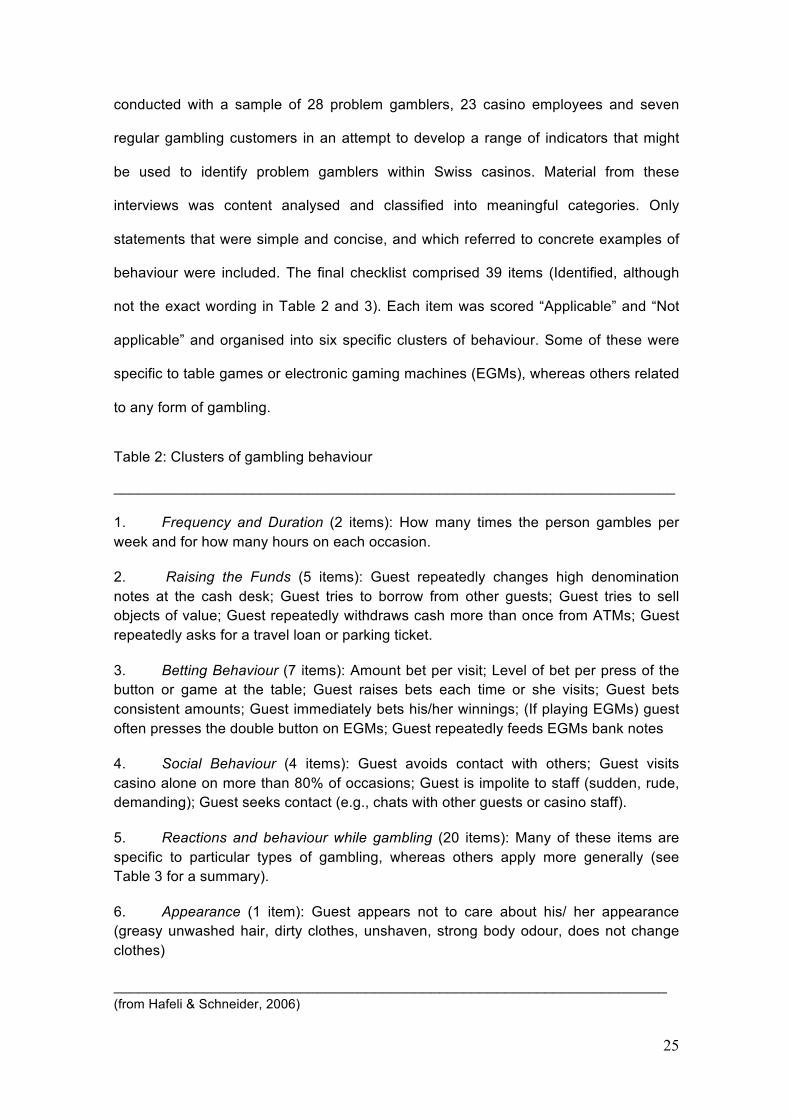
Table 2: Clusters of gambling behaviour
_____________________________________________________________________
1. Frequency and Duration (2 items): How many times the person gambles per week and for how many hours on each occasion.
2. Raising the Funds (5 items): Guest repeatedly changes high denomination notes at the cash desk; Guest tries to borrow from other guests; Guest tries to sell objects of value; Guest repeatedly withdraws cash more than once from ATMs; Guest repeatedly asks for a travel loan or parking ticket.
3. Betting Behaviour (7 items): Amount bet per visit; Level of bet per press of the button or game at the table; Guest raises bets each time or she visits; Guest bets consistent amounts; Guest immediately bets his/her winnings; (If playing EGMs) guest often presses the double button on EGMs; Guest repeatedly feeds EGMs bank notes
4. Social Behaviour (4 items): Guest avoids contact with others; Guest visits casino alone on more than 80% of occasions; Guest is impolite to staff (sudden, rude, demanding); Guest seeks contact (e.g., chats with other guests or casino staff).
5. Reactions and behaviour while gambling (20 items): Many of these items are specific to particular types of gambling, whereas others apply more generally (see Table 3 for a summary).
6. Appearance (1 item): Guest appears not to care about his/ her appearance (greasy unwashed hair, dirty clothes, unshaven, strong body odour, does not change clothes)
____________________________________________________________________ (from Hafeli & Schneider, 2006)
26
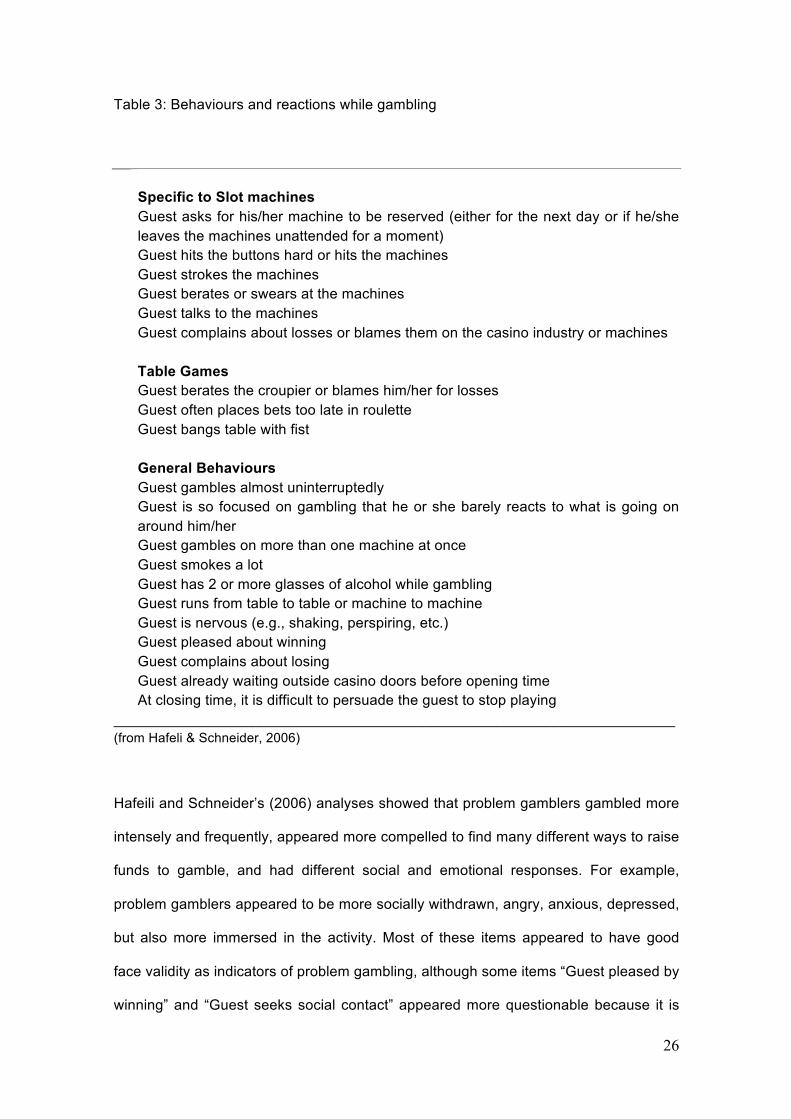
Table 3: Behaviours and reactions while gambling
Specific to Slot machines Guest asks for his/her machine to be reserved (either for the next day or if he/she leaves the machines unattended for a moment) Guest hits the buttons hard or hits the machines Guest strokes the machines Guest berates or swears at the machines Guest talks to the machines Guest complains about losses or blames them on the casino industry or machines Table Games Guest berates the croupier or blames him/her for losses Guest often places bets too late in roulette Guest bangs table with fist General Behaviours Guest gambles almost uninterruptedly Guest is so focused on gambling that he or she barely reacts to what is going on around him/her Guest gambles on more than one machine at once Guest smokes a lot Guest has 2 or more glasses of alcohol while gambling Guest runs from table to table or machine to machine Guest is nervous (e.g., shaking, perspiring, etc.) Guest pleased about winning Guest complains about losing Guest already waiting outside casino doors before opening time At closing time, it is difficult to persuade the guest to stop playing
_____________________________________________________________________ (from Hafeli & Schneider, 2006)
Hafeili and Schneider’s (2006) analyses showed that problem gamblers gambled more
intensely and frequently, appeared more compelled to find many different ways to raise
funds to gamble, and had different social and emotional responses. For example,
problem gamblers appeared to be more socially withdrawn, angry, anxious, depressed,
but also more immersed in the activity. Most of these items appeared to have good
face validity as indicators of problem gambling, although some items “Guest pleased by
winning” and “Guest seeks social contact” appeared more questionable because it is
27
known that problem gamblers are often solitary and evasive in their social interactions
and also report reduced enjoyment from gambling (see Ben-Tovim, Esterman,
Tolchard, and Battersby, 2001).
Although the authors did not present statistical analyses to show how these indicators
could be used to differentiate between different types of gambler, these indicators have
been applied in training programs for staff working in Swiss casinos, where there are
already policies and procedures in place to identify customers with gambling-related
problems. Swiss gambling policies are governed by the Casinos Act of 1998 which, as
one of its provisions, requires staff to log instances of problem gambling. If people
display two or more of what are termed A-type criteria (e.g., they admit to having a
problem, try to borrow or steal money, or receive third party enquiries) (see Delfabbro
et al., 2007, 2012; Hancock, 2011), an interview will be conducted with gamblers,
whereas a range of other indicators (B-type criteria) are logged over time.
Hafeli and Schneider’s (2006) work was followed by an Australian study undertaken by
Delfabbro et al. (2007) which drew upon material from Hafeli and Schneider’s as well
as other previous studies, including the work of Schellinck and Schrans (2004) and the
Allcock (2002) review. This study also attempted to develop indicators that were not so
specifically focused on particular activities (e.g., casino table games), but which could
be applied to venue-based gambling more broadly. Based upon this material, it was
argued that visible indicators appeared to fall into six principal groups. Once again,
there were items that referred to the statistically unusual frequency or intensity of
gambling; evidence concerning gamblers’ need for funding while gambling; variations
in social and emotional responses, but also evidence that gamblers had lost control
over their gambling urges (Delfabbro et al., 2012). A full summary of this study appears
below.
28
Summary of Delfabbro et al. (2007) national study
The first part of the research involved a survey of venue staff (n=120) and counsellors
(n=20) recruited from different parts of Australia. Respondents were presented with
lists of indicators and asked to specify whether each was a valid indicator of problem
gambling. Findings showed almost all of the indicators were endorsed by both groups
of respondents with venue staff, in particular, placing a very strong emphasis on social
and emotional responses (e.g., customer anger, blaming staff for losing). Venue staff
also drew attention to the importance of looking for changes in customer appearance
and behaviour or “out of character” behaviours rather than solely focusing on static
indicators.
Other questions in the venue staff survey related to likely impediments to identification,
including staff hours, turnover, the size of venues, the visibility of customers on the
gaming floor, and the adequacy of training. Over 70% indicated that there was
inadequate staff training, 57% said that customers were difficult to see, around 50%
thought that staff turnover and shift-lengths were a problem, and 58% did not think that
staff would have enough time to observe problem gamblers on the gaming floor. At the
same time, all the respondents believed that they had observed problem gamblers at
venues at which they had worked. Thirty-eight percent indicated that this happened on
a weekly basis and 42% reported that they saw problem gamblers all the time. Only
14% reported that it was hard or very difficult to spot problem gamblers, but 46%
indicated having significant difficulties approaching people in the venue (Delfabbro et
al., 2012).
A major component of the research by Delfabbro (2007) was a detailed survey of
almost 700 regular gamblers recruited either from the general community or from
outside gaming venues. Participants were eligible to participate if they gambled at least
fortnightly on EGMs, casino games or sports and race betting, although the principal

29
focus was on EGMs because this is largely venue-based. All respondents completed
the Problem Gambling Severity Index (PGSI; Ferris & Wynne, 2001) and responded to
a checklist of indicators where the frequency of each indicator was scored using a 5-
point rating scale (0, 25, 50, 75, 100% of the time). Twenty per cent of the sample
scored 8+ on the PGSI and were classified as problem gamblers, 21% were at risk,
and 58% were low or no risk (Delfabbro et al., 2007).
The principal analyses in the Delfabbro et al. (2007) study were based on calculations
that compared the relative odds of different indicators being reported by problem and
non-problem gamblers. Consistent with early work by Schellinck and Schran (2004),
the results showed that indicators typically fell into one of two categories. One group of
indicators occurred relatively commonly in problem gamblers but were also reported by
a moderate proportion of other regular gamblers. A second group were more rarely
reported, but typically only by problem gamblers. Each indicator was described in terms
of its likelihood of being reported by a problem gambler (PG) versus other regular
gamblers, or P (indicator / PG) / P (indicator / Non-PG) with higher ratios indicating a
greater the likelihood of the indicator being reported by problem gamblers. Table 4
shows that almost all behaviours or experiences were significantly more likely to be
reported by problem gamblers, but that the divergence of responding varied across
times.

30
Table 4: Probability of behaviour or indicators: Problem vs. non-problem gamblers
Indicator PGs NPG PG/ NPG
Frequency, Duration and Intensity
1. Gambled so intensely you barely reacted to what was going
on around you
.91 .25 3.64
2. Gambled continuously .91 .31 2.94
3. Rushed from one machine or gaming table to another .80 .30 2.67
4. Bet $5 or more per spin most of the time .51 .21 2.43
5. Gambled every day of the week .66 .28 2.36
6. Gambled for three hours or more without a proper break .87 .39 2.23
7. Played very fast .92 .43 2.14
8. Played mainly high denomination $1 machines .76 .44 1.73
9. After winning on poker machines, you play on quickly
without even stopping to listen to the music or jingle
.96 .60 1.60
Impaired Control
1. Found it difficult to stop gambling at closing time 69 .13 5.31
2. Gambled right through your lunch break or usual dinner time .66 .15 4.41
3. Fell asleep at a machine .08 .02 4.00
4. Stopped gambling only when the venue was closing .74 .28 2.64
6. Started gambling when the venue was opening .65 .25 2.60
5. Tried obsessively to win on a particular machine .93 .54 1.72
Social Behaviours
1. Asked venue staff not to let other people know you there .16 .02 8.00
2. Had friends or relatives call/arrive at venue asking for you .42 .08 5.25
3. Become very angry if someone took your favourite machine or
spot in the venue
.70 .20 3.50
4. Was impolite to venue staff .23 .07 3.29
5. Avoided contact, communicated very little with anyone else .84 .31 2.71
6. Stayed on to gamble while friends left the venue .77 .33 2.33
31
Indicator PGs NPG PG/
NPG
Raising Funds/ Chasing Behaviour
1. Asked for a loan or credit from venues .16 .01 16.0
2. Borrowed money from other people at venues .54 .11 4.91
3. Fell asleep at a machine .08 .02 4.00
4. Started gambling when the venue was opening .65 .25 2.60
5. Got cash out 2+ occasions to gamble ATM/ EFTPOS .89 .43 2.07
6. Asked to change large notes at venues before gambling .74 .43 1.72
5. Tried obsessively to win on a particular machine .93 .54 1.72
Emotional Responses
1. Cried after losing a lot of money .58 .05 11.60
2. Shaking (while gambling) .60 .06 10.00
3. Sweated a lot (while gambling) .56 .07 8.00
4. Displayed your anger .55 .09 6.11
5. Kicked machines .23 .04 5.75
6. Sat with head in hand after losing .68 .12 5.67
7. Felt nervous/ edgy .84 .19 4.42
8. V. Sad /depressed (after gambling) .94 .36 2.61
Other Behaviours
1. Gambled after having drunk a lot of alcohol .56 .37 1.51
Irrational Attributions
1. Complained to staff about losing .37 .10 3.70
2. Blamed venues or machines for losing .81 .23 3.52
3. Swore at machines or venue staff because you lost .49 .20 2.45
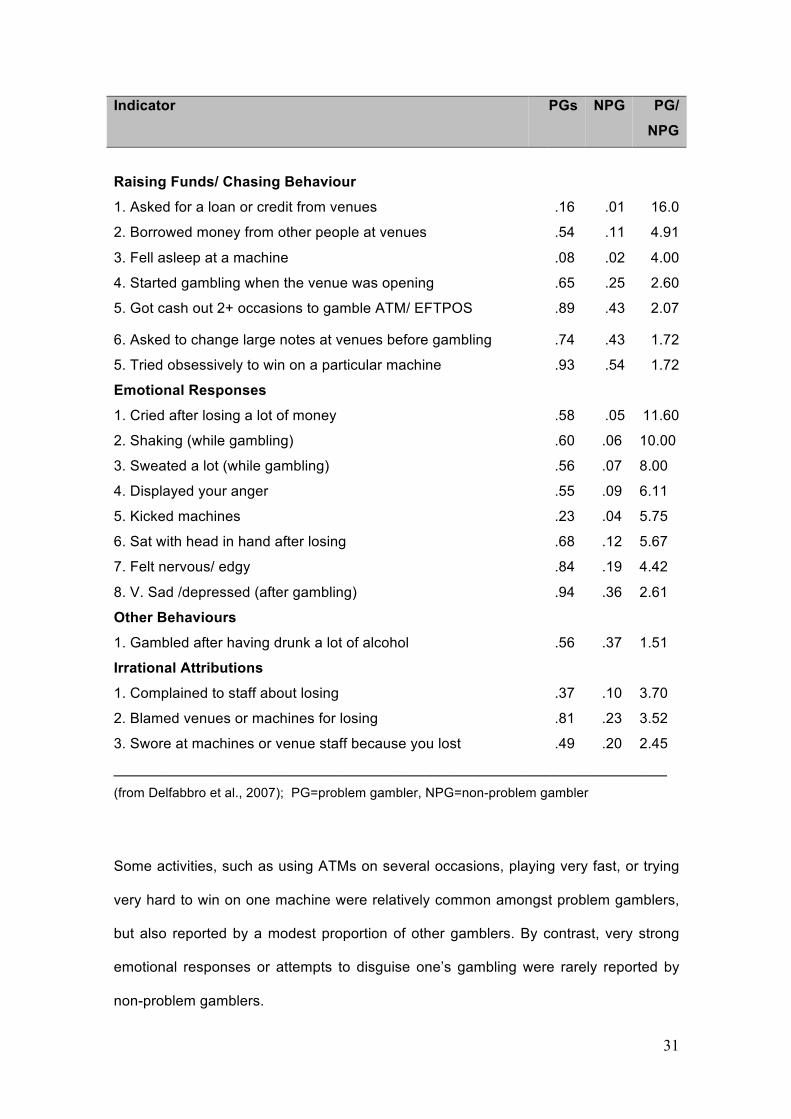
____________________________________________________________________ (from Delfabbro et al., 2007); PG=problem gambler, NPG=non-problem gambler
Some activities, such as using ATMs on several occasions, playing very fast, or trying
very hard to win on one machine were relatively common amongst problem gamblers,
but also reported by a modest proportion of other gamblers. By contrast, very strong
emotional responses or attempts to disguise one’s gambling were rarely reported by
non-problem gamblers.

32
These indicators were used in a series of logistic regression analyses to determine the
best predictors of gambler status (problem vs. non-problem). Regressions were run for
the overall sample and then for males and females separately, thus three final models
were presented with different indicators. Table 5 shows the probability of a person
being a problem gambler based on the accumulated observation of specific behaviours
or indicators.
Table 5: Probability of a person being a problem gambler
PG
Total Sample
Nervous and edgy .53
+ Cried after losing .81
+ Left venue to find money .87
+ Played very fast .89
+ Gambled continuously .89
Males Only
Gambled for 3+ hours without break .33
+ Sweated a lot while gambling .74
+ Difficulty stopping at closing time .86
+Displayed anger .90
Females Only
Kicked machines .65
+ Nervous or edgy .90
+ Lost track of things around them .95
+ 2 or more withdrawals from ATMs .98
+ Left venue to find money .99
+ Angry if spot taken .99
_____________________________________________________________________
(from Delfabbro et al., 2007), PG=problem gambler Note: Each proportion/percentage is based on the cumulative addition of the indicators in that model, e.g., in total sample .87 or 87% is based on the 1st three indicators.

33
All three models showed that more accurate differentiation is likely to occur based on
multiple indicators, but that the classification probabilities associated with the addition
of indicators is subject to marginal returns.
For males, one indicator alone leads to little classification accuracy (33%), whereas the
addition of one more indicator leads to significant increases in confidence (74%).
However, once three indicators have been introduced, only relatively small increments
in the probability value will be achieved if additional indicators are considered. This
effect appears to be even stronger when one considers female problem gamblers. For
this group, it appears that as few as two indicators may be sufficient to be at least 90%
confident that a person is a problem gambler. The strongest predictors for males
appeared to relate to impaired control (i.e., an inability to stop gambling) and emotional
responses, whereas strong emotional responses and a preoccupation with gambling
appeared most indicative when considering female problem gamblers.
1.2.3 Related research: Studies of online and electronic gambling
Despite our principal focus on venue-based gambling, it is important to draw attention
to related work that may have future implications for gambling in Australia and/or could
inform development of indicators to be used in face to face environments (Delfabbro et
al., 2012). Much of this work relates to online gambling, but there are also studies and
identification systems that have been applied to gaming in venues. In both contexts,
attempts have been made to develop computerised systems that are capable of
tracking the activity of individual players over time (Griffiths, 2009). For example, if
people use some form of loyalty card or device when they gamble, it is possible for
venues to determine how long individual players gamble, how much they spend, and
on how many machines (Griffiths & Wood, 2008).
On the internet, this information is even more detailed. Player account data can be
used to examine the nature of the bets people place, how much they spent over time,
34
how long they spend gambling, and any trends in their expenditure patterns (Griffiths &
Parke, 2002). This information can then be used to alert players to how much they
have been spending and for the gambling provider to determine whether the person
might benefit from a particular responsible gambling service (e.g., exclusion, time-outs,
problem gambling service information). In several countries systems (e.g., PlayScan,
Observer, and GAMTrack) have been designed to track player behaviour and provide
diagnostic or ‘smart’ interpretations of player data.
Tools of this nature were designed to detect players at risk of developing gambling
problems, and offer the gamblers’ tools to help change their behaviour. Such tools
have been likened to a ‘safety belt’ (i.e., something you use without intending to
actually make use of). In most cases, the use of these systems has been voluntary, but
gaming operators will typically recommend that customers take advantage of these
features (Griffiths, Wood & Parke, 2009). If the system predicts players’ behaviour as
risky, they get an advance warning together with advice on how they can change their
patterns in order to avoid future unhealthy and/or risky gambling.
In 2009, Griffiths, Wood and Parke undertook a critical review of PlayScan, a voluntary
responsible gambling tool which is made available to internet gamblers by Svenska
Spel and used by around a quarter of all gamblers. The system uses a ‘traffic light’
indicator system to indicate the level of risk. If a player’s gaming is stable and without
any signs of risky gaming behaviour, it gives a green signal to the player. A yellow
signal indicates some risky gaming. Serious problems with gaming are indicated by a
red signal. The study showed very low rates of utilisation of other features such as
limit-setting but found that over 60% of players found the traffic light warning to be
useful and made them more aware of their gambling.
Other parts of the world, including the Canadian providences of Saskatchewan and
Nova Scotia, have developed similar systems, although detailed evaluations of these
35
systems have not been made available for peer review. Davies (2007) points out that
Saskatchewan was one of the first places in the world to examine whether technology
could be incorporated into existing loyalty card systems to provide responsible
gambling features. The system arose as the result of collaboration between the
technology company iView Systems, the Saskatchewan Gaming Corporation (SGC)
who developed a software package called iCare that was installed on VLTs in its major
casinos (Austin, 2007). iCare is a computerised tracking system that allows casinos to
monitor and track player behaviour across time. The software is used in conjunction
with a responsible gambling training programme for staff (Davies, 2007). Davies
reported that two levels of training are used. Level 1 training is designed to teach staff
to recognise the warning signals or ‘red flags’ that may indicate that a customer is
experiencing gambling-related harm, whereas Level 2 trains staff in ways to approach
and intervene if problems are detected. These different levels are very similar to those
described by other casinos around the world, e.g., SkyCity Auckland and Adelaide
(Hing et al., 2010). According to promotional material, iCare software has the capacity
to generate predictive information based on an algorithm so that the casino can
observe changes in player behaviour over an extended period. The system also allows
incidents to be logged so that an information base can be built up concerning certain
at-risk customers. How information is used is then up to the discretion of individual
casinos, but would usually involve interactions with players who appear to be showing
signs of risky play.
Internet tracking has also been used to profile gambling behaviour in two recent United
States (U.S.) studies. For example, LaBrie and Shaffer (2011) examined the gambling
behaviour of 679 sports betters using account data provided by the industry. All of
these people had provided information concerning the reason for closing down their
accounts. One of these reasons was because of problem gambling so that it was
possible to compare the behaviour of 215 people who closed down their accounts for
36
this reason and those who had not been satisfied (n=113) and who had been no longer
interested (n=351). Using discriminant function analysis, the authors showed that the
problem gamblers differed in several ways. They typically bet more often, placed larger
bets, and engaged in more intense betting soon after enrolment. Although none of
these findings may seem surprising, these results suggested that it was
methodologically possible to study internet gambling and to develop prospective
profiles that might indicate more problematic behaviour.
A second study of internet gambling conducted by Xuan and Shaffer (2009) examined
18 months of data collected from 226 people who had closed their accounts due to
gambling-related problems and a case control sample of 226 people who kept their
accounts open. It was found that problem gamblers, in comparison to the control group,
tended to increase the average size of their bets, decrease the frequency of their bets,
but choose less risky odds just prior to closing down their accounts. Thus, contrary to
the view that problem gamblers might try to chase their losses by choosing riskier bets,
some problem gamblers tended to become more conservative over time. Larger bets
were placed on options with shorter odds (Delfabbro et al., 2012).
In the UK, Griffiths (2009; Griffiths & Whitty, 2010) examined the behavioural
characteristics of online problem gamblers as part of several consultancy projects for
online gaming companies and as part of a study based on data from 160,000 online
gamblers from win2day, the Austrian gaming operator (Auer & Griffiths, 2011). This
work identified a number of behavioural indicators that are engaged in by online
problem gamblers and that can be spotted online using behavioural tracking
technology. Such behaviours include (i) spending a lot of time and/or money gambling,
(ii) increasing the amount of time and/or money spent gambling over time, (iii) chasing
gambling losses, (iv) playing a variety of games, (v) player ‘reload’ within gambling
session, (vi) frequent payment method changes, (vii) verbal aggression, and (viii)
constant complaints to customer services. Griffiths argues that any one of these on
37
their own does not necessarily indicate problem gambling but that the more
behavioural indicators that a gambler engages in, the more likely they are to be an
online problem gambler (Delfabbro et al., 2012).
There have also been attempts to track the behaviour of EGM players using card-
based systems. For example, a study by Svetieva, Walker, Blaszczynski, and Sharpe
(2006) examined the playing behaviour of 102 EGM players in NSW clubs using data
collected from membership cards. These cards were used as part of a loyalty club
system that allowed one to track the intensity of play across multiple venues. The
principal aim of the study was to determine whether problem gamblers (defined as
people with South Oaks Gambling Screen [SOGS] scores > 5) had a different play
profile from other gamblers. The results showed that problem gamblers tended to
gamble for longer periods each week (280 minutes vs. 192 minutes), play more days
per week (2.28 vs. 1.79) and lose significantly more money ($65 vs. $26). However, the
two groups of gamblers did not differ in other aspects of play, including how often they
changed machines, stayed on the machines, or gambled continuously.
Other analyses of this nature have been undertaken as part of trials of responsible
gambling features or pre-commitment technology on EGMs. In South Australia, for
example, an evaluation of a card-based pre-commitment system (Playsmart) provided
by the company Worldsmart allowed access to player expenditure data over a number
of months (Schottler, 2010). As in Svetieva et al.’s (2006) study, problem gamblers
(classified using the PGSI) were found to gamble larger amounts and to have longer
gambling sessions than recreational players. In this trial, players had to set limits in
relation to their expenditure or the amount of time spent gambling. If these limits were
breached, a signal would be sent to a computer console in venues so that staff would
be alerted to which players had exceeded their limits. Players could also receive
personalised warning messages to alert them to the status of their session.
38
A similar study conducted by Focal Research (2007) as part of an evaluation of the
Nova Scotia Responsible Gambling Device obtained similar findings by analysing data
obtained from cards tracked over a number of months in VLT venues. The study was
able to examine pre- and post-expenditure patterns for players who had, or had not,
utilised the responsible gambling features on the pre-commitment cards. The study
showed that it was possible to determine the level of expenditure of different groups of
gamblers based on their level of risk (i.e., problem vs. non-problem gamblers) and the
extent to which use of the pre-commitment features had led to changes in their
gambling behaviour.
Thus it is possible to use electronic systems to track behaviour and create profiles
based on the riskiness of play. These can then be used to generate tailored warnings
to customers and/or to alert staff to risky or problematic customer play. In the latter
case, alerts can be incorporated into responsible gambling training programs and lead
to staff approaches to possible problem gamblers (Delfabbro et al., 2012).
1.2.4 Critique of indicator studies
On the whole, the studies conducted so far have yielded reasonably consistent
findings. All agree that: (a) there are potentially valid indicators of problem gambling,
(b) it is necessary to base judgments about the status of individual gamblers on
multiple indicators or sources of information, and (c) many of the indicators are either
observable or measurable either within venues or capable of being tracked
electronically (in some contexts). However, the existing studies also have a number of
limitations that need to be taken into account before this information can be easily
translated to ‘responsible gambling’ applications.
The first difficulty is that most (if not all) of the published studies described above
involved only single samples. For statistical models to be confidently applied to
39
different gamblers populations, it would be important to show that models developed in
one sample can be replicated using another (Schellinck, 2011).
A second difficulty is that survey-based responses do not provide a lot of information
concerning the practical reality of observing and consolidating information in a venue
environment. Even if the same staff members are available in the venue over a
protracted period, it does not necessarily follow that they will have the ability to observe
the same customers all the time. In Delfabbro et al.’s (2007) study, an attempt was
made to position observers in venues for periods of up to four hours to determine how
much behaviour could be reasonably observed in this period. In general, it was found
that several indicators could be observed in this period, but that such a process was
unlikely to be possible for venue staff members who generally only spent around 15%
of their time in the areas where gaming machines were operating. Schellinck and
Schran’s (2004) work similarly shows that, if the actual frequency with which people
produce different indicators are considered, the probability of observing two indicators
together at a particular point in time is likely to be very low.
However, staff do appear to be able to observe signs of problematic gambling.
Delfabbro et al.’s (2007) study included discussions with experts and venue staff,
finding that, although staff generally felt that current training was inadequate, they were
still able to identify problem gambling in their venues. Similarly, a study in Victoria
(Cosic, 2012) found that staff nominated observable signs of problem gambling
correlated well with those of Delfabbro et al. (2007). Cosic found that staff most
commonly discussed signs related to emotional responses and chasing funds
suggesting that these are the most easily observable in staff. She concluded that
training should be targeted at increasing staff awareness of some of the less obvious
signs including social behaviours and impaired control.
40
More support for the view that staff can observe signs of problem gambling over time
was obtained in another recent study by Delfabbro, Borgas and King (2011) that
involved an in situ interview with both customers and venue staff at several South
Australian venues. Customers were approached and asked to complete a short survey
concerning their gambling habits as well as a measure of problem gambling (the
PGSI). Staff members were then asked to rate their knowledge of each of these
customers and the likelihood of them being problem gamblers. These staff had
received training from Gaming Care South Australia which included some element of
training in how to identify problem gamblers in venues with potential indicators and
some role playing exercises. It was found that staff generally knew the customers’
gambling habits quite well and were generally able to identify those who were more
likely to be at risk of having gambling-related problems as based on PGSI scores.
Those identified as possible problem gamblers by venue staff had significantly higher
PGSI scores than those who were identified as not having problems. However, the
classification rates based on the correspondence of staff ratings and self-reported
PGSI classifications were low. Of 22 problem gamblers identified by self-report, 14
were reported as having no problems by staff, whereas a small number of non-problem
and low risk gamblers (PGSI scores < 3) were suspected of being problem gamblers.
These results suggest that staff knowledge was sufficient to assist them in confidently
knowing the general group of customers that might be monitored more closely for signs
of gambling-related harm, but that staff are likely to under-estimate the severity of
gambling issues, and will be reluctant to label a customer as a problem gambler until
the signs are very clear.
Another reason staff may be reluctant to nominate customers as problem gamblers is a
lack of confidence in approaching and discussing gambling problems. The need for
staff training in both identification and approach was highlighted in a survey of 426
managers/nominees and venue staff conducted by the Victorian Commission for

41
Gambling Regulation (VCGR; VCGR News, 2011). They found that most staff would
like to receive more comprehensive training in identifying possible problem gamblers
and interacting with them. In particular, 36% of employees reported having some
difficulties identifying problem gamblers and two-thirds (66%) said they were “less than
comfortable” initiating contact with customers.
Similar results were found in a South Australian study by Hing, Nisbet and Nuske
(2010). A number of gaming staff were interviewed and provided with different venue
scenarios and asked to describe how they would respond. Most felt reasonably
confident in being able to assist people who self-reported as having difficulties with
gambling, but few felt confident about proactively approaching customers. It was
generally considered easier to assist people if they were regular customers and where
there had been some opportunity to build some personal rapport, but it was also
acknowledged that many problem gamblers are also secretive and made active
attempts to conceal their difficulties and avoid contact with staff. These findings further
strengthen the argument for greater translation of research relating to the identification
of problem gamblers into staff training.
1.2.5 Indicators in policy and practice contexts
Including problem gambling indicators in policy
In Australia and a number of other countries, attempts have been made to encourage
venues to play a more active role in providing their services in a manner that reduces
the likelihood of gambling-related harm. At the broadest level, these take the form of
duty of care statements developed by the industry to promote themselves as
‘responsible’ service providers. However, there are also dedicated ‘codes of practice’
that set out more specific details concerning the principles and practices that should
feature in the delivery of services. In most jurisdictions, these codes are voluntary in
that members of the industry are encouraged to use them, but are not penalised for
42
non-compliance. Mandatory codes, by contrast, involve a requirement to adhere to a
range of obligations which are informed by legislation, audited and enforced by
regulators often at a threat of financial penalties or a withholding of operational rights
(see Delfabbro et al., 2007 for a detailed review).
In Australia, almost every industry operator has its own code of practice (over 30 exist,
Australasian Gaming Council, 2012), but States and Territories differ in how codes are
applied. A summary of the different codes (current for 2012) is provided in Table 6. As
indicated, South Australia and Victoria both have mandatory codes of practice which
set out specific practices that must be complied with to hold a gambling licence. All
staff must undergo training to work in venues and the industry is expected to take
reasonable steps to identify and assist people who may be at risk of gambling-related
harm. Tasmania has similar mandatory codes and an emphasis on the provision of
appropriate staff training. Victoria has a mandatory requirement for codes of practice
but, unlike South Australia and the ACT, the industry is given the responsibility of
developing its own set of practices that address the key requirements set out by the
State regulator.
In Queensland, a co-regulatory environment applies. Responsible gambling provisions
are developed through collaboration between the State Government, non-Government
sector and the industry. Staff training is based on a Responsible Gambling Training
Manual and periodic audits and reviews are put in place to update and refine the code
over time. The Northern Territory Model is quite similar to the Queensland model,
although the code is more specifically identified as ‘mandatory’. Codes of practice are
required by law and training must be undertaken using an approved training manual.

43
Table 6: Responsible gambling codes of practice by jurisdiction
Region
Code of
Practice
Details
Staff Training
Identification of problem gamblers
VIC Mandatory All providers of gambling services must have a code of practice. The code must address a number of key requirements, but the exact form of the implementation is left to industry
Gaming staff must complete an approved course must within 6 months of appointment and have refresher courses every 3 years. Courses must address recognised competency standard.
The code must provide details concerning how staff interact with customers. Training must include awareness of the symptoms of problem gambling and knowledge of what to do if indicators are detected.
SA Mandatory A legislated code applies to all providers of gambling services.
All staff are required to undergo responsible gambling training.
The training should encourage the proactive identification of problem gambling in venues.
NSW Self-regulatory
The industry has its own voluntary codes which include a wide range of responsible gambling provisions.
All staff are required to undergo responsible gambling training.
No specific emphasis on the proactive identification of problem gamblers.
ACT Mandatory A legislated code applies to all providers of gambling services.
All staff required to undergo approved responsible gambling training.
Active attempts should be made by staff to identify problem gamblers.
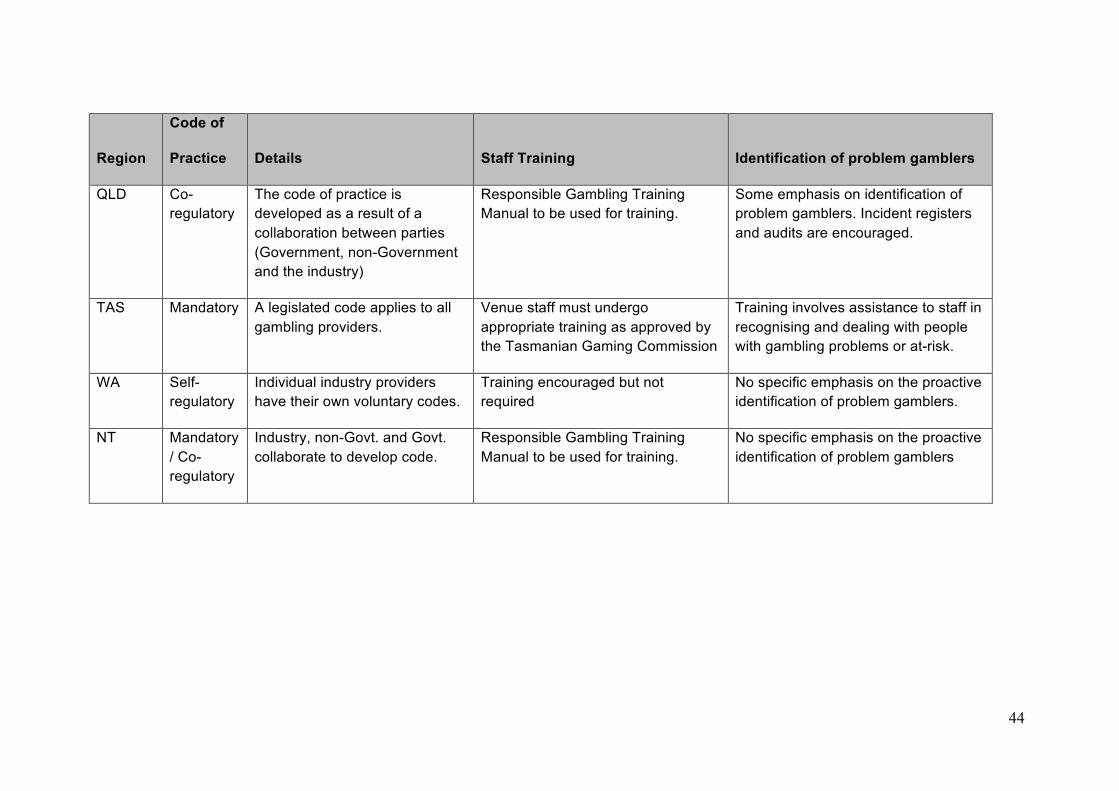
44
Region
Code of
Practice
Details
Staff Training
Identification of problem gamblers
QLD Co-regulatory
The code of practice is developed as a result of a collaboration between parties (Government, non-Government and the industry)
Responsible Gambling Training Manual to be used for training.
Some emphasis on identification of problem gamblers. Incident registers and audits are encouraged.
TAS Mandatory A legislated code applies to all gambling providers.
Venue staff must undergo appropriate training as approved by the Tasmanian Gaming Commission
Training involves assistance to staff in recognising and dealing with people with gambling problems or at-risk.
WA Self-regulatory
Individual industry providers have their own voluntary codes.
Training encouraged but not required
No specific emphasis on the proactive identification of problem gamblers.
NT Mandatory / Co-regulatory
Industry, non-Govt. and Govt. collaborate to develop code.
Responsible Gambling Training Manual to be used for training.
No specific emphasis on the proactive identification of problem gamblers

45
By contrast, New South Wales has a largely self-regulatory system in which individual
industry groups provide their own voluntary codes of practice. The content of these
codes is generally similar to the other States and Territories and staff training is
required. Western Australia, the only State without EGMs in clubs and hotels, does not
have a formal code of practice, but individual providers report that they comply with
their own voluntary codes. Details of the specific regulatory bodies, legislation and
documents relating to responsible gambling have been reviewed by the Australasian
Gaming Council (2012) and Delfabbro et al. (2007).
In New Zealand, under the Gambling Act 2003, the industry is required to adhere to a
legislated, mandatory code of practice. Included in this set of provisions is a
requirement that all venue staff undertake appropriate training and that the industry
develop strategies to assist in the early identification of customers who are either
experiencing gambling-related harm or who at ‘at risk’ of developing harm. The actual
nature of the training and identification policy is determined by the industry, but training
must be approved by the Government (e.g., the New Zealand Gambling Commission
reviews the appropriateness of intervention policies). These requirements, therefore,
are similar to those in various Australian states and territories.
Training staff in the use of indicators to identify problem gambling
In response to this legislative mandate, the major New Zealand casinos have
developed detailed identification and intervention policies that apply to their venue
operations. For example, as discussed by Delfabbro et al. (2007), Christchurch Casino
has, for a number of years, developed a list of indicators used in training to assist staff
to identify problem gamblers. Almost all of these are included in the list presented
earlier in this review and relate to unusual social and emotional behaviours, excessive
time spent at the Casino, changes in hygiene or appearance and attempts to borrow
money. Staff at Christchurch are trained to look for these known indicators and how

46
these relate to the DSM-IV criteria for pathological gambling. A similar, but longer list of
indicators is employed by SkyCity Casino in Auckland. In their system, indicators are
divided into groups: those which are high risk indicators of harm and those which need
to be examined in relation to other factors. High risk indicators would include situations
where the gambler admits to having a problem or where they are third party enquiries
about the person’s wellbeing. Other indicators relate to social and emotional
behaviours or the extent to which the person is looking to raise money to gamble (e.g.,
attempts to sell things, borrowing, requests for credit). Training in the process of
identification and how staff should respond is included as part of SkyCity’s Host
Responsibility Programme and this is also available in the SkyCity Adelaide Casino.
Training in how to identify problem gambling is also featured in a number of Australian
training programs, but using different methodologies or strategies. Some indicative
examples are as follows:
• GamingCare and ClubSafe in South Australia have dedicated training sessions
for venue staff which review indicators of problem gambling and conduct role-
plays to assist staff in recognising patterns of behaviour and how to respond to
customers.
• Venue Support Workers (VSWs) in Victoria similarly provide venue staff with
training sessions in observable signs and behaviours shown by possible
problem gamblers and ways to approach. Training programs incorporate
findings from prior research, particularly those of Delfabbro et al. (2007).
• Echo Entertainment (e.g., Jupiters Casino) has developed a short list of key
problem gambling indicators which are used as the basis for assisting staff to
identify people who might be experiencing harm.
47
• Star City (NSW) has developed DVDs and training materials relating to problem
gambling indicators.
In Europe, there are number of examples of industry attempts to assist and identify
problem gamblers within venues. As discussed earlier in this report (Section 1.2.2),
Swiss Casinos have developed their own list of indicators which they use as the basis
for identifying customers who might be experiencing problems as required by Swiss
law. Some indicators are placed into an A-list so that if even one indicator is observed
then the Casino takes immediate steps to speak to the person and make a formal
record of the interaction. Others are included in a B list which comprises a range of
‘lower’ risk indicators. This information is logged on a file specific to that person so that
it can be used to orient staff towards this person on future visits (see Delfabbro et al.,
2007 for a more detailed review).
A similar system applies in the Holland Casino system. Customers can either exclude
themselves from the venue or the Casino can do this unilaterally. Typically, this takes
the form of a restriction placed on the number of times that a person is allowed to visit
within a specified period of time (e.g., number of visits per month or week). In Holland,
such policies can be more easily enforced than in Australia because customers are
required to show identification each time they enter the casinos.
Northern American approaches to responsible gambling are considerably more
variable. In the U.S., most responsible gambling policies are implemented through self-
regulatory or industry-based approaches. Many industry groups incorporate information
concerning problem gambling and its symptoms into their training, but few (if any)
encourage staff to take active steps to identify problem gamblers. A similar situation
exists in Canada, although most provinces have enacted dedicated responsible
gambling legislation to inform the responsible provision of gambling services,
appropriate staff training as well as restrictions on the availability of gambling.
48
In Canada, attempts have been made to develop commercial systems that might assist
venues in implementing responsible gambling policies and which would extent to the
process of early detection. For example, the research company Focal Research in
Nova Scotia has complex algorithms with hundreds of player tracking variables which
can be used to profile the gambling patterns of people with different classifications on
the PGSI. According to Schellinck and Schrans (2011) such models have been
developed using samples of over 1000 casino gamblers and validated using both
development and test samples. Attempts to use electronic tracking of player behaviour
as a means to detect higher risk gambling have been trialled in Saskatchewan using a
software package called iView in conjunction with the Saskatchewan Gaming
Corporation (SGC; as discussed in Section 1.2.3). The models developed in Canada
by Focal Research are reported to achieve a high degree of accuracy, although it is
acknowledged that different models have to be developed for each jurisdiction or venue
to make them effective. Although these tools or models are commercial products with
proprietary interests that prevent them from being made available for independent
assessment or peer review in the academic literature, these developments have
important implications for the nature of responsible gambling and harm minimisation in
the future.
Impediments to identifying problem gamblers using behavioural indicators
Despite these developments, there remain challenges to identifying problem gamblers
in venues or in any context. First, although (as discussed in the section above), some
training of venue staff in identifying and approaching possible problem gamblers has
begun, industry staff are typically not trained to identify problem gambling in situ.
Industry respondents will often argue that it is inappropriate for non-clinically or
psychologically trained people to make a judgment about the status of gamblers
(Allcock, 2002). A second problem is the threat of resentment and customer privacy.
Unsolicited scrutiny of customer behaviour could be considered a violation of trust by
49
some customers and evoke an angry response (Hing et al., 2010), although there are
international examples which suggest that this process can be facilitated by appropriate
staff training. A third view is that it may not be in the industry’s interest to identify and
assist problem gamblers if a significant proportion of revenue is being derived from
those customers (e.g., the Productivity Commission, 2010 estimates that 42% of EGM
revenue is derived from problem gamblers). Finally it has been argued that venue staff
may not have sufficient time to observe particular customers in enough detail to make
any sort of judgment about their disposition (Allcock,2002).
Another problem identified by Hancock (2011) is that, in larger land-based gambling
venues in particular, there are often organisational structures that are inimical to
effective action when indicators of problem gambling are detected. Junior staff who
interact with gamblers may not have the authority to take action; referrals may need to
be made to other senior staff, and then a separate person again may have to interact
with the customer. She suggests that a more effective model is one where skilled staff
with the ability to provide immediately counselling and assessment are located on-site,
or can be readily contacted in the event that a customer with difficulties is identified.
Some models of this nature are claimed to be in operation already at some major
casinos, but it is clear that thorough and transparent evaluations of these arrangements
need to be conducted to ensure that they are making a genuine contribution to harm
minimisation as opposed to corporate marketing in the guise of ‘responsible gambling’.
1.3 Conclusions
There is increasing emphasis on the need for interventions that assist people at-risk of
gambling problems. Part of this push includes an emphasis on proactively approaching
at-risk people before they ask for help. This type of early identification and assistance
can reduce the severity of problems long term. Identification of possible gambling
problems by venue staff fits within these parameters. Studies have established that
50
there are visible indicators of problematic gambling and that behaviours can be
delineated in terms of how commonly they are seen in problem gamblers and how well
they discriminate between problem and non-problem gamblers. It has further been
established that multiple indicators should be observed to increase confidence of
accurate identification and that it is likely that observations will need to be made over a
number of occasions to facilitate this.
However, there remain a number of limitations that need to be addressed. First, studies
conducted so far have involved only single samples. It is important that models
developed in one sample are shown to be replicable in other samples to ensure
confidence that the findings can be applied to different gamblers populations.
Second, survey-based responses do not examine the practical validity of the indicators.
In other words, can venue staff actually observe and consolidate information about
particular customers in a busy venue environment? In particular, concerns have been
raised about practical difficulties in observing behaviour due to the size and layout of
venues; whether staff are able to consistently observe behaviour across time and
situation; whether staff have sufficient time for observations; and whether training is
sufficient to allow accurate identification.
Third, these studies do not articulate on what is done after identification of possible
problem gamblers. In particular, how are approaches managed by staff and
management; what are the outcomes of these approaches in terms of customers
reactions (initially and longer term); and how do staff feel about the need and outcomes
of these approaches?
1.4 Research Objectives
The aim of this research project was to address these gaps in understanding. To do
this we constructed a 2-part study. The scope of the study included all Australian
States and Territories and focussed on EGM gamblers in clubs, pubs and casinos. We
51
focussed on EGM gambling in response to tender requirements. This refinement in
methodology is appropriate as allows us to be more specific in terms of the conclusions
drawn regarding the most appropriate visible indicators for this form of gambling. The
vast majority of items on the original checklist related to this form of gambling and it is
known that the vast majority of all gambling-related problems are associated with this
form of gambling. EGM venues are also the most numerous and relevant venue-types
in Australia and employ a large number of staff.
Stage One
The first stage of the study was designed to validate the identified indicators developed
by Delfabbro et al., in 2007 and rate the indicators in terms of their strength in
contributing to the identification of problem gamblers in venues. A large sample of
regular (fortnightly +) EGM gamblers will be sampled across Australia. Using
methodologies and analyses similar to those used in 2007 enabled us to determine if
the findings of the 2007 study were fundamentally stable in terms of (a) the types of
behaviours which are commonly or frequently displayed by problem gamblers, (b) the
types of behaviours which discriminate between problem and non-problem gamblers,
and (c) the behaviours which best predict problem gambling. This assisted in
identifying valid and reliable indicators of possible and probable problem gambling.
These indicators formed the Gambling Behaviour Checklist for use in EGM venues
(GBC-EGM).
Stage Two
The second stage of the research was designed to validate the Gambling Behaviour
Checklist (GBC-EGM) in terms of its usefulness as a tool for staff to use in identifying
potential problem gambling customers. This was done through conducting a 3-month
trial of the use of the checklist by EGM venue staff. Semi-structured focus groups were
then conducted with staff to evaluate the checklist. The evaluation was designed to

52
articulate on the practical validity of the checklist and assisted in providing an evidence
base for the translation of theory into practice. Final refinements to the GBC-EGM
resulting from this evaluation constituted the GBC-EGM-SV for Victorian staff and
GBC-EGM-S for staff in other jurisdictions and countries. These versions prioritise
checklist usability, brevity and simplicity for staff working in the typical EGM venue
environment. A researcher checklist was also developed on the basis of the findings,
the GBC-EGM-R, which prioritises breadth of behaviours over brevity.

53
CHAPTER 2: Stage One - Statistical Validation of the Gambling Behaviour Checklist
2.1 Methodology
2.1.1 Participants
Five hundred and five regular EGM gamblers7 from across Australia were recruited.
There were 225 females ranging in age from 18 to 98 (M age = 43.61, SD = 15.71) and
280 males ranging in age from 18 to 82 (M age = 34.84, SD = 16.05). A breakdown of
demographic characteristics can be found in Table 7 below.
Table 7: Table of Demographics
Males Females Variable n % n % Country of birth Australia 248 88.6 187 83.5 Other 28 11.4 34 16.5 State of Residence Australian Capital Territory 4 1.4 4 1.8 NSW 110 39.3 46 20.4 Northern Territory 3 1.1 9 4.0 Queensland 31 11.1 25 11.1 South Australia 33 11.8 35 15.6 Tasmania 5 1.8 5 2.2 Victoria 92 32.9 99 44.0 Western Australia 2 0.7 2 0.9 Marital status Single 147 52.7 66 29.3 Currently partnered 110 39.4 109 48.4 Separated/divorced/widowed 22 7.9 50 22.2 Household Live alone 48 17.2 45 20.1 Couple (no children) 49 17.6 56 25.0 Couple with children at home 47 16.1 43 19.2 Sole parent with children at home 6 2.2 33 14.7 Share house 53 19.0 18 8.0 Living with parents 72 25.8 20 8.9 Other 6 2.2 9 4.0 7 Regular EGM gamblers in this case included people who reported gambling on EGMs at least twice a month. This criterion was consistent with the method used by Delfabbro et al. (2007) and was used because it has proved to be an effective way to recruit a sufficient sample of gambler at different levels of risk. If the criterion had been less stringent (e.g., once per month) fewer problem gamblers may been recruited given the same allocation of resources for recruitment.

54
Males Females Variable n % n % Work status Full time 128 45.9 77 34.2 Student primarily 56 20.1 19 8.4 Part time/casual 43 15.4 56 24.9 Seeking employment 23 8.2 9 4.0 At home/retired 19 6.8 48 21.3 Other 10 3.6 16 7.1 2.1.2 Measures
Demographics
Details were recorded concerning the participants’ gender, age, country of birth, suburb
and State of residence, marital status, living arrangements, work status.
Gambling Frequency
Frequency and type of gambling was assessed over the past 12 months across six
different types of gambling activities. For this report only frequency of gambling on
EGMs is reported. Participants reported how frequently they played EGMs (pokies) at
hotels, clubs and the casino. In each case frequency was measured on a 9 point Likert-
type scale where 0 = (0 times over the past year) and 9 = (More than 5 times a week).
Problem Gambling
The Problem Gambling Severity Index (PGSI; Ferris & Wynne, 2001) is part of the
Canadian Problem Gambling Index. This was used to assess the severity of problem
gambling for this study. The PGSI consists of 9 items and captures both gambling
behaviour (e.g., ‘Have you gone back another day to try to win the money you lost?’)
and the adverse consequences of gambling (e.g., ‘Has your gambling caused you any
health problems, including stress or anxiety?’). Items are rated by participants on a 4-
point Likert scale where 0 = (Never) and 3 = (Almost always). Scores are summed
across the whole scale and range from 0-27. Risk levels as set by Ferris and Wynne
were as follows: 0 = Non problem gambling, 1-2 = Low risk gambling, 3-7 = moderate
55
risk gambling, 8+ = problem gambling. Research indicates the PGSI is
psychometrically sound, with demonstrated high internal consistency (α = .84 - .92),
stability (test-retest at 3-4 weeks .78), and validity with high correlations between the
PGSI and other measures of problem gambling (Ferris & Wynne, 2001). The
Cronbach’s Alpha in the current sample was .94 (very high).
Analysis of Visible Behaviours and Signs
The final checklist of visible indicators developed by Delfabbro et al. (2007) was used.
The question stem was also modified to relate only to EGM gambling due to the focus
of the present study. Respondents were presented with 52 items and asked to report
how often they usually engaged in the particular behaviour on a 5-point scale where, 1
= Never (0% of the time), 2 = Rarely (Fewer than 1 in 4 times you gambled), 3 =
Occasionally (25-50% of the times you gambled), 4= Frequently (50% of time or more
often), and 5= Always (100% of the time). Indicators were divided into six categories. In
total 12 items related to the frequency, duration and intensity of gambling; 5 related to
impaired control; 8 items captured social behaviours; 9 related to raising money or
chasing behaviours; 11 related to emotional responses; and 7 relating to various other
behaviours including drinking alcohol while gambling, a decline in
grooming/appearance, irrational attributions for losing and avoiding the cashier. Minor
alterations were made to a few items that referred to casino games as the scope of the
study related to EGM gambling.
2.1.3 Procedure
Ethics approvals to conduct the survey were obtained from the Department of Justice
(JREC) and Swinburne University (SUHREC) Human Research Ethics Committees.
The study used similar sampling strategies to the Delfabbro et al. (2007) study,
recruiting a non-random convenience sample designed to oversample at-risk and
problem gamblers as these were the populations of particular interest. To do this we
recruited regular EGM gamblers as it is known that larger numbers of problem
56
gamblers are represented in regular EGM gamblers than in the wider population
(Productivity Commission, 2010). The final sample therefore was intended to include
large samples of problem and moderate risk gamblers as well as no and low-risk
gamblers. This enabled examination of indicators for each of these groups as well as
comparisons between people who gambled regularly but non-problematically and those
who experience problems, thereby isolating items that are indicative of problematic
rather than simply regular gambling.
As was the case with Delfabbro et al. (2007), the major disadvantage of these methods
is that the resulting sample is not random, so findings may not generalise back to all
problem gamblers in the community. However, obtaining large samples of at-risk
gamblers is very difficult using random sampling strategies due to the low base rate of
this group in the community. This was not a prevalence study and the sampling
strategy used meets the primary requirement of the study to compare problem
gamblers and non-problem gamblers. The two studies combined include over 300
problem gamblers and almost 300 moderate risk gamblers from across Australia thus
findings are likely to be reasonably reflective of these populations. Further, as
discussed below the sampling strategy targeted gamblers directly through venues
across the country as well as through wider community sampling methods, increasing
the likelihood of a diverse sample of gamblers.
We used a combination of methods to recruit participants. Our initial survey included
some additional measures designed to broaden the focus of the survey to include
gambling motivations and self-regulation of gambling, thereby diffusing the focus on
behavioural indicators of problematic gambling. This survey was estimated to take
between 15 and 20 minutes. However, the initial newspaper advertisement resulted in
fairly low numbers so the survey was cut down to its essential elements to reduce the
length of participation to between 5 and 10 minutes. We advertised the survey to the
general community through newspaper and Facebook advertisements. We also
57
advertised to EGM customers directly through paper-based flyers placed in gaming
venues across all States and Territories in Australia and through electronic links placed
on venue websites. As recruitment progressed we targeted further advertising at
specific States and Territories to facilitate as wide recruitment as possible. To be
eligible for inclusion in the study, all participants had to be over 18, live in Australia and
gamble on EGMs at least twice per month8.. In all advertising prospective participants
were invited to take part in the research relating to their gambling habits. They were
directed to a website supported by Swinburne University of Technology which
contained a hotlink to the online survey. Prospective participants were also able to ring
or email the investigators and request a paper-based survey if preferred. Almost all
participants chose to take part online. The online and paper-based surveys were
identical and included the 2007 behavioural checklist, a measure of severity of problem
gambling symptoms, questions about frequency of gambling on various activities and
selected demographics. At the end of the survey respondents were invited to provide
their contact details to receive a $30 shopping voucher as thanks for their time and
effort. Once the surveys were downloaded the contact details were separated from
survey responses to preserve participant anonymity. Both contact details and survey
responses were saved on second secure online databases.
2.2 Analytical Framework
When considering the most appropriate methodology to apply to this validation study,
we reviewed national and international literature in relation to scale development for
behavioural screens as well as validation studies for behavioural screens. In doing this
we considered the type of screen that was being developed in this particular case. As
discussed in this review, much of the previous research shows that problem gamblers
are likely to exhibit only one or two observable behavioural indicators during any one
8 The fortnightly gambling requirement (as a measure of current regular EGM gambling) replicates Delfabbro et al. (2007) methodology.
58
gambling session (Delfabbro et al, 2007; Schellinck & Schrans, 2004). Additionally, the
indicators exhibited by a gambler can differ across sessions, and between gamblers.
As a result, development of an effective checklist to assist in staff training and in
identifying problem gamblers depends on evaluating the performance of several
different individual (or coupled) indicators. This is in contrast to usual scale
development which focuses on the best combinations of multiple items, optimal cut-off
scores, and satisfactory internal reliability (DeVellis, 2003; Murphy & Davidshofer,
2001). It also contrasts with usual practice for development of screens which is to
reduce the scale to the smallest possible number of items which can reliably identify
the behaviour (Brown, Leonard, Saunders & Papasouliotis, 2001). Thus, usual
statistical approaches that apply to scale development, such as item-response theory
are difficult to apply in this context.
Nonetheless, as the checklist relies on determining status from observable indicators,
much like diagnosing an individual with an illness, the types of analyses used in the
medical literature may be informative. However, such diagnoses are often determined
by either one particularly reliable indicator (e.g., detecting anti-bodies from a blood
sample), or by a cluster of features that can present over a considerable time-period,
and which patients can self-report (e.g., a self-report screen for drug and alcohol use or
mental health issues). It is evident from the review, that identifying behavioural
indicators in a gambling venue differs from this. First, there is no single reliable
indicator that can be used to identify problem gamblers from non-problem gamblers.
Second, it may not always be possible to observe the same individual over multiple
sessions to determine the stability of indicators or whether the person’s gambling has
changed over time (although as discussed in the literature review, some research has
indicated that this was sometimes possible). Third, only observable indicators are used,
so the checklist cannot rely upon self-report. Hence, the statistical approaches used in
the medical literature are likely to differ from those required to develop the checklist.
59
Due to the uniqueness of the type of analyses required, an extensive literature search
showed the only relevant research that may inform the statistical approach for this
validation study were the two previous quantitative studies that attempted to identify
behavioural indicators in a gambling setting (Delfabbro et al, 2007; Schellinck &
Schrans, 2004). The former study (Schellinck & Schrans, 2004) used ‘association
analysis’, which, as described in the literature review, is often used for data-mining in
marketing research. The analysis does not involve any inferential statistics. Rather, it
provides information about the rules of association between particular indicator(s) and
a given event (in this case, attending a gaming venue). The prior probability that a
gambler at a venue is a problem gambler is calculated, and then the increase in this
probability given observation of a particular indicator, or group of indicators (this is
calculated in two different ways, and depends on distinction) is determined. For each
indicator, the likelihood of a problem gambler exhibiting a given indicator during a
session (frequency) is also calculated.
Overall, association analysis is beneficial as it provides information that is directly
relevant to determining the likelihood that a gambler at a venue is a problem gambler.
The analysis also incorporates the prior probability of being a problem gambler, rather
than assuming the null hypothesis as is the case with inferential statistics. The
downside of the analysis is that distinction and frequency are calculated separately for
each indicator, so there is no overall measure for the performance of each indicator.
Additionally, indicators (or small groups of indicators) are examined separately, rather
than being incorporated into a model. Thus, the relationship between indicators is not
tested. Finally, association analysis does not make any inferences from the sample
data to the population, and so is not able to provide confidence intervals for the data.
The latter study (Delfabbro et al, 2007) used inferential statistics, specifically, logistic
regression, to make inferences to the population from which the sample was drawn.
When using a dichotomous outcome variable (problem-gambling status), logistic

60
regression is a common choice. It requires no assumptions about the distribution of the
predictor variables, and predictors can be continuous, discrete, or mixed. Thus, there
are few issues that arise due to the way in which the predictor variables (the indicators)
were measured.
For each indicator, Delfabbro and colleagues (2007) calculated a ratio of the frequency
at which problem gamblers exhibit the behavioural indicator over the frequency at
which non-problem gamblers exhibit the behavioural indicator. Such ratios incorporate
both distinction and frequency, and so provide an overall measure of the performance
of each indicator. Indicators were grouped into categories of related behaviours (e.g.,
impaired control, social behaviours, emotional responses), and the ratios for each
group of indicators were entered into separate logistic regressions, in order to identify
which were able to significantly predicting gambling status. The significant predictors in
each regression were then entered together into one final logistic regression. Only
those indicators that remained significant in this final regression were retained. As
multi-collinearity between predictors is likely to be high (many predictors are likely to be
related), and only unique variance is tested in regressions, only five predictors
remained significant (gambling continuously, playing very fast, leaving venue to search
for further funds, cried after losing, appearing nervous/edgy). Thus, the study was able
to make inferences about indicators from the sample to the population, but most
indicators were discarded in the final models.
Following this review, this study will use a combination of statistical approaches. As
discussed in detail in this review, behaviours displayed by problem gamblers are likely
to differ not only between people but also within the same person across different
visits. Therefore, the unique circumstances of this type of screen mean it would not be
advantageous to dramatically reduce the number of indicative behaviours available to
staff. To avoid this outcome, odd-ratios and cross-tabulation analyses, which were
used effectively in the earlier study by Delfabbro et al. (2007) will again be used. These

61
analyses will assist by providing useful information concerning the relative importance
of individual indicators.
The study will also use logistic regression analyses to identify the strongest predictors
of problem gambling. An additional statistical approach, Bayesian analysis, will also be
used to overcome some of the issues related to association analysis and traditional
inferential statistics (logistic regression). Like association analysis, Bayesian analysis
starts with a model that incorporates the prior probability that a gambler is a problem
gambler (rather than spuriously assuming a null hypothesis). Then, as information
accrues about the association rules for each indicator (how much more likely a gambler
is to be a problem gambler given a particular indicator), the model is updated. All
indicators can be entered into the model at once, so the relationship between indicators
is incorporated into the model (unlike association analysis). This increases the
accuracy of the model. Furthermore, unlike inferential statistics, Bayesian analysis
does not depend on arbitrary p-values which determine whether or not a variable is
retained, nor is multi-collinearity an issue in Bayesian analysis. Thus, all indicators can
be retained, and can contribute to the model. Finally, the model can be updated
whenever more information accrues. Thus, as more is learned about the association
between problem-gambling status and various behavioural indicators, this information
can be incorporated. The analysis does not have to be re-run, as would be the case
with traditional inferential statistics and association analysis. Hence, although no
inferences are made about the performance of indicators in the population (as is the
case with inferential statistics), the sample size may eventually become sufficiently
large that it is not necessary to make such inferences (Kruschke, 2010).
2.3 Results
Data from the 2013 data collection form the basis of these results. However, as this
study is primarily a validation study of the research conducted by Delfabbro et al.

62
(2007) we have referred to results from that study and conducted comparative analysis
between the two studies. This has been done to check validity in terms of reliability or
stability of results from 2007 to 2013 data. When we have referred to data from the
Delfabbro et al.(2007) study we have termed this the ‘2007’ data.
2.3.1 EGM Gambling Behaviour over the past 12 months
Of the 505 participants, 498 completed the PGSI. This group were used for the
remaining analyses. We combined people in the no and low risk categories to create
three final risk categories: no-low risk gamblers (LRG); moderate risk gamblers (MRG)
and problem gamblers (PG). An examination of the frequency of EGM gambling
behaviour over the past 12 months showed that there was a general pattern of more
frequent gambling at each of the venue types by higher risk gamblers compared to
lower risk gamblers (see Table 8). This pattern was similar across clubs, hotels and
casinos.
Table 8: Frequency of EGM gambling over the past 12 months
Never Occasionally Often Very Often
n % n % n % n %
EGM gambling at hotels
Low risk gamblers 26 17.4 21 14.1 72 48.3 30 20.1
Moderate risk gamblers 7 4.7 22 14.9 60 40.5 59 39.9
Problem Gamblers 9 4.5 28 13.9 43 21.4 121 60.2
EGM gambling at clubs
Low risk gamblers 28 18.8 32 21.5 62 41.6 27 18.1
Moderate risk gamblers 20 13.5 28 18.9 54 36.5 46 31.1
Problem Gamblers 24 11.9 28 13.9 47 23.4 102 50.7
EGM gambling at Casinos
Low risk gamblers 48 32.2 73 49.0 20 13.4 8 5.4
Moderate risk gamblers 35 23.6 70 47.3 32 21.6 11 7.4
Problem Gamblers 46 22.9 78 38.8 38 18.9 39 19.4
Percentages for each row sum to 100%
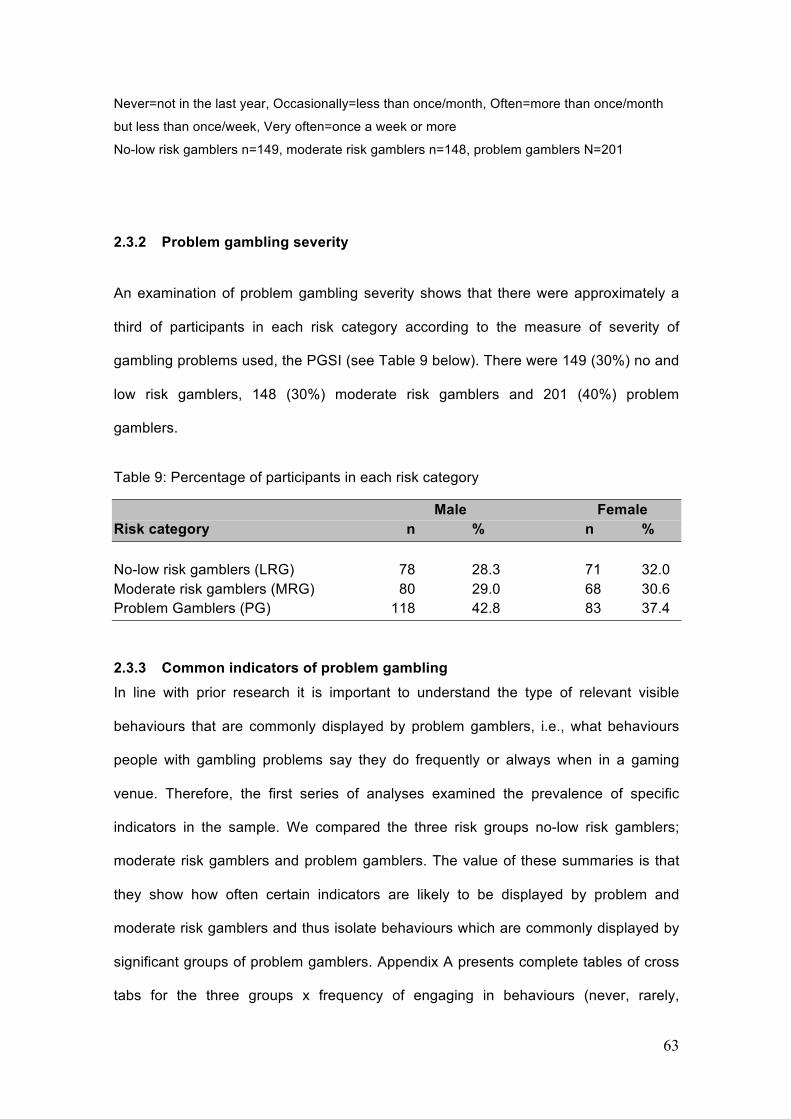
63
Never=not in the last year, Occasionally=less than once/month, Often=more than once/month
but less than once/week, Very often=once a week or more
No-low risk gamblers n=149, moderate risk gamblers n=148, problem gamblers N=201
2.3.2 Problem gambling severity
An examination of problem gambling severity shows that there were approximately a
third of participants in each risk category according to the measure of severity of
gambling problems used, the PGSI (see Table 9 below). There were 149 (30%) no and
low risk gamblers, 148 (30%) moderate risk gamblers and 201 (40%) problem
gamblers.
Table 9: Percentage of participants in each risk category
Male Female Risk category n % n % No-low risk gamblers (LRG) 78 28.3 71 32.0 Moderate risk gamblers (MRG) 80 29.0 68 30.6 Problem Gamblers (PG) 118 42.8 83 37.4
2.3.3 Common indicators of problem gambling In line with prior research it is important to understand the type of relevant visible
behaviours that are commonly displayed by problem gamblers, i.e., what behaviours
people with gambling problems say they do frequently or always when in a gaming
venue. Therefore, the first series of analyses examined the prevalence of specific
indicators in the sample. We compared the three risk groups no-low risk gamblers;
moderate risk gamblers and problem gamblers. The value of these summaries is that
they show how often certain indicators are likely to be displayed by problem and
moderate risk gamblers and thus isolate behaviours which are commonly displayed by
significant groups of problem gamblers. Appendix A presents complete tables of cross
tabs for the three groups x frequency of engaging in behaviours (never, rarely,

64
occasionally, frequently or always) for all behaviours. Chi-squared analyses confirmed
that the prevalence of ‘frequent’ and ‘always’ responses were significantly higher for
higher risk gamblers compared to lower risk gamblers for all of the behaviours and
indicators. Below we present the behaviours that at least 25% of problem gamblers
reported engaging in frequently or always, i.e., common behaviours of problem
gamblers.
Frequency, duration and intensity indicators
Eight of the 12 items reflecting how intensely or frequently a person gambled were
commonly reported by problem gamblers (see Table 10). As can be seen problem
gamblers are likely to gamble quickly and will be so focussed on their play they do not
stop to enjoy wins. They are likely to play for significant periods of time without a break
and spend significant amounts in a session.
Table 10: Intensity and duration behaviours commonly displayed by problem gamblers
Frequency, duration and intensity indicators %
gambling three hours or more without a proper break 41
gambling so intensely, that they lose track of things around them 38
very fast gambling 42
betting $2.50 or more most of the time 28
gambling on after the jingle starts 57
rushing from one machine to another 46
spending more than $300 or more per session 67
changing expenditure patterns 33
Percentage of problem gamblers who engaged in the behaviour ‘frequently’ or ‘always’
Indicators of Impaired Choice or Control
Three of the five items around impaired control were commonly shown by problem
gamblers, particularly around still gambling at closing time (see Table 11).
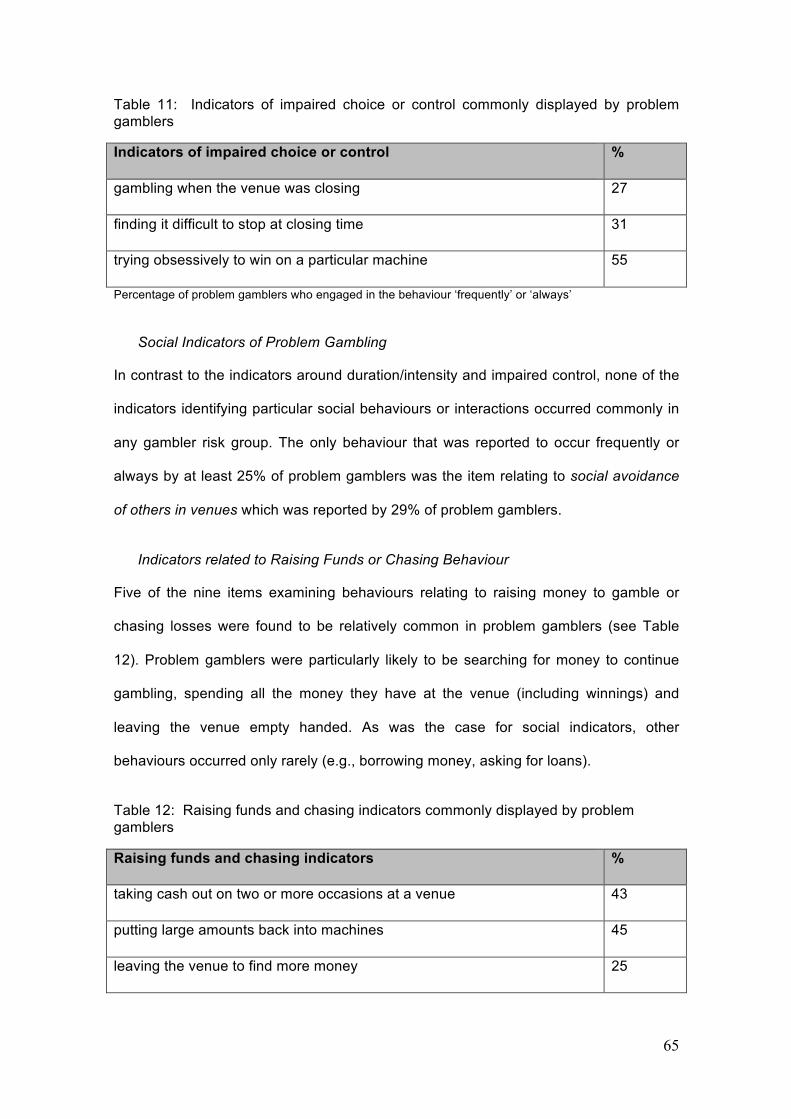
65
Table 11: Indicators of impaired choice or control commonly displayed by problem gamblers
Indicators of impaired choice or control %
gambling when the venue was closing 27
finding it difficult to stop at closing time 31
trying obsessively to win on a particular machine 55
Percentage of problem gamblers who engaged in the behaviour ‘frequently’ or ‘always’
Social Indicators of Problem Gambling
In contrast to the indicators around duration/intensity and impaired control, none of the
indicators identifying particular social behaviours or interactions occurred commonly in
any gambler risk group. The only behaviour that was reported to occur frequently or
always by at least 25% of problem gamblers was the item relating to social avoidance
of others in venues which was reported by 29% of problem gamblers.
Indicators related to Raising Funds or Chasing Behaviour
Five of the nine items examining behaviours relating to raising money to gamble or
chasing losses were found to be relatively common in problem gamblers (see Table
12). Problem gamblers were particularly likely to be searching for money to continue
gambling, spending all the money they have at the venue (including winnings) and
leaving the venue empty handed. As was the case for social indicators, other
behaviours occurred only rarely (e.g., borrowing money, asking for loans).
Table 12: Raising funds and chasing indicators commonly displayed by problem gamblers
Raising funds and chasing indicators %
taking cash out on two or more occasions at a venue 43
putting large amounts back into machines 45
leaving the venue to find more money 25

66
rummaging around for additional money in handbags or wallets 38
running out of all available money at the venue 50
Percentage of problem gamblers who engaged in the behaviour ‘frequently’ or ‘always’
Emotional and Physiological Indicators of Problem Gambling
Of the 11 items examining potentially visible emotional and physiological responses
only three were endorsed by 25% or more problem gamblers, most commonly feeling
sad or depressed after gambling (see Table 13).
Table 13: Emotional and physiological indicators commonly displayed by problem gamblers
Emotional and physiological indicators %
felt nervous or edgy 25
felt sad and depressed after gambling 50
experienced a significant mood change during sessions 43
Percentage of problem gamblers who engaged in the behaviour ‘frequently’ or ‘always’
Other Behaviours and Gambling
Respondents were also asked to indicate whether they engaged in a range of
miscellaneous behaviours. The most commonly reported behaviours amongst problem
gamblers were gambling after drinking a lot of alcohol (26%) and blaming machines or
venues for losing (28%) (reported frequently or always by at least 25% of problem
gamblers).
Based on the results above, it would appear that the most prevalent indicators of
problem gambling which can be observed in venues relate to the duration and intensity
of gambling (e.g., playing for long periods without interruption, being totally involved in
the process of gambling, playing rapidly or frenetically) or raising funds/chasing
behaviours (e.g., using ATMs etc. multiple times, spending all available money).
Indicators related to social or emotional responses were much less frequently
displayed but the most common of these related to avoiding contact and appearing sad

67
or depressed after gambling. In terms of impaired control customers who are still
gambling at closing time and who do not want to leave may be experiencing problems.
Others may blame staff or venues for losing or drink alcohol while gambling.
2.3.4 Reliability of common indicators As an indicator of reliability, we examined the more common indicators displayed
frequently or always by problem gamblers in the 2013 study compared to the earlier
2007 study (for indicators that were included in both studies)9. See Table 14 below
which shows the visible indicators most likely to be observed frequently or always in
problem gamblers 2013 percentages compared to 2007.
Table 14: Common visible indicators in problem gamblers 2013 v 2007
Indicator 2013 % 2007 % Frequency, Duration and Intensity Spend more than $300 in one session of gambling 67 - Playing on without listening to the jingle 57 44 Rush from one machine to another 46 17 Play very fast 42 45 Gamble for 3 or more hours without a proper break 41 39 Gambling intensely, lose track of things around them 38 40 Significant change in expenditure pattern 33 - Bet $2.50 or more per spin 28 - Impaired Control Try to win obsessively on one machine 63 55 Find it difficult to stop at closing time 31 19 Stop only when the venue is closing 27 14 Social Behaviours Avoided contact 29 34 Raising Funds / Chasing behaviour Run out of all available money at venue 50 - Got cash out 2+ times from ATM or EFTPOS 43 45 Put large amounts of money back into machine 45 39 Rummage around for more money 38 - Leave the venue to find more money 25 22 Emotional responses Felt sad and depressed 50 67
9 Some variables were identified as part of the 2007 investigation (e.g., in feedback from respondents and in qualitative components of the investigation), but were not part of the formal quantitative validation in this earlier study. These are indicated by“-“.
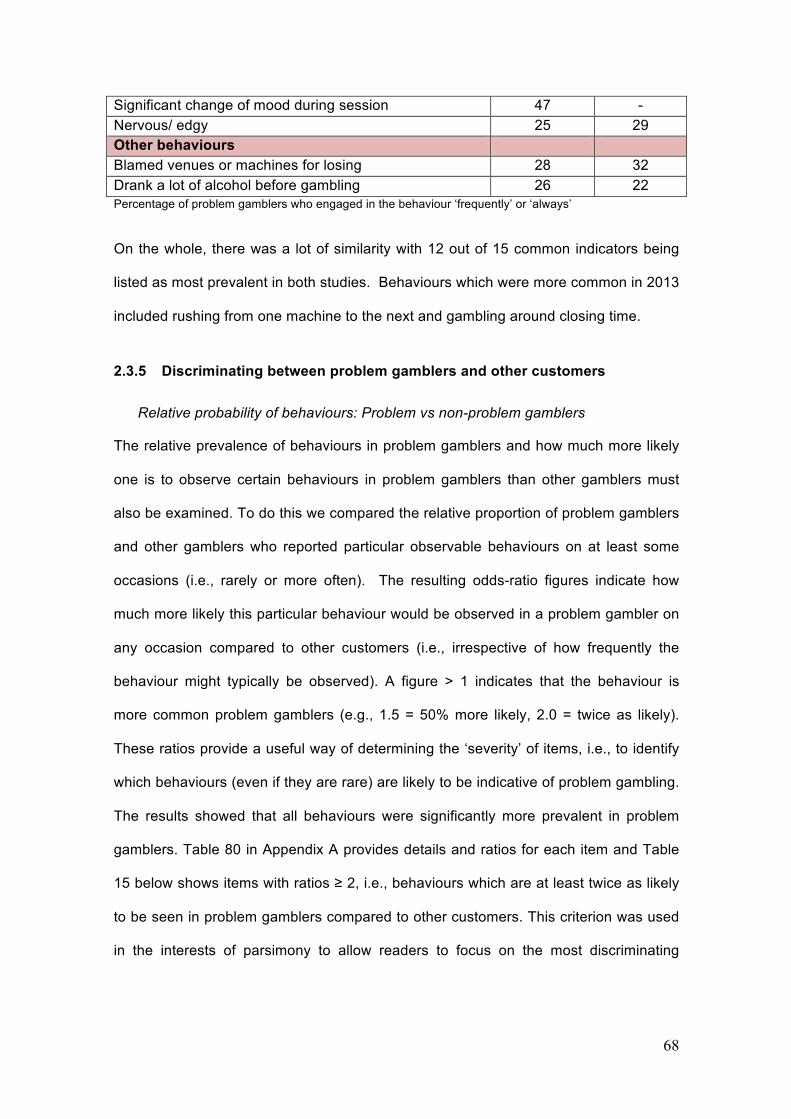
68
Significant change of mood during session 47 - Nervous/ edgy 25 29 Other behaviours Blamed venues or machines for losing 28 32 Drank a lot of alcohol before gambling 26 22 Percentage of problem gamblers who engaged in the behaviour ‘frequently’ or ‘always’
On the whole, there was a lot of similarity with 12 out of 15 common indicators being
listed as most prevalent in both studies. Behaviours which were more common in 2013
included rushing from one machine to the next and gambling around closing time.
2.3.5 Discriminating between problem gamblers and other customers
Relative probability of behaviours: Problem vs non-problem gamblers
The relative prevalence of behaviours in problem gamblers and how much more likely
one is to observe certain behaviours in problem gamblers than other gamblers must
also be examined. To do this we compared the relative proportion of problem gamblers
and other gamblers who reported particular observable behaviours on at least some
occasions (i.e., rarely or more often). The resulting odds-ratio figures indicate how
much more likely this particular behaviour would be observed in a problem gambler on
any occasion compared to other customers (i.e., irrespective of how frequently the
behaviour might typically be observed). A figure > 1 indicates that the behaviour is
more common problem gamblers (e.g., 1.5 = 50% more likely, 2.0 = twice as likely).
These ratios provide a useful way of determining the ‘severity’ of items, i.e., to identify
which behaviours (even if they are rare) are likely to be indicative of problem gambling.
The results showed that all behaviours were significantly more prevalent in problem
gamblers. Table 80 in Appendix A provides details and ratios for each item and Table
15 below shows items with ratios ≥ 2, i.e., behaviours which are at least twice as likely
to be seen in problem gamblers compared to other customers. This criterion was used
in the interests of parsimony to allow readers to focus on the most discriminating
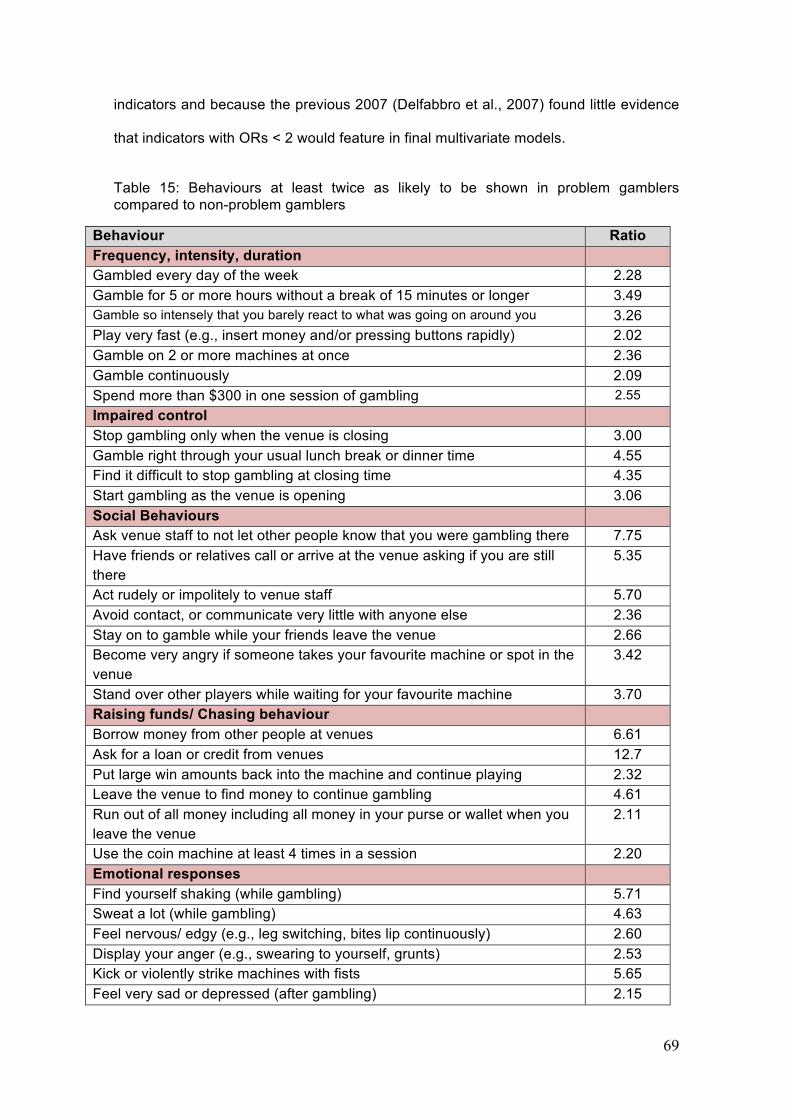
69
indicators and because the previous 2007 (Delfabbro et al., 2007) found little evidence
that indicators with ORs < 2 would feature in final multivariate models.
Table 15: Behaviours at least twice as likely to be shown in problem gamblers compared to non-problem gamblers
Behaviour Ratio Frequency, intensity, duration Gambled every day of the week 2.28 Gamble for 5 or more hours without a break of 15 minutes or longer 3.49 Gamble so intensely that you barely react to what was going on around you 3.26 Play very fast (e.g., insert money and/or pressing buttons rapidly) 2.02 Gamble on 2 or more machines at once 2.36 Gamble continuously 2.09 Spend more than $300 in one session of gambling 2.55 Impaired control Stop gambling only when the venue is closing 3.00 Gamble right through your usual lunch break or dinner time 4.55 Find it difficult to stop gambling at closing time 4.35 Start gambling as the venue is opening 3.06 Social Behaviours Ask venue staff to not let other people know that you were gambling there 7.75 Have friends or relatives call or arrive at the venue asking if you are still there
5.35
Act rudely or impolitely to venue staff 5.70 Avoid contact, or communicate very little with anyone else 2.36 Stay on to gamble while your friends leave the venue 2.66 Become very angry if someone takes your favourite machine or spot in the venue
3.42
Stand over other players while waiting for your favourite machine 3.70 Raising funds/ Chasing behaviour Borrow money from other people at venues 6.61 Ask for a loan or credit from venues 12.7 Put large win amounts back into the machine and continue playing 2.32 Leave the venue to find money to continue gambling 4.61 Run out of all money including all money in your purse or wallet when you leave the venue
2.11
Use the coin machine at least 4 times in a session 2.20 Emotional responses Find yourself shaking (while gambling) 5.71 Sweat a lot (while gambling) 4.63 Feel nervous/ edgy (e.g., leg switching, bites lip continuously) 2.60 Display your anger (e.g., swearing to yourself, grunts) 2.53 Kick or violently strike machines with fists 5.65 Feel very sad or depressed (after gambling) 2.15

70
Cry after losing a lot of money 7.62 Sit with your head in hands after losing 5.94 Play the machine very roughly and aggressively (e.g., with fists or slaps) 3.89 Groan repeatedly while gambling 2.96 Feel a significant change in your mood during sessions 2.15 Other behaviours Avoid the cashier and only use cash facilities 4.02 Notice decline in grooming/ appearance 11.0 Blame venues or machines for losing 2.78 Complain to staff about losing 4.80 Swear at machines or venue staff because you are losing 4.32 Compulsively rub the machine 2.02
As in the 2007 study, indicators tended to fall into different clusters using this analysis.
Some behaviours are more prevalent amongst problem gamblers, but also reasonably
common amongst non-problem gamblers resulting in low ratios (e.g., playing on
without stopping to listen for the jingle; trying to win obsessively on a particular
machine; asking to change large notes at a venue). Other behaviours are rarer and are
typically only reported by problem gamblers, resulting in large ratios (e.g., asking the
venue not the reveal the presence of the gambler; trying to borrow money from people
at the venue and social or emotional behaviours such as being rude to staff, shaking
kicking machines or crying). Other indicators tended to fall in between these two
extremes.
The results also showed that the items that best differentiate between the two groups
are not necessarily the ones that occur most often. Whereas section 2.2.3 showed that
seven behaviours relating to frequency, duration and intensity were likely to be shown
by problem gamblers at any given session (occurring on most, if not all, venue visits),
only one of these items had an odds-ratio of greater than 3. Thus, by themselves,
these behaviours may not work as well to identify a problem gambler as other items.
These figures do not allow one to specify the reverse probability, (i.e., Probability of
problem gambler given the presence of an indicator), but they show that there is a
71
range of potentially visible behaviours which are very rare in non-problem players and
much more common in problem gamblers. These results provide support for the
conclusions from the 2007 study; namely, that there are distinctive profiles of
potentially observable behaviour that theoretically could allow one to differentiate
between problem gamblers and other players.
Relative probability of behaviour across all risk levels
There is also interest in knowing to what extent indicators are likely to differentiate
between different levels of risk over and above those which differentiate between
problem gamblers and others. In particular whether there are there specific indicators
which clearly differentiate between:
(a) problem gamblers and moderate risk gamblers
(b) moderate risk gamblers and low-no risk gamblers,
(c) higher risk gamblers (being both problem-moderate risk gamblers) and lower risk
gamblers (low-no risk gamblers).
Table 81 in Appendix A displays all of these different ratios for each item. The sections
below discuss items which discriminate between these higher and lower risk gamblers.
High Severity Indicators: Table 16 shows behaviours which differentiate best between
problem and moderate risk gamblers. We have displayed those which are at least twice
as likely to be seen in problem gamblers than those who are moderately at risk of
gambling problems. As can be seen, these indicators tend to be at the more severe
end of the behavioural spectrum, such as gambling for 5 or more hours without a
break, finding it difficult to stop at closing time, hiding out from family or friends, having
strong emotional reactions and using different methods to try to raise funds. These
behaviours also had higher odds-ratio scores when problem and non-problem
gamblers were compared.
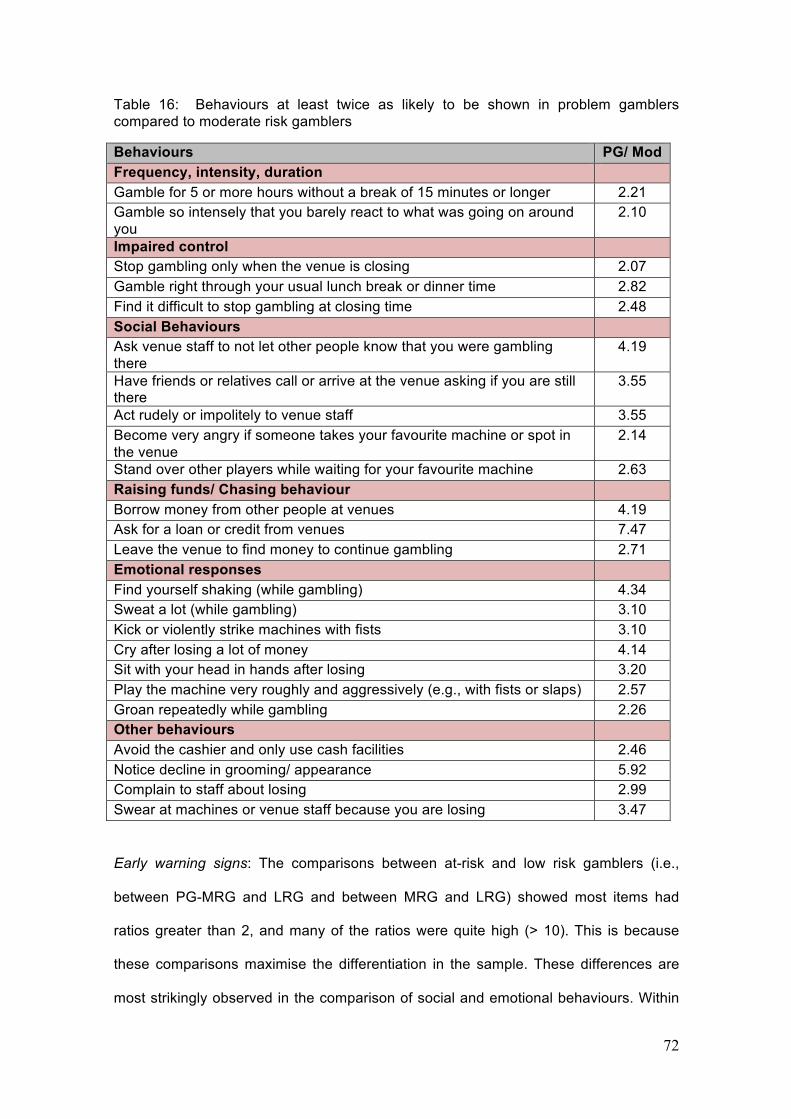
72
Table 16: Behaviours at least twice as likely to be shown in problem gamblers compared to moderate risk gamblers
Behaviours PG/ Mod Frequency, intensity, duration Gamble for 5 or more hours without a break of 15 minutes or longer 2.21 Gamble so intensely that you barely react to what was going on around you
2.10
Impaired control Stop gambling only when the venue is closing 2.07 Gamble right through your usual lunch break or dinner time 2.82 Find it difficult to stop gambling at closing time 2.48 Social Behaviours Ask venue staff to not let other people know that you were gambling there
4.19
Have friends or relatives call or arrive at the venue asking if you are still there
3.55
Act rudely or impolitely to venue staff 3.55 Become very angry if someone takes your favourite machine or spot in the venue
2.14
Stand over other players while waiting for your favourite machine 2.63 Raising funds/ Chasing behaviour Borrow money from other people at venues 4.19 Ask for a loan or credit from venues 7.47 Leave the venue to find money to continue gambling 2.71 Emotional responses Find yourself shaking (while gambling) 4.34 Sweat a lot (while gambling) 3.10 Kick or violently strike machines with fists 3.10 Cry after losing a lot of money 4.14 Sit with your head in hands after losing 3.20 Play the machine very roughly and aggressively (e.g., with fists or slaps) 2.57 Groan repeatedly while gambling 2.26 Other behaviours Avoid the cashier and only use cash facilities 2.46 Notice decline in grooming/ appearance 5.92 Complain to staff about losing 2.99 Swear at machines or venue staff because you are losing 3.47
Early warning signs: The comparisons between at-risk and low risk gamblers (i.e.,
between PG-MRG and LRG and between MRG and LRG) showed most items had
ratios greater than 2, and many of the ratios were quite high (> 10). This is because
these comparisons maximise the differentiation in the sample. These differences are
most strikingly observed in the comparison of social and emotional behaviours. Within
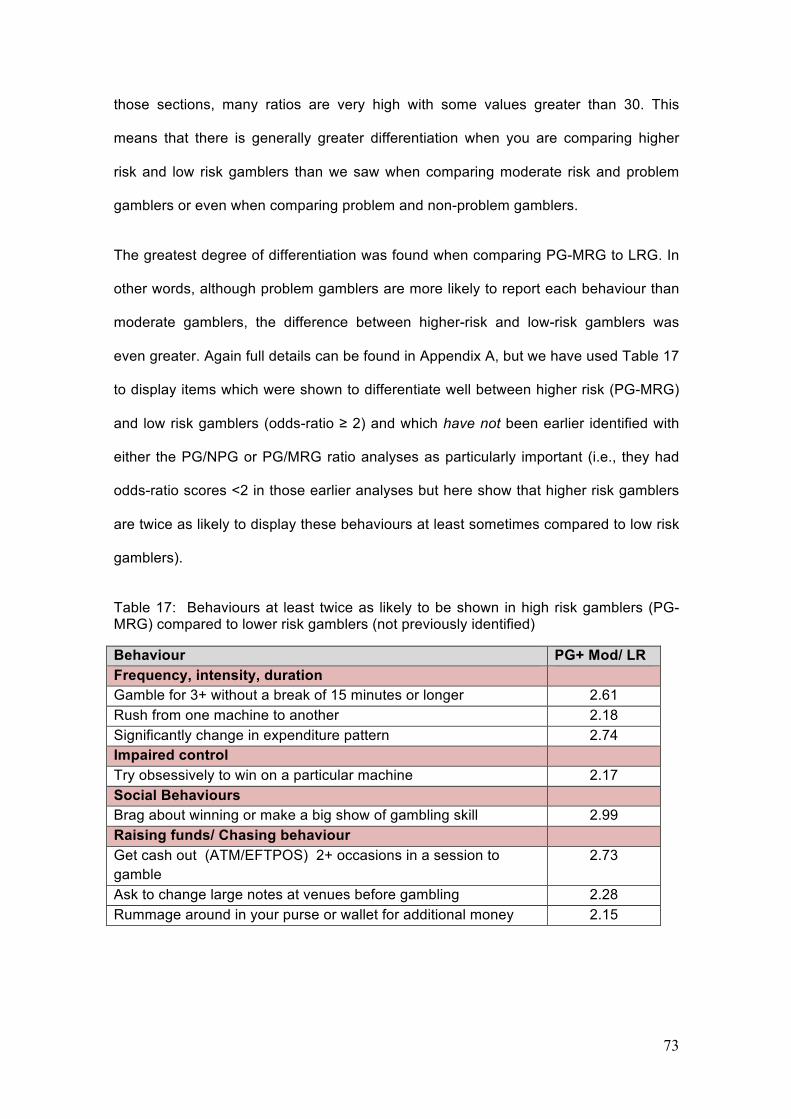
73
those sections, many ratios are very high with some values greater than 30. This
means that there is generally greater differentiation when you are comparing higher
risk and low risk gamblers than we saw when comparing moderate risk and problem
gamblers or even when comparing problem and non-problem gamblers.
The greatest degree of differentiation was found when comparing PG-MRG to LRG. In
other words, although problem gamblers are more likely to report each behaviour than
moderate gamblers, the difference between higher-risk and low-risk gamblers was
even greater. Again full details can be found in Appendix A, but we have used Table 17
to display items which were shown to differentiate well between higher risk (PG-MRG)
and low risk gamblers (odds-ratio ≥ 2) and which have not been earlier identified with
either the PG/NPG or PG/MRG ratio analyses as particularly important (i.e., they had
odds-ratio scores <2 in those earlier analyses but here show that higher risk gamblers
are twice as likely to display these behaviours at least sometimes compared to low risk
gamblers).
Table 17: Behaviours at least twice as likely to be shown in high risk gamblers (PG-MRG) compared to lower risk gamblers (not previously identified)
Behaviour PG+ Mod/ LR Frequency, intensity, duration Gamble for 3+ without a break of 15 minutes or longer 2.61 Rush from one machine to another 2.18 Significantly change in expenditure pattern 2.74 Impaired control Try obsessively to win on a particular machine 2.17 Social Behaviours Brag about winning or make a big show of gambling skill 2.99 Raising funds/ Chasing behaviour Get cash out (ATM/EFTPOS) 2+ occasions in a session to gamble
2.73
Ask to change large notes at venues before gambling 2.28 Rummage around in your purse or wallet for additional money 2.15
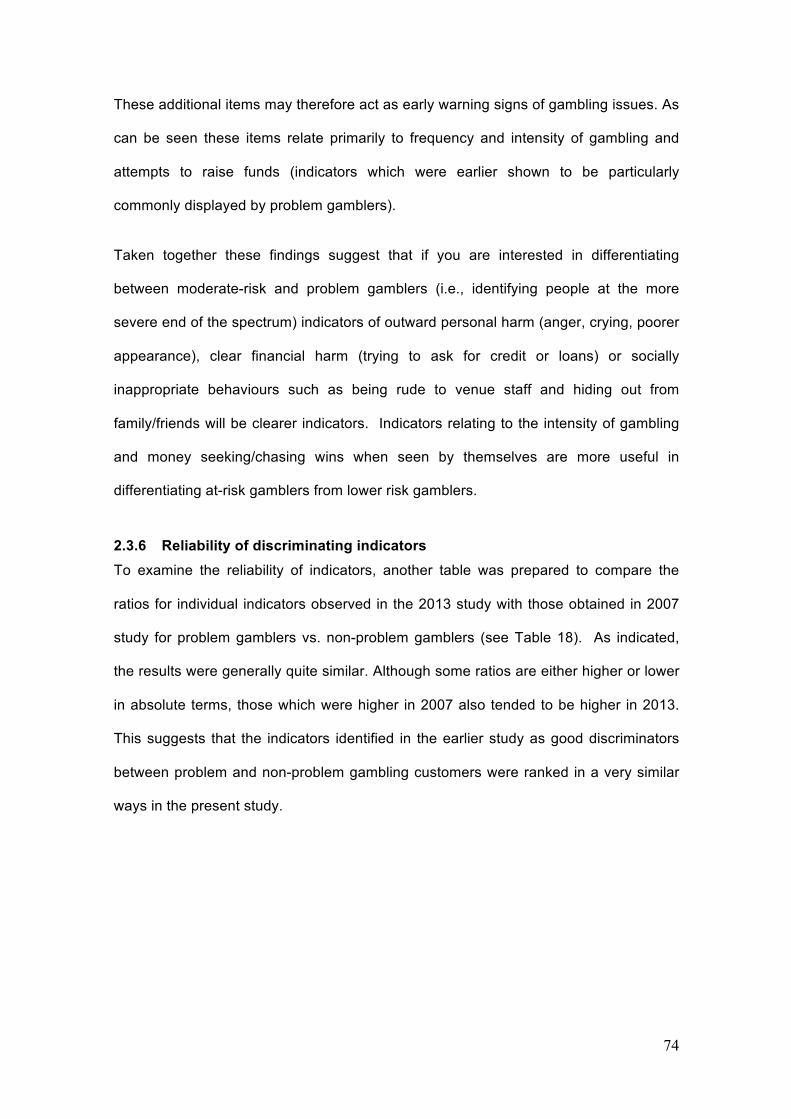
74
These additional items may therefore act as early warning signs of gambling issues. As
can be seen these items relate primarily to frequency and intensity of gambling and
attempts to raise funds (indicators which were earlier shown to be particularly
commonly displayed by problem gamblers).
Taken together these findings suggest that if you are interested in differentiating
between moderate-risk and problem gamblers (i.e., identifying people at the more
severe end of the spectrum) indicators of outward personal harm (anger, crying, poorer
appearance), clear financial harm (trying to ask for credit or loans) or socially
inappropriate behaviours such as being rude to venue staff and hiding out from
family/friends will be clearer indicators. Indicators relating to the intensity of gambling
and money seeking/chasing wins when seen by themselves are more useful in
differentiating at-risk gamblers from lower risk gamblers.
2.3.6 Reliability of discriminating indicators To examine the reliability of indicators, another table was prepared to compare the
ratios for individual indicators observed in the 2013 study with those obtained in 2007
study for problem gamblers vs. non-problem gamblers (see Table 18). As indicated,
the results were generally quite similar. Although some ratios are either higher or lower
in absolute terms, those which were higher in 2007 also tended to be higher in 2013.
This suggests that the indicators identified in the earlier study as good discriminators
between problem and non-problem gambling customers were ranked in a very similar
ways in the present study.

75
Table 18: Comparative problem/ non-problem gambler risk ratios: 2013 vs 2007 study
Indicators 2013 2007 Frequency, intensity, duration Gambled every day of the week 2.28 2.36 Gamble for 3+ hours without a break of 15 minutes or longer 1.95 2.23 Gamble for 5+ hours without a break of 15 minutes or longer 3.49 - Gambles intensely (does not react to external stimuli) 3.26 3.64 Plays very fast (inserting money/pushing buttons rapidly) 2.02 2.14 Bet $2.50 or more per spin most of the time 1.92 - Plays on quickly after wins (not listening to music or jingle) 1.43 1.60 Rush from one machine to another 1.80 2.67 Gamble on 2 or more machines at once 2.36 - Gamble continuously 2.09 2.94 Spend more than $300 in one session of gambling 2.55 - Significantly change (increase) in expenditure pattern 1.91 - Impaired control Stop gambling only when the venue is closing 3.00 2.64 Gamble right through your usual lunch break or dinner time 4.55 4.41 Find it difficult to stop gambling at closing time 4.35 5.31 Try obsessively to win on a particular machine 1.55 1.72 Start gambling as the venue is opening 3.06 2.60 Social Behaviours Ask venue staff to not let people know they there 7.75 8.00 Have friends or relatives call or asking if you are still there 5.35 5.25 Act rudely or impolitely to venue staff 5.70 3.29 Avoid contact, or communicate very little with anyone else 2.36 2.71 Stay on to gamble while your friends leave the venue 2.66 2.33 Become very angry if someone takes favourite machine/spot 3.42 3.50 Brag about winning or make a big show of gambling skill 1.95 - Stand over other players while waiting for favourite machine 3.70 - Raising funds/ Chasing behaviour Get cash out (ATM/EFTPOS) on 2+ occasions in single session 1.85 2.07 Ask to change large notes at venues before gambling 1.56 1.72 Borrow money from other people at venues 6.61 4.91 Ask for a loan or credit from venues 12.7 16.00 Put large win amounts back into the machine, continue playing 2.32 2.02 Leave the venue to find money to continue gambling 4.61 3.70 Rummage around in your purse or wallet for additional money 1.79 - Run out of all money including in purse/wallet when leave 2.11 - Use the coin machine at least 4 times in a session 2.20 -
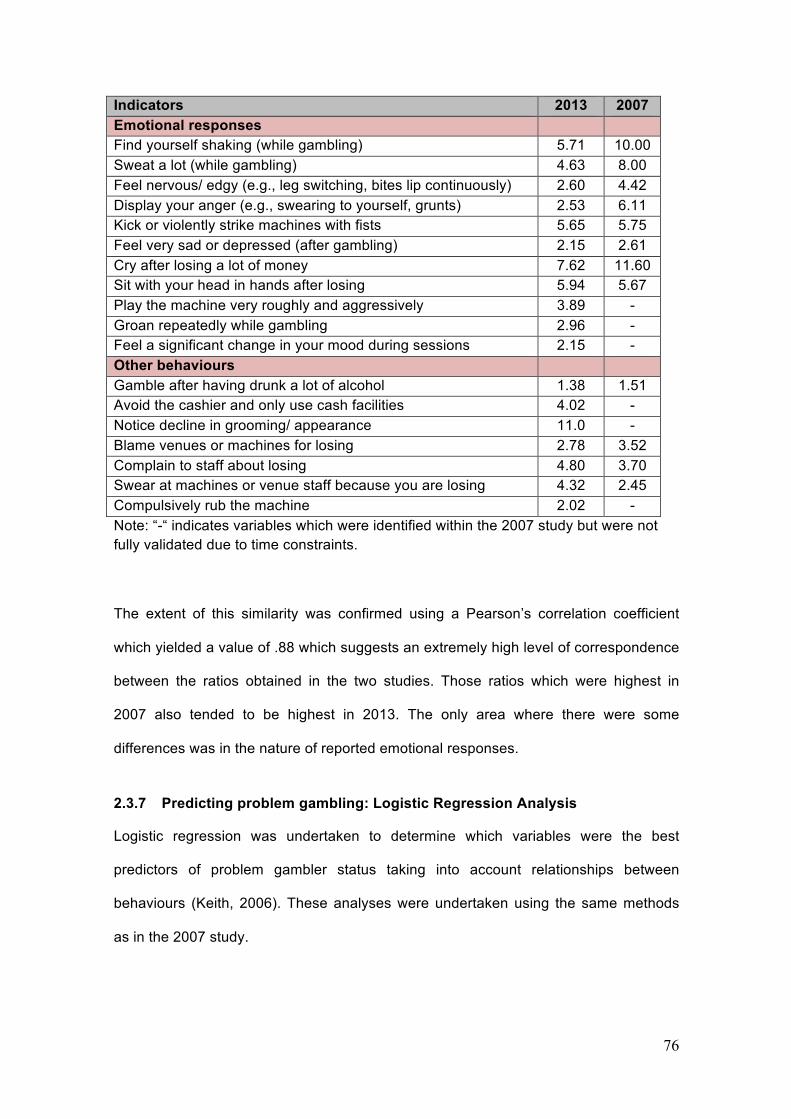
76
Indicators 2013 2007 Emotional responses Find yourself shaking (while gambling) 5.71 10.00 Sweat a lot (while gambling) 4.63 8.00 Feel nervous/ edgy (e.g., leg switching, bites lip continuously) 2.60 4.42 Display your anger (e.g., swearing to yourself, grunts) 2.53 6.11 Kick or violently strike machines with fists 5.65 5.75 Feel very sad or depressed (after gambling) 2.15 2.61 Cry after losing a lot of money 7.62 11.60 Sit with your head in hands after losing 5.94 5.67 Play the machine very roughly and aggressively 3.89 - Groan repeatedly while gambling 2.96 - Feel a significant change in your mood during sessions 2.15 - Other behaviours Gamble after having drunk a lot of alcohol 1.38 1.51 Avoid the cashier and only use cash facilities 4.02 - Notice decline in grooming/ appearance 11.0 - Blame venues or machines for losing 2.78 3.52 Complain to staff about losing 4.80 3.70 Swear at machines or venue staff because you are losing 4.32 2.45 Compulsively rub the machine 2.02 - Note: “-“ indicates variables which were identified within the 2007 study but were not fully validated due to time constraints.
The extent of this similarity was confirmed using a Pearson’s correlation coefficient
which yielded a value of .88 which suggests an extremely high level of correspondence
between the ratios obtained in the two studies. Those ratios which were highest in
2007 also tended to be highest in 2013. The only area where there were some
differences was in the nature of reported emotional responses.
2.3.7 Predicting problem gambling: Logistic Regression Analysis
Logistic regression was undertaken to determine which variables were the best
predictors of problem gambler status taking into account relationships between
behaviours (Keith, 2006). These analyses were undertaken using the same methods
as in the 2007 study.

77
Initial models were run for each group of indicators (e.g., Intensity, duration, social
behaviours) to identify the strongest indicators for a final model. Variables which did not
prove to be significant in these individual regressions were dropped and the final model
was developed based only on the significant variables10. Complete results for these
initial models can be found in Appendix A in Tables 82-87.
All of the indicators found to be significant in the initial models were entered into final
models to identify the overall strongest indicators of problem gambler status. An overall
model was run first (Table19).
Table 19: Final model: Overall best independent predictors of problem gambler status
Predictors of PG status B SE Wald Odds ratio 95% CI
Constant -4.50
Bet $2.50+ per spin most times 1.10 .34 10.8 3.01 1.56-5.80
Leave venue to find more money 1.24 .30 16.6 3.46 1.91-6.27
Sad or depressed after gambling 1.66 .41 16.5 5.23 2.53-11.64
Change in grooming/ appearance 1.59 .36 19.4 4.88 2.41-9.88
Gamble through meal breaks .89 .30 8.6 2.43 1.35-4.41
Put money back in and keep playing .98 .38 6.7 2.67 1.18-5.61
86.9% of cases correctly classified, Nagelkerke R = .67
This was followed with the development of separate models for males (Table 20) and
females (Table 21). As with the overall model, the modelling process occurred in two
stages with all variables were entered in their respective groups as initial models and
10 In the interests of developing a more inclusive model, the criteria for inclusion was that the variable was significant p < .10 in the first model and had to be significant (p < .05) in the final model.

78
only those variables that were found to be significant in the first model included in the
final gender-specific models.
Table 20: Final model: Overall best predictors of problem gambler status for males
Predictors of PG status B SE Wald Odds ratio 95% CI
Constant -5.39
Gambled 3 hours without break 1.44 .42 11.8 4.22 1.86-9.60
Bet $2.50+ per spin most times 2.08 .44 22.7 8.00 3.40-18.79
Avoid contact/ communication 1.36 .41 11.2 3.91 1.76-8.68
Shaking while gambling 1.62 .40 16.3 5.06 2.30-11.14
Sad and depressed after gambling
1.73 .48 12.9 5.64 2.19-14.49
85.9% of cases correctly classified, Nagelkerke R = .66
Table 21: Final model: Overall best predictors of problem gambler status for females
Predictors of PG status B SE Wald Odds ratio
95% CI
Constant -5.16
Gamble intensely/ loss awareness 1.66 .47 12.24 5.25 2.07-13.29
Leave the venue to find money 2.50 .46 28.85 12.14 4.98-29.73
Sad and depressed after gambling 2.52 .83 9.36 12.48 2.48-62-90
Avoid cashier .96 .47 4.14 2.61 1.04-6.56
87.3% of cases correctly classified, Nagelkerke R = .71
Final models: Likelihood of Being Identified
As with the 2007 study, the present study conducted analyses to determine the
behaviours most likely to indicate the presence of problem gambling. The probability of
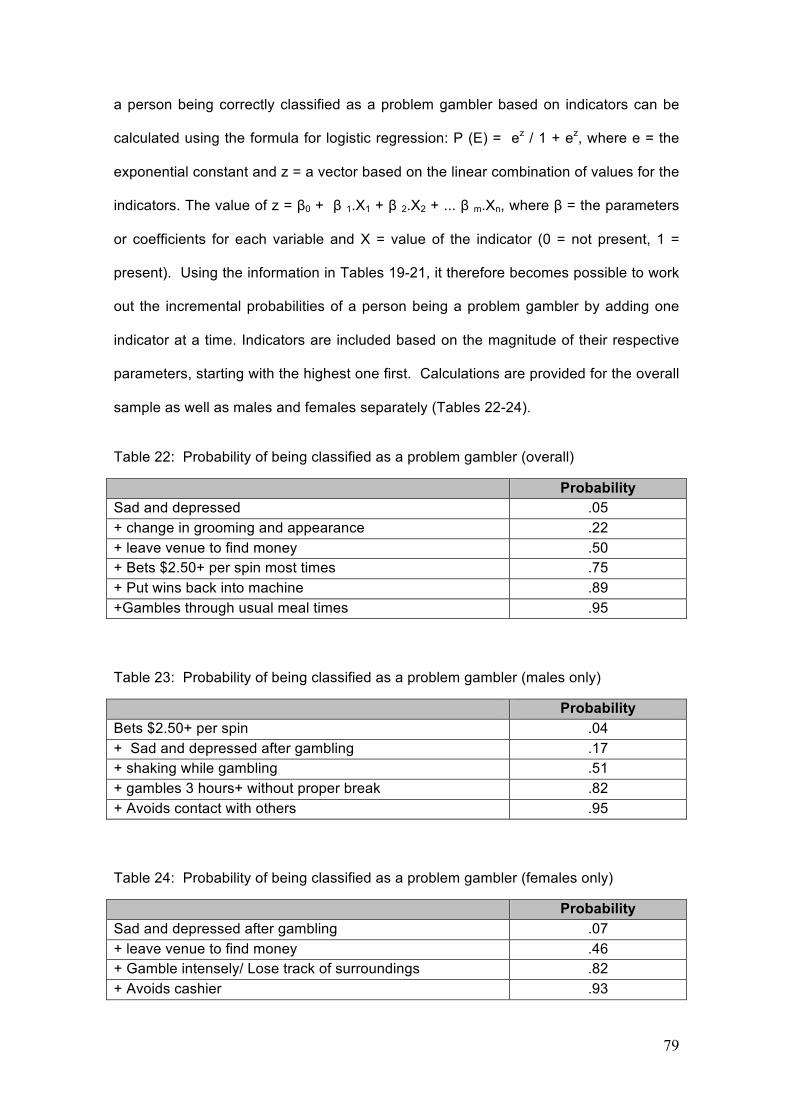
79
a person being correctly classified as a problem gambler based on indicators can be
calculated using the formula for logistic regression: P (E) = ez / 1 + ez, where e = the
exponential constant and z = a vector based on the linear combination of values for the
indicators. The value of z = β0 + β 1.X1 + β 2.X2 + ... β m.Xn, where β = the parameters
or coefficients for each variable and X = value of the indicator (0 = not present, 1 =
present). Using the information in Tables 19-21, it therefore becomes possible to work
out the incremental probabilities of a person being a problem gambler by adding one
indicator at a time. Indicators are included based on the magnitude of their respective
parameters, starting with the highest one first. Calculations are provided for the overall
sample as well as males and females separately (Tables 22-24).
Table 22: Probability of being classified as a problem gambler (overall)
Probability Sad and depressed .05 + change in grooming and appearance .22 + leave venue to find money .50 + Bets $2.50+ per spin most times .75 + Put wins back into machine .89 +Gambles through usual meal times .95
Table 23: Probability of being classified as a problem gambler (males only)
Probability Bets $2.50+ per spin .04 + Sad and depressed after gambling .17 + shaking while gambling .51 + gambles 3 hours+ without proper break .82 + Avoids contact with others .95
Table 24: Probability of being classified as a problem gambler (females only)
Probability Sad and depressed after gambling .07 + leave venue to find money .46 + Gamble intensely/ Lose track of surroundings .82 + Avoids cashier .93
80
The results show that it is necessary to accumulate a number of indicators before one
can be confident of being able to identify a problem gambler. For the sample as a
whole, it is necessary to accumulate at least 5 indicators. Using this model, one would
look for a person who was sad and depressed, whose appearance had deteriorated,
who was gambling at odd hours and often with large bet sizes. For males, one needs
4-5 indicators. The profile is of a withdrawn person who gamblers for long periods
without proper breaks and who is antisocial and depressed. For females, one observes
quite a similar pattern: poor mood states and a withdrawal from social interactions.
Bayesian Analysis of 2013 Models
Finally, as an extension of the 2007 study and as an illustration of how the study’s
information could be applied in future venue information systems, we applied Bayesian
statistics based on the assumption that one typically already knows something about a
population of interest before making a particular decision about the status of individuals
within in it. This existing knowledge is usually expressed as a prior probability or base-
rate which indicates the existing state of knowledge about a particular phenomena or
hypothesis. For example, from a number of studies, we now know that the probability of
a randomly selected adult in the population being a problem gambler (PGSI 8+ is about
.5%, see Productivity Commission, 2010), whereas the base-rate for regular or weekly
gamblers in venues has been estimated to be much higher (15-20%). According to
Bayesian analysis, one can provide a more accurate statement about the likelihood of
a given hypothesis if base-rate information is combined with diagnostic or classification
probabilities. In medical contexts, for example, one might be able to indicate the
likelihood of a person having a given disease based on a positive test result if one
know the typical prevalence of the disease in the population (e.g., 1%) and the
accuracy of the test (e.g., it correctly identifies a true case of 80% of occasions). Much
of the research in this area shows that base-rate information tends to be downplayed
and that getting a positive test result yields an exaggerated sense of risk because this

81
information fails to take the very low base-rate into account. Thus, even if the rest is
quite reliable (e.g., 80% accuracy) and one gets a positive test, one’s chances of
having the disease may still be low if the disease is quite rare.
Bayes theorem calculates the probability of the hypothesis given the data we have
available. It is given by the following formula:
P ( H / D) = P ( D / H). P (D) / [ P (D / H ).P(D) + P (A / H ). P (A) ]
Where, H = Our hypothesis (problem gambler) based on our diagnostic information, D
= Probability of the event (e.g., how many problem gamblers in the population being
considered), A = Probability of Alternate hypothesis (1- base-rate of problem gambling
in population of interest).
In relation to the data above, it is clear that the probability of identifying a problem
gambler based on the indicators is around .95 if one takes the maximum number of
indicators. The probability of a person being a problem gambler in general (the base-
rate) will be based on which population one chooses to examine. If venue staff, for
example, were to direct their attention to people who gambled once per week, then it is
known that around .2 (or 20%) of these people are likely to be problem gamblers. If
these people gambled more than once per week, the figure is likely to be higher (e.g.,
.33 or 33%). When this information is placed into the formula, the following results
emerge. For a base-rate of .20, the probability = (.95 x .2) / [ (.95 x .2) + (.05 x .8)
= .83. For a base-rate of .33, the probability is (.95 x .33) / [ (.95 x .33) + (.05 x .67) =
.90. In other words, when one directs attention only to regular gamblers, the probability
that someone displaying all of these indicators is a problem gambler is not quite as
high as indicated in the original logistic regression tables (i.e., it indicates that there is
an 83% probability that someone you are observing who is showing all of these signs is
a problem gambler, rather than the original conclusion that there is a 95% probability).
Nonetheless this is still a very high probability and would warrant further investigation.

82
Further, if venue staff were to record indicators for people who came to their venue
more than once per week, they could be very confident that a person was a problem
gambler if they were successful in observing 4+ indicators for that individual (here, the
probability is still 90%).
2.3.8 Reliability of Predictors Although it is important to discern the consistency of indicators across the two studies,
it is also important to examine whether studies of this nature are capable of developing
classification models which can be replicated across more than one sample. To
investigate this issue, we sought to determine whether the final models developed in
the 2007 study could be replicated using this new sample. The same variables that
appeared in the 2007 models were entered into a logistic regression with gambling
status (problem vs. non-problem) as the dependent grouping variable. In other words,
the same logistic regressions using the same variables used in 2007 have been re-run
using 2013 data. The results of these analyses are displayed in Table 25 and 26.
Table 25: Predictors of being currently classified as a problem gambler: Comparison of 2007 final model for males: 2007 vs 2013 data
B Wald Odds ratio % classified
2007 Data Constant -5.61 Gambled 3+ hours without break 2.38 13.14** 10.8 Sweated a lot 2.08 20.4*** 8.0 Difficulty stopping at closing time 1.79 14.1** 6.0 Displayed anger 1.59 11.8** 4.9 89% 2013 Data
Constant -2.93 Gambled 3+ hours without break 1.68 18.8*** 5.5 Sweated a lot 1.59 19.1*** 4.9 Difficulty stopping at closing time 1.26 13.3** 3.5 Displayed anger .66 3.53 1.9 91% **p< .01 ***p< .001
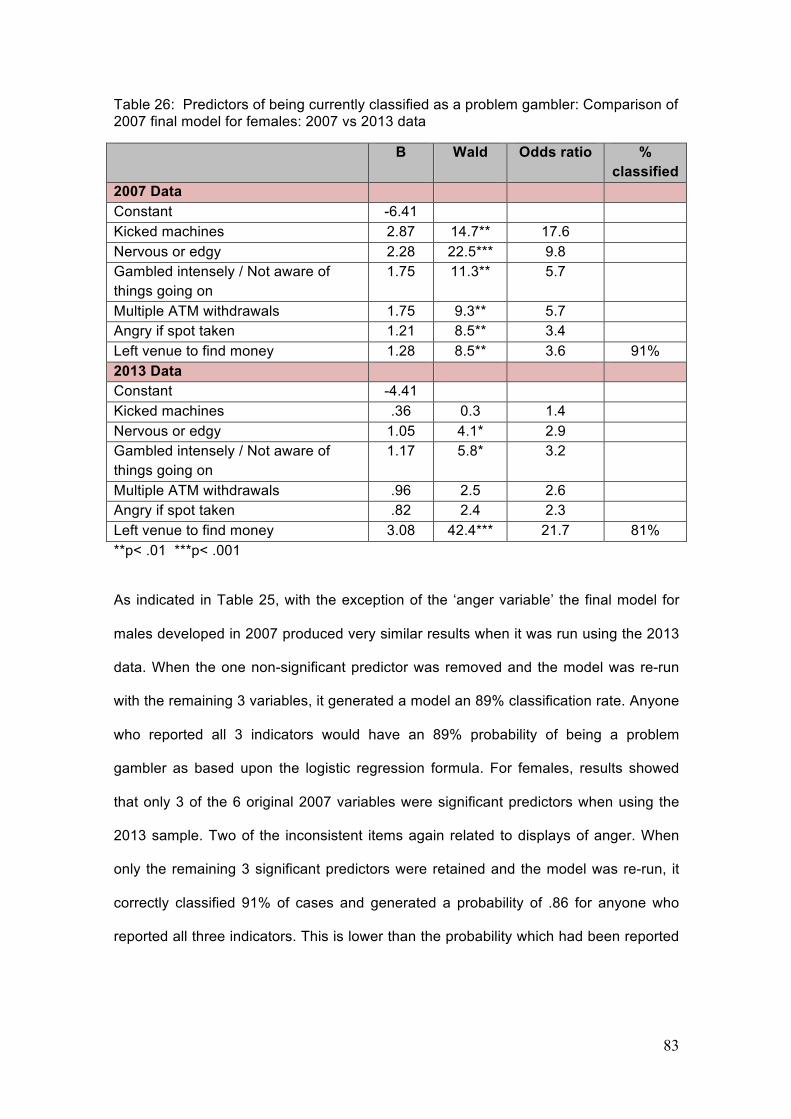
83
Table 26: Predictors of being currently classified as a problem gambler: Comparison of 2007 final model for females: 2007 vs 2013 data
B Wald Odds ratio % classified
2007 Data Constant -6.41 Kicked machines 2.87 14.7** 17.6 Nervous or edgy 2.28 22.5*** 9.8 Gambled intensely / Not aware of things going on
1.75 11.3** 5.7
Multiple ATM withdrawals 1.75 9.3** 5.7 Angry if spot taken 1.21 8.5** 3.4 Left venue to find money 1.28 8.5** 3.6 91% 2013 Data Constant -4.41 Kicked machines .36 0.3 1.4 Nervous or edgy 1.05 4.1* 2.9 Gambled intensely / Not aware of things going on
1.17 5.8* 3.2
Multiple ATM withdrawals .96 2.5 2.6 Angry if spot taken .82 2.4 2.3 Left venue to find money 3.08 42.4*** 21.7 81% **p< .01 ***p< .001
As indicated in Table 25, with the exception of the ‘anger variable’ the final model for
males developed in 2007 produced very similar results when it was run using the 2013
data. When the one non-significant predictor was removed and the model was re-run
with the remaining 3 variables, it generated a model an 89% classification rate. Anyone
who reported all 3 indicators would have an 89% probability of being a problem
gambler as based upon the logistic regression formula. For females, results showed
that only 3 of the 6 original 2007 variables were significant predictors when using the
2013 sample. Two of the inconsistent items again related to displays of anger. When
only the remaining 3 significant predictors were retained and the model was re-run, it
correctly classified 91% of cases and generated a probability of .86 for anyone who
reported all three indicators. This is lower than the probability which had been reported
84
in the 2007 study, (> .90), but still very good. In other words, the 2007 models were
well validated using the 2013 data11.
2.3.9 Refining the model and determining severity of indicators
The next step was to use the information gained from the different sets of analyses
including the comparisons from 2007 and 2013 data to create a more refined checklist
which provides maximum information in a simple way, thereby maximalising usability.
We used a colour coding system to create a list which incorporated information
obtained about relative commonality of behaviours in problem gamblers, the ability of
items to discriminate between risk groups of gamblers and highlighted the strongest
items in terms of predicting problem gambling. These different levels of severity in
indicators can be used to more effectively assist management and staff to make
decisions on appropriate actions. The following describes the decisions used to create
different levels of severity in indicators.
Red flags – strong indicators
If item was an independent predictor in either the 2007 or 2013 logistic regression
analyses it was designated a red flag as these can be seen as strong indicators of
gambling problems. In all but three cases these items were also at least twice as likely
to be displayed by problem gamblers compared to others (odds ratios >2 PG/NPG),
and this was again seen as a reasonable basis for receiving a red flag. In terms of the
three items which had odds ratios under 2:
11 In a recent article by Schrans and Schellinck (2011), it was suggested that differences in the composition of samples (i.e., the relative proportion of problem and non-problem gamblers) can also influence validation attempts. If samples are self-selected (as is the case in the this study), there is a danger that people with more of an interest in gambling and the extent of their problems may be more willing to volunteer. If so, the more problem gamblers one gets, the more one may be likely to obtain problem gamblers who self-select themselves to be evaluated. One way to reduce this bias is to weight the data so that the two sample compositions are equivalent. This was done in this analysis by applying weights to the 2013 sample so that it reflected the composition of the 2007 sample. Inspection of the resultant models showed that they were so similar to the unweighted ones that this adjustment was considered unnecessary.

85
• Gambling for 3 or more hours without a proper break had a ratio of 1.95. We
considered making gambling 5 or more hours a red flag and giving 3+ hours a
lower ranking (orange or yellow) but decided that, to limit redundancy and
minimise confusion the checklist should retain only of these items in the
interests. We decided to retain the more conservative 3 or more hours as a red
flag at this stage and see how well this worked in situ in Stage Two.
• Get cash out 2 or more times through ATMs or EFTPOS had a ratio of 1.85. It is
possible the discriminability of this item was reduced somewhat by the removal
of ATMs in Victoria which occurred during the data collection period. As this
indicator has been discussed widely in the literature as a good indicator of
problem gambling it was decided to retain this as a red indicator at this stage
and examine its usefulness in Stage Two of the research.
• Bet $2.50 or more most of the time had a ratio of 1.92. This item was found to
be relatively common across the board, with 41% of low risk gamblers reporting
doing this. We therefore decided to make this a lower severity orange item and
again examine its usefulness in Stage Two.
Orange flags – possible indicators
Orange flags were items which were at least twice as likely to be seen in problem
compared to non-problem gamblers (odds ratios >2 PG/NPG) but which did not show
up as independent predictors in logistic regressions.
Purple flags – very strong but uncommon indicators
We used the information gained from examining high severity indicators (those which
discriminated well between moderate risk and problem gamblers) to create another
level of severity. Items which were at least three times more likely to be seen in
problem gamblers than even moderate risk gamblers (odds ratio >3 PG/MRG) were
converted from orange to purple flags. In most cases these were relatively uncommon
behaviours even in problem gamblers but were very rarely seen in non-problem
86
gamblers so should be seen as probable signs of gambling problems.
If the behaviour was already a red flag we retained this ranking to indicate it was a
more commonly seen indicator. The exception to this was significant decline in
personal grooming/appearance. This had been given a red flag as it was a significant
predictor in the 2013 logistic regression but was reported by very few low or moderate
risk gamblers so we decided to retain its identification as an uncommon indicator.
Yellow flags – early warning signs
We then used the analyses examining differences between lower and higher risk
gamblers to create a final category. Yellow items were created from items which were
initially not seen as very important (ratio PG>NPG being <2) but which were later
shown to discriminate well between higher risk gamblers (PG and MRG) and low risk
gamblers (discriminating with odds ratios > 2).
In the interests of reducing the length and complexity of the checklist where possible
we collapsed some items relating to similar behaviours together where the risk level
was the same. For example, items relating to anxiety (shaking, sweating or showing
nervousness) were collapsed into one item as were items relating to displaying anger
or aggression. This was consistent with the earlier discussed idea that emotionality is
likely to be displayed by problem gamblers but the specific behaviours may vary across
person and situation. We also combined gambling when venue opens and closes.
We then removed two items which did not discriminate well between any of the risk
groups (plays on quickly without listing to winning jingles and gambling after drinking
alcohol). The above removals and collapsing of items allowed us to move some items
from the ‘other behaviours’ section to social or emotional responses and relabel this
category ‘irrational behaviours’. The resulting checklist, the Gambling Behaviour
Checklist, for use in EGM venues (GBC-EGM) can be seen in Table 27.
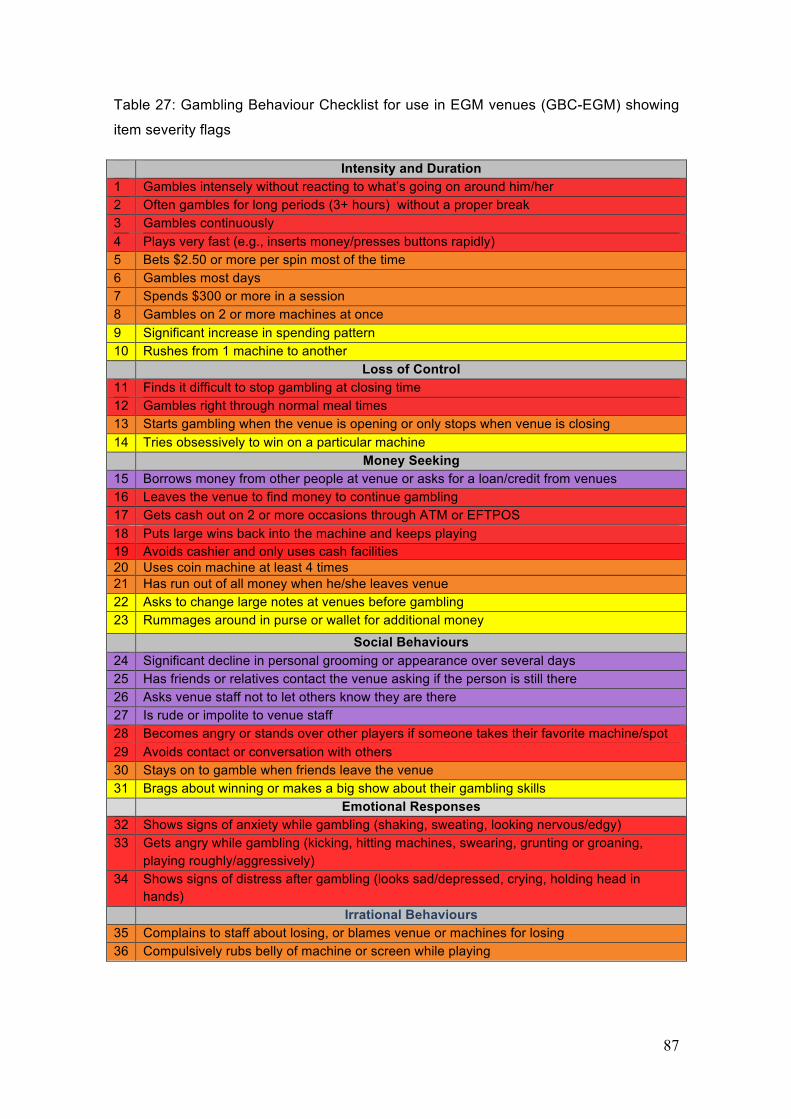
87
Table 27: Gambling Behaviour Checklist for use in EGM venues (GBC-EGM) showing
item severity flags
Intensity and Duration 1 Gambles intensely without reacting to what’s going on around him/her 2 Often gambles for long periods (3+ hours) without a proper break 3 Gambles continuously 4 Plays very fast (e.g., inserts money/presses buttons rapidly) 5 Bets $2.50 or more per spin most of the time 6 Gambles most days 7 Spends $300 or more in a session 8 Gambles on 2 or more machines at once 9 Significant increase in spending pattern 10 Rushes from 1 machine to another
Loss of Control 11 Finds it difficult to stop gambling at closing time 12 Gambles right through normal meal times 13 Starts gambling when the venue is opening or only stops when venue is closing 14 Tries obsessively to win on a particular machine
Money Seeking 15 Borrows money from other people at venue or asks for a loan/credit from venues 16 Leaves the venue to find money to continue gambling 17 Gets cash out on 2 or more occasions through ATM or EFTPOS 18 Puts large wins back into the machine and keeps playing 19 Avoids cashier and only uses cash facilities 20 Uses coin machine at least 4 times 21 Has run out of all money when he/she leaves venue 22 Asks to change large notes at venues before gambling 23 Rummages around in purse or wallet for additional money
Social Behaviours 24 Significant decline in personal grooming or appearance over several days 25 Has friends or relatives contact the venue asking if the person is still there 26 Asks venue staff not to let others know they are there 27 Is rude or impolite to venue staff 28 Becomes angry or stands over other players if someone takes their favorite machine/spot 29 Avoids contact or conversation with others 30 Stays on to gamble when friends leave the venue 31 Brags about winning or makes a big show about their gambling skills
Emotional Responses 32 Shows signs of anxiety while gambling (shaking, sweating, looking nervous/edgy) 33 Gets angry while gambling (kicking, hitting machines, swearing, grunting or groaning,
playing roughly/aggressively) 34 Shows signs of distress after gambling (looks sad/depressed, crying, holding head in
hands) Irrational Behaviours
35 Complains to staff about losing, or blames venue or machines for losing 36 Compulsively rubs belly of machine or screen while playing

88
2.4 Discussion and Conclusions Stage One of this study achieved its aim of validating identified indicators developed by
Delfabbro et al., in 2007 and rating the indicators in terms of their strength in
contributing to the identification of problem gamblers in venues. This was done by
recruiting another large sample of regular EGM gamblers across Australia and
conducting analyses similar to those conducted in 2007. Analyses were used to
examine the relative usefulness of each indicator. In addition, results of this new
sample collected in 2013 were compared to those of 2007. Results were similar
between the two studies suggesting the indicators were fundamentally stable in terms
of (a) the types of behaviours which are commonly or frequently displayed by problem
gamblers, (b) the types of behaviours which best discriminate between problem and
non-problem gamblers, and (c) the behaviours which best predict problem gambling.
This is an important extension of prior research which has involved only single
samples. The results of the two studies were then used in combination to refine the
Checklist of Visible Indicators (Delfabbro et al. 2007) into the Gambling Behaviour
Checklist for use in EGM venues (GBC-EGM)12,. Specific results and their meaning are
discussed in detail below.
2.4.1 What do problem gamblers do in venues? Common indicators
The study firstly considered common indicators of problem gambling, i.e., behaviours
which were frequently or always shown by problem gamblers when they were in
venues. The results of the present study showed that the most common visible
indicators of problem gambling which can be observed in venues relate to the duration
and intensity of gambling or to ways of raising funds or chasing wins. Problem
gamblers were likely to be intensely focussed on their play, want to play for long
12 Three further versions of this measure are refined in Chapter 3, Stage Two, for staff use in Victoria, (GBC-EGM-SV), in other jurisdictions (GBC-EGM-S), and for researchers (GBC-EGM-R)
89
periods of time without a proper break and play rapidly or frenetically. They are likely to
be trying to raise funds by leaving the venue to find more cash and/or using venue
cash facilities multiple times. They will play back winnings and are likely to leave
venues only once they have spent all their money. Social or emotional responses are
very unlikely to be seen in any customer, but the most commonly shown by problem
gamblers were avoiding contact with others or looking sad and depressed after
gambling. Problem gamblers were likely to show some signs of impaired control such
as gambling up until closing time and still not wanting to leave the venue. Problem
gamblers may also drink a lot of alcohol while gambling or try to blame the machines or
venues for their losses. Comparisons of common indicators in 2013 and 2007 showed
there was a lot of similarity with 12 out of 15 of the common indicators being listed as
most prevalent in both studies. These indicators are important because common
indicators are more likely to be seen by venue staff.
2.4.2 How do we discriminate between problem gamblers and other customers?
Although it is important to know which behaviours are commonly shown by problem
gamblers, this, by itself may not assist in discriminating between problem gamblers and
other customers. This is because some behaviours which are common in problem
gamblers may also be relatively common in regular gamblers who are not experiencing
problems. For example, gambling after drinking a lot of alcohol was reported at least
occasionally by almost half (47.2%) of the problem gamblers but was also reported at
least occasionally by 36.5% of the moderate risk gamblers and 16% of the no-low risk
gamblers.
Therefore, it is important to also examine the relative prevalence of these behaviours in
problem gamblers as opposed to other players, and to consider how much more likely
it is that staff will observe particular behaviours in problem gamblers compared to other
gamblers. The results showed that some behaviours which were common in problem
90
gamblers were not good discriminators because they were also fairly common in non-
problem gamblers. This included behaviours such as trying to win obsessively on
particular machines, changing large notes at venues and playing on quickly after a win.
This analysis also revealed that while frequency and intensity of gambling was a good
warning sign of potential problem gambling (as these behaviours were commonly
shown by problem gamblers), by themselves they were not good at identifying a
problem gambler as they did not differentiate very well between problem and non-
problem gamblers.
On the other hand, social and emotional behaviours, which were relatively uncommon
in problem gamblers tended to discriminate well between problem gamblers and other
customers. In some instances this was because these behaviours, while fairly rare in
problem gamblers, were almost never seen in any other customer groups, for example
telling staff not to let other people know you were in the venue or having family or
friends asking if the person was at the venue. Other behaviours were seen across
customer groups but more common in the higher risk groups such as displaying anger
in the venue. Comparisons across the 2007 and 2013 data sets showed the
discriminatory ability of items was stable across time. Items which discriminated well
between problem and non-problem gamblers in 2007 tended to also discriminate well
in 2013. Correlational analyses confirmed this. The only areas which showed
noticeable variability in terms of discriminability were around emotional responses
(signs of anger, nerves or distress).
Odd-ratio analyses were used to identify behaviours which discriminated well between
specific risk groups, in this case behaviours which were at least twice as likely to be
seen by a higher risk group than a lower risk group. Behaviours which were at least
twice as likely to be seen by problem gamblers than non-problem gamblers could be
seen as possible signs of problem gambling (i.e., much more likely to be seen in
problem gamblers than other customers). Behaviours which were at least twice as
91
likely to be seen by problem gamblers than even moderate risk gamblers can be seen
as probable signs of problem gambling (i.e., much more likely to be seen by those with
established issues with their gambling). These included gambling for very extended
periods of time, finding it difficult to stop gambling at closing time, trying to borrow
money, hiding out from family or friends and showing strong emotional reactions.
Finally, items which did not discriminate well between problem gamblers and others,
but which did discriminate well between higher risk gamblers (problem and moderate
risk) and no-low risk gamblers could possibly be early warning signs of gambling
issues. These included changes (increases) in spending patterns, gambling for
extended periods of time, rummaging around for additional gambling money or
repeated visits to obtain money, and bragging about wins.
As well as showing good consistency with the earlier study by Delfabbro et al., (2007),
the results of the present study also showed good consistency with prior research.
They supported findings from studies into online gambling which found indicators of
problematic gambling included spending substantial amounts of time or money
gambling, more intense betting patterns, variable methods of obtaining money,
aggression and complaints to staff (Griffiths, 2009; Griffiths & Whitty, 2010; LaBrie and
Shaffer 2011; Schottler, 2010; Svetieva et al., 2006)
Further, indicators which were found to be commonly shown by problem gamblers in
the present study were also commonly displayed by problem gamblers in Schellinck
and Schrans’ (2004) study, and indicators which discriminated well between problem
and non-problem gamblers in the present study were also found to discriminate well
between these groups by Schellinck and Schrans (2004). The only exceptions to this
pattern were some slight differences in findings relating to (a) emotional/physiological
responses (having sweaty palms/body and feeling angry) which Schellinck and
Schrans found were common responses of problem gamblers and good at
differentiating between the groups, but which the present study found were uncommon

92
differentiators, and (b) getting out more cash to gamble which was uncommon but a
good differentiator in Schellinck and Schrans’s study, while the present study’s findings
suggested it was a relatively common behaviour in both problem and non-problem
gambler groups.
2.4.3 Predicting gambling problems A series of analyses were run to see which indicators were best at predicting gambling
problems, overall and for males and females separately. As was the case in 2007 and
in earlier research by Schellick and Schrans (2004), the results showed that multiple
indicators need to be observed to increase confidence that you have identified a
possible or probable problem gambler. While the 2007 report suggested that as few as
three indicators may be sufficient, the results of the present study suggested that
observation of 4-5 indicators may be required to be very confident of gambling
problems. This does not, however, mean that conversations about responsible
gambling could not be initiated at earlier stages with customers exhibiting clear signs of
risky gambling.
The indicators which are best able to predict gambling issues overall related to
social/emotional behaviours (looking sad, appearing dishevelled), money seeking
(leaving the venue to find money, re-playing wins), betting relatively large sums per
spin, and gambling through meal times. For males additional specific indicators may be
avoiding contact with others, shaking and gambling for long periods without a break.
For women, specific predictive indicators included avoiding the cashier and intensity of
gambling.
To examine consistency of predictors, analyses were run to determine whether the
predictive models of 2007 could be replicated in the 2013 dataset. Results showed that
findings were generally consistent, validating the 2007 models. For males the
indicators which remained significant related to gambling for long periods without a
93
break, sweating and having difficulty stopping gambling at closing time. For women,
consistently important indicators across both studies were gambling intensely,
appearing nervous or edgy and money seeking. As was the case with the
discriminatory analyses the main area of inconsistency was variability was around
emotionality, in this case anger. Differences in this area might not be unexpected given
that emotional reactions to gambling are likely to be highly variable between individuals
based on dispositional factors such as age, gender and personality. Some people
many display anger; others may become depressed. Situational factors may also
influence the particular emotional response given. Thus, while emotional responses
were detected as important across both studies, the exact nature of these responses
appears to vary across to the two samples.
These findings were consistent with Schellnick and Schrans (2004) where an
examination of combinations of predictors found that the most consistent indicators
involved long gambling sessions, continuous gambling, money seeking, displays of
anger/disorderly conduct, having trouble quitting, and playing two machines.
Considering this in conjunction with findings discussed above it would appear that
gambling for long periods without a break, gambling intensely, seeking additional
money to gamble, and having trouble stopping gambling (e.g., to have a meal or
because it is closing time) are likely to be particularly strong indicators of problematic
gambling.
2.4.4 Levels of severity in indicators
The combined analyses were used to create a refined list which removed redundant or
non-discriminatory items, had meaningful categories and used a colour coding system
to designate levels of severity in the indicators based on commonality and
discriminability of behaviours between relevant risk groups. The concept of delineating
relative riskiness of particular behaviours has been used in the past, for example the
Swiss Casinos Act of 1998 (see Delfabbro et al, 2007; 2012; Hancock, 2011)

94
differentiated between more severe A-type criteria and less severe B-type criteria with
two or more A-type indicators resulting in the need for a staff interview, while B
indicators are logged over time. Further, PlayScan provides internet gamblers with
informative feedback regarding their playing behaviour using a traffic light system.
The resulting list consisted of red flags which were strong indicators of gambling
problems (independent predictors of gambling problems); orange flags which were
possible indicators of gambling problems (behaviours at least twice as likely to be seen
in problem gamblers compared to others); purple flags which were very strong but
uncommon indicators (behaviours at least three times more likely to be seen in
problem gamblers than moderate risk gamblers) and yellow flags which were early
warning signs (behaviours at least twice as likely to be seen in higher risk gamblers
than low risk gamblers).
Methodological considerations
Although this study has a number of methodological strengths (a good sample
size, standardised measures and used a consistent inclusion criteria for sampling),
there are number of limitations that should be taken into account when interpreting the
findings. First, the study is based on a convenience sample, so it is not clear to what
extent the results can be generalised to all gamblers in the population. Those who are
willing to take part in research may be more willing to admit that they have problems
with their gambling and may be more aware of their own behaviour.
Second, the PGSI is a generalist measure of gambling problems so we cannot be
certain that all gambling problems do relate to EGM gambling. However, we recruited
only regular EGM gamblers, and it is known that regular gambling is positively
associated with gambling problems, and that at least 70% of all gambling-related
problems are associated with this form of gambling in Australia (Productivity

95
Commission, 2010). Thus it is very likely that any gambling issues related, at least in
part, to EGM gambling.
Third, the scope of this study did not extend to an investigation of individual differences
in the presentation of indicators (apart from gender). Thus, it is unclear to what extent
these findings can be generalised across different cultural groups or across different
age groups. It may be, for example, that the salience of certain behaviours differs
depending on a person’s cultural background.
Fourth, this stage of the research was based on self-report measures and the
relationship between indicators and measures of problem gambler status. The extent to
which indicators are able to predict whether or not a person is a problem gambler is
therefore only theoretical. In practical terms, it may be much more difficult for venue
staff to observe the different indicators and then make an accurate appraisal of a
patron’s gambling. This issue is examined in more depth in Stage 2 of the research,
which follows, but it is recognised that other potential research methods could be used.
One possibility, for example, is for staff observations to be combined with information
obtained from electronic monitoring systems (e.g., pre-commitment or loyalty card
systems; Delfabbro et al., 2012; Griffiths & Wood, 2009; Svetjeva et al., 2006).
Conclusions
Stage One achieved the aim of validating the findings of Delfabbro et al. (2007) and
showing that those findings were fundamentally stable in terms of (a) the types of
behaviours which are commonly or frequently displayed by problem gamblers, (b) the
types of behaviours which discriminate between problem and non-problem gamblers,
and (c) the behaviours which best predict problem gambling. Findings from the 2007
and 2013 data analyses were combined to refine the 2007 indicators into the Gambling
Behaviour Checklist, the GBC-EGM, with items colour coded in terms of severity. This

96
checklist was then used in Stage Two by venue staff to identify possible and probable
problem gamblers according to the number and severity of behaviours displayed.

97
CHAPTER 3: Stage Two – Practical Validation of the
Gambling Behaviour Checklist
Stage Two of the study was undertaken to articulate on the practical validity of the
GBC-EGM in terms of its usefulness as a tool for EGM venue staff to use to identify
potential problem gambling customers. This was achieved by conducting a 3-month
pilot of the checklist under real conditions of use, followed by semi-structured focus
groups with staff to discuss the usefulness of the tool. Staff feedback in Stage Two was
used to calibrate the checklist to their needs and working conditions, resulting in the
GBC-EGM-SV for Staff in Victoria. Versions were also created for EGM staff operating
in other jurisdictions and countries (the GBC-EGM-S), and EGM researchers (the GBC-
EGM-R). Findings from stage two provide the beginnings of an evidence base for the
translation of theory into practice.
3.1 Methodology
3.1.1 Participants
Primary participants were gaming staff from three Melbourne hotels which contained
EGMs who volunteered to use the GBC-EGM during a 3-month trial period and who
then participated in post-trial focus groups. The participants were eleven females who
had between one month and 20 years experience working in EGM venues (M = 7.7,
SD 7.4). Within this range of experience, two groups of staff were apparent. Four
participants had worked for less than two years in EGM venues, whereas seven had
worked for four years or more. For the purpose of qualitative analyses we classified
those with less than two years’ experience as ‘less experienced’ and those with four
years or more experience as ‘experienced’. In terms of age, three participants were
between 18-30, four 31-50 and four 51+ years old.

98
Secondary participants were eight venue support workers (VSW) located in three
Gamblers Help Services in metropolitan Melbourne. The workers volunteered their
expertise and experience in terms of training venue workers in identification of, and
approaching problem gamblers in venues.
3.1.2 Measures
Demographics
Staff details were recorded concerning gender, age range, gaming venue experience,
shifts worked.
Gambling Behaviour Checklist
The GBC-EGM validated in Stage One was used by Victorian staff to monitor the
behaviour of customers who they believed might have a gambling problem. Four items
were modified for applicability to Victoria: (1) ‘Gets cash out on 2 or more occasions
through ATM or EFTPOS’ (Item 17) was changed to EFTPOS only since ATMs are no
longer permitted in Victorian EGM venues. (2) ‘Avoids cashier and only uses cash
facilities’, and (3) ‘Uses coin machine at least 4 times’, were removed as they are not
applicable in the Victorian context. (4) ‘Bets $2.50 or more per spin most of the time’
(Item 5) was changed to ‘$3’ to equate with common Victorian bet denominations. Thus
34 of the 36 checklist items from Stage One were used in this pilot, with alignment of
content to Victoria for two items. The pilot checklist is shown in below in Table 28.

99
Table 28: Pilot Gambling Behaviour Checklist for EGM Staff in Victoria (Pilot GBC-
EGM-SV)
Intensity and Duration 1 Gambles intensely without reacting to what’s going on around him/her 2 Often gambles for long periods (3+ hours) without a proper break 3 Gambles continuously 4 Plays very fast (e.g., inserts money/presses buttons rapidly) 5 Bets $3 or more per spin most of the time 6 Gambles most days 7 Spends $300 or more in a session 8 Gambles on 2 or more machines at once 9 Significant increase in spending pattern 10 Rushes from 1 machine to another
Loss of Control 11 Finds it difficult to stop gambling at closing time 12 Gambles right through normal meal times 13 Starts gambling when the venue is opening or only stops when venue is closing 14 Tries obsessively to win on a particular machine
Money Seeking 15 Borrows money from other people at venue or asks for a loan/credit from venues 16 Leaves the venue to find money to continue gambling 17 Gets cash out on 2 or more occasions through EFTPOS 18 Puts large wins back into the machine and keeps playing 19 Has run out of all money when he/she leaves venue 20 Asks to change large notes at venues before gambling 21 Rummages around in purse or wallet for additional money
Social Behaviours 22 Significant decline in personal grooming or appearance over several days 23 Has friends or relatives contact the venue asking if the person is still there 24 Asks venue staff not to let others know they are there 25 Is rude or impolite to venue staff 26 Becomes angry or stands over other players if someone takes their favorite machine/spot 27 Avoids contact or conversation with others 28 Stays on to gamble when friends leave the venue 29 Brags about winning or makes a big show about their gambling skills
Emotional Responses 30 Shows signs of anxiety while gambling (shaking, sweating, looking nervous/edgy) 31 Gets angry while gambling (kicking, hitting machines, swearing, grunting or groaning,
playing roughly/aggressively) 32 Shows signs of distress after gambling (looks sad/depressed, crying, holding head in
hands) Irrational Behaviours
33 Complains to staff about losing, or blames venue or machines for losing 34 Compulsively rubs belly of machine or screen while playing

100
Staff indicated which of the 34 listed behaviours they had seen in the customer, both at
the time of observation and any they could recall from past behaviour (the literature
suggests staff can recall past customer behaviour, e.g. Delfabbro et al 2007). The
behaviours were presented in their six categories: 10 items related to the intensity and
duration of gambling; 4 related to impaired control; 8 items captured social behaviours;
7 related to raising money or money chasing behaviours; 3 related to emotional
responses; and 2 related to irrational behaviours.
Patron identification and action report sheet
For each possible problem gambler observed, staff recorded details concerning the
date and time of observation, customer age and gender, how often the observing staff
member had seen the customer in the venue, and how often the customer visited to
play EGMs. Staff also indicated what they had seen that alerted them to possible
gambling problems in the customer (primary indicator/s), and the extent to which they
personally believed the customer had a gambling problem.
After completing the GBC-EGM-SV checklist, staff were requested to complete
a follow up action sheet detailing what actions they took (e.g., talk to a senior staff
member; approach patron to talk for a general chat; approach patron to talk about
behaviour/choices), any details about any relevant outcomes from these actions.
3.1.3 Procedure
Ethics approval to conduct the study was obtained from Swinburne University Human
Research Ethics Committee (SUHREC). Information was obtained from venue support
workers about Victorian venues that were likely to contain staff who had not yet been
trained in identification of problem gamblers (we obtained this information as we were
interested in training inexperienced staff in identification needs and then compare their
experience with the checklist to more experienced staff who were provided with written
instructions on how to use the tool). Of these potential sites, Australian Hospitality and

101
Leisure Group (ALH) identified three Melbourne venues for the 3-month trial of the
checklist. The managers of each venue identified appropriate staff within their venues
and asked them if they would like to take part in the study. All venue staff participation
was voluntary. Some inexperienced staff who volunteered took part in a 1-2 hour face
to face training session which involved a discussion of the need to identify potential
problem gamblers in venues, non-confrontational ways to approach people identified
as possible problem gamblers, and an explanation of how to use the checklist and fill in
the research sheets. Staff were introduced to the six categories of behaviour on the
checklist, the items comprising each, and the colour-coded minor and major problem-
flag designation attached to each item. In two out of the three training sessions this
session was provided in conjunction with an additional problem gambling training
component provided by a venue support worker on support and counselling options
available for people with gambling problems. Other staff who volunteered to take part
were provided with written instructions similar to the face to face training including the
need for observation of customer gambling behaviour, how to use the checklist and fill
in research sheets, and ways to approach customers. All staff had backup support from
their venue managers.
The checklist was incorporated into day to day functioning of the venue over the three
month period. Staff were asked to complete the checklist and patron identification and
action report sheet whenever they saw a customer who they thought may be showing
behavioural signs of gambling problems. At the end of three months, participating staff
were invited to participate in focus groups to provide feedback to the researchers
concerning the practical validity of the checklist.
The results presented in Stage Two reflect the value of the checklist following self-
directed learning rather than face-to-face training. As discussed above, we provided
face-to-face training in use of the checklist to staff new to the EGM environment. Most
102
staff familiar with the EGM environment had already received training on identifying
problem gamblers by venue support workers prior to the pilot. Rather than replicating
training, we provided these staff members with the short written version of the training
on the importance of identifying problem gamblers and how to use the checklist. We
had intended to conduct some comparative analysis between the two groups to
articulate on whether it is advantageous to provide the checklist within a supportive
training environment (as opposed to providing it with written instructions). However,
according to the venue managers, more than 50% of the inexperienced staff who
completed the face to face training left the employing venues during the study.
Moreover, only one staff member who had received the training and was still employed
at the pilot venues volunteered to participate in the focus groups. We were therefore
not able to conduct these comparisons. The remainder of the staff who participated in
the focus groups were introduced to the checklist by their managers and fellow staff
members and used the written instructions.
Focus group protocol and schedule
Staff who trialled the checklist were invited to provide feedback in semi-structured
focus groups performed on-site. The focus groups were conducted to evaluate the
practical utility of the checklist and constituent items as a tool for identifying at-risk
gamblers. We sought to understand whether venue staff could observe and consolidate
information about particular customers in a busy venue environment using the
checklist. Focus groups took between 30 minutes and one hour to complete.
Semi-structured focus groups addressed the following issues:
a. Whether staff thought the checklist was a helpful tool to identify problem
gambling behaviours and potential problem gamblers;
b. Whether the checklist behaviours were easy or difficult to observe under real
conditions of use;
103
c. Whether there were problem gambling behaviours in the checklist that were
new to staff (i.e., unfamiliar as potential identifying behaviours);
d. Whether there were problem gambling behaviours that staff felt were missing
from the checklist (i.e., behaviours staff thought were indicative of behaviours
but not on the list);
e. What kinds of difficulties staff encountered in use of the checklist;
f. What staff would change about the checklist;
g. What kinds of follow-up actions followed problem behaviour identification and
what were the outcomes of these actions.
Venue support workers at the three venues participated in unstructured interviews prior
to the 3-month trial. These interviews were designed to elicit information about the
techniques they used to train venue staff in observing the behaviour of staff in venues
to identify potential signs of problem gambling. As these staff used the 2007 version of
the Behavioural Checklist in their training the interviews were also used to gather any
relevant information about how the checklist was perceived by staff and how useful the
venue support workers thought this tool was in training venue staff.
Workers at the services also assisted in identifying venues with inexperienced staff
(who had not yet received training in identifying problem gamblers) and attended some
of the training sessions to provide further training on providing problem gamblers with
assistance in accessing help services.
3.1.4 Process of analysis
Focus group discussions were digitally recorded with participant permission.
Discussions were transcribed and de-identified. Transcripts containing a total of 4950
lines of conversation were imported into NVivo 10, a qualitative software program for
analysis. Sex, age group and years of experience working in EGM venues were
attached to each passage of text.
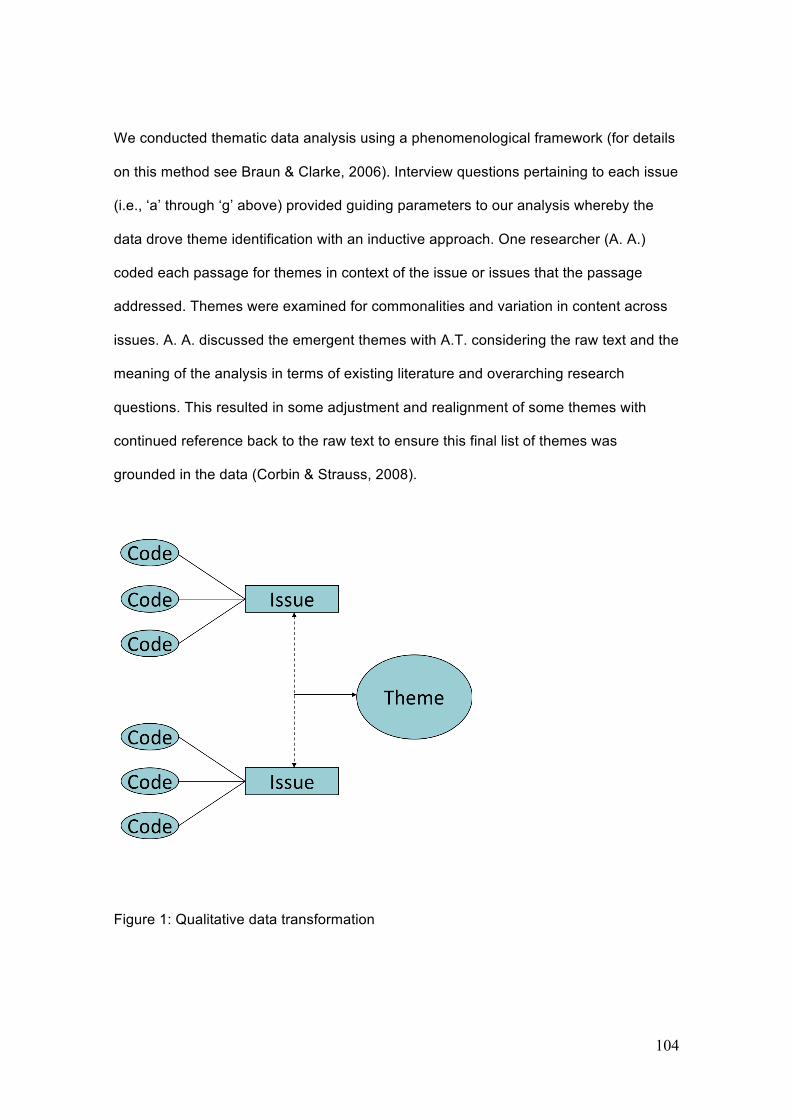
104
We conducted thematic data analysis using a phenomenological framework (for details
on this method see Braun & Clarke, 2006). Interview questions pertaining to each issue
(i.e., ‘a’ through ‘g’ above) provided guiding parameters to our analysis whereby the
data drove theme identification with an inductive approach. One researcher (A. A.)
coded each passage for themes in context of the issue or issues that the passage
addressed. Themes were examined for commonalities and variation in content across
issues. A. A. discussed the emergent themes with A.T. considering the raw text and the
meaning of the analysis in terms of existing literature and overarching research
questions. This resulted in some adjustment and realignment of some themes with
continued reference back to the raw text to ensure this final list of themes was
grounded in the data (Corbin & Strauss, 2008).
Figure 1: Qualitative data transformation
105
3.2 Results
3.2.1 Usefulness of the Gambling Behaviour Checklist
We asked staff whether, and how, they found the checklist useful in identifying problem
gambling behaviours and potential problem gamblers. Staff responded in terms of the
clarity, relevance and comprehensiveness of the checklist. The usefulness of the
checklist also varied between the seven experienced (more than 4 years EGM
experience) and four less experienced staff (less than 2 years EGM experience).
Clear, relevant and comprehensive checklist
Ten of the 11 staff who participated in the focus groups found the checklist useful in
clarifying the signs of problem gambling and in the identification of potential problem
gamblers:
Q: “Did it seem like these were clear identifiers of the people who might become
difficult?”
A: “Yes definitely, they’re the things [behaviours] that I’ve always classed as the
problem ones.” (Female, 51+ years old, 4 years EGM experience)
Q: Did you find the checklist helpful in identifying people with potential
problems?
A1: “It seemed relevant.”
A2: “It is, it’s really relevant.”
(A1: Female, 18-30 years old, 1 year EGM experience; A2: Female, 31-50
years old, 5 months EGM experience).
The members of one focus group spontaneously reported the checklist to be
comprehensive:
Q: “Do you think there’s something that’s missing from the list? Is there
something else?”
106
A1: “I thought that was very good. Can you think of anything else?”
A2: “No. I actually found it helpful.”
A1: “Yeah, I thought it was good. I could relate to it all straight away”.
(A1: Female, 51+ years old, 4 years EGM experience; A2: Female, 18-30, 2
years EGM experience)
Staff experience and use of the checklist
Experienced and less experienced staff both found the checklist useful for different
reasons. Experienced staff tended to use the checklist as a helpful reminder of
problem gambling behaviours:
Q: One of the aims of developing this kind of checklist is to increase staff
confidence in identifying possible issues with clients who might have a
problem. Did you feel like it increased your confidence in identifying people
who might have a problem?
A1: No, I’ve always been aware [laughs].
Q: You’ve always been aware?
A1: Yeah.
Q: Yep. Yep. And did it change anything? So when you said you found it
useful, how was it useful?
A1: Well it was useful [in] that it’s like a refresher of things to look for when
people came in and you know the regulars that are constant[ly] gambling, and
when I filled out a few of them I thought ‘yes, I take note of that, and yes I
did’. It was just a reminder to what to… yeah.
(Female, 31-50 years old, 11 years EGM experience)
Experienced staff also found browsing the checklist to be a quick or easy way to
identify problem gambling behaviours:
Q: “Okay. So did you find the checklist to be helpful at all in identifying people
107
who might have problems?”
A: ”Yes I did.”
Q: “Can you talk a little bit about that? What did you find helpful, for
instance?”
A: “Well I just read through it, and it was just easier to tick what was
applicable to whomever I was surveying.”
(Female staff, 31-50 years old, 11 years EGM experience)
One of the more experienced staff did not find the checklist useful. This participant
explained that she was well-versed in problem gambling behaviours after 20 years of
working in the same venue with the same customers and was picking up the signs
without needing to reference the checklist:
A: “I found there was a lot to fill out [on the checklist] and I’ve worked in there
[EGM room] a long time and to me it’s obvious. You get to know the people
and then you get to know the ones that struggle with that kind of stuff and so I
probably didn’t need to do all of that so much. And a lot of the customers have
all been here 20 years too, so you get an understanding of them and yeah.”
(Female, 31-50 years old, 20 years EGM experience).
These results demonstrate the importance of ensuring that the checklist is used in a
way that supports staff rather than simply increasing workloads.
Experienced staff believed that the checklist was particularly helpful for less
experienced staff who need to know how to identify problem gamblers:
Q: “Did you find this sheet useful to have when you were looking at the
customers – think they might have a problem?”
A: “I was sitting there staring at them just going, “Yeah” If I hadn’t ever done
gaming before this [checklist] would be really useful because everything in here
108
are the classic signs of people that have problems as far as I’m concerned.”
(Female staff member, 51+ years old, 4 years EGM experience)
Less experienced staff made similar statements. They explained that using the
checklist had made them more aware of customer behaviour and the sensitive nature
of the gambling environment. It also had the effect of increasing their confidence in
identifying and potentially approaching problem gambling customers:
“Q: “What have you learnt from this sheet if you don’t mind?”
A: “I just – like you just said I’ve developed a lot more confidence, especially
with my knowledge and how to control everything and how to deal with
situations and things like that.”
Q: “Can you give an example of that for instance?”
A: “Well beforehand I wouldn’t have approached anybody about their
gambling issues because I felt like it was none of my business. I just felt like
I’d be yelled at and things like that. Whereas now I have a lot more
background information and a better understanding of how to approach
people and to figure out whether they do have these problems, what sort of
questions to ask and all of that sort of stuff. So it has yeah it’s helped me a
lot.” (Female staff member, 18-30 years old, 1.5 years EGM experience).
The staff member quoted above also considered the checklist an improvement over
existing methods of identifying problem gamblers:
Q:” So do you think that this – using the checklist or having it available it’s an
improvement over the previous methods of identifying problem gamblers, the
previous training.”
A: “Yeah definitely it’s helped me out a lot. So yep.”
Q: “And how has it helped you out?”
A: “Like I said, before with the confidence and I feel like I’ve got a better

109
knowledge of things to look at and how many things to look at because you
sort of look at one or two things and go “oh yeah it could be a problem” and
then you actually figure out that there’s seven or eight things on this one list
and you go “oh well yeah definitely needs to change”. So yeah it’s helped a
lot.” (Female staff member, 18-30 years old, 1.5 years EGM experience).
The manager of one venue concurred that use of the checklist had improved
observation skills amongst the staff, particularly amongst newer staff:
A: “I don’t know whether any of them [staff] had actually made these
observations prior to that [study participation], especially because I had
three new staff, so I think it was good because it made them go out there
and actually do some observing and have a look at who’s out there and
what they’re doing.” (Venue manager, 31-50 years old, 20 years EGM
experience).
The same manager also thought that use of the checklist had increased staff
confidence and capacity to cope with problem gambling behaviours:
A: “..while we’ve been doing this [piloting the checklist], I haven’t had
anybody [staff] come up to me and ask me to go and deal with anybody
[customer] that they thought was a problem gambler. I think this has
sort of made them more confident themselves - the staff – in regards to
being able to approach a customer if they did feel that they had issues.”
(Venue manager, 31-50 years old, 20 years EGM experience).
This shows the usefulness of the checklist to support inexperienced staff in particular. It
can assist people new to the gaming environment to understand the behaviours which
may indicate a gambling problem. Setting staff training within a broader context
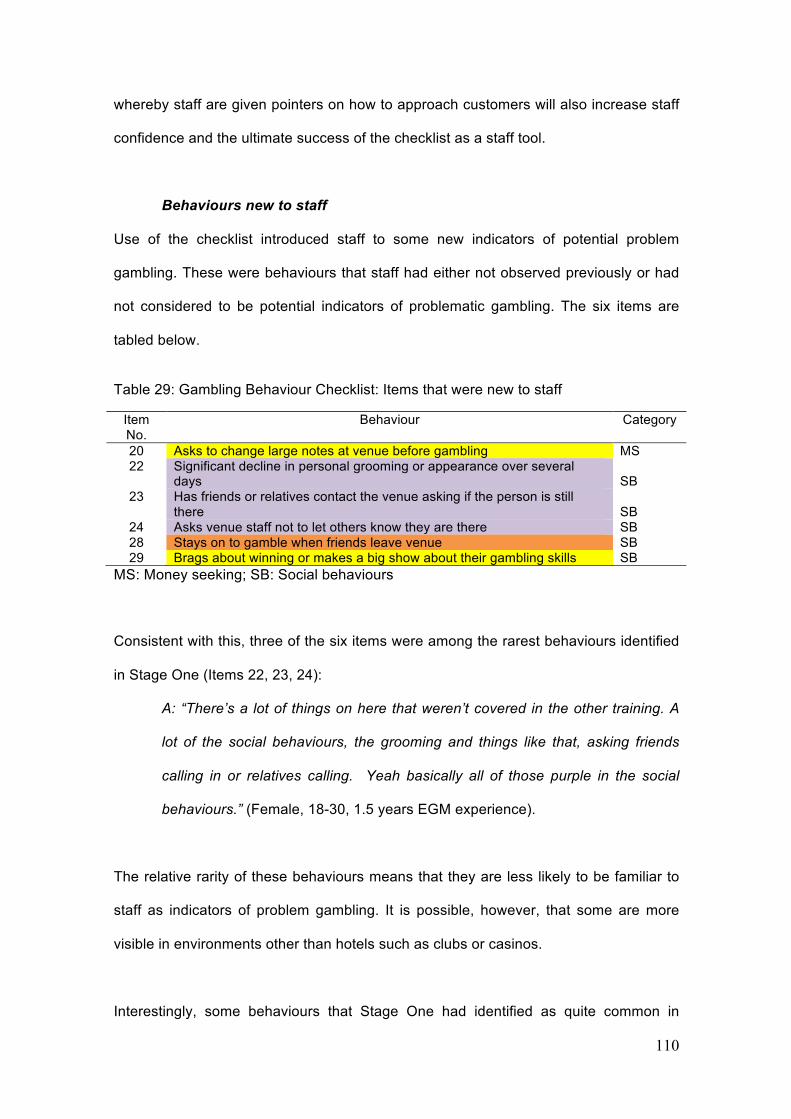
110
whereby staff are given pointers on how to approach customers will also increase staff
confidence and the ultimate success of the checklist as a staff tool.
Behaviours new to staff
Use of the checklist introduced staff to some new indicators of potential problem
gambling. These were behaviours that staff had either not observed previously or had
not considered to be potential indicators of problematic gambling. The six items are
tabled below.
Table 29: Gambling Behaviour Checklist: Items that were new to staff
Item No.
Behaviour Category
20 Asks to change large notes at venue before gambling MS 22 Significant decline in personal grooming or appearance over several
days SB 23 Has friends or relatives contact the venue asking if the person is still
there SB 24 Asks venue staff not to let others know they are there SB 28 Stays on to gamble when friends leave venue SB 29 Brags about winning or makes a big show about their gambling skills SB
MS: Money seeking; SB: Social behaviours
Consistent with this, three of the six items were among the rarest behaviours identified
in Stage One (Items 22, 23, 24):
A: “There’s a lot of things on here that weren’t covered in the other training. A
lot of the social behaviours, the grooming and things like that, asking friends
calling in or relatives calling. Yeah basically all of those purple in the social
behaviours.” (Female, 18-30, 1.5 years EGM experience).
The relative rarity of these behaviours means that they are less likely to be familiar to
staff as indicators of problem gambling. It is possible, however, that some are more
visible in environments other than hotels such as clubs or casinos.
Interestingly, some behaviours that Stage One had identified as quite common in

111
problem gamblers, were also unfamiliar to some staff. Behaviour such as changing
large notes before gambling (Item 20) had not been thought of as an issue by some
staff until they used the checklist. Some staff remained resistant to label it as such:
Q: “Do you reckon the people who are doing that, that they’re the people who
are more likely to spend too much, the people who are asking to change
hundreds?”
A: “Yes and no, yes and no. I mean, well they’re the ones with the hundreds,
they might have a bit more to spend but they’re still losing it. I don’t think you
can say just because they’ve got the hundreds, they’re looking like they’re
losing more because you can only lose what you can afford, yeah. I reckon
it’s across the board.”
Q: “So you can see it but it might not be as applicable to them, it mightn’t be a
problem behaviour?
”A: “Might not or it might. Yeah it’s all individual, yeah.”
(Female, 31-50 years old, 20 years EGM experience)
This contrasted with the views of other staff who clearly saw this behaviour as part of a
problem gambling cycle:
A: “A lot of people ask for $100 notes so that they can’t put them back in, and
then five minutes later they come back and say, “Change these.” It’s like a
boomerang.”
Q: “So they’re trying to self-control?”
A: “Yeah. So they collect their $500, “Can I have hundreds so I don’t use
them,” and then yeah, they blow it, they come back, change it, and they’re
gone.”
(Female, 18-30 years old, 2 years EGM experience)
Item 29, ‘Brags about winning or making a show of winning’ was another behaviour that
112
most staff had not realised was an indicator of potential problems:
A: Yeah see again I just would’ve thought they were happy or whatever. I’d be
happy if I won too but yeah I don’t know if that would have been as a problem
on my list of things to look out.” (Female, 18-30 years old, 1.5 years EGM
experience).
This suggests it may be difficult for staff to separate happiness at a win from excessive
bragging which may reflect an underlying need to be seen as a winner. Both of these
behaviours are early warning signs and are behaviours which are still relatively
common in non-problem gamblers so are possibly less easily identifiable as
problematic than other more severe ‘red flag’ behaviours.
Finally, most staff had not been aware that customers who stayed on to gamble when
friends left the venue were exhibiting a sign of gambling problems (Item 28):
Q: What about [customers] ‘staying on to gamble when friends leave the
venue’? If they arrive with a bunch of friends and then they stay.
A: Yeah I have seen that. I wouldn’t have thought of that as a concern either
until this [checklist] came out. (Female, 18-30 years old, 1.5 years EGM
experience)
These findings emphasise the importance of integrating and contextualising these
behaviours in staff training on problem gambler identification.
3.2.2 Individual item analysis During the pilot we requested staff use the checklist to record all behaviours that they
had observed in customers they suspected may be displaying problem gambling
behaviour. In focus groups we asked staff about the ease with which they could

113
observe and match the checklist items to customer behaviour during routine shifts.
Staff articulated their responses in terms of observation and interpretation experiences.
Observation experiences
There were clear distinctions between items that were easy or difficult to observe under
real conditions of use. Table 30 shows the number of staff who found each checklist
behaviour ‘easy’ to observe. It also shows the number of times behaviour was
observed across the 23 customers that staff put under observation.
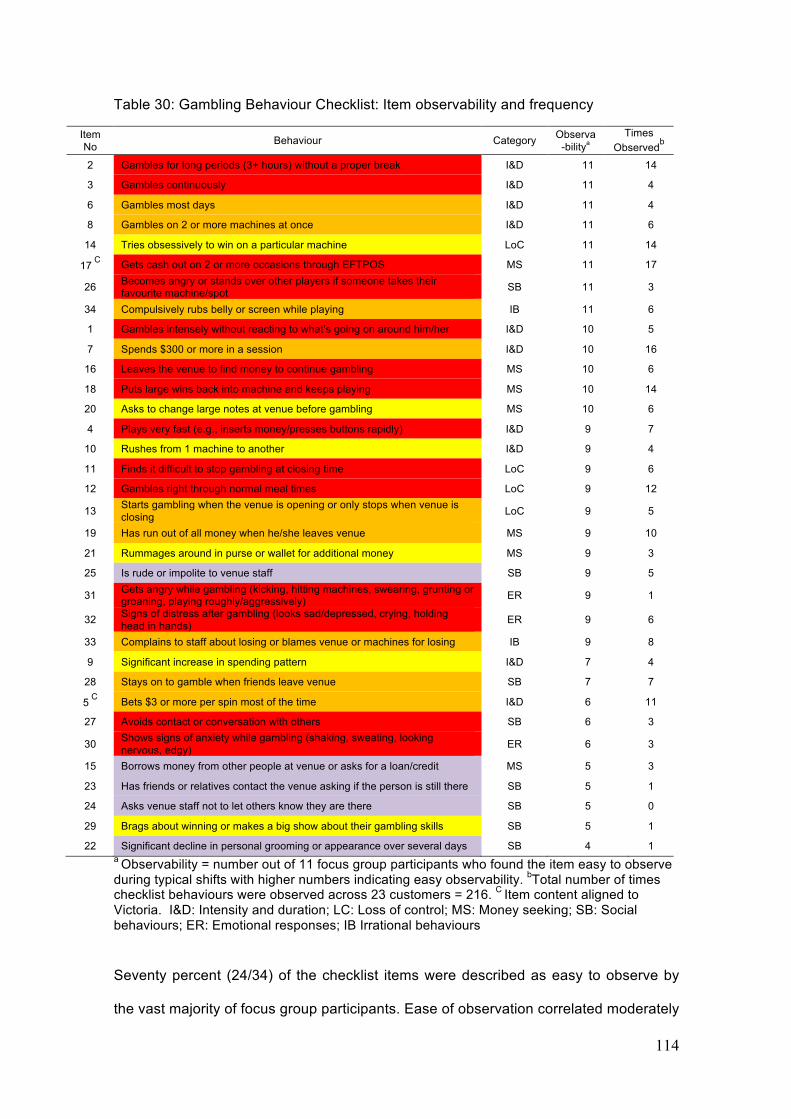
114
Table 30: Gambling Behaviour Checklist: Item observability and frequency
Item No Behaviour Category Observa
-bilitya Times
Observedb
2 Gambles for long periods (3+ hours) without a proper break I&D 11 14
3 Gambles continuously I&D 11 4
6 Gambles most days I&D 11 4
8 Gambles on 2 or more machines at once I&D 11 6
14 Tries obsessively to win on a particular machine LoC 11 14
17 C Gets cash out on 2 or more occasions through EFTPOS MS 11 17
26 Becomes angry or stands over other players if someone takes their favourite machine/spot SB 11 3
34 Compulsively rubs belly or screen while playing IB 11 6
1 Gambles intensely without reacting to what’s going on around him/her I&D 10 5
7 Spends $300 or more in a session I&D 10 16
16 Leaves the venue to find money to continue gambling MS 10 6
18 Puts large wins back into machine and keeps playing MS 10 14
20 Asks to change large notes at venue before gambling MS 10 6
4 Plays very fast (e.g., inserts money/presses buttons rapidly) I&D 9 7
10 Rushes from 1 machine to another I&D 9 4
11 Finds it difficult to stop gambling at closing time LoC 9 6
12 Gambles right through normal meal times LoC 9 12
13 Starts gambling when the venue is opening or only stops when venue is closing LoC 9 5
19 Has run out of all money when he/she leaves venue MS 9 10
21 Rummages around in purse or wallet for additional money MS 9 3
25 Is rude or impolite to venue staff SB 9 5
31 Gets angry while gambling (kicking, hitting machines, swearing, grunting or groaning, playing roughly/aggressively) ER 9 1
32 Signs of distress after gambling (looks sad/depressed, crying, holding head in hands) ER 9 6
33 Complains to staff about losing or blames venue or machines for losing IB 9 8
9 Significant increase in spending pattern I&D 7 4
28 Stays on to gamble when friends leave venue SB 7 7
5 C Bets $3 or more per spin most of the time I&D 6 11
27 Avoids contact or conversation with others SB 6 3
30 Shows signs of anxiety while gambling (shaking, sweating, looking nervous, edgy) ER 6 3
15 Borrows money from other people at venue or asks for a loan/credit MS 5 3
23 Has friends or relatives contact the venue asking if the person is still there SB 5 1
24 Asks venue staff not to let others know they are there SB 5 0
29 Brags about winning or makes a big show about their gambling skills SB 5 1
22 Significant decline in personal grooming or appearance over several days SB 4 1 a Observability = number out of 11 focus group participants who found the item easy to observe during typical shifts with higher numbers indicating easy observability. bTotal number of times checklist behaviours were observed across 23 customers = 216. C Item content aligned to Victoria. I&D: Intensity and duration; LC: Loss of control; MS: Money seeking; SB: Social behaviours; ER: Emotional responses; IB Irrational behaviours
Seventy percent (24/34) of the checklist items were described as easy to observe by
the vast majority of focus group participants. Ease of observation correlated moderately

115
with the actual number of times a behaviour was observed (r = .51), indicating that
behaviours that were easier to observe were observed more often. The easiest
behaviours to observe were generally those involving intensity and duration of play,
i.e., behaviour directly related to EGM play as opposed to customer behaviour
elsewhere in the venue. Regular use of EFTPOS (Item 17) was also easily seen and
the most frequently observed behaviour in customers that staff had targeted for
observation.
In contrast, 30% (n=10) of items were seen as difficult to observe by a third of staff.
These encompassed most of the behaviours identified as rare in Stage One and/or
unfamiliar or new to staff in Stage Two (Items 15, 22, 23, 24, 29). For example,
customer attempts to borrow money (Item 15) were described as difficult to observe
since customers actively concealed this behaviour from staff. Rather than witness
money-borrowing, staff were more likely to have heard reports of this behaviour from
other customers or staff. Item 24 was described as especially rare. According to staff,
very few customers had asked them to conceal their presence from callers in recent
times, and none had experienced this during the pilot period. Relatedly, when friends or
relatives called a venue looking for a customer (item 23), staff could rarely match the
call to the customer in question since they often did not know their clientele on a first
name basis. It is possible that these behaviours are better at identifying problem
gamblers at particular venues such as small clubs where regular customers are well
known to staff or in regions where there are few venues so family and friends know
where to call.
The usefulness of these behaviours as indicators of gambling problems may also have
receded in recent times with the rise of mobile phone use and decline in fixed phone
use. Staff noted that customers who wished to disguise their location from family,
friends and so forth would step outside the venue (beyond range of the tell-tale EGM
116
sounds), to take or make a mobile phone call:
Q: “Do you ever get asked not to let others know that you’re here, so “if
someone calls for me don’t let them know I’m here.”
A: “No, but I quite often see people with their mobile phones bolt outside to take
the call rather than take it in the initial venue.”
(Female, 31-50 years old, 5 months EGM experience).
The remaining items which staff found difficult to observe contained a mix of rare and
commonly displayed behaviours (according to Stage One of the research), but they
required staff to pay uncommon levels of attention to customers or to have personal
knowledge of their customers. For instance, staff explained that they rarely paid the
level of attention necessary to confidently report a decline in personal grooming over
several days (item 22). Similarly, a significant increase in spending patterns (Item 9)
was potentially observable in regular but not irregular customers. Whether customers
stayed on to gamble after friends left the venue (Item 28) also required more than the
typical level of attention, especially in the case of non-regular customers. Finally,
whether customers were mostly betting $3 or more a spin (Item 5) was generally easy
and quite common to see amongst targeted customers, but only for a few moments
during a round of the gaming floor.
Interpretation experiences
Staff generally found it easy to interpret whether observed behaviour was normal or
problematic and to reconcile the behaviour with available checklist items. There were
some exceptions however where observations did not fit cleanly with the checklist
items. For more than half the staff interviewed, it was hard to draw the line between
customers who were enjoying some peace and quiet while gambling on their own, and
those who were problematically avoiding contact with others (Item 27). For three staff
in one venue, this difficulty concerned a group of regular customers, each of whom sat
117
on their own in a corner and gambled for many hours, yet at irregular intervals would
yell across the gaming floor to each other to take a smoke or coffee break.
Bragging about winnings (Item 29) was also a problematic item for staff, with more than
half unable to distinguish between customers’ celebration of winnings and bragging of
winnings. Signs of anxiety, including shaking, sweating, looking nervous or edgy (Item
30), were difficult for almost half the staff to differentiate from other forms of distress
such as looking sad or depressed (Item 32). This last is possibly less of an issue from
an identification point of view as any signs of distress should be taken as indicators of
gambling problems.
Prior knowledge of customers also appeared to confound item interpretation in a small
number of cases. For instance, whether two staff members thought a problematic
increase in customer spending had occurred depended on how wealthy they believed
the customer to be. In another case, a staff member described a customer as generally
anxious so was unsure of applying anxiety item 30 as a problem gambling indicator. A
further customer was described as sad and depressed as a result of having lost their
partner to illness. The staff member was therefore unsure of applying item 32. While
we did not gather enough information to be confident of the broader effects of customer
relations, Delfabbro et al. (2007) suggests that staff to look for behaviours and
reactions that are inconsistent or out of character in customers that they know well,
rather than confine their focus to static interpretations of behaviour. Instructions to
staff, therefore, should emphasise departures from normal behaviour as indicating
potential for gambling issues.
3.2.3 Impediments to identification During focus group discussions we also asked whether staff had encountered any
practical difficulties in application of the checklist. Staff discussed three environmental

118
considerations that affected use of the checklist and the applicability of particular items.
These concerned the location of staff in the venue, the time of shift, and venue activity
levels.
Location of staff in venue
The physical location of staff on a shift influenced the kinds of behaviours that they
could observe. In particular, betting $3 or more per spin (Item 5) and expressions of
anger (Item 31) were described as easier to observe while performing rounds on the
gaming floor but more difficult to observe when attending to service areas such as the
bar, cashier desk and EFTPOS:
Q: “What about betting $3 or more dollars per spin most of the time [Item 5], is
that easy to see?”
A: “You can see on the machine if you're walking past and you're having a look
at it you can see what they're betting…” (Female, 31-50 years old, 12 years
EGM experience)
Q: “Which other ones do you think would be, are things that you guys can
observe yourselves when you’re working on the floor?”
A: “Number 2 here, kicking, hitting machines, swearing, grunting, groaning.
That happens all the time.”
(Female, 51+ years old, 5 years EGM experience)
Time of shift
Other behaviours were only observable by staff on particular shifts. For example, item
11, ‘Finds it difficult to stop gambling at closing time’ was obviously only observable by
staff who worked the ‘graveyard’ shift (usually 9pm to 5am). Similar limitations
surrounded endorsement of items 12, ‘Gambles right through normal meal times’, and
119
item 13, ‘Starts gambling when the venue is opening or only stops when the venue is
closing’.
Q: “Do you see them [customers] finding it difficult to stop gambling at closing
time?”
A: “Yeah, oh well I don’t see that, I used to see it on graveyards, but I don’t
see it anymore because I don’t do the graveyards.”
Q: “So you’d only see that, of course, if you’re on the late shift?”
A: “Yeah.”
(Female, 51+ years old, 9 years EGM experience)
Another behaviour distinguished by time of day was item 10, which concerned rushing
from one machine to another. Staff noted that this behaviour may be less likely to be
observed during the quieter, late night hours”
Q: “And what about rushing from one machine to another? Is that something
that happens?”
A: “Yeah I don’t see that a lot. So like I said I work graveyard – mostly
graveyard shifts so it’s quiet generally. So if they’re – most of the customers
have their special machines that they like to play so they won’t really rush from
one to another.” (Female, 18-30 years, 1.5 years EGM experience)
Venue activity level
There were often times when venue activity levels were high. These periods limited
staff movements and attention to individual customers. They were also less able to
take the time to think about customer profiles. Consequently when staff were working
these busy periods they were less likely to be able to effectively identify problem
gambling. One described her difficulties using the checklist during the research pilot
period:
120
A: “I’m busy out there, and when I got told to do these [checklists] too,
because we’re understaffed, they’re always cutting back, it’s really hard to
concentrate. You’re constantly, and especially me when I’m cashiering, and
I’ve got to concentrate on my money, because I’m dealing a lot of money, and
by the time I read the first question I’ve got to go back to it. So sometimes it
takes me a long time to get through all these questions.” (Female, 31-50
years old, 20 years EGM experience)
It is important to note that for study purposes, staff members completed the 34-item
checklist for each customer they put under observation. Under real conditions of use,
staff are encouraged to use the checklist as a reference point when considering
customer behaviour rather than go through all 34 items. This would reduce the impact
of venue activity level on checklist utility, especially for experienced staff and those
more experienced with the checklist.
These findings support the need for a range of different items to compensate for the
fact that some behaviour will only be able to be observed at particular times. This
limitation could be minimised further if staff had a method of sharing concerns about
particular customers so that multiple staff could contribute to identification of
problematic gambling. The involvement of a senior staff member who works multiple
shifts, for example, may assist with this.
3.2.4 Outcomes of identification
Our study instructions to staff included suggested follow-up actions where they
identified customers exhibiting multiple problem behaviours, or the same behaviour on
multiple occasions. These actions included writing up customers’ behaviour in the log
121
book, sustained observation of customers, talking to senior staff members about
customers’ behaviour, approaching customers for general conversation, and
approaching customers to talk directly about their problem behaviour. Suggested
actions were in line with gambling venue code of conduct and existing training
protocols including Responsible Service of Gaming. To gain an understanding of the
relationship between identification and action, we asked staff to record any follow-up
actions taken following identification. We also discussed their choices and experiences
in the focus groups.
Descriptive statistics for the follow-up actions and the severity classes of precipitating
problem behaviours are displayed in Table 31. Shown are the type, number and
proportion of follow-up actions performed. Also shown are the severity class, number,
proportion, mean and standard deviation of problem behaviours that precipitated each
type of follow-up action.
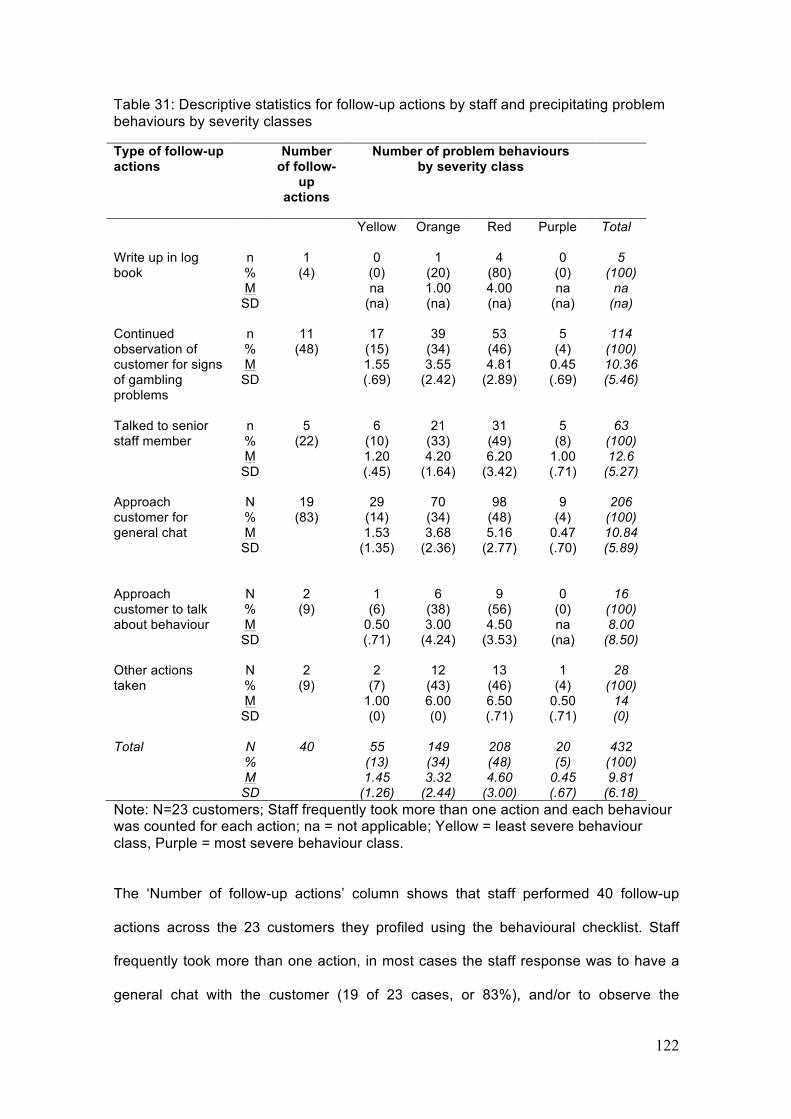
122
Table 31: Descriptive statistics for follow-up actions by staff and precipitating problem behaviours by severity classes
Type of follow-up actions
Number of follow-
up actions
Number of problem behaviours by severity class
Yellow
Orange
Red
Purple
Total
Write up in log book
n % M
SD
1 (4)
0 (0) na
(na)
1 (20) 1.00 (na)
4 (80) 4.00 (na)
0 (0) na
(na)
5 (100)
na (na)
Continued observation of customer for signs of gambling problems
n % M
SD
11 (48)
17 (15) 1.55 (.69)
39 (34) 3.55
(2.42)
53 (46) 4.81
(2.89)
5 (4)
0.45 (.69)
114 (100) 10.36 (5.46)
Talked to senior staff member
n % M
SD
5 (22)
6 (10) 1.20 (.45)
21 (33) 4.20
(1.64)
31 (49) 6.20
(3.42)
5 (8)
1.00 (.71)
63 (100) 12.6
(5.27)
Approach customer for general chat
N % M
SD
19 (83)
29 (14) 1.53
(1.35)
70 (34) 3.68
(2.36)
98 (48) 5.16
(2.77)
9 (4)
0.47 (.70)
206 (100) 10.84 (5.89)
Approach customer to talk about behaviour
N % M
SD
2 (9)
1 (6)
0.50 (.71)
6 (38) 3.00
(4.24)
9 (56) 4.50
(3.53)
0 (0) na
(na)
16 (100) 8.00
(8.50)
Other actions taken
N % M
SD
2 (9)
2 (7)
1.00 (0)
12 (43) 6.00 (0)
13 (46) 6.50 (.71)
1 (4)
0.50 (.71)
28 (100)
14 (0)
Total N
% M
SD
40 55 (13) 1.45
(1.26)
149 (34) 3.32
(2.44)
208 (48) 4.60
(3.00)
20 (5)
0.45 (.67)
432 (100) 9.81
(6.18) Note: N=23 customers; Staff frequently took more than one action and each behaviour was counted for each action; na = not applicable; Yellow = least severe behaviour class, Purple = most severe behaviour class.
The ‘Number of follow-up actions’ column shows that staff performed 40 follow-up
actions across the 23 customers they profiled using the behavioural checklist. Staff
frequently took more than one action, in most cases the staff response was to have a
general chat with the customer (19 of 23 cases, or 83%), and/or to observe the
123
customer for further signs of gambling issues (11 of 23 cases, or 48%). In some cases
staff approached a manager or more senior staff member to discuss their concerns
about a customer. It was rare for staff to talk directly to customers about their
behaviour.
The ‘Total’ column shows that follow-up actions mostly occurred following observation
of between 4 and 16 checklist behaviours, with staff usually recording around ten
behaviours (M = 9.81, SD 6.18). When staff saw one checklist behaviour they
described becoming aware of other behaviours. The high number of behaviours that
precipitated follow-up corresponds with research showing that staff are likely to
underestimate the severity of gambling issues, and are reluctant to label a customer as
a problem gambler until the signs are very clear (Delfabbro et al. 2012).
The ‘Number of problem behaviours by severity class’ columns show that the
behaviours precipitating all follow-up actions were more often from the higher severity
red and orange classes than from the lower severity yellow class. For instance, the
follow-up action, ‘Approach customer for general chat’, was precipitated on average by
5 red classed behaviours (M = 5.16, SD 2.77). Moreover, red classed behaviours
constituted 48% of precipitating observations. This should be expected as red and
orange class items are stronger indicators of problem gambling and are more
numerous in the checklist than the yellow ‘early warning sign’ items or the highest
severity purple class behaviours. As discussed earlier, purple class items are also rare
and difficult to observe (e.g. borrowing money from other people). These findings
indicate that staff proactively engaged with customers using the listed follow-up actions
when they were confident that multiple strong problem indicators were present.

124
Staff rationale and experiences of follow-up actions
During focus group discussions we asked staff to discuss the actions they took after
they had identified a possible problem gambler and the outcomes of those actions. As
noted earlier staff often took multiple actions (e.g., a general chat and continued
observations). The different types of actions are discussed in more detail below.
Action: Observation and general chat
Staff described placing customers under extended observation after multiple problem
behaviours (usually red and orange) were observed. Staff were also likely to say they
approached the customer for a chat. These conversations were general with the staff
member waiting for the customer to make reference to gambling problems rather than
directly engaging the customer about their behaviour. A highly experienced staff
member spoke about this process, and showed how she guided her conversation from
general small talk, through further observations made during the conversation, to a
position where she could gently go through options and encourage positive behaviour
change:
A: “I might go up and just do little bit of small talking, see a lot of the time
they’ll go, “Oh God I’m doing everything on this and I’ve got to try and stop
coming or...” I’ll say, “well yeah”, and they’ll say to me, “What about if I bar
myself?” And I go, “Yeah and then you can still come in and have dinner and
stuff, but we can’t allow you in the gaming room and...” Yeah, I don’t force it
down them though because I find then they go the other way. If they’re slowly
saying little bits you’ll find in the end they’ll come out and ask you. But you
just let them slowly, maybe warm to you a bit and feel like that they can
because they think, you don’t want to judge them. Just hear what they’ve got
to say and then I slowly just stick in my little things of, you know, if you do that
you can still on a Saturday night come in and have a, you know, a bistro meal
125
and then no-one has to know.” (Female, 31-50 years old, 20 years EGM
experience)
Action: Talk to senior staff member
On some occasions staff would talk to a manager or other senior staff member about
the behaviour of customers they had observed but this was fairly infrequent.
Consultations with senior staff were usually incorporated with a general chat to the
customer, either before or after talking with the manager. Less experienced staff were
more likely to draw on the experience of senior staff :
Q: [Did you perform any follow-up actions after identifying customers with
problem behaviours?]
A: I did. Generally it was talking to a senior staff member like a gaming
manager, mainly probably – we don’t have a gaming manager so a gaming
supervisor. So and approaching the customer for a general chat, I’ve done that
as well. (Female, 18-30 years old, 1.5 years EGM experience)
Experienced staff felt that this was a secondary choice to acting independently and
tended to only approach a manager in circumstances which extended beyond their
confidence to control the situation:
Q: “If you see someone who’s displaying problematic behaviours, they’re
getting angry at the machine or crying or whatever, what do you do? Would
you talk to a senior member?”
A: “No I’d go to them [the customer] for a general chat first. And then if I feel it’s
growing too big for me and out of my control then I might say to [Manager’s
name] or someone, “Oh look, you know, [Customer’s name] like I’ve tried to
have a bit of a chat, I’m really worried because she’s at that point,”... But I
would start it; I start it and mostly finish it...
(Female, 31-50 years old, 20 years EGM experience)
126
Action: Direct approaches and write up in the log book
In rare circumstances, staff approached customers to directly address specific
behaviour. The circumstances in which staff said they felt it was appropriate to discuss
specific behaviour were when customers were behaving inappropriately towards other
customers (item 26), when customers did not stop gambling at closing time (item 11),
or when they damaged property (Item 31). Thus it was only when behaviour had
become overtly problematic and was disrupting the comfort of other players or the
venue that staff would directly refer to the player’s behaviour.
A staff member new to the EGM room described having to act to stop customers
intimidating others (Item 26):
Q: “Have you seen people becoming angrier standing over other players, if
someone takes their machine?”
A: “I have seen that, yes.”
Q: “So what happens when that happens?”
A: “I always go and ask that person, “is this person bothering you?” And if they
say “no”, I leave it. But if they are bothering them, I just say “could you please
move away from the machine, you’re making that person feel uncomfortable.”
(Female, 18-30, 1 month EGM experience)
A highly experienced staff member referred to actions taken when customers found it
difficult to stop gambling at closing time (Item 11):
A: “Oh yeah, we struggle sometimes in the early hours when we’re trying to
say to people, “That’s enough now we’ve got to close.”
Q: “And how do you deal with it, how do you deal with those people who
won’t go home..?”
A: “Yeah we get security and we go, “Can you get them out now.”

127
(Female, 31-50 years old, 20 years EGM experience)
She also explained the circumstances under which the log book was included as part
of direct action with customers who became angry (Item 31):
A: “We’ve had smashed screens, smashed buttons...”
Q: “What do you do in that kind of situation?”
A: “Just try and calm them down and just say, “Look I think it’s time you
leave.”
Q: “Is that the kind of situation where you have to put it into a log book or
what happens there?”
A: Yeah it’s got to get written in an incident book, yeah.
(Female, 31-50 years old, 20 years EGM experience)
Obstacles to action: Aggression, rudeness and lack of staff confidence
Staff talked about barriers to direct action with players including fear of reprisal or lack
of confidence. In particular, wariness of aggression or rudeness led many staff to think
twice before taking direct action, and as the reason behind decisions not to refer to
customers’ gambling behaviour before the customer initiated the topic. Lack of
confidence inhibited others, especially younger and less experienced staff from taking
more direct actions.
Aggression and rudeness
Q: [Would you ever talk directly to a customer about their problem
behaviour?]
A: “If you see them quite upset you might say that but I’ve learnt my lesson I
wouldn’t go up to aggressive people, I’m not going to come to work to get
abused so I wouldn’t do that, why would you do it.”
(Female, 31-50 years old, 12 years EGM experience)

128
Q: “I was just going to ask you if you worry about receiving aggression.”
A: “Yeah absolutely. A lot of the time. Because they – a lot of them get very
aggressive. They’re losing their money, they’re losing their houses, you know,
losing their families and they just need someone to take it out on. Whereas
you’re trying to help, that’s the person they’re just going to go ape at so. It’s
worrying.”
(Female, 18-30 years old, 1.5 years EGM experience)
Perceptions of customer rudeness appeared to vary depending on the nature of the
relationships staff had with customers. In one venue, the experience of staff members
with established customer relationships appeared to have an impact on customer
behaviour:
Q: And you’re getting rudeness all the time, or frequently here?
A1: Yes, that’s a regular daily thing.
A2: I don’t know, I mean I get on really well, because I call everybody Love.
(Female, 31-50, 1 month EGM experience; Female 51+, 5 years EGM
experience)
In another venue, the experience of rudeness remained the same irrespective of
experience, age or relationships:
Q: “You know them [customers] by name, you’ve probably got a bit of a
relationship with them, like staff customer relationship and they’re still being
rude to you?”
A1: “Yeah, when they’re losing [item 33] and they put a lot in then [item 7] they’ll
start being rude to us as well won’t they? Bite your head off, and they want
everything done before they even ask for it.”
129
Q: “That aggressive behaviour, do most of the staff receive that from people
when they’re upset, or are there people who might be a bit older or something
like that and they get treated a bit more respectfully?”
A1: “No. Well I’m older, I’m in my fifties.”
A2: “No, they don’t care, they don’t care.”
A1: “They don’t care at all.”
A2: “Yeah, they don’t care.”
(A1: Female, 51+ years old; 4 years EGM experience; A2: Female, 18-30
years old, 2 years EGM experience)
Experiences such as these were sometimes raised as detracting from interest in
following up at all, with staff dismissive of those whom they perceived to show a lack of
respect.
Lack of confidence
Younger and less experienced staff were more likely to report a lack of confidence in
their efficacy to follow-up with customers displaying clear problem behaviours:
Q: “When you’ve got someone coming up to you [at the EFTPOS] multiple
times in a session and you know that they’re spending a lot, do you – is that
at the point where you intervene or is it intimidating to intervene.”
A: It’s probably where we should. I try and have a chat to them. It’s such a
hard situation to – yeah it’s just so hard to approach people about...”
Q: “Tell me about that. Why is it hard to approach?”
A: ”It’s such a personal thing and if people feel like they want to spend that
much money then they should be able to but there’s – well I don’t think they
should be able to, they shouldn’t. But it’s really hard.”
(Female, 18-30 years old, 1.5 years EGM experience)
130
Some of the older and more experienced staff also felt a lack of confidence at times,
although this appeared to relate more to a lack of confidence in the appropriateness of
their actions rather than in their ability to make the actual approach:
A: “I did make a comment when I filled out the form that I feel I’m not qualified
[to follow-up]. You can only do so much, you can only speak to them…
[However,] There is a couple of people that, because I’ve been here so long,
that I was able to speak to them as a friend, but most people that have
a gambling problem don’t want to know you, they don’t want you to know how
much money they’ve put through, they’re unapproachable.”
(Female, 51+ years old, 11 years EGM experience)
These findings showed that staff did generally act once they had identified a customer
with potential gambling problems. They highlight the staff preference to rely on
observation and general chat as follow-up actions to their observations, and the value
of these indirect actions to overcome obstacles of aggression, rudeness and lack of
confidence. This style of responding is consistent with the training staff currently
receive on ways to approach potential problem gamblers which emphasises the use of
a general approach rather than confronting the customer directly, something which is
likely to be much more stressful for staff and may be counterproductive (Cosic 2012)
3.2.5 Potential improvements to the checklist The gambling behaviour checklist was devised to be used as a staff learning tool and
an aide to problem gambling identification. It is important that the tool be streamlined
for use in a busy, working environment. To this end, we engaged in a process of item
and checklist refinement, incorporating feedback from staff about what they would
change about the checklist and how the checklist might be practically implemented in
the work setting. This includes the earlier discussed issues with some items in terms of
observability and interpretation, as well as environmental impediments to behavioural

131
identification. The following sections discuss ways of addressing problematic items to
improve the overall usability of the checklist.
Reduction in number of items
While two staff commented on the value of having a wide range of items present on the
checklist, five others suggested that the checklist should contain fewer items,
especially for workers who regularly worked busy shifts:
Q: How do you think the list could be improved?
A: I think there was a lot to read so when I was answering the things I was
thinking, “Oh," if there was somehow, there was less of it there.
(Female, 31-50 years old, 12 years EGM experience)
A: Yeah what to look for but not have too many, just have a few of your
main ones that yeah.
(Female, 31-50, 20 years EGM experience)
A1: I reckon it’s too many, I reckon it should just be the more typical ones on
there.
A2: Definitely make it smaller, because half of this is relevant.
A3: …there’s way too many, like by the time you look at them and you think,
oh maybe they’ve got that, or have they got that one. You’re sort of second
guessing yourself, there’s too many to set it aside… I just reckon just have
like maybe ten behaviours in total, that are the major ones. Like ones getting
angry, ones with…
A1: Or gambling continuously.
(A1: Female, 18-30, 1.5 years EGM experience; A2: Female, 51+ years old, 5
years EGM experience; A3: Female, 31-50, 5 months EGM experience)

132
Repetitious or redundant items
Merging or removing repetitious items is one way of reducing an overly long list. Staff
commented that there were repetitious items, and further, that the repetitious items
made it difficult to choose one particular item over the other. Discussions suggested
this may have led to situations in which one item was chosen arbitrarily over another,
or both items were endorsed in relation to a single behaviour. An example of this
relates to the comments of two staff who struggled to differentiate between Item 2,
‘gambles continuously’, and Item 3, ‘often gambles for long periods (3+ hours) without
a proper break’. A further staff member said she could not differentiate between these
items and Item 1 ‘Gambles intensely without reacting to what’s going on around
him/her’:
A: I just think you know, like you’re saying gambles intensely and without
reacting to what's going on around, or often gambles for long periods of three
hours without a proper break, and then you’ve got gambles continuously –
they’re all sort of relevant. But they’re all similar, but it’s just worded differently,
that’s how I see it. (Female, 31-50, 5 months EGM experience)
Another staff member raised the issue of repetition in relation to items 1 and 27, noting
that they could not differentiate between a customer who gambled intensely without
reacting to their surrounds and one who avoided contact or conversations with others.
These repetitious items are tabled below.
Table 32: Repetitious item groupings according to staff
Item No
Grouping 1: Category
1 Gambles intensely without reacting to what’s going on around him/her I&D 2 Often gambles for long periods (3+ hours) without a proper break I&D 3 Gambles continuously I&D
Grouping 2:
1 Gambles intensely without reacting to what’s going on around him/her I&D 27 Avoids contact or conversation with others SB I&D: Intensity and duration; SB: Social behaviours

133
Effective psychological scales often make use of several similar items to measure a
concept as this can strengthen the accuracy of measurement. However, an important
consideration in the development of screens for workplace use is to make them as brief
and simple as possible. Early use of this particular screen by Venue Support Workers
in Victoria suggested staff thought it was important to include variability of behaviour,
however these results demonstrate the importance of combining items that are
measuring the same overall concept. For example, merging items 2 and 3 would not
result in any loss of information. It may also be possible to create a slightly more
generic item and have examples that cover items 1, 2 and 3 to reduce the overall
number of items related to intensity and duration. It is less certain whether items 1 and
27 should be combined as confusion between these items was only discussed by one
person. Moreover these two items retain unique content in that they distinguish
between the behaviours of gambling intensely and actively avoiding others.
Difficult to observe items
Removal or reworking of items that are rarely seen or otherwise difficult to observe is
another way of reducing the checklist to a more practical length for staff. Ten items,
tabled below, were rated as difficult to observe for a third of staff who participated (as
discussed in Section 3.2.2). We therefore considered them for their utility.
Table 33: Gambling Behaviour Checklist: Difficult to observe items
Item Behaviour Category
Described by staff as
difficult to observe (N=11)
Times observedb
(N=216) 9 Significant increase in spending pattern I&D 4 4
28 Stays on to gamble when friends leave venue SB 4 7 5 C Bets $3 or more per spin most of the time I&D 5 11 27 Avoids contact or conversation with others SB 5 3
30 Shows signs of anxiety while gambling (shaking, sweating, looking nervous, edgy) ER 5 3
15 Borrows money from other people at venue or asks for a loan/credit MS 6 3

134
23 Has friends or relatives contact the venue asking if the person is still there SB 6 1
24 Asks venue staff not to let others know they are there SB 6 0
29 Brags about winning or makes a big show about their gambling skills SB 6 1
22 Significant decline in personal grooming or appearance over several days SB 7 1
a Number out of 11 focus group participants who found the item difficult to observe during a typical shift. bTotal number of times checklist behaviours were observed across 23 customers = 216. C Item content aligned to Victoria. I&D: Intensity and duration; MS: Money seeking; SB: Social behaviours; ER: Emotional responses
Items that would benefit from enhanced staff awareness
Difficulties pertaining to the observation of items 5, 9, 22, and 28 manifested from the
levels of attention staff give to customer behaviour. Rather than remove these items,
training staff to be aware of these problem indicators would expand their repertoire and
capacity to identify customers with potential gambling problems. For instance, whether
or not customers stay on to gamble after friends leave (Item 28) is observable with
appropriate attention. Observation of customer betting levels (Item 5) might be a
practice encouraged during rounds of the gaming floor.
In the case of item 22, while staff participating in this study rarely noted a decline in
personal grooming, more perceptive staff referenced customers who appeared to arrive
untidy, unwashed and odorous, or in the same clothes as the previous day. It should
also be noted that this has been seen as a key indicator within earlier consultations
(Delfabbro et al., 2007). It may be that this item would benefit from a simple reworking
to reflect issues with broader hygiene and/or appearance in customers (especially
where this appears to be exacerbated over time).
Items that were rarely observed
Whereas observational difficulties for the above items would be alleviated through
awareness training, results from both Stage One and Stage Two of this study suggest
that items 15, 23 and 24 are unlikely to be observed frequently in EGM venues even
135
with such training. They are potentially less useful to a staff checklist applied under real
conditions of use. However, all three items were very strong problem gambling
indicators in Stage One and in Delfabbro et al (2007). Further, a customer exhibiting
even one of these three particular indicators is immediately approached by staff and
the incident formally recorded in Swiss casinos (see Delfabbro et al, 2007, 2012;
Hancock, 2011). These items may become more useful with some simple re-wording.
For example, while staff said they were unlikely to see customers attempting to borrow
money (Item 15) they did say they may hear about attempts to borrow money from
other customers or staff. This information could still be used as an identifying marker if
it is seen in conjunction with other personal behaviour. Item 23 (having friends and
family contact the venue asking for a customer) and item 24 (asking staff to conceal
customer presence in a venue) are both evidence that a customer is attempting to
conceal gambling visits from others. Staff also suggested a further similar behaviour,
leaving the gaming room to use their mobile phone. In the interests of brevity and
simplicity, therefore, it may be helpful to write an item encompasses all three
behaviours as indicators that a customer to disguise or conceal their presence at the
venue.
Items which were hard to interpret
Items 27, 29 and 30 were difficult for staff to interpret and may therefore benefit from
removal, modification or require a training focus to enhance their usefulness. More than
half the staff were unable to distinguish between customers’ celebration of winnings
and bragging of winnings (Item 29) and this behaviour was reported only once. The
value of a similar indicator was questioned in a previous study for similar reasons (Ben-
Tovim et al. 2001) This item might be considered for removal from a checklist used in
EGM venues. It may be more useful for table games at casinos.
Signs of anxiety, including shaking, sweating, looking nervous or edgy (Item 30), were

136
difficult for many staff to differentiate from other forms of distress such as looking sad
or depressed (Item 32). This is not so much an issue from an identification point of view
as any signs of distress should be taken as indicators. Given the requests for a
reduced number of items it may be worthwhile to further consolidate distress items by
incorporating item 30 into item 32. The main argument against this is that it reduces
what may be a variety of behaviours to a single indicator, thus minimising the chances
of early identification in the absence of other indicators.
In the case of item 27, staff struggled to differentiate between customers who were
enjoying some peace and quiet, and those who were problematically avoiding contact
with others. Prior research would suggest this is likely to be a key item (Delfabbro et al.
2007; Current study, Stage One). Tailored staff training would likely improve the ability
of staff to make this important distinction.
Suggestions for additional items
Staff suggested the inclusion of some further indicators of potential problem gambling
that they had observed but which they could not locate on the checklist. Each
suggestion is discussed below. Notably all suggested behaviours overlapped with an
existing item. This suggests that some staff were not extrapolating from existing items
to similar behaviours without specific examples being provided for a few different
behaviours. The content of staff suggestions could be considered for clarification or
modification of existing checklist items, or in development of further checklist items.
Each of the behaviours suggested by staff is shown in Table 34. Alongside them are
pre-existing checklist items which share similar content.
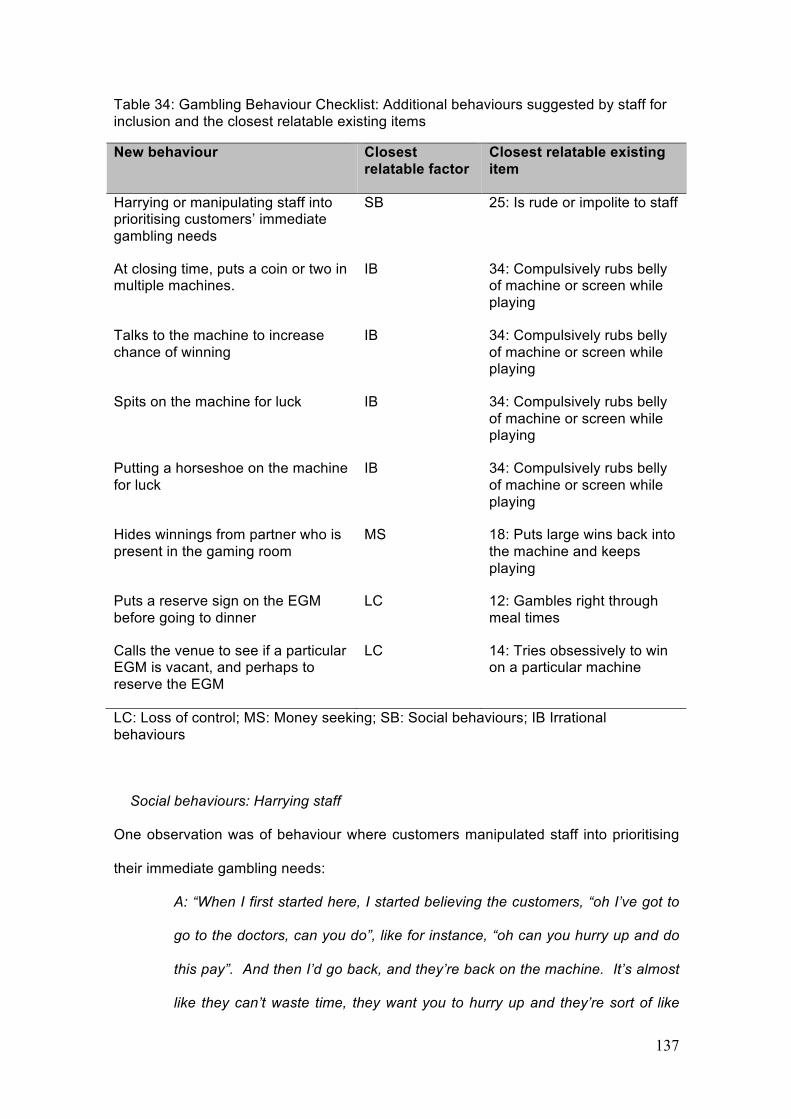
137
Table 34: Gambling Behaviour Checklist: Additional behaviours suggested by staff for inclusion and the closest relatable existing items
New behaviour Closest relatable factor
Closest relatable existing item
Harrying or manipulating staff into prioritising customers’ immediate gambling needs
SB 25: Is rude or impolite to staff
At closing time, puts a coin or two in multiple machines.
IB 34: Compulsively rubs belly of machine or screen while playing
Talks to the machine to increase chance of winning
IB 34: Compulsively rubs belly of machine or screen while playing
Spits on the machine for luck IB 34: Compulsively rubs belly of machine or screen while playing
Putting a horseshoe on the machine for luck
IB 34: Compulsively rubs belly of machine or screen while playing
Hides winnings from partner who is present in the gaming room
MS 18: Puts large wins back into the machine and keeps playing
Puts a reserve sign on the EGM before going to dinner
LC 12: Gambles right through meal times
Calls the venue to see if a particular EGM is vacant, and perhaps to reserve the EGM
LC 14: Tries obsessively to win on a particular machine
LC: Loss of control; MS: Money seeking; SB: Social behaviours; IB Irrational behaviours
Social behaviours: Harrying staff
One observation was of behaviour where customers manipulated staff into prioritising
their immediate gambling needs:
A: “When I first started here, I started believing the customers, “oh I’ve got to
go to the doctors, can you do”, like for instance, “oh can you hurry up and do
this pay”. And then I’d go back, and they’re back on the machine. It’s almost
like they can’t waste time, they want you to hurry up and they’re sort of like
138
telling tales, so that they can hurry up and get to their machines.” (Female,
51+ years old, 9 years EGM experience).
This resonated with other examples staff gave in which they were cajoled into dropping
what they were doing or were hurried to meet customer demand. It links to current item
28, concerning rudeness or impoliteness to staff.
Irrational behaviours: Coins in multiple EGMs, talking to EGMs, spitting on EGMS,
and use of luck charms
At closing time, regular gamblers would sometimes visit the venue just to put a few
coins into each machine in the hopes of setting off a win. A staff member thought might
be problematic:
A: “[Customers] thought the machines were going to pay within the last half
hour. We used to get people walk in - two, three, whatever - regulars, who’d
walk in half an hour before closing time, and of course it used to be so
frustrating because you’d be doing the readings and whatnot, and they’d put a
dollar in there, and they honestly thought… It’s ridiculous, you know, come in
at 3:30 (am), you’re half an hour before we closed… Oh people have got
some funny ideas about gambling.”
At face value, this behaviour fits with the intensity and duration items concerned with
gambling on multiple machines (Item 8) and rushing from one machine to another (Item
10). However, the cognitions behind this behaviour fit most closely to the irrational
behaviour domain, reflected in irrational belief that a last minute win is possible on an
EGM that has been played throughout the day.

139
Three staff made observations concerning the regularity with which some customers
talked to EGMs, and thought this irrationality or anthropomorphic attribution might be a
sign of potential gambling problems:
A1: “Where you’ve got here, irrational behaviour – quite often you walk past
and you can hear them talking to the machines, you haven’t got anything about
that. They actually talk to the machines.”
Q: “Okay, talking to the machines, yeah.”
A2: “Yeah they do.”
A1: “On a regular basis, “come on, give me the jackpot”, “Come on, you can do
it.”
(A1: Female, 31-50 years old, 5 months EGM experience; A2 Female, 18-30
years old, 1 year EGM experience)
Additional superstitious behaviours were raised, including spitting on machines and
placing horseshoes on the machine for luck:
Q: “What about compulsively rubbing the belly of the machine, do you see
that?”
A: “Oh yeah, the thing they spit on it, they do everything.”
Q: “Spit on it?”
A: “Oh they spit on it, they put it on their hands and then they do... Aww it
makes me sick.”
Q: … What other odd things do you see?”
A: “We’ve got a lady that comes, she’s got a horseshoe and <laughs> once
I walked past, I had to double back, “Oh <customer name> what have you
got?” “Oh that’s my horseshoe.” So she just leaves it sitting up on the
thing. So I go, “Is your horseshoe helping?” She’ll go, “Yeah today it is.”
Then she brings it in the next time <laughs> and then it’s not helping
anymore. So yeah.”

140
Q: “That’s interesting. So do you reckon this would be a useful list for new
staff?”
A: “Probably for new people, yeah because you need to start to see some
signs of what people do, yeah.”
(Female, 31-50 years old, 20 years EGM experience).
Irrational cognitions / beliefs such as these have been well described in the literature,
with a positive relationship being found between such erroneous cognitions and
gambling problems (Delfabbro & Winefield, 2000). These suggestions correspond with
the domain of item 34, concerning compulsive machine belly rubbing, however, the
above suggests staff may not always extrapolate to similar behaviours without specific
examples being provided for a few different behaviours.
Money Seeking: Concealed winnings
A staff member pointed out that some customers concealed winnings from their partner
who was at the venue with them, and that this was a potential problem behaviour not
covered by the checklist.
A: “Yeah. I mean I get people in the gaming room whose wife might be down
one end of the room and he’s at the other, and he’ll go “don’t tell her I just had a
win.” You get that quite often.” (Female, 51+ years old, 5 years EGM
experience)
This suggestion appears related to Money Seeking item 18 ‘Puts large wins back into
the machine and keeps playing’.
Loss of Control: Reserving machines for extended periods
When discussing item 12, ‘Gambles right through meal times’, a staff member made
the observation that some customers stopped to eat but will put reserved signs on their
machines:
141
A1: “They go in for dinner, and then they’re back, and the number of people
that play a machine and they put a reserved sign, hoping it’ll still be reserved
when they come back from dinner, that happens quite a lot. And they’ll leave
one or two credits on it. Yeah, it happens, especially with the 1c machines and
2c machines, with leaving small credits on it. It’s always under a dollar.”
(A1: Female, 51+ years old, 11 years EGM experience; A2: Female venue
manager, 31-50 years old, 20 years EGM experience)
This reserve behaviour is closest in similarity to Loss of Control item 12 concerning
gambling during meal times.
In another venue, a staff member described how some customers called ahead to ask
whether there was anyone playing on “their” machine and asked staff to reserve it:
A: “We will have them ring and ask to see if their machine is vacant, and if it’s
not, [they will ask] “Can we put a reserve sign on the machine?”
This behaviour shares similarity with items in the Loss of Control category and item 14
in particular, “Tries obsessively to win on a particular machine”:
It is not known at this stage whether these potential new items or exemplars are
commonly seen in problem gamblers, nor whether they are good discriminators. For
example, while irrational cognitions are often more prominent in problem gamblers,
they are also quite common in non-problem gamblers (Walker, 1992) so may not
discriminate well. It is therefore recommended that any of these potential new
items/examples which are added to the checklist are tested for applicability. As can be
seen from Table 34, some of the suggestions are quite similar to existing items, so
where possible any additions are to expand the coverage of an existing item (more
varied examples of core behaviours) rather than adding additional items.
142
3.2.6 Refinements to the Gambling Behaviour Checklist (GBC-EGM): The GBC-EGM-SV for Staff in Victoria, GBC-EGM-S for Saff elsewhere, and GBC-EGM-R for Researchers The results for Stage Two showed that the checklist was useful for staff and the
majority of items were easy for staff to observe and interpret in terms of normal versus
problematic behaviour. However, some items were identified by staff as being
potentially problematic in their current form. Drawing on the analysis of data from focus
groups, we made a series of decisions and modifications to the checklist to increase its
practical utility for EGM staff working in Victorian venues, staff in other jurisdictions and
countries, and for researchers interested in EGM gambling behaviour observation.
Three simple variations on the checklist were developed to meet these ends: (1) The
GBC-EGM-SV for staff in Victoria, (2) The GBC-EGM-S for staff located in other
countries or Australian jurisdictions, and (3) The GBC-EGM-R for researchers
interested in collecting a larger range of observational gambling behaviour data. Each
checklist item was considered on its individual merits, including its contribution to the
behaviour category and severity class it belonged to, and relevance to each respective
checklist version. The similarities and differences between the three versions are
explained below. All three versions appear in Appendix B and are formatted for use.
GBC-EGM-SV (30-items) for Staff in Victoria
We developed the GBC-EGM-SV for ease of use by EGM staff working in the Victorian
gambling environment. Of the three versions it contains the fewest number of items.
This version most deeply integrates the findings of Stage One and Two presented in
the current report. Following staff feedback in Stage Two, Pilot GBC-EGM-SV items 2
and 3 were merged into one item to alleviate repetition, confusion or potential duplicate
responses for observations of customers who gamble continuously for extended
periods. Items 30 and 32 were merged to address the difficulty many staff had in
distinguishing between distress and anxiety. Item 22 was modified, with poor general

143
hygiene emphasised. Items 23 and 24 were merged and had talking or making mobile
calls outside the venue added to broaden the applicability of behaviours designed to
conceal gambling behaviour from close others. Item 34 was expanded to include a
broader array of irrational behaviours. Item 15 was reworded to include third party
accounts of borrowing money and item 29 was removed due to rarity and visibility in
EGM venues. Items 5, 22, 27, 28 were highlighted for staff awareness training in the
instructions to accompany the checklist. The effect of these revisions was to reduce the
Pilot GBC-EGM checklist modified for Staff in Victoria in Stage Two from 34 to 30
items. Table 35 shows a summary of the decision-making rationale for each item and
resulting modifications. The Final GBC-EGM-SV is an example of how the GBC-EGM-
S can be modified to encompass any jurisdiction-specific conditions within which staff
work. The GBC-EGM-SV is formatted for use in Appendix B.

144
Table 35: Refinement of the Pilot into the Final Gambling Behaviour Checklist for Staff in Victoria (GBC-EGM-SV)
Pilo
t GB
C-E
GM
-SV
Item
No
Revised behaviour Cat
egor
y
Stag
e 1
Odd
s R
atio
Stag
e 2
Obs
erva
bilit
y a
Stag
e 2
Tim
es
obse
rved
b
Staff feedback Decision 1 Gambles intensely without reacting to what’s going on around
him/her I&D 3.26 10 5 Repetitious 1,2,3; 1,27;
Easily observed Retain
2 Often gambles for long periods (3+ hours) without a proper break
I&D 1.95 11 14 Repetitious 1,2,3; Easily observed; Frequently observed
Incorporate 3
3 Gambles continuously
I&D 2.09 11 4 Repetitious 1,2,3; Easily observed
Merge with 2 and delete
4 Plays very fast
I&D 2.02 9 7 Easily observed Retain
5 C Bets $3 or more per spin most of the time
I&D 1.92 6 11 Location dependent Awareness training
6 Gambles most days
I&D 2.28 11 4 Easily observed Retain
7 Spends $300 or more in a session
I&D 2.55 10 16 Easily observed; Frequently observed
Retain
8 Gambles on 2 or more machines at once
I&D 2.36 11 6 Easily observed Retain
9 Significant increase in spending pattern
I&D 1.91 7 4 Hard to observe in irregular customers
Retain
10 Rushes from 1 machine to another
I&D 2.09 9 4 Easily observed Retain
11 Finds it difficult to stop gambling at closing time
LC 4.35 9 6 Shift dependent; Easily observed
Retain
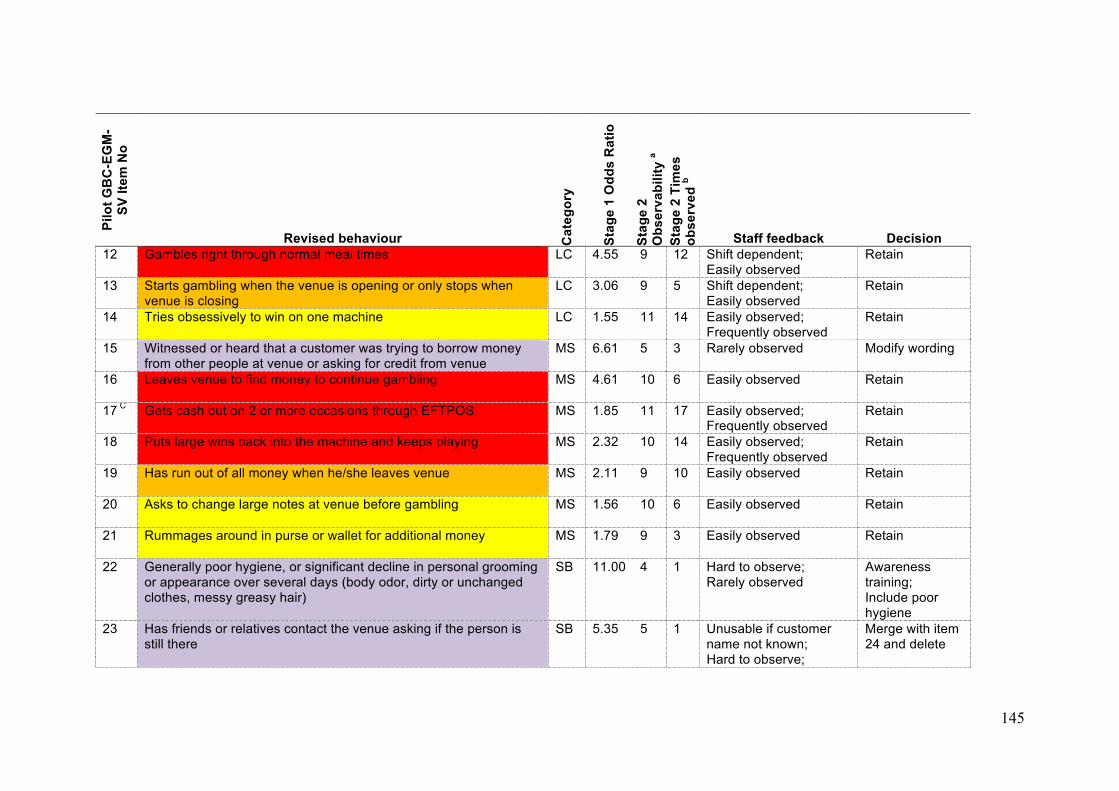
145
Pilo
t GB
C-E
GM
-SV
Item
No
Revised behaviour Cat
egor
y
Stag
e 1
Odd
s R
atio
Stag
e 2
Obs
erva
bilit
y a
Stag
e 2
Tim
es
obse
rved
b
Staff feedback Decision 12 Gambles right through normal meal times
LC 4.55 9 12 Shift dependent;
Easily observed Retain
13 Starts gambling when the venue is opening or only stops when venue is closing
LC 3.06 9 5 Shift dependent; Easily observed
Retain
14 Tries obsessively to win on one machine
LC 1.55 11 14 Easily observed; Frequently observed
Retain
15 Witnessed or heard that a customer was trying to borrow money from other people at venue or asking for credit from venue
MS 6.61 5 3 Rarely observed Modify wording
16 Leaves venue to find money to continue gambling
MS 4.61 10 6 Easily observed Retain
17 C Gets cash out on 2 or more occasions through EFTPOS
MS 1.85 11 17 Easily observed; Frequently observed
Retain
18 Puts large wins back into the machine and keeps playing
MS 2.32 10 14 Easily observed; Frequently observed
Retain
19 Has run out of all money when he/she leaves venue
MS 2.11 9 10 Easily observed Retain
20 Asks to change large notes at venue before gambling
MS 1.56 10 6 Easily observed Retain
21 Rummages around in purse or wallet for additional money
MS 1.79 9 3 Easily observed Retain
22 Generally poor hygiene, or significant decline in personal grooming or appearance over several days (body odor, dirty or unchanged clothes, messy greasy hair)
SB 11.00 4 1 Hard to observe; Rarely observed
Awareness training; Include poor hygiene
23 Has friends or relatives contact the venue asking if the person is still there
SB 5.35 5 1 Unusable if customer name not known; Hard to observe;
Merge with item 24 and delete
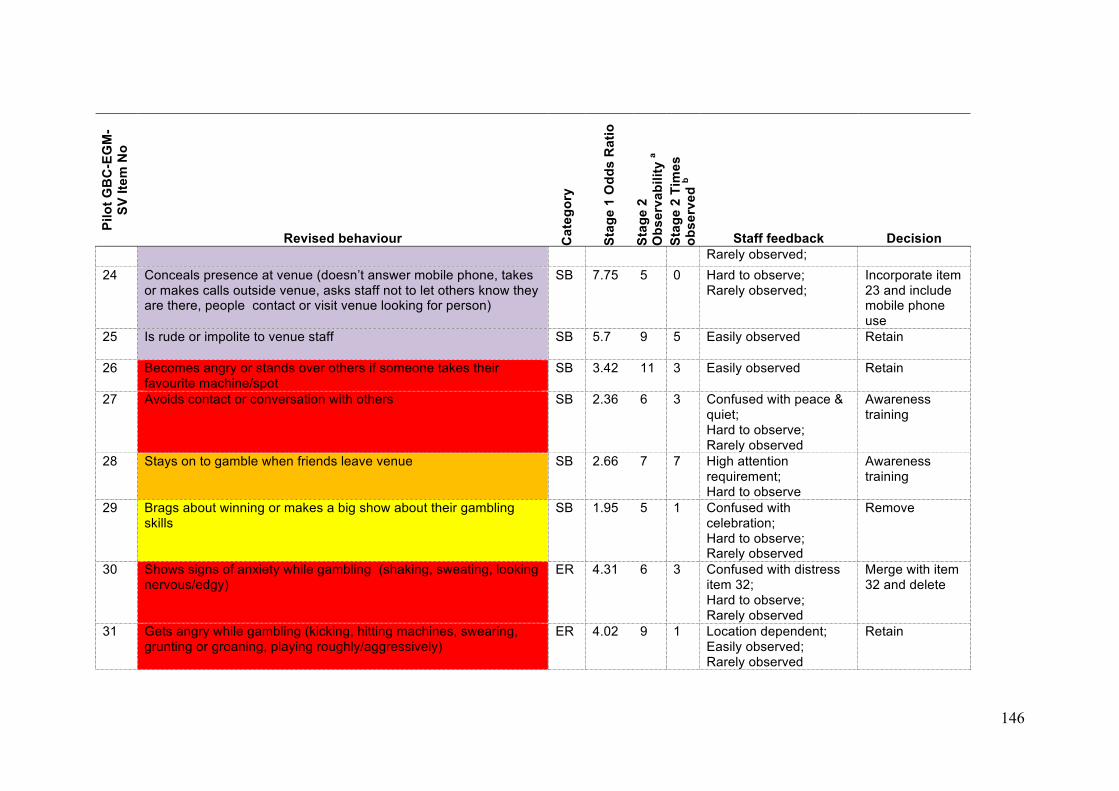
146
Pilo
t GB
C-E
GM
-SV
Item
No
Revised behaviour Cat
egor
y
Stag
e 1
Odd
s R
atio
Stag
e 2
Obs
erva
bilit
y a
Stag
e 2
Tim
es
obse
rved
b
Staff feedback Decision Rarely observed;
24 Conceals presence at venue (doesn’t answer mobile phone, takes or makes calls outside venue, asks staff not to let others know they are there, people contact or visit venue looking for person)
SB 7.75 5 0 Hard to observe; Rarely observed;
Incorporate item 23 and include mobile phone use
25 Is rude or impolite to venue staff
SB 5.7 9 5 Easily observed Retain
26 Becomes angry or stands over others if someone takes their favourite machine/spot
SB 3.42 11 3 Easily observed Retain
27 Avoids contact or conversation with others SB 2.36 6 3 Confused with peace & quiet; Hard to observe; Rarely observed
Awareness training
28 Stays on to gamble when friends leave venue
SB 2.66 7 7 High attention requirement; Hard to observe
Awareness training
29 Brags about winning or makes a big show about their gambling skills
SB 1.95 5 1 Confused with celebration; Hard to observe; Rarely observed
Remove
30 Shows signs of anxiety while gambling (shaking, sweating, looking nervous/edgy)
ER 4.31 6 3 Confused with distress item 32; Hard to observe; Rarely observed
Merge with item 32 and delete
31 Gets angry while gambling (kicking, hitting machines, swearing, grunting or groaning, playing roughly/aggressively)
ER 4.02 9 1 Location dependent; Easily observed; Rarely observed
Retain

147
Pilo
t GB
C-E
GM
-SV
Item
No
Revised behaviour Cat
egor
y
Stag
e 1
Odd
s R
atio
Stag
e 2
Obs
erva
bilit
y a
Stag
e 2
Tim
es
obse
rved
b
Staff feedback Decision 32 Shows signs of distress after gambling (looks sad/depressed,
crying, holding head in hands, nervous/edgy, shaking, sweating) ER 5.24 9 6 Easily observed Incorporate item
30 33 Complains to staff about losing, or blames venue or machines for
losing IB 4.8 9 8 Easily observed Retain
34 Rituals or superstitious behaviours (rubbing belly of machine or screen, talking to machine, spitting on machine, use of luck charms)
IB 2.02 11 6 Spitting, luck charms, machine talk not included.
Modify to include additional example behaviours
a Observability = number out of 11 focus group participants who found the item easy to observe during a typical shift.b Total number of times checklist behaviours were observed across 23 customers = 216. C Item content aligned to Victoria. I&D: Intensity and duration; LC: Loss of control; MS: Money seeking; SB: Social behaviours; ER: Emotional responses; IB Irrational behaviours

148
GBC-EGM-S (32-items) for Staff in other jurisdictions and countries
While the GBC-EGM-SV was calibrated to Victorian staff, we designed the GBC-EGM-
S (32-items) for use by staff in EGM venues in jurisdictions beyond Victoria including
other countries. To this end we reinstated two Money Seeking items from the GBC-
EGM developed in Stage One that were not applicable to the 2012-13 Victorian
gambling environment but were applicable to other jurisdictions. These included Item
19, ‘Avoids cashier and only uses cash facilities’, and Item 20, ‘Uses coin machine at
least 4 times’. Secondly, we reverted two items that had been modified to fit the
Victorian gambling environment to their original GBC-EGM wording. Item 17, ‘Gets
cash out on 2 or more occasions through EFTPOS’ was reverted to ‘Gets cash out on 2
or more occasions through ATM or EFTPOS’. Item 5, ‘Bets $3 or more per spin most of
the time’ was reverted to ‘Bets $2.50 or more per spin most of the time). We retained
the refinements to item sequence, wording and exemplification made to the Victorian
version. The GBC-EGM-S is formatted for use in Appendix B.
Future users of the GBC-EGM-S should ensure that each item is suited to the gambling
environment in which they intend to use it. A small number of changes to the checklist
items may be necessary. For instance, the item, ‘Finds it difficult to stop gambling at
closing time’, would be redundant for staff working in a 24-hour Las Vegas casino. It
should therefore be removed from a staff checklist used in that environment.
GBC-EGM-R (36-items) for Researchers
The GBC-EGM-R (36-items) for researchers carried forward the 36 GBC-EGM items
from Stage One. This version was intended for data collection of a greater range of
visible customer behaviours than the staff versions. It was also designed for ease of
data comparison with Delfabbro et al 2007, with Stage One of the current report and
with research papers arising. Items were not merged or deleted as this was done to
facilitate ease of staff use in the SV and S versions. However, refinements to item
149
sequence, wording and exemplification arising from Stage Two were integrated where
applicable.
Items comprising each version of the Gambling Behaviour Checklist are displayed
together in Table 36. The table facilitates ease of content examination across the
different versions. Formatted versions including instructions for staff are provided in
Appendix B. Items are numbered and displayed in their recommended sequence. The
categories of behaviours most likely to be seen by staff are located earlier in the list,
followed by the behaviours most likely to be seen, followed by those which are easiest
to observe. Behaviours that are rarer and/or more difficult to observe are still retained
but located closer to the bottom of the checklist. We believe this sequencing will
contribute to quicker identification of problem behaviours, and enhance checklist
efficacy in busy periods.

150
Table 36: The Gambling Behaviour Checklist
Item Number
Fina
l GB
C-E
GM
-SV
GB
C-E
GM
-S
GB
C-E
GM
-R
Pilo
t GB
C-E
GM
-SVe
Revised Behaviour Cat
egor
y
Stag
e 1
Odd
s R
atio
d
Stag
e 2
Obs
erva
bilit
y a
Stag
e 2
Tim
es
obse
rved
b
1 1 1 14 Tries obsessively to win on one machine
LC 1.55 11 14
2 2 2 12 Gambles right through normal meal times
LC 4.55 9 12
3 3 3 11 Finds it difficult to stop gambling at closing time
LC 4.35 9 6
4 4 4 13 Starts gambling when the venue is opening or only stops when venue is closing
LC 3.06 9 5
5 5 5 17 C Gets cash out on 2 or more occasions through ATM or EFTPOS
MS 1.85 11 17
- 6 6 - Avoids cashier and only uses cash facilities
MS 4.02 - -
- 7 7 - Uses coin machine at least 4 times
MS 2.20 - -
6 8 8 18 Puts large wins back into the machine and keeps playing
MS 2.32 10 14
7 9 9 19 Has run out of all money when he/she leaves venue
MS 2.11 9 10
8 10 10 16 Leaves venue to find money to continue gambling
MS 4.61 10 6
9 11 11 20 Asks to change large notes at venue before gambling
MS 1.56 10 6
10 12 12 21 Rummages around in purse or wallet for additional money
MS 1.79 9 3
11 13 13 15 Witnessed or heard that a customer was trying to borrow money from other people at venue or asking for credit from venue
MS 6.61 5 3
12 14 14 7 Spends $300 or more in a session
I&D 2.55 10 16
13 15 15 2 Often gambles for long periods (3+ hours) without a proper break
I&D 1.95 11 14
- - 16 3 Gambles continuously I&D 2.09 11 4

151
Item Number
Fina
l GB
C-E
GM
-SV
GB
C-E
GM
-S
GB
C-E
GM
-R
Pilo
t GB
C-E
GM
-SVe
Revised Behaviour Cat
egor
y
Stag
e 1
Odd
s R
atio
d
Stag
e 2
Obs
erva
bilit
y a
Stag
e 2
Tim
es
obse
rved
b
14 16 17 5 C Bets $3 or more per spin most of the time
I&D 1.92 6 11
15 17 18 4 Plays very fast
I&D 2.02 9 7
16 18 19 8 Gambles on 2 or more machines at once
I&D 2.36 11 6
17 19 20 1 Gambles intensely without reacting to what’s going on around him/her
I&D 3.26 10 5
18 20 21 6 Gambles most days
I&D 2.28 11 4
19 21 22 10 Rushes from 1 machine to another
I&D 2.09 9 4
20 22 23 9 Significant increase in spending pattern
I&D 1.91 7 4
21 23 24 33 Complains to staff about losing, or blames venue or machines for losing
IB 4.8 9 8
22 24 25 34 Rituals or superstitious behaviours (rubbing belly of machine or screen, talking to machine, spitting on machine, use of luck charms)
IB 2.02 11 6
- - 26 30 Shows signs of anxiety while gambling (shaking, sweating, looking nervous/edgy)
ER 4.31 6 3
23 25 27 32 Shows signs of distress after gambling (looks sad/depressed, crying, holding head in hands, nervous/edgy, shaking, sweating)
ER 5.24 9 6
24 26 28 31 Gets angry while gambling (kicking, hitting machines, swearing, grunting or groaning, playing roughly/aggressively)
ER 4.02 9 1
25 27 29 28 Stays on to gamble when friends leave venue
SB 2.66 7 7
- - 30 29 Brags about winning or makes a big show about their gambling skills
SB 1.95 5 1
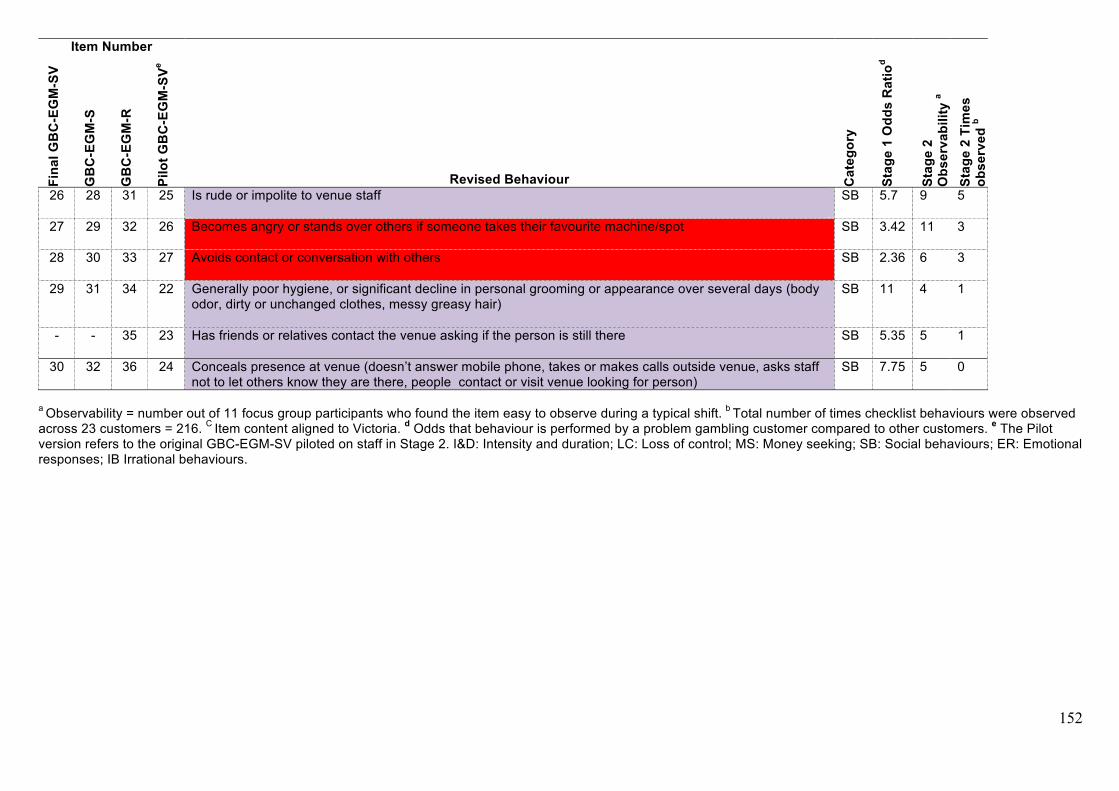
152
Item Number
Fina
l GB
C-E
GM
-SV
GB
C-E
GM
-S
GB
C-E
GM
-R
Pilo
t GB
C-E
GM
-SVe
Revised Behaviour Cat
egor
y
Stag
e 1
Odd
s R
atio
d
Stag
e 2
Obs
erva
bilit
y a
Stag
e 2
Tim
es
obse
rved
b
26 28 31 25 Is rude or impolite to venue staff
SB 5.7 9 5
27 29 32 26 Becomes angry or stands over others if someone takes their favourite machine/spot
SB 3.42 11 3
28 30 33 27 Avoids contact or conversation with others
SB 2.36 6 3
29 31 34 22 Generally poor hygiene, or significant decline in personal grooming or appearance over several days (body odor, dirty or unchanged clothes, messy greasy hair)
SB 11 4 1
- - 35 23 Has friends or relatives contact the venue asking if the person is still there
SB 5.35 5 1
30 32 36 24 Conceals presence at venue (doesn’t answer mobile phone, takes or makes calls outside venue, asks staff not to let others know they are there, people contact or visit venue looking for person)
SB 7.75 5 0
a Observability = number out of 11 focus group participants who found the item easy to observe during a typical shift. b Total number of times checklist behaviours were observed across 23 customers = 216. C Item content aligned to Victoria. d Odds that behaviour is performed by a problem gambling customer compared to other customers. e The Pilot version refers to the original GBC-EGM-SV piloted on staff in Stage 2. I&D: Intensity and duration; LC: Loss of control; MS: Money seeking; SB: Social behaviours; ER: Emotional responses; IB Irrational behaviours.
153
Overall, similar yet subtly different content is presented across all three versions
deriving from the pilot version. The GBC-EGM-SV is calibrated for ease of use by
staff working in the Victorian gambling environment. It has fewer items than the
jurisdictionally broader GBC-EGM-S or research-focused GBC-EGM-R. The GBC-
EGM-S is calibrated for ease of use by staff as well, but has more items than the
Victorian-specific GBC-EGM-SV. This broader range of items can be reduced or
modified to represent the gambling environment within which staff work. The GBC-
EGM-R or research version maintains as separate the items that were merged in
the other two versions while integrating the item wording and sequencing
refinements from Stage Two. It is designed for circumstances in which ease of use
by staff is not the priority, and distinguishing between relatively similar customer
behaviours is a priority, such making a distinction between ‘gambling continuously’
and ‘gambling for long periods without a break’. The items are also most easily
comparable with the data presented in Delfabbro et al. (2007), this report, and
papers arising from this report.
3.2.7 Strategies for successful implementation
As well as contributing to the checklist revision process, staff made a series of
suggestions for successful implementation of the checklist into regular daily use within
EGM venues. The suggestions included staff training, staff mentoring, and high
visibility and accessibility.
Formal training
A number of staff suggested that the checklist be part of training to complement
existing mandated responsible service of alcohol and gaming training. This could be a
face-to-face session or a training video. Staff generally thought full training would be
154
most useful for people new to the industry, with more experienced staff explaining that
they were well aware of most problem behaviours and may simply need an occasional
refresher:
A1: “Well new staff, I think you should have like a thing that they attend, or a…”
A2: “Training.”
A1: “A training thing, or even a video.”
A1: “I reckon a video’s the way to go.”
(A1: Female, 51+ years old, 11 years EGM experience; A2: Venue manager,
31-50 years old, 20 years EGM experience)
Q : “ Would you have a suggestion as to how it might work?”
A: “How it might, well like I said if they do like—you know, like we have our
responsible gaming, responsible alcohol, if we had something like that, I think a
meeting of two hours once every—once every couple of years or something, I
think that would help than doing these.”
Q : “Yep, so…”
A: “Nobody wants to do these it’s…”
Q : “Training rather than…”
A: “Training them, yeah.” (Female, 51+ years old, 9 years EGM experience).
An important benefit of incorporating the checklist into pre-existing training is that it
would allow the trainer to incorporate appropriate context and sensitivity into problem
gambling identification:
A: To me it’s like you're almost assuming that most of the customers that come
in have a gambling problem, that’s how I read it when I picked this up. I
think if you give that to new people straight away they’re going to think
everyone’s a pack of losers in here, the customers. Maybe once they do a self-
exclusion course or gamblers anonymous then this could be something that
155
could be added on because they talk about behaviours and stuff like that in
those courses, maybe this could be an add-on after they do something like that.
(Female, 31-50 years old, 21 years EGM experience)
Staff mentoring
Another suggestion for training new staff in a more venue-integrated manner was to
incorporate the checklist behaviours into in-house mentoring. Experienced staff could
assist new staff to become aware of, and correctly identify, problem behaviours, and to
profile customer risk from the aggregation of their behaviours. This approach was seen
as more attractive than having to fill in the checklist as regular paperwork.
A: I wouldn’t just give them something like that, not paperwork. Nothing to sit
down like that with because I think it’s better to have someone out there
standing up in a casual thing and just doing a few little things, letting them
know the difference and when someone starts to get agro and all the different
signs… you need to do it face to face because that’s how they have to do it
out there, you know [observe and response to customers]. The paper bit
doesn’t – Yeah bring it to life, in real life. (Female, 51+ years old, 9 years
EGM experience).
Brevity and simplicity
Staff were asked to fill in the checklist and some basic demographic data whenever
they saw a behaviour they thought may suggest gambling problems. This was done to
encourage staff to think about all the behaviours on the checklist whenever they saw
someone displaying any problem indicators. We then probed staff on the usefulness of
each item in focus groups. As demonstrated in the previous quote, responses from
staff suggest that it would be inappropriate to expect staff to use the checklist in this
manner long-term unless it was carefully streamlined. If it is too onerous it is unlikely to
be used effectively.
156
A: I think no more than this one sheet and one sheet on the front because if
people have to read too much they don’t want to do it, they don’t bother and
they think “Oh no it’s another thing we have to fill out.”
(Female, 31-50 years old, 20 years EGM experience).
Staff are busy and have limited time to invest in performing additional procedures,
particularly if these are seen as beyond their role:
A: Some of them just come in here, just do their job, and just get out too.
I’m sorry, I don’t know if that’s giving you a bad [impression], some people
just come in and do their work. They don’t care. I think on paper people
don’t want to do it, even I find that frustrating, like when I was told to
observe these people, because it’s quite busy in there and we’re short-
staffed. (Female, 51+ years old, 9 years EGM experience).
One way of achieving a balance between maintaining staff awareness of indicators and
minimising the workload would be to require initial formalised training supplemented by
a program of staff mentoring with the checklist as a point of reference (rather than
requiring staff to fill in the checklist). For this type of system to be effective long-term
the checklist would need to be readily accessible and highly visible.
Visibility and Accessibility
Staff are more likely to recognise and recall specific indicators on a daily basis if they
are highly visible and constantly available for easy reference. However there needs to
be careful consideration about how and where to display the checklist. Having the
checklist displayed on a staff notice board, for example, would mean it was constantly
available but it may become gradually less visible given the stream of notices that
change over in that small space. A dedicated permanent display may be required:
Q: If this was going to be useful, how would we put this into a venue?

157
A1: We don’t have much room for that sort of thing.
A1:…Unless you laminate it and put it on the bench.
A2: Well that would be your only option. I mean, we sometimes have no
memo’s for a week and then have three in a week and I’ve just got to take them
to the bench behind cashiers, because we don’t have anywhere else.
Q: Would you make it smaller, would you put it behind the bar, would you put it
next to the EFTPOS or?
A: I think it’s something that should be displayed definitely because we don’t
have them on display. We were told about these things and we got our folders
and they’re put in a draw and then we go back to them once a week and about
half the time you forgot.
The colour coding introduced to this version of the checklist was appreciated by staff as
it provided a good visual guide and quick reference to the level of problem. However, a
reduction in the intensity of colours was recommended by staff to aid readability.
3.3 Discussion and Conclusions
Stage Two achieved its aim of performing a practical validation of the Gambling
Behaviour Checklist (GBC-EGM) under real conditions of use. Three Melbourne EGM
venues incorporated the checklist into current venue protocols used by staff to identify
and intervene with problem gamblers. After a three-month trial, eleven staff from the
three venues participated in focus groups to evaluate the practical utility of the checklist
and individual items as a tool for identifying potential problem gamblers.
Semi-structured focus group discussions provided valuable data on 1) the usefulness
of the checklist in the identification of problem gambling behaviours under real
conditions of use, 2) the relative value of each individual checklist item, 3) impediments

158
to using the checklist such as shift times, 4) outcomes of identification in terms of staff
follow-up actions, 5) potential improvements to the checklist, and 6) strategies for
successful implementation into venues. Incorporation of these data facilitated
development of a revised checklist, the GBC-EGM-S, which is ready for use by staff in
EGM venues.
3.3.1 Usefulness
Staff generally found the checklist clear, relevant and comprehensive in listing problem
behaviours they were familiar with. For experienced staff, the checklist facilitated quick
and easy identification of problem gamblers, reminding them at a glance of problem
behaviours. For less experienced staff, the checklist assisted in proactive identification
and increased the confidence of staff when managing interactions with customers who
may have problems. Use of the checklist was also linked to improved customer
observation and awareness of problem behaviours that were previously unknown to
staff. Adoption of the checklist may help industry to take a more proactive role in
responding to problem gamblers as is increasingly emphasised in policy and legislation
(Griffiths, 2009; Delfabbro, King & Borgas, 2011).
Use of the checklist introduced staff to some new behaviours they had either not
observed previously or had not considered to be indicators of problem gambling. Half
of these concerned behaviours which we both rare and almost certainly indicative of
problems. Four of these six behaviours also featured in the list of items that staff found
the most difficult to observe in Stage Two. In most cases these behaviours required
greater levels of attention to customers than was normal practice. Other, more common
behaviours, such as changing large notes or staying on to gamble after friends left the
venue, had not previously been thought of as problematic by some staff. Moreover,
some staff were resistant to label these items problem behaviours, in some instances
159
believing that problematizing the behaviour was a value judgement. These findings
emphasise the importance of integrating and contextualising these behaviours in staff
training on problem gambler identification.
3.3.2 Individual item analysis Each staff member made clear distinctions between behaviours on the checklist that
were easy or difficult to observe in their venues. Seventy per cent of behaviours were
considered easy to observe by almost all staff. The easiest behaviours to observe were
those relating to intensity and duration of gambling, such as gambling very frequently
or for long periods and spending more than $300 in a session. EFTPOS use was
especially easy to observe as well, as were expressions of rudeness or anger towards
other customers, and superstitious rituals.
In Schellnick and Schrans’ (2004) study, an examination of combinations of predictors
found that the most consistent indicators of problem gambling involved long gambling
sessions, continuous gambling, money seeking, displays of anger/disorderly conduct,
having trouble quitting, and playing two machines. Our findings extend on these,
revealing that most of these behaviours are also easily observed and frequently seen in
Victorian hotels, especially EFTPOS use. EFTPOS has been the only means to
withdraw cash within Victorian EGM venues since July 2012, and is most frequently
practiced by higher risk gamblers (Thomas, Pfeifer, Moore, Meyer, Yap & Armstrong,
2013). This suggests that appropriately trained staff should be able to identify
customers with problem gambling habits using the checklist as a reference point.
While most listed behaviours were easy to observe, ten were described as difficult to
observe by at least a third of staff. Not surprisingly, half of these concerned behaviours
which are rarely seen (Delfabbro et al. 2007; Stage One current study). Six of the eight
160
social behaviours were included in this grouping. Those which are not rare may still be
less obvious to staff without specific training (Cosic, 2012).
Reasons for observational difficulties extended beyond rarity. Some checklist items
required that staff pay more attention to customer behaviours than was normal. A few
behaviours were difficult for staff to interpret, such as whether a particular behaviour
was normal or problematic. Determining whether an increase in customer spending
was problematic, for example, with difficult if the staff member did not have a good
personal knowledge of the customer. This again highlights the need for good initial
training to enhance the usefulness of the checklist as a staff tool.
The visibility of checklist behaviours under real conditions of use demonstrated in this
study are consistent with the frequency of problem gambling behaviours recalled by
staff in Delfabbro et al.’s (2007) industry survey. Those behaviours that were easiest to
see in our study corresponded with those most frequently recalled in Delfabbro et al.
This correspondence is important, given that staff confidence in identifying problem
gamblers is typically low (Delfabbro et al. 2007). The combined findings show that most
staff are clearly able to observe the majority of behaviours that constitute problem
gambler identification. However, without aids such as the checklist, staff are liable to
underestimate the severity of gambling issues, or lack the confidence to pull their
observations together to be definitive in problem identification. This speaks to the value
of regular training and having the checklist on hand to confidently profile customers and
perform follow-up actions to ensure the safety of those exhibiting difficulties.
3.3.3 Practical difficulties with the checklist Staff raised a number of practical difficulties in their use of the checklist. Some items
were only observable by staff in particular locations of the venue. For instance, staff on

161
the gaming floor could more easily observe whether customers were betting more than
$3 a spin than those located at the service area. Other behaviours were observable by
staff on particular shifts but not others, such as whether customers struggled to stop
gambling at closing time. Busy periods also limited sustained observation of customers.
These difficulties were also raised in Delfabbro et al. (2007). These limitations could be
minimised if staff were able to share concerns about particular customers so that
multiple staff could contribute to identifying problems. The involvement of a senior staff
member who worked multiple shifts may assist.
These difficulties nevertheless pertained to a relatively small set of items. The findings
run contrary to the pessimism expressed by some researchers who thought that staff
would not be able to effectively utilise problem gambling indicators given the practical
constraints associated with working in venue environments (Allcock, 2002;
Blaszczynski, 2002; Ladouceur, 2002; Lesieur, 2002).
3.3.4 Outcomes of identification Staff followed up in multiple ways with 22 of 23 customers who were identified as
exhibiting multiple problem behaviours. Staff actions were most likely to follow
customer behaviours which had been designated as frequent high severity items (i.e.,
red flagged items). This supports the value of the severity classes assigned to items in
Stage One. The most common staff response was to initiate a general conversation
with the customer, engaging with the problem behaviours only when the customer
raised these. Continued observation of customers using the checklist was another
common response from staff. Managers or senior staff were approached for advice in
around a quarter of cases.

162
The preference for general chat and observation is consistent with current staff training
with recent training materials suggest pro-active approaches to possible problem
gambler be of a more subtle nature over direct customer confrontation. That said,
younger and less experienced staff felt unprepared to directly approach customers
exhibiting problem behaviours and were anxious about potential customer rudeness or
anger. This may explain in part why the participants in our study only recorded and
followed up with customers exhibiting quite a large number of problem behaviours
(usually around 10). Our findings correspond with research showing that staff do not
feel confident about how customers will respond if they are approached (Delfabbro et
al. 2007; Hing, Nisbet & Nuske, 2010). The findings are also consistent with research
showing that staff often need to observe many indicators before being confident that
they have identified a problem gambler (Schellick & Schrans, 2004; Delfabbro et al.
2012).
3.3.5 The GBC-EGM-S, SV and R: Revised checklists for EGM staff and researchers We discovered that, although there was value in the wide array of items presented,
particularly at the research level, almost half of the focus group participants preferred a
shorter checklist for practical use in a busy working environment. We further found that
some items were viewed as repetitious or redundant, while others were rarely seen,
difficult to observe or hard to interpret. We also learned of additional problem
behaviours that staff did not feel were adequately represented on the checklist. We
considered these findings in the context of the data collected in Stage One, and made
final refinements to the GBC-EGM in terms of recommendations as to the modification,
expansion and removal of existing items.
On the basis of our findings, we developed three versions of the checklist, one for staff
in Victoria, one for staff located in other Australian jurisdictions or internationally, and
one for researchers. Practical validation and refinement of the GBC-EGM for staff use

163
was the greater priority and focus, however we also saw the merit in moving a research
version forwards as well on the basis of the findings. The ‘GBC-EGM-SV’ was
calibrated for ease of use by staff working in the Victorian gambling environment. It has
fewer items than the jurisdictionally broader GBC-EGM-S or research-oriented GBC-
EGM-R. It draws most deeply on the findings of Stages One and Two. It serves as an
example of how the GBC-EGM-S can be modified to the jurisdiction-specific gambling
environments within which staff work.
The ‘GBC-EGM-S’ was designed for ease of use by staff as well, but has more items
than the Victoria-specific GBC-EGM-SV. This broader range of items can and should
be reduced or modified to represent the gambling environment within which staff will
use it.
The ‘GBC-EGM-R’ or research version maintains the items that were merged or
deleted in the two staff versions while benefiting from the item wording and sequencing
refinements from Stage Two. It was designed for circumstances where the priority is
making data comparisons with Delfabbro et al. (2007) and current report or papers
arising, or where observational data on a greater range of visible customer behaviours
is a priority.
3.3.6 Successful implementation With respect to practical implementation of the checklist in venues, we emphasise the
value of integrating formal training in the need for, and use of, the checklist. This is
particularly important for new staff and should be supplemented by ongoing informal
training with senior staff acting as mentors to the newer staff. As discussed above
training would ensure staff understand that the checklist is there as a tool to assist
them and that identification and intervention is part of their normal work practices. It will
164
also ensure staff are aware of rare indicators in addition to more common indicators of
harm, and of the importance of considering any single behaviour in the context of
overall patron behaviour. Finally, the findings suggested that staff are often reluctant to
take any action until they are very confident there is a problem. Training could improve
early intervention by emphasising the importance of having regular, informal
interactions with customers at the first indication of any gambling issues. While this
method is less direct in terms of intervention, it will be more palatable for both staff and
patrons and so compliance is more likely, particularly where the presence of problems
is not clear-cut. This method will increase the chances that staff notice escalations in
behaviour and are able to instigate more direct reference to issues when the customer
appears ready.
In addition to training, it is vital that the checklist is highly visible and easily accessible
to staff. For example putting it on permanent display in multiple locations frequented by
staff within the venue.
3.3.7 Limitations and future research One of the goals of Stage Two was to compare staff who had been formally trained in
use of the checklist with those who had not, in terms of ease and frequency of
behaviour observation, item interpretation, follow-up actions and so forth. However,
due to high staff turnover at the venues, particularly amongst newer workers who were
more likely to have received the formal training, it was not possible to conduct these
comparisons. Only one staff member who received the formal training volunteered to
participate in a focus group. This is an important consideration because training may
have alleviated a number of the item difficulties reported by staff. Thus, the results of
Stage Two primarily derive from the experiences of staff that were introduced to the
checklist by their managers (with the support of written instructions), the face validity of

165
the items as they stood, and the clarity of the instructions provided with the checklist.
The absence of formal training may, in part, account for the fact that direct action only
occurred where staff had identified a large number of indicators despite written
instructions suggesting staff commence observations and interactions after 4-5
potentially problematic behaviours had been observed. The absence of formal training
may also account for some staff’s perception of the checklist as a chore to be
performed. It is important for future research to test the usefulness and clarity of the
checklist with trained and untrained staff to determine how important it is for the
checklist to be introduced within the broader context of formal face-to-face training.
A further set of limitations concerns the sample representativeness on the revisions
and recommendations made. The sample size of eleven hotel workers was adequate
to qualitatively explore the practical validity of the checklist for use in EGM venues
(Nixon & Wild, 2008) which was the aim of the present study. However, the visibility
and frequency with which particular checklist behaviours are seen may differ across
venue type or locality. For instance, friends or relatives of customers might contact
casinos or regional clubs more often than suburban hotels, with the added
consequence that customers might be more likely to ask staff in those venues to
conceal their presence. Bragging about winnings might also be seen at casino gaming
tables, whereas it was only observed once in 216 observations made by our hotel staff.
Impediments to identification may differ between venue type as well. For instance,
items which require sustained customer observation, such as witnessing a significant
increase in spending pattern over a number of days, might be more visible to staff at
social clubs. Customers might also be observed attempting to borrow money in a small
or social club environment. Future research may reveal that the relevance of certain
behaviours varies between venue types and localities and lead to further checklist
refinements.
166
The eleven volunteers for our Stage Two sample comprised women and mostly
experienced staff. Male staff and less experienced staff may have different experiences
in terms of visibility and frequency of particular checklist behaviours as well as
impediments to checklist use. For instance, rudeness might be more commonly
experienced by younger female staff than older male staff when dealing with male
customers. Customers might be less inclined to disclose problem gambling distress to
less experienced and less well-known staff. Incorporation of feedback from broader
staff samples would enrich and extend on the current findings relating to these issues.
Conclusions
In Stage One, a national sample was used to validate a set of problem gambling
behaviour indicators (from the Checklist of Visible Indicators) developed in 2007 by
Delfabbro et al. to identify people who are experiencing problems with gambling (in
particular, electronic gaming machines). The results generally confirmed the types of
behaviour and indicators identified in the previous study and extended the analysis to
include comparisons of people with different levels of gambling-risk based on the PGSI.
The report documents the prevalence of these indicators in different gambler risk
groups and the extent to which they were able to discriminate between them. Based on
these detailed analyses, we developed the Gambling Behaviour Checklist (the GBC-
EGM) to assist staff in EGM venues to identify and assist at-risk customers.
In Stage Two the GBC-EGM was piloted by staff in three Melbourne hotels to assess
the practical validity of the checklist under real conditions of use. Our findings
demonstrated that venue staff were able to observe and consolidate information about
customer gambling behaviour using the GBC-EGM in a typical EGM venue
167
environment with existing levels of training13. Based on the feedback from venue staff,
we further refined the checklist into the GBC-EGM-S its usability and relevance to
venue operational environments. These changes included the removal of redundant
items, greater exemplification of rarer and more difficult to observe behaviours and a
greater emphasis on items that are most likely to be observed in the venue and
therefore of greatest practical value to staff. This revised version is recommended for
future staff use.
Finally, the study provides greater detail concerning the ways in which the checklist
should be used. For example, it can be used as a powerful tool in staff training to
educate on the range of indicators and the need to look for additional indicators when
observing any sign of gambling issues. Staff are encouraged to be more proactively
engaged with customers using when they are confident that multiple strong problem
gambling indicators are present. Use of the checklist appeared to increase staff
confidence in identification and thus in the likelihood they engaged with customers who
are at-risk.
In sum, we believe the evaluation has provided a valuable evidence base to support
the translation of problem gambling theory into staff practice under typical working
conditions in EGM venues. Early identification of key problem gambling behaviours
using the checklist can facilitate confident proactive interaction with customers before
they ask for help. Early intervention can reduce the severity of problem gambling
behaviour and outcomes in both the short and long term. In some jurisdictions, this tool
will assist the industry to comply with legislative requirements relating to identification
of problem gamblers. In all jurisdictions (as well as internationally) this tool may assist
13 It should be noted that staff in Victorian EGM venues currently receive training from venue support workers in identifying gamblers in venues and ways to approach possible problem gamblers. Therefore, staff in other States and Territories may require similar training to effectively use this tool.

168
in providing a focal point for responsible gambling training and could also be used in
conjunction with technology-based systems designed to track the objective behaviour
of gamblers in venues.
169
REFERENCES Allcock, C. (2002). “Overview of discussion papers” In C. Allcock (Ed.). Current issues
related to identifying the problem gambler in the gambling venue. Melbourne,
Australian Gaming Council.
Auer, M. & Griffiths, M.D. (2011, October). Limit setting and player choice in online
gamblers: An empirical study of real time gambling behavior. Paper presented at the
12th Annual NCRG Conference on Gambling and Addiction, Las Vegas, USA.
Austin, M. (2007). Responsible gaming: The proactive approach: Integrating
responsible gaming into casino environments. Saskatchewan: iView Systems.
Australian Gaming Council (2001). Responsible gaming code: A framework for
responsible gaming. Melbourne, Victoria.
Ben-Tovim, D., Esterman, A., Tolchard, B., & Battersby, M. (2001). The Victorian
Gambling Screen. Melbourne, Victoria: Gambling Research Panel.
Blaszczynski, A. (2002). “Problem gambling behaviours: what can be observed in
venues and how should staff respond?” In C.Allcock (Ed.). Current issues related to
identifying the problem gambler in the gambling venue. Melbourne, Australian Gaming
Council.
Blaszczynski, A. & Nower, L. (2002). A pathways model of problem and pathological
gambling. Addiction, 97, 487- 499.
Braverman, J., & Shaffer, H. (2010). How do gamblers start gambling: identifying
behavioural markers for high-risk internet gambling. European Journal of Public Health:
Advance Access.
170
Braun, V. and Clarke, V. (2006). Using thematic analysis in psychology. Qualitative
Research in Psychology, 3: 77-101.
Breen, H., Bultjens, J., & Hing, N. (2003). The perceived efficacy of responsible
gambling strategies in Queensland hotels, casinos and licensed clubs. Brisbane
Research and Community Engagement Division of Queensland Treasury.
Brown, R.I.F. (1988). Models of gambling and gambling addictions as perceptual filters.
Journal of Gambling Behavior, 3, 224-236.
Brown, R. (2000). The harm minimisation strategy: A proposed national responsible
gambling policy for New Zealand. Auckland: Problem Gambling Committee of New
Zealand.
Brown, R.L., Leonard, T., Saunders, L.A., & Papasouliotis, O. (2001). A Two-Item
Conjoint Screen for Alcohol and Other Drug Problems. Journal of the American Board
of Family Practitioners, 14, 95–106.
Brown, R., & Raeburn, J. (2001). Gambling, harm and health: Two perspectives on
ways to minimise harm with regard to gambling in New Zealand. Auckland: Problem
Gambling Committee of New Zealand.
Corbin, J., & Strauss, A. (2008). Basics of qualitative research techniques and
procedures for developing grounded theory (3rd ed.). California: SAGE Publications.
Cosic, S. (2012). Observable signs of problem gambling – In-venue training and
validation – Update. Paper presented at the 22nd annual conference of the National
Association for Gambling Studies, Launceston, Tasmania.
Davies, B. (2007). iCare: Integrating responsible gaming into casino operation.
International Journal of Mental Health and Addiction, 5, 307-310.

171
Delfabbro, P.H., Borgas, M., & King, D. (2011). Venue staff knowledge of their
customers’ gambling and problem gambling. Journal of Gambling Studies, 27, 1-15.
Delfabbro, P.H., Osborn, A., McMillen, J., Neville, M., & Skelt, L. (2007). The
identification of problem gamblers within gaming venues: Final report. Melbourne,
Victorian Department of Justice.
Delfabbro, P.H., King, D., & Griffiths, M. (2012, in press). Behavioural profiling of
problem gamblers: A summary and review. International Gambling Studies.
Delfabbro P. H., & Winefield A. H. (2000) Predictors of irrational thinking in regular slot
machine gamblers. The Journal of Psychology, 134, 117-128.
DeVellis, R.F. (2003). Scale development theory and applications (2nd ed.). California:
SAGE Publications.
Ferris, J. & Wynne, H. (2001). The Canadian Problem Gambling Index Final Report.
Phase II final report to the Canadian Interprovincial Task Force on Problem Gambling.
Fisher, S. (1993). The pull of the fruit machine: a sociological typology of young
players. Sociological Review, 41, 446–474.
Focal Research (2007). Assessment of the behavioural impact of Responsible Gaming
Device Features (RGD): Analysis of Nova Scotia player-card data. Halifax, Nova cotia.
Gainsbury, S. (2011). Player account-based gambling: potentials for behaviour-based
research methodologies. International Gambling Studies, 11, 153-172.
Griffiths, M.D. (1991). The observational study of adolescent gambling in UK
amusement arcades. Journal of Community and Applied Social Psychology, 1, 309-
320.

172
Griffiths, M.D. (2003). Internet gambling: Issues, concerns and recommendations.
CyberPsychology and Behavior, 6, 557-568.
Griffiths, M.D. (2004). Betting your life on it: Problem gambling has clear health related
consequences. British Medical Journal, 329, 1055-1056.
Griffiths, M.D. (2009). Social responsibility in gambling: The implications of real-time
behavioural tracking. Casino and Gaming International, 5(3), 99-104.
Griffiths, M.D. (2010). Developing a World Leading ‘Best in Class’ Online Gaming
Social Responsibility Policy. Report prepared for the Atlantic Lottery Corporation
(Canada).
Griffiths, M.D. (2011). A typology of UK slot machine gamblers: A longitudinal
observational and interview study. International Journal of Mental Health and Addiction,
DOI 10.1007/s11469-010-9291-4.
Griffiths, M.D. & Auer, M. (2011). Approaches to understanding online versus offline
gaming impacts. Casino and Gaming International, 7(3), 45-48.
Griffiths, M.D., & Parke, J. (2002). The social impact of internet gambling. Social
Science Computer Review, 20, 312-320.
Griffiths, M.D. & Whitty, M.W. (2010). Online behavioural tracking in internet gambling
research: Ethical and methodological issues. International Journal of Internet Research
Ethics, 3, 104-117.
Griffiths, M.D. & Wood, R.T.A. (2008). Gambling loyalty schemes: Treading a fine line?
Casino and Gaming International, 4(2), 105-108.
173
Griffiths, M.D., Wood, R.T.A., & Parke, J. (2009). Social responsibility tools in online
gambling: A survey of attitudes and behaviour among internet gamblers.
CyberPsychology and Behavior, 12, 413-421.
Griffiths, M.D., Wood, R.T.A., Parke, J., & Parke, A. (2007). Gaming research and best
practice: Gaming industry, social responsibility and academia. Casino and Gaming
International, 3(3), 97-103.
Hafeli, J. & Schneider, C. (2006). The early detection of problem gamblers in casinos:
A new screening instrument. Paper presented at the Asian Pacific Gambling
Conference, Hong Kong.
Hancock, L. (2011). Regulatory failure? The case of Crown Casino. Melbourne:
Australian Scholarly Publishing.
Hancock, L., Schellinck, T., & Schrans, T. (2008). Gambling and social responsibility
(CSR): Re-defining industry and state roles on duty of care, host responsibility and risk
management. Journal of Policy and Society, 27, 55-68.
Hing, N. (2004). The efficacy of responsible gambling measures in NSW clubs: The
gambler’s perspective. Gambling Research, 16, 32-46.
Hing, N., & Dickerson, M. (2002). Responsible gambling: Australian voluntary and
mandatory approaches. Canberra: Australian Gambling Council.
IPART (2004). Gambling: Promoting a culture of responsibility, Sydney, New South
Wales.
Keith, T.Z. (2006). Multiple regression and beyond. New York: Pearson.
Korn, D., & Shaffer, H. (1999). Gambling and the health of the public: Adopting a public
health perspective. Journal of Gambling Studies, 15, 289-365.

174
Kruschke, J.K., (2010). What to believe: Bayesian methods for data analysis. Trends in
Cognitive Science, 14(7), p293-300.
LaBrie, R.A., Shaffer, H.J. (2011). Identifying behavioural markers of disordered
internet sports gambling. Addiction Research and Theory, 19, 56-65.
Ladouceur, R. (2002). Problem gambling behaviours: what can be demonstrated in the
venue and how should staff respond?” In C.Allcock (Ed.). Current issues related to
identifying the problem gambler in the gambling venue. Melbourne, Australian Gaming
Council.
Lesieur, H.R. (2002). “Customer behaviour on the casino floor”. In C.Allcock (Ed.).
Current issues related to identifying the problem gambler in the gambling venue.
Melbourne, Australian Gaming Council.
McMillen, J. & Toms, M. (1997). Report of the Responsible Gambling Trial Program for
NSW Clubs. Australian Institute for Gambling Research, UWS.
McMillen, J. & Pitt, S. (2005). Review of the ACT Government’s Harm Minimisation
Measures. Funded by the ACT Gambling and Racing Commission.
Moran, E. (1970). Varieties of pathological gambling. British Journal of Psychiatry, 116,
593-597.
Murphy, K.R., & Davidshofer, C.O. (2001). Psychological testing principles and
applications (5th ed.). New Jersey: Prentice Hall.
Neal, P., Delfabbro, P.H., & O’Neil, M. (2005). Problem gambling and harm: Towards a
national definition. Report Commissioned by Gambling Research Australia for the
Ministerial Council on Problem Gambling. Melbourne, Victorian Department of Justice.

175
Nixon A, & Wild D. (2008) Methodologies for assessing and demonstrating data
saturation in qualitative inquiry supporting patient-reported outcomes research. ISPOR
11th Annual European Congress.
Parke, J., Rigbye, J., & Parke, A. (2008). Cashless and card-based technologies in
gambling: A review of the literature. Report prepared for the Australasian Gaming
Council.
Productivity Commission (2010). Gambling. Canberra: Productivity Commission
Schellinck, T. & Schrans, T. (2011). “Advances in the use of machine data to identify
high risk and problem gamblers: Making it work for casinos worldwide”. Paper
presented at the 21st Annual Conference of the National Association for Gambling
Studies, Melbourne, Australia.
Schellinck, T., & Schrans, T. (2004). Identifying problem gamblers at the gambling
venue: Finding combinations of high confidence indicators. Gambling Research, 16, 8-
24.
Schottler Consulting (2010). Major findings and implications: Player tracking and pre-
commitment trial. Adelaide, S.A. Treasury.
Thomas, A., Pfeifer, J., Moore, S., Meyer, D., Yap, L., & Armstrong, A. (2013).
Evaluation of the removal of ATMs from gaming venues in Victoria, Australia. Report
prepared for the Department of Justice Victoria.
Victorian Commission for Gambling Regulation (2011). VGRC News. The newsletter of
the Victorian Commission for Gambling Regulation. Summer.
Walker, M.B. (1992b). Irrational thinking among slot machine players. Journal of
Gambling Studies, 8, 245-288.
176
Walker, M.B. & Blaszczynski, A. (2010). Clinical assessment of problem gamblers
identified using the Canadian Problem Gambling Index. Adelaide: Independent
Gambling Authority of South Australia.
Wardle, H., Moody, A., Griffiths, M.D., Orford, J., & Volberg, R. (2011). Defining the
online gambler and patterns of behaviour integration: Evidence from the British
Gambling Prevalence Survey 2010. International Gambling Studies, 11, 339-356.
Wardle, H., Moody. A., Spence, S., Orford, J., Volberg, R., Jotangia, D., Griffiths, M.D.,
Hussey, D. & Dobbie, F. (2011). British Gambling Prevalence Survey 2010. London:
The Stationery Office.
Wardle, H., Sproston, K., Orford, J., Erens, B., Griffiths, M.D., Constantine, R. & Pigott,
S. (2007). The British Gambling Prevalence Survey 2007. London: The Stationery
Office.
Williams, R., & Volberg, R. (2010). Best practices in the population assessment of
problem gambling. Guelph, Ontario: Ontario Problem Gambling Research Centre.
Xuan, Z., & Shaffer, H. (2009). How do gamblers end gambling: Longitudinal analysis
of internet gambling behaviours prior to account closure due to gambling related
problems. Journal of Gambling Studies, 25, 239-252.
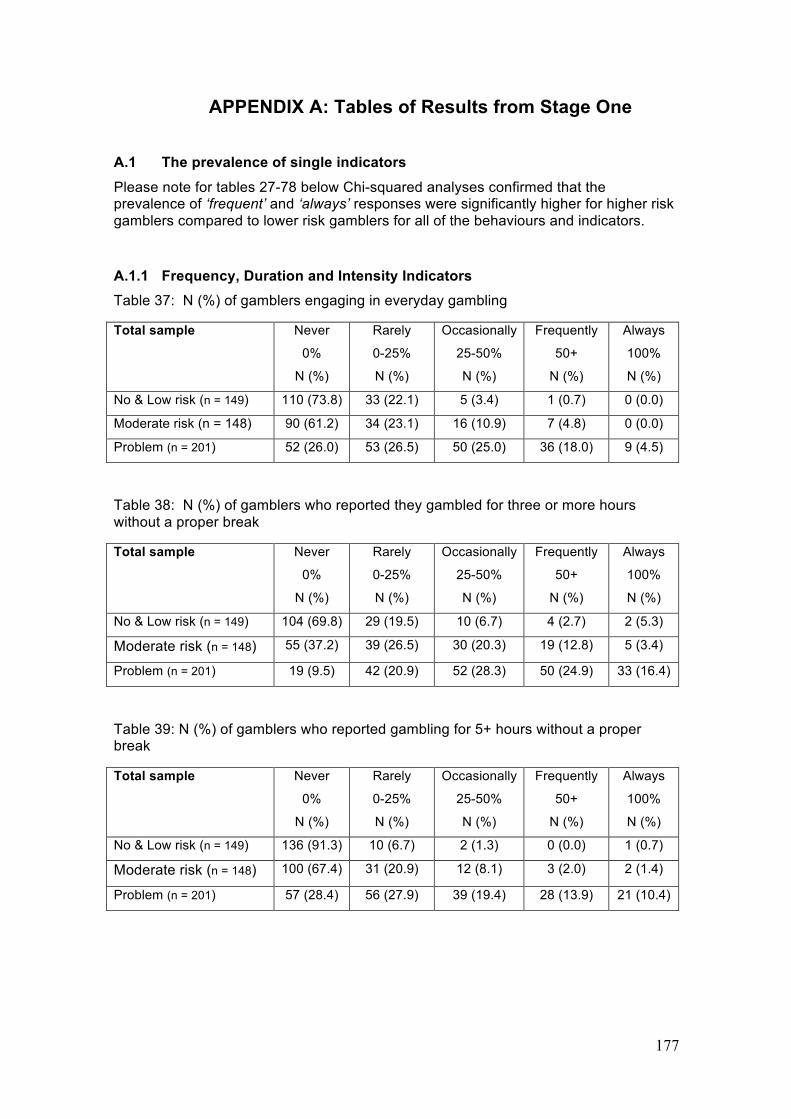
177
APPENDIX A: Tables of Results from Stage One
A.1 The prevalence of single indicators Please note for tables 27-78 below Chi-squared analyses confirmed that the prevalence of ‘frequent’ and ‘always’ responses were significantly higher for higher risk gamblers compared to lower risk gamblers for all of the behaviours and indicators.
A.1.1 Frequency, Duration and Intensity Indicators Table 37: N (%) of gamblers engaging in everyday gambling
Total sample Never
0%
N (%)
Rarely
0-25%
N (%)
Occasionally
25-50%
N (%)
Frequently
50+
N (%)
Always
100%
N (%)
No & Low risk (n = 149) 110 (73.8) 33 (22.1) 5 (3.4) 1 (0.7) 0 (0.0)
Moderate risk (n = 148) 90 (61.2) 34 (23.1) 16 (10.9) 7 (4.8) 0 (0.0)
Problem (n = 201) 52 (26.0) 53 (26.5) 50 (25.0) 36 (18.0) 9 (4.5)
Table 38: N (%) of gamblers who reported they gambled for three or more hours without a proper break
Total sample Never
0%
N (%)
Rarely
0-25%
N (%)
Occasionally
25-50%
N (%)
Frequently
50+
N (%)
Always
100%
N (%)
No & Low risk (n = 149) 104 (69.8) 29 (19.5) 10 (6.7) 4 (2.7) 2 (5.3)
Moderate risk (n = 148) 55 (37.2) 39 (26.5) 30 (20.3) 19 (12.8) 5 (3.4)
Problem (n = 201) 19 (9.5) 42 (20.9) 52 (28.3) 50 (24.9) 33 (16.4)
Table 39: N (%) of gamblers who reported gambling for 5+ hours without a proper break
Total sample Never
0%
N (%)
Rarely
0-25%
N (%)
Occasionally
25-50%
N (%)
Frequently
50+
N (%)
Always
100%
N (%)
No & Low risk (n = 149) 136 (91.3) 10 (6.7) 2 (1.3) 0 (0.0) 1 (0.7)
Moderate risk (n = 148) 100 (67.4) 31 (20.9) 12 (8.1) 3 (2.0) 2 (1.4)
Problem (n = 201) 57 (28.4) 56 (27.9) 39 (19.4) 28 (13.9) 21 (10.4)

178
Table 40: N (%) of gamblers who reported gambling so intensely that they lost track of things going on around them
Total sample Never
0%
N (%)
Rarely
0-25%
N (%)
Occasionally
25-50%
N (%)
Frequently
50+
N (%)
Always
100%
N (%)
No & Low risk (n = 149) 132 (88.6) 13 (8.7) 3 (2) 1 (0.7) 0 (0.0)
Moderate risk (n = 148) 90 (61.2) 36 (24.5) 14 (9.5) 6 (4.1) 1 (0.7)
Problem (n = 201) 37 (18.4) 47 (23.4) 41 (20.4) 44 (21.9) 31 (15.9)
Table 41: N (%) of gamblers who reported gambling very fast
Total sample Never
0%
N (%)
Rarely
0-25%
N (%)
Occasionally
25-50%
N (%)
Frequently
50+
N (%)
Always
100%
N (%)
No & Low risk (n = 149) 108 (72.5) 27 (18.1) 8 (5.4) 15 (3.4) 1 (0.7)
Moderate risk (n = 148) 62 (41.9) 37 (25.0) 34 (23.0) 14 (9.5) 1 (0.7)
Problem (n = 201)
Table 42: N (%) of gamblers who reported betting $2.50+ per spin most of the time
Total sample Never
0%
N (%)
Rarely
0-25%
N (%)
Occasionally
25-50%
N (%)
Frequently
50+
N (%)
Always
100%
N (%)
No & Low risk (n = 149) 88 (59.1) 42 (28.2) 13 (8.7) 6 (4.0) 0 (0.0)
Moderate risk (n = 148) 72 (48.6) 43 (29.1) 18 (12.2) 12 (8.1) 3 (2.0)
Problem (n = 201) 23 (11.5) 47 (23.5) 54 (27.0) 46 (23.0) 30 (15.0)
Table 43: N (%) of gamblers who reported playing on without stopping to listen to jingle
Total sample Never
0%
N (%)
Rarely
0-25%
N (%)
Occasionally
25-50%
N (%)
Frequently
50+
N (%)
Always
100%
N (%)
No & Low risk (n = 149) 74 (49.7) 38 (25.5) 21 (14.1) 12 (8.1) 4 (2.7)
Moderate risk (n = 148) 34 (23.0) 36 (24.3) 49 (33.1) 21 (14.2) 8 (5.4)
Problem (n = 201) 18 (9.0) 26 (12.9) 43 (21.4) 50 (24.9) 64 (31.8)
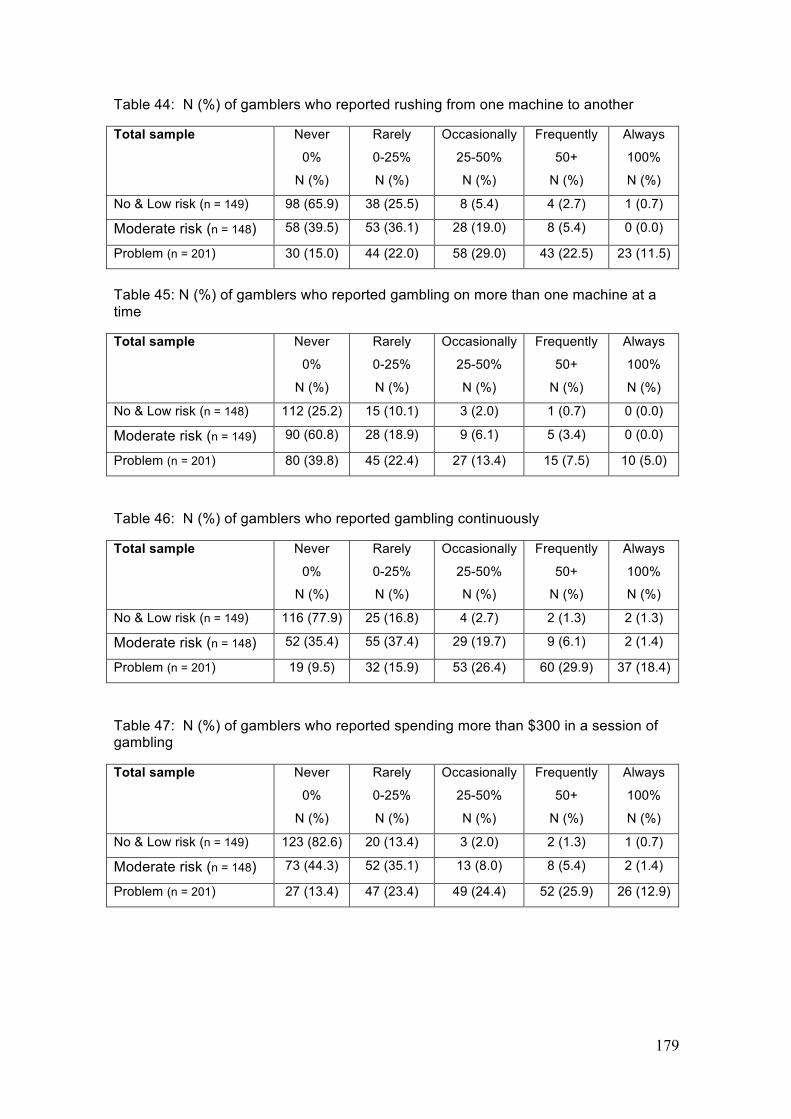
179
Table 44: N (%) of gamblers who reported rushing from one machine to another
Total sample Never
0%
N (%)
Rarely
0-25%
N (%)
Occasionally
25-50%
N (%)
Frequently
50+
N (%)
Always
100%
N (%)
No & Low risk (n = 149) 98 (65.9) 38 (25.5) 8 (5.4) 4 (2.7) 1 (0.7)
Moderate risk (n = 148) 58 (39.5) 53 (36.1) 28 (19.0) 8 (5.4) 0 (0.0)
Problem (n = 201) 30 (15.0) 44 (22.0) 58 (29.0) 43 (22.5) 23 (11.5)
Table 45: N (%) of gamblers who reported gambling on more than one machine at a time
Total sample Never
0%
N (%)
Rarely
0-25%
N (%)
Occasionally
25-50%
N (%)
Frequently
50+
N (%)
Always
100%
N (%)
No & Low risk (n = 148) 112 (25.2) 15 (10.1) 3 (2.0) 1 (0.7) 0 (0.0)
Moderate risk (n = 149) 90 (60.8) 28 (18.9) 9 (6.1) 5 (3.4) 0 (0.0)
Problem (n = 201) 80 (39.8) 45 (22.4) 27 (13.4) 15 (7.5) 10 (5.0)
Table 46: N (%) of gamblers who reported gambling continuously
Total sample Never
0%
N (%)
Rarely
0-25%
N (%)
Occasionally
25-50%
N (%)
Frequently
50+
N (%)
Always
100%
N (%)
No & Low risk (n = 149) 116 (77.9) 25 (16.8) 4 (2.7) 2 (1.3) 2 (1.3)
Moderate risk (n = 148) 52 (35.4) 55 (37.4) 29 (19.7) 9 (6.1) 2 (1.4)
Problem (n = 201) 19 (9.5) 32 (15.9) 53 (26.4) 60 (29.9) 37 (18.4)
Table 47: N (%) of gamblers who reported spending more than $300 in a session of gambling
Total sample Never
0%
N (%)
Rarely
0-25%
N (%)
Occasionally
25-50%
N (%)
Frequently
50+
N (%)
Always
100%
N (%)
No & Low risk (n = 149) 123 (82.6) 20 (13.4) 3 (2.0) 2 (1.3) 1 (0.7)
Moderate risk (n = 148) 73 (44.3) 52 (35.1) 13 (8.0) 8 (5.4) 2 (1.4)
Problem (n = 201) 27 (13.4) 47 (23.4) 49 (24.4) 52 (25.9) 26 (12.9)
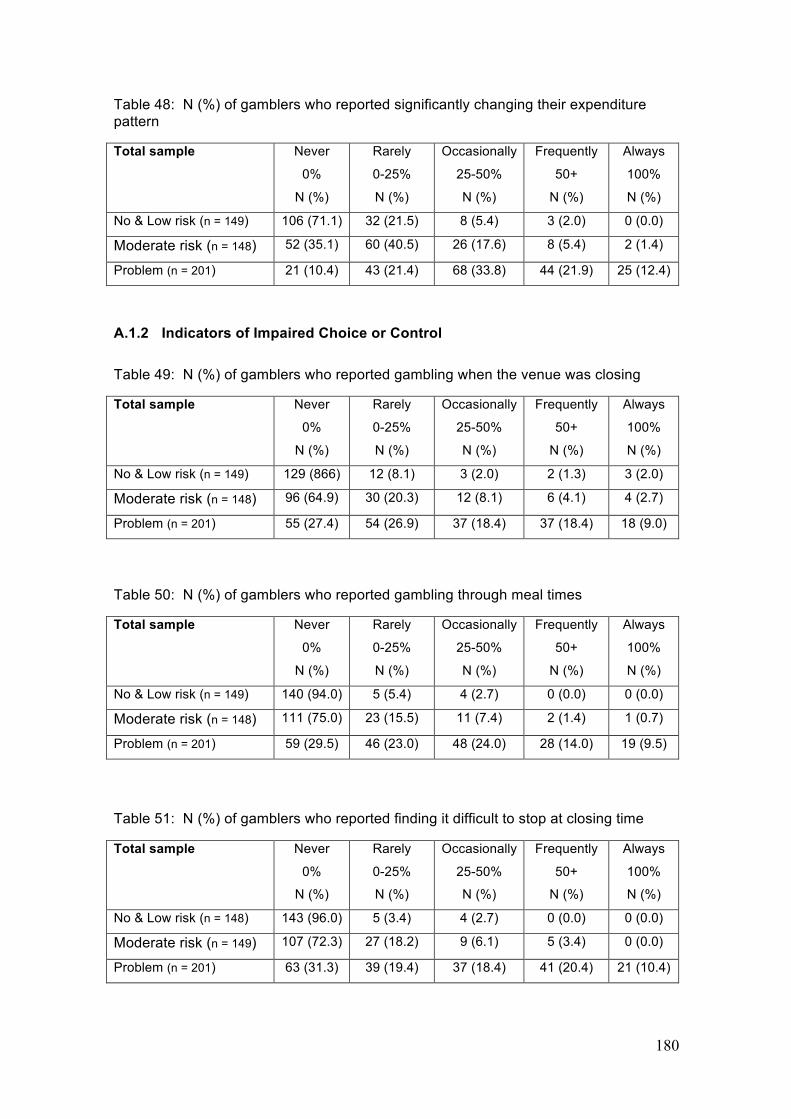
180
Table 48: N (%) of gamblers who reported significantly changing their expenditure pattern
Total sample Never
0%
N (%)
Rarely
0-25%
N (%)
Occasionally
25-50%
N (%)
Frequently
50+
N (%)
Always
100%
N (%)
No & Low risk (n = 149) 106 (71.1) 32 (21.5) 8 (5.4) 3 (2.0) 0 (0.0)
Moderate risk (n = 148) 52 (35.1) 60 (40.5) 26 (17.6) 8 (5.4) 2 (1.4)
Problem (n = 201) 21 (10.4) 43 (21.4) 68 (33.8) 44 (21.9) 25 (12.4)
A.1.2 Indicators of Impaired Choice or Control Table 49: N (%) of gamblers who reported gambling when the venue was closing
Total sample Never
0%
N (%)
Rarely
0-25%
N (%)
Occasionally
25-50%
N (%)
Frequently
50+
N (%)
Always
100%
N (%)
No & Low risk (n = 149) 129 (866) 12 (8.1) 3 (2.0) 2 (1.3) 3 (2.0)
Moderate risk (n = 148) 96 (64.9) 30 (20.3) 12 (8.1) 6 (4.1) 4 (2.7)
Problem (n = 201) 55 (27.4) 54 (26.9) 37 (18.4) 37 (18.4) 18 (9.0)
Table 50: N (%) of gamblers who reported gambling through meal times
Total sample Never
0%
N (%)
Rarely
0-25%
N (%)
Occasionally
25-50%
N (%)
Frequently
50+
N (%)
Always
100%
N (%)
No & Low risk (n = 149) 140 (94.0) 5 (5.4) 4 (2.7) 0 (0.0) 0 (0.0)
Moderate risk (n = 148) 111 (75.0) 23 (15.5) 11 (7.4) 2 (1.4) 1 (0.7)
Problem (n = 201) 59 (29.5) 46 (23.0) 48 (24.0) 28 (14.0) 19 (9.5)
Table 51: N (%) of gamblers who reported finding it difficult to stop at closing time
Total sample Never
0%
N (%)
Rarely
0-25%
N (%)
Occasionally
25-50%
N (%)
Frequently
50+
N (%)
Always
100%
N (%)
No & Low risk (n = 148) 143 (96.0) 5 (3.4) 4 (2.7) 0 (0.0) 0 (0.0)
Moderate risk (n = 149) 107 (72.3) 27 (18.2) 9 (6.1) 5 (3.4) 0 (0.0)
Problem (n = 201) 63 (31.3) 39 (19.4) 37 (18.4) 41 (20.4) 21 (10.4)
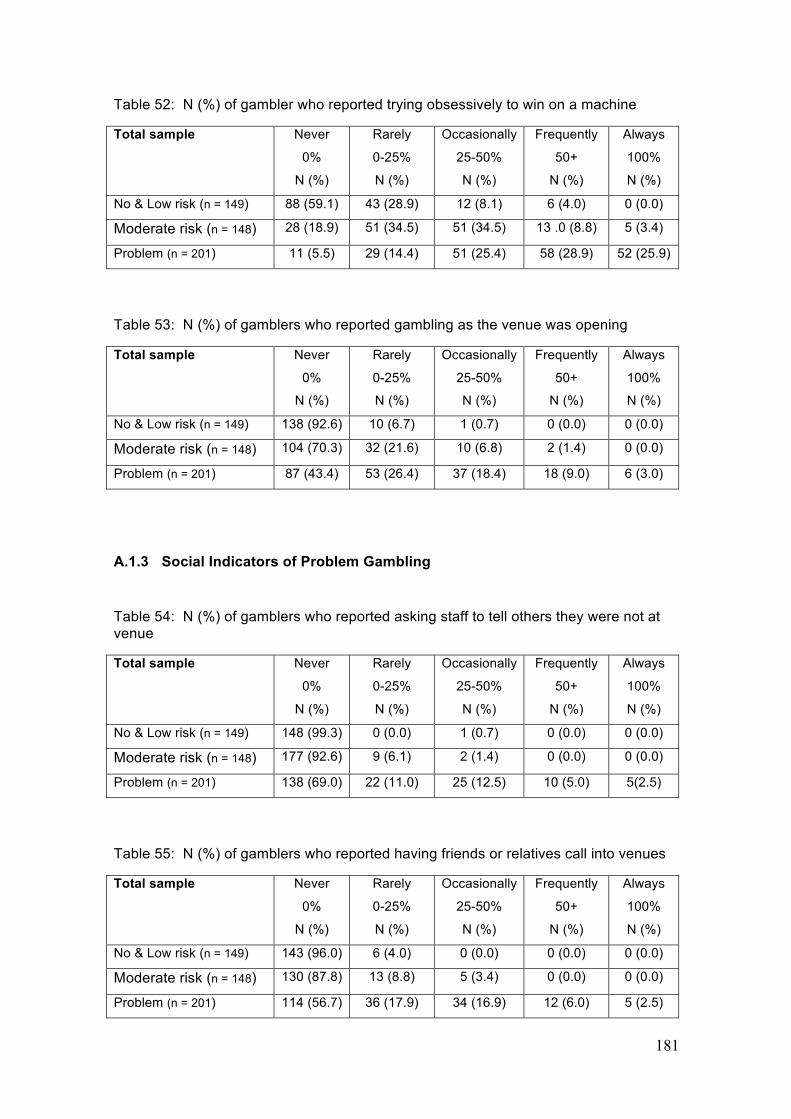
181
Table 52: N (%) of gambler who reported trying obsessively to win on a machine
Total sample Never
0%
N (%)
Rarely
0-25%
N (%)
Occasionally
25-50%
N (%)
Frequently
50+
N (%)
Always
100%
N (%)
No & Low risk (n = 149) 88 (59.1) 43 (28.9) 12 (8.1) 6 (4.0) 0 (0.0)
Moderate risk (n = 148) 28 (18.9) 51 (34.5) 51 (34.5) 13 .0 (8.8) 5 (3.4)
Problem (n = 201) 11 (5.5) 29 (14.4) 51 (25.4) 58 (28.9) 52 (25.9)
Table 53: N (%) of gamblers who reported gambling as the venue was opening
Total sample Never
0%
N (%)
Rarely
0-25%
N (%)
Occasionally
25-50%
N (%)
Frequently
50+
N (%)
Always
100%
N (%)
No & Low risk (n = 149) 138 (92.6) 10 (6.7) 1 (0.7) 0 (0.0) 0 (0.0)
Moderate risk (n = 148) 104 (70.3) 32 (21.6) 10 (6.8) 2 (1.4) 0 (0.0)
Problem (n = 201) 87 (43.4) 53 (26.4) 37 (18.4) 18 (9.0) 6 (3.0)
A.1.3 Social Indicators of Problem Gambling
Table 54: N (%) of gamblers who reported asking staff to tell others they were not at venue
Total sample Never
0%
N (%)
Rarely
0-25%
N (%)
Occasionally
25-50%
N (%)
Frequently
50+
N (%)
Always
100%
N (%)
No & Low risk (n = 149) 148 (99.3) 0 (0.0) 1 (0.7) 0 (0.0) 0 (0.0)
Moderate risk (n = 148) 177 (92.6) 9 (6.1) 2 (1.4) 0 (0.0) 0 (0.0)
Problem (n = 201) 138 (69.0) 22 (11.0) 25 (12.5) 10 (5.0) 5(2.5)
Table 55: N (%) of gamblers who reported having friends or relatives call into venues
Total sample Never
0%
N (%)
Rarely
0-25%
N (%)
Occasionally
25-50%
N (%)
Frequently
50+
N (%)
Always
100%
N (%)
No & Low risk (n = 149) 143 (96.0) 6 (4.0) 0 (0.0) 0 (0.0) 0 (0.0)
Moderate risk (n = 148) 130 (87.8) 13 (8.8) 5 (3.4) 0 (0.0) 0 (0.0)
Problem (n = 201) 114 (56.7) 36 (17.9) 34 (16.9) 12 (6.0) 5 (2.5)
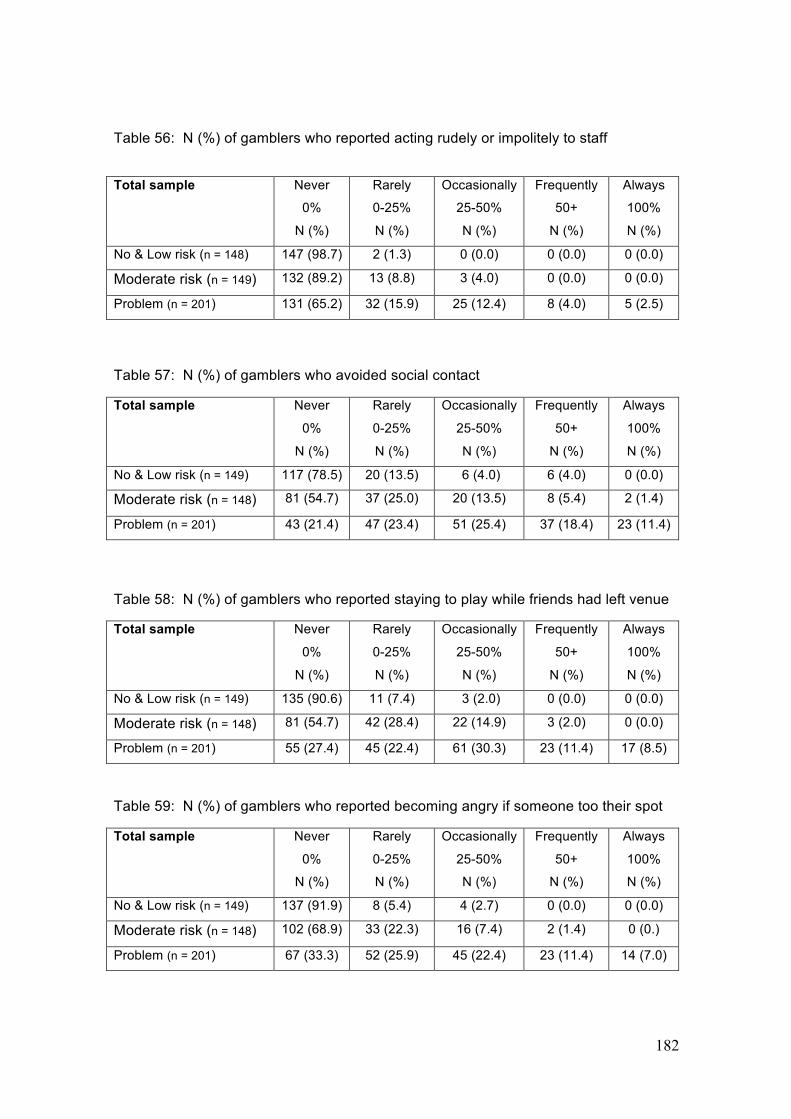
182
Table 56: N (%) of gamblers who reported acting rudely or impolitely to staff
Total sample Never
0%
N (%)
Rarely
0-25%
N (%)
Occasionally
25-50%
N (%)
Frequently
50+
N (%)
Always
100%
N (%)
No & Low risk (n = 148) 147 (98.7) 2 (1.3) 0 (0.0) 0 (0.0) 0 (0.0)
Moderate risk (n = 149) 132 (89.2) 13 (8.8) 3 (4.0) 0 (0.0) 0 (0.0)
Problem (n = 201) 131 (65.2) 32 (15.9) 25 (12.4) 8 (4.0) 5 (2.5)
Table 57: N (%) of gamblers who avoided social contact
Total sample Never
0%
N (%)
Rarely
0-25%
N (%)
Occasionally
25-50%
N (%)
Frequently
50+
N (%)
Always
100%
N (%)
No & Low risk (n = 149) 117 (78.5) 20 (13.5) 6 (4.0) 6 (4.0) 0 (0.0)
Moderate risk (n = 148) 81 (54.7) 37 (25.0) 20 (13.5) 8 (5.4) 2 (1.4)
Problem (n = 201) 43 (21.4) 47 (23.4) 51 (25.4) 37 (18.4) 23 (11.4)
Table 58: N (%) of gamblers who reported staying to play while friends had left venue
Total sample Never
0%
N (%)
Rarely
0-25%
N (%)
Occasionally
25-50%
N (%)
Frequently
50+
N (%)
Always
100%
N (%)
No & Low risk (n = 149) 135 (90.6) 11 (7.4) 3 (2.0) 0 (0.0) 0 (0.0)
Moderate risk (n = 148) 81 (54.7) 42 (28.4) 22 (14.9) 3 (2.0) 0 (0.0)
Problem (n = 201) 55 (27.4) 45 (22.4) 61 (30.3) 23 (11.4) 17 (8.5)
Table 59: N (%) of gamblers who reported becoming angry if someone too their spot
Total sample Never
0%
N (%)
Rarely
0-25%
N (%)
Occasionally
25-50%
N (%)
Frequently
50+
N (%)
Always
100%
N (%)
No & Low risk (n = 149) 137 (91.9) 8 (5.4) 4 (2.7) 0 (0.0) 0 (0.0)
Moderate risk (n = 148) 102 (68.9) 33 (22.3) 16 (7.4) 2 (1.4) 0 (0.)
Problem (n = 201) 67 (33.3) 52 (25.9) 45 (22.4) 23 (11.4) 14 (7.0)
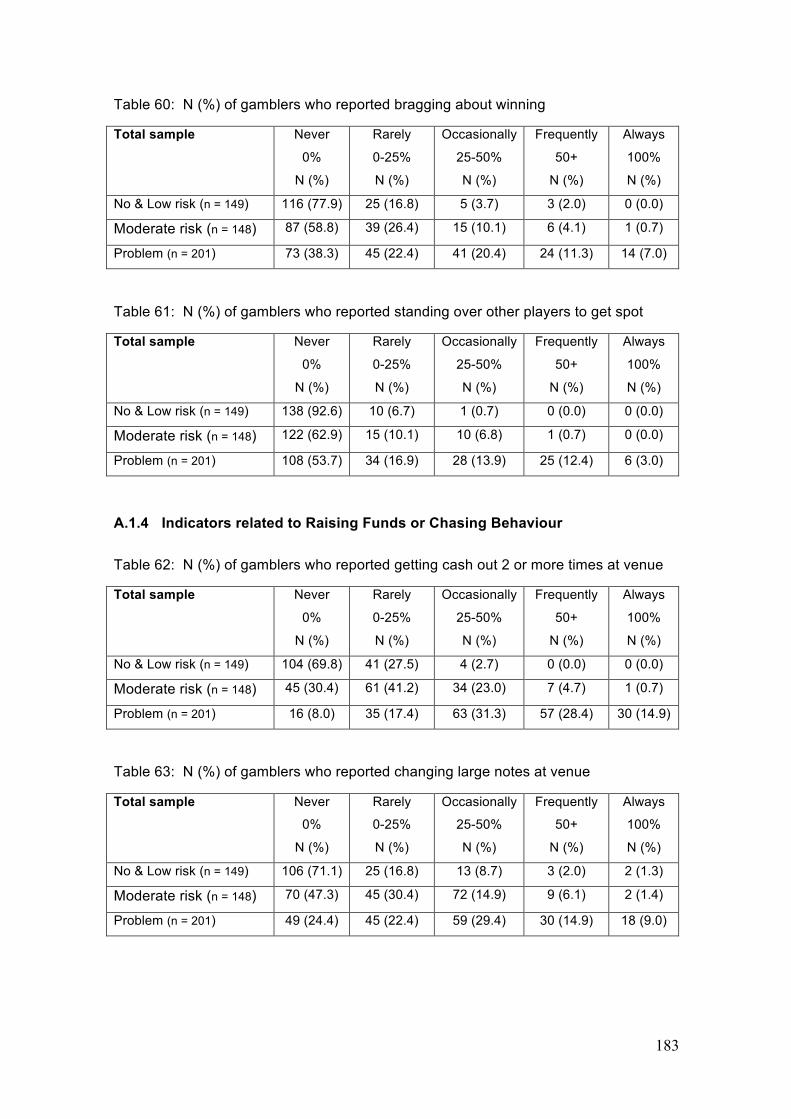
183
Table 60: N (%) of gamblers who reported bragging about winning
Total sample Never
0%
N (%)
Rarely
0-25%
N (%)
Occasionally
25-50%
N (%)
Frequently
50+
N (%)
Always
100%
N (%)
No & Low risk (n = 149) 116 (77.9) 25 (16.8) 5 (3.7) 3 (2.0) 0 (0.0)
Moderate risk (n = 148) 87 (58.8) 39 (26.4) 15 (10.1) 6 (4.1) 1 (0.7)
Problem (n = 201) 73 (38.3) 45 (22.4) 41 (20.4) 24 (11.3) 14 (7.0)
Table 61: N (%) of gamblers who reported standing over other players to get spot
Total sample Never
0%
N (%)
Rarely
0-25%
N (%)
Occasionally
25-50%
N (%)
Frequently
50+
N (%)
Always
100%
N (%)
No & Low risk (n = 149) 138 (92.6) 10 (6.7) 1 (0.7) 0 (0.0) 0 (0.0)
Moderate risk (n = 148) 122 (62.9) 15 (10.1) 10 (6.8) 1 (0.7) 0 (0.0)
Problem (n = 201) 108 (53.7) 34 (16.9) 28 (13.9) 25 (12.4) 6 (3.0)
A.1.4 Indicators related to Raising Funds or Chasing Behaviour Table 62: N (%) of gamblers who reported getting cash out 2 or more times at venue
Total sample Never
0%
N (%)
Rarely
0-25%
N (%)
Occasionally
25-50%
N (%)
Frequently
50+
N (%)
Always
100%
N (%)
No & Low risk (n = 149) 104 (69.8) 41 (27.5) 4 (2.7) 0 (0.0) 0 (0.0)
Moderate risk (n = 148) 45 (30.4) 61 (41.2) 34 (23.0) 7 (4.7) 1 (0.7)
Problem (n = 201) 16 (8.0) 35 (17.4) 63 (31.3) 57 (28.4) 30 (14.9)
Table 63: N (%) of gamblers who reported changing large notes at venue
Total sample Never
0%
N (%)
Rarely
0-25%
N (%)
Occasionally
25-50%
N (%)
Frequently
50+
N (%)
Always
100%
N (%)
No & Low risk (n = 149) 106 (71.1) 25 (16.8) 13 (8.7) 3 (2.0) 2 (1.3)
Moderate risk (n = 148) 70 (47.3) 45 (30.4) 72 (14.9) 9 (6.1) 2 (1.4)
Problem (n = 201) 49 (24.4) 45 (22.4) 59 (29.4) 30 (14.9) 18 (9.0)
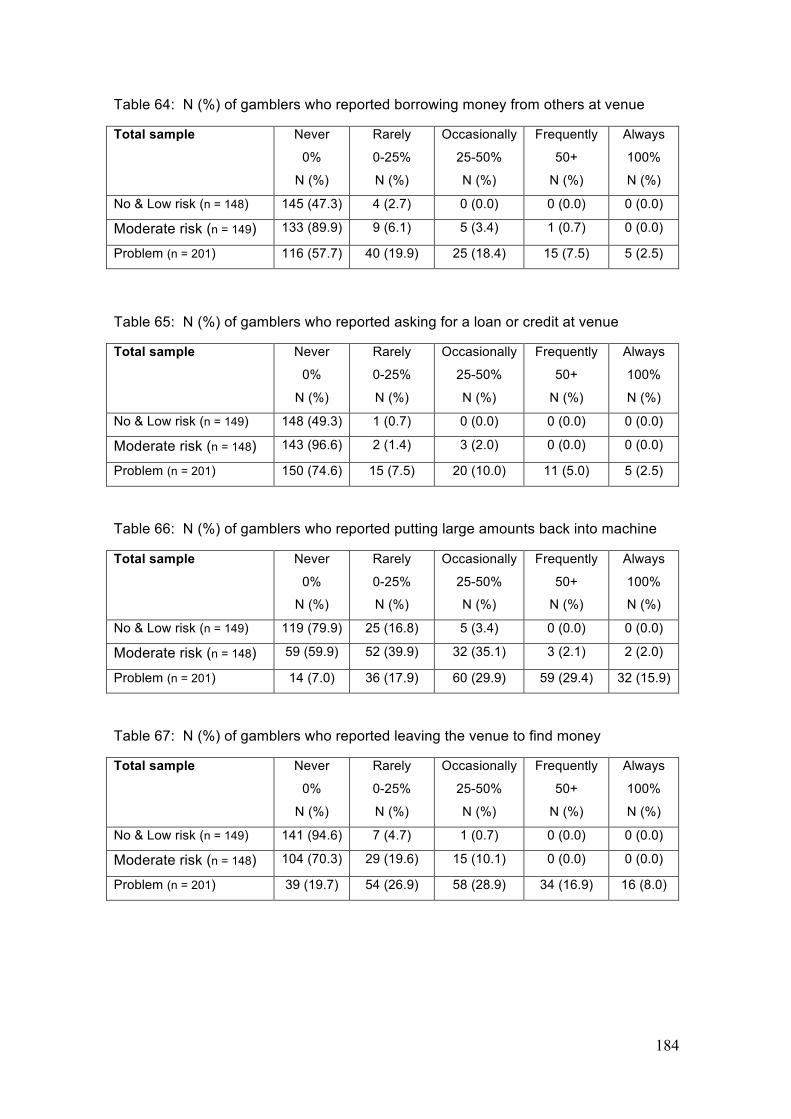
184
Table 64: N (%) of gamblers who reported borrowing money from others at venue
Total sample Never
0%
N (%)
Rarely
0-25%
N (%)
Occasionally
25-50%
N (%)
Frequently
50+
N (%)
Always
100%
N (%)
No & Low risk (n = 148) 145 (47.3) 4 (2.7) 0 (0.0) 0 (0.0) 0 (0.0)
Moderate risk (n = 149) 133 (89.9) 9 (6.1) 5 (3.4) 1 (0.7) 0 (0.0)
Problem (n = 201) 116 (57.7) 40 (19.9) 25 (18.4) 15 (7.5) 5 (2.5)
Table 65: N (%) of gamblers who reported asking for a loan or credit at venue
Total sample Never
0%
N (%)
Rarely
0-25%
N (%)
Occasionally
25-50%
N (%)
Frequently
50+
N (%)
Always
100%
N (%)
No & Low risk (n = 149) 148 (49.3) 1 (0.7) 0 (0.0) 0 (0.0) 0 (0.0)
Moderate risk (n = 148) 143 (96.6) 2 (1.4) 3 (2.0) 0 (0.0) 0 (0.0)
Problem (n = 201) 150 (74.6) 15 (7.5) 20 (10.0) 11 (5.0) 5 (2.5)
Table 66: N (%) of gamblers who reported putting large amounts back into machine
Total sample Never
0%
N (%)
Rarely
0-25%
N (%)
Occasionally
25-50%
N (%)
Frequently
50+
N (%)
Always
100%
N (%)
No & Low risk (n = 149) 119 (79.9) 25 (16.8) 5 (3.4) 0 (0.0) 0 (0.0)
Moderate risk (n = 148) 59 (59.9) 52 (39.9) 32 (35.1) 3 (2.1) 2 (2.0)
Problem (n = 201) 14 (7.0) 36 (17.9) 60 (29.9) 59 (29.4) 32 (15.9)
Table 67: N (%) of gamblers who reported leaving the venue to find money
Total sample Never
0%
N (%)
Rarely
0-25%
N (%)
Occasionally
25-50%
N (%)
Frequently
50+
N (%)
Always
100%
N (%)
No & Low risk (n = 149) 141 (94.6) 7 (4.7) 1 (0.7) 0 (0.0) 0 (0.0)
Moderate risk (n = 148) 104 (70.3) 29 (19.6) 15 (10.1) 0 (0.0) 0 (0.0)
Problem (n = 201) 39 (19.7) 54 (26.9) 58 (28.9) 34 (16.9) 16 (8.0)

185
Table 68: N (%) of gamblers who reported rummaging around for more money
Total sample Never
0%
N (%)
Rarely
0-25%
N (%)
Occasionally
25-50%
N (%)
Frequently
50+
N (%)
Always
100%
N (%)
No & Low risk (n = 149) 95 (63.8) 40 (26.8) 13 (8.7) 0 (0.0) 1 (0.7)
Moderate risk (n = 148) 55 (37.2) 45 (30.4) 37 (25.0) 9 (6.1) 2 (1.4)
Problem (n = 201) 23 (11.4) 41 (20.4) 59 (29.4) 41 (20.4) 37 (18.4)
Table 69: N (%) of gamblers who reported running out of all their money
Total sample Never
0%
N (%)
Rarely
0-25%
N (%)
Occasionally
25-50%
N (%)
Frequently
50+
N (%)
Always
100%
N (%)
No & Low risk (n = 149) 117 (98.5) 28 (18.8) 4 (2.3) 0 (0.0) 0 (0.0)
Moderate risk (n = 148) 46 (31.1) 58 (39.2) 29 (19.6) 13 (8.8) 2 (1.4)
Problem (n = 201) 9 (4.5) 30 (14.9) 59 (29.4) 69 (34.3) 34 (16.9)
Table 70: N (%) of gambler who reported using the coin machine 4+ times
Total sample Never
0%
N (%)
Rarely
0-25%
N (%)
Occasionally
25-50%
N (%)
Frequently
50+
N (%)
Always
100%
N (%)
No & Low risk (n = 149) 93 (62.4) 17 (11.4) 7 (4.7) 3 (2.0) 0 (0.0)
Moderate risk (n = 148) 53 (35.8) 33 (22.3) 16 (10.8) 5 (3.4) 1 (0.7)
Problem (n = 201) 30 (14.9) 38 (18.9) 40 (19.9) 26 (10.4) 16 (8.0)
A.1.5 Emotional and Physiological Indicators of Problem Gambling Table 71: N (%) of gamblers who reported shaking while gambling
Total sample Never
0%
N (%)
Rarely
0-25%
N (%)
Occasionally
25-50%
N (%)
Frequently
50+
N (%)
Always
100%
N (%)
No & Low risk (n = 149) 138 (92.6) 10 (6.7) 1 (0.7) 0 (0.0) 0 (0.0)
Moderate risk (n = 148) 127 (85.8) 16 (10.8) 4 (2.7) 1 (0.7) 0 (0.0)
Problem (n = 201) 77 (78.3) 50 (24.9) 44 (21.9) 20 (10.0) 10 (5.0)
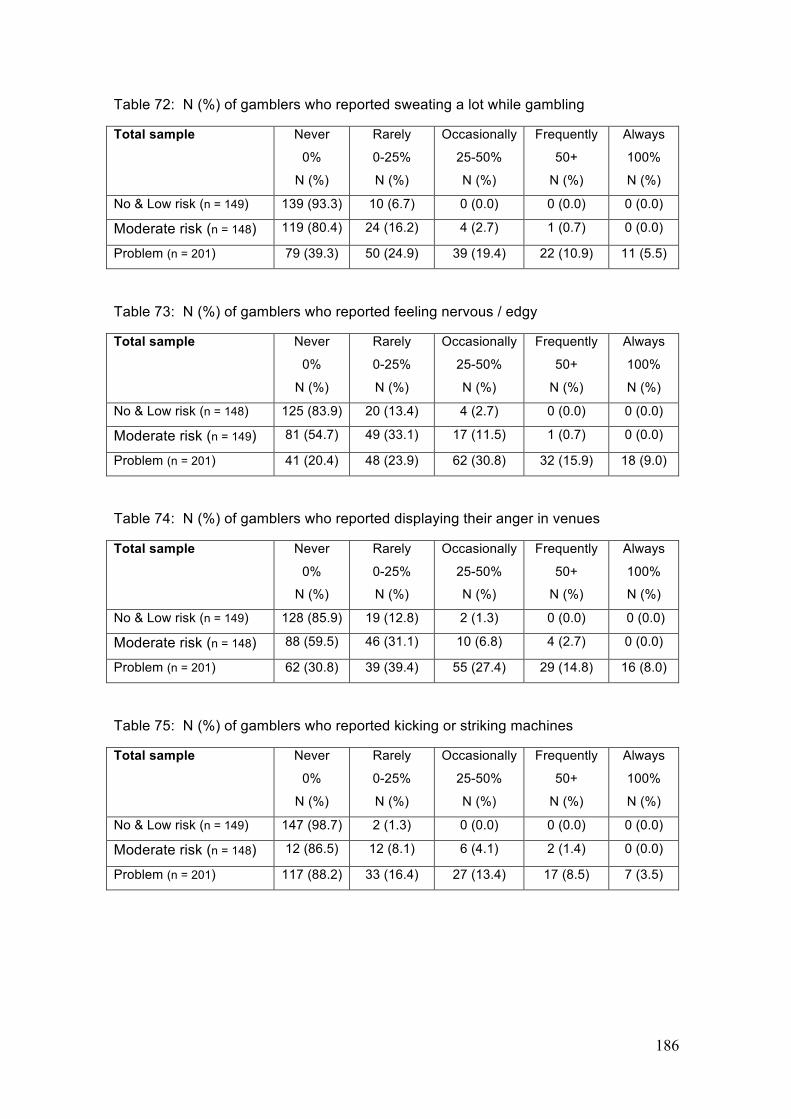
186
Table 72: N (%) of gamblers who reported sweating a lot while gambling
Total sample Never
0%
N (%)
Rarely
0-25%
N (%)
Occasionally
25-50%
N (%)
Frequently
50+
N (%)
Always
100%
N (%)
No & Low risk (n = 149) 139 (93.3) 10 (6.7) 0 (0.0) 0 (0.0) 0 (0.0)
Moderate risk (n = 148) 119 (80.4) 24 (16.2) 4 (2.7) 1 (0.7) 0 (0.0)
Problem (n = 201) 79 (39.3) 50 (24.9) 39 (19.4) 22 (10.9) 11 (5.5)
Table 73: N (%) of gamblers who reported feeling nervous / edgy
Total sample Never
0%
N (%)
Rarely
0-25%
N (%)
Occasionally
25-50%
N (%)
Frequently
50+
N (%)
Always
100%
N (%)
No & Low risk (n = 148) 125 (83.9) 20 (13.4) 4 (2.7) 0 (0.0) 0 (0.0)
Moderate risk (n = 149) 81 (54.7) 49 (33.1) 17 (11.5) 1 (0.7) 0 (0.0)
Problem (n = 201) 41 (20.4) 48 (23.9) 62 (30.8) 32 (15.9) 18 (9.0)
Table 74: N (%) of gamblers who reported displaying their anger in venues
Total sample Never
0%
N (%)
Rarely
0-25%
N (%)
Occasionally
25-50%
N (%)
Frequently
50+
N (%)
Always
100%
N (%)
No & Low risk (n = 149) 128 (85.9) 19 (12.8) 2 (1.3) 0 (0.0) 0 (0.0)
Moderate risk (n = 148) 88 (59.5) 46 (31.1) 10 (6.8) 4 (2.7) 0 (0.0)
Problem (n = 201) 62 (30.8) 39 (39.4) 55 (27.4) 29 (14.8) 16 (8.0)
Table 75: N (%) of gamblers who reported kicking or striking machines
Total sample Never
0%
N (%)
Rarely
0-25%
N (%)
Occasionally
25-50%
N (%)
Frequently
50+
N (%)
Always
100%
N (%)
No & Low risk (n = 149) 147 (98.7) 2 (1.3) 0 (0.0) 0 (0.0) 0 (0.0)
Moderate risk (n = 148) 12 (86.5) 12 (8.1) 6 (4.1) 2 (1.4) 0 (0.0)
Problem (n = 201) 117 (88.2) 33 (16.4) 27 (13.4) 17 (8.5) 7 (3.5)

187
Table 76: N (%) of gamblers who reported feeling sad or depressed
Total sample Never
0%
N (%)
Rarely
0-25%
N (%)
Occasionally
25-50%
N (%)
Frequently
50+
N (%)
Always
100%
N (%)
No & Low risk (n = 149) 122 (81.9) 23 (15.4) 3 (2.0) 1 (0.7) 0 (0.0)
Moderate risk (n = 148) 44 (29.9) 68 (41.9) 23 (15.5) 13 (8.8) 0 (0.0)
Problem (n = 201) 10 (5.0) 30 (14.9) 40 (19.9) 65 (32.3) 56 (27.9)
Table 77: N (%) of gamblers who reported crying after losing a lot of money
Total sample Never
0%
N (%)
Rarely
0-25%
N (%)
Occasionally
25-50%
N (%)
Frequently
50+
N (%)
Always
100%
N (%)
No & Low risk (n = 149) 147 (98.7) 1 (0.7) 1 (0.7) 0 (0.0) 0 (0.0)
Moderate risk (n = 148) 126 (85.1) 16 (10.8) 5 (3.4) 1 (0.7) 0 (0.0)
Problem (n = 201) 77 (38.3) 35 (17.4) 41 (20.4) 31 (15.4) 17 (8.5)
Table 78: N (%) of gamblers who reported sitting with head in hands after losing
Total sample Never
0%
N (%)
Rarely
0-25%
N (%)
Occasionally
25-50%
N (%)
Frequently
50+
N (%)
Always
100%
N (%)
No & Low risk (n = 149) 141 (98.7) 2 (1.3) 0 (0.0) 0 (0.0) 0 (0.0)
Moderate risk (n = 148) 121 (81.8) 15 (10.4) 11 (7.4) 1 (0.7) 0 (0.0)
Problem (n = 201) 84 (41.8) 44 (21.9) 37 (18.4) 23 (11.4) 13 (6.5)
Table 79: N (%) of gamblers who reported playing machines very roughly
Total sample Never
0%
N (%)
Rarely
0-25%
N (%)
Occasionally
25-50%
N (%)
Frequently
50+
N (%)
Always
100%
N (%)
No & Low risk (n = 149) 139 (93.3) 9 (6.0) 1 (0.7) 0 (0.0) 0 (0.0)
Moderate risk (n = 148) 117 (79.1) 21 (14.2) 7 (4.7) 2 (1.4) 1 (0.7)
Problem (n = 201) 93 (46.3) 36 (17.9) 45 (22.4) 17 (8.5) 10 (5.0)

188
Table 80: N (%) of gamblers who reported groaning repeatedly while gambling
Total sample Never
0%
N (%)
Rarely
0-25%
N (%)
Occasionally
25-50%
N (%)
Frequently
50+
N (%)
Always
100%
N (%)
No & Low risk (n = 149) 127 (85.2) 20 (13.4) 2 (1.3) 0 (0.0) 0 (0.0)
Moderate risk (n = 148) 107 (72.3) 28 (18.9) 11 (7.4) 1 (0.7) 1 (0.7)
Problem (n = 201) 75 (37.3) 48 (23.9) 45 (22.4) 26 (12.9) 7 (3.5)
Table 81: N (%) of gamblers who reported feeling a significant change in mood during sessions
Total sample Never
0%
N (%)
Rarely
0-25%
N (%)
Occasionally
25-50%
N (%)
Frequently
50+
N (%)
Always
100%
N (%)
No & Low risk (n = 149) 113 (75.8) 31 (20.8) 4 (2.7) 1 (0.7) 0 (0.0)
Moderate risk (n = 148) 57 (38.1) 57 (38.5) 27 (18.2) 6 (4.8) 1 (0.7)
Problem (n = 201) 16 (8.0) 34 (16.9) 64 (31.8) 52 (25.9) 35 (17.4)
A.1.6 Other Behavioural Indicators Table 82: N (%) of gamblers who reported gambling after drinking a lot of alcohol
Total sample Never
0%
N (%)
Rarely
0-25%
N (%)
Occasionally
25-50%
N (%)
Frequently
50+
N (%)
Always
100%
N (%)
No & Low risk (n = 149) 98 (65.8) 27 (18.1) 14 (9.4) 7 (4.7) 3 (2.0)
Moderate risk (n = 148) 65 (43.9) 29 (19.6) 38 (25.7) 12 (8.1) 4 (2.7)
Problem (n = 201) 76 (37.8) 30 (14.9) 42 (20.9) 28 (13.9) 25 (12.4)
Table 83: N (%) of gamblers who reported avoiding the cashier
Total sample Never
0%
N (%)
Rarely
0-25%
N (%)
Occasionally
25-50%
N (%)
Frequently
50+
N (%)
Always
100%
N (%)
No & Low risk (n = 149) 139 (93.3) 6 (4.0) 3 (2.0) 0 (0.0) 1 (0.7)
Moderate risk (n = 148) 105 (70.9) 28 (18.9) 12 (8.1) 1 (0.7) 2 (1.4)
Problem (n = 201) 57 (28.5) 47 (23.5) 49 (24.5) 27 (13.5) 20 (10.0)
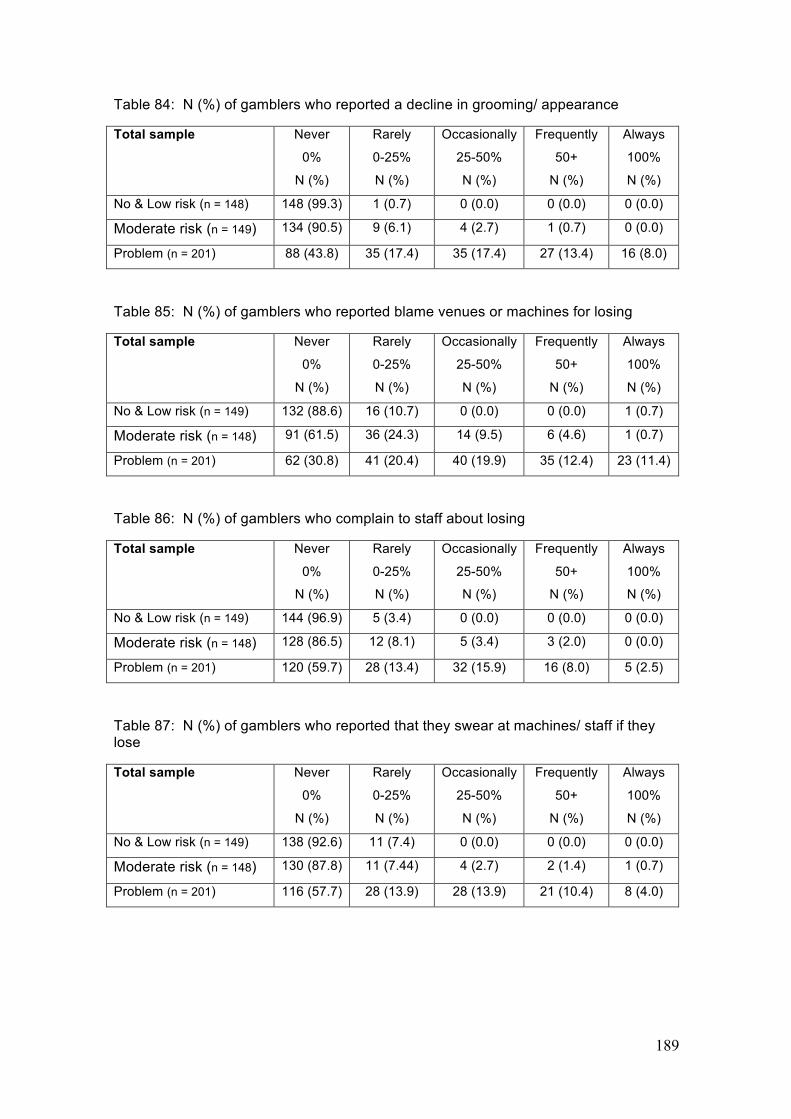
189
Table 84: N (%) of gamblers who reported a decline in grooming/ appearance
Total sample Never
0%
N (%)
Rarely
0-25%
N (%)
Occasionally
25-50%
N (%)
Frequently
50+
N (%)
Always
100%
N (%)
No & Low risk (n = 148) 148 (99.3) 1 (0.7) 0 (0.0) 0 (0.0) 0 (0.0)
Moderate risk (n = 149) 134 (90.5) 9 (6.1) 4 (2.7) 1 (0.7) 0 (0.0)
Problem (n = 201) 88 (43.8) 35 (17.4) 35 (17.4) 27 (13.4) 16 (8.0)
Table 85: N (%) of gamblers who reported blame venues or machines for losing
Total sample Never
0%
N (%)
Rarely
0-25%
N (%)
Occasionally
25-50%
N (%)
Frequently
50+
N (%)
Always
100%
N (%)
No & Low risk (n = 149) 132 (88.6) 16 (10.7) 0 (0.0) 0 (0.0) 1 (0.7)
Moderate risk (n = 148) 91 (61.5) 36 (24.3) 14 (9.5) 6 (4.6) 1 (0.7)
Problem (n = 201) 62 (30.8) 41 (20.4) 40 (19.9) 35 (12.4) 23 (11.4)
Table 86: N (%) of gamblers who complain to staff about losing
Total sample Never
0%
N (%)
Rarely
0-25%
N (%)
Occasionally
25-50%
N (%)
Frequently
50+
N (%)
Always
100%
N (%)
No & Low risk (n = 149) 144 (96.9) 5 (3.4) 0 (0.0) 0 (0.0) 0 (0.0)
Moderate risk (n = 148) 128 (86.5) 12 (8.1) 5 (3.4) 3 (2.0) 0 (0.0)
Problem (n = 201) 120 (59.7) 28 (13.4) 32 (15.9) 16 (8.0) 5 (2.5)
Table 87: N (%) of gamblers who reported that they swear at machines/ staff if they lose
Total sample Never
0%
N (%)
Rarely
0-25%
N (%)
Occasionally
25-50%
N (%)
Frequently
50+
N (%)
Always
100%
N (%)
No & Low risk (n = 149) 138 (92.6) 11 (7.4) 0 (0.0) 0 (0.0) 0 (0.0)
Moderate risk (n = 148) 130 (87.8) 11 (7.44) 4 (2.7) 2 (1.4) 1 (0.7)
Problem (n = 201) 116 (57.7) 28 (13.9) 28 (13.9) 21 (10.4) 8 (4.0)
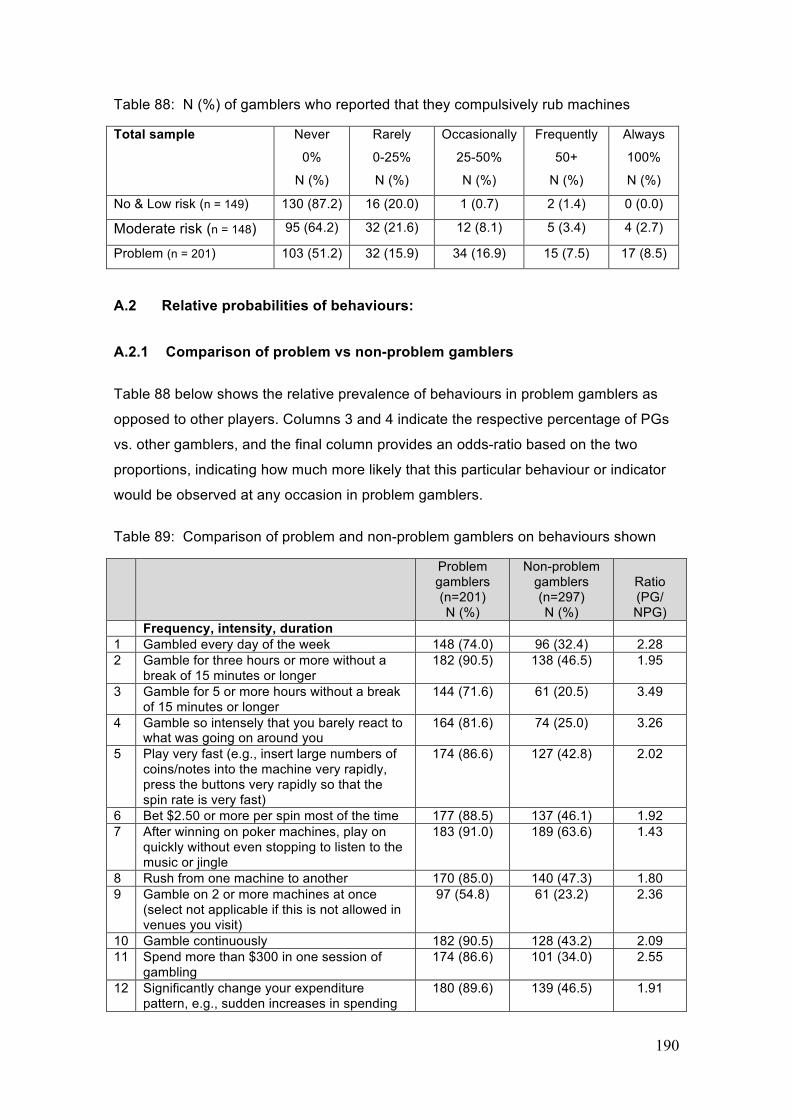
190
Table 88: N (%) of gamblers who reported that they compulsively rub machines
Total sample Never
0%
N (%)
Rarely
0-25%
N (%)
Occasionally
25-50%
N (%)
Frequently
50+
N (%)
Always
100%
N (%)
No & Low risk (n = 149) 130 (87.2) 16 (20.0) 1 (0.7) 2 (1.4) 0 (0.0)
Moderate risk (n = 148) 95 (64.2) 32 (21.6) 12 (8.1) 5 (3.4) 4 (2.7)
Problem (n = 201) 103 (51.2) 32 (15.9) 34 (16.9) 15 (7.5) 17 (8.5)
A.2 Relative probabilities of behaviours:
A.2.1 Comparison of problem vs non-problem gamblers Table 88 below shows the relative prevalence of behaviours in problem gamblers as
opposed to other players. Columns 3 and 4 indicate the respective percentage of PGs
vs. other gamblers, and the final column provides an odds-ratio based on the two
proportions, indicating how much more likely that this particular behaviour or indicator
would be observed at any occasion in problem gamblers.
Table 89: Comparison of problem and non-problem gamblers on behaviours shown
Problem gamblers (n=201) N (%)
Non-problem gamblers (n=297) N (%)
Ratio (PG/ NPG)
Frequency, intensity, duration 1 Gambled every day of the week 148 (74.0) 96 (32.4) 2.28 2 Gamble for three hours or more without a
break of 15 minutes or longer 182 (90.5) 138 (46.5) 1.95
3 Gamble for 5 or more hours without a break of 15 minutes or longer
144 (71.6) 61 (20.5) 3.49
4 Gamble so intensely that you barely react to what was going on around you
164 (81.6) 74 (25.0) 3.26
5 Play very fast (e.g., insert large numbers of coins/notes into the machine very rapidly, press the buttons very rapidly so that the spin rate is very fast)
174 (86.6) 127 (42.8) 2.02
6 Bet $2.50 or more per spin most of the time 177 (88.5) 137 (46.1) 1.92 7 After winning on poker machines, play on
quickly without even stopping to listen to the music or jingle
183 (91.0) 189 (63.6) 1.43
8 Rush from one machine to another 170 (85.0) 140 (47.3) 1.80 9 Gamble on 2 or more machines at once
(select not applicable if this is not allowed in venues you visit)
97 (54.8) 61 (23.2) 2.36
10 Gamble continuously 182 (90.5) 128 (43.2) 2.09 11 Spend more than $300 in one session of
gambling 174 (86.6) 101 (34.0) 2.55
12 Significantly change your expenditure pattern, e.g., sudden increases in spending
180 (89.6) 139 (46.5) 1.91
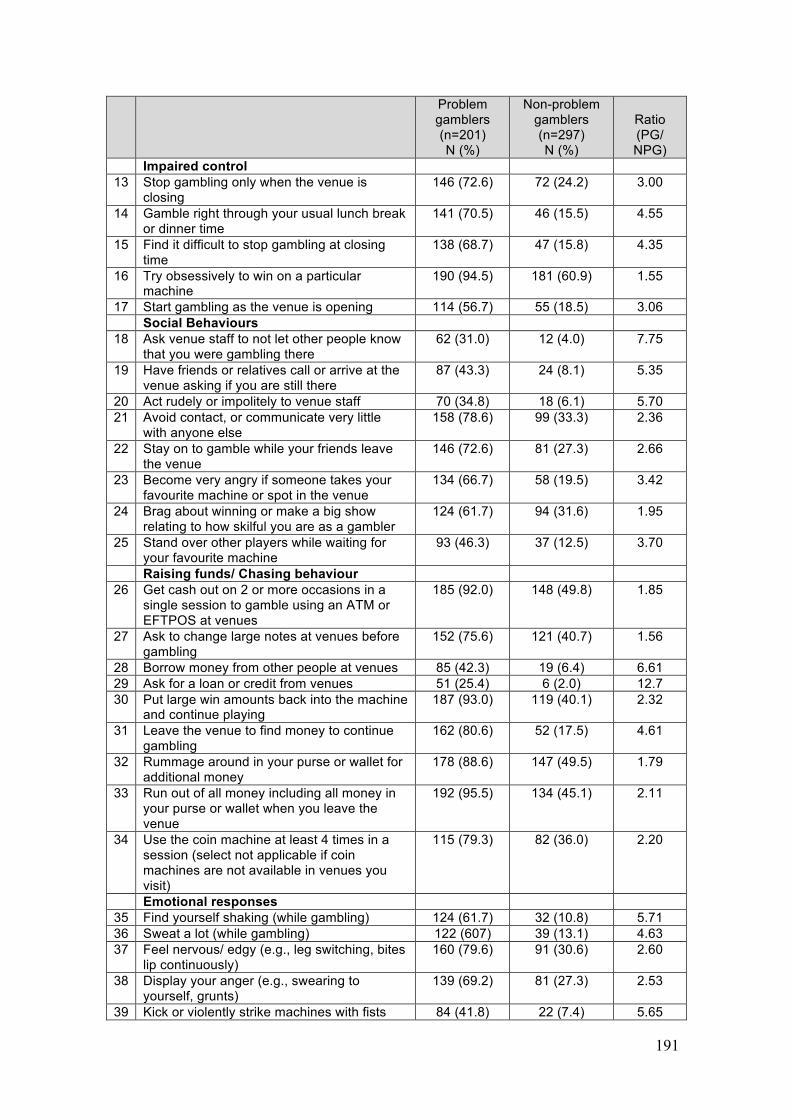
191
Problem gamblers (n=201) N (%)
Non-problem gamblers (n=297) N (%)
Ratio (PG/ NPG)
Impaired control 13 Stop gambling only when the venue is
closing 146 (72.6) 72 (24.2) 3.00
14 Gamble right through your usual lunch break or dinner time
141 (70.5) 46 (15.5) 4.55
15 Find it difficult to stop gambling at closing time
138 (68.7) 47 (15.8) 4.35
16 Try obsessively to win on a particular machine
190 (94.5) 181 (60.9) 1.55
17 Start gambling as the venue is opening 114 (56.7) 55 (18.5) 3.06 Social Behaviours 18 Ask venue staff to not let other people know
that you were gambling there 62 (31.0) 12 (4.0) 7.75
19 Have friends or relatives call or arrive at the venue asking if you are still there
87 (43.3) 24 (8.1) 5.35
20 Act rudely or impolitely to venue staff 70 (34.8) 18 (6.1) 5.70 21 Avoid contact, or communicate very little
with anyone else 158 (78.6) 99 (33.3) 2.36
22 Stay on to gamble while your friends leave the venue
146 (72.6) 81 (27.3) 2.66
23 Become very angry if someone takes your favourite machine or spot in the venue
134 (66.7) 58 (19.5) 3.42
24 Brag about winning or make a big show relating to how skilful you are as a gambler
124 (61.7) 94 (31.6) 1.95
25 Stand over other players while waiting for your favourite machine
93 (46.3) 37 (12.5) 3.70
Raising funds/ Chasing behaviour 26 Get cash out on 2 or more occasions in a
single session to gamble using an ATM or EFTPOS at venues
185 (92.0) 148 (49.8) 1.85
27 Ask to change large notes at venues before gambling
152 (75.6) 121 (40.7) 1.56
28 Borrow money from other people at venues 85 (42.3) 19 (6.4) 6.61 29 Ask for a loan or credit from venues 51 (25.4) 6 (2.0) 12.7 30 Put large win amounts back into the machine
and continue playing 187 (93.0) 119 (40.1) 2.32
31 Leave the venue to find money to continue gambling
162 (80.6) 52 (17.5) 4.61
32 Rummage around in your purse or wallet for additional money
178 (88.6) 147 (49.5) 1.79
33 Run out of all money including all money in your purse or wallet when you leave the venue
192 (95.5) 134 (45.1) 2.11
34 Use the coin machine at least 4 times in a session (select not applicable if coin machines are not available in venues you visit)
115 (79.3) 82 (36.0) 2.20
Emotional responses 35 Find yourself shaking (while gambling) 124 (61.7) 32 (10.8) 5.71 36 Sweat a lot (while gambling) 122 (607) 39 (13.1) 4.63 37 Feel nervous/ edgy (e.g., leg switching, bites
lip continuously) 160 (79.6) 91 (30.6) 2.60
38 Display your anger (e.g., swearing to yourself, grunts)
139 (69.2) 81 (27.3) 2.53
39 Kick or violently strike machines with fists 84 (41.8) 22 (7.4) 5.65

192
Problem gamblers (n=201) N (%)
Non-problem gamblers (n=297) N (%)
Ratio (PG/ NPG)
40 Feel very sad or depressed (after gambling) 191 (95.0) 131 (44.1) 2.15 41 Cry after losing a lot of money 124 (61.7) 24 (8.1) 7.62 42 Sit with your head in hands after losing 117 (58.2) 29 (9.8) 5.94 43 Play the machine very roughly and
aggressively (e.g., with fists or slaps) 108 (53.7) 41 (13.8) 3.89
44 Groan repeatedly while gambling 126 (62.7) 63 (21.2) 2.96 45 Feel a significant change in your mood
during sessions 185 (92.0) 127 (42.8) 2.15
Other behaviours 46 Gamble after having drunk a lot of alcohol 125 (62.2) 134 (45.1) 1.38 47 Avoid the cashier and only use cash facilities 143 (71.5) 53 (17.8) 4.02 48 Notice decline in grooming/ appearance 113 (56.2) 15 (5.1) 11.0 49 Blame venues or machines for losing 139 (69.2) 74 (24.9) 2.78 50 Complain to staff about losing 81 (40.3) 25 (8.4) 4.80 51 Swear at machines or venue staff because
you are losing 85 (42.3) 29 (9.8) 4.32
52 Compulsively rub the machine 98 (48.8) 72 (24.2) 2.02
Note: All ratios are significantly different to each other at p<.05
A.2.2 Comparisons across other risk levels Table 89 below uses the same method as table 79 but with problem gamblers, moderate risk gamblers and no-low risk gamblers to indicate how much more likely each indicator would be observed at any occasion, comparing • In column 5: problem gamblers compared to moderate risk gamblers, • In column 6: moderate risk gamblers compared to no/low risk gamblers • In column 7: problem/moderate risk gamblers compared to no/low risk gamblers
Table 90: Self-report prevalence of indicators by risk level
PGs N (%)
MRG N (%)
LRG N (%)
PG/ Mod
Mod/ LRG
PG+ Mod/ LRG
Frequency, intensity, duration Gambled every day of the week 148 (74.0) 57 (38.8) 39 (26.2) 1.91 1.48 2.26 Gamble for three hours or more without a break of 15 minutes or longer
182 (90.5) 93 (62.8) 45 (30.2) 1.44 2.08 2.61
Gamble for 5 or more hours without a break of 15 minutes or longer
144 (71.6) 48 (32.4) 13 (8.7) 2.21 3.72 6.32
Gamble so intensely that you barely react to what was going on around you
164 (81.6) 57 (38.8) 17 (11.4) 2.10 3.40 5.57
Play very fast (e.g., insert large numbers of coins/notes into the machine very rapidly, press the buttons very rapidly so that the spin rate is very fast)
174 (86.6) 86 (58.1) 41 (27.5) 1.49 2.11 2.71
Bet $2.50 or more per spin most of the time
177 (88.5) 76 (51.4) 61 (40.9) 1.72 1.26 1.78

193
PGs N (%)
MRG N (%)
LRG N (%)
PG/ Mod
Mod/ LRG
PG+ Mod/ LRG
After winning on poker machines, play on quickly without even stopping to listen to the music or jingle
183 (91.0) 114 (77.0) 75 (50.3) 1.18 1.53 1.69
Rush from one machine to another 170 (85.0) 89 (60.5) 51 (34.2) 1.40 1.77 2.18 Gamble on 2 or more machines at once (select not applicable if this is not allowed in venues you visit)
97 (54.8) 42 (31.8) 19 (14.5) 1.72 2.19 3.10
Gamble continuously 182 (90.5) 95 (64.6) 33 (22.1) 1.40 2.92 3.60 Spend more than $300 in one session of gambling
174 (86.6) 75 (50.7) 26 (17.4) 1.71 2.91 4.10
Significantly change your expenditure pattern, e.g., sudden increases in spending
180 (89.6) 96 (64.9) 43 (28.9) 1.38 2.25 2.74
Impaired control Stop gambling only when the venue is closing
146 (72.6) 52 (35.1) 20 (13.4) 2.07 2.62 2.84
Gamble right through your usual lunch break or dinner time
141 (70.5) 37 (25.0) 9 (6.0) 2.82 4.12 8.52
Find it difficult to stop gambling at closing time
138 (68.7) 41 (27.7) 6 (4.0) 2.48 6.93 12.8
Try obsessively to win on a particular machine
190 (94.5) 120 (81.1) 61 (40.9) 1.17 1.98 2.17
Start gambling as the venue is opening
114 (56.7) 44 (29.7) 11 (7.4) 1.91 4.01 6.12
Social Behaviours Ask venue staff to not let other people know that you were gambling there
62 (31.0) 11 (7.4) 1 (1.7) 4.19 10.6 30.0
Have friends or relatives call or arrive at the venue asking if you are still there
87 (43.3) 18 (12.2) 6 (4.0) 3.55 3.05 7.53
Act rudely or impolitely to venue staff
70 (34.8) 16 (10.8) 2 (1.3) 3.55 3.05 18.92
Avoid contact, or communicate very little with anyone else
158 (78.6) 67 (45.3) 32 (21.5) 1.74 2.11 3.00
Stay on to gamble while your friends leave the venue
146 (72.6) 67 (45.3) 14 (9.4) 1.60 4.81 6.49
Become very angry if someone takes your favourite machine or spot in the venue
134 (66.7) 46 (31.1) 12 (8.1) 2.14 3.83 6.37
Brag about winning or make a big show relating to how skilful you are as a gambler
124 (61.7) 61 (41.2) 33 (22.1) 1.50 1.86 2.99
Stand over other players while waiting for your favourite machine
93 (46.3) 26 (17.6) 11 (7.4) 2.63 2.38 4.61
Raising funds/ Chasing behaviour
Get cash out on 2 or more occasions in a single session to gamble using an ATM or EFTPOS at venues
185 (92.0) 103 (69.6) 45 (30.2) 1.32 2.30 2.73
Ask to change large notes at venues before gambling
152 (75.6) 78 (52.7) 43 (28.9) 1.43 1.82 2.28
Borrow money from other people at venues
85 (42.3) 15 (10.1) 4 (2.7) 4.19 3.74 10.62

194
PGs N (%)
MRG N (%)
LRG N (%)
PG/ Mod
Mod/ LRG
PG+ Mod/ LRG
Ask for a loan or credit from venues
51 (25.4) 5 (3.4) 1 (0.7) 7.47 4.86 22.86
Put large win amounts back into the machine and continue playing
187 (93.0) 89 (60.1) 30 (20.1) 1.55 2.99 3.94
Leave the venue to find money to continue gambling
162 (80.6) 44 (29.7) 8 (5.4) 2.71 5.50 10.92
Rummage around in your purse or wallet for additional money
178 (88.6) 93 (62.8) 54 (36.2) 1.41 1.73 2.15
Run out of all money including all money in your purse or wallet when you leave the venue
192 (95.5) 102 (68.9) 32 (21.5) 1.39 3.20 3.92
Use the coin machine at least 4 times in a session (select not applicable if coin machines are not available in venues you visit)
115 (79.3) 55 (50.9) 27 (22.5) 1.56 2.26 2.99
Emotional responses Find yourself shaking (while gambling)
124 (61.7) 21 (14.2) 11 (7.4) 4.34 1.92 5.61
Sweat a lot (while gambling) 122 (60.7) 29 (19.6) 10 (6.7) 3.10 2.93 6.46 Feel nervous/ edgy (e.g., leg switching, bites lip continuously)
160 (79.6) 67 (45.3) 24 (16.1) 1.76 2.81 4.04
Display your anger (e.g., swearing to yourself, grunts)
139 (69.2) 60 (40.5) 21 (14.1) 1.71 2.87 4.04
Kick or violently strike machines with fists
84 (41.8) 20 (13.5) 2 (1.3) 3.10 10.38
22.92
Feel very sad or depressed (after gambling)
191 (95.0) 104 (70.3) 27 (18.1) 1.35 3.88 4.67
Cry after losing a lot of money 124 (61.7 22 (14.9) 2 (1.3) 4.14 11.46
32.15
Sit with your head in hands after losing
117 (58.2) 27 (18.2) 2 (1.3) 3.20 14.0 31.77
Play the machine very roughly and aggressively (e.g., with fists or slaps)
108 (53.7) 31 (20.9) 10 (6.7) 2.57 3.22 5.94
Groan repeatedly while gambling 126 (62.7) 41 (27.7) 22 (14.8) 2.26 1.87 3.23 Feel a significant change in your mood during sessions
185 (92.0) 91 (61.5) 36 (24.2) 1.50 2.54 3.27
Other behaviours Gamble after having drunk a lot of alcohol
125 (62.2) 83 (56.1) 51 (34.2) 1.11 1.64 1.74
Avoid the cashier and only use cash facilities
143 (71.5) 43 (29.1) 10 (6.7) 2.46 4.34 7.97
Notice decline in grooming/ appearance
113 (56.2) 14 (9.5) 1 (0.7) 5.92 13.60
52.0
Blame venues or machines for losing
139 (69.2) 57 (38.5) 17 (11.4) 1.79 3.38 4.93
Complain to staff about losing 81 (40.3) 20 (13.5) 5 (3.4) 2.99 3.97 8.50 Swear at machines or venue staff because you are losing
85 (42.3) 18 (12.2) 11 (7.4) 3.47 1.65 3.99
Compulsively rub the machine 98 (48.8) 53 (35.8) 19 (12.8) 1.36 2.80 3.38
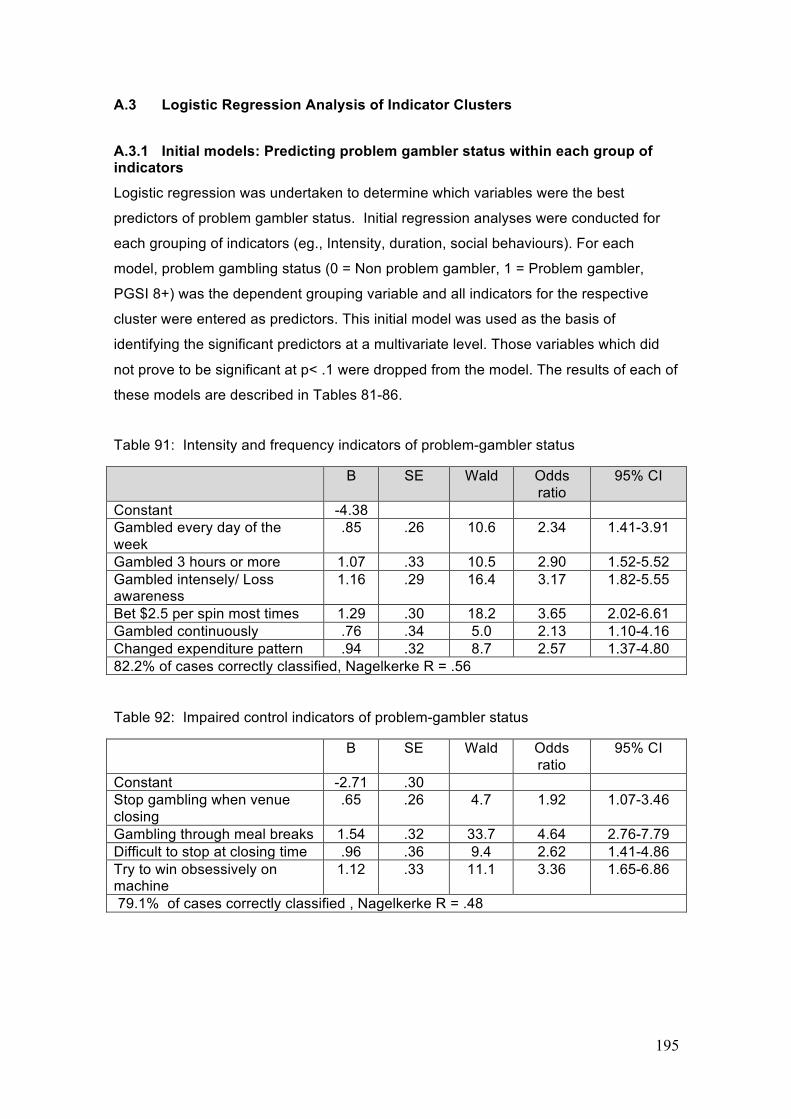
195
A.3 Logistic Regression Analysis of Indicator Clusters
A.3.1 Initial models: Predicting problem gambler status within each group of indicators
Logistic regression was undertaken to determine which variables were the best
predictors of problem gambler status. Initial regression analyses were conducted for
each grouping of indicators (eg., Intensity, duration, social behaviours). For each
model, problem gambling status (0 = Non problem gambler, 1 = Problem gambler,
PGSI 8+) was the dependent grouping variable and all indicators for the respective
cluster were entered as predictors. This initial model was used as the basis of
identifying the significant predictors at a multivariate level. Those variables which did
not prove to be significant at p< .1 were dropped from the model. The results of each of
these models are described in Tables 81-86.
Table 91: Intensity and frequency indicators of problem-gambler status
B SE Wald Odds ratio
95% CI
Constant -4.38 Gambled every day of the week
.85 .26 10.6 2.34 1.41-3.91
Gambled 3 hours or more 1.07 .33 10.5 2.90 1.52-5.52 Gambled intensely/ Loss awareness
1.16 .29 16.4 3.17 1.82-5.55
Bet $2.5 per spin most times 1.29 .30 18.2 3.65 2.02-6.61 Gambled continuously .76 .34 5.0 2.13 1.10-4.16 Changed expenditure pattern .94 .32 8.7 2.57 1.37-4.80 82.2% of cases correctly classified, Nagelkerke R = .56 Table 92: Impaired control indicators of problem-gambler status
B SE Wald Odds ratio
95% CI
Constant -2.71 .30 Stop gambling when venue closing
.65 .26 4.7 1.92 1.07-3.46
Gambling through meal breaks 1.54 .32 33.7 4.64 2.76-7.79 Difficult to stop at closing time .96 .36 9.4 2.62 1.41-4.86 Try to win obsessively on machine
1.12 .33 11.1 3.36 1.65-6.86
79.1% of cases correctly classified , Nagelkerke R = .48
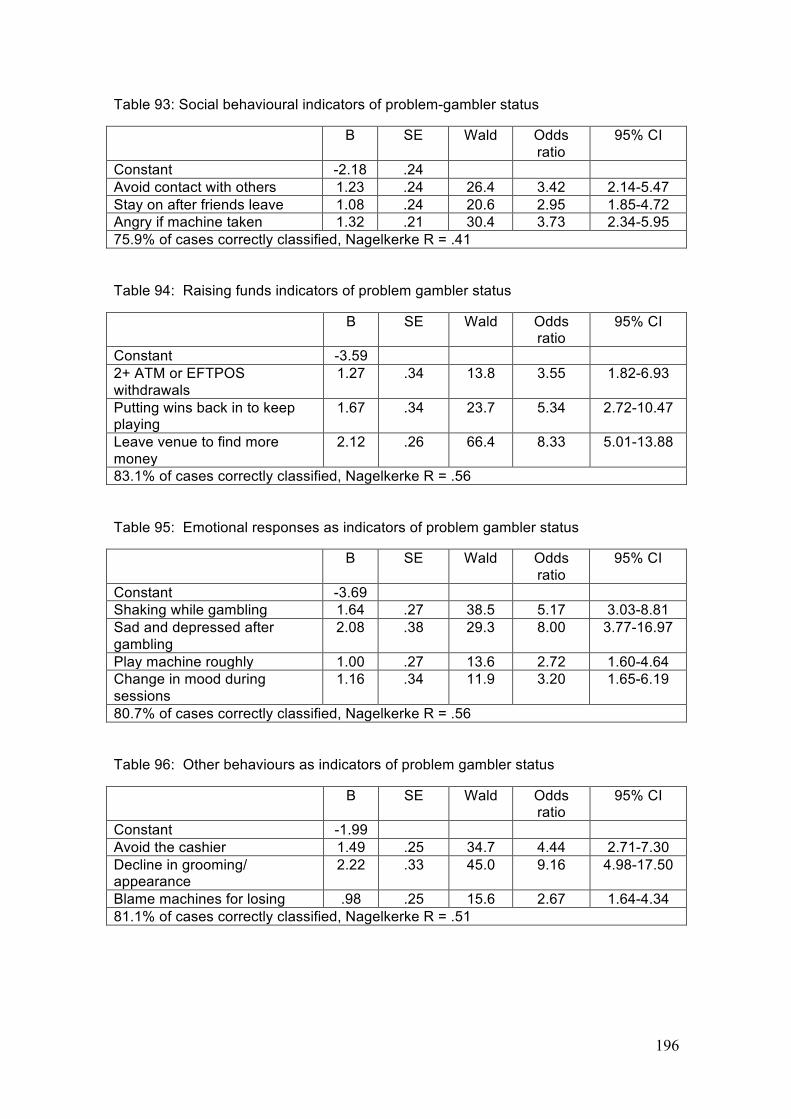
196
Table 93: Social behavioural indicators of problem-gambler status
B SE Wald Odds ratio
95% CI
Constant -2.18 .24 Avoid contact with others 1.23 .24 26.4 3.42 2.14-5.47 Stay on after friends leave 1.08 .24 20.6 2.95 1.85-4.72 Angry if machine taken 1.32 .21 30.4 3.73 2.34-5.95 75.9% of cases correctly classified, Nagelkerke R = .41 Table 94: Raising funds indicators of problem gambler status
B SE Wald Odds ratio
95% CI
Constant -3.59 2+ ATM or EFTPOS withdrawals
1.27 .34 13.8 3.55 1.82-6.93
Putting wins back in to keep playing
1.67 .34 23.7 5.34 2.72-10.47
Leave venue to find more money
2.12 .26 66.4 8.33 5.01-13.88
83.1% of cases correctly classified, Nagelkerke R = .56 Table 95: Emotional responses as indicators of problem gambler status
B SE Wald Odds ratio
95% CI
Constant -3.69 Shaking while gambling 1.64 .27 38.5 5.17 3.03-8.81 Sad and depressed after gambling
2.08 .38 29.3 8.00 3.77-16.97
Play machine roughly 1.00 .27 13.6 2.72 1.60-4.64 Change in mood during sessions
1.16 .34 11.9 3.20 1.65-6.19
80.7% of cases correctly classified, Nagelkerke R = .56 Table 96: Other behaviours as indicators of problem gambler status
B SE Wald Odds ratio
95% CI
Constant -1.99 Avoid the cashier 1.49 .25 34.7 4.44 2.71-7.30 Decline in grooming/ appearance
2.22 .33 45.0 9.16 4.98-17.50
Blame machines for losing .98 .25 15.6 2.67 1.64-4.34 81.1% of cases correctly classified, Nagelkerke R = .51
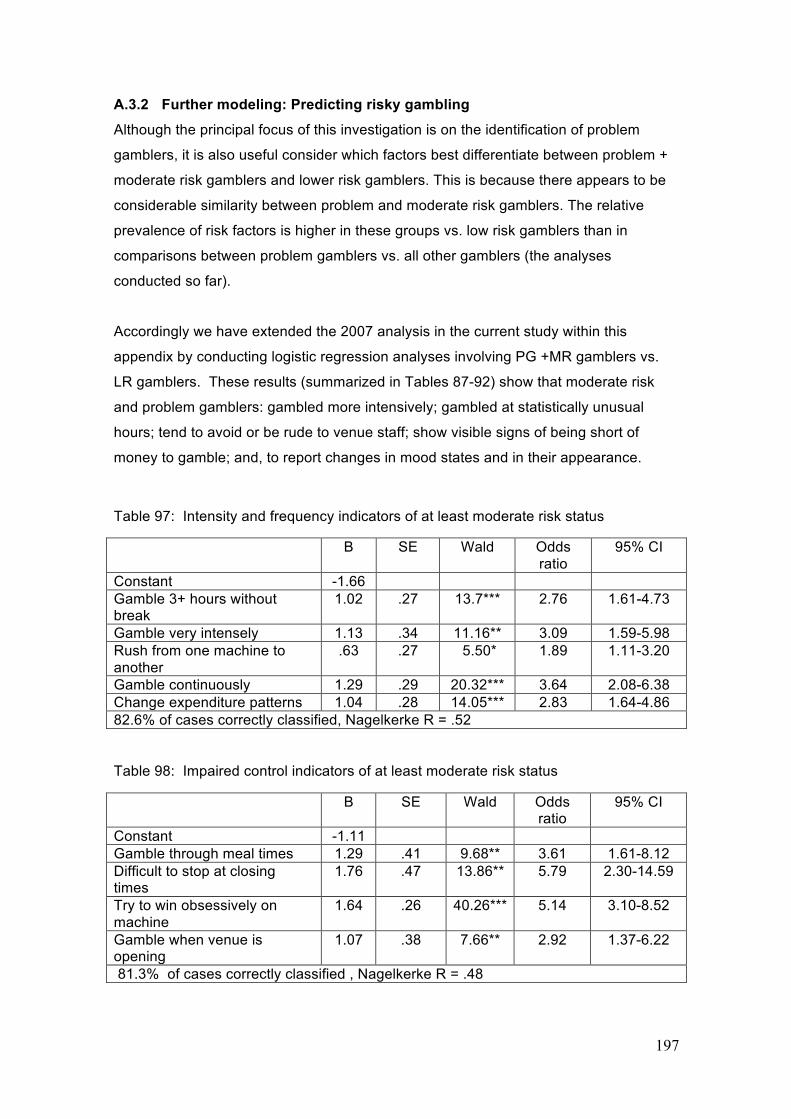
197
A.3.2 Further modeling: Predicting risky gambling
Although the principal focus of this investigation is on the identification of problem
gamblers, it is also useful consider which factors best differentiate between problem +
moderate risk gamblers and lower risk gamblers. This is because there appears to be
considerable similarity between problem and moderate risk gamblers. The relative
prevalence of risk factors is higher in these groups vs. low risk gamblers than in
comparisons between problem gamblers vs. all other gamblers (the analyses
conducted so far).
Accordingly we have extended the 2007 analysis in the current study within this
appendix by conducting logistic regression analyses involving PG +MR gamblers vs.
LR gamblers. These results (summarized in Tables 87-92) show that moderate risk
and problem gamblers: gambled more intensively; gambled at statistically unusual
hours; tend to avoid or be rude to venue staff; show visible signs of being short of
money to gamble; and, to report changes in mood states and in their appearance.
Table 97: Intensity and frequency indicators of at least moderate risk status
B SE Wald Odds ratio
95% CI
Constant -1.66 Gamble 3+ hours without break
1.02 .27 13.7*** 2.76 1.61-4.73
Gamble very intensely 1.13 .34 11.16** 3.09 1.59-5.98 Rush from one machine to another
.63 .27 5.50* 1.89 1.11-3.20
Gamble continuously 1.29 .29 20.32*** 3.64 2.08-6.38 Change expenditure patterns 1.04 .28 14.05*** 2.83 1.64-4.86 82.6% of cases correctly classified, Nagelkerke R = .52 Table 98: Impaired control indicators of at least moderate risk status
B SE Wald Odds ratio
95% CI
Constant -1.11 Gamble through meal times 1.29 .41 9.68** 3.61 1.61-8.12 Difficult to stop at closing times
1.76 .47 13.86** 5.79 2.30-14.59
Try to win obsessively on machine
1.64 .26 40.26*** 5.14 3.10-8.52
Gamble when venue is opening
1.07 .38 7.66** 2.92 1.37-6.22
81.3% of cases correctly classified , Nagelkerke R = .48
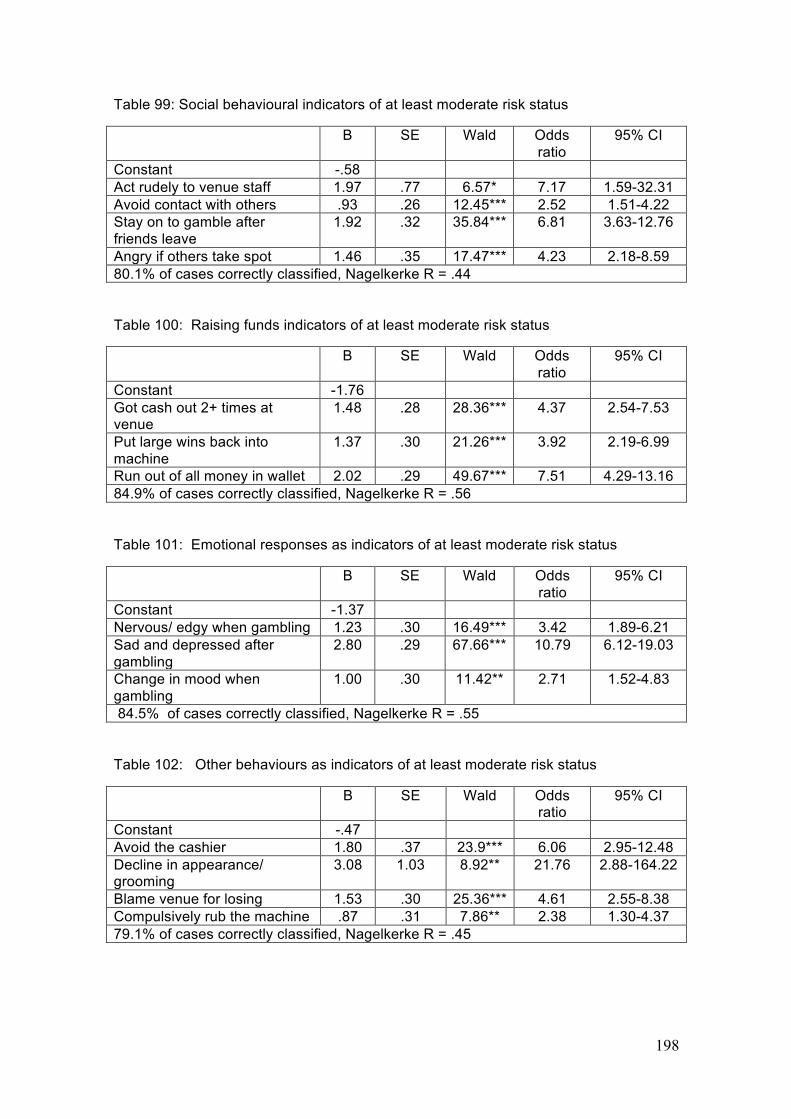
198
Table 99: Social behavioural indicators of at least moderate risk status
B SE Wald Odds ratio
95% CI
Constant -.58 Act rudely to venue staff 1.97 .77 6.57* 7.17 1.59-32.31 Avoid contact with others .93 .26 12.45*** 2.52 1.51-4.22 Stay on to gamble after friends leave
1.92 .32 35.84*** 6.81 3.63-12.76
Angry if others take spot 1.46 .35 17.47*** 4.23 2.18-8.59 80.1% of cases correctly classified, Nagelkerke R = .44 Table 100: Raising funds indicators of at least moderate risk status
B SE Wald Odds ratio
95% CI
Constant -1.76 Got cash out 2+ times at venue
1.48 .28 28.36*** 4.37 2.54-7.53
Put large wins back into machine
1.37 .30 21.26*** 3.92 2.19-6.99
Run out of all money in wallet 2.02 .29 49.67*** 7.51 4.29-13.16 84.9% of cases correctly classified, Nagelkerke R = .56 Table 101: Emotional responses as indicators of at least moderate risk status
B SE Wald Odds ratio
95% CI
Constant -1.37 Nervous/ edgy when gambling 1.23 .30 16.49*** 3.42 1.89-6.21 Sad and depressed after gambling
2.80 .29 67.66*** 10.79 6.12-19.03
Change in mood when gambling
1.00 .30 11.42** 2.71 1.52-4.83
84.5% of cases correctly classified, Nagelkerke R = .55 Table 102: Other behaviours as indicators of at least moderate risk status
B SE Wald Odds ratio
95% CI
Constant -.47 Avoid the cashier 1.80 .37 23.9*** 6.06 2.95-12.48 Decline in appearance/ grooming
3.08 1.03 8.92** 21.76 2.88-164.22
Blame venue for losing 1.53 .30 25.36*** 4.61 2.55-8.38 Compulsively rub the machine .87 .31 7.86** 2.38 1.30-4.37 79.1% of cases correctly classified, Nagelkerke R = .45
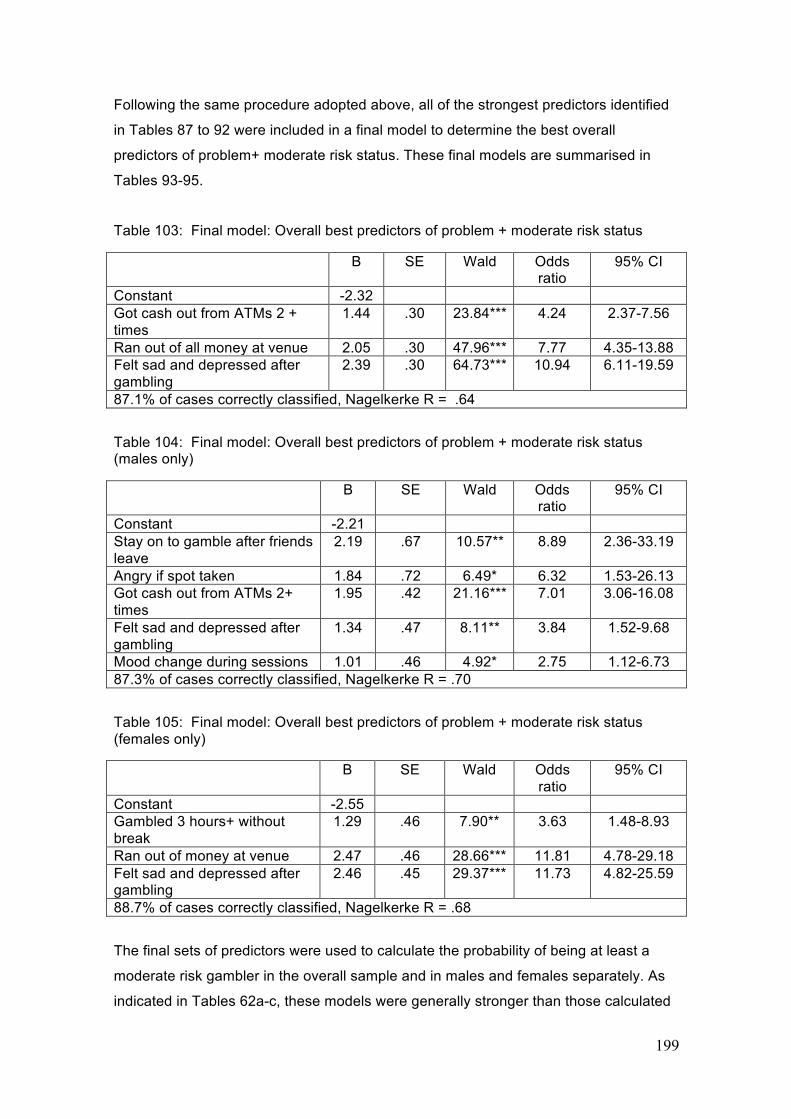
199
Following the same procedure adopted above, all of the strongest predictors identified
in Tables 87 to 92 were included in a final model to determine the best overall
predictors of problem+ moderate risk status. These final models are summarised in
Tables 93-95.
Table 103: Final model: Overall best predictors of problem + moderate risk status
B SE Wald Odds ratio
95% CI
Constant -2.32 Got cash out from ATMs 2 + times
1.44 .30 23.84*** 4.24 2.37-7.56
Ran out of all money at venue 2.05 .30 47.96*** 7.77 4.35-13.88 Felt sad and depressed after gambling
2.39 .30 64.73*** 10.94 6.11-19.59
87.1% of cases correctly classified, Nagelkerke R = .64
Table 104: Final model: Overall best predictors of problem + moderate risk status (males only)
B SE Wald Odds ratio
95% CI
Constant -2.21 Stay on to gamble after friends leave
2.19 .67 10.57** 8.89 2.36-33.19
Angry if spot taken 1.84 .72 6.49* 6.32 1.53-26.13 Got cash out from ATMs 2+ times
1.95 .42 21.16*** 7.01 3.06-16.08
Felt sad and depressed after gambling
1.34 .47 8.11** 3.84 1.52-9.68
Mood change during sessions 1.01 .46 4.92* 2.75 1.12-6.73 87.3% of cases correctly classified, Nagelkerke R = .70
Table 105: Final model: Overall best predictors of problem + moderate risk status (females only)
B SE Wald Odds ratio
95% CI
Constant -2.55 Gambled 3 hours+ without break
1.29 .46 7.90** 3.63 1.48-8.93
Ran out of money at venue 2.47 .46 28.66*** 11.81 4.78-29.18 Felt sad and depressed after gambling
2.46 .45 29.37*** 11.73 4.82-25.59
88.7% of cases correctly classified, Nagelkerke R = .68
The final sets of predictors were used to calculate the probability of being at least a
moderate risk gambler in the overall sample and in males and females separately. As
indicated in Tables 62a-c, these models were generally stronger than those calculated
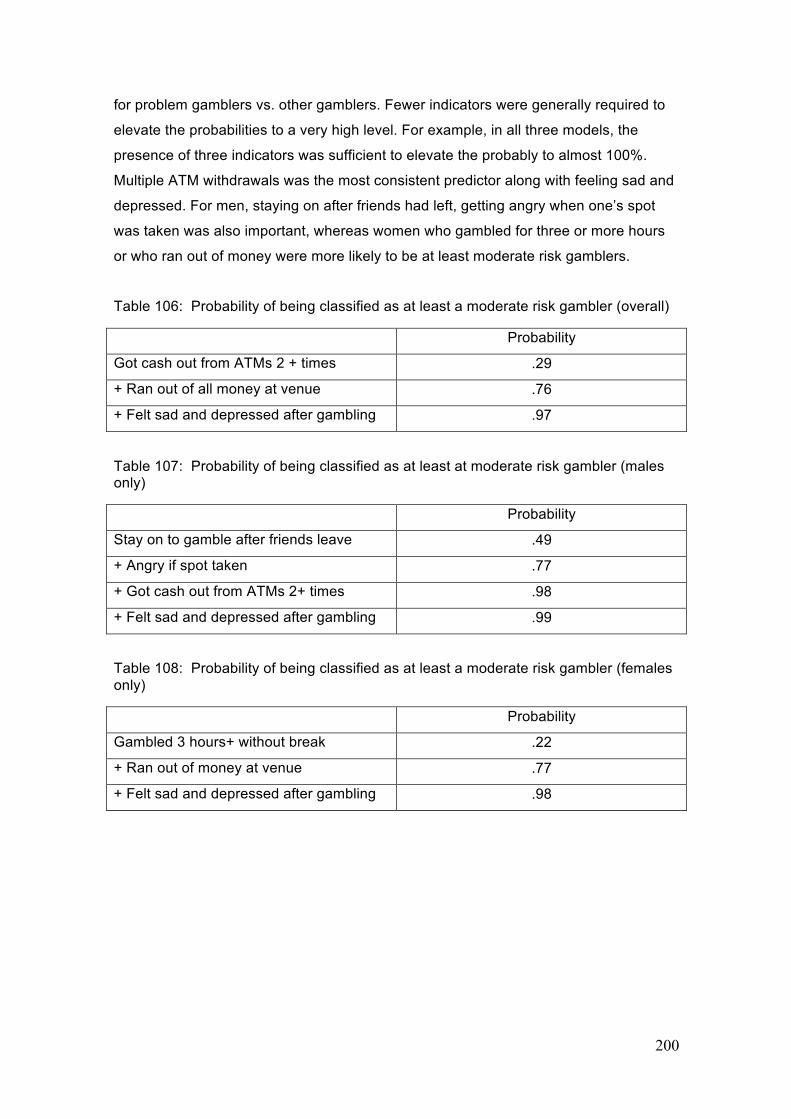
200
for problem gamblers vs. other gamblers. Fewer indicators were generally required to
elevate the probabilities to a very high level. For example, in all three models, the
presence of three indicators was sufficient to elevate the probably to almost 100%.
Multiple ATM withdrawals was the most consistent predictor along with feeling sad and
depressed. For men, staying on after friends had left, getting angry when one’s spot
was taken was also important, whereas women who gambled for three or more hours
or who ran out of money were more likely to be at least moderate risk gamblers.
Table 106: Probability of being classified as at least a moderate risk gambler (overall)
Probability
Got cash out from ATMs 2 + times .29
+ Ran out of all money at venue .76
+ Felt sad and depressed after gambling .97
Table 107: Probability of being classified as at least at moderate risk gambler (males only)
Probability
Stay on to gamble after friends leave .49
+ Angry if spot taken .77
+ Got cash out from ATMs 2+ times .98
+ Felt sad and depressed after gambling .99
Table 108: Probability of being classified as at least a moderate risk gambler (females only)
Probability
Gambled 3 hours+ without break .22
+ Ran out of money at venue .77
+ Felt sad and depressed after gambling .98

201
APPENDIX B: The Gambling Behaviour Checklist
Important information for users of the Gambling Behaviour Checklist Appendix B contains three versions of the Gambling Behaviour Checklist:
(1) The first version is for use by EGM staff in in Victorian venues (GBC-EGM-
SV; 30 items).
(2) The second version is for use by EGM staff located elsewhere in Australia or
in other countries (GBC-EGM-S; 32 items). Users of the checklist may find that they
need to modify some items to reflect the characteristics of the gambling jurisdiction in
which their research is undertaken. For example, the item, ‘Finds it difficult to stop
gambling at closing time’ would not be useful for staff working in a 24-hour Las Vegas
casino and should be removed from the checklist for use in that environment.
(3) The third version is for researchers (GBC-EGM-R; 36 items) interested in a
checklist that carries forward the improvements to item wording, sequencing and
exemplification improvements made in Stage Two of this report, a greater range of
distinct behaviours than that offered by the staff versions, and checklist findings that
are easy to compare with the data presented in Delfabbro et al 2007, the current report
and papers arising, due to the retention of the Stage One GBC-EGM item distinctions.
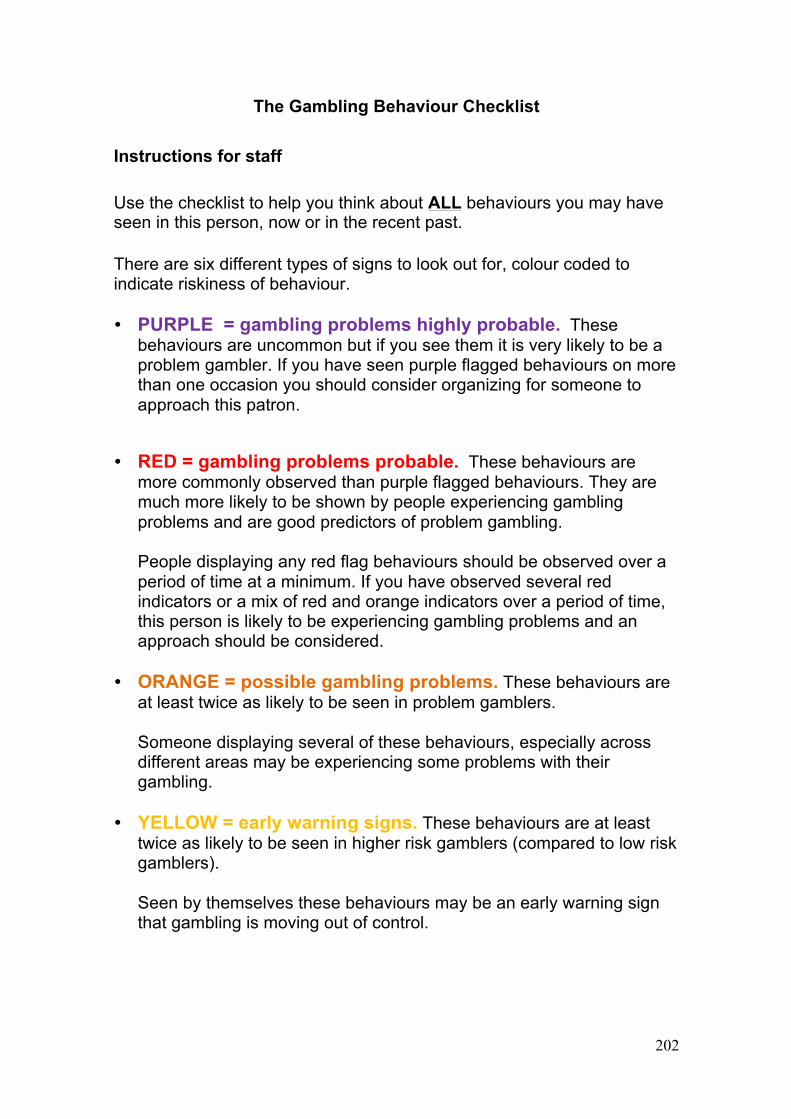
202
The Gambling Behaviour Checklist Instructions for staff
Use the checklist to help you think about ALL behaviours you may have seen in this person, now or in the recent past. There are six different types of signs to look out for, colour coded to indicate riskiness of behaviour. • PURPLE = gambling problems highly probable. These
behaviours are uncommon but if you see them it is very likely to be a problem gambler. If you have seen purple flagged behaviours on more than one occasion you should consider organizing for someone to approach this patron.
• RED = gambling problems probable. These behaviours are more commonly observed than purple flagged behaviours. They are much more likely to be shown by people experiencing gambling problems and are good predictors of problem gambling. People displaying any red flag behaviours should be observed over a period of time at a minimum. If you have observed several red indicators or a mix of red and orange indicators over a period of time, this person is likely to be experiencing gambling problems and an approach should be considered.
• ORANGE = possible gambling problems. These behaviours are at least twice as likely to be seen in problem gamblers. Someone displaying several of these behaviours, especially across different areas may be experiencing some problems with their gambling.
• YELLOW = early warning signs. These behaviours are at least twice as likely to be seen in higher risk gamblers (compared to low risk gamblers). Seen by themselves these behaviours may be an early warning sign that gambling is moving out of control.

203
GBC-EGM-SV: The Gambling Behaviour Checklist for EGM Staff in Victoria
Loss of Control Tick 1 Tries obsessively to win on one machine 2 Gambles right through normal meal times 3 Finds it difficult to stop gambling at closing time 4 Starts gambling when the venue is opening or only stops when venue is closing Money Seeking Tick
5 Gets cash out on 2 or more occasions through EFTPOS 6 Puts large wins back into the machine and keeps playing 7 Has run out of all money when he/she leaves venue 8 Leaves venue to find money to continue gambling 9 Asks to change large notes at venue before gambling
10 Rummages around in purse or wallet for additional money
11 Witnessed or heard that a customer was trying to borrow money from other people at venue or asking for credit from venue
Intensity and Duration Tick 12 Spends $300 or more in a session 13 Often gambles for long periods (3+ hours) without a proper break 14 Bets $3 or more per spin most of the time 15 Plays very fast 16 Gambles on 2 or more machines at once 17 Gambles intensely without reacting to what’s going on around him/her 18 Gambles most days 19 Rushes from 1 machine to another 20 Significant increase in spending pattern
Irrational and Superstitious Behaviour Tick 21 Complains to staff about losing, or blames venue or machines for losing
22 Rituals or superstitious behaviours such as rubbing belly of machine or screen, talking to machine, spitting on machine, use of luck charms
Emotional Responses Tick
23 Shows signs of distress after gambling (looks sad/depressed, crying, holding head in hands, nervous/edgy, shaking, sweating)
24 Gets angry while gambling (kicking, hitting machines, swearing, grunting or groaning, playing roughly/aggressively)
Social Behaviour Tick 25 Stays on to gamble when friends leave venue 26 Is rude or impolite to venue staff 27 Becomes angry or stands over others if someone takes their favourite machine/spot 28 Avoids contact or conversation with others
29 Generally poor hygiene, or, significant decline in personal grooming or appearance over several days (body odors, dirty or unchanged clothes, messy greasy hair)
30 Conceals presence at venue (doesn’t answer mobile phone, takes or makes calls outside venue, asks staff not to let others know they are there, people contact or visit venue looking for person)
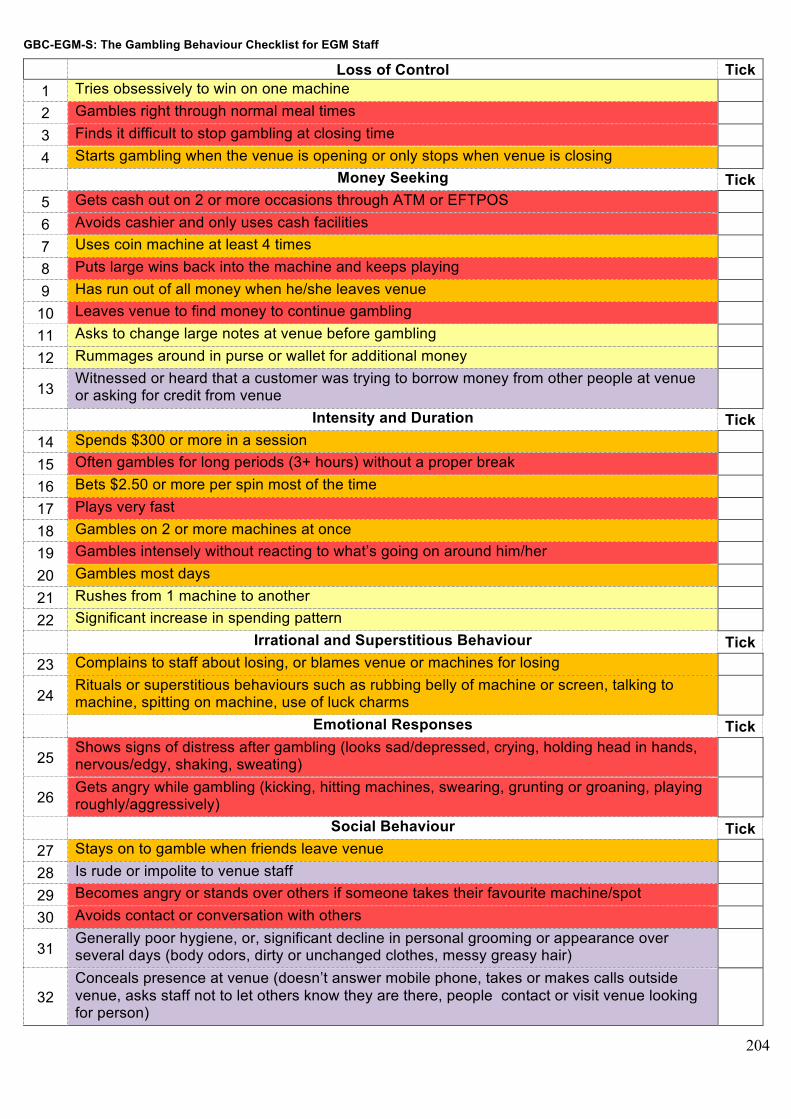
204
GBC-EGM-S: The Gambling Behaviour Checklist for EGM Staff
Loss of Control Tick 1 Tries obsessively to win on one machine 2 Gambles right through normal meal times 3 Finds it difficult to stop gambling at closing time 4 Starts gambling when the venue is opening or only stops when venue is closing Money Seeking Tick
5 Gets cash out on 2 or more occasions through ATM or EFTPOS 6 Avoids cashier and only uses cash facilities 7 Uses coin machine at least 4 times 8 Puts large wins back into the machine and keeps playing 9 Has run out of all money when he/she leaves venue
10 Leaves venue to find money to continue gambling 11 Asks to change large notes at venue before gambling 12 Rummages around in purse or wallet for additional money
13 Witnessed or heard that a customer was trying to borrow money from other people at venue or asking for credit from venue
Intensity and Duration Tick 14 Spends $300 or more in a session 15 Often gambles for long periods (3+ hours) without a proper break 16 Bets $2.50 or more per spin most of the time 17 Plays very fast 18 Gambles on 2 or more machines at once 19 Gambles intensely without reacting to what’s going on around him/her 20 Gambles most days 21 Rushes from 1 machine to another 22 Significant increase in spending pattern
Irrational and Superstitious Behaviour Tick 23 Complains to staff about losing, or blames venue or machines for losing
24 Rituals or superstitious behaviours such as rubbing belly of machine or screen, talking to machine, spitting on machine, use of luck charms
Emotional Responses Tick
25 Shows signs of distress after gambling (looks sad/depressed, crying, holding head in hands, nervous/edgy, shaking, sweating)
26 Gets angry while gambling (kicking, hitting machines, swearing, grunting or groaning, playing roughly/aggressively)
Social Behaviour Tick 27 Stays on to gamble when friends leave venue 28 Is rude or impolite to venue staff 29 Becomes angry or stands over others if someone takes their favourite machine/spot 30 Avoids contact or conversation with others
31 Generally poor hygiene, or, significant decline in personal grooming or appearance over several days (body odors, dirty or unchanged clothes, messy greasy hair)
32 Conceals presence at venue (doesn’t answer mobile phone, takes or makes calls outside venue, asks staff not to let others know they are there, people contact or visit venue looking for person)
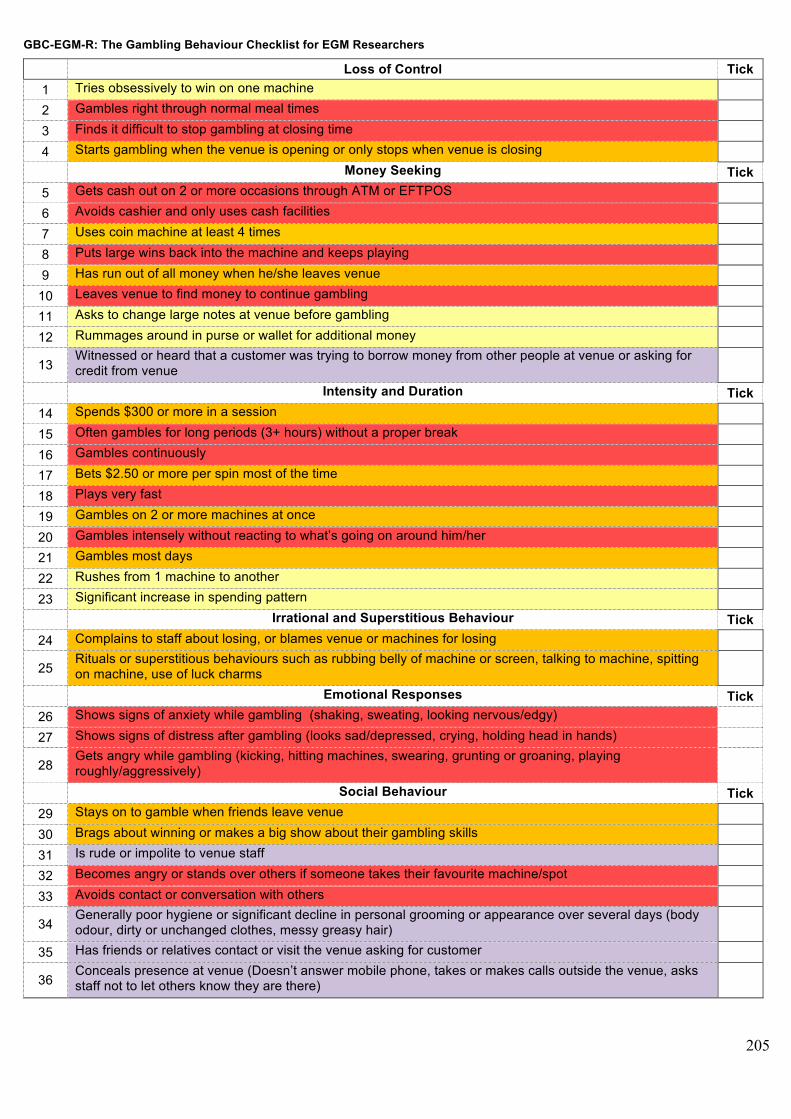
205
GBC-EGM-R: The Gambling Behaviour Checklist for EGM Researchers
Loss of Control Tick 1 Tries obsessively to win on one machine 2 Gambles right through normal meal times 3 Finds it difficult to stop gambling at closing time 4 Starts gambling when the venue is opening or only stops when venue is closing Money Seeking Tick
5 Gets cash out on 2 or more occasions through ATM or EFTPOS 6 Avoids cashier and only uses cash facilities 7 Uses coin machine at least 4 times 8 Puts large wins back into the machine and keeps playing 9 Has run out of all money when he/she leaves venue
10 Leaves venue to find money to continue gambling 11 Asks to change large notes at venue before gambling 12 Rummages around in purse or wallet for additional money
13 Witnessed or heard that a customer was trying to borrow money from other people at venue or asking for credit from venue
Intensity and Duration Tick 14 Spends $300 or more in a session 15 Often gambles for long periods (3+ hours) without a proper break 16 Gambles continuously 17 Bets $2.50 or more per spin most of the time 18 Plays very fast 19 Gambles on 2 or more machines at once 20 Gambles intensely without reacting to what’s going on around him/her 21 Gambles most days 22 Rushes from 1 machine to another 23 Significant increase in spending pattern
Irrational and Superstitious Behaviour Tick 24 Complains to staff about losing, or blames venue or machines for losing
25 Rituals or superstitious behaviours such as rubbing belly of machine or screen, talking to machine, spitting on machine, use of luck charms
Emotional Responses Tick 26 Shows signs of anxiety while gambling (shaking, sweating, looking nervous/edgy) 27 Shows signs of distress after gambling (looks sad/depressed, crying, holding head in hands)
28 Gets angry while gambling (kicking, hitting machines, swearing, grunting or groaning, playing roughly/aggressively)
Social Behaviour Tick 29 Stays on to gamble when friends leave venue
30 Brags about winning or makes a big show about their gambling skills
31 Is rude or impolite to venue staff
32 Becomes angry or stands over others if someone takes their favourite machine/spot
33 Avoids contact or conversation with others
34 Generally poor hygiene or significant decline in personal grooming or appearance over several days (body odour, dirty or unchanged clothes, messy greasy hair)
35 Has friends or relatives contact or visit the venue asking for customer
36 Conceals presence at venue (Doesn’t answer mobile phone, takes or makes calls outside the venue, asks staff not to let others know they are there)