Embed Size (px)
Citation preview
Validity of the Hogan Personality Inventory and
Hogan Development Survey for the Leader BASIS
Documentation of Evidence for Validity Generalization and Criterion-Related
Validity
2013
T E C H N I C A L R E P O R T
www.mentisglobal.com Distributed by Mentis [email protected]
2 Copyright Hogan Assessment Systems, Inc. 2013. All rights reserved.
EXECUTIVE SUMMARY
This report (a) summarizes the research procedures Hogan used to establish the validity of the Hogan Personality Inventory (HPI) and Hogan Development Survey (HDS) for selecting top performers in leadership jobs using the Hogan Leader BASIS and (b) presents evidence demonstrating the Leader BASIS cutoff scores predict performance in leadership jobs.
To establish criterion-related validity evidence for the cutoff scores used in the Leader BASIS, Hogan pooled and analyzed data from criterion studies for leadership jobs from the Hogan archive. The pooled leadership sample represented 10 companies across 7 industries. The study results demonstrate that the Leader BASIS cutoff scores predict overall performance ratings using the pooled sample of leaders. Analyses using a simulated leader applicant pool indicate the recommended Moderate Fit cutoff scores should result in no adverse impact.
Hogan recommends the completion of a local validation study and accumulation of business utility data (when feasible) to evaluate the effectiveness of Leader BASIS cutoff scores. Until sufficient company-specific assessment and performance data are available, we recommend using these results in conjunction with other applicant information to drive selection decisions.
www.mentisglobal.com Distributed by Mentis [email protected]
3 Copyright Hogan Assessment Systems, Inc. 2013. All rights reserved.
CONTENTS
EXECUTIVE SUMMARY 2
CONTENTS 3
TABLES & FIGURES 5
1 – INTRODUCTION 6
1.1 Foundation .................................................................................................. 6
1.2 Overview ...................................................................................................... 6
1.3 Study Selection and Dates of Leader BASIS Study. ................................. 6
1.4 Problem and Setting ................................................................................... 7
2 – DESCRIPTION OF SELECTION PROCEDURES 8
2.1 Approach and Rationale ............................................................................. 8
2.2 What to Measure and Why ......................................................................... 8
2.3 Personality as a Predictor of Important Outcomes ................................ 10
2.4 The Hogan Personality Inventory (HPI). ................................................... 11
2.5 HPI Description and Development .......................................................... 13
2.6 The Hogan Development Survey (HDS). ................................................. 16
2.7 HDS Description and Development ......................................................... 17
3 – HPI & HDS SCALES USED IN LEADER BASIS 20
3.1 HPI & Leader BASIS ................................................................................. 20
3.2 HDS & Leader BASIS. .............................................................................. 21
3.3 Leader BASIS Scoring Guidelines ............................................................ 23
4 – CRITERION-RELATED VALIDITY EVIDENCE 25
4.1 Criterion-Related Validity Samples. ......................................................... 26
4.2 Criterion-Related Validity Results. ........................................................... 27
4.3 Adverse Impact ......................................................................................... 29
www.mentisglobal.com Distributed by Mentis [email protected]
4 Copyright Hogan Assessment Systems, Inc. 2013. All rights reserved.
5 – USES AND APPLICATIONS 32
5.1 Accuracy and Completeness .................................................................... 32
REFERENCES 34
www.mentisglobal.com Distributed by Mentis [email protected]
5 Copyright Hogan Assessment Systems, Inc. 2013. All rights reserved.
TABLES & FIGURES
Table 2.1 Correlations between Goldberg’s Big-Five Markers and the HPI Scales ................................................................................................................... 12
Table 2.2 Correlations between the PCI Primary Scales and the HPI Scales .. 12
Table 2.3 Correlations between the IP/5F and the HPI Scales ........................ 12
Table 2.4 Correlations between the NEO-PI-R and the HPI Scales .................. 12
Figure 2.1 Relationships between FFM Inventories and the HPI Scales ......... 13
Table 3.1 Meta-Analytic Correlations between HPI Scales and Leader Performance ......................................................................................................... 21
Table 3.2 Leader BASIS Cutoff Scores ............................................................... 24
Table 4.1 Composition of Leader Criterion Sample by Industry ....................... 26
Table 4.2 HPI and HDS Means and Standard Deviations ................................. 27
Table 4.3 Correlation between Leader BASIS Cutoff Scores and Overall Performance ......................................................................................................... 27
Figure 4.1 Above Average Leaders by Leader BASIS Fit Levels ....................... 28
Figure 4.2 Top 15% Leaders by Leader BASIS Fit Levels .................................. 28
Figure 4.3 Bottom 15% Leaders by Leader BASIS Fit Levels ........................... 29
Table 4.4 Effects of Applying Recommended HPI Cutoff Scores to the General Hogan Archival Sample—Selection Rates and Adverse Impact Ratios by Demographic Group ............................................................................................. 31
Table 4.5 Effects of Applying Recommended HPI Cutoff Scores to the Leader Hogan Archival Sample—Selection Rates and Adverse Impact Ratios by Demographic Group ............................................................................................. 31
www.mentisglobal.com Distributed by Mentis [email protected]
6 Copyright Hogan Assessment Systems, Inc. 2013. All rights reserved.
1 – INTRODUCTION
1.1 Foundation. This report provides a technical summary of research conducted to evaluate the validity of the Hogan Leader BASIS. The Leader BASIS uses scales from the Hogan Personality Inventory (R. Hogan & J. Hogan, 2007; hereafter “HPI”) and Hogan Development Survey (R. Hogan & J. Hogan, 2009; hereafter “HDS”) to predict performance in leadership jobs. The research conforms to standards outlined in the Uniform Guidelines on Employee Selection Procedures (Equal Employment Opportunity Commission, 1978; hereafter “Uniform Guidelines”), The Principles for the Validation and Use of Personnel Selection Procedures (Society for Industrial and Organizational Psychology, 2003; hereafter “Principles”), and the Standards for Educational and Psychological Testing (American Educational Research Association, 1999; hereafter “Standards”). In areas where the Uniform Guidelines, Principles and/or Standards proved vague or inapplicable, the research approach relied on the broader scientific/professional literature for guidance.
1.2 Overview. We organized this document in the following sections:
Introduction – project overview
Description of Selection Procedures – review of predictors
Leader BASIS Description – review of scales used in profile
Criterion-Related Validity Evidence – predicting leader performance
Applications and Uses – best practices for use
1.3 Study Selection and Dates of Leader BASIS Study. As an international authority in personality assessment and consulting, Hogan has over 25 years of experience helping businesses reduce turnover and increase productivity by hiring the right people, developing key talent, and evaluating leadership potential. We obtained data for this study from the Hogan archive, which contains hundreds of studies from the past 25 years.
Hogan conducted research described in this report between December 2012 and February 2013. We identified 10 criterion-related validation studies for leadership jobs in the Hogan archive. These studies represented 660 leaders across multiple industries and contained both assessment and overall job performance data (e.g., supervisor performance ratings). We pooled and analyzed these data to establish criterion-related validation evidence for the Leader BASIS.
www.mentisglobal.com Distributed by Mentis [email protected]
7 Copyright Hogan Assessment Systems, Inc. 2013. All rights reserved.
1.4 Problem and Setting. Valid selection processes are critical for selecting talented leaders who will contribute to the long-term success of any company. The complexities of recruiting and a dynamic job market warrant continuous evaluation and improvement of an organization’s selection process for leadership jobs. Valid personality assessments can enhance this process by providing job-relevant information that cannot be obtained through other common techniques, such as application blanks, background checks, and reference checks.
www.mentisglobal.com Distributed by Mentis [email protected]
8 Copyright Hogan Assessment Systems, Inc. 2013. All rights reserved.
2 – DESCRIPTION OF SELECTION PROCEDURES
2.1 Approach and Rationale. Validating any selection instrument relies on accurate measurement. Measurement consists of any procedure that assigns numbers systematically to characteristic features of people according to explicit rules (Ghiselli, Campbell, & Zedeck, 1981). Professionals use these numbers to make predictions or forecast future behavior(s). Assigning numbers in a systematic fashion to characteristics is a necessary, but not sufficient, requirement of any pre-employment selection tool. Every instrument should also provide evidence to support (a) the reliability of the instrument and (b) relationships between scores on the instrument and job-relevant behaviors or outcomes (Equal Employment Opportunity Commission, 1978). At a minimum, professionals should evaluate the reliability of assessments in terms of the degree to which (a) items or questions on a scale relate to one another (internal item consistency) and (b) results or scores remain stable over time (test-retest reliability).
Test publishers should document an assessment’s ability to predict job-relevant behaviors or outcomes. The supporting evidence should include significant and interpretable relations between scores on the instrument and indices of job performance, and should appear in credible scientific sources. Moreover, evidence should also demonstrate scores on the instrument predict job performance criteria critical to success in the job of interest, rather than an ability to predict performance outcomes unrelated to critical work or behaviors.
Assessment instruments should also be “fair,” in that they should not discriminate unfairly on the basis of gender, age, or race (Equal Employment Opportunity Commission, 1978). As such, professionals must validate selection procedures that result in adverse impact in accordance with the Uniform Guidelines. Unfortunately, many instruments currently used in applied contexts fail to meet these criteria (R. Hogan, J. Hogan, & Trickey, 1999).
2.2 What to Measure and Why. For personality assessment, the most important question is “What should we measure?” Historically, the answer depended on an author’s personal interests (e.g., Locus of Control; Rotter, 1966), practical concerns (e.g., Minnesota Multiphasic Personality Inventory; Hathaway & McKinley, 1943), or theory (e.g., Myers-Briggs Type Indicator; Briggs-Meyers, McCaulley, Quenk, & Hammer, 1998; Thematic Apperception Test; Morgan & Murray, 1935). Multi-dimensional personality inventories developed during the 1940s and 1950s measured traits, or hypothetical structures believed to underlie differences in social behavior (cf. Allport, 1937). Early approaches to personality inventory construction led to more advanced test development strategies and improved the quality and interpretability of the instruments.
www.mentisglobal.com Distributed by Mentis [email protected]
9 Copyright Hogan Assessment Systems, Inc. 2013. All rights reserved.
Current thinking in personality assessment converges on the idea that most personality characteristics reflect five broad personality dimensions. The Five-Factor Model (FFM; cf. Digman, 1990; Goldberg, 1992; John, 1990, p. 72; McCrae & Costa, 1987), which emerged from 50 years of factor analytic research on the structure of observer ratings (cf. Norman, 1963; Thurstone, 1934; Tupes & Christal, 1961), suggests we think about and describe others and ourselves (Goldberg, 1990) in terms of five themes:
I. Surgency/Extraversion - The degree to which a person is outgoing and talkative.
II. Agreeableness - The degree to which a person is rewarding to deal with and pleasant.
III. Conscientiousness - The degree to which a person complies with rules, norms, and standards.
IV. Emotional Stability - The degree to which a person appears calm and self-accepting.
V. Intellect/Openness to Experience - The degree to which a person seems creative and open-minded.
The FFM provides the starting point for several prominent personality inventories constructed in the last 25 years (e.g., NEO-PI: Costa & McCrae, 1992; HPI: R. Hogan & J. Hogan, 1995, 2007; Personal Characteristics Inventory: Mount & Barrick, 2001). The five dimensions provide a useful taxonomy for classifying individual differences in social behavior (i.e., reputation). Evidence suggests all existing multidimensional personality inventories conform, with little difficulty, to these five dimensions (Wiggins & Pincus, 1992). Consequently, the FFM represents the dominant paradigm for current research in personality assessment (De Raad & Perugini, 2002; R. Hogan & J. Hogan, 1995, 2007).
The FFM emerged from observer’s descriptions of others, which form the basis of one’s reputation (R. Hogan, 1983). Reputations grow from social consensus regarding consistencies in a person's behavior, and develop from behavior during social and occupational interaction. These behaviors consist, at least in part, of actions designed to establish, defend, or enhance a person's identity, or view of him or herself (cf. Goffman, 1958). Reputations are public, tell us about observable tendencies, can be measured reliably, and can be used to forecast future behavior (cf. Emler, 1990). Consequently, a person’s reputation represents an invaluable source of information about work-related strengths and shortcomings and influences the direction of careers.
www.mentisglobal.com Distributed by Mentis [email protected]
10 Copyright Hogan Assessment Systems, Inc. 2013. All rights reserved.
2.3 Personality as a Predictor of Important Outcomes. Personality assessment samples self-presentational behavior, or how a person portrays him or herself to others on the job. A personality assessment allows us to aggregate these behavioral samples, assign them numbers according to certain agreed-upon rules, and then use these numbers or scores to make predictions about a person's future behavior. More importantly, personality measurement provides highly meaningful information, as previous research shows personality predicts numerous work and non-work related outcomes. Hough and Oswald (2008) provides a summary of the value of applied personality assessment.
For example, personality predicts a number of major life outcomes, such as academic achievement, mortality, divorce, subjective well-being, and occupational attainment (Lievens, Ones, & Dilchert, 2009; O’Connor & Paunonen, 2007; Roberts, Kuncel, Shiner, Caspi, & Goldberg, 2007; Rothstein, Paunonen, Rush, & King, 1994; Steel, Schmidt, & Shulz, 2008). Also, research demonstrates that personality predicts health-related behaviors, including the use of drugs and alcohol (Bogg & Roberts, 2004; Cooper-Hakim & Viswesvaran, 2002; Paunonen, Haddock, Forsterling, & Keinonen, 2003; Roberts, Chernyshenko, Stark, & Goldberg, 2005). Illustrating the value of personality across contexts, Ozer and Benet-Martinez (2006) note that personality dispositions relate to (a) happiness, physical and psychological health, spirituality, and identity at the individual level; (b) the quality of relationships with others at the interpersonal level; and (c) occupational choice, satisfaction, performance, community involvement, criminal activity, and political ideology at the social/institutional level. Additional research illustrates the value of personality for predicting work-related outcomes. For example, researchers consistently find that personality predicts overall job performance (e.g., Barrick, Mount, & Judge, 2001; Dudley, Orvis, Lebiecki, & Cortina, 2006; J. Hogan & Holland, 2003; Oh, Wang, & Mount, 2011), task performance (Dudley et al., 2006; Hurtz & Donovan, 2000), expatriate performance (Mol, Born, Willemsen, & Van Der Molen, 2005), and performance in teams (Peeters, Van Tuijl, Rutte, & Reymen, 2006). Furthermore, personality not only predicts performance, but predicts changes in performance over time (Minbashian, Earl, & Bright, 2013) and long term career success (Wille, De Fruyt, & Feys, 2013). Also, personality predicts a range of contextual performance variables including Organizational Citizenship Behaviors (OCBs), altruism, job dedication, interpersonal facilitation, employability, and generalized compliance (Borman, Penner, Allen, & Motowidlo, 2001; Chiaburu, Oh, Berry, Li, & Gardner, 2011; Dudley et al., 2006; R. Hogan, Chamorro-Premuzic, & Kaiser, 2013; Hurtz & Donovan, 2000; LePine, Erez, & Johnson, 2002; Organ & Ryan, 1995; Panaccio & Vandenberghe, 2012).
www.mentisglobal.com Distributed by Mentis [email protected]
11 Copyright Hogan Assessment Systems, Inc. 2013. All rights reserved.
Regarding specific work skills and individual competence, researchers report that personality predicts training performance and skill acquisition (Barrick & Mount, 1991; Barrick et al., 2001; Colquitt, LePine, & Noe, 2000), goal setting (Judge & Ilies, 2002; Steel, 2007), creativity and innovation (Feist, 1998; Furnham, Crump, Batey, & Chamorro-Premuzic, 2009; Hough, 1992; Hough & Dilchert, 2007), teamwork (Barrick, Mount, & Gupta, 2003; J. Hogan & Holland, 2003; O’Neill & Allen, 2011), safety (J. Hogan & Foster, 2013), and job and career satisfaction (Judge, Heller, & Mount, 2002; Ng, Eby, Sorensen, & Feldman, 2005). Among leaders and managers, personality shows significant correlations with overall managerial effectiveness, promotion, and managerial level (Hough, Ones, & Viswesvaran, 1998), ethical leader behavior (Kalshoven, Den Hartog, & De Hoogh, 2011), and leader emergence and effectiveness (Bono & Judge, 2004; Ensari, Riggio, Christian, & Carslaw, 2011; Judge, Bono, Ilies, & Gerhardt, 2002). Organizations can use personality measures to identify employees likely to engage in Counterproductive Work Behaviors (CWBs), or behaviors that violate an organization’s norms, potentially causing harm to the organization or its members (Berry, Ones, & Sackett, 2007; Gruys & Sackett, 2003; Jensen & Patel, 2011). Personality-based integrity tests predict more specific negative outcomes such as theft, disciplinary actions, and absenteeism (Ones, Viswesvaran, & Schmidt, 1993, 2003; Van Iddekinge, Roth, Raymark, & Odle-Dusseau, 2012). Considering the applied value of personality in predicting a range of important business-related outcomes without unfairly discriminating against individuals based on age, race/ethnicity, or gender, it is advantageous for organizations to use personality assessment to predict job performance. In addition, evaluations of predictive effectiveness and operational validity of assessment inventories are essential to demonstrate business necessity.
The next section describes the Hogan Personality Inventory (HPI), a reliable, valid, and well-established assessment instrument.
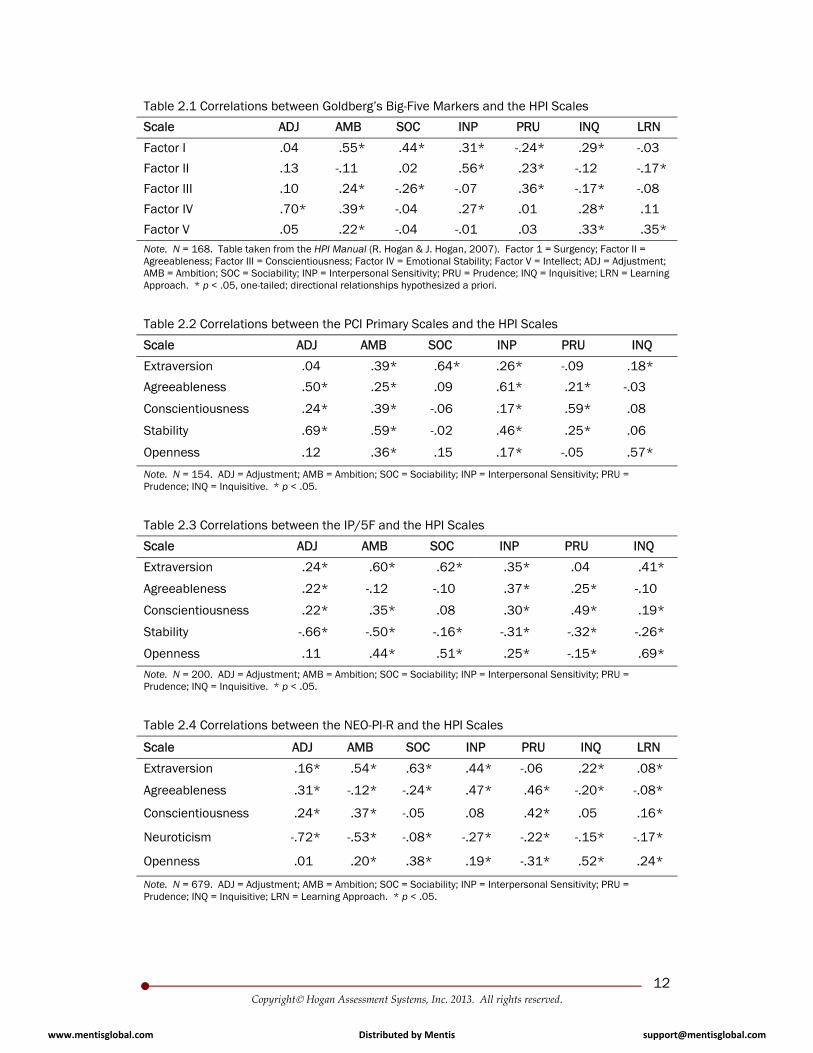
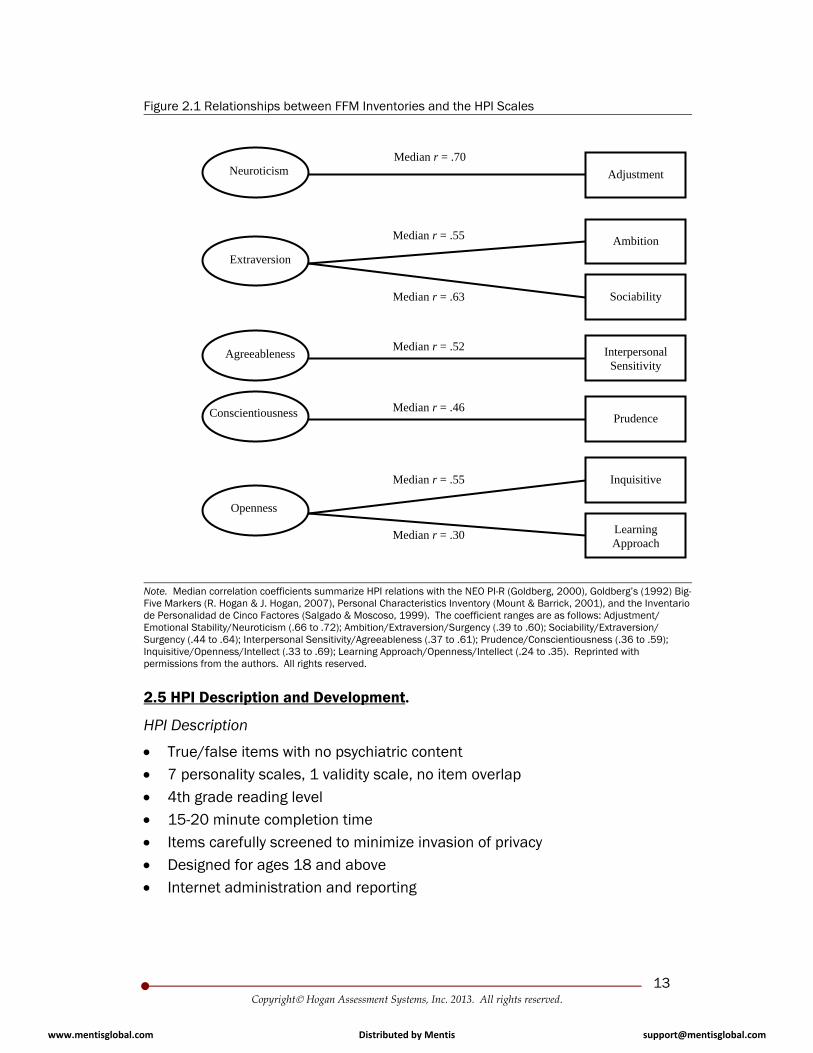
2.4 The Hogan Personality Inventory (HPI). The HPI was the first measure of normal personality developed explicitly to assess the FFM in occupational performance. The measurement goal of the HPI is to predict real-world outcomes. As such, it is an original and well-known measure of the FFM and considered a marker instrument in English and other languages. To illustrate the relationships between the HPI and other well-known personality assessments, Tables 2.1 through 2.4 present correlations between the HPI and other FFM assessments. Figure 2.1 shows median correlation coefficients that summarize HPI relations with Goldberg’s (1992) Big-Five Markers (R. Hogan & J. Hogan, 2007), the Personal Characteristics Inventory (Mount & Barrick, 1995), the Inventario de Personalidad de Cinco Factores (IP/5F: Salgado & Moscoso, 1999), and the NEO PI-R (Goldberg, 2000).
www.mentisglobal.com Distributed by Mentis [email protected]
12 Copyright Hogan Assessment Systems, Inc. 2013. All rights reserved.
Table 2.1 Correlations between Goldberg’s Big-Five Markers and the HPI Scales
Scale ADJ AMB SOC INP PRU INQ LRN
Factor I .04 .55* .44* .31* -.24* .29* -.03
Factor II .13 -.11 .02 .56* .23* -.12 -.17*
Factor III .10 .24* -.26* -.07 .36* -.17* -.08
Factor IV .70* .39* -.04 .27* .01 .28* .11
Factor V .05 .22* -.04 -.01 .03 .33* .35* Note. N = 168. Table taken from the HPI Manual (R. Hogan & J. Hogan, 2007). Factor 1 = Surgency; Factor II = Agreeableness; Factor III = Conscientiousness; Factor IV = Emotional Stability; Factor V = Intellect; ADJ = Adjustment; AMB = Ambition; SOC = Sociability; INP = Interpersonal Sensitivity; PRU = Prudence; INQ = Inquisitive; LRN = Learning Approach. * p < .05, one-tailed; directional relationships hypothesized a priori.
Table 2.2 Correlations between the PCI Primary Scales and the HPI Scales
Scale ADJ AMB SOC INP PRU INQ
Extraversion .04 .39* .64* .26* -.09 .18*
Agreeableness .50* .25* .09 .61* .21* -.03
Conscientiousness .24* .39* -.06 .17* .59* .08
Stability .69* .59* -.02 .46* .25* .06
Openness .12 .36* .15 .17* -.05 .57*
Note. N = 154. ADJ = Adjustment; AMB = Ambition; SOC = Sociability; INP = Interpersonal Sensitivity; PRU = Prudence; INQ = Inquisitive. * p < .05.
Table 2.3 Correlations between the IP/5F and the HPI Scales
Scale ADJ AMB SOC INP PRU INQ
Extraversion .24* .60* .62* .35* .04 .41*
Agreeableness .22* -.12 -.10 .37* .25* -.10
Conscientiousness .22* .35* .08 .30* .49* .19*
Stability -.66* -.50* -.16* -.31* -.32* -.26*
Openness .11 .44* .51* .25* -.15* .69*
Note. N = 200. ADJ = Adjustment; AMB = Ambition; SOC = Sociability; INP = Interpersonal Sensitivity; PRU = Prudence; INQ = Inquisitive. * p < .05.
Table 2.4 Correlations between the NEO-PI-R and the HPI Scales
Scale ADJ AMB SOC INP PRU INQ LRN
Extraversion .16* .54* .63* .44* -.06 .22* .08*
Agreeableness .31* -.12* -.24* .47* .46* -.20* -.08*
Conscientiousness .24* .37* -.05 .08 .42* .05 .16*
Neuroticism -.72* -.53* -.08* -.27* -.22* -.15* -.17*
Openness .01 .20* .38* .19* -.31* .52* .24*
Note. N = 679. ADJ = Adjustment; AMB = Ambition; SOC = Sociability; INP = Interpersonal Sensitivity; PRU = Prudence; INQ = Inquisitive; LRN = Learning Approach. * p < .05.
www.mentisglobal.com Distributed by Mentis [email protected]
13 Copyright Hogan Assessment Systems, Inc. 2013. All rights reserved.
Figure 2.1 Relationships between FFM Inventories and the HPI Scales
Note. Median correlation coefficients summarize HPI relations with the NEO PI-R (Goldberg, 2000), Goldberg’s (1992) Big-Five Markers (R. Hogan & J. Hogan, 2007), Personal Characteristics Inventory (Mount & Barrick, 2001), and the Inventario de Personalidad de Cinco Factores (Salgado & Moscoso, 1999). The coefficient ranges are as follows: Adjustment/Emotional Stability/Neuroticism (.66 to .72); Ambition/Extraversion/Surgency (.39 to .60); Sociability/Extraversion/Surgency (.44 to .64); Interpersonal Sensitivity/Agreeableness (.37 to .61); Prudence/Conscientiousness (.36 to .59); Inquisitive/Openness/Intellect (.33 to .69); Learning Approach/Openness/Intellect (.24 to .35). Reprinted with permissions from the authors. All rights reserved.
2.5 HPI Description and Development.
HPI Description
True/false items with no psychiatric content 7 personality scales, 1 validity scale, no item overlap 4th grade reading level 15-20 minute completion time Items carefully screened to minimize invasion of privacy Designed for ages 18 and above Internet administration and reporting
Extraversion
Agreeableness
Neuroticism
Conscientiousness
Openness
Median r = .70
Median r = .55
Median r = .63
Median r = .52
Median r = .46
Median r = .55
Median r = .30
Adjustment
Ambition
Sociability
Interpersonal Sensitivity
Prudence
Inquisitive
Learning Approach
www.mentisglobal.com Distributed by Mentis [email protected]
14 Copyright Hogan Assessment Systems, Inc. 2013. All rights reserved.
HPI Development
Based on the FFM, development of the HPI began in the late 1970s, with construction and validation conducted in accordance with professional standards and the Uniform Guidelines.
Favorable reviews of the HPI appear in the Buros Institute of Mental Measurements, the 13th edition of the Mental Measurements Yearbook (Axford, 1998; Lobello, 1998), and the British Psychological Society Psychological Testing Centre Test Reviews (Creed & Shackleton, 2007; Marshall & Lindley, 2009). Additional objective reviews for the HPI exist with the Oregon Research Institute (Goldberg, 2013).
HPI norms are available in over 40 different languages based on data collected from over 3 million working adults throughout the world. Both global and country and/or language specific norms are available.
Over 400 validation studies, evaluating occupational performance across jobs and industries, have used the HPI.
Meta-analyses of HPI scales indicate that the estimated true scale validities for predicting job performance are as follows: Adjustment (.43), Ambition (.35), Interpersonal Sensitivity (.34), Prudence (.36), Inquisitive (.34), and Learning Approach (.25). These peer-reviewed results appear in the Journal of Applied Psychology (J. Hogan & Holland, 2003).
To date, research indicates no adverse impact for the HPI on protected racial/ethnic, gender, or age groups (Foster & Vert, 2012).
Recent research indicates that real job applicants who completed the HPI as part of the job application process did not/could not “fake” their scores on a second occasion after having been rejected the first time (J. Hogan, Barrett, & R. Hogan, 2007).
The HPI incorporates the FFM with an internal factor structure supporting seven scales. The test-retest reliabilities range from .69 to .87. The 2007 Hogan Personality Inventory Manual (3rd edition) documents the background, development, and psychometric properties of the inventory.
www.mentisglobal.com Distributed by Mentis [email protected]
15 Copyright Hogan Assessment Systems, Inc. 2013. All rights reserved.
HPI scales demonstrate adequate psychometric qualities (Lobello, 1998). Items retained in the final battery predict significant non-test behavior. There is no item overlap between the primary scales and the validity scale. Empirical validation research conducted over the last 20 years provides a firm understanding of construct validity and the nature and range of job performance prediction. Overall, the HPI is a well-validated instrument that predicts job performance across occupations and organizations (Axford, 1998; Hogan Assessment Systems, 2013; J. Hogan & Holland, 2003).
The HPI was included in research conducted by the Oregon Research Institute in 1997 and 2007. This research effort is the largest of its kind and it compiles longitudinal data on major personality assessments from a community sample in Eugene-Springfield, Oregon. The data collected is a comprehensive and objective source of validity evidence for the HPI. The results of these two studies indicate that the HPI has sufficient convergent and discriminant validity with other FFM measures (Goldberg, 2013).
HPI items form small composites (i.e., facets) that represent themes within the larger constructs. The number of composites per scale ranges from four (Learning Approach) to eight (Adjustment).
Constructs Measured
The HPI scales (and associated FFM constructs measured) are defined as follows:
Adjustment concerns the degree to which a person is steady in the face of pressure, or conversely, moody, and self-critical (FFM: Emotional Stability).
Ambition concerns the degree to which a person seems leaderlike, status-seeking, and achievement-oriented (FFM: Extraversion).
Sociability concerns the degree to which a person needs and/or enjoys social interaction (FFM: Extraversion).
Interpersonal Sensitivity concerns the degree to which a person has social sensitivity, tact, and perceptiveness (FFM: Agreeableness).
Prudence concerns the degree to which a person seems conforming, dependable, and has self-control (FFM: Conscientiousness).
Inquisitive concerns the degree to which a person seems imaginative, adventurous, and analytical (FFM: Intellect/Openness).
Learning Approach reflects the degree to which a person enjoys academic activities and values education as an end in itself (FFM: Intellect/Openness).
www.mentisglobal.com Distributed by Mentis [email protected]
16 Copyright Hogan Assessment Systems, Inc. 2013. All rights reserved.
2.6 The Hogan Development Survey (HDS). Scales on FFM instruments like the HPI measure normal, day-to-day personality. In contrast, the scales on the HDS measure dysfunctional interpersonal themes (R. Hogan & J. Hogan, 2009). These dysfunctional dispositions represent flawed interpersonal strategies that (a) reflect one’s distorted beliefs about others and (b) negatively influence careers and life satisfaction (Bentz, 1985; J. Hogan, R. Hogan, & Kaiser, 2011; R. Hogan & J. Hogan, 1997, 2009; Kaiser, LeBreton, & J. Hogan, in press; Leslie & Van Velsor, 1996). Behavioral tendencies associated with these themes emerge when people encounter stressful or novel situations and when they let down their guard—or stop considering how their actions affect others. These deeply ingrained personality characteristics reflect maladaptive coping strategies that coexist with normal, day-to-day personality.
Dysfunctional personality characteristics reflect flawed interpersonal strategies people use to negotiate for status and acceptance. These tendencies develop during childhood as strategies for dealing with criticism or feelings of inadequacy. Horney (1950), in what may be the first taxonomy of flawed interpersonal outcomes, identified three major domains of flawed dispositions: (a) managing personal inadequacies by forming alliances (i.e., moving toward people), (b) managing personal insecurities by avoiding others (i.e., moving away from people), and (c) managing personal insecurities by dominating or intimidating others (i.e., moving against people). Over time, these behavioral strategies become associated with a person’s reputation and can impede job performance and career success.
Researchers conceptualize poor employee performance in at least two mutually exclusive ways. One view argues that failure is synonymous with the absence of the requisite characteristics needed for success (Bray & Howard, 1983). A second view contends that failure has more to do with exhibiting undesirable qualities (i.e., derailing characteristics) than lacking the requisite ones (R. Hogan & J. Hogan, 2001). This second position suggests a different perspective from which to understand causes of employee failure. The extant literature suggests that it is possible to predict both desirable and undesirable qualities associated with occupational success.
The HDS assesses 11 dysfunctional dispositions that can impede job performance and lead to career difficulties. In the context of personnel selection, the HDS identifies applicants whose behavior, over time, will erode relationships with others because of flawed interpersonal strategies.
www.mentisglobal.com Distributed by Mentis [email protected]
17 Copyright Hogan Assessment Systems, Inc. 2013. All rights reserved.
2.7 HDS Description and Development.
HDS Description
Agree/disagree items that have no psychiatric or mental health content
11 primary scales, 1 social desirability scale, no item overlap between scales
5th grade reading level
15-20 minute completion time
Items are not interpretable in terms of medical or psychiatric disability
Designed for ages 18 and above
Internet administration and reporting
HDS Development
Principal components analysis of the HDS yields three clearly defined factors that support interpreting the inventory in terms of Horney’s (1950) taxonomy of flawed interpersonal characteristics (R. Hogan & J. Hogan, 2001).
Favorable reviews of the HDS appear in the Buros Institute of Mental Measurements, the 14th edition of the Mental Measurements Yearbook (Fox & Huebner, 2001), and the British Psychological Society Psychological Testing Centre Test Reviews (Hodgkinson & Robertson, 2007). Additional objective reviews for the HDS exists with the Oregon Research Institute (Goldberg, 2013).
HDS norms are available in over 40 different languages based on data collected from over 1 million working adults throughout the world. Both global and country and/or language specific norms are available.
Researchers have used the HDS in over 60 criterion-related validation studies to predict occupational performance across a range of jobs and industries, especially in management and leadership roles (Fleming, 2004; Kaiser, LeBreton, & J. Hogan, in press; Khoo & Burch, 2008).
To date, research indicates no adverse impact for the HDS on protected racial/ethnic, gender, or age groups (Foster & Vert, 2012).
www.mentisglobal.com Distributed by Mentis [email protected]
18 Copyright Hogan Assessment Systems, Inc. 2013. All rights reserved.
Alpha reliabilities for the scales range from .43 to .68 and short-term test-retest reliabilities, calculated using Pearson correlations, range from .66 to .75 (R. Hogan & J. Hogan, 2009). Test-retest reliabilities using normalized Euclidean similarities range from .76 to .85 (R. Hogan & J. Hogan, 1997). The 2009 HDS manual documents the development and psychometric properties in further detail.
Construct validity evidence is reported in the test manual; scale correlates with non-test behavior and observer ratings appear in R. Hogan and J. Hogan (2001, 2009).
Research shows that the HDS predicts job performance above and beyond traditional FFM inventories such as the HPI. Evidence of such incremental validity is available across a range of jobs, industries, and organizations (Hogan Assessment Systems, 2009b).
In 2007, the Oregon Research Institute included the HDS in its longitudinal research effort to collect data from a community sample in Eugene-Springfield Oregon on a variety of personality assessments. As a result, the HDS has desirable convergent and discriminant validity with other personality measures (R. Hogan & J. Hogan, 2009).
The HDS scales are defined as follows:
Excitable concerns seeming moody and inconsistent, being enthusiastic about new persons or projects and then becoming disappointed with them.
Skeptical concerns seeming cynical, distrustful, overly sensitive to criticism, and questioning others' true intentions.
Cautious concerns seeming resistant to change and reluctant to take even reasonable chances for fear of being evaluated negatively.
Reserved concerns seeming socially withdrawn and lacking interest in or awareness of the feelings of others.
Leisurely concerns seeming autonomous, indifferent to other people's requests, and becoming irritable when they persist.
Bold concerns seeming unusually self-confident and, as a result, unwilling to admit mistakes or listen to advice, and unable to learn from experience.
Mischievous concerns seeming to enjoy taking risks and testing the limits.
Colorful concerns seeming expressive, dramatic, and wanting to be noticed.
Imaginative concerns seeming to act and think in creative and sometimes unusual ways.
www.mentisglobal.com Distributed by Mentis [email protected]
19 Copyright Hogan Assessment Systems, Inc. 2013. All rights reserved.
Diligent concerns seeming careful, precise, and critical of the performance of others.
Dutiful concerns seeming eager to please, reliant on others for support, and reluctant to take independent action.
Dr. Robert Hogan wrote the items for the 11 HDS dimensions to reflect the core elements of each construct. This focus on the core of each construct is unique and contrasts with other existing inventories of personality disorders where items reflecting anxiety and depression appear on several scales simultaneously, making scale interpretation difficult. Six cycles of item writing, testing, analysis, and further revision took place over a three-year period. In 1995, Hogan defined a final item pool based on item analyses, scale-level factor analyses, correlations between scale scores and other psychometric measures, and correlations with non-test behavior. Empirical validation research conducted over the last 10 years provides a firm understanding of the construct validity and the nature and range of job performance outcomes predicted by the HDS.
The HDS is neither intended nor appropriate for diagnosing mental illness; rather, the HDS is a measure of personality characteristics that hinder the ability to build relationships and accomplish goals in organizational contexts. Because of this, a primary consideration shaping the development of the HDS concerned the actual content of the items. Because the HDS is intended for use in employment contexts—as opposed to being used to make medical or mental health status evaluations—the items reflect themes from the world of work. That is, the item content revolves around how one is perceived at work, how one relates to supervisors and co-workers, one’s attitudes about competition and success, etc. Further, Hogan did not validate the HDS against clinical diagnoses, but against descriptions provided by participants’ close working associates (Fico, R. Hogan, & J. Hogan, 2000; R. Hogan & J. Hogan, 2009). Besides these linear relations between the HDS and observers’ ratings and descriptions, researchers have found curvilinear relationships between HDS factors and managerial performance ratings (Benson & Campbell, 2007; Kaiser & J. Hogan, 2011). This has clear practical implications, as taking a strength to the extreme is often detrimental to performance, and in some cases, performance suffers even when managers show a slight tendency to exaggerate their strengths (Kaplan & Kaiser, 2009).
www.mentisglobal.com Distributed by Mentis [email protected]
20 Copyright Hogan Assessment Systems, Inc. 2013. All rights reserved.
3 – HPI & HDS SCALES USED IN LEADER BASIS
3.1 HPI & Leader BASIS. Hogan based the Leader BASIS HPI scales and cutoff scores on research pertaining to the Hogan Express Report for the Managers & Executives job family. The Hogan Express Manual describes this research in detail (Hogan Assessment Systems, 2009a). We summarize this research below.
The Hogan Express Managers & Executives job family consists of jobs that have administrative or managerial authority over the human, physical, and financial resources of an organization. These jobs involve establishing broad policies, planning, forecasting, prioritizing, allocating, and directing work to achieve efficient use of resources at each level of an organization. The Managers & Executives job family represents the following three job levels:
1. Executive Management – Senior-most business and business unit heads (e.g., Corporate-Levels, Executive Vice Presidents, Senior Vice Presidents, Vice Presidents, General Managers, Directors)
2. Middle Management – Positions with second-level management direct reports and higher (e.g., Department Heads)
3. Supervisors & Entry-level Management – First-level supervisors and the positions to whom they report (e.g., General Supervisor, First-Level Manager)
Hogan considered three primary sources of validity evidence when identifying HPI scales for the Hogan Express Report: job family meta-analytic validity, transportability of validity, and synthetic validity.
Several meta-analyses focus on Managers and Executives as a group (e.g., Barrick & Mount, 1991; Barrick et al., 2003; Bono & Judge, 2004; Hurtz & Donovan, 2000; Judge et al., 2002; Zhao & Siebert, 2006). Together, these analyses suggest that Emotional Stability (HPI Adjustment), Extraversion (HPI Ambition and Sociability), Conscientiousness (HPI Prudence), and Openness to Experience (HPI Inquisitive and Learning Approach) predict performance in the Managers & Executives job family.
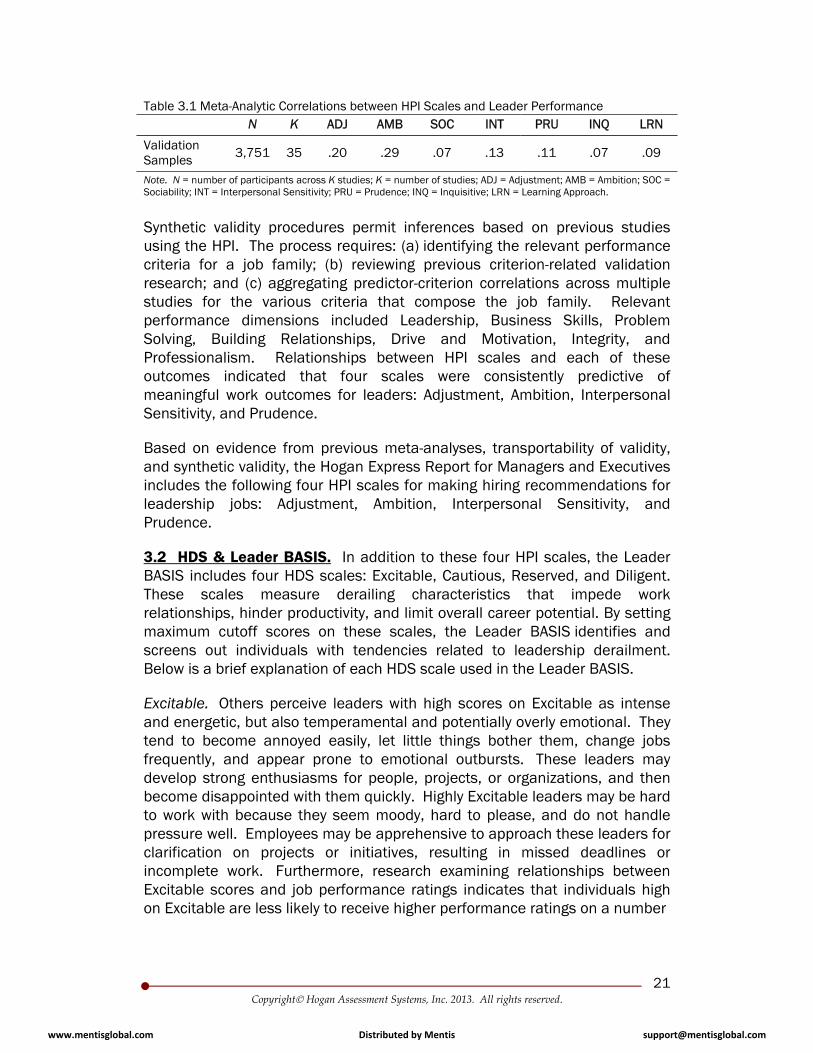
Transportability of validity evidence came from data in the Hogan archive. Hogan identified 35 studies containing both HPI data and overall performance ratings for managerial and executive samples. Next, based on procedures outlined by Hunter and Schmidt (2004), Hogan meta-analyzed the results across all 35 studies to provide transportability of validity evidence. Table 3.1 presents these results, which provide support for five HPI scales in predicting job performance; Adjustment, Ambition, Interpersonal Sensitivity, Prudence, and to a smaller degree, Learning Approach.
www.mentisglobal.com Distributed by Mentis [email protected]
21 Copyright Hogan Assessment Systems, Inc. 2013. All rights reserved.
Table 3.1 Meta-Analytic Correlations between HPI Scales and Leader Performance N K ADJ AMB SOC INT PRU INQ LRN
Validation Samples 3,751 35 .20 .29 .07 .13 .11 .07 .09
Note. N = number of participants across K studies; K = number of studies; ADJ = Adjustment; AMB = Ambition; SOC = Sociability; INT = Interpersonal Sensitivity; PRU = Prudence; INQ = Inquisitive; LRN = Learning Approach.
Synthetic validity procedures permit inferences based on previous studies using the HPI. The process requires: (a) identifying the relevant performance criteria for a job family; (b) reviewing previous criterion-related validation research; and (c) aggregating predictor-criterion correlations across multiple studies for the various criteria that compose the job family. Relevant performance dimensions included Leadership, Business Skills, Problem Solving, Building Relationships, Drive and Motivation, Integrity, and Professionalism. Relationships between HPI scales and each of these outcomes indicated that four scales were consistently predictive of meaningful work outcomes for leaders: Adjustment, Ambition, Interpersonal Sensitivity, and Prudence.
Based on evidence from previous meta-analyses, transportability of validity, and synthetic validity, the Hogan Express Report for Managers and Executives includes the following four HPI scales for making hiring recommendations for leadership jobs: Adjustment, Ambition, Interpersonal Sensitivity, and Prudence.
3.2 HDS & Leader BASIS. In addition to these four HPI scales, the Leader BASIS includes four HDS scales: Excitable, Cautious, Reserved, and Diligent. These scales measure derailing characteristics that impede work relationships, hinder productivity, and limit overall career potential. By setting maximum cutoff scores on these scales, the Leader BASIS identifies and screens out individuals with tendencies related to leadership derailment. Below is a brief explanation of each HDS scale used in the Leader BASIS.
Excitable. Others perceive leaders with high scores on Excitable as intense and energetic, but also temperamental and potentially overly emotional. They tend to become annoyed easily, let little things bother them, change jobs frequently, and appear prone to emotional outbursts. These leaders may develop strong enthusiasms for people, projects, or organizations, and then become disappointed with them quickly. Highly Excitable leaders may be hard to work with because they seem moody, hard to please, and do not handle pressure well. Employees may be apprehensive to approach these leaders for clarification on projects or initiatives, resulting in missed deadlines or incomplete work. Furthermore, research examining relationships between Excitable scores and job performance ratings indicates that individuals high on Excitable are less likely to receive higher performance ratings on a number
www.mentisglobal.com Distributed by Mentis [email protected]
22 Copyright Hogan Assessment Systems, Inc. 2013. All rights reserved.
of important leadership competencies (e.g., Decision Making, Motivating Others, Stress Tolerance, Building Relationships, Influence; Hogan Assessment Systems, 2010).
Cautious. Leaders with high Cautious scores seem self-doubting, conservative, and unassertive. They tend to avoid making decisions and are slow to adopt new procedures or technology because of the perceived likelihood of failure, criticism, and/or embarrassment. These leaders may be hard to work with because they appear to hold back, seem indecisive, and worry about being criticized for mistakes. Also, because overly cautious leaders tend to be slow to accept and promote change, their work teams and organizations may lag behind the curve. Meta-analytic results indicate that others are less likely to view high Cautious leaders as good communicators, delegators, managers, or problem solvers. Also, they are less likely to be viewed as flexible or innovative (Hogan Assessment Systems, 2010).
Reserved. Many see leaders with high Reserved scores as socially insensitive, self-absorbed, preoccupied, and tough. They tend to keep to themselves, avoid attention, prefer to work alone, and dislike working in teams. These leaders tend to be poor communicators, seem indifferent to the moods and feelings of others, and appear unconcerned about the impression they make on others. Also, leaders with high Reserved scores may not seem insightful or perceptive about social cues or organizational politics, thus impairing their career potential. Employees may find highly Reserved leaders difficult to work for because of their distant and insensitive communication style and because they rarely display public support for their employees. Furthermore, research indicates that high Reserved individuals are less likely to receive positive job performance ratings in several areas important to leaders (e.g., Active Listening, Building Relationships, Communication, Social Engagement, Building Teams, Managing Performance, Innovation; Hogan Assessment Systems, 2010).
Diligent. Leaders with high Diligent scores tend to make everything a top priority, overestimate their competence, and find it difficult to delegate. These tendencies create extra pressure for the leaders while depriving their staff of developmental opportunities. Also, others may find them difficult to work with because they tend to be micromanaging, critical, demanding, fussy, and stubborn under pressure. As a result, research indicates that others might not view these individuals as politically skilled or able to develop subordinates (Hogan Assessment Systems, 2010).
www.mentisglobal.com Distributed by Mentis [email protected]
23 Copyright Hogan Assessment Systems, Inc. 2013. All rights reserved.
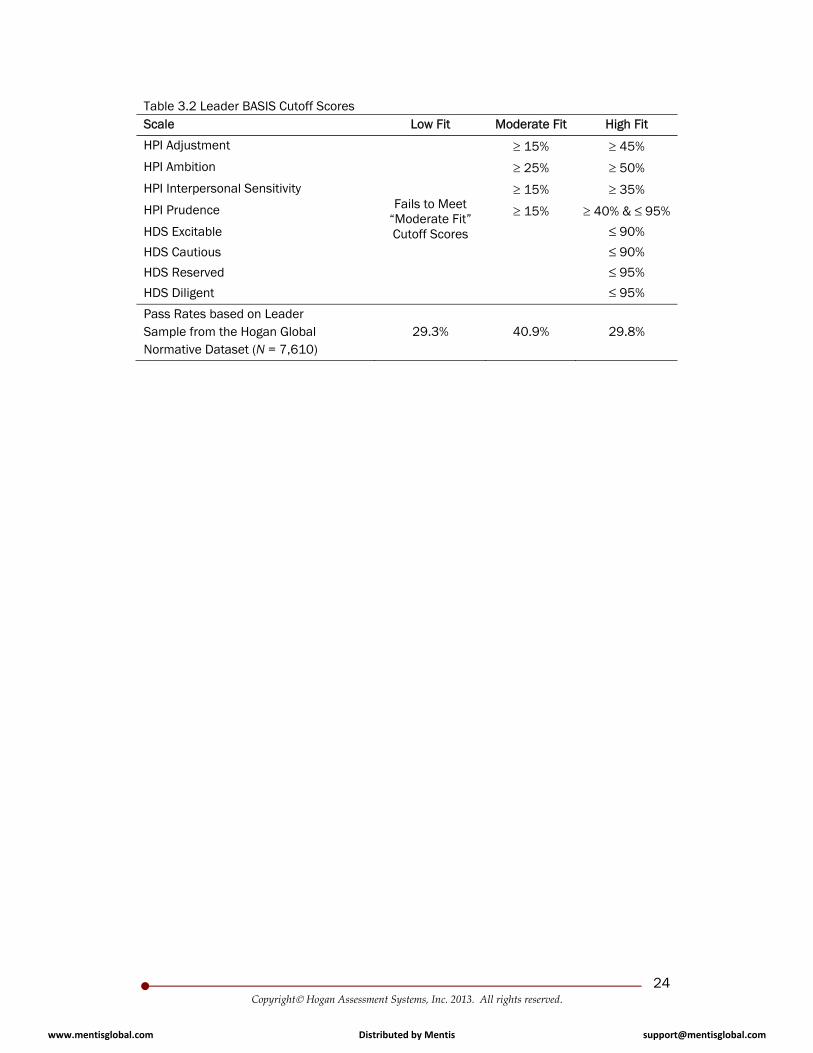
3.3 Leader BASIS Scoring Guidelines. Table 3.2 displays decision guidelines for selecting strong potential candidates into leadership jobs using the Leader BASIS. Hogan recommends minimum cutoff scores or Moderate Fit screening guidelines, which will screen out candidates who lack a minimal degree of the personal characteristics important to effective performance of leadership jobs. These Moderate Fit cutoff scores will help organizations screen out candidates who are likely to overreact or react negatively in response to setback and inconveniences (Adjustment), lack self assurance, initiative, or persistence (Ambition), seem imperceptive or indifferent to others (Interpersonal Sensitivity), or lack appropriate reverence for standard protocol or take inadvisable risks (Prudence).
In addition to offering Moderate Fit candidate screening guidelines, Hogan recommends pass-plus decision guidelines for selecting strong potential candidates into leadership jobs. As shown in Table 3.2, these High Fit candidate screening guidelines involve more stringent requirements on the scales comprising the Moderate Fit candidate screening guidelines and requirements on the HDS Excitable, Cautious, Reserved, and Diligent scales.
This pass-plus profile identifies individuals who possess greater levels of the characteristics needed to perform the job successfully. Pass-plus profiles provide one source of information for distinguishing between applicants who otherwise meet minimal requirements on both personality and other selection instruments. As such, it is a tool for distinguishing between multiple qualified candidates.
Collectively, the pass-plus (High Fit) guidelines will help screen in leadership candidates who appear even-tempered and calm under pressure (HPI Adjustment), energetic and driven (HPI Ambition), perceptive and tactful (HPI Interpersonal Sensitivity), responsible yet flexible (HPI Prudence), steady and consistent (HDS Excitable), decisive and willing to accept challenges (HDS Cautious), considerate and insightful (HDS Reserved), and willing to delegate tasks (HDS Diligent).
Note that the recommendations shown in Table 3.2 reflect guidelines only and should be used in conjunction with other available relevant information to screen otherwise qualified candidates.
www.mentisglobal.com Distributed by Mentis [email protected]
24 Copyright Hogan Assessment Systems, Inc. 2013. All rights reserved.
Table 3.2 Leader BASIS Cutoff Scores Scale Low Fit Moderate Fit High Fit
HPI Adjustment
Fails to Meet “Moderate Fit” Cutoff Scores
15% 45%
HPI Ambition 25% 50%
HPI Interpersonal Sensitivity 15% 35%
HPI Prudence 15% 40% & ≤ 95%
HDS Excitable ≤ 90%
HDS Cautious ≤ 90%
HDS Reserved ≤ 95%
HDS Diligent ≤ 95%
Pass Rates based on Leader Sample from the Hogan Global Normative Dataset (N = 7,610)
29.3% 40.9% 29.8%
www.mentisglobal.com Distributed by Mentis [email protected]
25 Copyright Hogan Assessment Systems, Inc. 2013. All rights reserved.
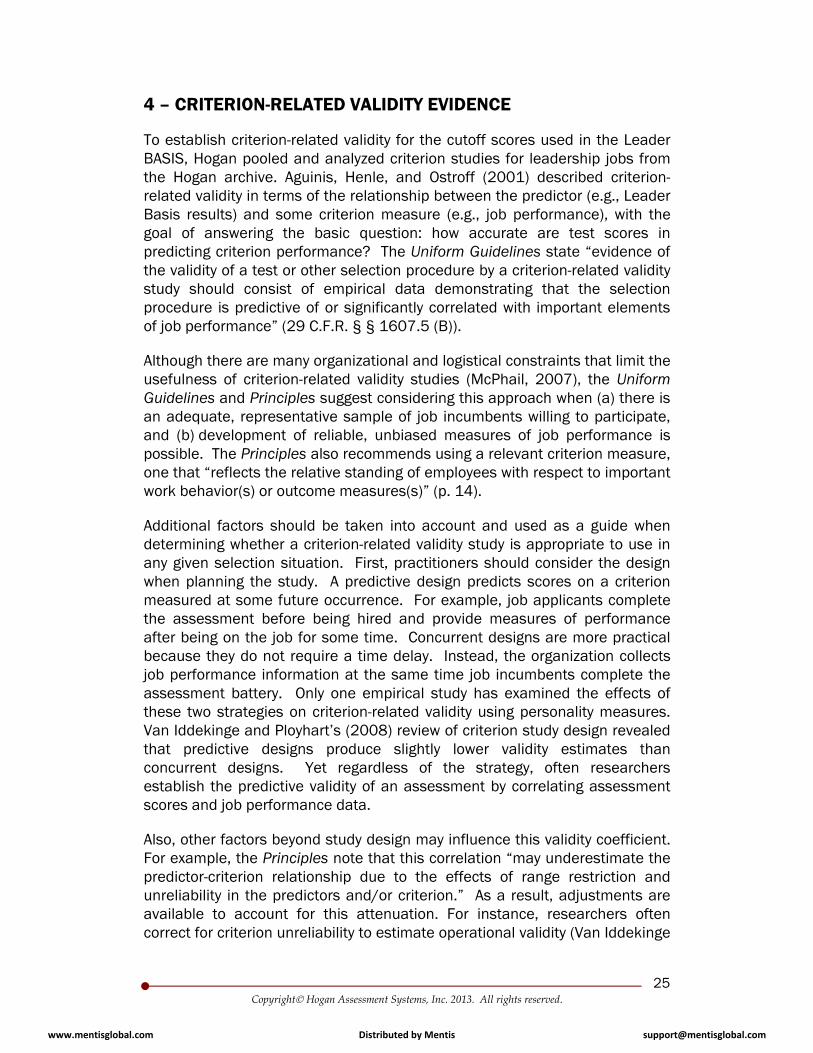
4 – CRITERION-RELATED VALIDITY EVIDENCE
To establish criterion-related validity for the cutoff scores used in the Leader BASIS, Hogan pooled and analyzed criterion studies for leadership jobs from the Hogan archive. Aguinis, Henle, and Ostroff (2001) described criterion-related validity in terms of the relationship between the predictor (e.g., Leader Basis results) and some criterion measure (e.g., job performance), with the goal of answering the basic question: how accurate are test scores in predicting criterion performance? The Uniform Guidelines state “evidence of the validity of a test or other selection procedure by a criterion-related validity study should consist of empirical data demonstrating that the selection procedure is predictive of or significantly correlated with important elements of job performance” (29 C.F.R. § § 1607.5 (B)).
Although there are many organizational and logistical constraints that limit the usefulness of criterion-related validity studies (McPhail, 2007), the Uniform Guidelines and Principles suggest considering this approach when (a) there is an adequate, representative sample of job incumbents willing to participate, and (b) development of reliable, unbiased measures of job performance is possible. The Principles also recommends using a relevant criterion measure, one that “reflects the relative standing of employees with respect to important work behavior(s) or outcome measures(s)” (p. 14).
Additional factors should be taken into account and used as a guide when determining whether a criterion-related validity study is appropriate to use in any given selection situation. First, practitioners should consider the design when planning the study. A predictive design predicts scores on a criterion measured at some future occurrence. For example, job applicants complete the assessment before being hired and provide measures of performance after being on the job for some time. Concurrent designs are more practical because they do not require a time delay. Instead, the organization collects job performance information at the same time job incumbents complete the assessment battery. Only one empirical study has examined the effects of these two strategies on criterion-related validity using personality measures. Van Iddekinge and Ployhart’s (2008) review of criterion study design revealed that predictive designs produce slightly lower validity estimates than concurrent designs. Yet regardless of the strategy, often researchers establish the predictive validity of an assessment by correlating assessment scores and job performance data.
Also, other factors beyond study design may influence this validity coefficient. For example, the Principles note that this correlation “may underestimate the predictor-criterion relationship due to the effects of range restriction and unreliability in the predictors and/or criterion.” As a result, adjustments are available to account for this attenuation. For instance, researchers often correct for criterion unreliability to estimate operational validity (Van Iddekinge
www.mentisglobal.com Distributed by Mentis [email protected]
26 Copyright Hogan Assessment Systems, Inc. 2013. All rights reserved.
& Ployhart, 2008). Note that Hogan corrects for measurement error and range restriction where appropriate and reports both the observed and corrected validity coefficients in technical documentation.
Another decision researchers face is whether to use a single criterion or multiple criteria to represent job performance. Literature recommends that researchers “develop criterion measures that are conceptually aligned with the latent criterion constructs and that maximize the potential use of multiple criteria for predictor validation” (Van Iddekinge & Ployhart, 2008, p. 906). Furthermore, Hogan and Holland (2003) provide support for using specific criteria to estimate the validity of specific predictors in operational use. Although support for using narrow criteria is growing, collecting overall performance composites still provide the best approach to estimating validity of global predictors (Guion, 1961) and prediction often improves when criterion ratings cover the full spectrum of effective performance (Oh & Berry, 2009). In other words, researchers should collect data on both global criteria and, when possible, more specific performance dimensions.
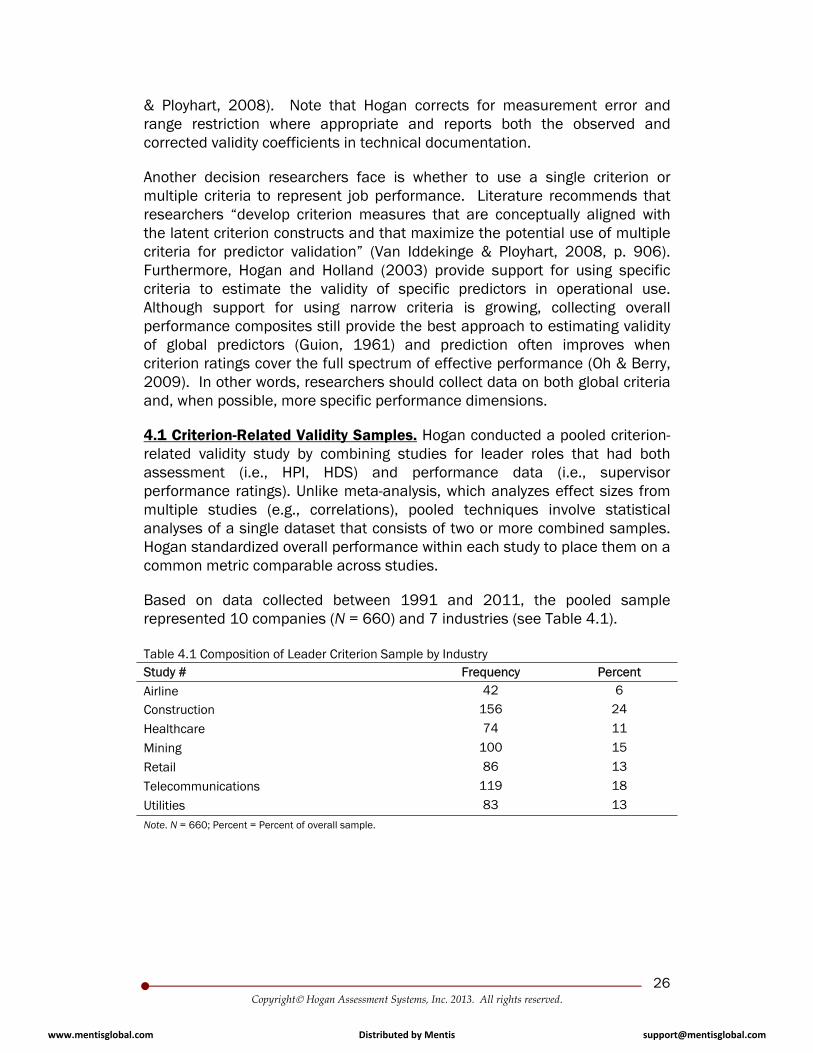
4.1 Criterion-Related Validity Samples. Hogan conducted a pooled criterion-related validity study by combining studies for leader roles that had both assessment (i.e., HPI, HDS) and performance data (i.e., supervisor performance ratings). Unlike meta-analysis, which analyzes effect sizes from multiple studies (e.g., correlations), pooled techniques involve statistical analyses of a single dataset that consists of two or more combined samples. Hogan standardized overall performance within each study to place them on a common metric comparable across studies.
Based on data collected between 1991 and 2011, the pooled sample represented 10 companies (N = 660) and 7 industries (see Table 4.1).
Table 4.1 Composition of Leader Criterion Sample by Industry Study # Frequency Percent Airline 42 6
Construction 156 24
Healthcare 74 11
Mining 100 15
Retail 86 13
Telecommunications 119 18
Utilities 83 13 Note. N = 660; Percent = Percent of overall sample.
www.mentisglobal.com Distributed by Mentis [email protected]
27 Copyright Hogan Assessment Systems, Inc. 2013. All rights reserved.
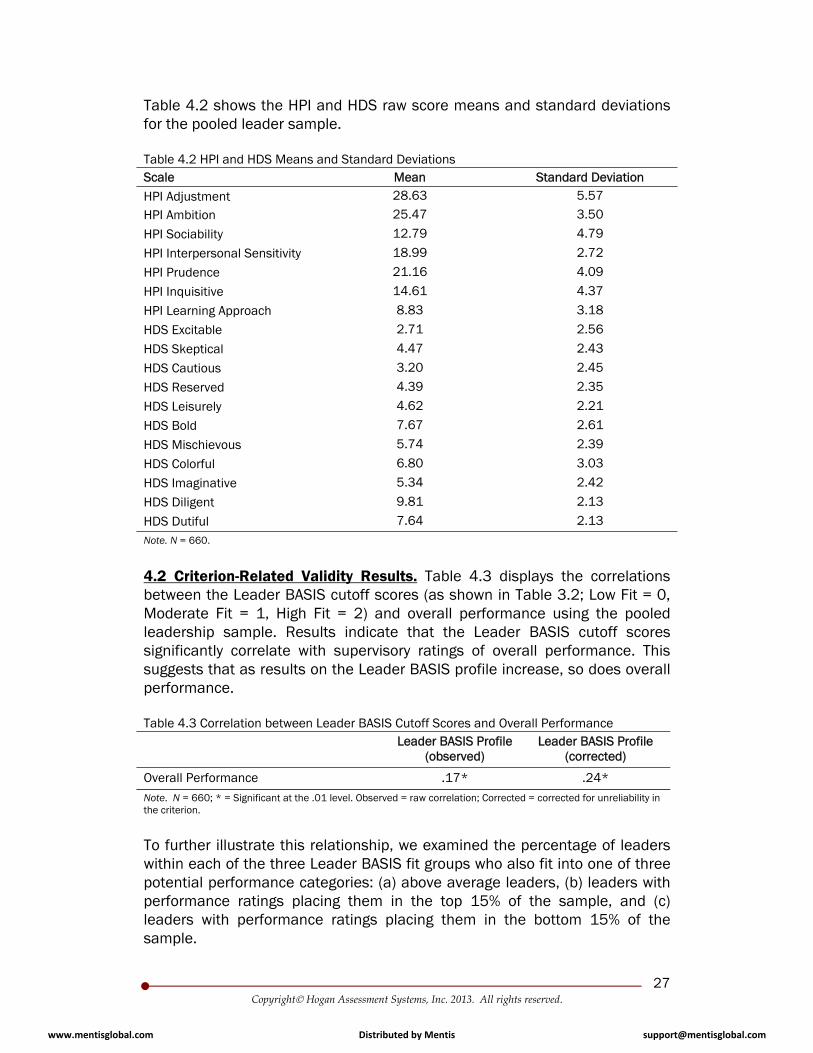
Table 4.2 shows the HPI and HDS raw score means and standard deviations for the pooled leader sample.
Table 4.2 HPI and HDS Means and Standard Deviations Scale Mean Standard Deviation HPI Adjustment 28.63 5.57
HPI Ambition 25.47 3.50
HPI Sociability 12.79 4.79
HPI Interpersonal Sensitivity 18.99 2.72
HPI Prudence 21.16 4.09
HPI Inquisitive 14.61 4.37
HPI Learning Approach 8.83 3.18
HDS Excitable 2.71 2.56
HDS Skeptical 4.47 2.43
HDS Cautious 3.20 2.45
HDS Reserved 4.39 2.35
HDS Leisurely 4.62 2.21
HDS Bold 7.67 2.61
HDS Mischievous 5.74 2.39
HDS Colorful 6.80 3.03
HDS Imaginative 5.34 2.42
HDS Diligent 9.81 2.13
HDS Dutiful 7.64 2.13 Note. N = 660.
4.2 Criterion-Related Validity Results. Table 4.3 displays the correlations between the Leader BASIS cutoff scores (as shown in Table 3.2; Low Fit = 0, Moderate Fit = 1, High Fit = 2) and overall performance using the pooled leadership sample. Results indicate that the Leader BASIS cutoff scores significantly correlate with supervisory ratings of overall performance. This suggests that as results on the Leader BASIS profile increase, so does overall performance.
Table 4.3 Correlation between Leader BASIS Cutoff Scores and Overall Performance
Leader BASIS Profile (observed)
Leader BASIS Profile (corrected)
Overall Performance .17* .24* Note. N = 660; * = Significant at the .01 level. Observed = raw correlation; Corrected = corrected for unreliability in the criterion.
To further illustrate this relationship, we examined the percentage of leaders within each of the three Leader BASIS fit groups who also fit into one of three potential performance categories: (a) above average leaders, (b) leaders with performance ratings placing them in the top 15% of the sample, and (c) leaders with performance ratings placing them in the bottom 15% of the sample.
www.mentisglobal.com Distributed by Mentis [email protected]
28 Copyright Hogan Assessment Systems, Inc. 2013. All rights reserved.
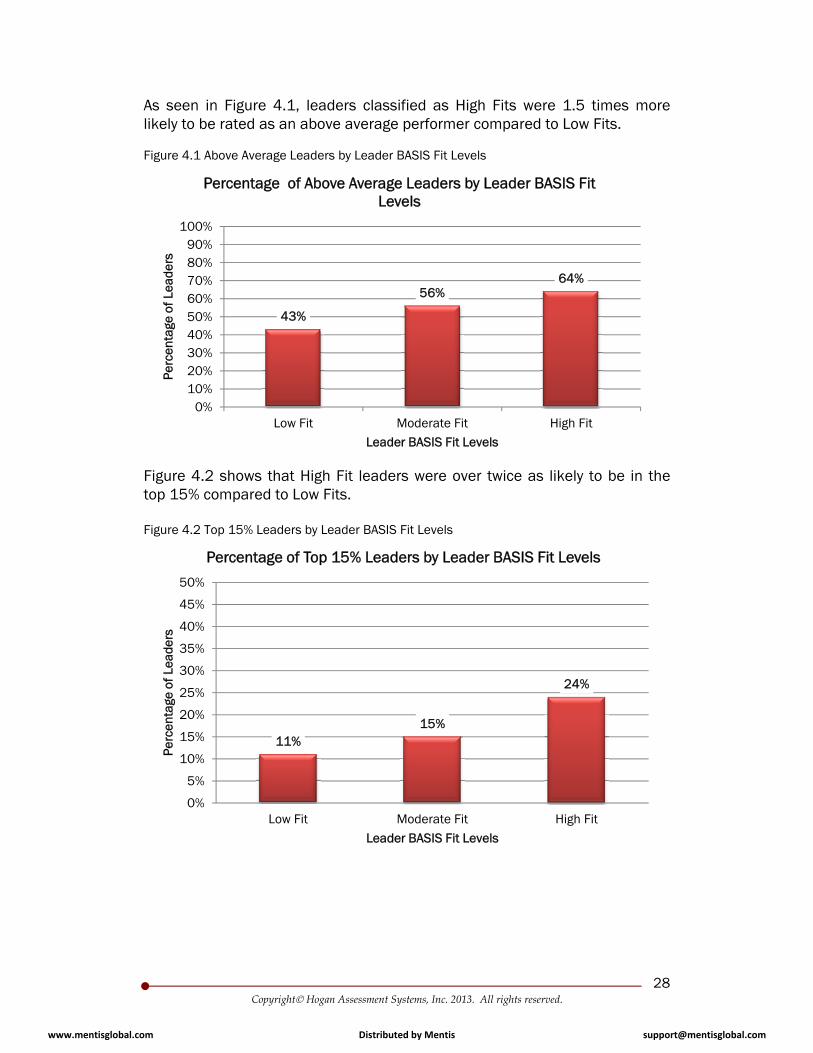
As seen in Figure 4.1, leaders classified as High Fits were 1.5 times more likely to be rated as an above average performer compared to Low Fits.
Figure 4.1 Above Average Leaders by Leader BASIS Fit Levels
Figure 4.2 shows that High Fit leaders were over twice as likely to be in the top 15% compared to Low Fits.
Figure 4.2 Top 15% Leaders by Leader BASIS Fit Levels
43%
56%64%
0%10%20%30%40%50%60%70%80%90%
100%
Low Fit Moderate Fit High Fit
Perc
enta
ge o
f Lea
ders
Leader BASIS Fit Levels
Percentage of Above Average Leaders by Leader BASIS Fit Levels
11%15%
24%
0%
5%
10%
15%
20%
25%
30%
35%
40%
45%
50%
Low Fit Moderate Fit High Fit
Perc
enta
ge o
f Lea
ders
Leader BASIS Fit Levels
Percentage of Top 15% Leaders by Leader BASIS Fit Levels
www.mentisglobal.com Distributed by Mentis [email protected]
29 Copyright Hogan Assessment Systems, Inc. 2013. All rights reserved.
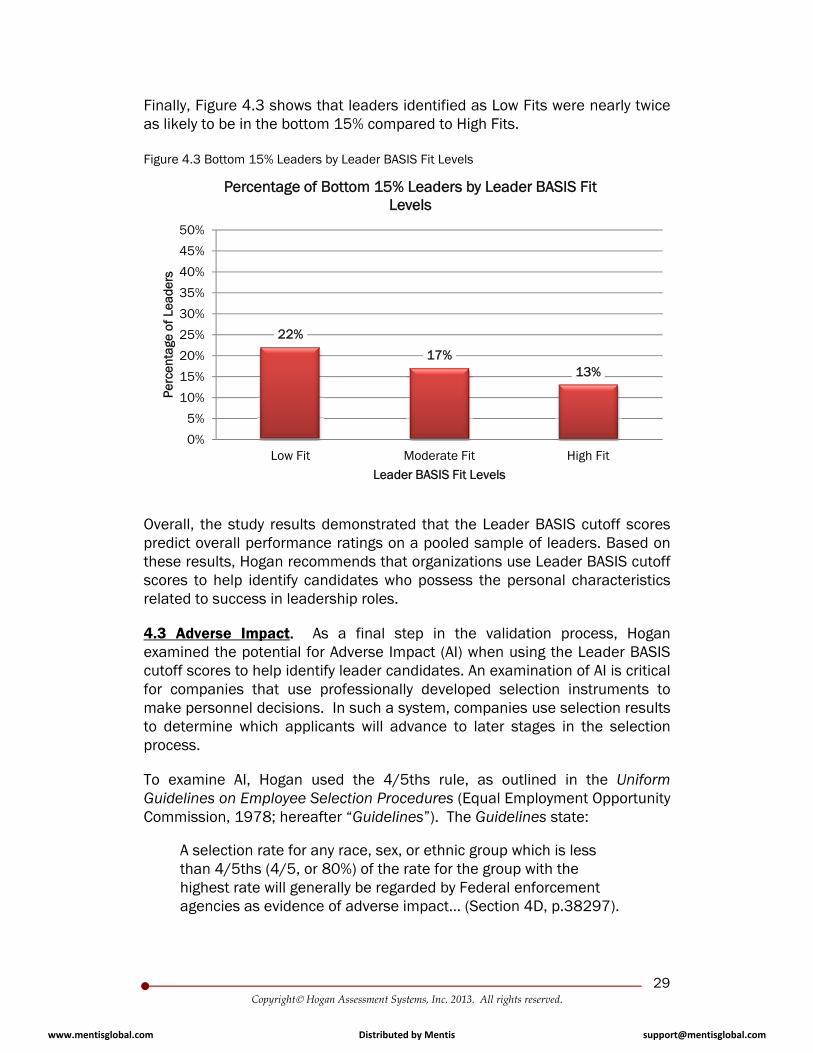
Finally, Figure 4.3 shows that leaders identified as Low Fits were nearly twice as likely to be in the bottom 15% compared to High Fits.
Figure 4.3 Bottom 15% Leaders by Leader BASIS Fit Levels
Overall, the study results demonstrated that the Leader BASIS cutoff scores predict overall performance ratings on a pooled sample of leaders. Based on these results, Hogan recommends that organizations use Leader BASIS cutoff scores to help identify candidates who possess the personal characteristics related to success in leadership roles.
4.3 Adverse Impact. As a final step in the validation process, Hogan examined the potential for Adverse Impact (AI) when using the Leader BASIS cutoff scores to help identify leader candidates. An examination of AI is critical for companies that use professionally developed selection instruments to make personnel decisions. In such a system, companies use selection results to determine which applicants will advance to later stages in the selection process.
To examine AI, Hogan used the 4/5ths rule, as outlined in the Uniform Guidelines on Employee Selection Procedures (Equal Employment Opportunity Commission, 1978; hereafter “Guidelines”). The Guidelines state:
A selection rate for any race, sex, or ethnic group which is less than 4/5ths (4/5, or 80%) of the rate for the group with the highest rate will generally be regarded by Federal enforcement agencies as evidence of adverse impact… (Section 4D, p.38297).
22%
17%13%
0%
5%
10%
15%
20%
25%
30%
35%
40%
45%
50%
Low Fit Moderate Fit High Fit
Perc
enta
ge o
f Lea
ders
Leader BASIS Fit Levels
Percentage of Bottom 15% Leaders by Leader BASIS Fit Levels
www.mentisglobal.com Distributed by Mentis [email protected]
30 Copyright Hogan Assessment Systems, Inc. 2013. All rights reserved.
Since 1978, the 4/5ths rule is the accepted guideline in the U.S. for examining AI based on group selection rate differences (e.g., Bobko, Roth, & Potosky, 1999; Reilly & Chao, 1982; Reilly & Warech 1993; Schmitt, Rogers, Chan, Sheppard, & Jennings, 1997). Some researchers are critical of the 4/5ths rule, arguing instead for significance testing (Morris & Lobsenz, 2000; Roth, Bobko, & Switzer, 2006; Shoben, 1978). However, a review of the Guidelines by Cascio and Aguinis (2001) outlined the controversies of significance testing. They state:
The controversies surrounding significance testing seem to be due mainly to how significance testing is used. Stated differently, many researchers have noted that significance testing is abused and misused (e.g., Cohen, 1994; Schmidt, 1996). Significance testing allows us to infer whether the null hypothesis that selection rates are equal in the population is likely to be false. On the other hand, significance testing is incorrectly used when: (a) conclusions are made regarding the magnitude of selection rate differences across subgroups (e.g., a statistically significant result at the .01 level is interpreted as a larger difference than a result at the .05 level) and (b) failure to reject the null hypothesis is interpreted as evidence of lack of differences in selection rates in the population (i.e., not detecting differences in the sample may be due to insufficient statistical power). (p. 204)
Cascio and Aguinis (2001) continue by stating that, since the Guidelines’ inception in 1978, the Equal Employment Opportunity Commission (EEOC) has provided no supplemental information regarding appropriate statistical power, methodology, or significance testing levels for determining AI. Although some researchers argue for the use of significance tests to examine AI, the appropriate use of such analyses remains undefined by the EEOC. As a result, Hogan continues to use the EEOC’s recommendation of the 4/5ths rule.
Calculations using the 4/5ths rule produce a ratio where (a) numbers greater than 1.00 indicate that results for minority group applicants fall within acceptable ranges more frequently than results for the majority group and (b) ratios below 1.00 indicate that results for minority group applicants fall within acceptable ranges less frequently than results for the majority group. According to the 4/5ths rule, evidence of AI exists when this ratio is less than .80.
Hogan evaluated potential selection rates for gender, age, and race/ethnicity groups using both a general (N = 156,614) and leader (N = 12,097) HPI archival sample of applicants who provided demographic characteristics. For these analyses, we compared individuals who failed the Moderate Fit Leader BASIS screening guidelines to those who passed the Moderate Fit screening guidelines. The results of these analyses serve only as estimates of potential
www.mentisglobal.com Distributed by Mentis [email protected]
31 Copyright Hogan Assessment Systems, Inc. 2013. All rights reserved.
selection rates in lieu of actual applicant data from organizations using Leader BASIS cutoff scores. A number of non-test factors, most notably the opportunity to take the assessment, affect selection rates.
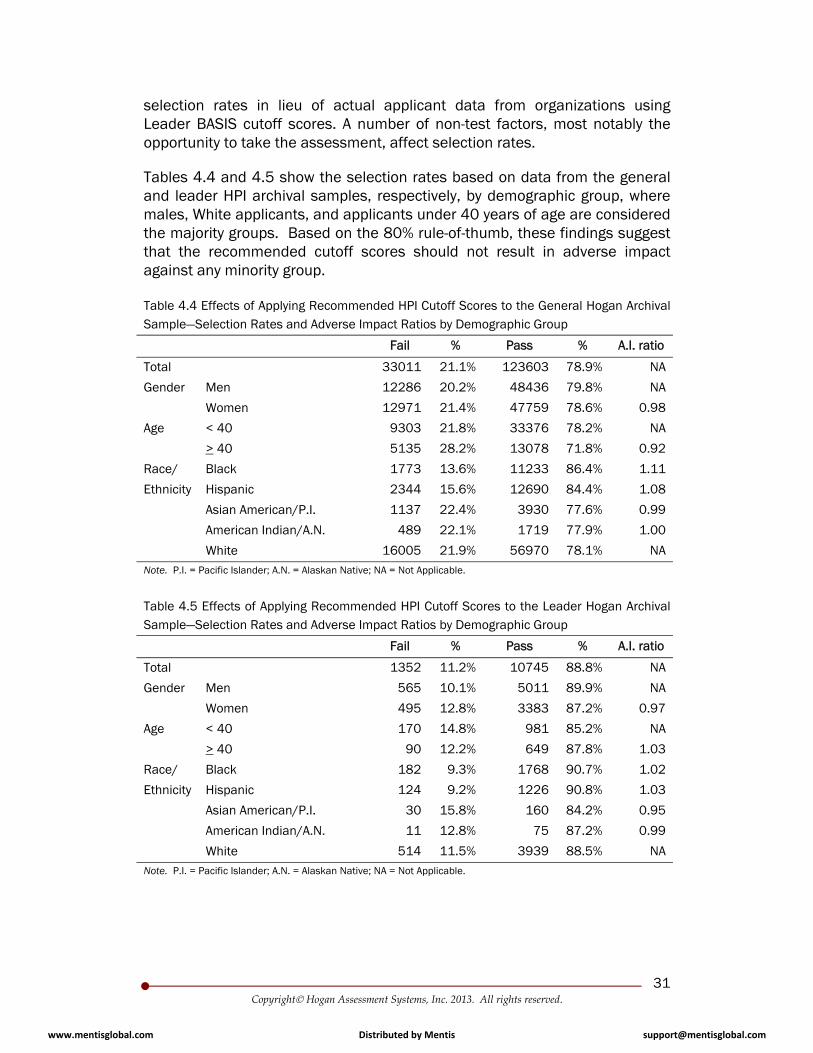
Tables 4.4 and 4.5 show the selection rates based on data from the general and leader HPI archival samples, respectively, by demographic group, where males, White applicants, and applicants under 40 years of age are considered the majority groups. Based on the 80% rule-of-thumb, these findings suggest that the recommended cutoff scores should not result in adverse impact against any minority group.
Table 4.4 Effects of Applying Recommended HPI Cutoff Scores to the General Hogan Archival Sample—Selection Rates and Adverse Impact Ratios by Demographic Group
Fail % Pass % A.I. ratio
Total 33011 21.1% 123603 78.9% NA
Gender Men 12286 20.2% 48436 79.8% NA
Women 12971 21.4% 47759 78.6% 0.98
Age < 40 9303 21.8% 33376 78.2% NA
> 40 5135 28.2% 13078 71.8% 0.92
Race/ Black 1773 13.6% 11233 86.4% 1.11
Ethnicity Hispanic 2344 15.6% 12690 84.4% 1.08
Asian American/P.I. 1137 22.4% 3930 77.6% 0.99
American Indian/A.N. 489 22.1% 1719 77.9% 1.00
White 16005 21.9% 56970 78.1% NA Note. P.I. = Pacific Islander; A.N. = Alaskan Native; NA = Not Applicable.
Table 4.5 Effects of Applying Recommended HPI Cutoff Scores to the Leader Hogan Archival Sample—Selection Rates and Adverse Impact Ratios by Demographic Group
Fail % Pass % A.I. ratio
Total 1352 11.2% 10745 88.8% NA
Gender Men 565 10.1% 5011 89.9% NA
Women 495 12.8% 3383 87.2% 0.97
Age < 40 170 14.8% 981 85.2% NA
> 40 90 12.2% 649 87.8% 1.03
Race/ Black 182 9.3% 1768 90.7% 1.02
Ethnicity Hispanic 124 9.2% 1226 90.8% 1.03
Asian American/P.I. 30 15.8% 160 84.2% 0.95
American Indian/A.N. 11 12.8% 75 87.2% 0.99
White 514 11.5% 3939 88.5% NA Note. P.I. = Pacific Islander; A.N. = Alaskan Native; NA = Not Applicable.
www.mentisglobal.com Distributed by Mentis [email protected]
32 Copyright Hogan Assessment Systems, Inc. 2013. All rights reserved.
5 – USES AND APPLICATIONS
There is no indication that selection using the Leader BASIS cutoff scores will result in adverse impact against any group. Therefore, because this profile is valid and does not discriminate unfairly, Hogan recommends that organizations administer both the HPI and HDS to leadership candidates and score the assessments using the recommended Leader BASIS cutoff scores shown in Table 3.2. Employment suitability should be determined, in part, by assessing scores on the recommended HPI and HDS scales.
The following procedures will help organizations use and monitor the Leader BASIS as part of their selection process. First, organizations should examine their applicant flow to determine if the recommended cutoff scores allow enough applicants to pass while screening out applicants who are likely to be poor performers. Cutoff scores on which everyone fails are just as ineffective as those on which everyone passes.
Second, organizations should maintain records of test scores by demographic group, as indicated in the Uniform Guidelines, to monitor the possibility of adverse impact resulting from the use of the Hogan assessments. Third, the appropriate administrative personnel should review the entire selection process to determine if they can improve any procedures. An organization should take this step after using the selection process for at least one year but not more than five years. Test validation experts recommend that organizations review validity information every five years or if a job’s requirements and responsibilities change significantly (Schmit, Lundquest, & Beckham, 2008).
Finally, organizations should maintain performance appraisal and/or monitoring data on new incumbents who are hired using any new selection procedure. These data are necessary to examine the utility of a selection procedure or for future validation efforts. In addition, Hogan recommends conducting follow-up analyses on the employees hired using the Leader BASIS and exploring the utility and bottom-line impact of its use as part of a selection system. For further information concerning this research or the results provided, please contact:
Hogan Assessment Systems P.O. Box 521176
Tulsa, Oklahoma 74152 (918) 749-0632
5.1 Accuracy and Completeness. Hogan completed all procedures within the requirements of both the Uniform Guidelines and the Principles. Hogan derived results strictly from data and archived study results and did not embellish, falsify, or alter results in any manner.
www.mentisglobal.com Distributed by Mentis [email protected]
33 Copyright Hogan Assessment Systems, Inc. 2013. All rights reserved.
Hogan attests to the accuracy of the data collection, analysis, and reporting procedures used in this validity study. The process of establishing criterion validity evidence proceeded from an analysis of leader studies from the Hogan archive. Hogan searched the archive for studies with leadership jobs and HPI and HDS data and, once identified, Hogan pooled data from these studies into a single SPSS/V.18.0 statistical software database. Hogan then computed the validity coefficients shown in this report.
www.mentisglobal.com Distributed by Mentis [email protected]
34 Copyright Hogan Assessment Systems, Inc. 2013. All rights reserved.
REFERENCES
Aguinis, H., Henle, C.A., & Ostroff, C. (2001). Measurement in work and organizational psychology. In N. Anderson, D.S. Ones, H.K. Sinangil, and C. Viswesvaran (Eds.), Handbook of Industrial, Work and Organizational
Allport, G. W. (1937). Personality: A psychological interpretation. New York, NY: Holt.
American Educational Research Association, American Psychological Association, & National Council on Measurement in Education (1999). Standards for educational and psychological testing. Washington, DC: American Psychological Association.
Axford, S. N. (1998). Review of the Hogan Personality Inventory (Revised). In J. C. Impara & B. S. Plake (Eds.), The thirteenth mental measurements yearbook. Lincoln, NE: Buros Institute of Mental Measurements.
Barrick, M. R., & Mount, M. K. (1991). The Big Five personality dimensions and job performance: A meta-analysis. Personnel Psychology, 44, 1-26.
Barrick, M. R., Mount, M. K., & Gupta, R. (2003). Meta-analysis of the relationship between the Five-Factor Model of personality and Holland’s occupational types. Personnel Psychology, 56, 45-74.
Barrick, M. R., Mount, M. K., & Judge, T. A. (2001). Personality and performance at the beginning of the new millennium: What do we know and where do we go next? International Journal of Selection and Assessment, 9, 9-30.
Benson, M. J., & Campbell, J. P. (2007). To be, or not to be, linear: An expanded representation of personality and its relationship to leadership performance. International Journal of Selection and Assessment, 15, 132-149.
Bentz, V. J. (1985, August). A view from the top: A thirty year perspective of research devoted to the discovery, description, and prediction of executive behavior. Paper presented at the 92nd Annual Convention of the American Psychological Association, Los Angeles, CA.
Berry, C. M., Ones, D. S., & Sackett, P. R. (2007). Interpersonal deviance, organizational deviance, and their common correlates. Journal of Applied Psychology, 92, 410-424.
www.mentisglobal.com Distributed by Mentis [email protected]
35 Copyright Hogan Assessment Systems, Inc. 2013. All rights reserved.
Bobko, P., Roth, P. L., & Potosky, D. (1999). Derivation and implications of a meta-analytic matrix incorporating cognitive ability, alternative predictors, and job performance. Personnel Psychology, 52, 561–589.
Bogg, T., & Roberts, B. W. (2004). Conscientiousness and health behaviors: A meta-analysis of the leading behavioral contributors to mortality. Psychological Bulletin, 130, 887-919.
Bono, J. E., & Judge, T. A. (2004). Personality and transformational and transactional leadership: A meta-analysis. Journal of Applied Psychology, 89, 901-910.
Borman, W. C., Penner, L. A., Allen, T. D., & Motowidlo, S. J. (2001). Personality predictors of citizenship performance. International Journal of Selection and Assessment, 9, 52-69.
Bray, D., & Howard, A. (1983). The AT&T longitudinal study of managers. In K. W. Schaie (Ed.), Longitudinal studies of adult psychological development (pp. 112-146). New York, NY: Guilford.
Briggs-Meyers, I., McCaulley, M. H., Quenk, N. L., & Hammer, A. L. (1998). MBTI manual. Palo Alto, CA: Consulting Psychologists Press.
Cascio, W. F., & Aguinis, H. (2001). The Federal Uniform Guidelines on Employee Selection Procedures (1978): An update on selected issues. Review of Public Personnel Administration, 21, 200-218.
Chiaburu, D. S., Oh, I., Berry, C. M., Li, N., & Gardner, R. G. (2011). The Five-Factor Model of personality traits and organizational citizenship behaviors: A meta-analysis. Journal of Applied Psychology, 96(6), 1140-1166.
Colquitt, J. A., LePine, J. A., & Noe, R. A. (2000). Toward an integrative theory of training motivation: A meta-analytic path analysis of 20 years of research. Journal of Applied Psychology, 85, 678-707.
Cooper-Hakim, A., & Viswesvaran, C. (2002). A meta-analytic review of the MacAndrew Alcoholism scale. Educational and Psychological Measurement, 62, 818-829.
Costa, P. T., Jr., & McCrae, R. R. (1992). Revised NEO Personality Inventory (NEO-PI-R) and NEO Five-Factor Inventory (NEO-FFI): Professional manual. Odessa, FL: Psychological Assessment Resources.
Creed, P., & Shackleton, V. (2007). Hogan Personality Inventory (HPI). In P. A. Lindley (Ed.), British Psychological Society Psychological Testing Centre test reviews. London, England: British Psychological Society.
www.mentisglobal.com Distributed by Mentis [email protected]
36 Copyright Hogan Assessment Systems, Inc. 2013. All rights reserved.
De Raad, B., & Perugini, M. (Eds.) (2002). Big Five assessment. Cambridge, MA: Hogrefe & Huber Publishing.
Digman, J. M. (1990). Personality structure: Emergence of the five-factor model. Annual Review of Psychology, 41, 417-440.
Dudley, N. M., Orvis, K. A., Lebiecki, J. E., & Cortina, J. M. (2006). A meta-analytic investigation of Conscientiousness in the prediction of job performance: Examining the intercorrelations and the incremental validity of narrow traits. Journal of Applied Psychology, 91, 40-57.
Emler, N. P. (1990). A social psychology of reputation. European Review of Social Psychology, 1, 173-193.
Ensari, N., Riggio, R., Christian, J., & Carslaw, G. (2011). Who emerges as a leader? Meta-analyses of individual differences as predictors of leadership emergence. Personality and Individual Differences, 51(4), 532-536.
Equal Employment Opportunity Commission (1978). Uniform guidelines on employee selection procedures. Federal Register, 43, 38,290-38,315.
Feist, G. J. (1998). A meta-analysis of personality in scientific and artistic creativity. Personality and Social Psychology Review, 2, 290-309.
Fico, J. M., Hogan, R., & Hogan, J. (2000). Interpersonal Compass manual and interpretation guide. Tulsa, OK: Hogan Assessment Systems.
Fleming, B. (2004, April). Predicting leadership effectiveness: Contributions of critical thinking, personality and derailers. Paper presented at the 19th Annual Conference of the Society for Industrial and Organizational Psychology, Chicago, IL.
Foster, J., & Vert, A. (2012). Analysis of adverse impact for the Hogan Personality Inventory, Hogan Development Survey, and the Motives, Values, Preferences Inventory. Tulsa, OK: Hogan Assessment Systems.
Fox, G., & Huebner, E. S. (2001). [Review of the Hogan Development Survey]. In B. S. Plake & J. C. Impara (Eds.), The fourteenth mental measurements yearbook. Lincoln, NE: Buros Institute of Mental Measurements.
Furnham, A., Crump, J., Batey, M., & Chamorro-Premuzic, T. (2009). Personality and ability predictors of the “consequences” test of divergent thinking in a large non-student sample. Personality and Individual Differences, 46, 536-540.
www.mentisglobal.com Distributed by Mentis [email protected]
37 Copyright Hogan Assessment Systems, Inc. 2013. All rights reserved.
Ghiselli, E. E., Campbell, J. P., & Zedeck, S. (1981). Measurement theory for the behavioral sciences. San Francisco, CA: W. H. Freeman.
Goffman, E. (1958). The presentation of self in everyday life. New York, NY: Doubleday.
Goldberg, L. R. (1990). An alternative “description of personality”: The Big-Five factor structure. Journal of Personality and Social Psychology, 59, 1216-1229.
Goldberg, L. R. (1992). The development of markers for the Big Five factor structure. Psychological Assessment, 4, 26-42.
Goldberg, L. R. (2000). [Hogan Personality Inventory and NEO PI-R correlation coefficients]. Unpublished raw data based on International Personality Item Pool Project.
Goldberg, L. R. (March, 2013). The Eugene-Springfield community sample: Information available from the research participants. (Tech. Rep. Vol. 48, No. 1). Eugene, OR: Oregon Research Institute.
Gruys, M. L., & Sackett, P. R. (2003). Investigating the dimensionality of counterproductive work behaviors. International Journal of Selection and Assessment, 11, 30-42.
Guion, R. M. (1961). Criterion measurement and personnel judgments. Personnel Psychology, 14, 141-149.
Hogan, J., & Foster, J. (in press). Multifaceted personality predictors of
workplace safety performance: More than conscientiousness. Human Performance.
Hathaway, S. R., & McKinley, J. C. (1943). Manual for the Minnesota
Multiphasic Personality Inventory. New York, NY: Psychological Corporation.
Hodgkinson, G., & Robertson, S. (2007). Hogan Development Survey (UK Edition) (HDS). In P. A. Lindley (Ed.), British Psychological Society Psychological Testing Centre test reviews. London, England: British Psychological Society.
Hogan Assessment Systems. (2009a). Hogan Express Report technical manual. Tulsa, OK: Hogan Press.
Hogan Assessment Systems. (2009b). HPI + HDS: Combining assessments to predict job performance. Tulsa, OK: Author.
www.mentisglobal.com Distributed by Mentis [email protected]
38 Copyright Hogan Assessment Systems, Inc. 2013. All rights reserved.
Hogan Assessment Systems. (2010). Hogan competency, domain, and job family synthetic validation results from the Hogan Personality Inventory and the Hogan Development Survey. Tulsa, OK: Author.
Hogan Assessment Systems. (2013). Express Report outcome highlights. Tulsa, OK: Author.
Hogan, J., Barrett, P., & Hogan, R. (2007). Personality measurement, faking, and employment selection. Journal of Applied Psychology, 92, 1270-1285.
Hogan, J., Hogan, R., & Kaiser, R. B. (2011). Management derailment. In Z. Sheldon (Ed.), APA handbook of industrial and organizational psychology (Vol. 3, pp. 555-575). Washington, DC: American Psychological Association.
Hogan, J., & Holland, B. (2003). Using theory to evaluate personality and job-performance relations: A socioanalytic perspective. Journal of Applied Psychology, 88, 100-112.
Hogan, R. (1983). A socioanalytic theory of personality. In M. M. Page (Ed.), 1982 Nebraska symposium on motivation (pp. 55-89). Lincoln, NE: University of Nebraska Press.
Hogan, R., Chamorro-Premuzic, T., & Kaiser, R. B. (2013). Employability and career success: Bridging the gap between theory and reality. Industrial and Organizational Psychology: Perspectives on Science and Practice, 6(1), 3-16.
Hogan, R., & Hogan, J. (1995). Hogan Personality Inventory manual (2nd ed.). Tulsa, OK: Hogan Assessment Systems.
Hogan, R., & Hogan, J. (1997). Hogan Development Survey manual. Tulsa, OK: Hogan Assessment Systems.
Hogan, R., & Hogan, J. (2001). Assessing leadership: A view from the dark side. International Journal of Selection and Assessment, 9, 40-51.
Hogan, R., & Hogan, J. (2007). Hogan Personality Inventory manual (3rd ed.). Tulsa, OK: Hogan Assessment Systems.
Hogan, R., & Hogan, J. (2009). Hogan Development Survey manual (2nd ed.). Tulsa, OK: Hogan Press.
Hogan, R., Hogan, J., & Trickey, J. (1999). Goodbye mumbo jumbo: The transcendental beauty of a validity coefficient. Selection Development Review, 15, 3-9.
www.mentisglobal.com Distributed by Mentis [email protected]
39 Copyright Hogan Assessment Systems, Inc. 2013. All rights reserved.
Horney, K. (1950). Neurosis and human growth. New York, NY: Norton.
Hough, L. M. (1992). The “Big Five” personality variables—construct confusion: Description versus prediction. Human Performance, 5, 139-156.
Hough, L. M., & Dilchert, S. (2007, October). Inventors, innovators, and their leaders: Selecting for Conscientiousness will keep you “inside the box.” Paper presented at SIOP’s 3rd Leading Edge Consortium: Enabling Innovation in Organizations, Kansas City, MO.
Hough, L. M., Ones, D. S., & Viswesvaran, C. (1998, April). Personality correlates of managerial performance constructs. In R. Page (Chair), Personality determinants of managerial potential, performance, progression and ascendancy. Symposium conducted at the 13th annual conference of the Society for Industrial and Organizational Psychology, Dallas, TX.
Hough, L. M., & Oswald, F. L. (2008). Personality testing and industrial-organizational psychology: Reflections, progress, and prospects. Industrial Organizational Psychologist, 1, 272-290.
Hunter, J. E., & Schmidt, F. L. (2004). Methods of meta-analysis: Correcting error and bias in research findings (2nd ed.). Thousand Oaks, CA: Sage.
Hurtz, G. M., & Donovan, J. J. (2000). Personality and job performance: The big five revisited. Journal of Applied Psychology, 85, 869-879.
Jensen, J. M., & Patel, P. C. (2011). Predicting counterproductive work behavior from the interaction of personality traits. Personality and Individual Differences, 51(4), 466-471.
John, O. P. (1990). The “Big-Five” factor taxonomy: Dimensions of personality in the natural language and in questionnaires. In L. A. Pervin (Ed.), Handbook of personality theory and research (pp. 66-100). New York, NY: Guilford.
Judge, T. A., Bono, J. E., Ilies, R., & Gerhardt, M. W. (2002). Personality and leadership: A qualitative and quantitative review. Journal of Applied Psychology, 87, 765-780.
Judge, T. A., Heller, D., & Mount, M. K. (2002). Five-factor model of personality and job satisfaction: A meta-analysis. Journal of Applied Psychology, 87, 530-541.
www.mentisglobal.com Distributed by Mentis [email protected]
40 Copyright Hogan Assessment Systems, Inc. 2013. All rights reserved.
Judge, T. A., & Ilies, R. (2002). Relationship of personality to performance motivation: A meta-analytic review. Journal of Applied Psychology, 87, 797-807.
Kaiser, R. B., & Hogan, J. (2011). Personality, leader behavior, and overdoing it. Consulting Psychology Journal: Practice and Research, 63(4), 219-242.
Kaiser, R. B., LeBreton, J. M., & Hogan, J. (in press). The dark side of personality and ineffective leadership. Applied Psychology: An International Review.
Kalshoven, K., Den Hartog, D., & De Hoogh, A. (2011). Ethical leader behavior and Big Five factors of personality. Journal of Business Ethics, 100(2), 349-366.
Kaplan, R. E., & Kaiser, R. B. (2009). Stop overdoing your strengths. Harvard Business Review, 87 (2), 62-69.
Khoo., H. S., & Burch, G. J. (2008). The “dark side” of leadership personality and transformation leadership: An exploratory study. Personality and Individual Differences, 44, 86-97.
LePine, J. A., Erez, A., & Johnson, D. E. (2002). The nature and dimensionality
of organizational citizenship behavior: A critical review and meta-analysis. Journal of Applied Psychology, 87, 52-65.
Leslie, J., & Van Velsor, E. (1996). A look at derailment today: North America and Europe. Greensboro, NC: Center for Creative Leadership.
Lievens, F., Ones, D., & Dilchert, S. (2009). Personality scale validities increase throughout medical school. Journal of Applied Psychology, 94, 1514-1535.
Lobello, S. G. (1998). Review of the Hogan Personality Inventory (Revised). In J. C. Impara & B. S. Plake (Eds.), The thirteenth mental measurements yearbook. Lincoln, NE: Buros Institute of Mental Measurements.
Marshall, L. A., & Lindley, P. (Eds.) (2009). Hogan Personality Inventory (HPI). British Psychological Society Psychological Testing Centre test reviews. London, England: British Psychological Society.
McCrae, R. R., & Costa, P. T., Jr. (1987). Validation of the five-factor model of personality across instruments and observers. Journal of Personality and Social Psychology, 52, 81-90.
www.mentisglobal.com Distributed by Mentis [email protected]
41 Copyright Hogan Assessment Systems, Inc. 2013. All rights reserved.
McGrath, R. E., Mitchell, M., Kim, B. H., & Hough, L. (2010). Evidence of response bias as a source of error variance in applied assessment. Psychological Bulletin, 136, 450-470.
McPhail, S. M. (2007). Alternative validation strategies. San Francisco, CA: Jossey-Bass.
Minbashian, A., Earl, J., & Bright, J. E. H. (2013). Openness to Experience as a predictor of job performance trajectories. Applied Psychology: An International Review, 62(1), 1-12.
Mol, S. T., Born, M. P. H., Willemsen, M. E., & Van Der Molen, H. T. (2005). Predicting expatriate job performance for selection purposes: A quantitative review. Journal of Cross-Cultural Psychology, 36, 590-620.
Morgan, C. D., & Murray, H. A. (1935). A method for investigating fantasies: The Thematic Apperception Test. Archives of Neurology and Psychiatry, 34, 289-306.
Morris, S., & Lobsenz, R. E. (2000). Significance tests and confidence-intervals for the adverse impact ratio. Personnel Psychology, 53, 89–111.
Mount, M. K., & Barrick, M. R. (1995). The big five personality dimensions: Implications for research and practice in human resources management. In G. R. Ferris (Ed.), Research in Personnel and Human Resources Management, 13, 153-200.
Mount, M. K., & Barrick, M. R. (2001). Personal Characteristics Inventory manual. Libertyville, IL: Wonderlic.
Ng, T. W. H., Eby, L. T., Sorensen, K. L., & Feldman, D. C. (2005). Predictors of objective and subjective career success: A meta-analysis. Personnel Psychology, 58, 367-408.
Norman, W. T. (1963). Toward an adequate taxonomy of personality attributes: Replicated factor structure in peer nomination personality ratings. Journal of Abnormal and Social Psychology, 66, 574-583.
O’Connor, M. C., & Paunonen, S. V. (2007). Big Five personality predictors of post-secondary academic performance. Personality and Individual Differences, 43, 971-990.
Oh, I., & Berry, C. M. (2009). The five-factor model of personality and managerial performance: Validity gains through the use of 360 degree performance ratings. Journal of Applied Psychology, 94, 1498-1513.
www.mentisglobal.com Distributed by Mentis [email protected]
42 Copyright Hogan Assessment Systems, Inc. 2013. All rights reserved.
Oh, I., Wang, G., & Mount, M. K. (2011). Validity of observer ratings of the Five-Factor Model of personality traits: A meta-analysis. Journal of Applied Psychology, 96, 762-773.
O’Neill, T. A., & Allen, N. J. (2011). Personality and the prediction of team performance. European Journal of Personality, 25(1), 31-42.
Ones, D. S., Viswesvaran, C., & Schmidt, F. L. (1993). Comprehensive meta-analysis of integrity test validation: Findings and implications for personnel selection and theories of job performance. Journal of Applied Psychology, 78, 679-703.
Ones, D. S., Viswesvaran, C., & Schmidt, F. L. (2003). Personality and absenteeism: A meta-analysis of integrity tests. European Journal of Personality, 17, S19-S38.
Organ, D. W., & Ryan, K. (1995). A meta-analytic review of attitudinal and dispositional predictors of organizational citizenship behavior. Personnel Psychology, 48, 775-802.
Ozer, D. J., & Benet-Martinez, V. (2006). Personality and the prediction of consequential outcomes. Annual Review of Psychology, 57, 8.1-8.21.
Panaccio, A., & Vandenberghe, C. (2012). Five-factor model of personality and organizational commitment: The mediating role of positive and negative affective states. Journal of Vocational Behavior, 80(3), 647-658.
Paunonen, S. V., Haddock, G., Forsterling, F., & Keinonen, M. (2003). Broad versus narrow personality measures and the prediction of behaviour across cultures. European Journal of Personality, 17, 413-433.
Peeters, A. G. M., Van Tuijl, H. F. J. M., Rutte, C. G., & Reymen, I. M. M. J. (2006). Personality and team performance: A meta-analysis. European Journal of Personality, 20, 377-396.
Reilly, R. R., & Chao, G. (1982). Validity and fairness of some alternative employee selection procedures. Personnel Psychology, 35, 1–62.
Reilly, R. R., & Warech, M. A. (1993). The validity and fairness of alternatives to cognitive ability tests. In L. Wing & B. Gifford (Eds.), Policy issues in employment testing (pp. 131–224). Boston, MA: Kluwer.
Roberts, B. W., Chernyshenko, O. S., Stark, S., & Goldberg, L. R. (2005). The structure of Conscientiousness: An empirical investigation based on seven major personality questionnaires. Personnel Psychology, 58, 103-139.
www.mentisglobal.com Distributed by Mentis [email protected]
43 Copyright Hogan Assessment Systems, Inc. 2013. All rights reserved.
Roberts, B. W., Kuncel, N. R., Shiner, R., Caspi, A., & Goldberg, L. R. (2007). The power of personality: The comparative validity of personality traits, socioeconomic status, and cognitive ability for predicting important life outcomes. Perspectives on Psychological Science, 2, 313-345.
Roth, P. L., Bobko, P., & Switzer, F. S. (2006). Modeling behavior of 4/5ths
rule for determining adverse impact: Reasons for caution. Journal of Applied Psychology, 91, 507-522.
Rothstein, M. G., Paunonen, S. V., Rush, J. C., & King, G. A. (1994). Personality and cognitive ability predictors of performance in graduate business school. Journal of Educational Psychology, 86, 516-530.
Rotter, J. (1966). Generalized expectancies for internal vs. external control of reinforcement. Psychological Monographs, 80 (Whole No. 609).
Salgado, J. F., & Moscoso, S. (1999, May). Construct validity of two personality inventories based upon the five-factor model (FFM). Paper presented at the 14th Annual Conference of the Society for Industrial and Organizational Psychology, Atlanta, GA.
Schmit, M. J., Lundquist, K. K., & Beckham, S. K. (2008, April). Expert opinions on the “shelflife” of a validation study. Poster session presented at the 23rd Annual Conference of the Society for Industrial Organizational Psychology, San Francisco, CA.
Schmitt, N., Rogers, W., Chan, D., Sheppard, L., & Jennings, D. (1997). Adverse impact and predictive efficiency of various predictor combinations. Journal of Applied Psychology, 82, 719–730.
Shoben, E. W. (1978). Differential pass rates in employment testing: Statistical proof under Title VII. Harvard Law Review, 91, 793-781.
Society for Industrial and Organizational Psychology (2003). Principles for the validation and use of personnel selection procedures (4th ed.). Bowling Green, OH: Author.
Steel, P. (2007). The nature of procrastination: A meta-analytic and theoretical review of quintessential self-regulatory failure. Psychological Bulletin, 133, 65-94.
Steel, P., Schmidt, J., & Shulz, J. (2008). Refining the relationship between personality and subjective well-being. Psychological Bulletin, 134, 138-161.
Thurstone, L. L. (1934). The vectors of mind. Psychological Review, 41, 1-32.
www.mentisglobal.com Distributed by Mentis [email protected]
44 Copyright Hogan Assessment Systems, Inc. 2013. All rights reserved.
Tupes, E. C., & Christal, R. E. (1961). Recurrent personality factors based on trait ratings (ASD-TR-61-97). Lackland Air Force Base, TX: Aeronautical Systems Division, Personnel Laboratory.
U.S. Department of Labor (1991). Dictionary of occupational titles. Washington, DC: U.S. Government Printing Office.
Van Iddekinge, C. H., & Ployhart, R. E. (2008). Developments in the criterion-related validation of selection procedures: A critical review and recommendations for practice. Personnel Psychology, 61, 871-925.
Van Iddekinge, C. H., Roth, P. L., Raymark, P. H., & Odle-Dusseau, H. N.
(2012). The criterion-related validity of integrity tests: An updated meta-analysis. Journal of Applied Psychology, 97(3), 499-530.
Wiggins, J. S. (1996). The five-factor model of personality. New York, NY: Guilford.
Wiggins, J. S., & Pincus, A. L. (1992). Personality structure and assessment. Annual Review of Psychology, 43, 473-504.
Wille, B., De Fruyt, F., Feys, M. (2013). Big Five traits and intrinsic success in
the new career era: A 15-year longitudinal study on employability and work-family conflict. Applied Psychology: An International Review, 62(1), 124-156.
Zhao, H., & Seibert, S. (2006). The Big Five personality dimensions and
entrepreneurial status: A meta-analytical review. Journal of Applied Psychology, 91, 259-271.
www.mentisglobal.com Distributed by Mentis [email protected]