Embed Size (px)
Citation preview
Benallou Benzekri et al., JMES, 2018, 9 (1), pp. 272-284 272
J. Mater. Environ. Sci., 2018, Volume 9, Issue 1, Page 272-284
https://doi.org/10.26872/jmes.2018.9.1.31
http://www.jmaterenvironsci.com
Journal of Materials and Environmental Sciences ISSN : 2028-2508 CODEN : JMESCN
Copyright © 2017, University of Mohammed Premier Oujda Morocco
1. Introduction Dyes and detergents are being used extensively throughout the modern world. The textile industry is one of the
most polluting and water consuming activities. It generates highly toxic water discharge because of the presence
of various chemical compounds: organic dyes, surfactants and heavy metals [1, 2]. Dyes cause visible persistent
staining and are difficult to biodegrade [3] even at very low concentrations, sometimes less than 1 mg L-1
[4].
Staining can therefore persist in the effluent after biological treatment, which requires the use of tertiary
treatment. To reduce the impact of this kind of pollution, several technologies have been used, including
chemical and physical techniques. However, these methods have not always been successful [5, 6]. On the other
hand, adsorption has proved to be promising for the removal of organic molecules. Activated carbon has widely
been used because of its high adsorption capacity of organic species [7, 8].
Oil residue, natural coal and wood are known as the main precursors of activated carbons [9]. But in the past
few decades, other low–cost and readily available precursors have been used. For example, coconut [10],
petroleum coke [11], bamboo [12], rice husks, bagasse [13], pecan shells [14], olive stones [15, 16], date pits
[17], artichoke leaves [18], coffee bean residue [19]… The removal of organic dyes and particularly Methylene
blue (MB) by activated carbon granules were studied by several authors [20-23]. The adsorption of cationic MB
is also known for the determination of specific surface area or of the MB index used to qualify industrial
adsorbents [6, 24]. This work aims at valorizing olive stones as an agricultural waste into a useful granular
activated carbon (GAC) and comparing its Methylene blue adsorption capacity to that of a commercial one
(Organosorb 10).
The first part of this work is devoted to the batch study of the adsorption of MB on both granular activated
carbons. The influence of parameters such as equilibrium time, pH of the solution, along with dye adsorption
isotherms was investigated. The second part concerns the study of adsorption in a continuous process (on fixed
bed column). The influence of bed height, flow rate and concentration of Methylene blue on adsorption was
examined and the "Bed depth Service time" (BDST) model was applied to predict the performance of such a
system.
Valorization of olive stones into a granular activated carbon for the removal of
Methylene blue in batch and fixed bed modes
M. Benallou Benzekri 1 *, N. Benderdouche
1, B. Bestani
1, N. Douara
1, L. Duclaux
2
1 . Laboratoire Structure, Elaboration et Application des Matériaux Moléculaires, Université de Mostaganem, Algeria
2. Laboratoire de Chimie Moleculaire et Environnement (LCME), Un Université de Savoie, Le Bourget du lac 73376, France
Abstract This work aims at valorizing olive stones as an agricultural waste into an
efficient granular activated carbon for the removal of Methylene blue in batch
and fixed bed modes from aqueous solutions. The adsorption capacity of the
prepared activated carbon was evaluated using these two modes. The activated
carbon preparation was carried out in two steps: an impregnation with 50%
phosphoric acid at 170 °C for 2.5 hours followed by physical activation using
steam at 750 °C. Nitrogen adsorption studies at 77 K on the prepared and
commercial (Organosorb 10) activated carbons resulted in specific surface areas
of 1031.5 and 1029.2 m2.g
-1, respectively. The Langmuir model was found to
describe correctly the isothermal adsorption of Methylene blue for both
adsorbents and resulted in adsorption capacities for the olive stone activated
carbon of 107 mg.g-1
and 121 mg.g-1
for the commercial one. This study shows
that olive stones as a waste can be valorized into a value added adsorbent that can
replace effectively costly commercial materials.
Received 25 Feb 2017,
Revised 04 Jun 2017,
Accepted 10 Jun 2017
Keywords
Olive stone;
activated carbon;
Depollution;
Adsorption column;
M. Benallou Benzekri
Benallou Benzekri et al., JMES, 2018, 9 (1), pp. 272-284 273
2. Material and methods 2.1. Adsorbent preparation
In this work, olive stones were first washed extensively with hot tap water then dried 24 hours at 105 °C and
crushed in a grinder mortar. After drying, impregnation of the crushed stone particles (≤ 2 mm) was carried out
in 50 % weight phosphoric acid for two hours and a half at 170 °C to dehydrate and stabilize the precursor. In a
second step, the impregnated precursor was steam activated at 750 °C for two hours in a tubular furnace
(Carbolite Furnaces, Banford, Sheffield - ENGLAND) [16]. A steam generator (GENERAL VAPEUR, Patent
by GV - ITALY) was used to generate the steam which was fed to the tubular furnace. The obtained adsorbent
was washed with hydrochloric acid (0.1 M) to remove any impurities, and with distilled water until the washing
water tested with lead acetate revealed no phosphorous presence [25]. Organosorb 10, a commercial activated
carbon developed for the purification of process or potable water was used as a reference material (DESOTEC,
12-40 mesh, (0.425-1.7 mm)). The range of particle size to be studied (0.5 - 1 mm) was obtained by using a
sieving vibrating machine (Retsch 5657 HAAN 1, type VIBRO – GERMANY) for both activated carbons.
Apparent density was measured by the ratio of the mass to a given volume by introducing a given amount of
activated carbon sample into a 50 mL graduated cylinder and weighing the empty cylinder (m0) and the
compacted filled cylinder (m1).
2.2. Adsorbent characterization
2.2.1. Iodine number
Iodine number is a widely used parameter for activated carbon testing due to its simplicity and rapid assessment
of adsorbent quality. It gives an estimate of its microporous volume. Iodine number is defined as the milligrams
of iodine adsorbed by one gram of material when the iodine residual concentration of the filtrate is 0.02 N (0.01
mol L-1
) according to ASTM D4607 standard [26], which is based on a three-point isotherm. A standard iodine
solution (0.1 N) is treated with three different weights of biosorbent. The sample is treated with 10 mL of 5%
(v/v) HCl. The mixture is boiled for 30 s and then cooled at room temperature. 100 mL of 0.1N iodine solution
is immediately added to the mixture and stirred for 30 s. The solution is then filtered and 50 mL of the filtrate is
titrated with 0.1 N (0.05 mol L-1
) sodium thiosulphate solution using thyodene as an indicator. The amount of
iodine adsorbed per gram of adsorbent is plotted against the residual iodine concentration, using logarithmic
axes.
2.2.2. Determination of the surface area accessible to Methylene Blue
MB is a reference dye used to estimate the specific surface area of the absorbent accessible to adsorbate
corresponding to the surface area of wide micropores and small mesopores. The available specific surface area
SMB (m2 g
-1), for MB molecule is calculated by the following equation:
MB
b N SS
M
(1),
where SMB is the surface area (m2
g-1
), b the maximum adsorption capacity (mg g-1
) based on a monolayer
coverage. It can be determined from the Langmuir model, N is Avogadro’s number (6.023 1023
mol-1
), S is
surface occupied by a molecule of Methylene Blue (taken as 119 Å2), and M is the molecular weight of
Methylene Blue (319.86 g mol-1
) [27].
2.2.3. BET Specific surface area The N2 adsorption–desorption isotherms of the sorbents were measured using an automatic adsorption
instrument (ASAP 2020, Micromeritics) at liquid nitrogen temperature (77 K). Prior to measurements,
adsorbent samples were degassed at 300 °C for 12 hours under secondary vacuum. The specific surface areas
(SBET) of the adsorbents were calculated using the BET (Brunauer–Emmett–Teller) equation by assuming the
area of the nitrogen molecule to be 16.2 Å2.
0 m m 0
P 1 c 1 P
V P P V c V c P
(2),
where P and P0 are the equilibrium and the saturation pressure of adsorbates at the temperature of adsorption, V
is the adsorbed gas volume, and Vm is the monolayer adsorbed gas volume. c is the BET constant.
2.2.4. Infrared spectroscopy
A mass of 1 mg of activated carbon sample was mixed with 100 mg of potassium bromide (Biochem
Chemapharma). The obtained powder was pressed at 350 MPa and dried for 48 hours at 105 °C. Analyses were
then carried out on a IR (Prestige – 21 Shimadzu) spectrophotometer. FTIR spectra were then recorded in the
wave number range 4000–400 cm−1
at 1 cm−1
spectral resolution.
Benallou Benzekri et al., JMES, 2018, 9 (1), pp. 272-284 274
2.2.5. pH of zero point charge (pHZPC)
One of the important parameters for the adsorbent is pHZPC which indicates electrical neutrality of adsorbent
surface [15]. pHZPC is defined as the pH for which there is neutral charge on the surface of the adsorbent. The
determination of the point of zero charge (pHZPC) of the activated carbons was carried out as follows: initially;
50 mL of 0.01 M NaCl solutions were put into several closed Erlenmeyer flasks. The pH within each flask was
adjusted to a value between 2 and 12 by adding HCl (0.1 M) and NaOH (0.1 M) solutions, measured with a
Hanna instrument pH meter and noted as pHinitial. After having reached a constant value of pHinitial, 0.15 g of
activated carbon sample was added into each flask. The flasks were agitated for 48 h and the final pH was then
measured and noted pHfinal The pHZPC is the value at which pHfinal = pHinitial [16].
2.2.6. Surface chemistry of activated carbons
Boehm titration was conducted to determine the number and type of surface oxygen groups [17]. Surface
functional groups were quantified by assuming that NaOC2H5 reacted with all groups. The amount of various
acidic sites was calculated by assuming that NaOH neutralizes carboxylic, lactonic and phenolic groups;
Na2CO3 reacts with carboxylic and lactonic groups; and NaHCO3 corresponds only to carboxylic group. 0.3 g of
sample was placed into 30 mL of each solution (0.1 N) for 48 h to reach equilibrium. The acidic oxygen-
containing surface groups were determined by back titration with 0.1 N HCl solution.
2.3. Adsorption of Methylene Blue
Adsorption studies of MB were carried out on the two granular activated carbons: the olive stone based GAC
and the commercial Organosorb 10 GAC.Two adsorption modes were investigated: • Batch mode (discontinuous process);
• Continuous mode (dynamic process)
Aqueous solutions of known concentrations of Methylene Blue (Merck, dye content ≥ 85%) were prepared by
dissolving the exactly weighed amounts in distilled water (Table 1).
Table 1: Some characteristics of Methylene Blue.
Chemical structure
Chemical formula C16H18ClN3S
Solubility at 20 °C 35.5 g L-1
2.3.1. Batch adsorption study
Effect of contact time
A 25 mL of two initial Methylene Blue solutions of concentrations 100 and 200 mg L-1
were mixed with 0.1 g
of each adsorbent used. The effect of contact time was determined for (1- 6 hours) at the initial MB solution pH
of 6.65.
Effect of adsorbent dose
The effect of the adsorbent dose was studied by varying the adsorbent amounts from 4 to 16 g L-1
for an initial
MB concentration of 300 mg L-1
(at pH = 6.65).
Effect of pH
Volumes of 25 mL of Methylene Blue solution of known concentration were successively introduced into a
series of beakers containing each 0.25 g of adsorbent; pH was varied from 2 to 12 at ambient temperature by
adding either 0.1 N HCl or NaOH solutions. The mixture was stirred for 4 hours as determined from kinetic
tests, then filtered and analyzed by spectrophotometry.
Isothermal adsorption of Methylene Blue: batch study
In a series of capped Erlenmeyer flasks, 0.25 g of olive stone based GAC or commercial GAC were placed in
contact with 25 mL of MB solutions of varying initial concentration C0 (300-1700 mg L-1
). The system,
maintained at 25 °C, was stirred for 4 hours. Kinetic studies showed that a contact time of 4 hours for the
Benallou Benzekri et al., JMES, 2018, 9 (1), pp. 272-284 275
GAC/MB system was amply sufficient for both materials. After centrifugation at 4000 rpm for 15 minutes, the
filtrates were analyzed at 665 nm using a Jenway 7305 spectrophotometer and the quantity qe (mass adsorbed
per gram of GAC) was determined from the following equation:
0 eq
e
C C Vq
1000 m
(3)
where C0 is the initial concentration of adsorbate (mg L-1
), Ceq the equilibrium concentration of adsorbate (mg L-
1), m the activated carbon mass (g), and V the solution volume (mL).
The Langmuir and Freundlich adsorption isotherm equations were used to simulate the experimental adsorption
data. The Langmuir isotherm model was chosen for estimation of the maximum adsorption capacity
corresponding to complete monolayer coverage on the sorbent surface. The generalized non-linear form of the
Langmuir isotherm is represented by [18]:
L eqe
L eq
K b Cq
1 K C
(4)
where KL and b are the Langmuir constants related to adsorption energy and maximum capacity corresponding
to complete monolayer coverage, respectively. The term of constant separation factor (RL) is one of the essential
dimensionless equilibrium parameters of the Langmuir isotherm modeling, which is defined by the following
equation [19]:
L
L 0
1R
1 K C
(5)
where C0 is the initial dye concentration (mg.L-1
) and KL is Langmuir isotherm constant (L.mg-1
). The RL values
indicate the type of the isotherm to be either unfavorable (RL > 1), linear (RL = 1), favorable (0 < RL < 1) or
irreversible (RL = 0).
The Freundlich model is used for the description of non–ideal sorption on heterogeneous surfaces and
multilayer adsorption processes based on the interaction between adsorbed molecules at different energies [19].
The Freundlich equation is given by the following formula: 1/ n
e F eqq K C (6)
where KF is a constant related to adsorption capacity and (n) to heterogeneity.
2.3.2. Fixed bed study
Column adsorption experiments were carried out in a glass column with an inner diameter of 1.2 cm and a
column height of 50 cm at a temperature of 25°C. The granular activated carbon particles size in the range 0.5-1
mm were placed between two supporting layers of glass-wool oensure uniform distribution and column packing.
The solution was pumped using a pump, connected with Teflon tubes from the sample tank to the top of the
column (down flow pattern). Flow was checked at the outlet of the column by two valves, one controls excess
pump flow and the other controls the flow-meter to avoid and reduce flow fluctuations that may occur inside the
bed column.
Prior to each experiment, distilled water was passed through the column to rid the column from impurities and
air bubbles. Experiments were carried out at different bed heights (2, 3 and 4 cm), influent flow rates (3, 4 and 5
mL min-1
) and influent MB concentrations (100, 150 and 200 mg L-1
), at specified pH as fed from a 25 L
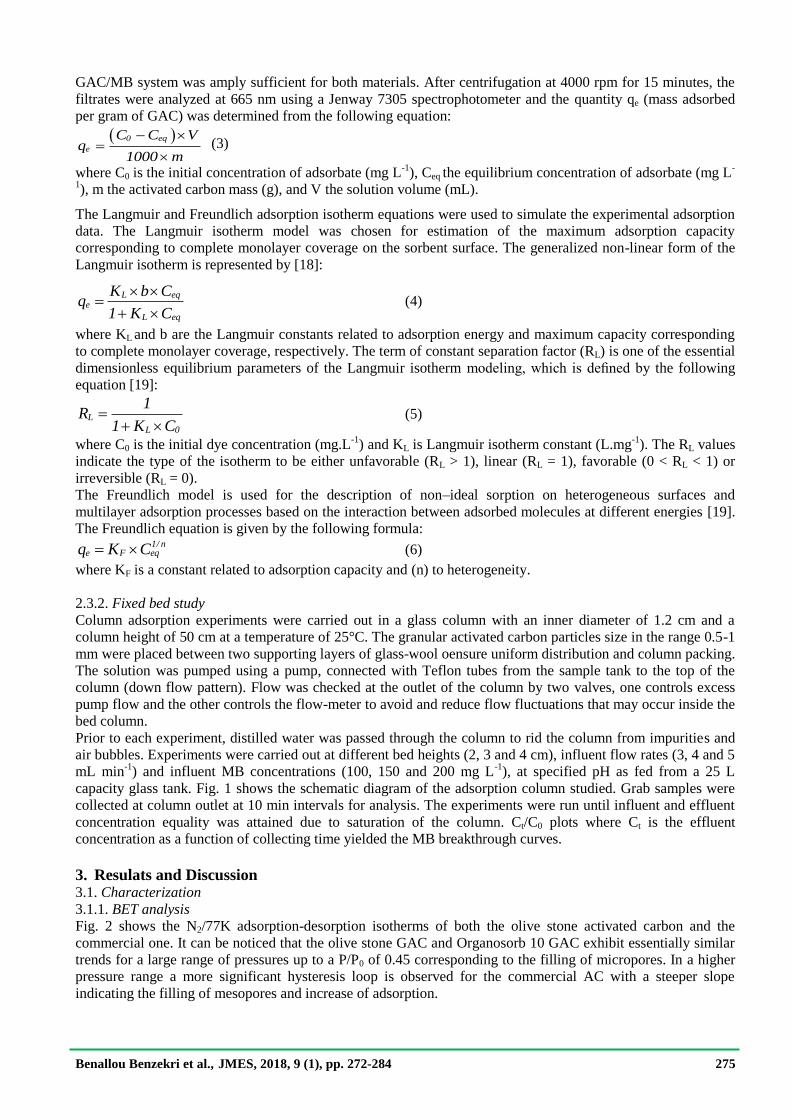
capacity glass tank. Fig. 1 shows the schematic diagram of the adsorption column studied. Grab samples were
collected at column outlet at 10 min intervals for analysis. The experiments were run until influent and effluent
concentration equality was attained due to saturation of the column. Ct/C0 plots where Ct is the effluent
concentration as a function of collecting time yielded the MB breakthrough curves.
3. Resulats and Discussion 3.1. Characterization
3.1.1. BET analysis
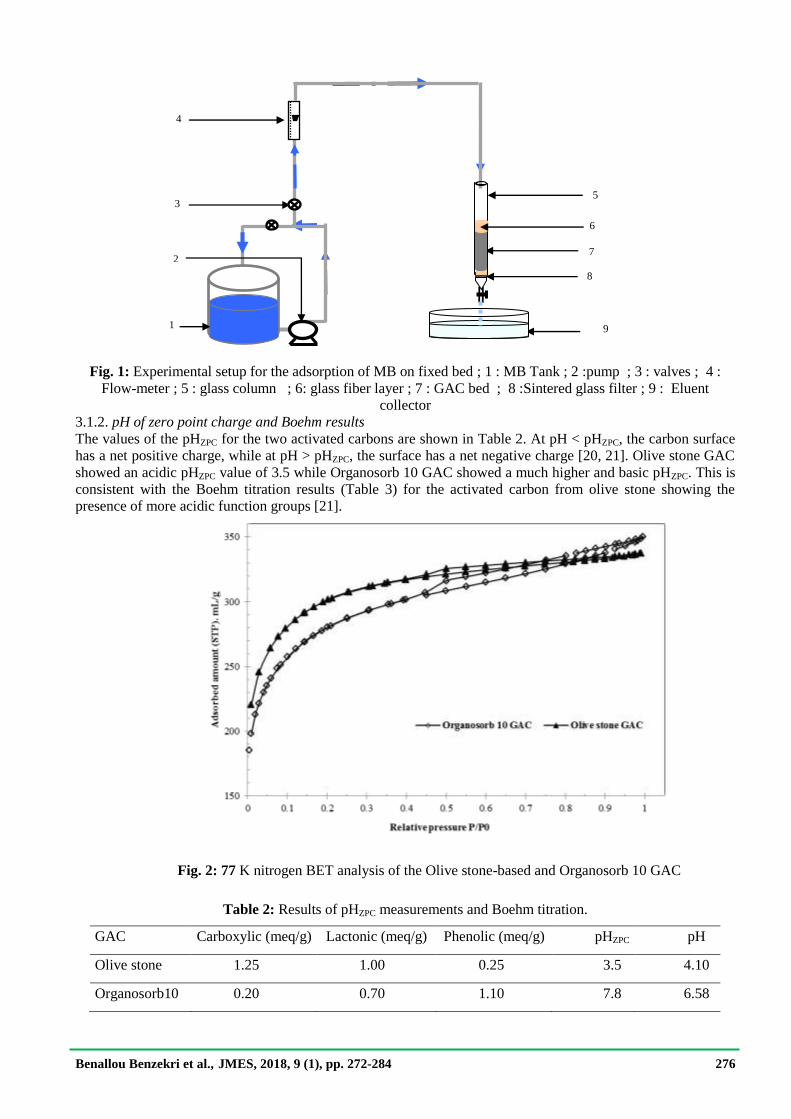
Fig. 2 shows the N2/77K adsorption-desorption isotherms of both the olive stone activated carbon and the
commercial one. It can be noticed that the olive stone GAC and Organosorb 10 GAC exhibit essentially similar
trends for a large range of pressures up to a P/P0 of 0.45 corresponding to the filling of micropores. In a higher
pressure range a more significant hysteresis loop is observed for the commercial AC with a steeper slope
indicating the filling of mesopores and increase of adsorption.
Benallou Benzekri et al., JMES, 2018, 9 (1), pp. 272-284 276
Fig. 1: Experimental setup for the adsorption of MB on fixed bed ; 1 : MB Tank ; 2 :pump ; 3 : valves ; 4 :
Flow-meter ; 5 : glass column ; 6: glass fiber layer ; 7 : GAC bed ; 8 :Sintered glass filter ; 9 : Eluent
collector
3.1.2. pH of zero point charge and Boehm results
The values of the pHZPC for the two activated carbons are shown in Table 2. At pH < pHZPC, the carbon surface
has a net positive charge, while at pH > pHZPC, the surface has a net negative charge [20, 21]. Olive stone GAC
showed an acidic pHZPC value of 3.5 while Organosorb 10 GAC showed a much higher and basic pHZPC. This is
consistent with the Boehm titration results (Table 3) for the activated carbon from olive stone showing the
presence of more acidic function groups [21].
Fig. 2: 77 K nitrogen BET analysis of the Olive stone-based and Organosorb 10 GAC
Table 2: Results of pHZPC measurements and Boehm titration.
GAC Carboxylic (meq/g) Lactonic (meq/g) Phenolic (meq/g) pHZPC pH
Olive stone 1.25 1.00 0.25 3.5 4.10
Organosorb10 0.20 0.70 1.10 7.8 6.58
6
3
1
2 7
9
4
5
8
Benallou Benzekri et al., JMES, 2018, 9 (1), pp. 272-284 277
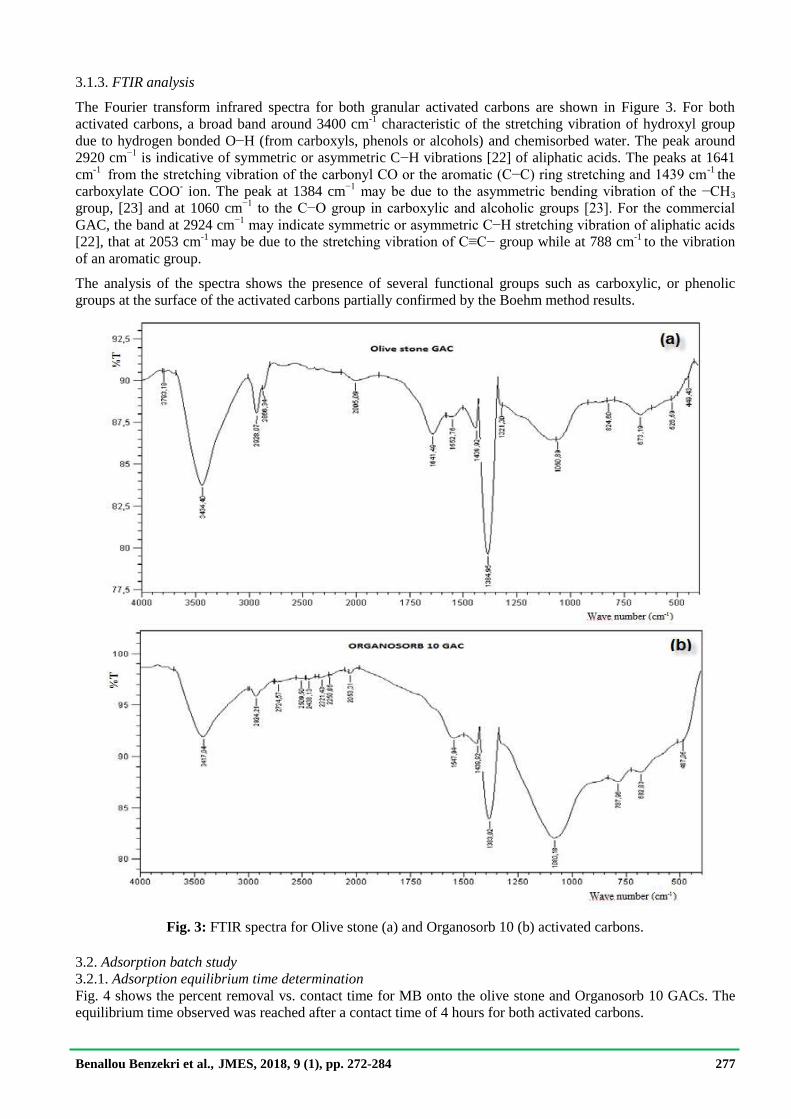
3.1.3. FTIR analysis
The Fourier transform infrared spectra for both granular activated carbons are shown in Figure 3. For both
activated carbons, a broad band around 3400 cm-1
characteristic of the stretching vibration of hydroxyl group
due to hydrogen bonded O−H (from carboxyls, phenols or alcohols) and chemisorbed water. The peak around
2920 cm−1
is indicative of symmetric or asymmetric C−H vibrations [22] of aliphatic acids. The peaks at 1641
cm-1
from the stretching vibration of the carbonyl CO or the aromatic (C−C) ring stretching and 1439 cm-1
the
carboxylate COO- ion. The peak at 1384 cm
−1 may be due to the asymmetric bending vibration of the −CH3
group, [23] and at 1060 cm−1
to the C−O group in carboxylic and alcoholic groups [23]. For the commercial
GAC, the band at 2924 cm−1
may indicate symmetric or asymmetric C−H stretching vibration of aliphatic acids
[22], that at 2053 cm-1
may be due to the stretching vibration of C≡C− group while at 788 cm-1
to the vibration
of an aromatic group.
The analysis of the spectra shows the presence of several functional groups such as carboxylic, or phenolic
groups at the surface of the activated carbons partially confirmed by the Boehm method results.
Fig. 3: FTIR spectra for Olive stone (a) and Organosorb 10 (b) activated carbons.
3.2. Adsorption batch study
3.2.1. Adsorption equilibrium time determination
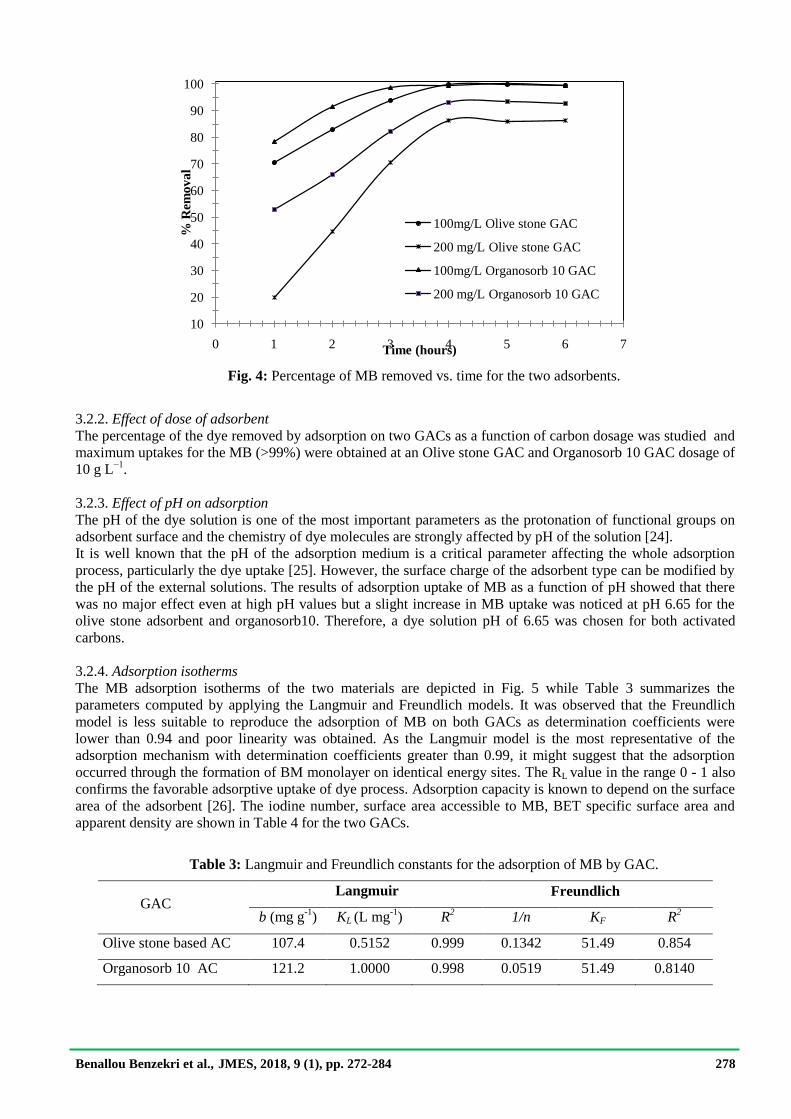
Fig. 4 shows the percent removal vs. contact time for MB onto the olive stone and Organosorb 10 GACs. The
equilibrium time observed was reached after a contact time of 4 hours for both activated carbons.
Benallou Benzekri et al., JMES, 2018, 9 (1), pp. 272-284 278
Fig. 4: Percentage of MB removed vs. time for the two adsorbents.
3.2.2. Effect of dose of adsorbent
The percentage of the dye removed by adsorption on two GACs as a function of carbon dosage was studied and
maximum uptakes for the MB (>99%) were obtained at an Olive stone GAC and Organosorb 10 GAC dosage of
10 g L−1
.
3.2.3. Effect of pH on adsorption
The pH of the dye solution is one of the most important parameters as the protonation of functional groups on
adsorbent surface and the chemistry of dye molecules are strongly affected by pH of the solution [24].
It is well known that the pH of the adsorption medium is a critical parameter affecting the whole adsorption
process, particularly the dye uptake [25]. However, the surface charge of the adsorbent type can be modified by
the pH of the external solutions. The results of adsorption uptake of MB as a function of pH showed that there
was no major effect even at high pH values but a slight increase in MB uptake was noticed at pH 6.65 for the
olive stone adsorbent and organosorb10. Therefore, a dye solution pH of 6.65 was chosen for both activated
carbons.
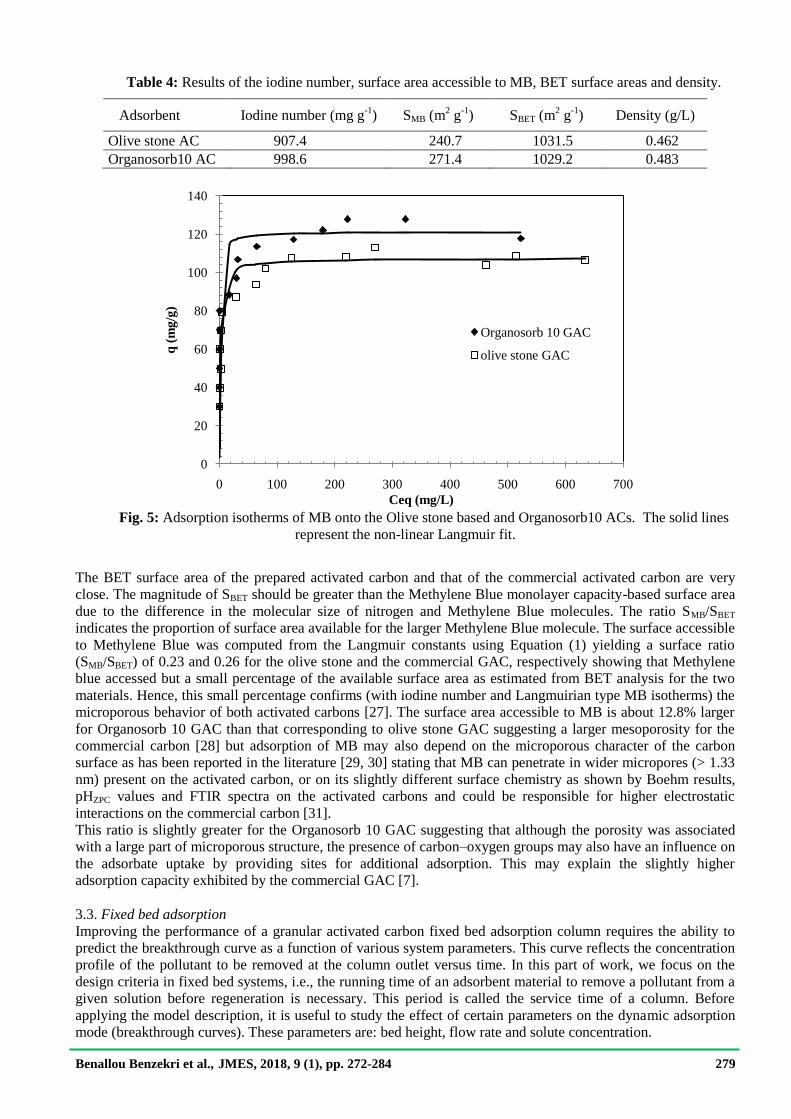
3.2.4. Adsorption isotherms
The MB adsorption isotherms of the two materials are depicted in Fig. 5 while Table 3 summarizes the
parameters computed by applying the Langmuir and Freundlich models. It was observed that the Freundlich
model is less suitable to reproduce the adsorption of MB on both GACs as determination coefficients were
lower than 0.94 and poor linearity was obtained. As the Langmuir model is the most representative of the
adsorption mechanism with determination coefficients greater than 0.99, it might suggest that the adsorption
occurred through the formation of BM monolayer on identical energy sites. The RL value in the range 0 - 1 also
confirms the favorable adsorptive uptake of dye process. Adsorption capacity is known to depend on the surface
area of the adsorbent [26]. The iodine number, surface area accessible to MB, BET specific surface area and
apparent density are shown in Table 4 for the two GACs.
Table 3: Langmuir and Freundlich constants for the adsorption of MB by GAC.
GAC Langmuir Freundlich
b (mg g-1
) KL (L mg-1
) R2 1/n KF R
2
Olive stone based AC 107.4 0.5152 0.999 0.1342 51.49 0.854
Organosorb 10 AC 121.2 1.0000 0.998 0.0519 51.49 0.8140
10
20
30
40
50
60
70
80
90
100
0 1 2 3 4 5 6 7
% R
emo
va
l
Time (hours)
100mg/L Olive stone GAC
200 mg/L Olive stone GAC
100mg/L Organosorb 10 GAC
200 mg/L Organosorb 10 GAC
Benallou Benzekri et al., JMES, 2018, 9 (1), pp. 272-284 279
Table 4: Results of the iodine number, surface area accessible to MB, BET surface areas and density.
Adsorbent Iodine number (mg g-1
) SMB (m2 g
-1) SBET (m
2 g
-1) Density (g/L)
Olive stone AC 907.4 240.7 1031.5 0.462
Organosorb10 AC 998.6 271.4 1029.2 0.483
Fig. 5: Adsorption isotherms of MB onto the Olive stone based and Organosorb10 ACs. The solid lines
represent the non-linear Langmuir fit.
The BET surface area of the prepared activated carbon and that of the commercial activated carbon are very
close. The magnitude of SBET should be greater than the Methylene Blue monolayer capacity-based surface area
due to the difference in the molecular size of nitrogen and Methylene Blue molecules. The ratio SMB/SBET
indicates the proportion of surface area available for the larger Methylene Blue molecule. The surface accessible
to Methylene Blue was computed from the Langmuir constants using Equation (1) yielding a surface ratio
(SMB/SBET) of 0.23 and 0.26 for the olive stone and the commercial GAC, respectively showing that Methylene
blue accessed but a small percentage of the available surface area as estimated from BET analysis for the two
materials. Hence, this small percentage confirms (with iodine number and Langmuirian type MB isotherms) the
microporous behavior of both activated carbons [27]. The surface area accessible to MB is about 12.8% larger
for Organosorb 10 GAC than that corresponding to olive stone GAC suggesting a larger mesoporosity for the
commercial carbon [28] but adsorption of MB may also depend on the microporous character of the carbon
surface as has been reported in the literature [29, 30] stating that MB can penetrate in wider micropores (> 1.33
nm) present on the activated carbon, or on its slightly different surface chemistry as shown by Boehm results,
pHZPC values and FTIR spectra on the activated carbons and could be responsible for higher electrostatic
interactions on the commercial carbon [31].
This ratio is slightly greater for the Organosorb 10 GAC suggesting that although the porosity was associated
with a large part of microporous structure, the presence of carbon–oxygen groups may also have an influence on
the adsorbate uptake by providing sites for additional adsorption. This may explain the slightly higher
adsorption capacity exhibited by the commercial GAC [7].
3.3. Fixed bed adsorption
Improving the performance of a granular activated carbon fixed bed adsorption column requires the ability to
predict the breakthrough curve as a function of various system parameters. This curve reflects the concentration
profile of the pollutant to be removed at the column outlet versus time. In this part of work, we focus on the
design criteria in fixed bed systems, i.e., the running time of an adsorbent material to remove a pollutant from a
given solution before regeneration is necessary. This period is called the service time of a column. Before
applying the model description, it is useful to study the effect of certain parameters on the dynamic adsorption
mode (breakthrough curves). These parameters are: bed height, flow rate and solute concentration.
0
20
40
60
80
100
120
140
0 100 200 300 400 500 600 700
q (
mg
/g)
Ceq (mg/L)
Organosorb 10 GAC
olive stone GAC
Benallou Benzekri et al., JMES, 2018, 9 (1), pp. 272-284 280
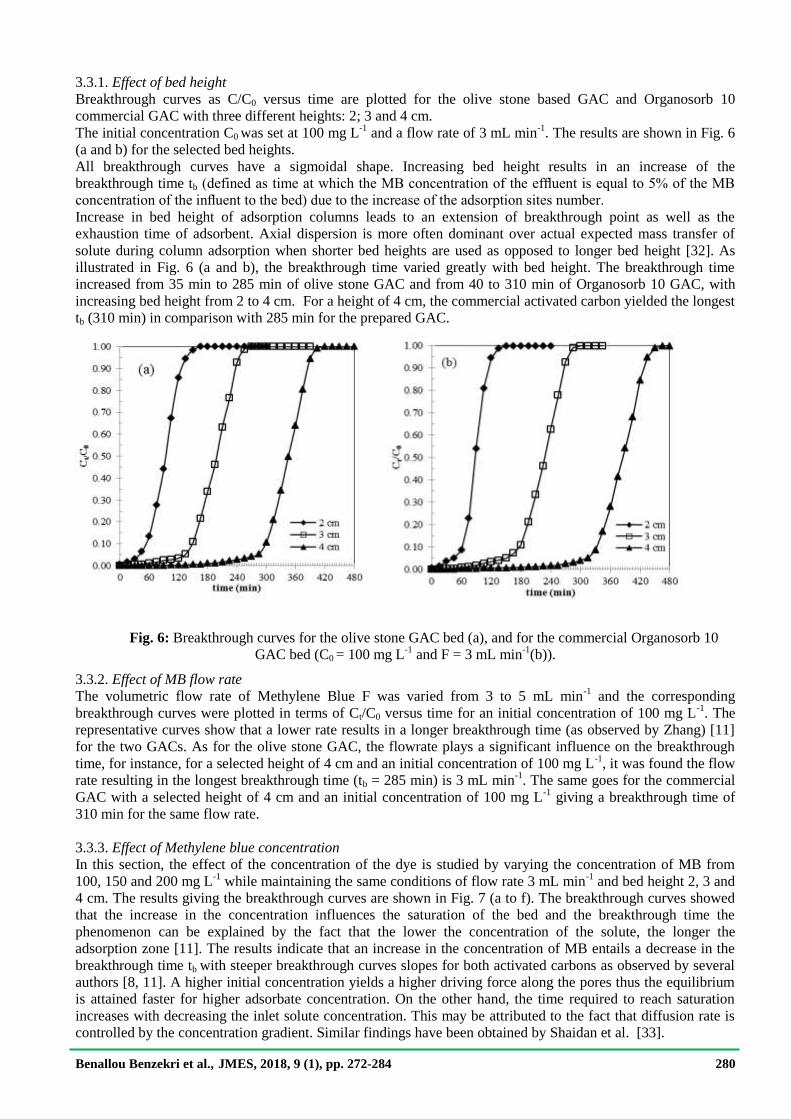
3.3.1. Effect of bed height
Breakthrough curves as C/C0 versus time are plotted for the olive stone based GAC and Organosorb 10
commercial GAC with three different heights: 2; 3 and 4 cm.
The initial concentration C0 was set at 100 mg L-1
and a flow rate of 3 mL min-1
. The results are shown in Fig. 6
(a and b) for the selected bed heights.
All breakthrough curves have a sigmoidal shape. Increasing bed height results in an increase of the
breakthrough time tb (defined as time at which the MB concentration of the effluent is equal to 5% of the MB
concentration of the influent to the bed) due to the increase of the adsorption sites number.
Increase in bed height of adsorption columns leads to an extension of breakthrough point as well as the
exhaustion time of adsorbent. Axial dispersion is more often dominant over actual expected mass transfer of
solute during column adsorption when shorter bed heights are used as opposed to longer bed height [32]. As
illustrated in Fig. 6 (a and b), the breakthrough time varied greatly with bed height. The breakthrough time
increased from 35 min to 285 min of olive stone GAC and from 40 to 310 min of Organosorb 10 GAC, with
increasing bed height from 2 to 4 cm. For a height of 4 cm, the commercial activated carbon yielded the longest
tb (310 min) in comparison with 285 min for the prepared GAC.
Fig. 6: Breakthrough curves for the olive stone GAC bed (a), and for the commercial Organosorb 10
GAC bed (C0 = 100 mg L-1
and F = 3 mL min-1
(b)).
3.3.2. Effect of MB flow rate
The volumetric flow rate of Methylene Blue F was varied from 3 to 5 mL min-1
and the corresponding
breakthrough curves were plotted in terms of Ct/C0 versus time for an initial concentration of 100 mg L-1
. The
representative curves show that a lower rate results in a longer breakthrough time (as observed by Zhang) [11]
for the two GACs. As for the olive stone GAC, the flowrate plays a significant influence on the breakthrough
time, for instance, for a selected height of 4 cm and an initial concentration of 100 mg L-1
, it was found the flow
rate resulting in the longest breakthrough time (tb = 285 min) is 3 mL min-1
. The same goes for the commercial
GAC with a selected height of 4 cm and an initial concentration of 100 mg L-1
giving a breakthrough time of
310 min for the same flow rate.
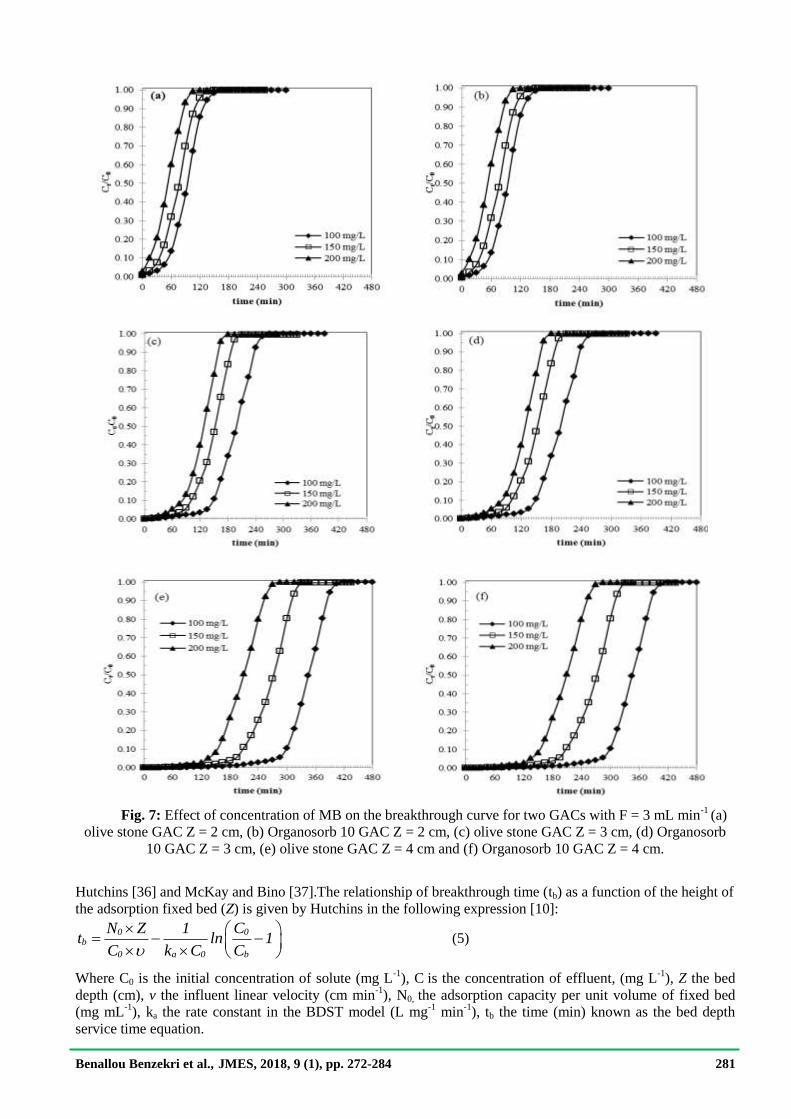
3.3.3. Effect of Methylene blue concentration
In this section, the effect of the concentration of the dye is studied by varying the concentration of MB from
100, 150 and 200 mg L-1
while maintaining the same conditions of flow rate 3 mL min-1
and bed height 2, 3 and
4 cm. The results giving the breakthrough curves are shown in Fig. 7 (a to f). The breakthrough curves showed
that the increase in the concentration influences the saturation of the bed and the breakthrough time the
phenomenon can be explained by the fact that the lower the concentration of the solute, the longer the
adsorption zone [11]. The results indicate that an increase in the concentration of MB entails a decrease in the
breakthrough time tb with steeper breakthrough curves slopes for both activated carbons as observed by several
authors [8, 11]. A higher initial concentration yields a higher driving force along the pores thus the equilibrium
is attained faster for higher adsorbate concentration. On the other hand, the time required to reach saturation
increases with decreasing the inlet solute concentration. This may be attributed to the fact that diffusion rate is
controlled by the concentration gradient. Similar findings have been obtained by Shaidan et al. [33].
Benallou Benzekri et al., JMES, 2018, 9 (1), pp. 272-284 281
Fig. 7: Effect of concentration of MB on the breakthrough curve for two GACs with F = 3 mL min-1
(a)
olive stone GAC Z = 2 cm, (b) Organosorb 10 GAC Z = 2 cm, (c) olive stone GAC Z = 3 cm, (d) Organosorb
10 GAC Z = 3 cm, (e) olive stone GAC Z = 4 cm and (f) Organosorb 10 GAC Z = 4 cm.
Hutchins [36] and McKay and Bino [37].The relationship of breakthrough time (tb) as a function of the height of
the adsorption fixed bed (Z) is given by Hutchins in the following expression [10]:
0 0b
0 a 0 b
N Z 1 Ct ln 1
C k C C
(5)
Where C0 is the initial concentration of solute (mg L-1
), C is the concentration of effluent, (mg L-1
), Z the bed
depth (cm), v the influent linear velocity (cm min-1
), N0, the adsorption capacity per unit volume of fixed bed
(mg mL-1
), ka the rate constant in the BDST model (L mg-1
min-1
), tb the time (min) known as the bed depth
service time equation.
Benallou Benzekri et al., JMES, 2018, 9 (1), pp. 272-284 282
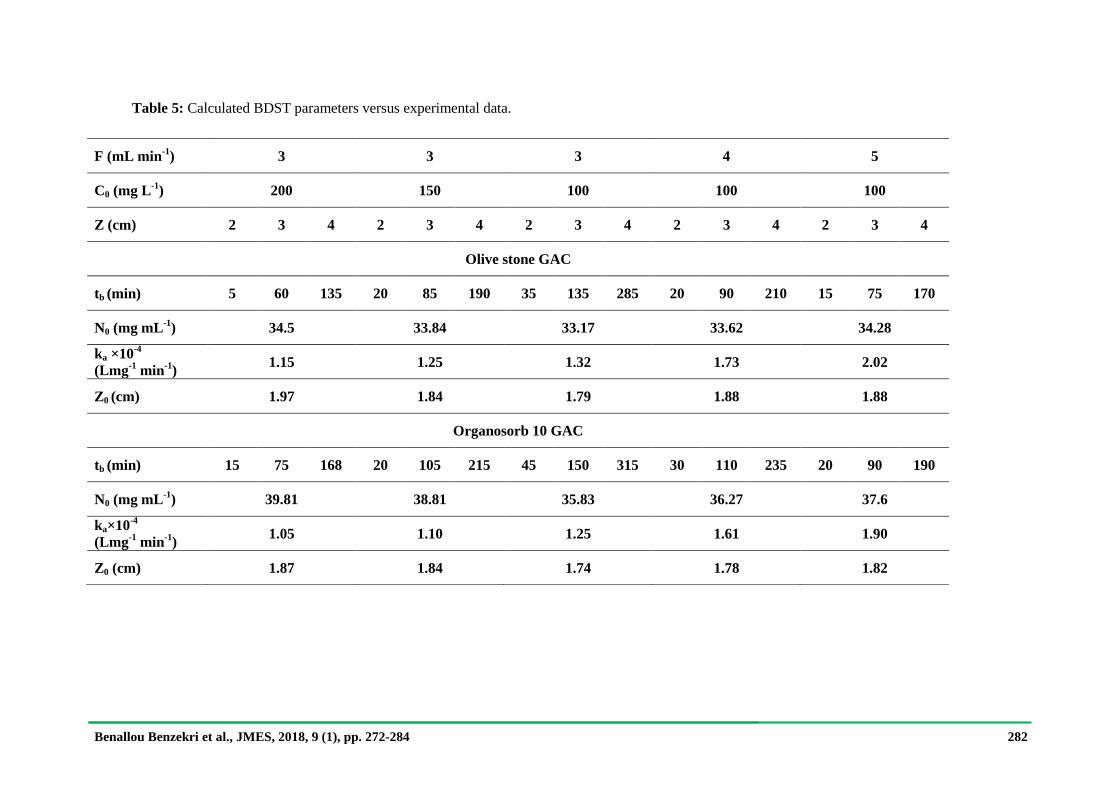
Table 5: Calculated BDST parameters versus experimental data.
F (mL min-1
) 3 3 3 4 5
C0 (mg L-1
) 200 150 100 100 100
Z (cm) 2 3 4 2 3 4 2 3 4 2 3 4 2 3 4
Olive stone GAC
tb (min) 5 60 135 20 85 190 35 135 285 20 90 210 15 75 170
N0 (mg mL-1
) 34.5 33.84 33.17 33.62 34.28
ka ×10-4
(Lmg-1
min-1
) 1.15 1.25 1.32 1.73 2.02
Z0 (cm) 1.97 1.84 1.79 1.88 1.88
Organosorb 10 GAC
tb (min) 15 75 168 20 105 215 45 150 315 30 110 235 20 90 190
N0 (mg mL-1
) 39.81 38.81 35.83 36.27 37.6
ka×10-4
(Lmg-1
min-1
) 1.05 1.10 1.25 1.61 1.90
Z0 (cm) 1.87 1.84 1.74 1.78 1.82
Benallou Benzekri et al., JMES, 2018, 9 (1), pp. 272-284 283
Applying the BDST model to both GAC systems allows the following observations: the adsorption capacity of
Methylene Blue is higher for the commercial GAC than the prepared one. High determination coefficients
(R2>0.98) likely explain the high efficiency of the MB-GACs bed, ensuring the validity of BDST model for the
present system. The parameters related to the BDST model as estimated are depicted in Table 5. It can be
observed that both the adsorption capacity (N0) and adsorption rate constant (ka) of the fixed bed increase with
flow rate keeping an inlet concentration of 100 mg L-1
) for both GACs. The values of N0 increase with inlet
concentration of MB. However, the values of ka remain essentially constant for a varying inlet concentration of
BM and a constant flow rate (3 mL min-1
).
It can also be said that the rate of increase of the sorption capacity with influent concentration is constant
equaling 19.9% and 13.3% for Organosorb 10 and Olive stone GAC, respectively. This can be attributed to the
increase in driving force (concentration gradient or mass transfer) for the adsorption process [38].
For a given GAC, the sorption capacity is larger for a lower flow rate since a better contact adsorbent-adsorbate
is expected with a longer residence time for molecules. Also, the capacities obtained from the batch process are
much higher than from fixed bed process as expected since the corresponding contact times are much longer.
The critical fixed bed height is also similar (< 2 cm) for two GACs and increases slightly together with
concentration for both systems.
For the two activated carbons studied, the BDST model was suitable for describing all the breakthrough curves
and estimating the dynamic parameters such as the adsorption rate constant (ka), 5% breakthrough time (tb) and
adsorption capacity (N0).
Conclusions This work aimed at valorizing olive stones as an agro-waste into an efficient granular activated carbon and
comparing its performance and characteristics to a commercial granular activated carbon, taken as reference,
through the adsorption of the typical Methylene blue dye using both batch and continuous processes.
For the batch process, the Langmuir model was found to adequately describe the adsorption of the dye for both
granular activated carbons investigated. The adsorption capacity of Methylene blue reached 107.4 and 121.4
mg g-1
for the olive stone and commercial materials, respectively.
In the fixed bed process: the bed depth service time model was found to adequately describe the sorption
process of the dye investigated and can hence be used to predict the breakthrough curves and work time of the
column with relevant parameters. Olive stones can be adequately transformed into a granular activated carbon
that can be used to pack adsorption columns for water depollution and recycling applications.
References 1. H.Yuh-Shan, C. Tzu-Hsuan, Process Biochem. 40 (2005) 119-124.
2. Y.Sarita, D. K. Tyagi, O.P. Yadav, Asian J. Res. Chem., 5(1) (2012) 01-07.
3. P. Waranusantigul, P. Pokethitiyook, M. Kruatrachue, E. S. Upatham, Environ. Pollut., 125 (2003) 385-392.
4. C. O’Neill, F. R. Hawkes, D. L. Hawkes, N. D. Lourenco, H. M. Pin-heiro, W. Dele, W., J. Chem. Technol.
Biotechnol., 74 (1999) 1009-18.
5. R.S.Juang, F.C.Wu, R.L.Tseng, Environ. Technol., 18 (1997) 525-531.
6. S. Altenora, B. Carenea, E. Emmanuel, J. Lambert, J.J. Ehrhardt, S. SarraGasparda, J. Hazard. Mater., 165
(2009) 1029-1039.
7. M.Termoul, B. Bestani, N. Benderdouche, M. Belhakem, E. Naffrechoux, J. Adsorption Science &
Technology., 24(5) (2006) 375.
8. S. K.Theydan, J. A. Muthanna, Powder Technol., 224 (2012) 101-108.
9. M. Benadjemia, L. Millière, L. Reinert, N. Benderdouche, L. Duclaux, Fuel Processing Technology, 92
(2011) 1203-1212.
10. R. Han, Y. Wang, X. Zhao, Y. Wang, F. Xie, J. Cheng, M. Tang, Desalination, 245 (2009) 284-297.
11. W. Zhang, L. Dong, H. Yan, H. Li, Z. Jiang, X. Kan, H. Yang, A. Li, R. Cheng, Chemical Engineering
Journal, 173(2) (2011) 429-436.
12. N. Douara, B. Bestani, N. Benderdouche, L. Duclaux, Desalination and Water Treatment, (2015) 1–17.
13. Standard Test Method for Determination of Iodine Number of Activated Carbon ASTM Annual Book. 4,
section 15, 4607, (1999).
14. A. Ouldmoumna, L. Reinert, N. Benderdouche, B. Bestani, L. Duclaux, Desalination and Water Treatment,
51 (2013) 3527-3538.
15. R. Coşkun, A. Yıldız, A. Delibaş, J. Mater. Environ. Sci., 8(2) (2017) 398-409
Benallou Benzekri et al., JMES, 2018, 9 (1), pp. 272-284 284
16. A. F. Hassan, A.M. Abdel-Mohsen, M.M.G. Fouda, Carbohydr. Polym., 102 (2014) 192-198.
17. I.I. Salame, T.J. Bandosz, J. Colloid Interf. Sci., 240(1) (2001) 252-8.
18. S. Akazdam, M. Chafi, W. Yassine, L. Sebbahi, B. Gourich, N. Barka, J. Mater. Environ. Sci., 8 (3) (2017)
784-800
19. V. T. Tran, D.T. Nguyen, V.T.T. Ho, P.Q.H. Hoang, P.Q. Bui, L.G. Bach, J. Mater. Environ. Sci., 8(2)
(2017) 426-437
20. S. Attouti, B. Bestani, N. Benderdouche, L. Duclaux, Water Res., 17 (2013) 3375-3388.
21. Y. Al-Degs, M.A.M. Khraisheh, S.J. Allen, M.N. Ahmad, Water Res., 34 (2000) 927-935.
22. A. B. Pérez Marin, M. I. Aguilar, V. F. Meseguer, J. F. Ortuno, J. Saez, M. Lloréns, Chem. Eng. J., 155(1-2)
(2009) 199-206.
23. J. Song, W. Zou, Y. Bian, F. Su, R. Han, Desalination, 265(1-3) (2011) 119-125.
24. B. Damiyine, A. Guenbour, R. Boussen, J. Mater. Environ. Sci., 8(1) (2017) 345-355.
25. F. Nemchi, B. Bestani, N. Benderdouch, M. Belhakem, L.C. Minorval, J. Adsorption Science & Technology,
30 (2012) 81-95.
26. P. Mouchet, ‘Traitement des eaux avant utilisation. Matières particulaires’. Technique de l'ingénieur.
G1170, 9, (2000).
27. G.G. Stavropoulos, A.A. Zabaniotou, Micropor. Mesopor. Mat., 82 (2005) 79-85.
28. B. Bestani, N. Benderdouche, B. Benstaali, A. Addou, Bioresour. Technol., 99 (2008) 8441-8444.
29. D. Graham, J. Phys. Chem., 59 (8) (1955) 896-900.
30. S. Kasaoka, Y. Sakata, E.Tanaka, R. Naitoh, Int. Chem. Eng., 29 (1) (1989) 101-114.
31. A. Seco, P. Marzal, C. Gabaldon, Sep. Sci. Technol., 34 (1999) 1577-1593.
32. V.C. Taty-Costodes, H. Fauduet, C. Porte, Y.S. Ho, J. Hazard. Mater., 123B (2005) 135-144.
33. N.H. Shaidan, U. Eldemerdash, S. Awad, J. Taiwan Inst. Chem. Eng., 43 (2012) 40-45.
34. G. Bohart, E.Q. Adams, J. Am. Chem. Soc., 42 (1920) 523-544.
35. H.C. Thomas, J. Am. Chem. Soc., 66 (1944) 1466-1664.
36. R.A. Hutchins, Chem. Eng., 80 (1973) 133-138.
37. G. McKay, M.J. bino, Environ. Poll., 66 (1990) 33-53.
38. M. Auta, B.H. Hameed, Chem. Eng. J., 237 (2014) 352-361.
(2018) ; http://www.jmaterenvironsci.com


![Activated Carbon[1]](https://img.pdfslide.net/doc/110x75/56d6be9b1a28ab301692d8de/activated-carbon1.jpg)