Embed Size (px)
Citation preview
VALORIZATION STRATEGIES OF COCONUT FLOUR
ABIOYE OLADIPUPO SAMUEL
Student Number: 01603190
Promoter: Prof. dr. ir. Koen Dewettinck
Co-Promoter: dr. ir. Filip Van Bockstaele
Supervisor: ir. Davy Van de Walle
A master’s dissertation submitted to Ghent University in partial fulfilment for the award of
the degree of Master of Science in Nutrition and Rural Development main subject: Human
Nutrition
ACADEMIC YEAR 2017-2018
i
Acknowledgement
Firstly, my gratitude goes to Almighty God; the author and finisher of my faith who had always
been my help in the time of need and even during my academic sojourn.
My sincere appreciation goes to my promoter, Prof. Koen Dewettinck of the Department of Food
Safety and Food Quality, Ghent University for believing in me and accepting me to work in his
laboratory as a research MSc student. It was indeed a rare opportunity and I do not take it for
granted. Also, the guidance, tutelage and feedbacks of my co-promoter, Dr. Filip Van Bockstaele
of the Department of Food Technology, Safety and Health, Ghent University can never be forgotten
in a rush as it was key to helping me complete this research study.
The experimental procedure would not have been possible without the support of my supervisor
Davy Van de Walle, who patiently taught me how to use many of the laboratory equipment and
was always ready to listen when questions arise. Your corrections and inputs had improved my
knowledge about research study. Likewise, I thank Phara De Bock, a PhD scholar, for sharing her
knowledge with me and providing suggestions during the thesis write up. Furthermore, it is will be
a great injustice to forget the role of Corine Loijson, one of the laboratory assistants who was
relentless in her effort in helping with some laboratory experiments.
I will also like to thank VLIR-UOS Belgium for granting me a scholarship award which enabled
me to participate in this life changing master’s degree programme. In addition, I would like to
acknowledge the Lagos State Government for granting me a two years study leave to complete my
study. During this period at Ghent University, I have been privileged to meet wonderful
individuals. One of such persons is Lilian Aluso, a friend, who was supportive during the
experimental procedure in the making of chapatti. I cannot thank you enough.
Last but not the least, I celebrate my blessed parents; Mr. Emmanuel and Mrs. Christianah Abioye,
my lovely wife; Mrs. Omolola Abioye, my awesome son; Mr. Ayanfeoluwa Abioye and my
siblings for their spiritual, moral and emotional support during this period of completing my study.
I sincerely love you all.
ii
Copyright protection
The author and promoters of this thesis give the permission to use it for consultation and to copy
parts of it for personal use. Any other use is subject to copyright laws. More specifically, the content
must be extensively specified when using the result from this Master’s Dissertation.
UGent, August 2018
Author Promoter Co- promoter
Oladipupo Samuel Abioye Prof. dr. ir Koen Dewettinck Dr. Ing Filip Van Bockstaele
iii
Table of Contents
ACKNOWLEDGEMENT…………………………………………………………………………………..i
ABSTRACT .............................................................................................................................................. vii
CHAPTER 1 ................................................................................................................................................. 1
INTRODUCTION ........................................................................................................................ 1
1. 1 BACKGROUND INFORMATION ...................................................................................... 1
1. 2 PROBLEM STATEMENT .................................................................................................... 2
1.3 JUSTIFICATION: .................................................................................................................. 2
1.4 OBJECTIVES ......................................................................................................................... 3
CHAPTER 2 ................................................................................................................................................. 4
LITERATURE REVIEW ............................................................................................................. 4
2.1 COCONUT ............................................................................................................................. 4
2.1.1 Variety and Geography of Coconuts ....................................................................................... 5
2.2 USAGE OF THE MAJOR COMPONENTS OF COCONUT PALM ................................... 6
2.2.1 Coconut Shell ............................................................................................................................. 6
2.2.2 Coconut Husk ............................................................................................................................. 6
2.2.3 Coconut Leaves .......................................................................................................................... 6
2.2.4 Coconut water ............................................................................................................................. 7
2.2.5 Coconut Kernel or Meat ............................................................................................................ 7
2.3 COCONUT FLOUR ............................................................................................................... 8
2.3.1 Processing of Coconut Flour .................................................................................................... 8
2.3.2 Macro composition of Coconut Flour ...................................................................................11
2.3.3 Nutrient Composition of Coconut Flour ...............................................................................12
2.3.4 The Nutritional Benefits of Coconut Flour ...........................................................................13
2.3.5 Possible Applications of coconut flour .................................................................................15
CHAPTER 3 ............................................................................................................................................... 19
MATERIALS AND METHODS ............................................................................................... 19
3.1 MATERIALS ....................................................................................................................... 19
3.1.1 Raw material sources ...............................................................................................................19
3.1.2. Raw material preparation .......................................................................................................19
iv
3.2 METHODS ........................................................................................................................... 20
3.2.1 Chemical Composition ............................................................................................................20
3.2.2 Functional Properties ...............................................................................................................23
3.2.3 Chapatti .....................................................................................................................................25
3.3 Statistical Analysis ............................................................................................................... 28
CHAPTER 4 ............................................................................................................................................... 29
RESULTS AND DISCUSSION .............................................................................................................. 29
4.1 Chemical Composition of Flours .......................................................................................... 29
4.2 Functional Properties of Flours ............................................................................................ 33
4.2.1 Pasting Properties .....................................................................................................................33
4.2.2 Hydration Properties, Oil Absorption Capacity and Foaming Capacity and Stability ...39
4.3 Chapatti ................................................................................................................................. 43
4.3.1 Physical Properties of Chapatti ..............................................................................................43
4.4 Chemical Composition ......................................................................................................... 47
4.4 Summary of the Sensory Evaluation Result ......................................................................... 50
4.5 Nutritional Relevance of This Research Study ..................................................................... 54
CHAPTER 5 ............................................................................................................................................... 56
CONCLUSION .......................................................................................................................................... 56
CHAPTER 6 ............................................................................................................................................... 57
The Future Prospect for Coconut Flour Utilization. ............................................................................. 57
REFERENCES ........................................................................................................................................... 59
APPENDIX: Sensory Evaluation Form ............................……………………………………....78
v
LIST OF FIGURES
Figure 1: (a): Coconut fruits (useofcoconut.com) (b): Structure of coconut fruit
(healthtipsinfo.com) .......................................................................................................................... 5
Figure 2: Flow chart of coconut flour production (Igbadul et al., 2011) ....................................... 10
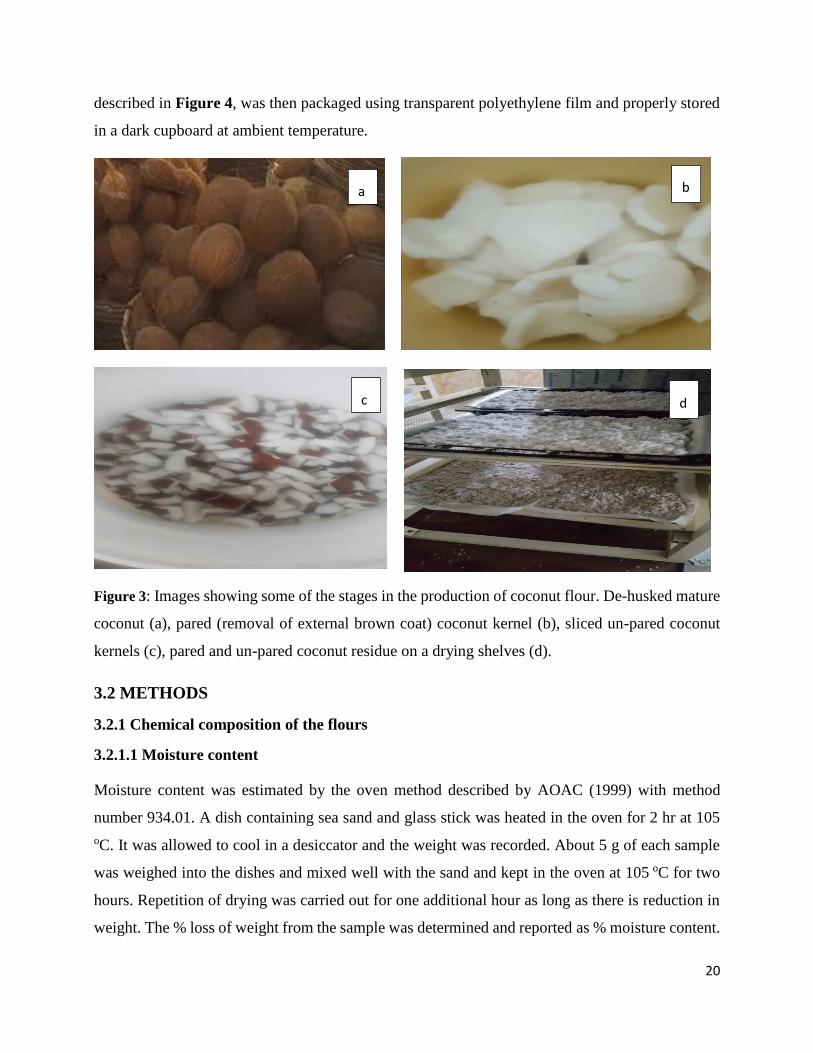
Figure 3: Images showing some of the stages in the production of coconut flour. De-husked
mature coconut (a), pared (removal of external brown coat) coconut kernel (b), sliced un-pared
coconut kernels (c), pared and un-pared coconut residue on a drying shelf (d)............................. 20
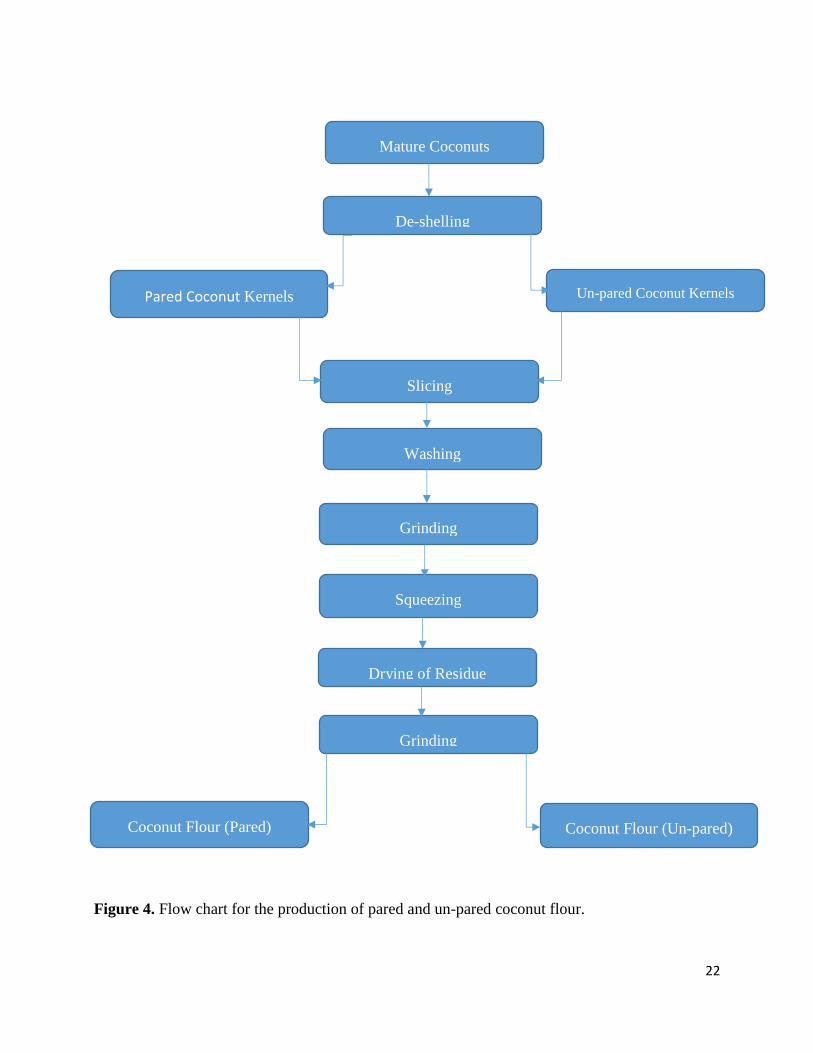
Figure 4: Flow chart of production of pared and un-pared coconut flour………………………..22
Figure 5: Flow chart for chapatti production ................................................................................. 26
Figure 6a: Pasting curve for wheat flour, cassava flour, maize flour, pared coconut flour and un-
pared coconut flour. ........................................................................................................................ 35
Figure 6b: Pasting curve of pared coconut flour and un-pared coconut flour ................................ 35
Figure 7: Images showing the paste formed by the different flours after the pasting procedure was
performed. Paste corn flour (a), paste cassava flour (b), paste wheat flour(c), paste pared coconut
flour (d), paste un-pared coconut Flour (e)……………………………………………………….37
Figure 8: Images of chapatti samples made by the addition of different levels of coconut flour
substitution. 100 % wheat flour chapatti (a), 10 % pared coconut flour incorporated chapatti (b), 20 % pared
flour incorporated chapatti (c), 10 % un-pared coconut flour incorported chapatti (d), 20 % un-pared coconut
flour incorporated chapatti……………………………………………………………………………..…52
vi
LIST OF TABLES
Table 2. 1 Macro nutrients of coconut flours, wheat flour, cassava flour and maize flour (USDA,
2017) ............................................................................................................................................... 11
Table 2. 2 Amino acid composition of coconut flour (gram/100gram of protein) (Kwon, 1996;
Rasyid et al., 1992) ........................................................................................................................ 13
Table 2. 3 Overview of some studies conducted on the incorporation of coconut flour in
composite mix ................................................................................................................................ 16
Table 3. 1 Chapatti formulation……………………………………………………………...…...26
Table 4. 1 Chemical composition of the different flour samples ................................................... 29
Table 4. 2 Pasting properties of the different flour samples. ......................................................... 34
Table 4. 3: Hydration properties and foaming capacity and stability of wheat flour, cassava flour,
maize flour, pared and un-pared coconut flour .............................................................................. 39
Table 4. 4 Physical properties of chapatti made from different levels of substitution of pared and
un-pared coconut flour into wheat flour. ........................................ Error! Bookmark not defined.
Table 4. 5 Texture of reference and composite chapatti with different levels of substitution. ...... 46
Table 4. 6 Chemical composition of chapatti with different levels of coconut flour substitution . 47
Table 4. 7 Sensory scores of chapatti containing different levels of substitution of pared and un-
pared coconut flour. ........................................................................................................................ 51
vii
ABSTRACT
The processing of coconuts into coconut milk and coconut oil has been the major area of focus
within the coconut industry. During the production process, a by-product called coconut residue is
obtained. In many cases, it is usually thrown away or used as a feed for livestock. However, the
processes of drying and grounding of the residue into flour enhance its potential application in food
formulation and production. Therefore, this study aimed at investigating how coconut flour (pared
and un-pared) compares to commonly used staple flours (wheat, cassava and maize flours) in terms
of chemical composition and functional properties. Furthermore, it examined the physical
characteristics and sensorial attributes of chapatti (unleavened flat bread) made by incorporating
coconut flour (pared and un-pared) into wheat flour at different levels of substitution (10 % and 20
%).
The chemical composition showed that pared coconut flour had a protein content of 6.3 % while
un-pared coconut flour contained 8.3 %. The staples flours; wheat, cassava and maize flours,
showed protein content of 10.6 %, 1.4 % and 7.8 %, respectively. Similarly, fibre content was
recorded to be significantly higher in pared coconut flour (16.7 %) which was followed by un-
pared coconut flour (15.6 %), maize flour (7.7 %), cassava flour (4.8 %) and wheat flour (2.8 %).
Furthermore, the coconut flours had significantly higher fat content than any of the staple flours.
Generally, the study revealed that coconut flour (pare and un-pared) possessed poor pasting
properties. On the other hand, the hydration properties and oil absorption capacity indicated
prospect of the possibilities of applying coconut flour in food systems. Sensorial evaluation of
chapatti made from composite wheat-coconut flours with level of substitutions (10 % and 20 %)
of pared and un-pared coconut flours in the composite mix remarkably revealed that in terms of
overall acceptability, there was no significant difference between all the coconut flour incorporated
chapatti and the reference chapatti (100 % wheat flour).
Keywords: Coconut flour, functional properties, food application, chapatti.
1
CHAPTER 1
INTRODUCTION
1. 1 BACKGROUND
Coconut (Cocos nucifera) belongs to the family of palm Arecaceae. It is the most important plant
within the family because it has application both as an ornamental crop and as a food crop (Fife et
al., 2011). All the plant parts have been found to have useful purposes in human’s life such as in
foods, house construction materials and in the making of house hold items such as baskets and hand
fans etc. (Igbabul et al., 2014). The plant has been estimated to have an economic lifespan of about
fifty years. However, some of the varieties can live for over a century (Danyo, 2011).
More than 70 % of the world production directly or indirectly contributes to the nutrition of local
house-holds, while the other remaining amount is only used in industrial applications (Peiris et al.,
2000). Coconut consumption can come in different ways. For instance, in India, coconut is
consumed in the form of the raw kernels, tender nuts, coconut oil, copra (the dried flesh of the nut)
and desiccated coconuts (Dhankhar, 2013; Hareya et al., 2000), while in Nigeria, coconut milk is
an ingredient to make coconut rice. It is important to note that meals which are made from coconut
meat or kernel can be high in fat, fibre and other nutrients, therefore it may help in reducing the
nutrient deficiencies that are associated with staple foods that contain predominantly starch which
are consumed in many developing countries. Asides from being a source of food, it helps create
job opportunities for those living along coastal region (Danyo, 2011).
Coconut fruit is an important source of vegetable oil which has application both industrially; in the
production of soaps and paints etc, and for edible purposes (Yalegama and Chavan, 2006). The oil
has received special attention, particularly among the Asian and Pacific populations compared to
other vegetable oils because of the special healing properties that has been attributed to it
(Dhankhar, 2013). According to Arora et al. (2011), the oil was reported to be effective against a
number of viruses which are lipid-coated such as visna virus, influenza virus, leukemia virus,
pneumonia virus, and hepatitis C virus. What was identified to be responsible is the medium chain
fatty acids such as lauric acid that is found in coconut oil which helps to inactive these organisms.
During coconut oil production a by-product called coconut residue is obtained. This residue can be
processed into coconut flour (Sujirtha and Mahendran, 2015).
2
1. 2 PROBLEM STATEMENT
For many decades, the coconut oil industry had been the most vibrant as many processors of the
coconut fruit focus on the oil production. In fact, a number of studies that have been done are
tailored towards the nutritional, health benefits and the applications of coconut oil (Muller et al.,
2003; Agero and Verallo, 2004; Debmandal and Mandal, 2011). However, the leftover residue
obtained during the coconut oil production procedure can be used in the making of coconut flour
(Yalegama and Chavan, 2006). This gluten-free flour has recently become increasingly important
in the bakery industries where it is used in partial substitution to wheat in order to produce baked
snacks such as cookies (Dhankhar, 2013). This idea can be extended to other wheat based foods.
There is also the possibility of combining coconut flour with other flour types like corn flour and
cassava flour which are lacking in some essential nutrients to produce gluten-free products which
are important for patients that are gluten intolerant (Gallagher et al., 2004; Daniela, 2016).
Furthermore, it has been reported that coconut flour possesses important nutritional constituents
such as fiber and proteins which are necessary in the formulation of healthy foods (Gunathilake et
al., 2009). Yet, little attention has been given to the incorporation of coconut flour into commonly
consumed foods like baked snacks and porridges.
Although, some studies have been done concerning the application of coconut flour as composite
flour in baking industries (Sujirtha and Mahendran, 2015; Gunathilake et al., 2009), still there is
dearth in knowledge as regards its overall functionality and possible potentials in other food
systems.
1.3 JUSTIFICATION:
There is a necessity to continuously find ways of converting industrial by-products into functional
ingredients, including coconut flour made from coconut milk residue (Ramaswamy, 2014). This
may further contribute to sustainability and improved food security within the households. As
mentioned above, coconut residue is a by-product of coconut oil production and it is majorly fed
to livestock or used as livestock ingredient. Many of the previous studies being carried out on
coconuts had focused primarily on coconut oil. Therefore, it is important to investigate the
functional properties of this coconut flour and compare it with already known staple flours which
have received greater attention in the food industries. This will enable us to further understand its
potential applications in other food systems. Through this, the research will provide additional
3
information to farmers, researchers, food developers and those involved in the processing of
coconuts, helping them to maximize its full potential.
1.4 OBJECTIVES
This research is aimed at studying the functional properties of coconut flour and understanding the
potential applicability of the flour in food systems.
The first specific task was to compare the nutritional composition and functional properties of
coconut flour with commonly used staple flours such as wheat flour, cassava flour and corn flour
that have received greater attention in the food industries. In addition, to investigate if there are
differences in the nutritional and functional properties of the pared and un-pared coconut flour.
Furthermore, to develop a food product and investigate the effects of different levels of coconut
flour incorporation in composite ratio with a staple flour.
4
CHAPTER 2
LITERATURE REVIEW
2.1 COCONUT
The coconut palm which is botanically called Cocos nucifera only grow in sandy soil which may
not suitable for other cash crops (Danyo, 2011). It is difficult to grow coconut palm in dry climates,
except with the use of proper irrigation, else the entire plant including the leaves and the fruit will
not grow well (Foale 2003). The coconut plant grows up to about 30 meters tall with pinnate leaves
of about 4-6 meters long. The old leaves easily break off leaving the trunk of the plant looking
smooth (Fife et al., 2001). The coconut palm begins it fruiting about three to five years after
planting. This is largely dependent on the variety of coconut palm (NARI, 2003).
Cocos palms are located across the humid intertropical zone (Srivastava, 2011). It is believed to
have originated from Southeast Asia (Indonesia, Philippines and Malaysia) and the islands that lie
between the Pacific and Indian oceans. It is from these regions that the plant had been introduced
to India, East Africa and West Africa. From here, they were dispersed to America and other tropical
regions of the world (Lima et al., 2015).
According to FAO STATS (2016), coconut is grown in more than 86 countries worldwide, with a
total production of about 60 million tonnes yearly. The top three countries in the leading position
as regards its production are Indonesia, Philippines, and India (Srivastava, 2011). India occupies
the premier position in the world with an annual production of more than 13 billion nuts. In many
cases, depending on its variety, 70-150 trees/hectare are planted which can produce about 5 to15
nuts per bunch and 60-100 nuts per tree if planted on a fertile soil (Fife et al., 2001). A coconut
tree during its entire life span can produce up to 10,000 nuts (NARI, 2003; Debmandal and Mandal,
2011).
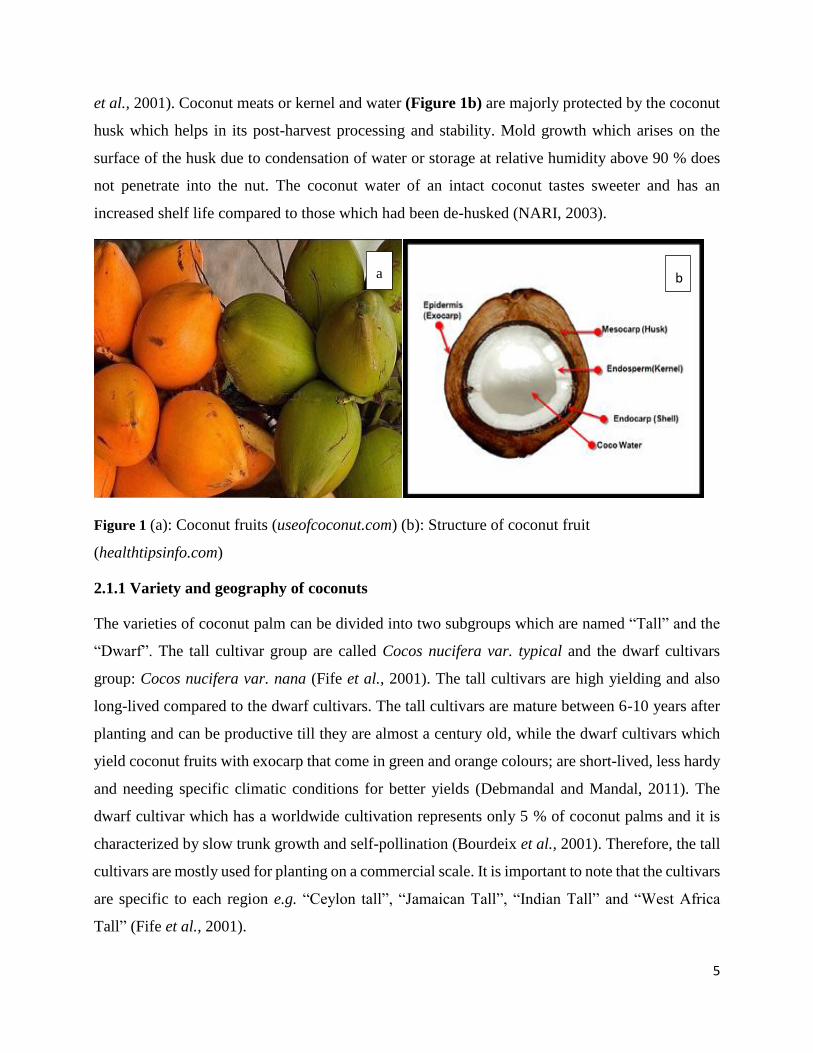
A full-sized coconut fruit (Figure 1a) weighs about 1.5 kg (Bourke et al., 2009). The fruit of the
coconut palm is botanically called a drupe and not a nut. It has three main layers (Figure 1b): the
exocarp which is the woody part that in many cases have been removed before being placed on
shelf for sales, the mesocarp which is the shell that protects the inner part of the coconut which
surrounds the coconut meat and water, and the endosperm which is the meat of the coconut (Fife
5
et al., 2001). Coconut meats or kernel and water (Figure 1b) are majorly protected by the coconut
husk which helps in its post-harvest processing and stability. Mold growth which arises on the
surface of the husk due to condensation of water or storage at relative humidity above 90 % does
not penetrate into the nut. The coconut water of an intact coconut tastes sweeter and has an
increased shelf life compared to those which had been de-husked (NARI, 2003).
Figure 1 (a): Coconut fruits (useofcoconut.com) (b): Structure of coconut fruit
(healthtipsinfo.com)
2.1.1 Variety and geography of coconuts
The varieties of coconut palm can be divided into two subgroups which are named “Tall” and the
“Dwarf”. The tall cultivar group are called Cocos nucifera var. typical and the dwarf cultivars
group: Cocos nucifera var. nana (Fife et al., 2001). The tall cultivars are high yielding and also
long-lived compared to the dwarf cultivars. The tall cultivars are mature between 6-10 years after
planting and can be productive till they are almost a century old, while the dwarf cultivars which
yield coconut fruits with exocarp that come in green and orange colours; are short-lived, less hardy
and needing specific climatic conditions for better yields (Debmandal and Mandal, 2011). The
dwarf cultivar which has a worldwide cultivation represents only 5 % of coconut palms and it is
characterized by slow trunk growth and self-pollination (Bourdeix et al., 2001). Therefore, the tall
cultivars are mostly used for planting on a commercial scale. It is important to note that the cultivars
are specific to each region e.g. “Ceylon tall”, “Jamaican Tall”, “Indian Tall” and “West Africa
Tall” (Fife et al., 2001).
a b
6
2.2 USAGE OF THE MAJOR COMPONENTS OF COCONUT PALM
The coconut plant has valorization potentials in both food and non-food applications contributing
to the economy of many communities and nations. Many smallholder farmers regard this plant as
the “tree of life” because of its value chain which is an important source of income as well as
nutrition (Chan et al., 2006).
2.2.1 Coconut shell
Coconut shell constitutes about 15 % of de-husked coconut. The shell is a hard, fine grain substance
which can be used for the production of cups and some artworks. In many coconut producing
communities, these shells are left unattended to and are usually given to women who use them as
a source of energy for home cooking (NARI, 2004). The shell charcoal is obtained by burning the
coconut shell obtained from a fully grown coconut in an environment where there is a limited
supply of oxygen. The shell is also an important raw material for obtaining active carbon for gas
production, deodorization and bleaching (Fife et al., 2011). It is also used to obtain coconut shell
powders by pulverizing the mature shells (Muralidharan and Jayashree, 2011). This is used as an
Electromagnetic Interference absorbing material (Siti et al., 2016).
2.2.2 Coconut husk
Coconut husks act as an important material to protect the endosperm of the coconut fruit. It is
composed of fibers which are tightly packed. The fibers are called coir. The fibers are 15 to 35 cm
long (Muralidharan and Jayashree, 2011). When this coir is soaked in salt water, they separate and
can be used in the making of different items such as ropes, rugs, mat and chairs. In other
applications, the coir can be grounded to be used as soil mixes in greenhouse plants. The coir fiber
has some characteristic properties which make it useful for different applications. These properties
include elasticity and resistance to mechanical wear (Fife et al., 2011).
2.2.3 Coconut leaves
The leaves of coconut grow up to 6.1 meters in length. They are used for shading seedlings and
covering up nursery beds. The leaves are also used in the making of rooftops and fences. The thin
leaf strip can be weaved into clothing and furnishing (Fife et al., 2011). They have also been used
in the feeding of elephants. Also, the dry leaves are used as a source of fuel (Gunn et al., 2011).
7
Many rural communities where coconut trees are cultivated utilize the leaves for the production of
baskets, brooms and brushes.
2.2.4 Coconut water
Coconut water volume is dependent on the maturity of the coconut fruit (Figure 1a). It is higher in
immature fruit but as the fruit matures, the coconut water is gradually absorbed into the meat and
the meat solidifies more (NARI, 2003). Coconut water is found to contain numerous amounts of
both macro- and micronutrients. The main macronutrients are the soluble sugars such as sucrose,
glucose and fructose, proteins, water (95.5 %) and little amount of oil which makes the coconut
water to have low energy value of 44 kcal/l (Thampan and Rethinam 2004).
According to Loki and Rajamohan (2003), the micro-components are majorly inorganic ions such
as K (290 mg %), Na (42 mg %), Ca (44 mg %), Mg (10 mg %), P (9.2 mg %). Fife et al. (2011)
reported that coconut water contains vitamin C which could vary from 20-40 mg/l which helps in
reducing the rate of oxidation but at a limited rate due to the small quantity. Coconut water also
contains vitamins from group B, including nicotinic acids, pantothenic acids, biotin, riboflavin,
folic acid, trace amount of thiamine and pyridoxine. Furthermore, the water is said to have some
amino acids such as alanine, cysteine and serine (Fife et al., 2011).
Coconut water might be applicable for rehydration due to its electrolytes content such as potassium
and sodium. It also has application as a growth medium for certain microorganisms such as
Acetobacter xylinum, as medicine in the management of certain diseases such as high blood
pressure, and as a biocatalyst which helps in the synthesis of proteins (Prades et al. (2012); NARI,
2003).
2.2.5 Coconut kernel or meat
The coconut kernel is often the most commercially processed component of the coconut plant. The
whitish, firm substance found inside the coconut fruit is highly nutritious containing a substantial
amount of fats and proteins (Fife et al., 2011).
Through different processing methods, various kinds of products can be obtained from the kernel.
They include desiccated coconuts which are obtained through the removal of the brownish coat of
the kernel. The whitish substance obtained is disintegrated and dried to a moisture content of less
than 3 %. Its commercial usage in food industries has gained popularity all over the world

8
(Muralidharan and Jayashree, 2011). Also, a whitish liquid (coconut milk) can be obtained from
the coconut kernel that has been subjected to milling followed by squeezing with or without the
inclusion of water. The milk has application in the production of coconut cream and sauces (Fife
et al., 2011). Furthermore, virgin coconut oil (VCO), which is a highly sought-after product in the
international market can be made from the coconut kernel. It is obtained from the fresh, hard and
mature coconut with or without the application of heat. The different processes used in its
production must exclude the application of techniques such as bleaching, deodorizing and other
forms of chemical treatments so as to keep its natural properties (Divina et al., 2016).
VCO is currently used as food supplement and has application as cosmetics. A number of
physiotherapists also use it for massage. The increase in its demand may have been linked with the
report of the health benefits of the medium chain triglycerides (MCT) present in the oil
(Muralidharan and Jayashree, 2011). However, there are also contrary reports on the possible
negative health implication of the coconut oil MCT on Total Cholesterol Levels (Laurence et al.,
2013).
2.3 COCONUT FLOUR
Coconut flour is obtained by drying, expelling and /or removing the oil or milk from the mature
coconut kernel or meat. The kernel can be pared (removal of the external brown coat) or un-pared.
The flour is usually bland in taste but is a good source dietary fibre (Hossain et al., 2016).
According to Trinidad et al. (2006), coconut flour contains about 60 g dietary fiber/100 g, of which
56 percent is insoluble dietary fiber while 4 percent is soluble dietary fiber. This was found to be
almost double that of wheat bran and 4 times that of oat bran (Ramaswamy, 2014). Coconut flour
is different from other types of flours particularly because it does not contain phytic acid, a well-
known plant anti-nutrient commonly found in grain flours that inhibit the absorption of some
micronutrients such as iron (Ramaswamy, 2014).
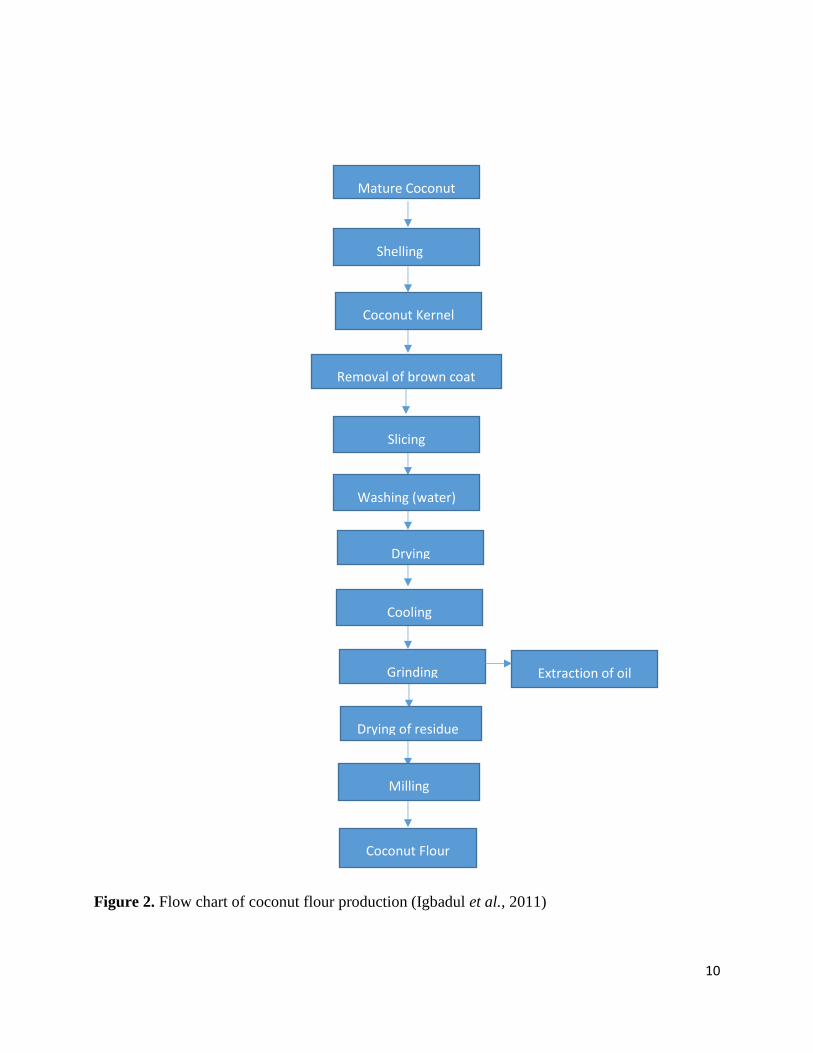
2.3.1 Processing of coconut flour
Coconuts which are to be used for coconut flour production should be harvested when they are
completely matured. This can be observed when the skin has turned mostly brown. At this state, it
will also enhance maximum oil and coconut residue recovery (NARI, 2003). The production of
coconut flour (Figure 2) according to Igbadul et al. (2011) showed that the coconut fruits are de-
9
shelled to have access to the coconut meat or kernels. The brown coat surrounding the kernel is
then carefully removed using a knife. This is called paring (PCA, 2006). The pared nuts are then
sliced into about 10 mm sizes and washed in water. This is followed by drying and cooling. They
will further be subjected to grinding using a powerful electric grinder after which the oil extraction
process is carried out using the screw press method. The residue obtained after the completion of
this procedure is re-dried in oven at 60 °C for 30 min. This is then followed by milling and
packaging of the flour. This produces coconut flour that is high in protein and can be used as a
partial substitute for wheat in the making of baked food products (Ramaswamy, 2014).
10
Mature Coconut
Figure 2. Flow chart of coconut flour production (Igbadul et al., 2011)
Shelling
Coconut Kernel
Removal of brown coat
Slicing
Grinding
Cooling
Drying
Washing (water)
Extraction of oil
Drying of residue
Milling
Coconut Flour
11
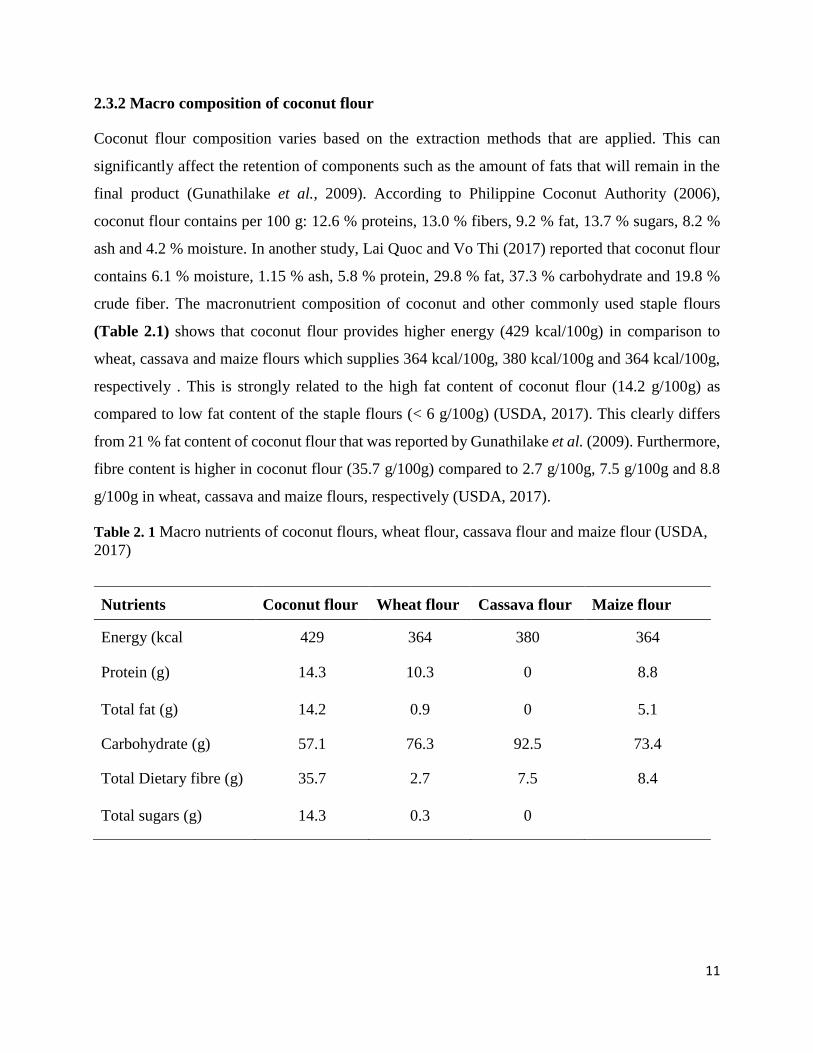
2.3.2 Macro composition of coconut flour
Coconut flour composition varies based on the extraction methods that are applied. This can
significantly affect the retention of components such as the amount of fats that will remain in the
final product (Gunathilake et al., 2009). According to Philippine Coconut Authority (2006),
coconut flour contains per 100 g: 12.6 % proteins, 13.0 % fibers, 9.2 % fat, 13.7 % sugars, 8.2 %
ash and 4.2 % moisture. In another study, Lai Quoc and Vo Thi (2017) reported that coconut flour
contains 6.1 % moisture, 1.15 % ash, 5.8 % protein, 29.8 % fat, 37.3 % carbohydrate and 19.8 %
crude fiber. The macronutrient composition of coconut and other commonly used staple flours
(Table 2.1) shows that coconut flour provides higher energy (429 kcal/100g) in comparison to
wheat, cassava and maize flours which supplies 364 kcal/100g, 380 kcal/100g and 364 kcal/100g,
respectively . This is strongly related to the high fat content of coconut flour (14.2 g/100g) as
compared to low fat content of the staple flours (< 6 g/100g) (USDA, 2017). This clearly differs
from 21 % fat content of coconut flour that was reported by Gunathilake et al. (2009). Furthermore,
fibre content is higher in coconut flour (35.7 g/100g) compared to 2.7 g/100g, 7.5 g/100g and 8.8
g/100g in wheat, cassava and maize flours, respectively (USDA, 2017).
Table 2. 1 Macro nutrients of coconut flours, wheat flour, cassava flour and maize flour (USDA,
2017)
Nutrients Coconut flour Wheat flour Cassava flour Maize flour
Energy (kcal 429 364 380 364
Protein (g) 14.3 10.3 0 8.8
Total fat (g) 14.2 0.9 0 5.1
Carbohydrate (g) 57.1 76.3 92.5 73.4
Total Dietary fibre (g) 35.7 2.7 7.5 8.4
Total sugars (g) 14.3 0.3 0
12
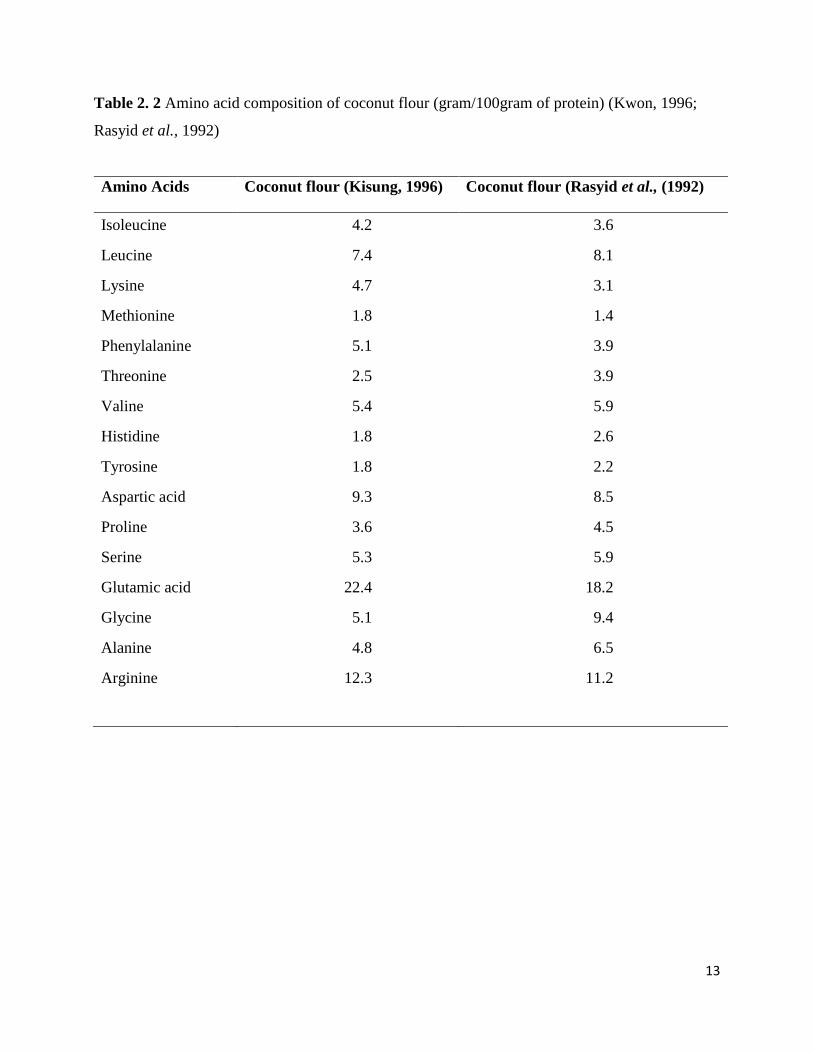
2.3.3 Nutrient composition of coconut flour
Coconut protein component is majorly categorized into three fractions namely albumins, globulins
and glutelins. It is important to know that the amino acid composition in each of these fractions
differs. The amino acids composition of glutelins and globulins are quite similar but the amino
acids absolute value is higher in globulins than in glutelins. Therefore, the globulin is the major
fraction of coconut flour protein (Kwon, 1996). Table 2.2 revealed the amino acid composition of
coconut flour from two different studies; Kwon (1996) and Rasyid et al. (1992). It indicated
similarities in some amino acids such as valine, seline and glutamic acid while marked differences
existed in their glycine and alanine content. Rasyid et al. (1992) reported that coconut flour protein
is comparable with that of soy flour and could play a role in food systems where the beany flavor
of soy flour is unacceptable. The amino acid profile further provided an information that coconut
flour has a balance in its amino acid profile and that it may be used to enrich certain flours that are
limiting in their amino acid composition. For instance Shoup et al. (1966) provided information
about of wheat flour obtained from several wheat varieties. Lysine, the limiting amino acid in wheat
flour were found to be in the range of 1.7-1.9 g/100g of protein which is lower than the range of
3.1-4.7 g/100g of protein reported by the two authors in Table 2.2.
Interestingly, in the production of coconut flour, a substantial amount of the fat component had
been removed and used in the production of oil but the flour still contains some fats which is
majorly saturated fats (14.3 g/100g) but free from trans fats (USDA, 2017). These saturated fatty
acids are mainly medium chain fatty acids such as lauric and myristic acids (Arora et al., 2011). It
is important to note that there are traces of unsaturated fatty acids such as oleic acid, linoleic acid
and linolenic acids (Shamina, 2007).
Compared to cereals crops which can be grown on less mineralized soils, coconuts plants are
commonly grown in highly rich mineralized soil which contributes to the presence of trace minerals
such as iron (18 mg/100g), calcium (57 mg/100g) and sodium (200 mg/100g) (USDA, 2017). These
minerals may be easily absorbable due to the absence of phytic acid which inhibits bioavailability
of trace element in many kinds of cereal product (Ramaswamy, 2014).
13
Table 2. 2 Amino acid composition of coconut flour (gram/100gram of protein) (Kwon, 1996;
Rasyid et al., 1992)
Amino Acids Coconut flour (Kisung, 1996) Coconut flour (Rasyid et al., (1992)
Isoleucine 4.2 3.6
Leucine 7.4 8.1
Lysine 4.7 3.1
Methionine 1.8 1.4
Phenylalanine 5.1 3.9
Threonine 2.5 3.9
Valine 5.4 5.9
Histidine 1.8 2.6
Tyrosine 1.8 2.2
Aspartic acid 9.3 8.5
Proline 3.6 4.5
Serine 5.3 5.9
Glutamic acid 22.4 18.2
Glycine 5.1 9.4
Alanine 4.8 6.5
Arginine 12.3 11.2
14
2.3.4 The Nutritional benefits of coconut flour
Trinidad et al. (2004) and Daniela (2016) both reported that coconut flour is gluten-free. Therefore,
it may be suitable for individuals who develop allergic reaction upon the consumption of gluten-
rich foods (Ramaswamy, 2014).
Coconut flour contains medium chain fatty acids which are mostly saturated but has no trans fats
and cholesterol (USDA, 2017). The Fatty acid composition of the coconut oil shows that it contains
92.7 % saturated fats of which 59.7 % is MCFA while mono unsaturated fatty acids and poly
unsaturated fatty acids constitutes 6.1 % and 1.2 %, respectively (Bhatnagar et al., 2009). Although,
there is conflicting evidence about the nutritional relevance of these acids particularly the principal
lauric acid which constitute about 50 % of the total fatty acids (Nevin and Rajamohan, 2006).
However, Awasthi (2016) describes these medium chain fatty acids to be easily digestible and
absorbed within the level of the small intestine. This ensures that the MCFA which are supplied,
do not interfere or participate in the transportation and biosynthesis of cholesterol in the body
(Debmandal and Mandal, 2011). Bhatnagar et al. (2009) further revealed that coconut oil was
deficient in total tocopherols when compared with other vegetable oils such as soybean, sunflower
oil etc.
Coconut flour is a low carbohydrate supplier that contains a high amount of dietary fibre compared
to flours like wheat and maize flour. Dietary fibre can be described as plant materials such as
cellulose, pectin, hemicellulose and polysaccharides such as gums that cannot be digested by the
digestive enzymes in the human body. Based on the study of Raghavarao et al. (2008), coconut
dietary fibre contained 58.7 % insoluble dietary fibre and 4.5 % soluble dietary fibre. The fibre
fractions are neutral detergent fibre (81.4 %) which comprises of 44.5 % acid detergent fibre and
36.9 % hemicellulose; cellulose (16.1 %) and lignin (1.3 %) (Yalegama and Chavan, 2004). The
World Health Organization recommends at least 25 g daily consumption of dietary fibre (Fuller et
al., 2016). According to USDA (2017) in Table 2.1, 100 g of coconut flour supplies more than this
minimum daily intake level of dietary fibre. However, Philippine Coconut Authority (2006)
reported a coconut flour with dietary fibre of 13 g/100g which implies that it will require about 200
g of this flour to meet the minimum requirement. It is important to note that dietary fibre can help
in regulating bodyweight (Galisteo et al., 2008). It is associated with increasing feacal bulk and
decreasing the transit time of food within the intestine (Heredia et al., 2002). It can be metabolized
15
in the colon to produce butyrate which is an important substrate for the maintenance of colonic
health (Ramaswamy, 2014). These butyrates help to enhance cell differentiation and prevent tumor
formation at the level of the colon (Trinidad et al., 2006). In another study, Trinidad et al. (2004)
reported that the fibrous nature of coconut flour may have been important in bounding the bile acids
which prevents their reabsorption at the level of the liver which eventually leads to their excretion.
Furthermore, high amount of dietary fibre from coconut flour contributes to delaying the glycemic
responses of the coconut flour supplemented food. This may be of particular benefit to people of
high blood glucose (Ramaswamy, 2014).
2.3.5 Possible applications of coconut flour
The development and application of different flours such as wheat flour, cassava flour and coconut
flour in different food applications have been well documented (Olaoye et al., 2006; Shittu et al.,
2008; Chavan et al., 2009). These flours constitute a substantial amount in the diet of many around
the world. The summary of some of the studies which was conducted that entail the incorporation
of coconut flour in composite ratio with other commonly used flours in the food industry is
presented in Table 2.3. The data shows the type of food products that coconut flour have been
incorporated into and the optimum level of incorporation.
Conventionally, wheat flour has been the major ingredient used in the production of breads, cakes
and cookies because of the functionality of wheat flour (Tharise et al., 2014). What makes wheat
flour unique for the baking industry is its ability to retain gas during baking, which aids in the
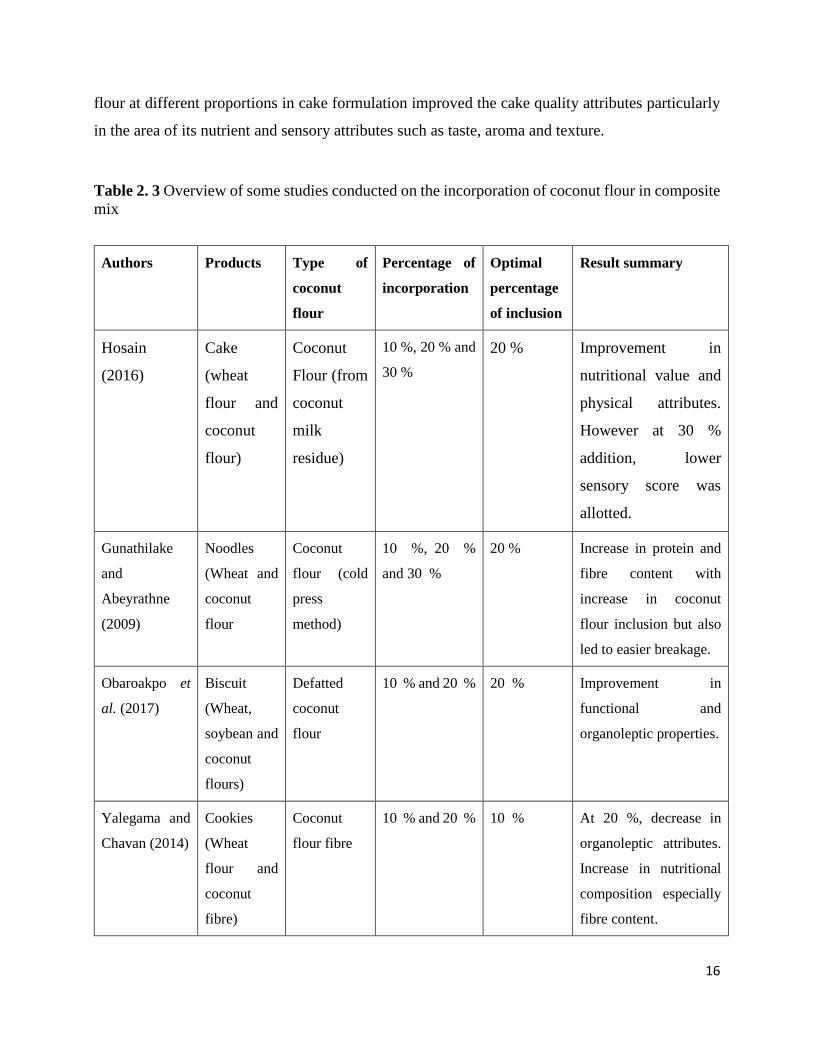
formation of an aerated foam structure. This is attributed to the gluten protein which is not present
in other flours (Lazaridou et al., 2007). However, many countries have decided to shift the attention
away from wheat flour in order to give value addition to other staple flour types which can be
sourced locally. A typical example is cassava flour which has received attention in bread making
(Shittu et al., 2007). In Nigeria, it has been mandated at National level to include at least 10 %
cassava flour in bread production while tax have been imposed on the importation of wheat and
wheat flour (Aristizábal et al., 2017). One major constraint is the unusual taste that may be observed
in cassava incorporated breads (Alvarenga et al., 2011). Sujirtha and Mahendran (2015) also
reported that application of coconut flour in baking industries helps in improving the amino acid
content of wheat flour, especially lysine. Hossain et al. (2016) showed that incorporation of coconut
16
flour at different proportions in cake formulation improved the cake quality attributes particularly
in the area of its nutrient and sensory attributes such as taste, aroma and texture.
Table 2. 3 Overview of some studies conducted on the incorporation of coconut flour in composite
mix
Authors Products Type of
coconut
flour
Percentage of
incorporation
Optimal
percentage
of inclusion
Result summary
Hosain
(2016)
Cake
(wheat
flour and
coconut
flour)
Coconut
Flour (from
coconut
milk
residue)
10 %, 20 % and
30 %
20 % Improvement in
nutritional value and
physical attributes.
However at 30 %
addition, lower
sensory score was
allotted.
Gunathilake
and
Abeyrathne
(2009)
Noodles
(Wheat and
coconut
flour
Coconut
flour (cold
press
method)
10 %, 20 %
and 30 %
20 % Increase in protein and
fibre content with
increase in coconut
flour inclusion but also
led to easier breakage.
Obaroakpo et
al. (2017)
Biscuit
(Wheat,
soybean and
coconut
flours)
Defatted
coconut
flour
10 % and 20 % 20 % Improvement in
functional and
organoleptic properties.
Yalegama and
Chavan (2014)
Cookies
(Wheat
flour and
coconut
fibre)
Coconut
flour fibre
10 % and 20 % 10 % At 20 %, decrease in
organoleptic attributes.
Increase in nutritional
composition especially
fibre content.
17
However, according to Sujirtha and Mahendran (2015), upon substitution of wheat flour with
coconut flour at high amount (50 %) in the production of biscuits, there was decrease in the score
for taste. This was attributed to the strong taste of coconut which dominated the product.
Furthermore, depending on consumer’s preference, the texture of biscuit received a decreased score
compared to biscuits without or lower amount of coconut flour. Also, baked products
supplemented with coconut flour became darker in colour due to the amino acids (lysine) and sugar
(fructose) present in the flour contributing to Maillard reaction during baking. However, 20 % for
supplementation with coconut flour was found acceptable (Gunathilake and Yalegama, 2009).
Porridges are also an important part of the diet of many people in developing country. Porridges
should be seen as a liquid viscous or thickened food that can be made mostly from cereal flours
such as corn, millet, and sorghum (FAO, 2001). The porridges are used in the feeding of young
children. During cooking, these flours absorb water and there will be an increase in viscosity due
to the starch pasting profile of the cereal flours. The extent of thickness is directly correlated to the
quantity of flour added to the boiling water (FAO, 2001). According to Igbabul et al. (2014),
fermented defatted coconut flour shows potential to be applied as a porridge. The fermentation
process after 72 hr made the defatted coconut flour to increase in water adsorption capacity and
viscosity. Furthermore, according to Usman and Okafor (2015), nutritious breakfast can be made
from blends of locally available products such as rice, soya beans and coconut flour. Through this,
the low nutritional quality of some cereals can be improved through supplementation with blends
of coconut flour.
Noodles and pasta products are majorly made from wheat flour (Nagao, 1996). However, many
studies have also reported the use of other flours in proportions to wheat flour (Devaraju et al.,
2006; Ayo and Nkama, 2003). According to Gunathilake and Abeyrathne (2009), the study
concluded that coconut flour added up to 20 % was not significantly different from noodles made
from 100 % wheat flour. However, following the partial substitution of wheat flour with coconut
flour in the production of noodles, the absence of gluten protein in coconut flour led to the ease
breakage of the noodles as compared to noodles produced from 100 % wheat flour. This is due to
the reduction of the viscoelastic ability of the wheat protein because of the higher inclusion of
18
coconut flour. Refined wheat is not an excellent source of dietary fiber. Therefore coconut flour
can be incorporated into wheat flour during noodles production in order to improve its fiber content
and confer important health benefits (Gunathilake and Yalegama, 2009).
19
CHAPTER 3
MATERIALS AND METHODS
3.1 MATERIALS
3.1.1 Raw material sources
Fresh and mature coconuts fruit (Figure 1a) were purchased at the Badagry coconut market in
Lagos, Nigeria. The coconuts were transported in sacks and stored at room temperature until further
use. Cassava flour and corn flour were purchased in a local store in Ghent, Belgium. Wheat flour
as well as other ingredients for chapatti production which comprise sugar, salt and vegetable oil
were all made available in the laboratory at the Ghent University.
3.1.2. Raw material preparation
3.1.2.1 Experimental site
The preliminary raw material preparatory procedure for the coconuts flour production was carried
out at Delay Farms and foods company, Ogun State, Nigeria. All other experimental procedures
were carried out at the laboratory of Food Technology and Engineering (FTE), the laboratory of
Food Chemistry and Human Nutrition and the Laboratory of Cereals Technology at the Ghent
University, Belgium, using analytical grade reagents.
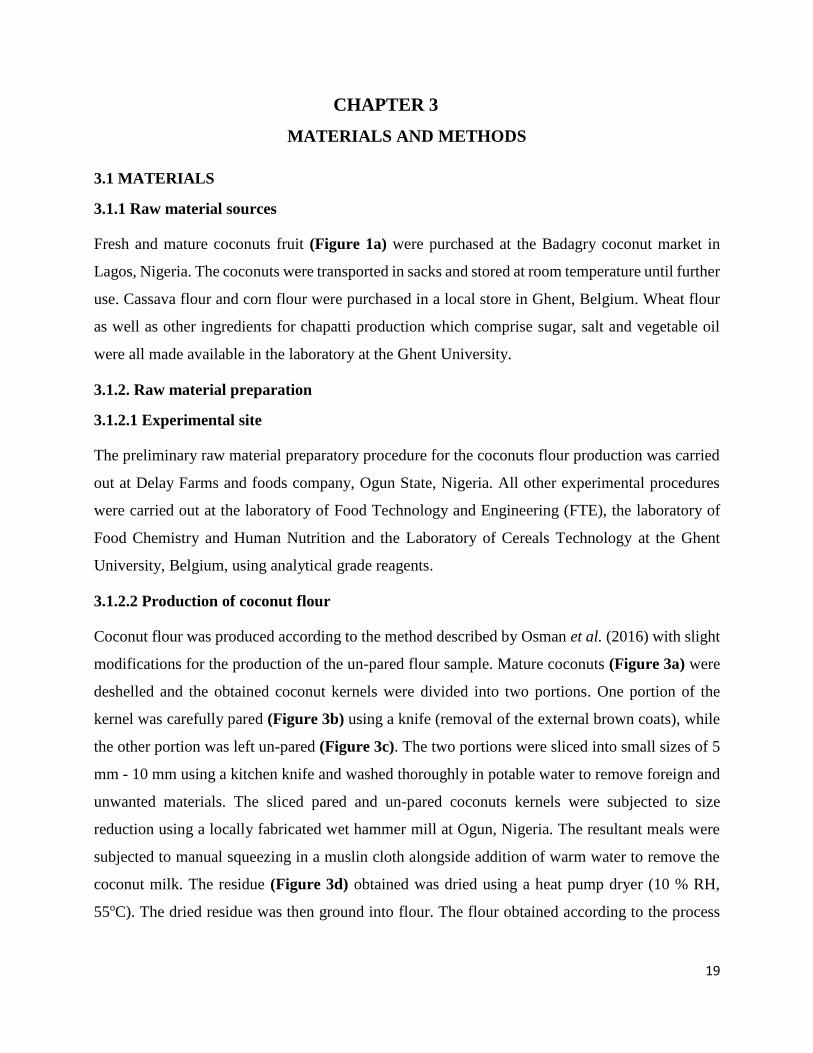
3.1.2.2 Production of coconut flour
Coconut flour was produced according to the method described by Osman et al. (2016) with slight
modifications for the production of the un-pared flour sample. Mature coconuts (Figure 3a) were
deshelled and the obtained coconut kernels were divided into two portions. One portion of the
kernel was carefully pared (Figure 3b) using a knife (removal of the external brown coats), while
the other portion was left un-pared (Figure 3c). The two portions were sliced into small sizes of 5
mm - 10 mm using a kitchen knife and washed thoroughly in potable water to remove foreign and
unwanted materials. The sliced pared and un-pared coconuts kernels were subjected to size
reduction using a locally fabricated wet hammer mill at Ogun, Nigeria. The resultant meals were
subjected to manual squeezing in a muslin cloth alongside addition of warm water to remove the
coconut milk. The residue (Figure 3d) obtained was dried using a heat pump dryer (10 % RH,
55oC). The dried residue was then ground into flour. The flour obtained according to the process
20
described in Figure 4, was then packaged using transparent polyethylene film and properly stored
in a dark cupboard at ambient temperature.
Figure 3: Images showing some of the stages in the production of coconut flour. De-husked mature
coconut (a), pared (removal of external brown coat) coconut kernel (b), sliced un-pared coconut
kernels (c), pared and un-pared coconut residue on a drying shelves (d).
3.2 METHODS
3.2.1 Chemical composition of the flours
3.2.1.1 Moisture content
Moisture content was estimated by the oven method described by AOAC (1999) with method
number 934.01. A dish containing sea sand and glass stick was heated in the oven for 2 hr at 105
oC. It was allowed to cool in a desiccator and the weight was recorded. About 5 g of each sample
was weighed into the dishes and mixed well with the sand and kept in the oven at 105 oC for two
hours. Repetition of drying was carried out for one additional hour as long as there is reduction in
weight. The % loss of weight from the sample was determined and reported as % moisture content.
a
c
b
d
21
3.2.1.2 Ash content
The ash content was determined according to the method described by AOAC (1999) with method
number 942.05. Approximately 5 g of sample was weighed into a pre-heated and weighed porcelain
crucible. This was then heated up on a hot plate until smoke ceases to appear. The crucible was
then transferred into a muffle furnace at 550 oC for three hours. It was allowed to cool in a
desiccator and weighed again. The percentage loss in weight after “ashing” is reported as
percentage ash content.
3.2.1.3 Protein content
The protein content was determined by Kjedahl method according to the steps described in AOAC
(1999) with method number 920.87. Sample weight of 0.3 - 0.5 g was carefully measured into a
Kjeldahl tube. One catalyst tablet was added into the tube alongside the addition of 10 ml of
concentrated H2SO4. The digestion of the sample was done until a bright green colour was obtained.
The digested materials was allowed to cool at room temperature. Distillation was then carried out
followed by titration with 0.05N HCL to obtain a purple colour. Conversion factors of 6.25 was
used for wheat flour while 5.70 was used for the rest of the flour samples to convert nitrogen values
into protein content of the flour samples.
3.2.1.4 Fat content
The fat content was estimated by Soxhlet extraction method according to the standard method
described in AOAC (1990) with method number 7.057. Approximately 4 - 5 g of samples was
weighed into a 250ml beaker containing boiling stones. About 45 ml of boiling water and 55 ml of
25 % HCl was added. The mixture was brought to boil until it turned completely black. The content
was filtered and fat was extracted with petroleum ether in the Soxhlet apparatus for 4 hr. The
petroleum ether was evaporated using a rotary evaporator and the sample was then subjected to
repetitive drying to remove residual petroleum ether. The loss in weight after drying was used to
estimate the percentage fat content.
22
Figure 4. Flow chart for the production of pared and un-pared coconut flour.
Mature Coconuts
De-shelling
Drying of Residue
Squeezing
Coconut Flour (Un-pared)
Grinding
Pared Coconut Kernels Un-pared Coconut Kernels
Slicing
Washing
Grinding
Coconut Flour (Pared)
23
3.2.1.5 Crude fibre content
Crude fiber was estimated using the enzymatic-gravimetric method based on the procedure that
was described by Johansson et al. (1983) and AOAC (1984) with method number 47.021. Defatting
was first performed for samples containing more than 5 % fat content by treating with petroleum
benzene (3 times) followed by drying. A measurement of 1 g of the dried samples was prepared
and 40 ml MES/TRIS buffer solution was added. The solution was digested using alpha amylase,
protease and amylo-glucosidase solution. Following the enzymatic breakdown, 220 ml of heated
(60 oC) 95 % ethanol was added, the precipitates were allowed to settle at room temperature for a
least 1 hr. The solution was filtered and the residue was washed with 78 % ethanol, 95 % ethanol
and acetone solutions. The residue was allowed to dry overnight in an oven at 105 oC. Protein and
ash content of the residues were determined. The fibre content was converted from fat-free basis to
product basis.
3.2.1.6 Carbohydrate content
Carbohydrate content was estimated by difference method according to the method described by
Ohizua et al. (2016). The carbohydrate content determined according to the equation below;
% Carbohydrate Content = 100 % - (fat + fibre + ash + protein) %. (Equation 1)
3.2.2 Functional properties
3.2.2.1 Pasting properties of flour samples
The pasting profile of the samples were evaluated using the AR 2000 rheometer according to the
method described by AACC (2000). About 3.5 g of samples was suspended in a 25 g of distilled
water inside the rheometer canister. The canister was immediately placed firmly into the paddle
coupling and the motor tower of the instrument where the stirrer was attached was immediately
depressed. The suspension was subjected to controlled heating and cooling cycles from 50 oC to 95
oC and then to 50 oC for a period of 56 min. The suspension was conditioned at 50 oC for 11 min,
heated to 95 oC at 2.8 oC/min, held at 95 oC for 10 min and cooled to 50 oC at the rate of 2.8 oC/min.
The data obtained was in expressed in pa.s and converted to mPa.s except for pasting temperature
that the data was obtained and reported in oC. The following pasting parameters were obtained;
pasting temperature (oC), peak viscosity (mPa.s), breakdown viscosity (mPa.s), final viscosity
(mPa.s) and set back viscosity (mPa.s) (Olugbenga, 2016).
24
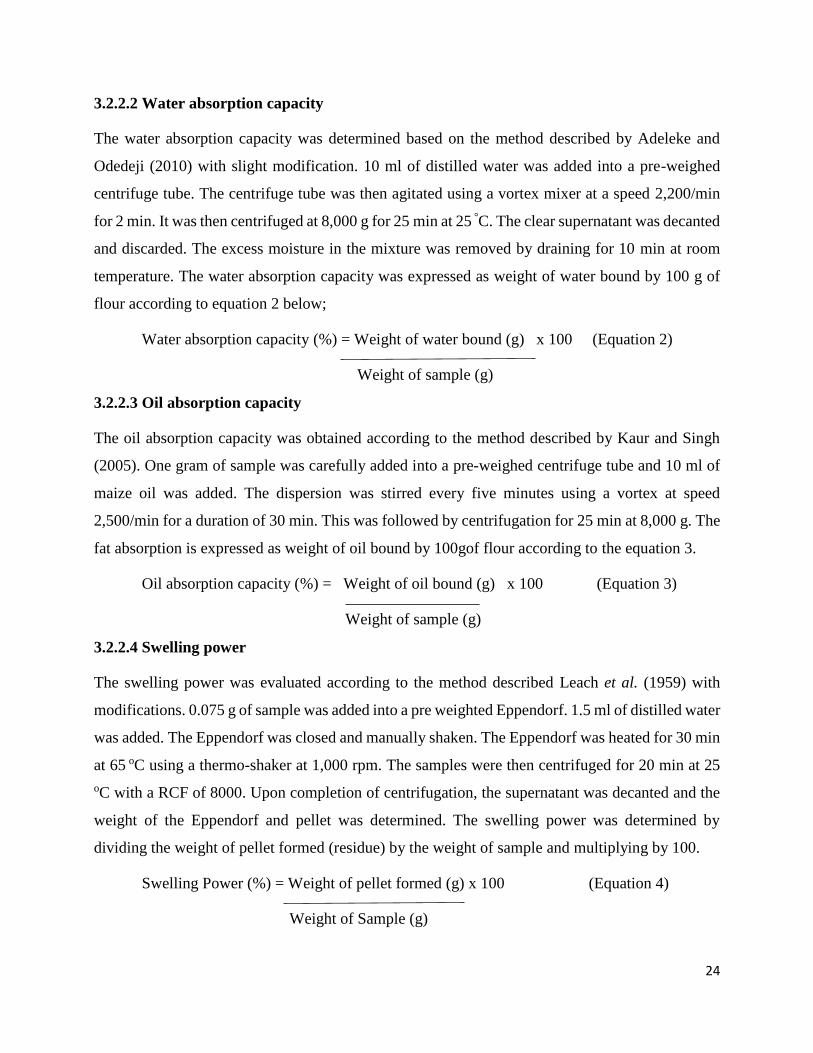
3.2.2.2 Water absorption capacity
The water absorption capacity was determined based on the method described by Adeleke and
Odedeji (2010) with slight modification. 10 ml of distilled water was added into a pre-weighed
centrifuge tube. The centrifuge tube was then agitated using a vortex mixer at a speed 2,200/min
for 2 min. It was then centrifuged at 8,000 g for 25 min at 25 °C. The clear supernatant was decanted
and discarded. The excess moisture in the mixture was removed by draining for 10 min at room
temperature. The water absorption capacity was expressed as weight of water bound by 100 g of
flour according to equation 2 below;
Water absorption capacity (%) = Weight of water bound (g) x 100 (Equation 2)
Weight of sample (g)
3.2.2.3 Oil absorption capacity
The oil absorption capacity was obtained according to the method described by Kaur and Singh
(2005). One gram of sample was carefully added into a pre-weighed centrifuge tube and 10 ml of
maize oil was added. The dispersion was stirred every five minutes using a vortex at speed
2,500/min for a duration of 30 min. This was followed by centrifugation for 25 min at 8,000 g. The
fat absorption is expressed as weight of oil bound by 100gof flour according to the equation 3.
Oil absorption capacity (%) = Weight of oil bound (g) x 100 (Equation 3)
Weight of sample (g)
3.2.2.4 Swelling power
The swelling power was evaluated according to the method described Leach et al. (1959) with
modifications. 0.075 g of sample was added into a pre weighted Eppendorf. 1.5 ml of distilled water
was added. The Eppendorf was closed and manually shaken. The Eppendorf was heated for 30 min
at 65 oC using a thermo-shaker at 1,000 rpm. The samples were then centrifuged for 20 min at 25
oC with a RCF of 8000. Upon completion of centrifugation, the supernatant was decanted and the
weight of the Eppendorf and pellet was determined. The swelling power was determined by
dividing the weight of pellet formed (residue) by the weight of sample and multiplying by 100.
Swelling Power (%) = Weight of pellet formed (g) x 100 (Equation 4)
Weight of Sample (g)
25
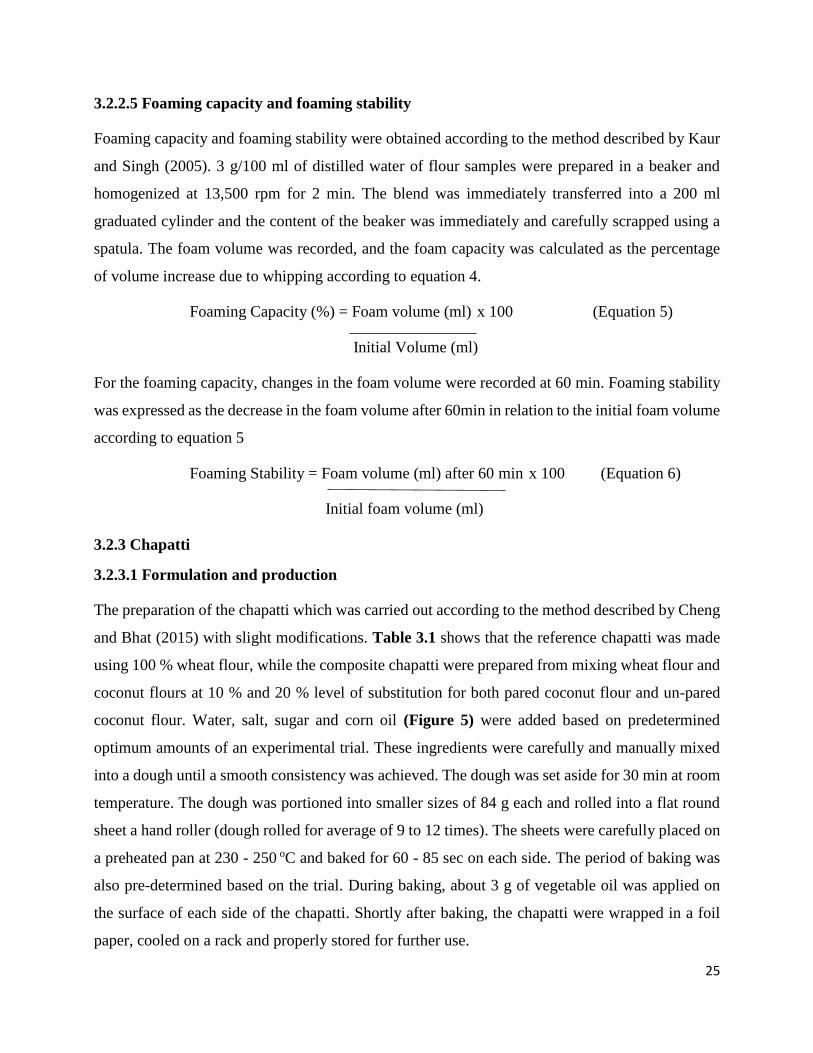
3.2.2.5 Foaming capacity and foaming stability
Foaming capacity and foaming stability were obtained according to the method described by Kaur
and Singh (2005). 3 g/100 ml of distilled water of flour samples were prepared in a beaker and
homogenized at 13,500 rpm for 2 min. The blend was immediately transferred into a 200 ml
graduated cylinder and the content of the beaker was immediately and carefully scrapped using a
spatula. The foam volume was recorded, and the foam capacity was calculated as the percentage
of volume increase due to whipping according to equation 4.
Foaming Capacity (%) = Foam volume (ml) x 100 (Equation 5)
Initial Volume (ml)
For the foaming capacity, changes in the foam volume were recorded at 60 min. Foaming stability
was expressed as the decrease in the foam volume after 60min in relation to the initial foam volume
according to equation 5
Foaming Stability = Foam volume (ml) after 60 min x 100 (Equation 6)
Initial foam volume (ml)
3.2.3 Chapatti
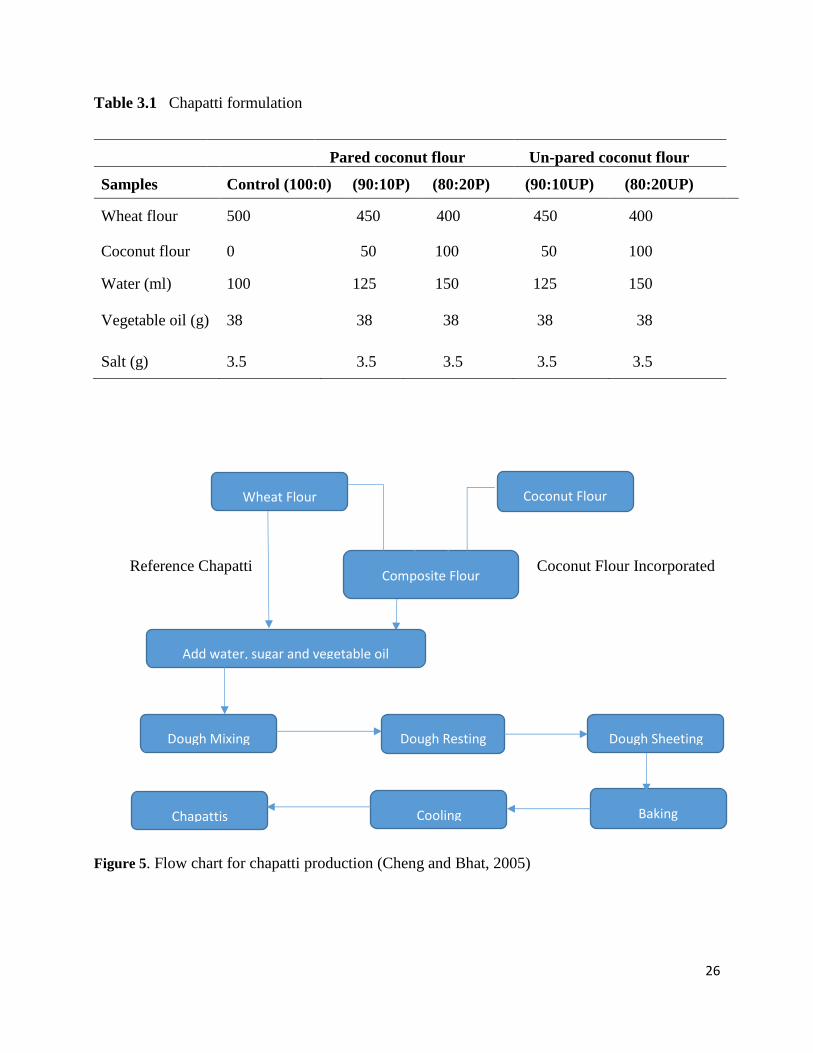
3.2.3.1 Formulation and production
The preparation of the chapatti which was carried out according to the method described by Cheng
and Bhat (2015) with slight modifications. Table 3.1 shows that the reference chapatti was made
using 100 % wheat flour, while the composite chapatti were prepared from mixing wheat flour and
coconut flours at 10 % and 20 % level of substitution for both pared coconut flour and un-pared
coconut flour. Water, salt, sugar and corn oil (Figure 5) were added based on predetermined
optimum amounts of an experimental trial. These ingredients were carefully and manually mixed
into a dough until a smooth consistency was achieved. The dough was set aside for 30 min at room
temperature. The dough was portioned into smaller sizes of 84 g each and rolled into a flat round
sheet a hand roller (dough rolled for average of 9 to 12 times). The sheets were carefully placed on
a preheated pan at 230 - 250 oC and baked for 60 - 85 sec on each side. The period of baking was
also pre-determined based on the trial. During baking, about 3 g of vegetable oil was applied on
the surface of each side of the chapatti. Shortly after baking, the chapatti were wrapped in a foil
paper, cooled on a rack and properly stored for further use.
26
Table 3.1 Chapatti formulation
Pared coconut flour Un-pared coconut flour
Samples Control (100:0) (90:10P) (80:20P) (90:10UP) (80:20UP)
Wheat flour 500 450 400 450 400
Coconut flour 0 50 100 50 100
Water (ml) 100 125 150 125 150
Vegetable oil (g) 38 38 38 38 38
Salt (g) 3.5 3.5 3.5 3.5 3.5
Reference Chapatti Coconut Flour Incorporated
Figure 5. Flow chart for chapatti production (Cheng and Bhat, 2005)
Dough Resting
Wheat Flour Coconut Flour
Dough Mixing
Add water, sugar and vegetable oil
Composite Flour
Dough Sheeting
Baking Cooling Chapattis
27
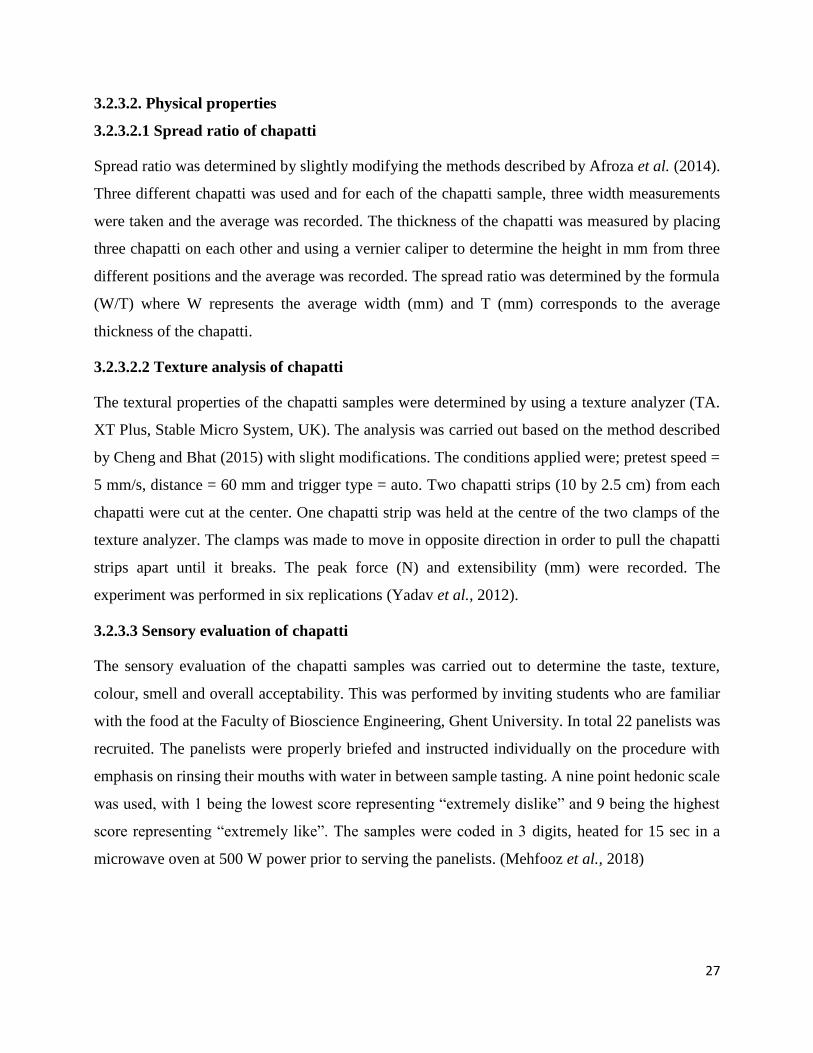
3.2.3.2. Physical properties
3.2.3.2.1 Spread ratio of chapatti
Spread ratio was determined by slightly modifying the methods described by Afroza et al. (2014).
Three different chapatti was used and for each of the chapatti sample, three width measurements
were taken and the average was recorded. The thickness of the chapatti was measured by placing
three chapatti on each other and using a vernier caliper to determine the height in mm from three
different positions and the average was recorded. The spread ratio was determined by the formula
(W/T) where W represents the average width (mm) and T (mm) corresponds to the average
thickness of the chapatti.
3.2.3.2.2 Texture analysis of chapatti
The textural properties of the chapatti samples were determined by using a texture analyzer (TA.
XT Plus, Stable Micro System, UK). The analysis was carried out based on the method described
by Cheng and Bhat (2015) with slight modifications. The conditions applied were; pretest speed =
5 mm/s, distance = 60 mm and trigger type = auto. Two chapatti strips (10 by 2.5 cm) from each
chapatti were cut at the center. One chapatti strip was held at the centre of the two clamps of the
texture analyzer. The clamps was made to move in opposite direction in order to pull the chapatti
strips apart until it breaks. The peak force (N) and extensibility (mm) were recorded. The
experiment was performed in six replications (Yadav et al., 2012).
3.2.3.3 Sensory evaluation of chapatti
The sensory evaluation of the chapatti samples was carried out to determine the taste, texture,
colour, smell and overall acceptability. This was performed by inviting students who are familiar
with the food at the Faculty of Bioscience Engineering, Ghent University. In total 22 panelists was
recruited. The panelists were properly briefed and instructed individually on the procedure with
emphasis on rinsing their mouths with water in between sample tasting. A nine point hedonic scale
was used, with 1 being the lowest score representing “extremely dislike” and 9 being the highest
score representing “extremely like”. The samples were coded in 3 digits, heated for 15 sec in a
microwave oven at 500 W power prior to serving the panelists. (Mehfooz et al., 2018)
28
3.2.3.4 Chemical composition of chapatti
The chapatti samples were all subjected to size reduction using a kitchen knife prior to subjecting
them to analysis. The moisture, ash, protein, fat, carbohydrate and fibre contents were determined
according to the methods described in section 3.2.1.
In addition, the energy values (kcal/100 g) of chapatti samples were calculated by adding the
multiplication values of the protein (g), fat (g) and carbohydrate (g) contents with their respective
Atwater factors of 4, 9 and 4.
3.3 Statistical analysis
The results obtained in this study are presented as mean ± standard deviation of three independent
replications. The statistical significance was generated by subjecting the results of the analysis to
one-way analysis of variance (ANOVA) to compare the means using SPSS version 16. A post doc
analysis using Duncan multiple range test was used to separate the means and homogeneity of
variance was also carried out. The test was accepted at 5 % significant level (Chinma et al., 2012).
The data obtained from the sensory evaluation was subjected to similar statistical test with N=22.
29
CHAPTER 4
RESULTS AND DISCUSSION
4.1 CHEMICAL COMPOSITION OF FLOURS
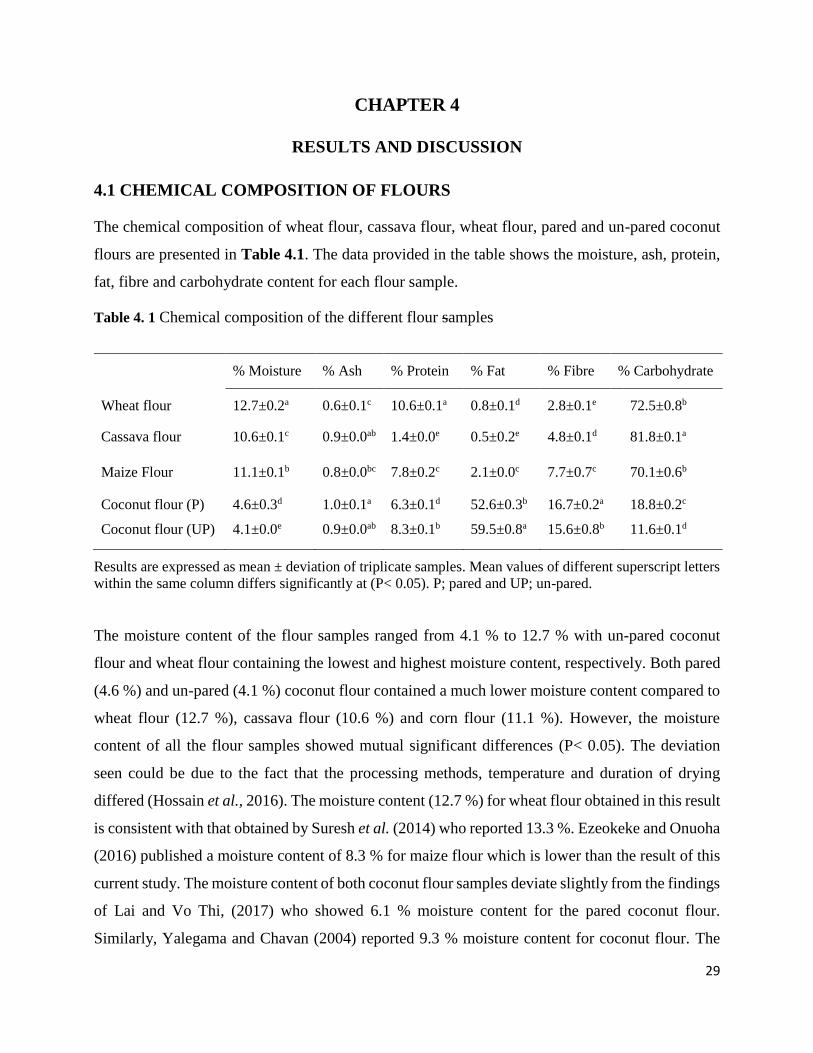
The chemical composition of wheat flour, cassava flour, wheat flour, pared and un-pared coconut
flours are presented in Table 4.1. The data provided in the table shows the moisture, ash, protein,
fat, fibre and carbohydrate content for each flour sample.
Table 4. 1 Chemical composition of the different flour samples
% Moisture % Ash % Protein % Fat % Fibre % Carbohydrate
Wheat flour 12.7±0.2a 0.6±0.1c 10.6±0.1a 0.8±0.1d 2.8±0.1e 72.5±0.8b
Cassava flour 10.6±0.1c 0.9±0.0ab 1.4±0.0e 0.5±0.2e 4.8±0.1d 81.8±0.1a
Maize Flour 11.1±0.1b 0.8±0.0bc 7.8±0.2c 2.1±0.0c 7.7±0.7c 70.1±0.6b
Coconut flour (P) 4.6±0.3d 1.0±0.1a 6.3±0.1d 52.6±0.3b 16.7±0.2a 18.8±0.2c
Coconut flour (UP) 4.1±0.0e 0.9±0.0ab 8.3±0.1b 59.5±0.8a 15.6±0.8b 11.6±0.1d
Results are expressed as mean ± deviation of triplicate samples. Mean values of different superscript letters
within the same column differs significantly at (P< 0.05). P; pared and UP; un-pared.
The moisture content of the flour samples ranged from 4.1 % to 12.7 % with un-pared coconut
flour and wheat flour containing the lowest and highest moisture content, respectively. Both pared
(4.6 %) and un-pared (4.1 %) coconut flour contained a much lower moisture content compared to
wheat flour (12.7 %), cassava flour (10.6 %) and corn flour (11.1 %). However, the moisture
content of all the flour samples showed mutual significant differences (P< 0.05). The deviation
seen could be due to the fact that the processing methods, temperature and duration of drying
differed (Hossain et al., 2016). The moisture content (12.7 %) for wheat flour obtained in this result
is consistent with that obtained by Suresh et al. (2014) who reported 13.3 %. Ezeokeke and Onuoha
(2016) published a moisture content of 8.3 % for maize flour which is lower than the result of this
current study. The moisture content of both coconut flour samples deviate slightly from the findings
of Lai and Vo Thi, (2017) who showed 6.1 % moisture content for the pared coconut flour.
Similarly, Yalegama and Chavan (2004) reported 9.3 % moisture content for coconut flour. The
30
moisture content of the individual flours are within the recommended level of not more than 14 %
for proper and safe storage. This criterion plays an important role in the prevention of microbial
deterioration, chemical changes and by consequence leads to extension of shelf life and overall
quality of flour products (Shahzadi et al., 2005). This suggests that all the flour samples may have
good keeping quality and will be stable during storage. The keeping quality of cereals flours is not
solely dependent on moisture content. However, it is also important to state that the lower the
moisture content of these flour, the more easily they will take up moisture from the surrounding air
if proper storage is not ensured.
The data pertaining to the ash content of the flour samples is presented in Table 4.1. The ash content
fell within the range of 0.6 % to 1 %. The lowest ash content was recorded for wheat flour while
the highest was for pared coconut flour. Cassava flour, corn flour and un-pared coconut flour were
all less than 1 %. The ash content of wheat flour was significant different (P< 0.05) from pared and
un-pared coconut flour. However, it is evident from Table 4.1 that there is an insignificant
difference in the ash content of both coconut flours. This implies that the process of paring of the
coconut did not influence this parameter. The results obtained in this study are quite different from
the findings of Etong et al. (2014) who reported that wheat and cassava flours contains 4.9 % and
2.1 % ash, respectively. Similarly, for the coconut flours samples, Daniela (2016) and Gunathilake
and Abeyrathne (2007) reported ash content of respectively 1.7 % and 6.0 % which are higher than
the results obtained in this study. However, Lai and Vo Thi, (2017) study showed that coconut flour
contains 1.2 % ash content which is similar to the range 0.9 % - 1 % that was presented in this
study. The differences in the ash content values for the coconut flour samples may be due to
different varieties and the retention of components after the extraction process of coconut milk
(Gunathilake and Abeyrathne, 2007). Therefore, based on this study, pared coconut flour was only
found to have a higher mineral content than wheat flour and maize flour. Ash content provides an
indication of the mineral content of any food sample. It is the residue left after complete combustion
of organic compounds (Usman et al., 2015). Minerals play a role for the maintenance of the overall
mental physical wellbeing and the development and maintenance bones, tissues teeth, and muscles
(Ohzua et al., 2016). However, the bioavailability of the minerals in the flour samples may be
impeded by the fibre matrix which was found to be higher in the coconut flour samples (Barbara,
1989).
31
The crude protein content of the flour samples varied from 1.4 % to 10.6 % where cassava and
wheat flour have the lowest and highest value, respectively. The protein content of all the flour
samples were significantly different from each other (P< 0.05). Similar results have been obtained
for wheat flour in the study conducted by David et al. (2015) who reported 10.2 % protein content.
However, Etong et al. (2014) reported a higher crude protein content for cassava flour (7.2 %) and
wheat flour (20.9 %). For the coconut flour samples, a similar finding was presented by Daniela
(2016). The latter reported that coconut flour contain 6.9 % crude protein which is consistent with
6.3 % protein content for pared coconut flour in this study. However, Lai and Vo Thi, (2017)
reported 5.8 % for coconut flour which was lower than the result for both pared and un-pared
coconut flour. The difference between the protein content of the pared and un-pared coconut flour
may have been influenced by the process of removing the outer brown coat of coconut kernel for
the pared sample. Furthermore, the difference may have resulted due to different geographical
locations of cultivation, as soil with higher nitrogen levels positively affects the protein content of
the crop grown (David et al., 2015). The protein content of coconut flours as obtained in this
research suggests that they have potential applicability in food formulation and they can be used in
the enrichment of other staple flours that are nutritionally poor. A higher protein intake to an extent
helps in the prevention and reverse of protein-energy malnutrition (Canan, 2016). Protein is a
source of amino acids and it plays an important role in determining the functionality of flours
(Usman et al., 2015). Protein’s influence on flour functionality may be due to the presence of
hydrophilic and hydrophobic parts and as such depending on the type of amino acid present;
whether polar or non-polar, it could determine the hydration properties of flour (Suresh et al.,
2015).
The fat content of the flour samples as presented in Table 4.1 were found to range from 0.5 % to
59.5 % with cassava flour and un-pared coconut flour having the lowest and the highest value,
respectively. For all the flour samples, the fat content are significantly different from each other
(P< 0.05). Wheat flour, cassava flour and corn flour showed that the staple flours have lower fat
content compared to any of the coconut flours including the pared coconut flour which contains
52.6 % fat. This is confirming that these staple flours are not oil-rich (Iwe et al., 2017). The fat
content for wheat flour in this present study was found to be lower than 1.3 % reported by Opong
et al. (2015). However, Etong et al. (2014) reported a much higher fat content for wheat flour (9.8
%) but a similar result for cassava flour (0.5 %). Daniela (2016) published a similar result of 63.9
32
% fat content for coconut flour while the findings of Lai and Vo Thi (2017) and Gunathilake and
Yalegama (2009) showed respectively 29.8 % and 9.2 % coconut flour fat content which differ
from the results in this study. Furthermore, Yalegama et al. (2013) reported 42.6 % fat content for
the residue which was obtained after coconut milk extraction. In this present study, the significant
difference between the fat content of the pared and un-pared coconut flour samples was due to the
removal of the external brown coating of the coconut kernel (Figure 3b) for the pared flour while
the brown coating of the kernel (Figure 3c) was left intact for the un-pared flour. However, the
high fat content in both coconut flour samples was mainly due to the fact that no further physical
or chemical treatment was done to reduce the fat content of the coconut residue. The varying results
of coconut flour fat content may be due to the different types of products obtained from coconut
kernels and the different processing methods that are applied (Lai and Vo Thi, 2017). Raghavendra
et al. (2004) reported that it is difficult to reduce the fat content of coconut residue to a very low
value through hot water and other physical treatments except with the application of solvent
extraction. Fat plays a role in enhancing the flavor and palatability of final food products.
According to the Codex Alimentarius commission, “dietary fibre is an edible, naturally occurring
in the food as consumed, non-digestible materials composed of carbohydrate polymer which is
neither digested nor absorbed in the small intestine”. The data for the crude fibre content of the
flour samples revealed wheat flour to have the lowest (2.8 %), while pared coconut flour have the
highest (16.7 %). This is followed by un-pared coconut flour (15.6 %), maize flour (7.7 %) and
cassava flour (4.8 %). The fibre contents of all the flours are significantly different from each other
(P< 0.05). The findings of Etong et al. (2014) showed that wheat flour and cassava flour have fibre
content of 3.4 % and 6.19 % respectively. These were slightly higher than the result obtained in
this study. Lai and Vo Thi (2017) reported coconut flour of 19.82 % fibre content which is higher
but similar to 16.7 % fibre content of pared coconut flour in this study. Daniela (2016) reported
13.2 % fibre content which is lower than the result for our pared and un-pared coconut flour. These
findings show that wheat flour, cassava flour and corn flour are not a good source of dietary fibre
compared to coconut flour. One possible implication of using higher fibre coconut flour in food
applications particularly in bakery products is that higher amount of water may be needed. Based
on these findings, there is potential for the incorporation of coconut flours in food formulations
where wheat flour is the main ingredient which will help raise their fibre content of the food
products and offer some important health benefits such as prevention of constipation and colon
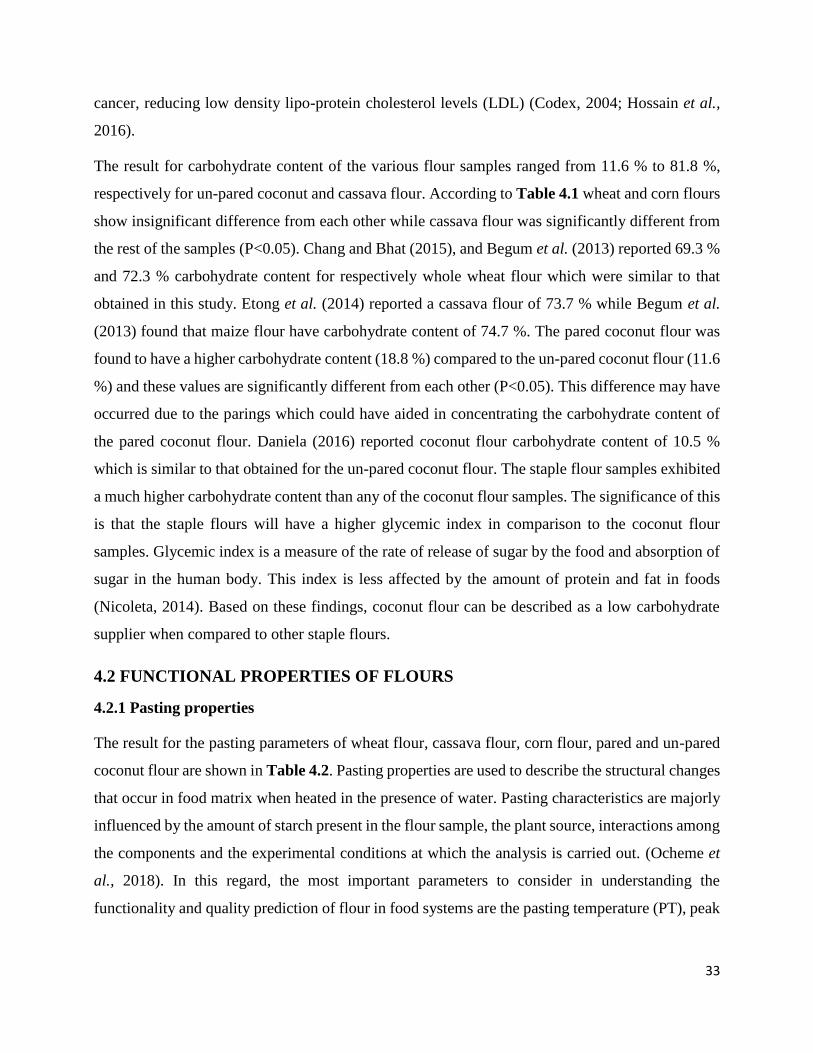
33
cancer, reducing low density lipo-protein cholesterol levels (LDL) (Codex, 2004; Hossain et al.,
2016).
The result for carbohydrate content of the various flour samples ranged from 11.6 % to 81.8 %,
respectively for un-pared coconut and cassava flour. According to Table 4.1 wheat and corn flours
show insignificant difference from each other while cassava flour was significantly different from
the rest of the samples (P<0.05). Chang and Bhat (2015), and Begum et al. (2013) reported 69.3 %
and 72.3 % carbohydrate content for respectively whole wheat flour which were similar to that
obtained in this study. Etong et al. (2014) reported a cassava flour of 73.7 % while Begum et al.
(2013) found that maize flour have carbohydrate content of 74.7 %. The pared coconut flour was
found to have a higher carbohydrate content (18.8 %) compared to the un-pared coconut flour (11.6
%) and these values are significantly different from each other (P<0.05). This difference may have
occurred due to the parings which could have aided in concentrating the carbohydrate content of
the pared coconut flour. Daniela (2016) reported coconut flour carbohydrate content of 10.5 %
which is similar to that obtained for the un-pared coconut flour. The staple flour samples exhibited
a much higher carbohydrate content than any of the coconut flour samples. The significance of this
is that the staple flours will have a higher glycemic index in comparison to the coconut flour
samples. Glycemic index is a measure of the rate of release of sugar by the food and absorption of
sugar in the human body. This index is less affected by the amount of protein and fat in foods
(Nicoleta, 2014). Based on these findings, coconut flour can be described as a low carbohydrate
supplier when compared to other staple flours.
4.2 FUNCTIONAL PROPERTIES OF FLOURS
4.2.1 Pasting properties
The result for the pasting parameters of wheat flour, cassava flour, corn flour, pared and un-pared
coconut flour are shown in Table 4.2. Pasting properties are used to describe the structural changes
that occur in food matrix when heated in the presence of water. Pasting characteristics are majorly
influenced by the amount of starch present in the flour sample, the plant source, interactions among
the components and the experimental conditions at which the analysis is carried out. (Ocheme et
al., 2018). In this regard, the most important parameters to consider in understanding the
functionality and quality prediction of flour in food systems are the pasting temperature (PT), peak
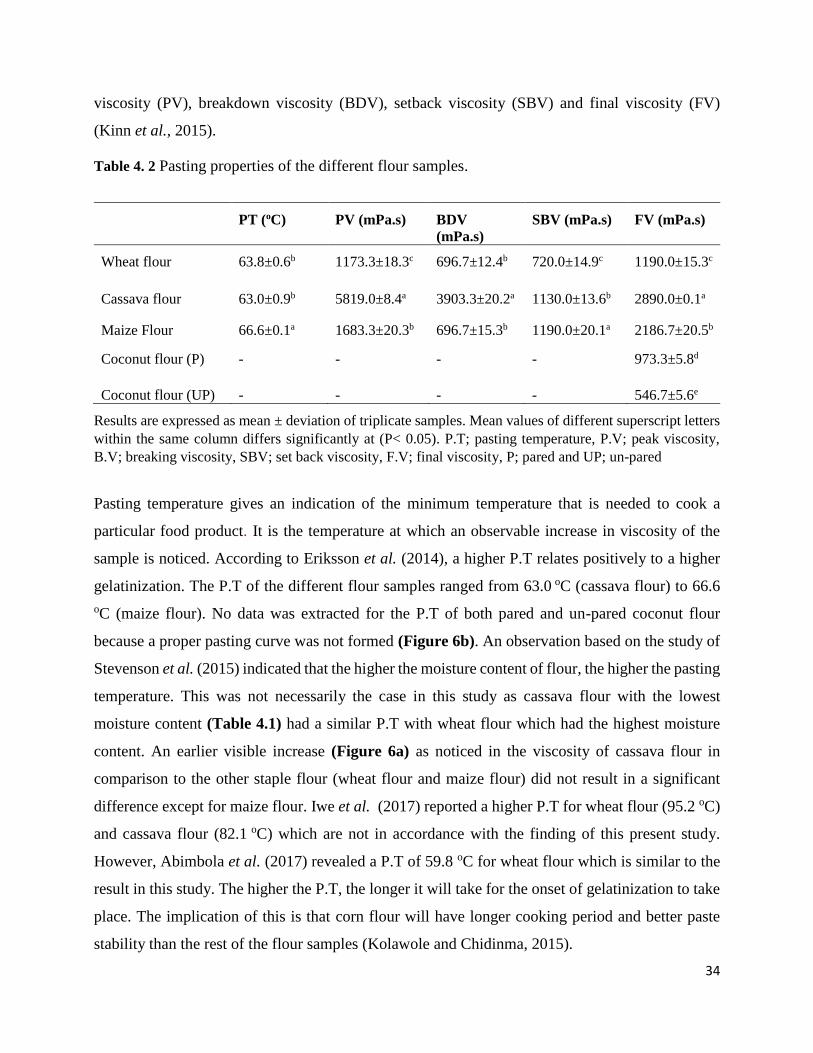
34
viscosity (PV), breakdown viscosity (BDV), setback viscosity (SBV) and final viscosity (FV)
(Kinn et al., 2015).
Table 4. 2 Pasting properties of the different flour samples.
PT (oC) PV (mPa.s) BDV
(mPa.s)
SBV (mPa.s) FV (mPa.s)
Wheat flour 63.8±0.6b 1173.3±18.3c 696.7±12.4b 720.0±14.9c 1190.0±15.3c
Cassava flour 63.0±0.9b 5819.0±8.4a 3903.3±20.2a 1130.0±13.6b 2890.0±0.1a
Maize Flour 66.6±0.1a 1683.3±20.3b 696.7±15.3b 1190.0±20.1a 2186.7±20.5b
Coconut flour (P) - - - - 973.3±5.8d
Coconut flour (UP) - - - - 546.7±5.6e
Results are expressed as mean ± deviation of triplicate samples. Mean values of different superscript letters
within the same column differs significantly at (P< 0.05). P.T; pasting temperature, P.V; peak viscosity,
B.V; breaking viscosity, SBV; set back viscosity, F.V; final viscosity, P; pared and UP; un-pared
Pasting temperature gives an indication of the minimum temperature that is needed to cook a
particular food product. It is the temperature at which an observable increase in viscosity of the
sample is noticed. According to Eriksson et al. (2014), a higher P.T relates positively to a higher
gelatinization. The P.T of the different flour samples ranged from 63.0 oC (cassava flour) to 66.6
oC (maize flour). No data was extracted for the P.T of both pared and un-pared coconut flour
because a proper pasting curve was not formed (Figure 6b). An observation based on the study of
Stevenson et al. (2015) indicated that the higher the moisture content of flour, the higher the pasting
temperature. This was not necessarily the case in this study as cassava flour with the lowest
moisture content (Table 4.1) had a similar P.T with wheat flour which had the highest moisture
content. An earlier visible increase (Figure 6a) as noticed in the viscosity of cassava flour in
comparison to the other staple flour (wheat flour and maize flour) did not result in a significant
difference except for maize flour. Iwe et al. (2017) reported a higher P.T for wheat flour (95.2 oC)
and cassava flour (82.1 oC) which are not in accordance with the finding of this present study.
However, Abimbola et al. (2017) revealed a P.T of 59.8 oC for wheat flour which is similar to the
result in this study. The higher the P.T, the longer it will take for the onset of gelatinization to take
place. The implication of this is that corn flour will have longer cooking period and better paste
stability than the rest of the flour samples (Kolawole and Chidinma, 2015).
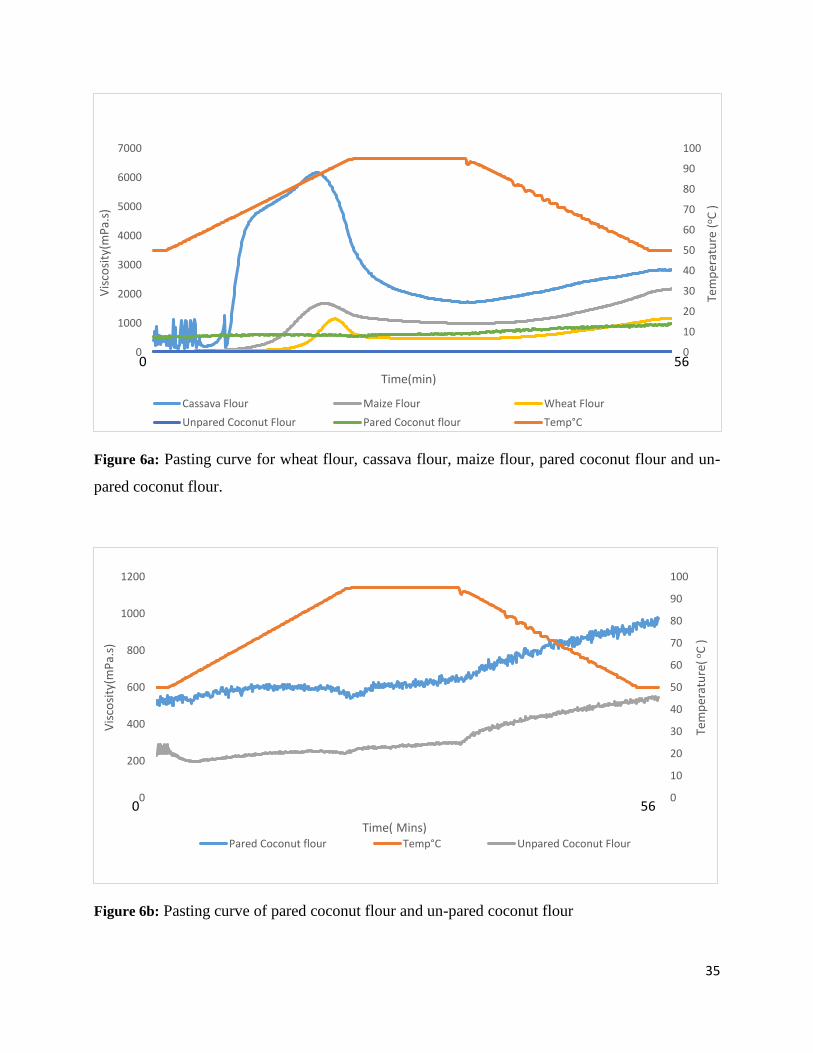
35
Figure 6a: Pasting curve for wheat flour, cassava flour, maize flour, pared coconut flour and un-
pared coconut flour.
Figure 6b: Pasting curve of pared coconut flour and un-pared coconut flour
0
10
20
30
40
50
60
70
80
90
100
0
1000
2000
3000
4000
5000
6000
7000
Tem
per
atu
re (
oC
)
Vis
cosi
ty(m
Pa.
s)
Time(min)
Cassava Flour Maize Flour Wheat Flour
Unpared Coconut Flour Pared Coconut flour Temp°C
0 56
0
10
20
30
40
50
60
70
80
90
100
0
200
400
600
800
1000
1200
Tem
per
atu
re(o
C )
Vis
cosi
ty(m
Pa.
s)
Time( Mins)Pared Coconut flour Temp°C Unpared Coconut Flour
0 56
36
The peak viscosity gives an indication of the strength of paste induced by the swelling of the starch
granules (Adebowale et al., 2011). It is the maximum viscosity that is developed during heating
(Ohizua et al., 2016). The PV of the flour samples varied from 1173.3 mPa.s to 5819.0 mPa.s where
wheat flour and cassava flour have the lowest and highest value, respectively. These values were
found to be significantly different from each other (P< 0.05). With respect to the coconut flour
samples, the ill-suited pasting curve led to inability to determine their PV. This resulted possibly
because of the low carbohydrate content of both pared and un-pared coconut flour. For the staple
flours, it can be observed that the PV (Figure 6a) for cassava and maize flour were attained at a
lower temperature than that of wheat flour. This may have occurred due to the swelling capacity of
the starch granules in the flours (Eriksson et al., 2014). The result obtained for wheat flour is in
accordance with 1100 mPa.s reported by Blessing (2014). He further declared that the PV reduces
significantly as the proportion of walnut flour (higher fat and lower carbohydrate) was incorporated
into the mix. This gives credence to the improper pasting curve for the coconut flours which were
characterized by high fat and low carbohydrate. Furthermore, it can be observed (Table 4.1) that
the higher the protein content of the staple flours, the lower the attainment of peak viscosity (Figure
6a). Ocheme et al. (2018) published a decreasing PV as more ground protein concentrate flour was
added in composite mix with wheat flour. This claim was further stressed by Chandrashekar and
Kirleis (1988) who reported sorghum with a higher protein content having a lower degree of starch
gelatinization in comparison to sorghum with lower protein. It is important to note that a high PV
can be associated with good textural property of paste and this also shows that such flour will be
applicable for food products that are requiring high gel strength. Moreover, it is indicative of the
water binding capacity of the flour’s starch mixes. This parameter can be used to correlate the final
product quality of foods made from flour (Osungbaro et al., 2010). Therefore, coconut flours used
in this study was poor in this regard.
Breakdown viscosity is an important parameter which indicates the stability of the paste. It explains
the ability of flour to withstand controlled heating and application of shear during food processing
(Ohizua et al., 2016). Therefore, the higher the breakdown viscosity, the lesser the ability of the
flour to withstand shear and heat during cooking, and vice versa. It explains the weakness of the
swollen granules against the high temperature that was being applied during the test period while
low breakdown viscosity indicates that the starch in product may possess crosslinking abilities
(Chinma et al., 2012). The breakdown viscosity of the flours fell within 696.7 mPa.s for maize
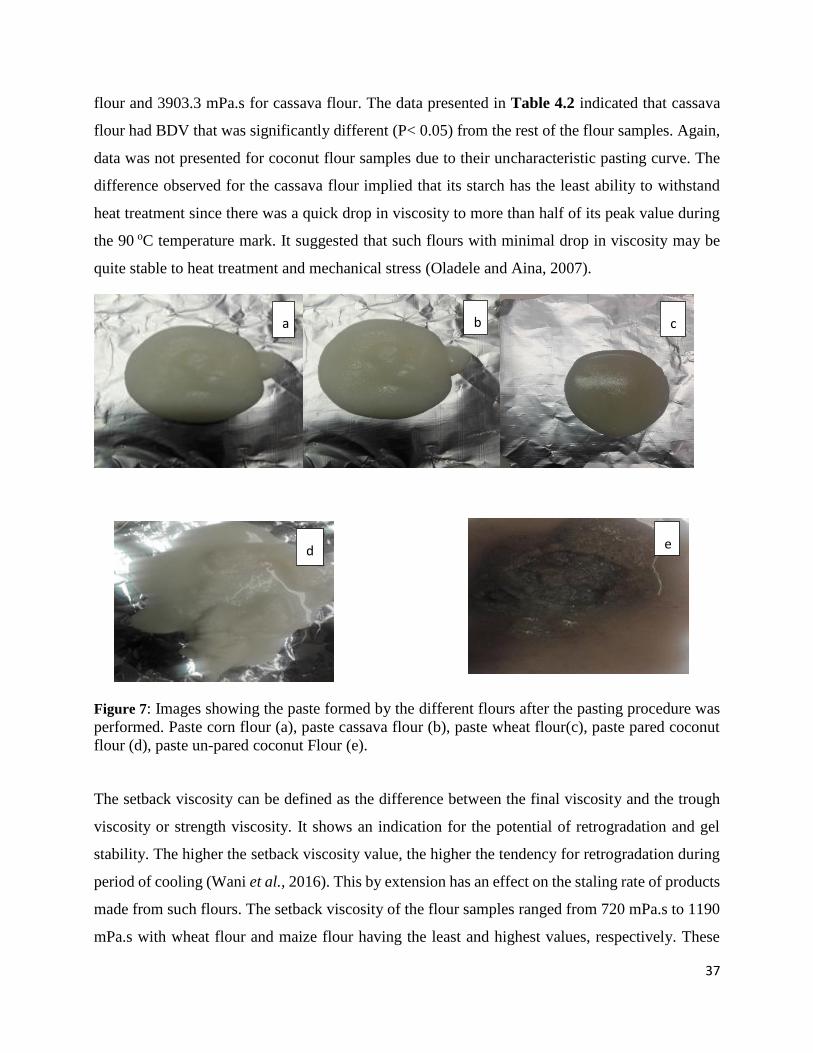
37
flour and 3903.3 mPa.s for cassava flour. The data presented in Table 4.2 indicated that cassava
flour had BDV that was significantly different (P< 0.05) from the rest of the flour samples. Again,
data was not presented for coconut flour samples due to their uncharacteristic pasting curve. The
difference observed for the cassava flour implied that its starch has the least ability to withstand
heat treatment since there was a quick drop in viscosity to more than half of its peak value during
the 90 oC temperature mark. It suggested that such flours with minimal drop in viscosity may be
quite stable to heat treatment and mechanical stress (Oladele and Aina, 2007).
Figure 7: Images showing the paste formed by the different flours after the pasting procedure was
performed. Paste corn flour (a), paste cassava flour (b), paste wheat flour(c), paste pared coconut
flour (d), paste un-pared coconut Flour (e).
The setback viscosity can be defined as the difference between the final viscosity and the trough
viscosity or strength viscosity. It shows an indication for the potential of retrogradation and gel
stability. The higher the setback viscosity value, the higher the tendency for retrogradation during
period of cooling (Wani et al., 2016). This by extension has an effect on the staling rate of products
made from such flours. The setback viscosity of the flour samples ranged from 720 mPa.s to 1190
mPa.s with wheat flour and maize flour having the least and highest values, respectively. These
a b c
d
f
e
38
values show significant difference (P< 0.05) from each other. The higher setback viscosity seen in
maize flour indicate that there will a greater re-association of starch polymer (Darfour et al., 2013).
This implies that maize flour will show greater retrogradation and by extension faster spoilage due
to staling when used in food application such as in bread making. For wheat and cassava flour, it
indicate that their paste will be relatively quite stable during cooking. The increasing trend noticed
in the pasting profile particularly for the staple flours during the cooling phase was due to the re-
association of the amylose molecules (Sanni et al., 2001). Amylose content is a critical criterion in
determining retrogradation characteristic of starch based product (Chinma et al., 2012). It is
important to state that fat may also play a part in determining the tendencies of retrogradation of
flours. In the presence of lipid, which is a major constituent of the coconut flour, there may be
retardation of starch gelatinization due to possible interaction of lipid and starch leading formation
of complex which could entrap amylose (Radhika et al., 2008).
Final viscosity is an important parameter that is used to determine the gel forming ability of flour
after a period of progressive cooking and cooling (Iwe et al., 2007). The final viscosity varied from
546.7 mPa.s to 2890.0 mPa.s where un-pared coconut flour and cassava flour have the least and
highest values, respectively. These values were significantly different from each other (P< 0.05).
According to Iwe et al. (2007), the high F.V value (Figure 6a) seen for cassava flour could be due
to its higher amylose content (Ohizua et al., 2016). He further stressed that some varieties of
cassava flour have a FV higher than their PV. However, this is contrary to the findings for cassava
flour in this present study where the final viscosity is less than peak viscosity. Again, coconut flour
samples have much lower final viscosity compared to the staple flours which further establishes
their poor pasting characteristics which may be attributed to their low carbohydrate content and
partly to high fat.
The pasting properties of the different flour samples as shown above clearly indicated that the
coconut flour samples (pared or un-pared) as defined in this study have poor and uncharacteristic
pasting profile when compared to the three staple flours. A closer look at the pasting profile (Figure
6b) showed that a proper pasting curve was not achieved, rather an increasing set of undulating
viscosity values was displayed. This was largely dependent on the compositional profile of the
coconut flour samples and that made it difficult to paste or form a gel (Figure 6(d) and (6e)), un-
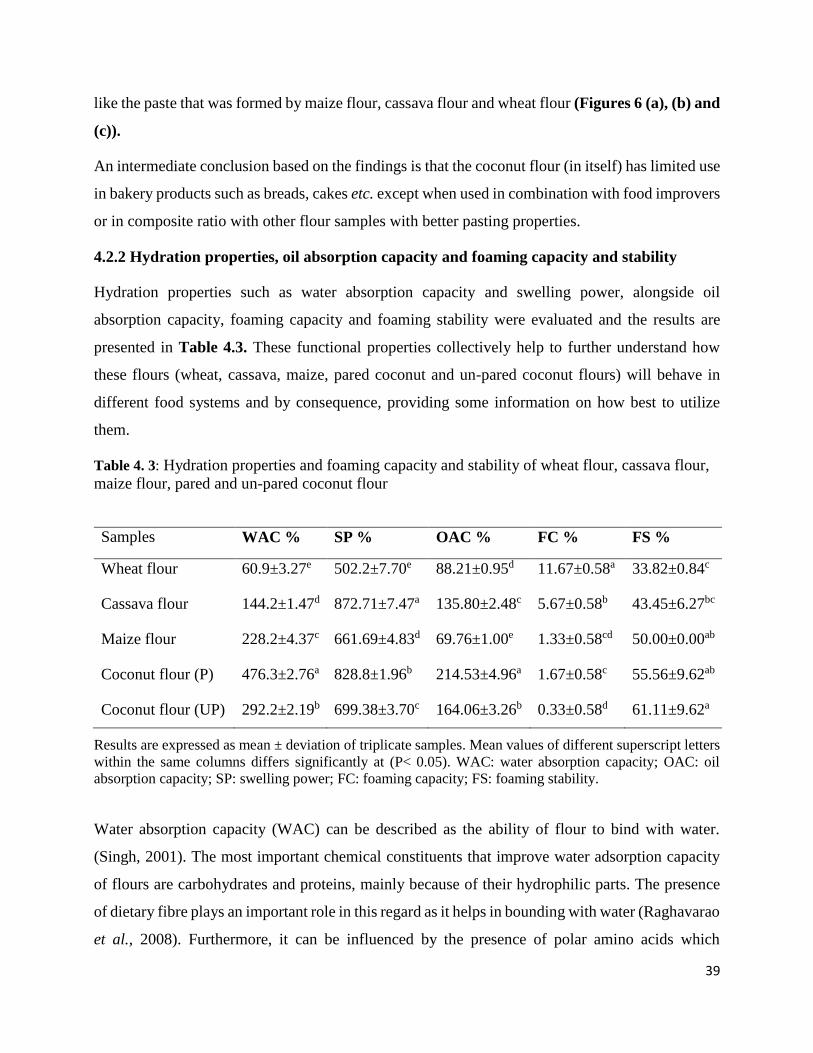
39
like the paste that was formed by maize flour, cassava flour and wheat flour (Figures 6 (a), (b) and
(c)).
An intermediate conclusion based on the findings is that the coconut flour (in itself) has limited use
in bakery products such as breads, cakes etc. except when used in combination with food improvers
or in composite ratio with other flour samples with better pasting properties.
4.2.2 Hydration properties, oil absorption capacity and foaming capacity and stability
Hydration properties such as water absorption capacity and swelling power, alongside oil
absorption capacity, foaming capacity and foaming stability were evaluated and the results are
presented in Table 4.3. These functional properties collectively help to further understand how
these flours (wheat, cassava, maize, pared coconut and un-pared coconut flours) will behave in
different food systems and by consequence, providing some information on how best to utilize
them.
Table 4. 3: Hydration properties and foaming capacity and stability of wheat flour, cassava flour,
maize flour, pared and un-pared coconut flour
Samples WAC % SP % OAC % FC % FS %
Wheat flour 60.9±3.27e 502.2±7.70e 88.21±0.95d 11.67±0.58a 33.82±0.84c
Cassava flour 144.2±1.47d 872.71±7.47a 135.80±2.48c 5.67±0.58b 43.45±6.27bc
Maize flour 228.2±4.37c 661.69±4.83d 69.76±1.00e 1.33±0.58cd 50.00±0.00ab
Coconut flour (P) 476.3±2.76a 828.8±1.96b 214.53±4.96a 1.67±0.58c 55.56±9.62ab
Coconut flour (UP) 292.2±2.19b 699.38±3.70c 164.06±3.26b 0.33±0.58d 61.11±9.62a
Results are expressed as mean ± deviation of triplicate samples. Mean values of different superscript letters
within the same columns differs significantly at (P< 0.05). WAC: water absorption capacity; OAC: oil
absorption capacity; SP: swelling power; FC: foaming capacity; FS: foaming stability.
Water absorption capacity (WAC) can be described as the ability of flour to bind with water.
(Singh, 2001). The most important chemical constituents that improve water adsorption capacity
of flours are carbohydrates and proteins, mainly because of their hydrophilic parts. The presence
of dietary fibre plays an important role in this regard as it helps in bounding with water (Raghavarao
et al., 2008). Furthermore, it can be influenced by the presence of polar amino acids which
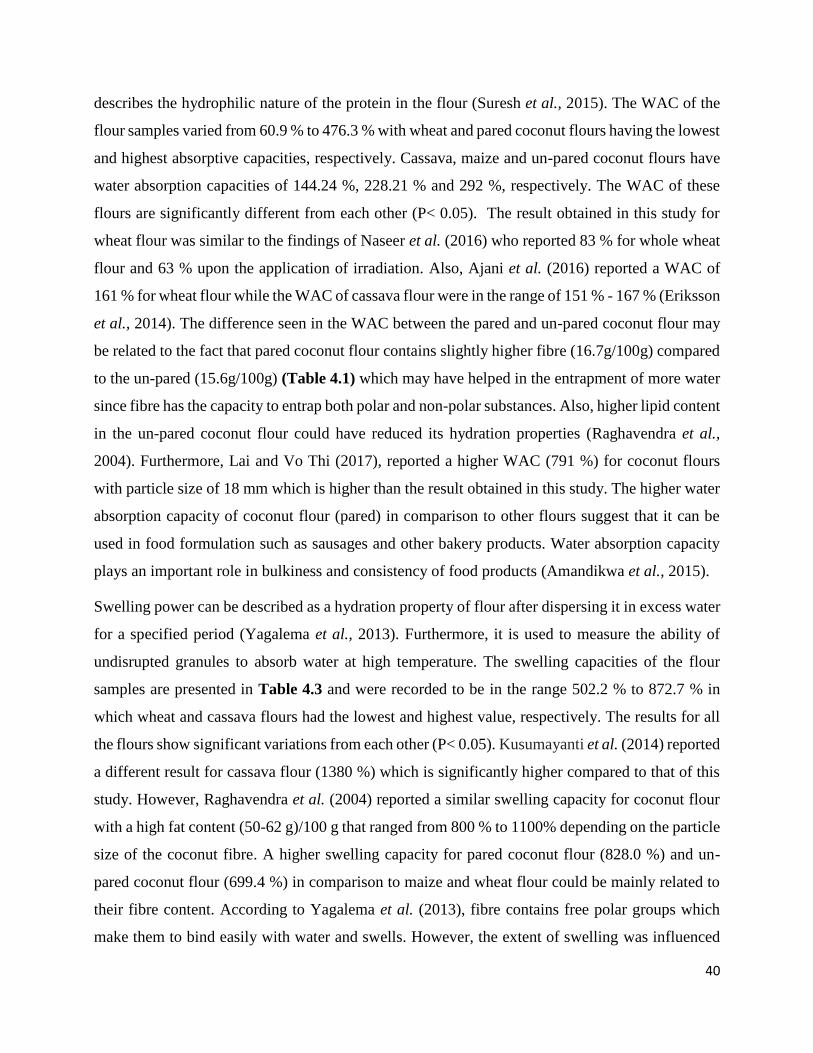
40
describes the hydrophilic nature of the protein in the flour (Suresh et al., 2015). The WAC of the
flour samples varied from 60.9 % to 476.3 % with wheat and pared coconut flours having the lowest
and highest absorptive capacities, respectively. Cassava, maize and un-pared coconut flours have
water absorption capacities of 144.24 %, 228.21 % and 292 %, respectively. The WAC of these
flours are significantly different from each other (P< 0.05). The result obtained in this study for
wheat flour was similar to the findings of Naseer et al. (2016) who reported 83 % for whole wheat
flour and 63 % upon the application of irradiation. Also, Ajani et al. (2016) reported a WAC of
161 % for wheat flour while the WAC of cassava flour were in the range of 151 % - 167 % (Eriksson
et al., 2014). The difference seen in the WAC between the pared and un-pared coconut flour may
be related to the fact that pared coconut flour contains slightly higher fibre (16.7g/100g) compared
to the un-pared (15.6g/100g) (Table 4.1) which may have helped in the entrapment of more water
since fibre has the capacity to entrap both polar and non-polar substances. Also, higher lipid content
in the un-pared coconut flour could have reduced its hydration properties (Raghavendra et al.,
2004). Furthermore, Lai and Vo Thi (2017), reported a higher WAC (791 %) for coconut flours
with particle size of 18 mm which is higher than the result obtained in this study. The higher water
absorption capacity of coconut flour (pared) in comparison to other flours suggest that it can be
used in food formulation such as sausages and other bakery products. Water absorption capacity
plays an important role in bulkiness and consistency of food products (Amandikwa et al., 2015).
Swelling power can be described as a hydration property of flour after dispersing it in excess water
for a specified period (Yagalema et al., 2013). Furthermore, it is used to measure the ability of
undisrupted granules to absorb water at high temperature. The swelling capacities of the flour
samples are presented in Table 4.3 and were recorded to be in the range 502.2 % to 872.7 % in
which wheat and cassava flours had the lowest and highest value, respectively. The results for all
the flours show significant variations from each other (P< 0.05). Kusumayanti et al. (2014) reported
a different result for cassava flour (1380 %) which is significantly higher compared to that of this
study. However, Raghavendra et al. (2004) reported a similar swelling capacity for coconut flour
with a high fat content (50-62 g)/100 g that ranged from 800 % to 1100% depending on the particle
size of the coconut fibre. A higher swelling capacity for pared coconut flour (828.0 %) and un-
pared coconut flour (699.4 %) in comparison to maize and wheat flour could be mainly related to
their fibre content. According to Yagalema et al. (2013), fibre contains free polar groups which
make them to bind easily with water and swells. However, the extent of swelling was influenced
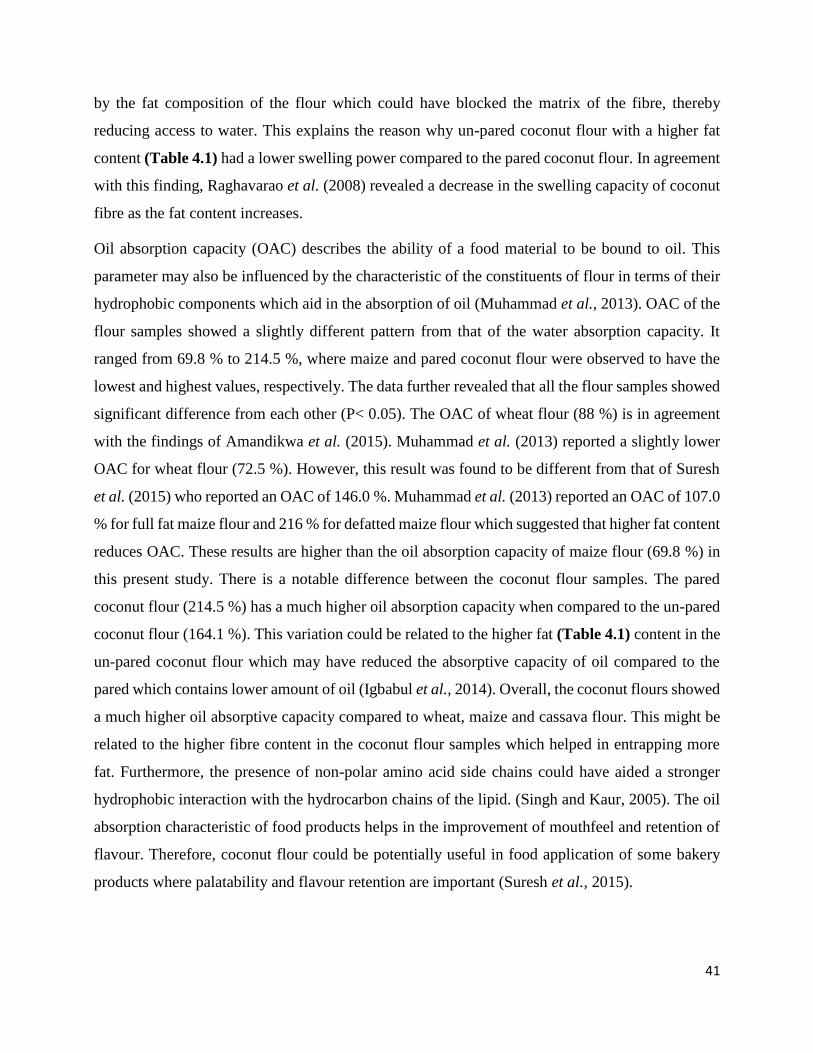
41
by the fat composition of the flour which could have blocked the matrix of the fibre, thereby
reducing access to water. This explains the reason why un-pared coconut flour with a higher fat
content (Table 4.1) had a lower swelling power compared to the pared coconut flour. In agreement
with this finding, Raghavarao et al. (2008) revealed a decrease in the swelling capacity of coconut
fibre as the fat content increases.
Oil absorption capacity (OAC) describes the ability of a food material to be bound to oil. This
parameter may also be influenced by the characteristic of the constituents of flour in terms of their
hydrophobic components which aid in the absorption of oil (Muhammad et al., 2013). OAC of the
flour samples showed a slightly different pattern from that of the water absorption capacity. It
ranged from 69.8 % to 214.5 %, where maize and pared coconut flour were observed to have the
lowest and highest values, respectively. The data further revealed that all the flour samples showed
significant difference from each other (P< 0.05). The OAC of wheat flour (88 %) is in agreement
with the findings of Amandikwa et al. (2015). Muhammad et al. (2013) reported a slightly lower
OAC for wheat flour (72.5 %). However, this result was found to be different from that of Suresh
et al. (2015) who reported an OAC of 146.0 %. Muhammad et al. (2013) reported an OAC of 107.0
% for full fat maize flour and 216 % for defatted maize flour which suggested that higher fat content
reduces OAC. These results are higher than the oil absorption capacity of maize flour (69.8 %) in
this present study. There is a notable difference between the coconut flour samples. The pared
coconut flour (214.5 %) has a much higher oil absorption capacity when compared to the un-pared
coconut flour (164.1 %). This variation could be related to the higher fat (Table 4.1) content in the
un-pared coconut flour which may have reduced the absorptive capacity of oil compared to the
pared which contains lower amount of oil (Igbabul et al., 2014). Overall, the coconut flours showed
a much higher oil absorptive capacity compared to wheat, maize and cassava flour. This might be
related to the higher fibre content in the coconut flour samples which helped in entrapping more
fat. Furthermore, the presence of non-polar amino acid side chains could have aided a stronger
hydrophobic interaction with the hydrocarbon chains of the lipid. (Singh and Kaur, 2005). The oil
absorption characteristic of food products helps in the improvement of mouthfeel and retention of
flavour. Therefore, coconut flour could be potentially useful in food application of some bakery
products where palatability and flavour retention are important (Suresh et al., 2015).
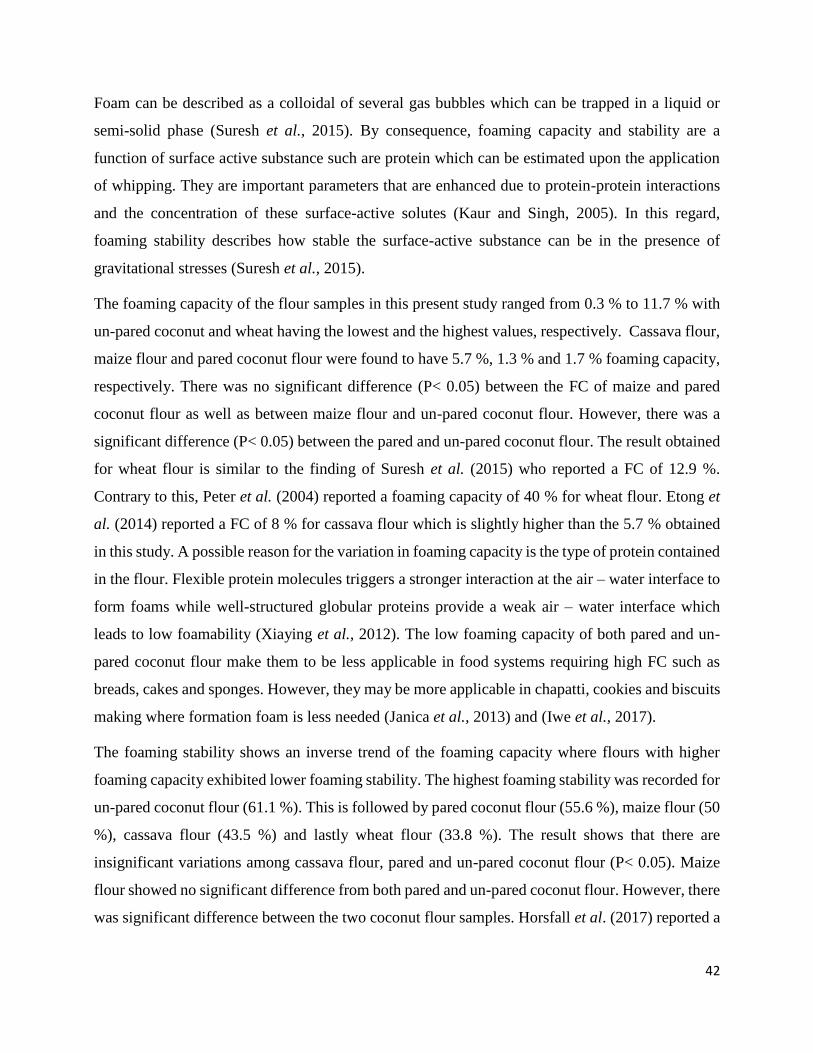
42
Foam can be described as a colloidal of several gas bubbles which can be trapped in a liquid or
semi-solid phase (Suresh et al., 2015). By consequence, foaming capacity and stability are a
function of surface active substance such are protein which can be estimated upon the application
of whipping. They are important parameters that are enhanced due to protein-protein interactions
and the concentration of these surface-active solutes (Kaur and Singh, 2005). In this regard,
foaming stability describes how stable the surface-active substance can be in the presence of
gravitational stresses (Suresh et al., 2015).
The foaming capacity of the flour samples in this present study ranged from 0.3 % to 11.7 % with
un-pared coconut and wheat having the lowest and the highest values, respectively. Cassava flour,
maize flour and pared coconut flour were found to have 5.7 %, 1.3 % and 1.7 % foaming capacity,
respectively. There was no significant difference (P< 0.05) between the FC of maize and pared
coconut flour as well as between maize flour and un-pared coconut flour. However, there was a
significant difference (P< 0.05) between the pared and un-pared coconut flour. The result obtained
for wheat flour is similar to the finding of Suresh et al. (2015) who reported a FC of 12.9 %.
Contrary to this, Peter et al. (2004) reported a foaming capacity of 40 % for wheat flour. Etong et
al. (2014) reported a FC of 8 % for cassava flour which is slightly higher than the 5.7 % obtained
in this study. A possible reason for the variation in foaming capacity is the type of protein contained
in the flour. Flexible protein molecules triggers a stronger interaction at the air – water interface to
form foams while well-structured globular proteins provide a weak air – water interface which
leads to low foamability (Xiaying et al., 2012). The low foaming capacity of both pared and un-
pared coconut flour make them to be less applicable in food systems requiring high FC such as
breads, cakes and sponges. However, they may be more applicable in chapatti, cookies and biscuits
making where formation foam is less needed (Janica et al., 2013) and (Iwe et al., 2017).
The foaming stability shows an inverse trend of the foaming capacity where flours with higher
foaming capacity exhibited lower foaming stability. The highest foaming stability was recorded for
un-pared coconut flour (61.1 %). This is followed by pared coconut flour (55.6 %), maize flour (50
%), cassava flour (43.5 %) and lastly wheat flour (33.8 %). The result shows that there are
insignificant variations among cassava flour, pared and un-pared coconut flour (P< 0.05). Maize
flour showed no significant difference from both pared and un-pared coconut flour. However, there
was significant difference between the two coconut flour samples. Horsfall et al. (2017) reported a
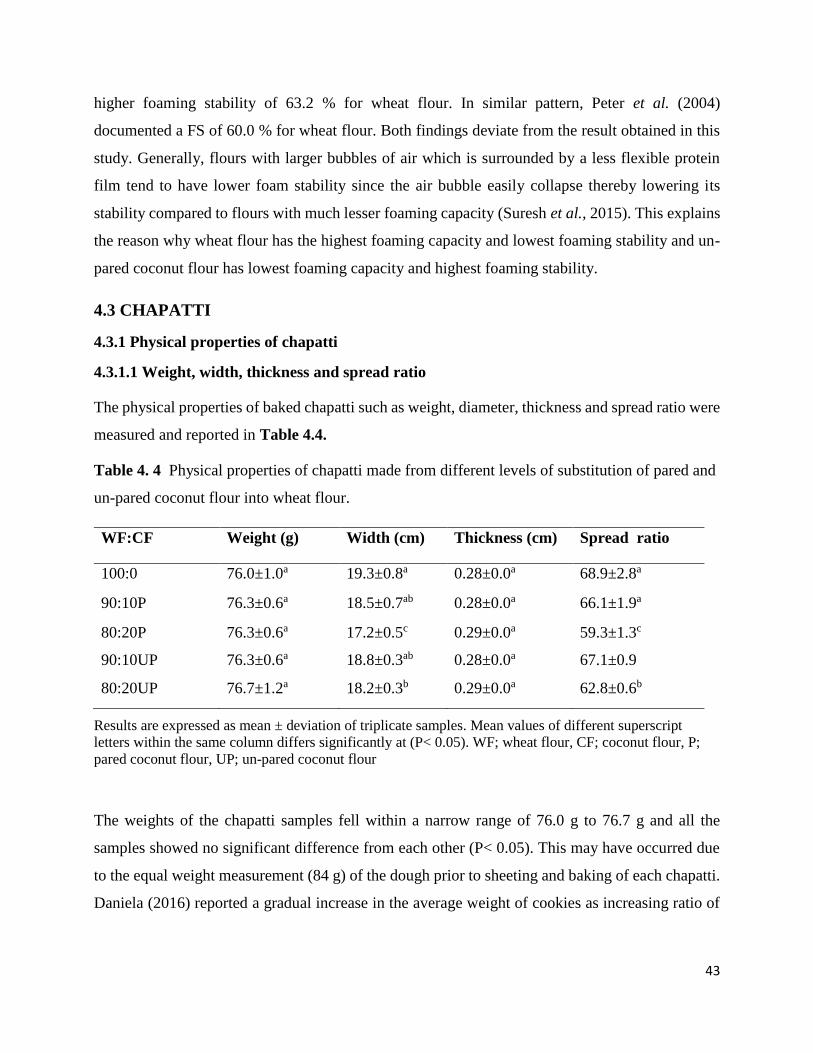
43
higher foaming stability of 63.2 % for wheat flour. In similar pattern, Peter et al. (2004)
documented a FS of 60.0 % for wheat flour. Both findings deviate from the result obtained in this
study. Generally, flours with larger bubbles of air which is surrounded by a less flexible protein
film tend to have lower foam stability since the air bubble easily collapse thereby lowering its
stability compared to flours with much lesser foaming capacity (Suresh et al., 2015). This explains
the reason why wheat flour has the highest foaming capacity and lowest foaming stability and un-
pared coconut flour has lowest foaming capacity and highest foaming stability.
4.3 CHAPATTI
4.3.1 Physical properties of chapatti
4.3.1.1 Weight, width, thickness and spread ratio
The physical properties of baked chapatti such as weight, diameter, thickness and spread ratio were
measured and reported in Table 4.4.
Table 4. 4 Physical properties of chapatti made from different levels of substitution of pared and
un-pared coconut flour into wheat flour.
Results are expressed as mean ± deviation of triplicate samples. Mean values of different superscript
letters within the same column differs significantly at (P< 0.05). WF; wheat flour, CF; coconut flour, P;
pared coconut flour, UP; un-pared coconut flour
The weights of the chapatti samples fell within a narrow range of 76.0 g to 76.7 g and all the
samples showed no significant difference from each other (P< 0.05). This may have occurred due
to the equal weight measurement (84 g) of the dough prior to sheeting and baking of each chapatti.
Daniela (2016) reported a gradual increase in the average weight of cookies as increasing ratio of
WF:CF Weight (g) Width (cm) Thickness (cm) Spread ratio
100:0 76.0±1.0a 19.3±0.8a 0.28±0.0a 68.9±2.8a
90:10P 76.3±0.6a 18.5±0.7ab 0.28±0.0a 66.1±1.9a
80:20P 76.3±0.6a 17.2±0.5c 0.29±0.0a 59.3±1.3c
90:10UP 76.3±0.6a 18.8±0.3ab 0.28±0.0a 67.1±0.9
80:20UP 76.7±1.2a 18.2±0.3b 0.29±0.0a 62.8±0.6b
44
coconut flour was added into the composite mix of whole rice-coconut flour cookies. Afroza et al.
(2014) revealed that there was no significant difference in the weight of chapatti upon the increase
in the addition of jack fruit seed and Bengal gram flours.
The width of the chapatti samples were measured to be in the range of 17.2 cm to 19.3 cm with
sample (80:20P) and the reference sample (100:0) having the lowest and highest values,
respectively. The data presented in Table 4.4 indicated that sample 80:20P was significantly
different (P< 0.05) from the rest of the samples while the reference chapatti showed insignificant
difference when compared to samples 90:10P and 90:10UP. The increase in the level of substitution
from 10 % to 20 % of the pared coconut flour resulted in a significant difference (P< 0.05) in the
width measurement of the chapatti. Likewise, upon the increase in the addition of un-pared coconut
flour from 10 % to 20 %, the width reduces. It is important to note that fat or oils which was higher
in the coconut flour enriched chapatti may have played a role in the lubrication of dough and by
extension resulted in the easy of dough sheeting which may have contributed to the values recorded
for width (Debi, 2004). In addition, the application of manual sheeting method during this
experiment may have slightly affected the results for the chapatti. Daniela (2016) reported a similar
finding which showed that an increase in the addition of coconut flour reduces the width of whole
rice-coconut composite flour cookies. The possible reason for this could be that the inclusion of
coconut flour which contained higher fibre compared to wheat flour, had disrupted the starch-gluten
network, resulting in a reduction in its extensibility during sheeting and by extension led to a
decrease in the width of the chapatti. This was also evident in the poor pasting profile of the coconut
flours in comparison to wheat flour which had a much better pasting characteristics than coconut
flour. Another explanation is that due to the higher water absorptive capacity of fibre, the added
coconut flours; with significantly higher fibre content compete for water which should have used
by the gluten protein and then causes a lesser strength of the gluten network (Yadav et al., 2012).
The thicknesses of the chapatti samples were recorded to have no significant difference (P< 0.05).
The chapatti samples had thickness that fell within a narrow range from 2.8 mm to 2.9 mm. The
implication here is that the inclusion of coconut flour (pared or un-pared) up to 20 % in the making
of chapatti does not affect the thickness of the chapatti in comparison to the reference sample. A
similar observation was reported by Raihan and Saina (2017). The study revealed that there was no
statistical difference in the thickness of the cookies upon the enrichment of the multi grain flour in
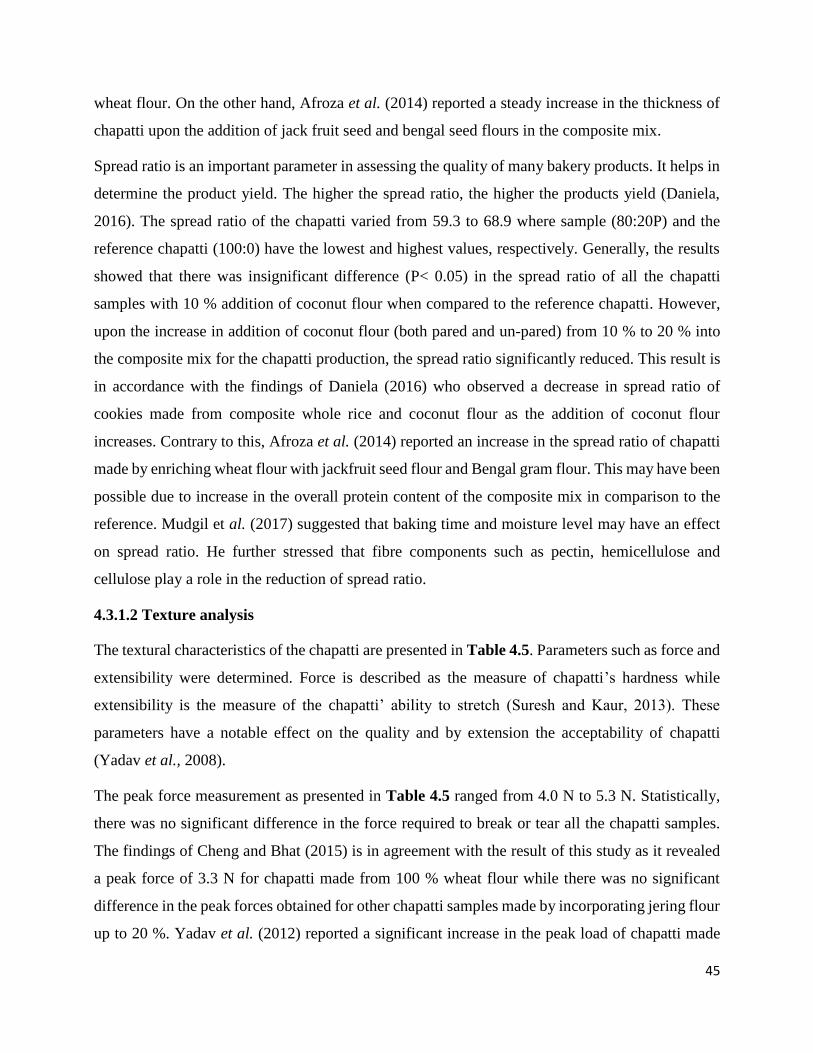
45
wheat flour. On the other hand, Afroza et al. (2014) reported a steady increase in the thickness of
chapatti upon the addition of jack fruit seed and bengal seed flours in the composite mix.
Spread ratio is an important parameter in assessing the quality of many bakery products. It helps in
determine the product yield. The higher the spread ratio, the higher the products yield (Daniela,
2016). The spread ratio of the chapatti varied from 59.3 to 68.9 where sample (80:20P) and the
reference chapatti (100:0) have the lowest and highest values, respectively. Generally, the results
showed that there was insignificant difference (P< 0.05) in the spread ratio of all the chapatti
samples with 10 % addition of coconut flour when compared to the reference chapatti. However,
upon the increase in addition of coconut flour (both pared and un-pared) from 10 % to 20 % into
the composite mix for the chapatti production, the spread ratio significantly reduced. This result is
in accordance with the findings of Daniela (2016) who observed a decrease in spread ratio of
cookies made from composite whole rice and coconut flour as the addition of coconut flour
increases. Contrary to this, Afroza et al. (2014) reported an increase in the spread ratio of chapatti
made by enriching wheat flour with jackfruit seed flour and Bengal gram flour. This may have been
possible due to increase in the overall protein content of the composite mix in comparison to the
reference. Mudgil et al. (2017) suggested that baking time and moisture level may have an effect
on spread ratio. He further stressed that fibre components such as pectin, hemicellulose and
cellulose play a role in the reduction of spread ratio.
4.3.1.2 Texture analysis
The textural characteristics of the chapatti are presented in Table 4.5. Parameters such as force and
extensibility were determined. Force is described as the measure of chapatti’s hardness while
extensibility is the measure of the chapatti’ ability to stretch (Suresh and Kaur, 2013). These
parameters have a notable effect on the quality and by extension the acceptability of chapatti
(Yadav et al., 2008).
The peak force measurement as presented in Table 4.5 ranged from 4.0 N to 5.3 N. Statistically,
there was no significant difference in the force required to break or tear all the chapatti samples.
The findings of Cheng and Bhat (2015) is in agreement with the result of this study as it revealed
a peak force of 3.3 N for chapatti made from 100 % wheat flour while there was no significant
difference in the peak forces obtained for other chapatti samples made by incorporating jering flour
up to 20 %. Yadav et al. (2012) reported a significant increase in the peak load of chapatti made
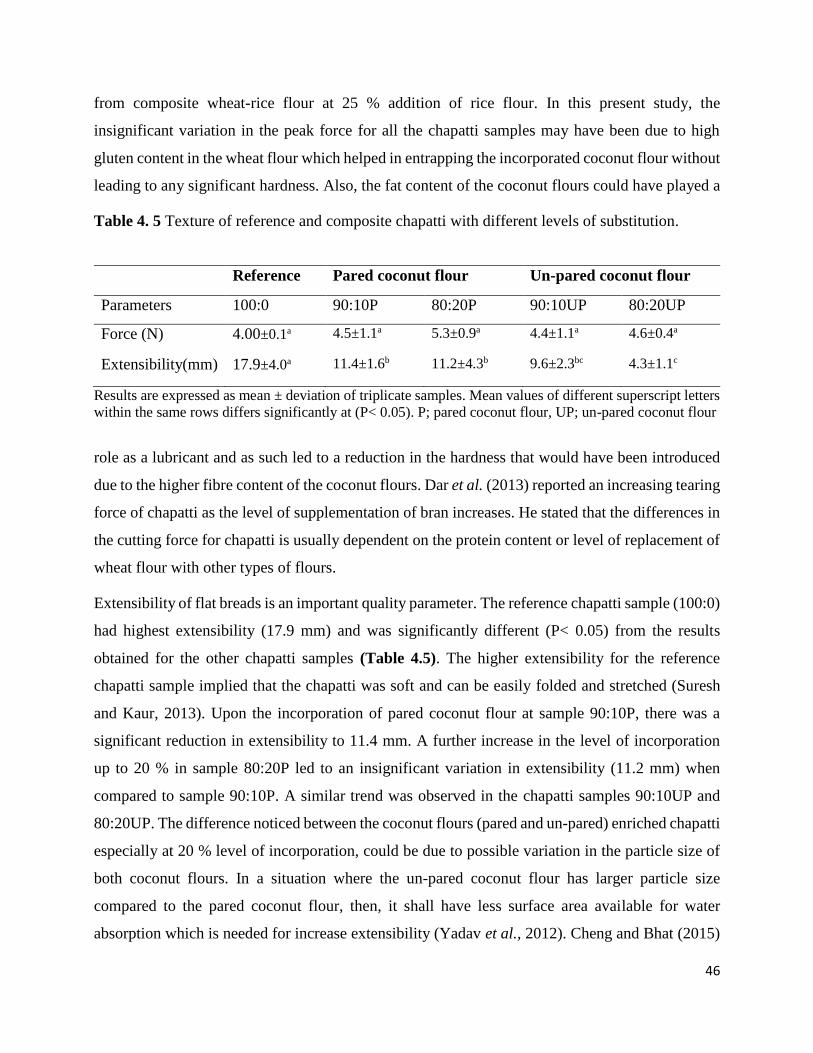
46
from composite wheat-rice flour at 25 % addition of rice flour. In this present study, the
insignificant variation in the peak force for all the chapatti samples may have been due to high
gluten content in the wheat flour which helped in entrapping the incorporated coconut flour without
leading to any significant hardness. Also, the fat content of the coconut flours could have played a
Table 4. 5 Texture of reference and composite chapatti with different levels of substitution.
Reference Pared coconut flour Un-pared coconut flour
Parameters 100:0 90:10P 80:20P 90:10UP 80:20UP
Force (N) 4.00±0.1a 4.5±1.1a 5.3±0.9a 4.4±1.1a 4.6±0.4a
Extensibility(mm) 17.9±4.0a 11.4±1.6b 11.2±4.3b 9.6±2.3bc 4.3±1.1c
Results are expressed as mean ± deviation of triplicate samples. Mean values of different superscript letters
within the same rows differs significantly at (P< 0.05). P; pared coconut flour, UP; un-pared coconut flour
role as a lubricant and as such led to a reduction in the hardness that would have been introduced
due to the higher fibre content of the coconut flours. Dar et al. (2013) reported an increasing tearing
force of chapatti as the level of supplementation of bran increases. He stated that the differences in
the cutting force for chapatti is usually dependent on the protein content or level of replacement of
wheat flour with other types of flours.
Extensibility of flat breads is an important quality parameter. The reference chapatti sample (100:0)
had highest extensibility (17.9 mm) and was significantly different (P< 0.05) from the results
obtained for the other chapatti samples (Table 4.5). The higher extensibility for the reference
chapatti sample implied that the chapatti was soft and can be easily folded and stretched (Suresh
and Kaur, 2013). Upon the incorporation of pared coconut flour at sample 90:10P, there was a
significant reduction in extensibility to 11.4 mm. A further increase in the level of incorporation
up to 20 % in sample 80:20P led to an insignificant variation in extensibility (11.2 mm) when
compared to sample 90:10P. A similar trend was observed in the chapatti samples 90:10UP and
80:20UP. The difference noticed between the coconut flours (pared and un-pared) enriched chapatti
especially at 20 % level of incorporation, could be due to possible variation in the particle size of
both coconut flours. In a situation where the un-pared coconut flour has larger particle size
compared to the pared coconut flour, then, it shall have less surface area available for water
absorption which is needed for increase extensibility (Yadav et al., 2012). Cheng and Bhat (2015)
47
reported a much lower extensibility of 4.6 mm for reference chapatti while there was significant
difference between the reference and 20 % addition of jering seed flour in the composite mix.
However, Yadav et al. (2012) reported an extensibility of 11.2 mm for the 100 % wheat chapatti.
He further revealed a significant decrease in the extensibility of chapatti made by incorporating 25
% of rice flour. This varying result may have been affected by the differences in the protein content
of the wheat flours used as gluten plays an important role in determining the elasticity of doughs
and by extension the textural profile of chapatti and other food product made from wheat flour.
4.3.2 Chemical composition of chapatti
The nutritional composition for the chapatti samples which were made by incorporating different
levels of pared and un-pared coconut flours into wheat flour are showed in Table 4.6.
The moisture content ranged from 17.4 % to 26.6 % with samples 80:20P and 100:0 chapatti having
the lowest and highest moisture content values, respectively. There was a significant difference
between the moisture content of the reference and the rest of the chapatti (P< 0.05). However, the
moisture content of the 90:10P and 90:10UP chapatti samples only slightly differ from the reference
sample while on the other hand, chapatti samples 80:20P and 80:20UP showed much larger
deviation from reference sample. One possible explanation for this variation could be the longer
time that was required to bake the 20 % coconut flour (pared and un-pared) incorporated chapatti
which may have led to more moisture loss compared to the other samples.
Table 4. 6 Chemical composition of chapatti with different levels of coconut flour substitution
WF:CF Moisture
(%)
Ash (%) Protein
(%)
Fat (%) Fibre
(%)
Carbohydrat
e (%)
Energy
(Kcal/100g)
100:0 26.6±0.0a 1.0±0.0d 7.5±0.0a 12.8±0.5e 2.8±0.1e 52.1±0.3a 341.3±2.0cd
90:10P 24.4±0.5b 1.0±0.0cd 7.5±0.2a 15.0±0.0d 4.2±0.0c 47.9±0.4b 353.7±3.7c
80:20P 17.4±0.0d 1.1±0.0c 7.2±0.1a 22.7±0.2b 6.2±0.0a 45.4±0.4c 407.9±2.9b
90:10UP 24.0±0.0b 1.1±0.0b 7.0±0.0a 16.3±0.1c 3.5±0.3d 48.1±1.0b 357.3±4.0c
80:20UP 18.1±0.1c 1.1±0.0a 7.5±0.2a 25.8±0.0a 5.1±0.1b 42.4±0.5d 421.0±3.5a
Results are expressed as mean ± deviation of triplicate samples. Mean values of different superscript letters
within the same column differs significantly at (P< 0.05). P; pared coconut flour, UP; un-pared coconut
flour
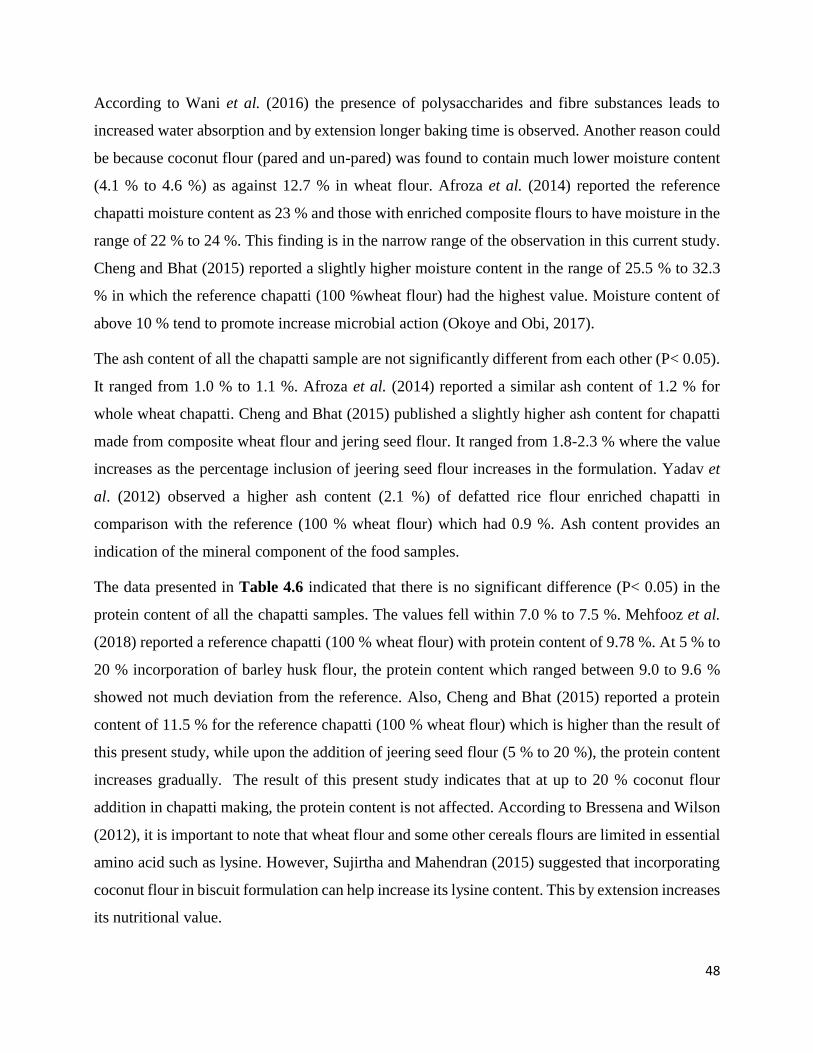
48
According to Wani et al. (2016) the presence of polysaccharides and fibre substances leads to
increased water absorption and by extension longer baking time is observed. Another reason could
be because coconut flour (pared and un-pared) was found to contain much lower moisture content
(4.1 % to 4.6 %) as against 12.7 % in wheat flour. Afroza et al. (2014) reported the reference
chapatti moisture content as 23 % and those with enriched composite flours to have moisture in the
range of 22 % to 24 %. This finding is in the narrow range of the observation in this current study.
Cheng and Bhat (2015) reported a slightly higher moisture content in the range of 25.5 % to 32.3
% in which the reference chapatti (100 %wheat flour) had the highest value. Moisture content of
above 10 % tend to promote increase microbial action (Okoye and Obi, 2017).
The ash content of all the chapatti sample are not significantly different from each other (P< 0.05).
It ranged from 1.0 % to 1.1 %. Afroza et al. (2014) reported a similar ash content of 1.2 % for
whole wheat chapatti. Cheng and Bhat (2015) published a slightly higher ash content for chapatti
made from composite wheat flour and jering seed flour. It ranged from 1.8-2.3 % where the value
increases as the percentage inclusion of jeering seed flour increases in the formulation. Yadav et
al. (2012) observed a higher ash content (2.1 %) of defatted rice flour enriched chapatti in
comparison with the reference (100 % wheat flour) which had 0.9 %. Ash content provides an
indication of the mineral component of the food samples.
The data presented in Table 4.6 indicated that there is no significant difference (P< 0.05) in the
protein content of all the chapatti samples. The values fell within 7.0 % to 7.5 %. Mehfooz et al.
(2018) reported a reference chapatti (100 % wheat flour) with protein content of 9.78 %. At 5 % to
20 % incorporation of barley husk flour, the protein content which ranged between 9.0 to 9.6 %
showed not much deviation from the reference. Also, Cheng and Bhat (2015) reported a protein
content of 11.5 % for the reference chapatti (100 % wheat flour) which is higher than the result of
this present study, while upon the addition of jeering seed flour (5 % to 20 %), the protein content
increases gradually. The result of this present study indicates that at up to 20 % coconut flour
addition in chapatti making, the protein content is not affected. According to Bressena and Wilson
(2012), it is important to note that wheat flour and some other cereals flours are limited in essential
amino acid such as lysine. However, Sujirtha and Mahendran (2015) suggested that incorporating
coconut flour in biscuit formulation can help increase its lysine content. This by extension increases
its nutritional value.
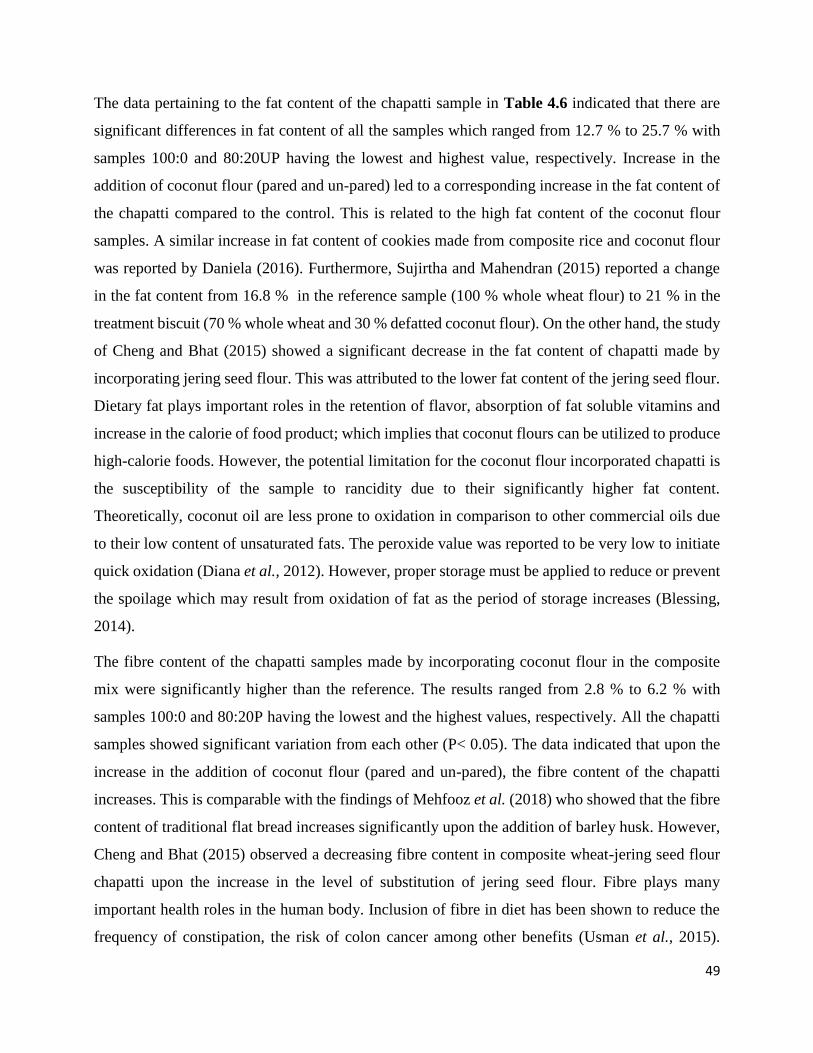
49
The data pertaining to the fat content of the chapatti sample in Table 4.6 indicated that there are
significant differences in fat content of all the samples which ranged from 12.7 % to 25.7 % with
samples 100:0 and 80:20UP having the lowest and highest value, respectively. Increase in the
addition of coconut flour (pared and un-pared) led to a corresponding increase in the fat content of
the chapatti compared to the control. This is related to the high fat content of the coconut flour
samples. A similar increase in fat content of cookies made from composite rice and coconut flour
was reported by Daniela (2016). Furthermore, Sujirtha and Mahendran (2015) reported a change
in the fat content from 16.8 % in the reference sample (100 % whole wheat flour) to 21 % in the
treatment biscuit (70 % whole wheat and 30 % defatted coconut flour). On the other hand, the study
of Cheng and Bhat (2015) showed a significant decrease in the fat content of chapatti made by
incorporating jering seed flour. This was attributed to the lower fat content of the jering seed flour.
Dietary fat plays important roles in the retention of flavor, absorption of fat soluble vitamins and
increase in the calorie of food product; which implies that coconut flours can be utilized to produce
high-calorie foods. However, the potential limitation for the coconut flour incorporated chapatti is
the susceptibility of the sample to rancidity due to their significantly higher fat content.
Theoretically, coconut oil are less prone to oxidation in comparison to other commercial oils due
to their low content of unsaturated fats. The peroxide value was reported to be very low to initiate
quick oxidation (Diana et al., 2012). However, proper storage must be applied to reduce or prevent
the spoilage which may result from oxidation of fat as the period of storage increases (Blessing,
2014).
The fibre content of the chapatti samples made by incorporating coconut flour in the composite
mix were significantly higher than the reference. The results ranged from 2.8 % to 6.2 % with
samples 100:0 and 80:20P having the lowest and the highest values, respectively. All the chapatti
samples showed significant variation from each other (P< 0.05). The data indicated that upon the
increase in the addition of coconut flour (pared and un-pared), the fibre content of the chapatti
increases. This is comparable with the findings of Mehfooz et al. (2018) who showed that the fibre
content of traditional flat bread increases significantly upon the addition of barley husk. However,
Cheng and Bhat (2015) observed a decreasing fibre content in composite wheat-jering seed flour
chapatti upon the increase in the level of substitution of jering seed flour. Fibre plays many
important health roles in the human body. Inclusion of fibre in diet has been shown to reduce the
frequency of constipation, the risk of colon cancer among other benefits (Usman et al., 2015).
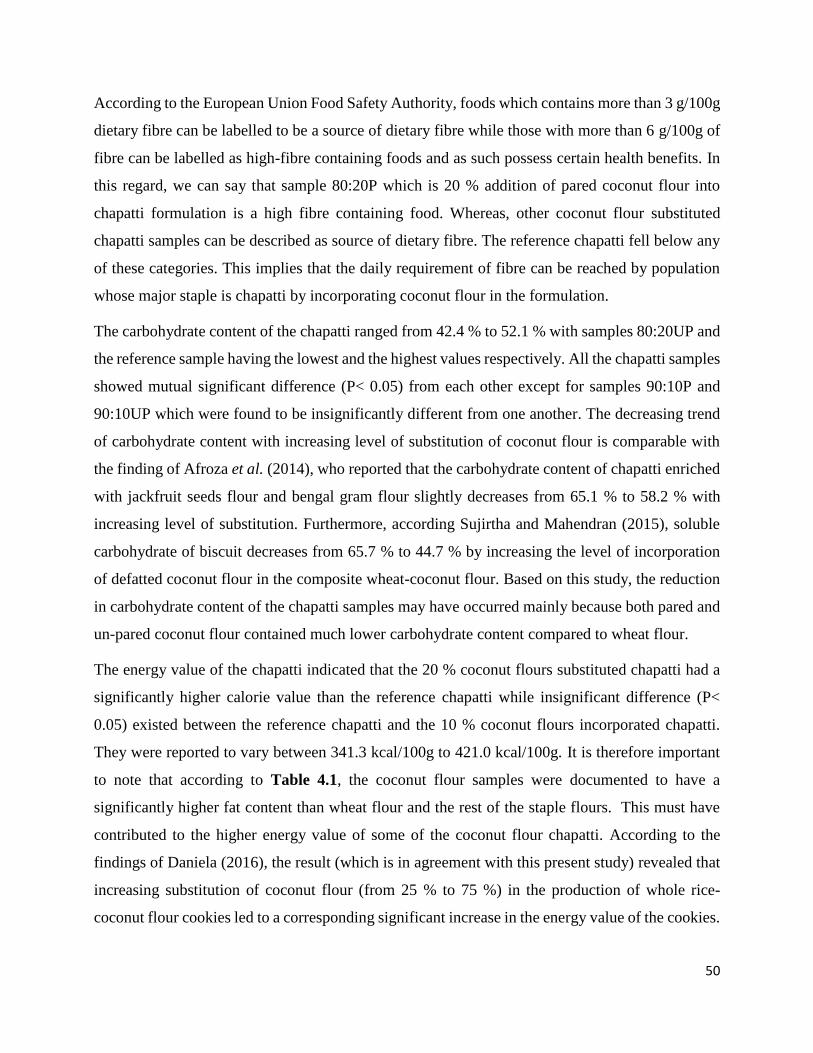
50
According to the European Union Food Safety Authority, foods which contains more than 3 g/100g
dietary fibre can be labelled to be a source of dietary fibre while those with more than 6 g/100g of
fibre can be labelled as high-fibre containing foods and as such possess certain health benefits. In
this regard, we can say that sample 80:20P which is 20 % addition of pared coconut flour into
chapatti formulation is a high fibre containing food. Whereas, other coconut flour substituted
chapatti samples can be described as source of dietary fibre. The reference chapatti fell below any
of these categories. This implies that the daily requirement of fibre can be reached by population
whose major staple is chapatti by incorporating coconut flour in the formulation.
The carbohydrate content of the chapatti ranged from 42.4 % to 52.1 % with samples 80:20UP and
the reference sample having the lowest and the highest values respectively. All the chapatti samples
showed mutual significant difference (P< 0.05) from each other except for samples 90:10P and
90:10UP which were found to be insignificantly different from one another. The decreasing trend
of carbohydrate content with increasing level of substitution of coconut flour is comparable with
the finding of Afroza et al. (2014), who reported that the carbohydrate content of chapatti enriched
with jackfruit seeds flour and bengal gram flour slightly decreases from 65.1 % to 58.2 % with
increasing level of substitution. Furthermore, according Sujirtha and Mahendran (2015), soluble
carbohydrate of biscuit decreases from 65.7 % to 44.7 % by increasing the level of incorporation
of defatted coconut flour in the composite wheat-coconut flour. Based on this study, the reduction
in carbohydrate content of the chapatti samples may have occurred mainly because both pared and
un-pared coconut flour contained much lower carbohydrate content compared to wheat flour.
The energy value of the chapatti indicated that the 20 % coconut flours substituted chapatti had a
significantly higher calorie value than the reference chapatti while insignificant difference (P<
0.05) existed between the reference chapatti and the 10 % coconut flours incorporated chapatti.
They were reported to vary between 341.3 kcal/100g to 421.0 kcal/100g. It is therefore important
to note that according to Table 4.1, the coconut flour samples were documented to have a
significantly higher fat content than wheat flour and the rest of the staple flours. This must have
contributed to the higher energy value of some of the coconut flour chapatti. According to the
findings of Daniela (2016), the result (which is in agreement with this present study) revealed that
increasing substitution of coconut flour (from 25 % to 75 %) in the production of whole rice-
coconut flour cookies led to a corresponding significant increase in the energy value of the cookies.
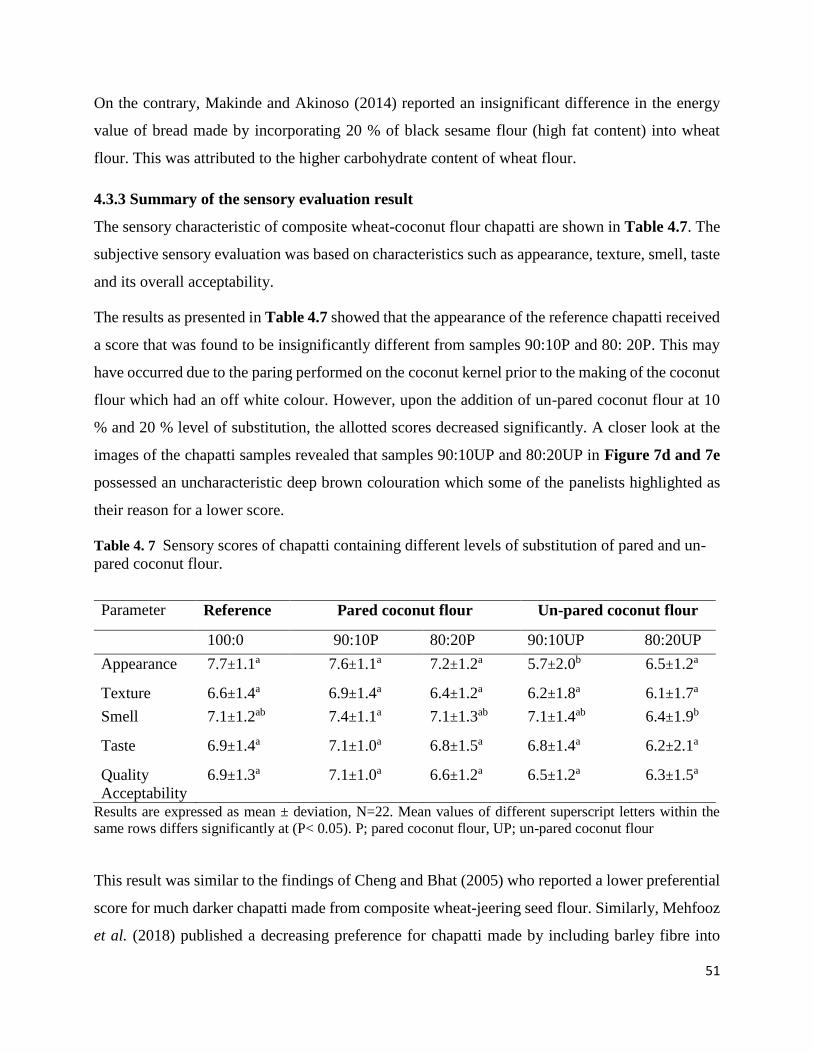
51
On the contrary, Makinde and Akinoso (2014) reported an insignificant difference in the energy
value of bread made by incorporating 20 % of black sesame flour (high fat content) into wheat
flour. This was attributed to the higher carbohydrate content of wheat flour.
4.3.3 Summary of the sensory evaluation result
The sensory characteristic of composite wheat-coconut flour chapatti are shown in Table 4.7. The
subjective sensory evaluation was based on characteristics such as appearance, texture, smell, taste
and its overall acceptability.
The results as presented in Table 4.7 showed that the appearance of the reference chapatti received
a score that was found to be insignificantly different from samples 90:10P and 80: 20P. This may
have occurred due to the paring performed on the coconut kernel prior to the making of the coconut
flour which had an off white colour. However, upon the addition of un-pared coconut flour at 10
% and 20 % level of substitution, the allotted scores decreased significantly. A closer look at the
images of the chapatti samples revealed that samples 90:10UP and 80:20UP in Figure 7d and 7e
possessed an uncharacteristic deep brown colouration which some of the panelists highlighted as
their reason for a lower score.
Table 4. 7 Sensory scores of chapatti containing different levels of substitution of pared and un-
pared coconut flour.
Parameter Reference Pared coconut flour Un-pared coconut flour
100:0 90:10P 80:20P 90:10UP 80:20UP
Appearance 7.7±1.1a 7.6±1.1a 7.2±1.2a 5.7±2.0b 6.5±1.2a
Texture 6.6±1.4a 6.9±1.4a 6.4±1.2a 6.2±1.8a 6.1±1.7a
Smell 7.1±1.2ab 7.4±1.1a 7.1±1.3ab 7.1±1.4ab 6.4±1.9b
Taste 6.9±1.4a 7.1±1.0a 6.8±1.5a 6.8±1.4a 6.2±2.1a
Quality
Acceptability
6.9±1.3a 7.1±1.0a 6.6±1.2a 6.5±1.2a 6.3±1.5a
Results are expressed as mean ± deviation, N=22. Mean values of different superscript letters within the
same rows differs significantly at (P< 0.05). P; pared coconut flour, UP; un-pared coconut flour
This result was similar to the findings of Cheng and Bhat (2005) who reported a lower preferential
score for much darker chapatti made from composite wheat-jeering seed flour. Similarly, Mehfooz
et al. (2018) published a decreasing preference for chapatti made by including barley fibre into
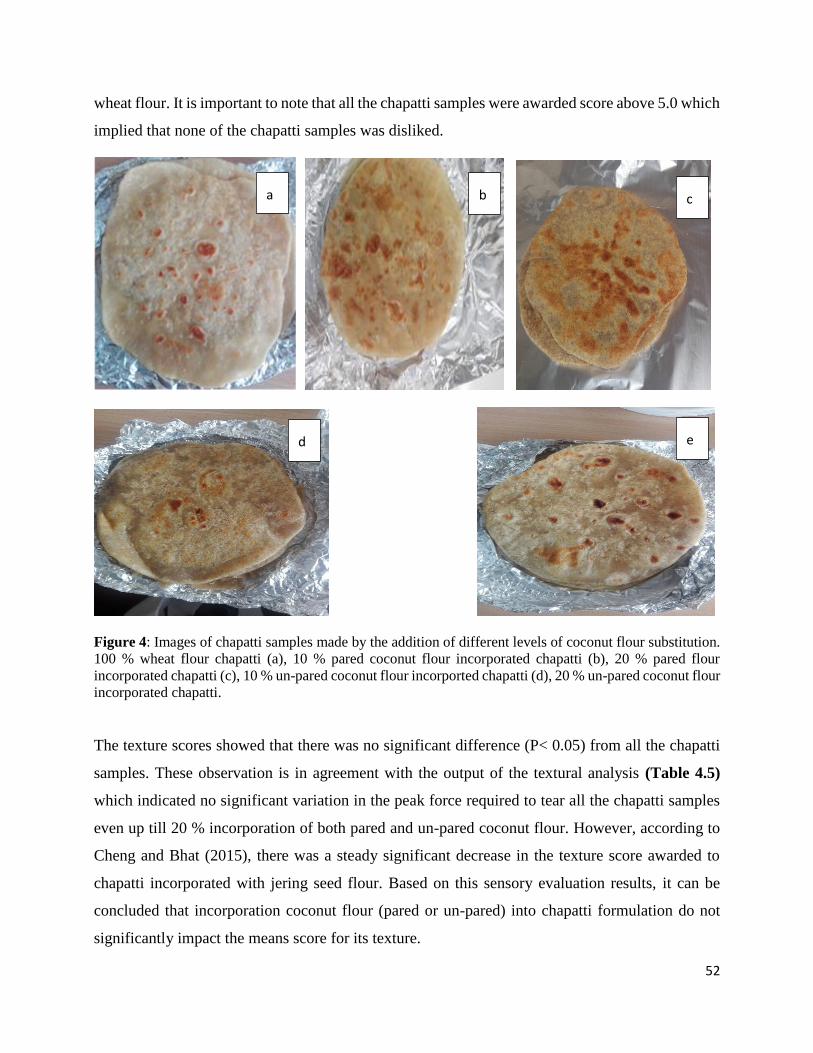
52
wheat flour. It is important to note that all the chapatti samples were awarded score above 5.0 which
implied that none of the chapatti samples was disliked.
Figure 4: Images of chapatti samples made by the addition of different levels of coconut flour substitution.
100 % wheat flour chapatti (a), 10 % pared coconut flour incorporated chapatti (b), 20 % pared flour
incorporated chapatti (c), 10 % un-pared coconut flour incorported chapatti (d), 20 % un-pared coconut flour
incorporated chapatti.
The texture scores showed that there was no significant difference (P< 0.05) from all the chapatti
samples. These observation is in agreement with the output of the textural analysis (Table 4.5)
which indicated no significant variation in the peak force required to tear all the chapatti samples
even up till 20 % incorporation of both pared and un-pared coconut flour. However, according to
Cheng and Bhat (2015), there was a steady significant decrease in the texture score awarded to
chapatti incorporated with jering seed flour. Based on this sensory evaluation results, it can be
concluded that incorporation coconut flour (pared or un-pared) into chapatti formulation do not
significantly impact the means score for its texture.
a b c
d e
53
In a similar trend, chapatti samples 80:20UP and 90:10P had a smell score of 6.4 and 7.4
representing the least and highest score respectively. These two samples show significant
difference from each other (P< 0.05). All other samples were insignificant different from each
other. The insignificant variation in the awarded smell score for the coconut incorporated chapatti
may be due to the preference for the coconut flavour by the panelists. Yagalema and Chavan (2004)
reported a sharp decrease in smell score when the level of substitution of coconut fibre increased
to 20 % in wheat flour-coconut fibre cookies. Overall, the smell score for all the chapatti samples
fall within the range of “slightly liked” and “moderately liked” and they were all found to be
comparable with the reference chapatti.
The taste scores for the chapatti showed no statistical difference from each other (P< 0.05). The
peculiar coconut taste which some of the panelists preferred might have been responsible for this
insignificant difference in taste in comparison to the reference. Furthermore, it is important to note
that the coconut flours incorporated chapatti (pared and un-pared) had higher fat content (Table
4.1) and therefore might have helped in the retention of flavour and improvement in mouth feel.
On the contrary, the findings of Cheng and Bhat (2015) published a significant decrease in taste
score as jering seed flour is substituted in the chapatti formulation. Surjirtha and Mahendran (2015)
reported a decreasing taste score for biscuit upon the increase in the addition of coconut flour due
to its dominating taste when used in larger amounts. In this present study it implied that coconut
flours addition up to 20 % do not negatively influence the taste of chapatti.
The overall acceptability score gives an indication of the panelists’ product preferences by
combining all the product sensorial characteristics and allotting a score that best describe it. Based
on the findings documented in Table 4.7, the overall acceptability ranged from 6.3 to 7.1. It is of
note that there is an insignificant variation between the samples. Contrary to this, Ameh et al.
(2013) reported a significant decrease in the overall acceptability of wheat flour bread as the level
of substitution of rice flour increased. However, Obaroakpo et al. (2017) published an increase in
the overall acceptability score for biscuits made by incorporation soybean and coconut flour into
wheat flour.
The outcome of the sensory evaluation provided an indication that there is a potential for the
incorporation of coconut flour (pared or un-pared) up to 20 % in food formulations. In this case
where all the panelists were familiar with the sensorial quality attributes of the reference sample,
54
chapatti made from 10 % to 20 % incorporation of pared and un-pared coconut flour had a
comparable overall acceptability score like the reference sample. This result agrees with findings
of Butt et al. (2004) who reported that 10 % incorporation of bran for chapatti have comparable
sensory attributes as that of the reference chapatti.
4.4 Nutritional relevance of this research study
The world has always made great strides to reduce or eliminate the problems of malnutrition and
hunger particularly in many developing countries like Nigeria, India and Kenya. Solving these
problems will not only require improvement in agricultural production techniques but also there
should be conscious effort deployed towards the valorization of agricultural by-products which can
contribute to increased food availability and by extension household food security. The processing
of coconut residue (by-product of coconut oil industry) in the production of coconut flour with
possible food applications may be one of the practicable approaches that could help in this regard.
Wheat flour and some other staple flours such as cassava and corn flour are used in the production
of different food products such as breads, cakes and porridges etc. However, these flours are known
to be inadequate in their fibre content. In an ideal situation, the meals made from theses staple
flours should be consumed along with portions of fruits and vegetables in other to supply dietary
fibre, but this rarely happens especially in rural and poorer households. A composite of some of
these staple flours with coconut flour will help to improve the fibre intake of the members of these
households and by extension reduce the occurrence of diseases or conditions such as constipation
and colon cancer that are associated with low consumption of dietary fibre which is fast rising in
today’s world such as in Sub-Sahara Africa.
It is becoming much more important to emphasize on the quality of fat consumed rather than
focusing on only the amount. It is recommended that a healthy diet should not contain more than
30 % of fat which should be free from trans-fatty acids (Trinidad et al., 2014). Foods with more
proportions of polyunsaturated fatty acids are preferred. Coconut flour majorly contains saturated
fats which is predominantly lauric acids. Saturated fats have received a negative health connotation
(Sack and Katan, 2002; Spady et al., 1993). However, some studies have suggested that lauric acids
possess remarkable nutritional and health benefits in comparison to other saturated fatty acids
(Enig, 1999; Shamina, 2007). This medium chain fatty acid has been reported to be quickly
absorbed and transported to the mitochondria where they are utilized as energy rather than be stored
55
as fat. This lauric acid further helps in the formation of monolaurin; a monoester which was
reported to have antibacterial and antiviral activities (Leiberman et al., 2006). Yet, its overall health
benefit potentials in these domain remain debatable.
The coconut enriched chapatti as reported in the study was found to have higher energy value
(kcal/100g) than the reference (100 % wheat flour) which is primarily due to its fat content. In the
case of nutritional intervention, where increase in energy intake may be needed, this type of novel
food may be used to raise the population’s calorie intake without necessarily reducing the nutrient
content. However, this may contribute to some health concerns when high calorie containing
chapatti are consumed by individuals who are already overweight or obese.
56
CHAPTER 5
CONCLUSION
This study was conducted to understand the nutritional, functional and potential applicability of
coconut flour in food systems. Having shown that coconut flour is high in fat, fibre and some
amount of protein, the experiment also revealed that in terms of functional properties; the pasting
characteristics was poor in comparison to the staple flours. This clearly showed that coconut flour
possesses limited ability to function as the main ingredient in bakery food formulation. Contrary to
the poor pasting properties, coconut flour indicated better prospect ahead of some of the staple
flours in terms of hydration characteristics such as water absorption and swelling power. This
strengthens its potential ability to be used in composite proportion with other flours.
An attempt to develop chapatti from composite wheat - coconut flour was made. The coconut flour
(pared or un-pared) incorporated chapatti samples up to 20 % had comparable characteristics in
terms of physical and sensorial evaluation in relation to the reference chapatti which was made
from 100 % wheat flour. However, the textural attribute (extensibility) and appearance of the un-
pared coconut flour enriched chapatti samples fell short from the reference chapatti. Additionally,
the nutritional composition of coconut flour enriched chapatti indicated higher fibre and fat content
when compared to the reference.
The utilization of coconut flour in the making of unleavened breads such as chapatti would enhance
and contribute to its proper valorization potentials in countries where coconuts are being cultivated
and processed, and consumption of chapatti is popular. This can also provide commercial
opportunities for coconut farmers as well as small scale food processing industries. This in the long
run may help in reducing the pressure of importing wheat flour.
57
CHAPTER 6
THE FUTURE PROSPECT FOR COCONUT FLOUR UTILIZATION.
Based on this study, it can be clearly seen that coconut flour has poor pasting properties which
makes them rarely useful in some food applications that requires formation of gel or paste and as
such, in itself cannot be used to make porridges, bakery products and a few other staple meals.
However, the flour still contains important nutrients such as protein, fibre and fat. This nutritional
composition of coconut flour enables them to have potential in composite ratio with other flours
particularly for those staple flours that are nutritionally poor. However, its valorization options
have not been fully maximized.
A number of experimental studies which entail the application of coconut flour in the baking and
pastry industries have been carried out (Hosain, 2016; Igbadul et al., 2011; Gunathilake and
Yalegama, 2009). They all show that coconut flour can be used to increase the nutritional value of
food products such as breads, cakes and cookies. However, to the best of my knowledge, there are
no studies which have been carried out to see the possibility of incorporating coconut flour into
composite mix as a complementary food.
The problems of undernutrition among children within the ages of 6-24 months are mainly because
of inadequate nutrients and energy intake which then exacerbate the prevalence of stunting and
wasting especially in many developing countries. The consequences of poor diets among children
in poorer households become much more severe at the point where children are introduced to
complementary foods (Kulwa et al., 2015). It is a common practice within such households to give
children maize, millet, sorghum and cassava based porridges which have being diluted with water
into thin consistencies and thereby leading to inadequate supply of energy. The energy densities of
these porridges fed to these children have been reported to be low and within the range (0.25-0.50
kcal/g) which do not meet the basic requirement. (Stephenson et al., 1994). According to World
Health Organization (2001), the minimum energy density should be 80 kcal/100 g. In a bit to
increase the energy value of these porridges, edibles oil are being encouraged to be added in the
meals. However, this comes at an extra cost for the households.
Tanzania, Kenya and Nigeria top the list of coconut producing countries in Africa (Uwubanmwen
et al., 2011). Based on my experience in Nigeria, the current area of focus in the utilization of
58
coconut kernel is coconut milk and oil production through which coconut residue is obtained as a
bye product. In-view of this, it may be interesting to investigate the functionality and consumer
acceptability of porridges made by combining a nutritional poor staple flour with coconut flour.
For example, in the context of maize porridges which require addition of edible oil to raise its
energy value, a composite mix of maize-coconut flour porridge will eliminate the need for oil
addition in these coconut producing countries since the coconut flour is high in fats. This will
proffer a better solution to energy inadequacy while enhancing the dietary fibre intake on the other
hand.
59
REFERENCES
AACC (2000). Approved Method of Analysis, American Association of Cereals Chemists.
Saint.Paul, MN, USA.
Abimbola K. A., Adegbola O. D., Gbonjubola V. A., Temilade V. A. (2017). Physico-chemical,
functional and pasting properties of composite flour made from wheat, plantain and
bambara for biscuit production annals. Food science and technology; 18(4).
Adebowale A.A., Sanni, L.O. and Awonorin, S.O. (2005). Effect of Texture Modifiers on the
Physicochemical and Sensory Properties of Dried Fufu. Food Science and Technology
International; 11: 373-382. http://dx.doi.org/10.1177/1082013205058531.
Adeleke R.O. and Odedeji J.O. (2010). Functional Properties of Wheat and Sweet Potato Flour
Blend. Pakistan Journal of Nutrition; 9(6): 535-538.
Afroza S., Ramin T. R., Moniru I., Moshiur R., and Abdul A. (2014). Evaluation of Quality of
Chapattis Enriched with Jackfruit Seed Flour and Bengal Gram Flour. Journal of
Environmental Science, Toxicology and food Technology; 8(5): 73-78.
Agero A. L and Verallo-Rowell V. M. (2004). A randomized double-blind controlled trial
comparing extra virgin coconut oil with mineral oil as a moisturizer for mild to moderate
xerosis. Dermatitis: Contact, Atopic, Occupational, Drug; 15: 109-116.
Ajani A. O., Fasoyiro, S. B., Arowora, K. A., Ajani, O. O., Popoola, C. A., & Zaka, K. O. (2016).
Functional Properties of Composite Flour Made from Wheat and Breadfruit. Applied
Tropical Agriculture; 21: 89-93.
Alvarenga N. B., Lidon F. C., Belga E., Motrena, P., Guerreiro, S., Carvalho, M. J. and Canada J.
(2011). Characterization Of Gluten-Free Bread Prepared From Maize, Rice And Tapioca
Flours Using Hydrocolloid Seaweed Agar-Agar. Recent Research in Science and
Technology; 3(8): 64-68.
Amandikwa C., Iwe M. O., Uzomah A., Olawuni A. I. (2015). Physico-Chemical Properties of
Wheat –Yam Composite Bread. Nigerian Food Journal; 33:12-17.
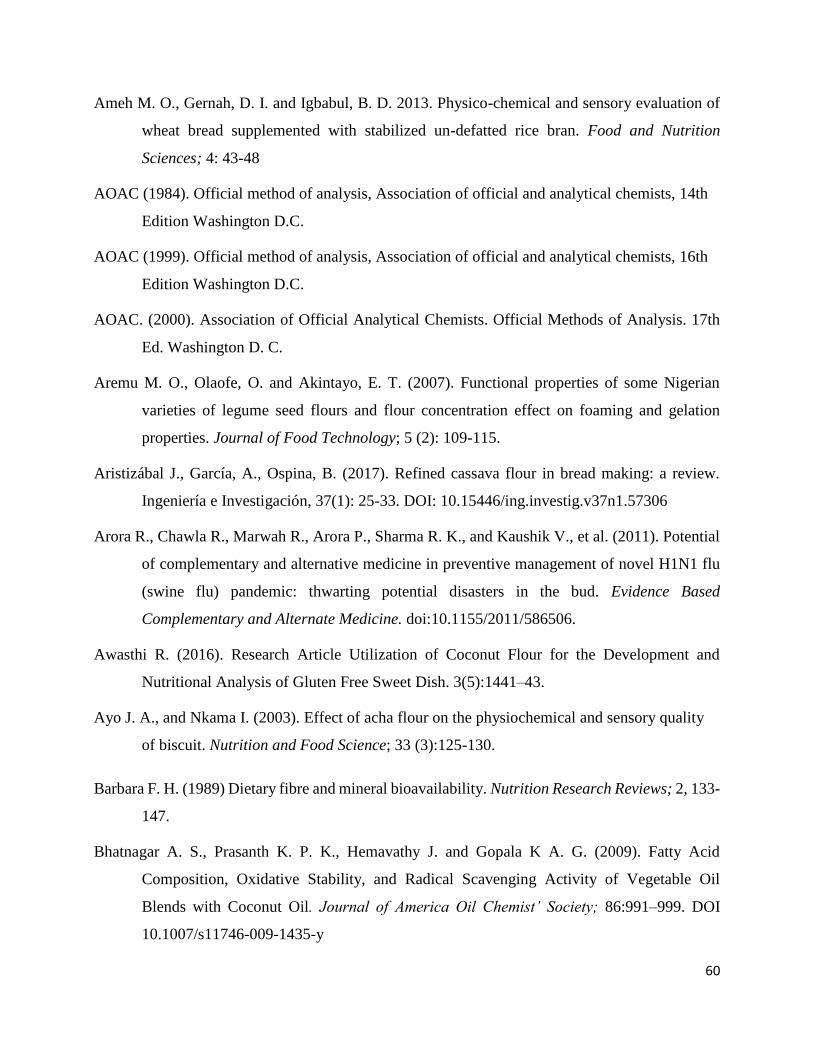
60
Ameh M. O., Gernah, D. I. and Igbabul, B. D. 2013. Physico-chemical and sensory evaluation of
wheat bread supplemented with stabilized un-defatted rice bran. Food and Nutrition
Sciences; 4: 43-48
AOAC (1984). Official method of analysis, Association of official and analytical chemists, 14th
Edition Washington D.C.
AOAC (1999). Official method of analysis, Association of official and analytical chemists, 16th
Edition Washington D.C.
AOAC. (2000). Association of Official Analytical Chemists. Official Methods of Analysis. 17th
Ed. Washington D. C.
Aremu M. O., Olaofe, O. and Akintayo, E. T. (2007). Functional properties of some Nigerian
varieties of legume seed flours and flour concentration effect on foaming and gelation
properties. Journal of Food Technology; 5 (2): 109-115.
Aristizábal J., García, A., Ospina, B. (2017). Refined cassava flour in bread making: a review.
Ingeniería e Investigación, 37(1): 25-33. DOI: 10.15446/ing.investig.v37n1.57306
Arora R., Chawla R., Marwah R., Arora P., Sharma R. K., and Kaushik V., et al. (2011). Potential
of complementary and alternative medicine in preventive management of novel H1N1 flu
(swine flu) pandemic: thwarting potential disasters in the bud. Evidence Based
Complementary and Alternate Medicine. doi:10.1155/2011/586506.
Awasthi R. (2016). Research Article Utilization of Coconut Flour for the Development and
Nutritional Analysis of Gluten Free Sweet Dish. 3(5):1441–43.
Ayo J. A., and Nkama I. (2003). Effect of acha flour on the physiochemical and sensory quality
of biscuit. Nutrition and Food Science; 33 (3):125-130.
Barbara F. H. (1989) Dietary fibre and mineral bioavailability. Nutrition Research Reviews; 2, 133-
147.
Bhatnagar A. S., Prasanth K. P. K., Hemavathy J. and Gopala K A. G. (2009). Fatty Acid
Composition, Oxidative Stability, and Radical Scavenging Activity of Vegetable Oil
Blends with Coconut Oil. Journal of America Oil Chemist’ Society; 86:991–999. DOI
10.1007/s11746-009-1435-y
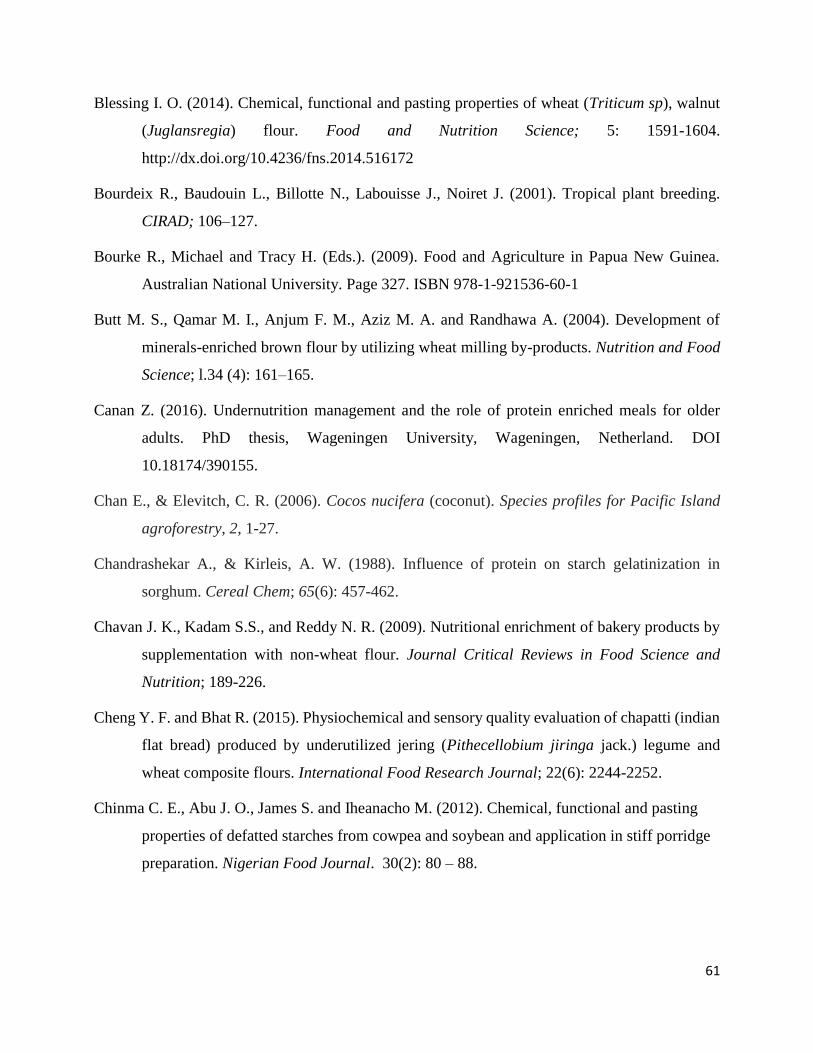
61
Blessing I. O. (2014). Chemical, functional and pasting properties of wheat (Triticum sp), walnut
(Juglansregia) flour. Food and Nutrition Science; 5: 1591-1604.
http://dx.doi.org/10.4236/fns.2014.516172
Bourdeix R., Baudouin L., Billotte N., Labouisse J., Noiret J. (2001). Tropical plant breeding.
CIRAD; 106–127.
Bourke R., Michael and Tracy H. (Eds.). (2009). Food and Agriculture in Papua New Guinea.
Australian National University. Page 327. ISBN 978-1-921536-60-1
Butt M. S., Qamar M. I., Anjum F. M., Aziz M. A. and Randhawa A. (2004). Development of
minerals-enriched brown flour by utilizing wheat milling by-products. Nutrition and Food
Science; l.34 (4): 161–165.
Canan Z. (2016). Undernutrition management and the role of protein enriched meals for older
adults. PhD thesis, Wageningen University, Wageningen, Netherland. DOI
10.18174/390155.
Chan E., & Elevitch, C. R. (2006). Cocos nucifera (coconut). Species profiles for Pacific Island
agroforestry, 2, 1-27.
Chandrashekar A., & Kirleis, A. W. (1988). Influence of protein on starch gelatinization in
sorghum. Cereal Chem; 65(6): 457-462.
Chavan J. K., Kadam S.S., and Reddy N. R. (2009). Nutritional enrichment of bakery products by
supplementation with non-wheat flour. Journal Critical Reviews in Food Science and
Nutrition; 189-226.
Cheng Y. F. and Bhat R. (2015). Physiochemical and sensory quality evaluation of chapatti (indian
flat bread) produced by underutilized jering (Pithecellobium jiringa jack.) legume and
wheat composite flours. International Food Research Journal; 22(6): 2244-2252.
Chinma C. E., Abu J. O., James S. and Iheanacho M. (2012). Chemical, functional and pasting
properties of defatted starches from cowpea and soybean and application in stiff porridge
preparation. Nigerian Food Journal. 30(2): 80 – 88.
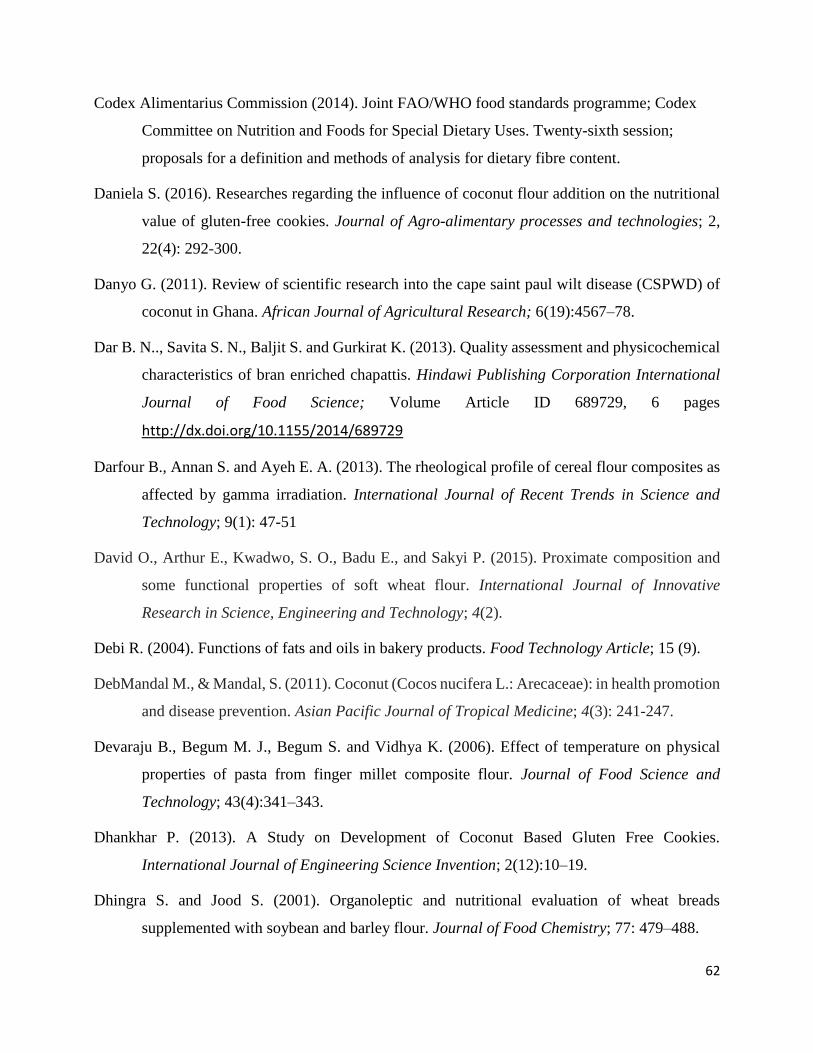
62
Codex Alimentarius Commission (2014). Joint FAO/WHO food standards programme; Codex
Committee on Nutrition and Foods for Special Dietary Uses. Twenty-sixth session;
proposals for a definition and methods of analysis for dietary fibre content.
Daniela S. (2016). Researches regarding the influence of coconut flour addition on the nutritional
value of gluten-free cookies. Journal of Agro-alimentary processes and technologies; 2,
22(4): 292-300.
Danyo G. (2011). Review of scientific research into the cape saint paul wilt disease (CSPWD) of
coconut in Ghana. African Journal of Agricultural Research; 6(19):4567–78.
Dar B. N.., Savita S. N., Baljit S. and Gurkirat K. (2013). Quality assessment and physicochemical
characteristics of bran enriched chapattis. Hindawi Publishing Corporation International
Journal of Food Science; Volume Article ID 689729, 6 pages
http://dx.doi.org/10.1155/2014/689729
Darfour B., Annan S. and Ayeh E. A. (2013). The rheological profile of cereal flour composites as
affected by gamma irradiation. International Journal of Recent Trends in Science and
Technology; 9(1): 47-51
David O., Arthur E., Kwadwo, S. O., Badu E., and Sakyi P. (2015). Proximate composition and
some functional properties of soft wheat flour. International Journal of Innovative
Research in Science, Engineering and Technology; 4(2).
Debi R. (2004). Functions of fats and oils in bakery products. Food Technology Article; 15 (9).
DebMandal M., & Mandal, S. (2011). Coconut (Cocos nucifera L.: Arecaceae): in health promotion
and disease prevention. Asian Pacific Journal of Tropical Medicine; 4(3): 241-247.
Devaraju B., Begum M. J., Begum S. and Vidhya K. (2006). Effect of temperature on physical
properties of pasta from finger millet composite flour. Journal of Food Science and
Technology; 43(4):341–343.
Dhankhar P. (2013). A Study on Development of Coconut Based Gluten Free Cookies.
International Journal of Engineering Science Invention; 2(12):10–19.
Dhingra S. and Jood S. (2001). Organoleptic and nutritional evaluation of wheat breads
supplemented with soybean and barley flour. Journal of Food Chemistry; 77: 479–488.

63
Diana M., Mariana A. P., Ioan G. (2012). Quality characteristics and oxidative stability of coconut
oil during storage. Journal of Agro-alimentary Processes and Technologies; 18 (4): 272-
276.
Divina D., Bauala and Keith R. C. (2016). Virgin Coconut oil Production Manual for Micro and
Vintage Scale Processing: FAO, Regional Office for Asia and the Pacific.
EFSA (2010) European Food Safety Authority, Scientific Opinion on Dietary Reference Values
for carbohydrates and dietary fibre (2010). EFSA Panel on Dietetic Products, Nutrition,
and Allergies. EFSA Journal; 8(3):1462
Eltayeb M., Ali A.O., Abou-Arab A. A. and AbuSalem F. M. (2011). Chemical composition and
functional properties of flour and protein isolate extracted from Bambara groundnut (Vigna
subterranean). African Journal of Food Science; 5: 82-90.
Enig M. (1999). Coconut: in support of good health in the 21st century [Presentation]. Presented
to the Federated States of Micronesia, Pohnpei.
Eriksson E., Koch K., Tortoe C., Akonor P.T. and Badoo E. (2014). Physicochemical, functional
and pasting characteristics of three varieties of cassava in wheat composite flours. British
Journal of Applied Science and Technology; 4(11): 1609-1621
Etong D. I., Mustapha A. O., Lawrence I. G., Jacob A. G. and Oladimeji M. O. (2014). Nutritional
and physiochemical properties of wheat (Triticum vulgare), cassava (Manihot esculenta)
and sweet potato (Ipomoea batatas) flours. Paskistan Journal of Nutrition; 13(8): 439-445.
Ezeokeke C. T., & Onuoha, A. B. (2016). Nutrient composition of cereal (maize), legume (soybean)
and fruit (banana) as a complementary food for older infants and their sensory assessment.
Journal of Food Science and Engineering; 6; 139-148.
FAO (2001). Improving nutrition through home gardening. A training package for preparing field
workers in Africa, and WHO. (2000). Complementary feeding: family foods for breastfed
children.
Fife B. F., Uwubanmwen I. O., Nwawe C. N., Okene R. A., Dada M., and Eseigbe E. (2011).
Harnessing the potentials of the coconut palm in the-Nigerian economy. Journal of
Agricultural Sciences; 7(6): 684-691.
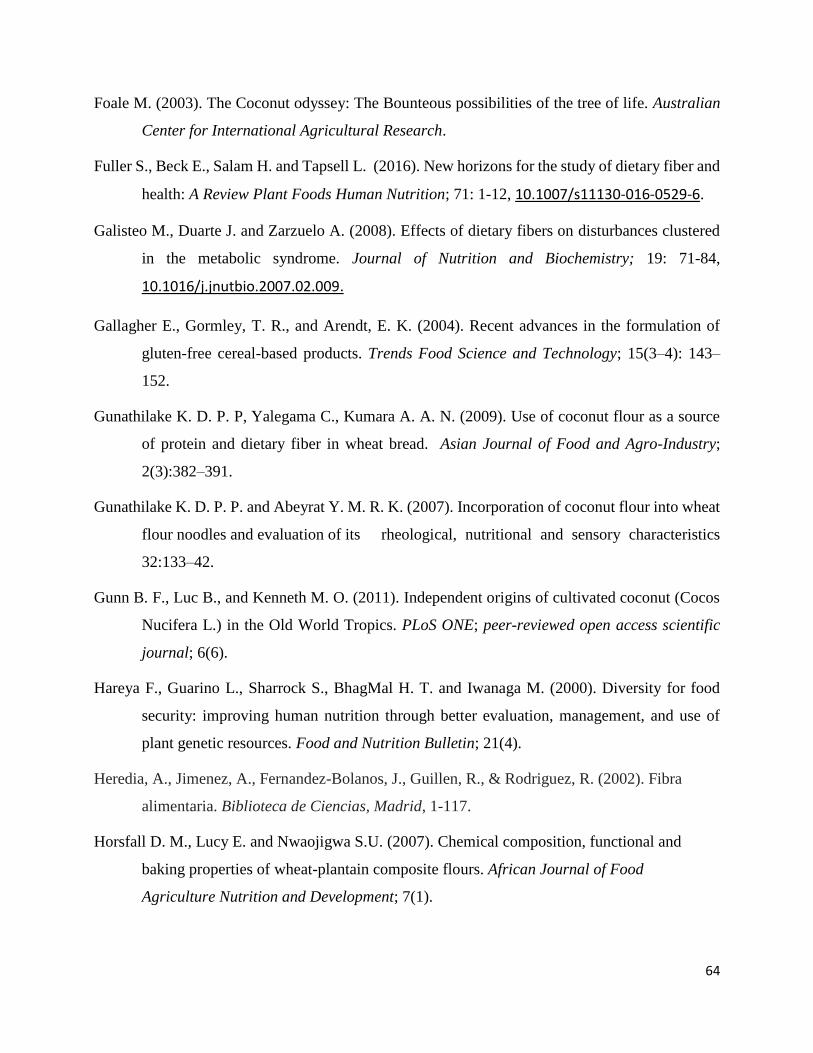
64
Foale M. (2003). The Coconut odyssey: The Bounteous possibilities of the tree of life. Australian
Center for International Agricultural Research.
Fuller S., Beck E., Salam H. and Tapsell L. (2016). New horizons for the study of dietary fiber and
health: A Review Plant Foods Human Nutrition; 71: 1-12, 10.1007/s11130-016-0529-6.
Galisteo M., Duarte J. and Zarzuelo A. (2008). Effects of dietary fibers on disturbances clustered
in the metabolic syndrome. Journal of Nutrition and Biochemistry; 19: 71-84,
10.1016/j.jnutbio.2007.02.009.
Gallagher E., Gormley, T. R., and Arendt, E. K. (2004). Recent advances in the formulation of
gluten-free cereal-based products. Trends Food Science and Technology; 15(3–4): 143–
152.
Gunathilake K. D. P. P, Yalegama C., Kumara A. A. N. (2009). Use of coconut flour as a source
of protein and dietary fiber in wheat bread. Asian Journal of Food and Agro-Industry;
2(3):382–391.
Gunathilake K. D. P. P. and Abeyrat Y. M. R. K. (2007). Incorporation of coconut flour into wheat
flour noodles and evaluation of its rheological, nutritional and sensory characteristics
32:133–42.
Gunn B. F., Luc B., and Kenneth M. O. (2011). Independent origins of cultivated coconut (Cocos
Nucifera L.) in the Old World Tropics. PLoS ONE; peer-reviewed open access scientific
journal; 6(6).
Hareya F., Guarino L., Sharrock S., BhagMal H. T. and Iwanaga M. (2000). Diversity for food
security: improving human nutrition through better evaluation, management, and use of
plant genetic resources. Food and Nutrition Bulletin; 21(4).
Heredia, A., Jimenez, A., Fernandez-Bolanos, J., Guillen, R., & Rodriguez, R. (2002). Fibra
alimentaria. Biblioteca de Ciencias, Madrid, 1-117.
Horsfall D. M., Lucy E. and Nwaojigwa S.U. (2007). Chemical composition, functional and
baking properties of wheat-plantain composite flours. African Journal of Food
Agriculture Nutrition and Development; 7(1).
65
Hossain S. (2016). Incorporation of coconut flour in plain cake and investigation of the effect of
sugar and baking powder on its baking quality. International Journal of Nutrition and Food
Sciences; 5(1):31.
Hossain S., Rezaul M. I. S., Saifullah Md., Kayshar S. Md., Tonmoy S. W., Rahman A. and Shams
Md. (2016). Incorporation of Coconut Flour in Plain Cake and Investigation of the Effect
of Sugar and Baking Powder on Its Baking Quality. International Journal of Nutrition and
Food Sciences; 5(1): 31-38. Doi: 10.11648/j.ijnfs.20160501.15.
Igbabul B. D., Bello F. A. and Ani E. C. (2014). Effect of fermentation on the proximate
composition and functional properties of defatted coconut (Cocos Nucifera L.) Flour. Sky
Journal of Food Science; 3(5):34–40.
Iwe M. O., Michael N., Madu N. E., Obasi N. E., Onwuka G. I., Nwabueze T. U. and Onuh J. O.
(2017). Physicochemical and pasting properties high quality cassava flour (HQCF) and
wheat flour blends. Agro-technology; 6:3 DOI: 10.4172/2168-9881.1000167.
Janica C. S. B., Dominique S. S. and Marissa G. N. (2013). Functional properties of flours prepared
from glucosinolate – rich vegetables: Alugbati (Basella rubra); Research congress; De La
Salle University.
Johansson C. G., Hallmer H. and Siljestrom M. (1983) Rapid enzymatic assay of insoluble and
soluble dietary fibre. Journal of Agricultural and Food Chemistry; 3: 476-482
Kaur M. and Singh N. (2005). Studies on functional, thermal and pasting properties of flours from
different chickpea cultivars. Food Chemistry; 91(3): 403-411.
Kiin-Kabari D. B., Eke-Ejiofor J., Giami S. Y. (2015). Functional and pasting properties of wheat
plantain flours enriched with bambara groundnut protein concentrate. International Journal
of Food Science and Nutrition Engineering; 5(2): 75-81 DOI: 10.5923/j.food.20150502.01
Kolawole O. F. and Chidinma A. O. (2015). Physical, functional, and pasting properties of flours
from corms of two Cocoyam (Colocasia esculenta and Xanthosoma sagittifolium) cultivars.
Journal of Food Science and Technology; 52(6):3440–344.
Kulwa B. M. K., Peter S. M., Martin E. K., Rajab M., and Patrick W. K. (2015). Feeding practices
and nutrient content of complementary meals in rural central Tanzania: implications for
66
dietary adequacy and nutritional status. BMC Pediatrics; 15:171 DOI 10.1186/s12887-015-
0489-2
Kusumayanti H., Handayani, N. A., & Santosa, H. (2015). Swelling power and water solubility of
cassava and sweet potatoes flour. Procedia Environmental Sciences, 23, 164-167.
Kwon K., Park K. H., and Rhee K. C. (1996). Fractionation and characterization of proteins from
coconut (Cocos nucifera L.). Journal of Agricultural and Food Chemistry; 44(7): 1741-
1745.
Lai Quoc D. and VO Thi H. P. (2017). Functional properties and influence of coconut flour on
texture of dough and cookies. Vietnam Journal of Science and Technology; 55 (5A): 100-
107.
Laurence E., Michael F. E., Alexandra C. and Rachel C. B. (2016). Coconut oil consumption and
cardiovascular risk factors in humans. Nutrition Reviews; 74(4):267–28.
Lazaridou A., Duta D., Papageorgiou M., Belc N. and Biliaderis C. G. (2007). Effects of
hydrocolloids on dough rheology and bread quality parameters in gluten free formulations.
Journal of Food Engineering; 79: 1033–1047.
Leach W., McCowen D. and Schoch T. J. (1959). Structure of the starch granule. Swelling and
solubility patterns of various starches. Ceereals Chemistry; 534-544
Lieberman S., Enig, M. G., & Preuss, H. G. (2006). A review of monolaurin and lauric acid: natural
virucidal and bactericidal agents. Alternative & Complementary Therapies; 12(6): 310-314.
PCA. (2006).
Lieberman S., Enig, M. G., & Preuss, H. G. (2006). A review of monolaurin and lauric acid: natural
virucidal and bactericidal agents. Alternative & Complementary Therapies; 12(6): 310-314.
Lima E. B. C., Sousa, C. N. S., Meneses, L. N., Ximenes, N. C., Júnior, S., Vasconcelos, G. S. and
Vasconcelos S. M. M. (2015). Cocos nucifera (L.)(Arecaceae): A phytochemical and
pharmacological review. Brazilian Journal of Medical and Biological Research; 48(11),
953-964.
67
Loki A. L. and Rajamohan T. (2003). Hepato-protective and antioxidant effect of tender coconut
water on ccl4 induced liver injury in rats. Indian Journal of Biochemistry and Biophysics;
40: 354-357.
Makinde F. M. and Akinoso, R. (2014). Physical, nutritional and sensory qualities of bread samples
made with wheat and black sesame (Sesamum indicum Linn) flours. International Food
Research Journal; 21(4): 1635-1640.
Mehfooz T., Ali T. M., Arif S. and Hasnain A. (2018). Effect of barley husk addition on rheological,
textural, thermal and sensorial characteristics of traditional flat bread (chapatti). Journal of
cereals science; 79: 376-382.
Mudgil D., Barak S. and Khatkar B. (2017). Cookies texture, spread ratio and sensory acceptability
of cookies as a function of soluble dietary fibre, baking time and different water levels.
Journal of Food Science and Technology; 80; 537-542
Muhammad A. S., Haq N., Misbah N., Hafiz B. A., Mazhar H. and Muhammad A. C. (2013).
Functional properties of maize flour and its blends with wheat flour: optimization of
preparation conditions by response surface methodology Pakistan Journal of Botany; 45(6):
2027-2035.
Muralidharan K., & Jayashree, A. (2011). Value addition, product diversification and by-product
utilization in coconut. Indian Coconut Journal, 7, 4-10.
Nagao S. (1996) Processing technology of noodle products in japan. in: pasta and noodle
technology. Kruger J. E., Matsuo RB (Eds). American Association of Cereal Chemists, St.
Paul, MN, USA; 169-195
NARI. (2003). Coconuts: Postharvest care and market preparation. Technical Bulletin; No. 2 (6):1–
11.
Naseer A. B., Idrees A. W., Afshan M. H., Adil G., (2016). Physiochemical properties of whole
wheat flour as affected by gamma irradiation. Journal of Food Science and Technology;
71:175-183.
68
Obaroakpo J. U., Iwanegbe, I., and Ojokoh, A. (2017). The Functional and Sensory Evaluation of
Biscuits Produced from Wheat, Defatted Soybean and Coconut Flour. Current Journal of
Applied Science and Technology; 23(6): 1-7.
Ocheme B. O., Olajide E. A., Chiemela E. C., Caleb M. Y. and Ugochukwu H. A. (2018).
Proximate composition, functional and pasting properties of wheat and groundnut protein
concentrate flour blends. Food Science and Nutrition; 6:1173–1178
Ohizua E. R., Adeola A. A., Micheal A. I., et al. Nutrient composition, functional, and pasting
properties of unripe cooking banana, pigeon pea, and sweet potato flour blends. Food
Science and Nutrition; 5:750–762. https://doi.org/10.1002/fsn3.455
Okoye J. I and Obi C.D (2017). Nutrient composition and sensory properties of wheat- African
bread fruit composite flour cookies. Sky Journal of Food Science; 6 (3): 027-032.
Oladele A. K., and Aina J. O. (2007). Chemical composition and functional properties of flour
produced from two varieties of tigernut (Cyperus esculentus). African Journal of
Biotechnology; 6 (21).
Olaoye O. A., Onilude A. A. and Idowu O. A. (2006). Quality characteristics of bread produced
from composite flours of wheat, plantain and soybeans. African Journal of Biotechnology;
5 (11): 1102-1106.
Olugbenga O. A. (2017) Optimization of the functional characteristics, pasting and rheological
properties of pearl millet-based composite flour. Heliyon 3, e00240
Oluwamukomi M. O., Oluwalan I. B. and Akinbowale, F. O. (2011). Physicochemical and sensory
properties of wheat-cassava composite biscuit enriched with soy flour. African Journal of
Food Science; 5: 50-56.
Osungbaro T. O., Jimoh, D., & Osundeyi, E. (2010). Functional and pasting properties of composite
Cassava-Sorgum flour meals. Agriculture and Biology Journal of North America; 1(4):
715-720.
PCA (2006). Production of coconut flour and virgin coconut oil. Philippine Coconut Authority.
Retrieved (http://www.pca.da.gov.ph/pdf/techno/flour_vco.pdf).
69
Peiris T. S. G., Peiris T. U. S. and Rajapaksha, S. (2000). Prediction of annual national coconut
production: a statistical approach. Sri Lankan Journal of Applied Statistics; 1(1): 25–31.
Prades A., Dornier M., Diop N. and Pain J. P. (2012). Coconut water uses, composition and
properties: A review; 67: 87–107. DOI: 10.1051/fruits/2012002.
Radhika G. S., Shanavas, S. and Moorthy, S. N. (2008). Influence of lipids isolated from soybean
seed on different properties of cassava starch. Starch/Stärke 60: 485 – 492.
Raghavendra S. N., Rastogi N. K., Raghavarao K. S. M. S., and Tharanathan R. N. (2004). Dietary
fiber from coconut residue: effects of different treatments and particle size on the hydration
properties. European Food Research Technology; 218:563–567 DOI 10.1007/s00217-004-
0889.
Raihan M., & Saini, C. S. (2017). Evaluation of various properties of composite flour from oats,
sorghum, amaranth and wheat flour and production of cookies thereof. International Food
Research Journal; 24(6): 2278-2284.
Ramaswamy L. (2014). Coconut flour - A low carbohydrate, gluten free flour.” International
Journal of Ayurvedic and Herbal Medicine; 3:1426–36.
Rasyid F., Manullang M. and Hansen P. M. T. (1992). Isolation and characterization of coconut
protein, Food Hydrocolloids 6(3): 301-314.
Sacks F. M. and Katan M. (2002). Randomized clinical trials on the effects of dietary fat and
carbohydrate on plasma lipoproteins and cardiovascular disease. American Journal of
Medicine; 113 (suppl. 9b): 13s-24s.
Sanni L. O., Ikuomola D. P. and Sanni S. A. (2001). Effect of length of fermentation and varieties
on the qualities of sweet potato gari. Proc. 8th triennial Symposium of the International
Society for Tropical Root Crops – Africa Branch (ISTRC-AB), Ed. M.O. Akoroda, IITA,
Ibadan., Nigeria; 208-211. 19.
Shahzadi N., Butt M. S., Rehman S. U. and Sharif K. (2005). Chemical characteristics of various
composite flours. International Journal of Agriculture and Biology; 7(1): 105-108.
70
Shamina A. (2007). Fatty acid profile of coconut oil in relation to nut maturity and season in
selected cultivar/hybrids. British Food Journal; Vol. 109 Issue: 4: 272-279, https://
doi.org/10.1108/00070700710736525.
Shittu T., Raji, A. O. and Sanni, L. O. (2007). Bread from composite cassava-wheat flour: effect
of baking time and temperature on some physical properties of bread loaf. Food Research
International; 40: 280–290.
Shoup F. K., Pomeranz Y. and Deyoe C. W. (1966). Amino acid composition of wheat varieties
and flours varying widely in bread-making potentialities. Research division. Agricultural
research services U.S; 66504
Singh U. (2001): Functional Properties of Grain Legume Flours. Journal of Food Science and
Technology; 38 (3): 191-199. http://dx.doi.org/10.1007/s13197-010-0042-0.
Spady D. K. and Woollett J. M. (1993). Dietary regulation of plasma LDL- cholesterol levels by
dietary cholesterol and fatty acids. Annual Revision Nutrition; 13: 355-381.
Spiller G.A. (2000) CRC Hand book of: dietary fiber in human nutrition. CRC Press, New York;
9-10.
Stephenson D., Gardner J., Walker S., Ashworth A. (1994). Weaning food viscosity and energy
density: Their effects on Ad Libitum consumption and energy intakes in Jamaican children.
American Journal Clinical Nutrition; 60:465–9.
Stevenson D. G., Biswas Atanu B. and Inglett G. (2005) Thermal and Pasting Properties of
Microwaved Corn Starch. Starch/Stärke; 57: 347–353
Sujirtha N. and Mahendran T. (2015). Use of Defatted Coconut Flour as a Source of Protein and
Dietary Fiber in Wheat Biscuits. International Journal of Innovative Research in Science,
Engineering and Technology; 4 (8).
Suresh C., Samsher S. and Durvesh K. (2014). Evaluation of functional properties of composite
flours and sensorial attributes of composite flour biscuits. Journal of Food Science and
Technology; 52(6):3681–3688.
Tester R. F., and Morrison W. R. (1990). Swelling and gelatinization of cereal starches: Effect of
amylopectin, amylose and lipids. Cereal Chemistry; 67: 551-559.
71
Thampan, P. K., & Rethinam, P. (2004). Coconut products for health and medicine. Indian Coconut
Journal; 35: 6-15.
Tharise N., Julianti E., and Nurminah. M. (2014). Evaluation of physico-chemical and functional
properties of composite flour from cassava, rice, potato, soybean and xanthan gum as
alternative of wheat flour. International Food Research Journal; 21(4):1641–49.
Trinidad P. T., Aida C. M., Divinagracia H. V., Anacleta S. L., Faridah C. A., Joan C. C., Rosario
R. E., Dina B. M., Angelica S. M. and Modesto T. C. (2006). Dietary fiber from coconut
flour: a functional food. Innovative Food Science and Emerging Technologies; 7(4):309–
317.
Trinidad P. T., Faridah C. A., Joan C. C., Rosario L. R. and Dina B. M. (2004). The cholesterol-
lowering effect of coconut flakes in humans with moderately raised serum cholesterol.
Journal of Medical Foods; 7(2):136–40.
United States Department of Agriculture; Agricultural Research Service. (2017). USDA Branded
Food Products Database coconut flour.
Usman G. O., Ameh U. E., Alifa O. N. and Babatunde R. M. (2015). Proximate composition and
anti-nutrient properties of breakfast cereal made from blends of local rice, soybeans and
defatted coconut flours. Nutrition & Food Sciences; S11:006
Usman G. O., & Okafor G. I. (2016). Organoleptic properties and perception of maize, African
yam bean, and defatted coconut flour‐based breakfast cereals served in conventional forms.
Food science & nutrition; 4(5): 716-722.
Uwabanmwen I. O., Nwawe C. N., Okere R. A., Dada M. and Eseigbe E. (2011). Harnessing the
potentials of the coconut palm in the Nigerian economy. World Journal of Agricultural
Sciences 7 (6): 684-691, ISSN 1817-3047.
Wani I. A., Sogi D. S., Sharma P., & Gill B. S. (2016). Physicochemical and pasting properties of
unleavened wheat flat bread (Chapatti) as affected by addition of pulse flour. Cogent Food
& Agriculture, 2(1), 1124486.
WHO (2001). World Health Organization, Guiding Principles for Complementary Feeding of the
Breastfed Child:
72
http://www.who.int/nutrition/publications/guiding_principles_compfeeding_breastfed.
Yadav D. Y., Singh K. K. & Rehal J. (2012). Studies on fortification of wheat flour with defatted
rice bran for chappati making. Journal of Food Science and Technology; 49(1): 96–102
DOI 10.1007/s13197-011-0264-9
Yalegama L. L. W. C., Karunaratne D. N., Sivakanesan R. and Jayasekara C. (2013). Chemical and
functional properties of fibre concentrates obtained from by-products of coconut kernel.
Journal of Food Chemistry; 141: 124 – 130.
Yalegama L. L. W. C. and Chevan J. K. (2006). Studies on Utilization of Coconut Flour as a Source
of Cell Wall Polysaccharides. Tropical Agricultural Research; Volume 18.
Web links
http://www.freshplaza.com/article/165420/Nigerian-farmers-can-tap-into-4bn-global-coconut-
market accessed 25th of June, 2018
https://www.bakeryandsnacks.com/Article/2017/09/18/Lagos-Govt-introduces-Eko-Coconut-
Bread-to-boost-food-security accessed 20th of June, 2018
http://www.uaecement.com/articles/Coconut%20shells.pdf accessed 20th of June 2018
https://www.bgci.org/education/1685/ accessed 16th August, 2018
http://www.usesofcoconut.com/king-coconut-water-drink/ accessed 17th July, 2018
http://healthtipsinfo.com/ accessed 17th July, 2018
http://www.fao.org/faostat/en/#data/QC accessed 17th August, 2018
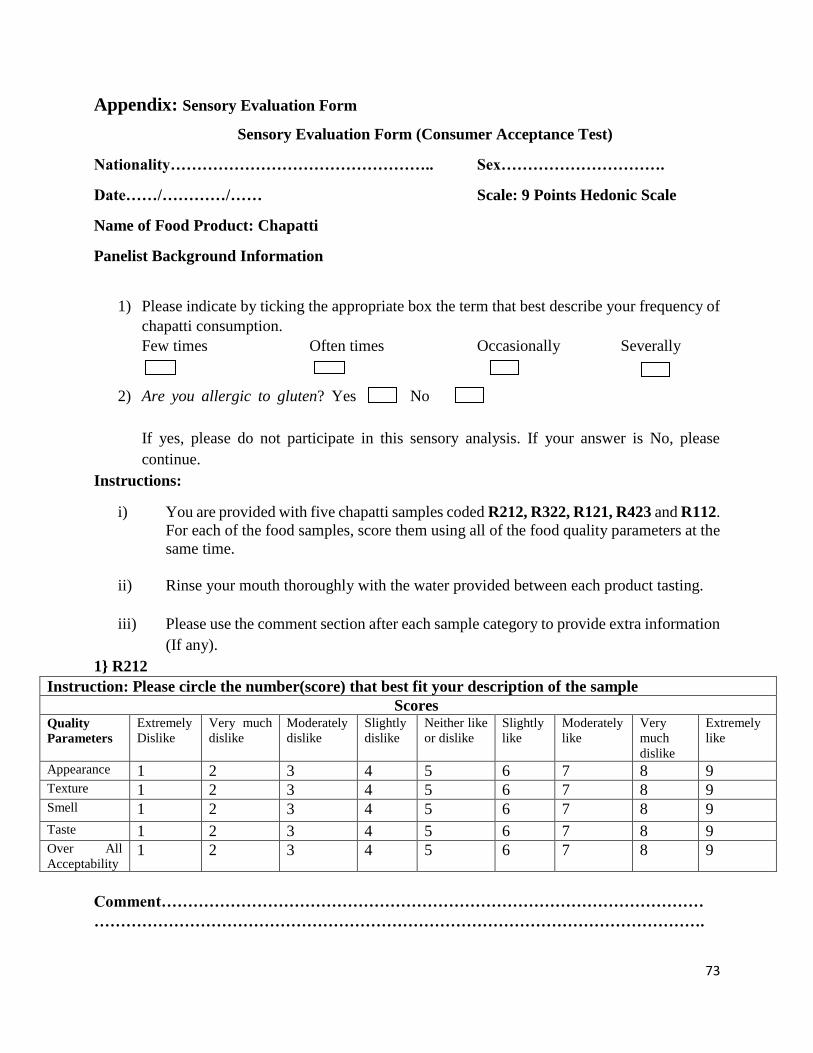
73
Appendix: Sensory Evaluation Form
Sensory Evaluation Form (Consumer Acceptance Test)
Nationality………………………………………….. Sex………………………….
Date……/…………/…… Scale: 9 Points Hedonic Scale
Name of Food Product: Chapatti
Panelist Background Information
1) Please indicate by ticking the appropriate box the term that best describe your frequency of
chapatti consumption.
Few times Often times Occasionally Severally
2) Are you allergic to gluten? Yes No
If yes, please do not participate in this sensory analysis. If your answer is No, please
continue.
Instructions:
i) You are provided with five chapatti samples coded R212, R322, R121, R423 and R112.
For each of the food samples, score them using all of the food quality parameters at the
same time.
ii) Rinse your mouth thoroughly with the water provided between each product tasting.
iii) Please use the comment section after each sample category to provide extra information
(If any).
1} R212
Instruction: Please circle the number(score) that best fit your description of the sample
Scores Quality
Parameters
Extremely
Dislike
Very much
dislike
Moderately
dislike
Slightly
dislike
Neither like
or dislike
Slightly
like
Moderately
like
Very
much
dislike
Extremely
like
Appearance 1 2 3 4 5 6 7 8 9 Texture 1 2 3 4 5 6 7 8 9 Smell 1 2 3 4 5 6 7 8 9
Taste 1 2 3 4 5 6 7 8 9 Over All
Acceptability 1 2 3 4 5 6 7 8 9
Comment…………………………………………………………………………………………
…………………………………………………………………………………………………….
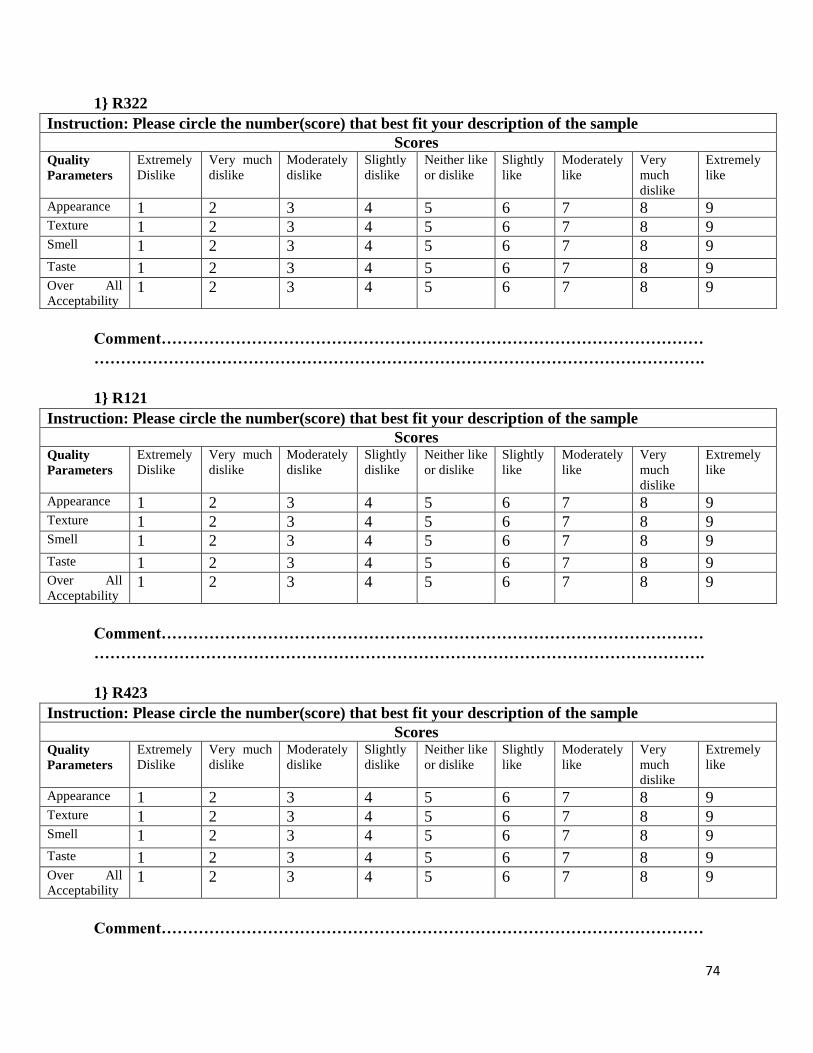
74
1} R322
Instruction: Please circle the number(score) that best fit your description of the sample
Scores Quality
Parameters
Extremely
Dislike
Very much
dislike
Moderately
dislike
Slightly
dislike
Neither like
or dislike
Slightly
like
Moderately
like
Very
much
dislike
Extremely
like
Appearance 1 2 3 4 5 6 7 8 9 Texture 1 2 3 4 5 6 7 8 9 Smell 1 2 3 4 5 6 7 8 9
Taste 1 2 3 4 5 6 7 8 9 Over All
Acceptability 1 2 3 4 5 6 7 8 9
Comment…………………………………………………………………………………………
…………………………………………………………………………………………………….
1} R121
Instruction: Please circle the number(score) that best fit your description of the sample
Scores Quality
Parameters
Extremely
Dislike
Very much
dislike
Moderately
dislike
Slightly
dislike
Neither like
or dislike
Slightly
like
Moderately
like
Very
much
dislike
Extremely
like
Appearance 1 2 3 4 5 6 7 8 9 Texture 1 2 3 4 5 6 7 8 9 Smell 1 2 3 4 5 6 7 8 9
Taste 1 2 3 4 5 6 7 8 9 Over All
Acceptability 1 2 3 4 5 6 7 8 9
Comment…………………………………………………………………………………………
…………………………………………………………………………………………………….
1} R423
Instruction: Please circle the number(score) that best fit your description of the sample
Scores Quality
Parameters
Extremely
Dislike
Very much
dislike
Moderately
dislike
Slightly
dislike
Neither like
or dislike
Slightly
like
Moderately
like
Very
much
dislike
Extremely
like
Appearance 1 2 3 4 5 6 7 8 9 Texture 1 2 3 4 5 6 7 8 9 Smell 1 2 3 4 5 6 7 8 9
Taste 1 2 3 4 5 6 7 8 9 Over All
Acceptability 1 2 3 4 5 6 7 8 9
Comment…………………………………………………………………………………………
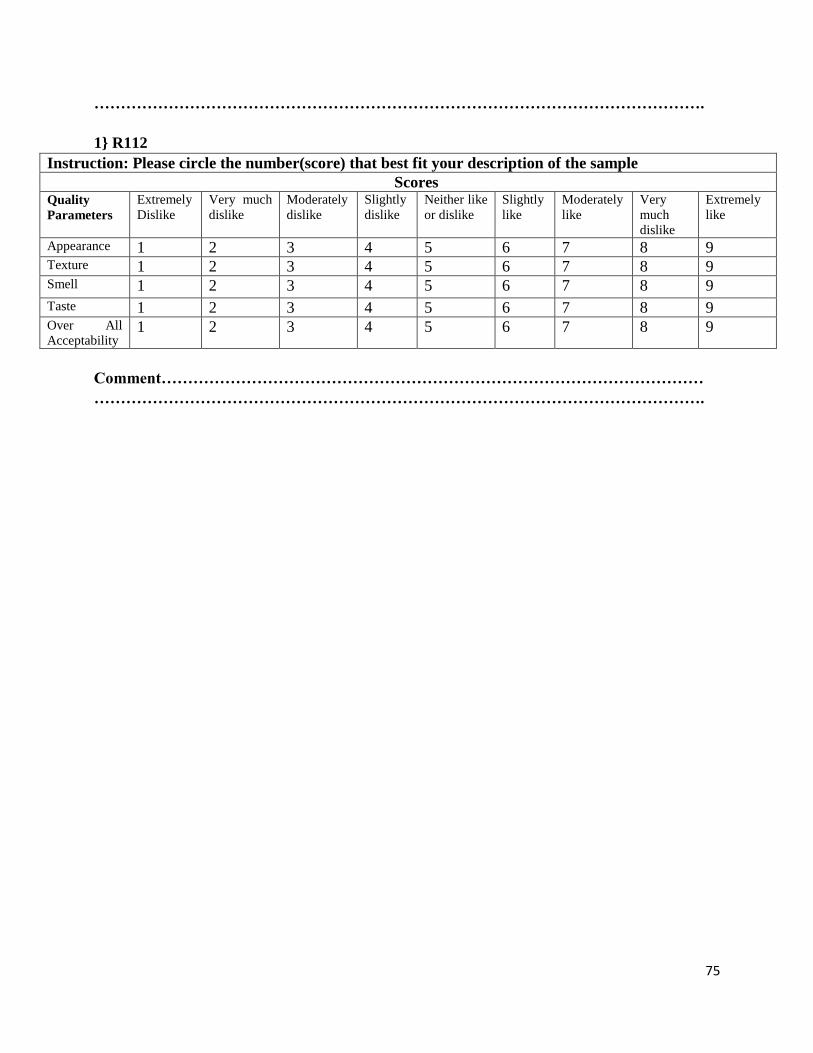
75
…………………………………………………………………………………………………….
1} R112
Instruction: Please circle the number(score) that best fit your description of the sample
Scores Quality
Parameters
Extremely
Dislike
Very much
dislike
Moderately
dislike
Slightly
dislike
Neither like
or dislike
Slightly
like
Moderately
like
Very
much
dislike
Extremely
like
Appearance 1 2 3 4 5 6 7 8 9 Texture 1 2 3 4 5 6 7 8 9 Smell 1 2 3 4 5 6 7 8 9
Taste 1 2 3 4 5 6 7 8 9 Over All
Acceptability 1 2 3 4 5 6 7 8 9
Comment…………………………………………………………………………………………
…………………………………………………………………………………………………….