Embed Size (px)
Citation preview
ValuationFree Cash Flows
Katharina LewellenFinance Theory II
April 2, 2003

Valuation Tools
A key task of managers is to undertake valuation exercises in order to allocate capital between mutually exclusive projects:
Is project A better than doing nothing?Is project A better than project B?Is the project’s version A than its modified version A’?
The process of valuation and ultimately of capital budgeting generally involves many factors, some formal, some not (experience, hard-to-formalize information, politics, etc.).
We will focus on financial tools for valuation.
2

Valuation Tools (cont.)
These tools provide managers with numerical techniques to “keep score” and assist in the decision-making process.
They build on modern finance theory and deal with cash flows, time, and risk.
All rely on (often highly) simplified models of the business:Technical limitations (less now with computers)VersatilityUnderstandable and discussible
3

How to Value a Project/Firm?
Calculate NPVEstimate the expected cash-flowsEstimate the appropriate discount rate for each cash flowCalculate NPV
Look up the price of a comparable project
Use alternative criteria (e.g., IRR, payback method)You need to be an educated user of these
4

Comparables method
Suppose you want to value a private company going publicEBITDA = $100 millionFor a similar public company P/E = 10You value the IPO company at $1,000 million
What are the implicit assumptions?Suppose that P = E / (r – g)Then, P/E = 1 / (r – g)Thus, we assume that
• Earnings are expected to grow in perpetuity at a constant rate• Growth rates and discount rates are the same for both firms
5

Internal Rate of Return (IRR)One-period project
Investment = 100 at time 0 Payoff = 150 at time 1
Rate of return = 150/100 – 1 = 50%NPV = -100 + 150/discount rate = 0Discount rate = 150/100 = 50%
Rate of return is the discount rate that makes NPV = 0
Multiple period projects
IRR is the discount rate that makes NPV = 0
0)IRR1(
C...)IRR1(
CIRR1
CINPV TT
221
o =+
+++
++
+=
Basic rule: Chose projects with IRR > opportunity costs of capitBasic rule: Chose projects with IRR > opportunity costs of capitalal
6

Internal Rate of Return (IRR), cont.
Suppose you choose among two mutually exclusive projectsE.g., alternative ways to use a particular piece of land
Project 1: cash flows -10 +20 IRR=100%Project 2: cash flows: -20 +35 IRR=75%
Which project would you choose? (costs of capital = 10%)• Project 2 because it has a higher NPV
Other pitfalls (BM, Chapter 5)E.g., multiple IRR, lending vs. borrowing.
Bottom lineNPV is easier to use than IRRIf used properly, IRR should give you the same answer as NPV
7

1. Calculating Cash Flows

The Free Cash Flow (FCF) Approach
FCF: The expected after tax cash flows of an all equity firmThese cash flows ignore the tax savings the firm gets from debt financing (the deductibility of interest expense)
Plan of Attack:Step 1: Estimating the Free Cash FlowsStep 2: Account for the effect of financing on value
Preview: Two ways to account for tax shield:Adjust the discount rate (WACC method).Adjust the cash-flow estimate (APV method).
9

Count all incremental, after-tax cash flows allowing for reasonable inflation.
All:Don’t just look at operating profits in the out years.If project requires follow-on CAPX or additional working capital, take these into account.
After-tax: The rest goes to the IRS.
Be consistent in your treatment of inflation:Discount nominal cash flows at nominal discount rates.Reasons:
• Nominal rates reflect inflation in overall economy, but inflation in cash flows may be different.
• In fact, some items in cash flows, e.g., depreciation, may have no inflation.
10

Treatment of Inflation - Example
T-Bill rate (nominal) = 8%Expected inflation rate = 6%Expected real rate = 1.08/1.06 = 1.9%
Sales of widgets next year = $100 measured in today’s dollarsYou expect that the price of the widgets will go up by 6%What’s the PV of the widgets?
nominal cash flows: PV = $100*(1.06)/1.08 = 98.2
real cash flows: PV = $100/(1.08/1.06) = 98.2
11
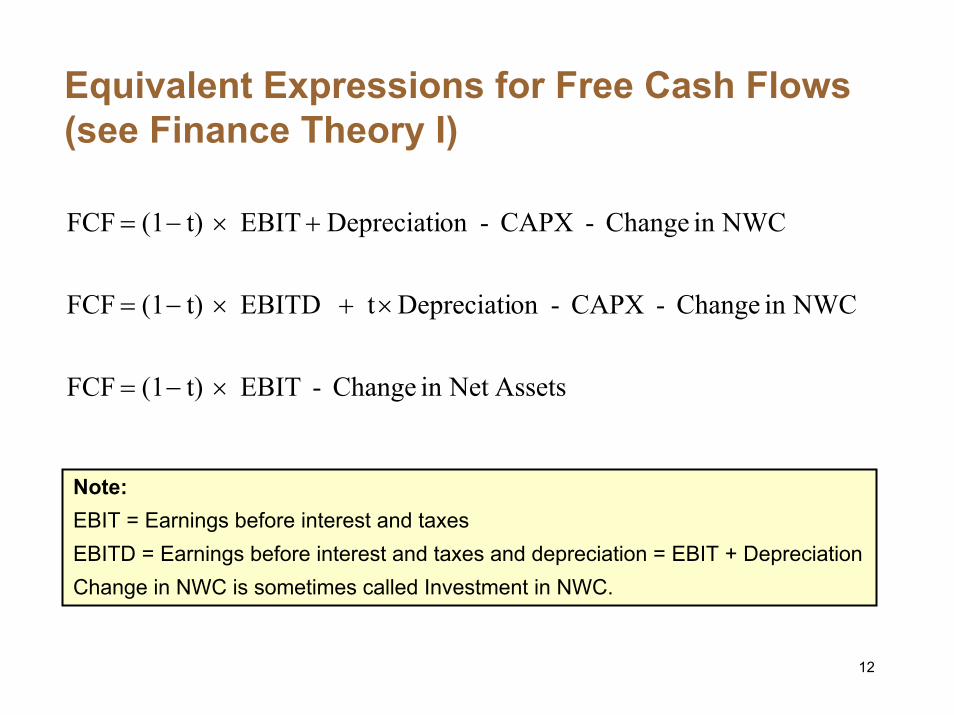
Equivalent Expressions for Free Cash Flows (see Finance Theory I)
AssetsNet in Change - EBIT t)(1FCF
NWCin Change - CAPX -on Depreciati t EBITD t)(1FCF
NWCin Change - CAPX -on Depreciati EBIT t)(1FCF
×−=
×+×−=
+×−=
Note:EBIT = Earnings before interest and taxesEBITD = Earnings before interest and taxes and depreciation = EBIT + DepreciationChange in NWC is sometimes called Investment in NWC.
12

Example of Free Cash Flow Calculation
1998 1999Sales 1,000 1,200 Cost of Goods Sold 700 850 Depreciation 30 35 Interest Expense 40 50 Taxes (38%) 80 90 Profit After taxes 150 175 Capital Expenditures 40 40 Accounts Receivable 50 60 Inventories 50 60 Accounts Payable 20 25
In 1999: FCF = EBIT*(1-t) + Depreciation - CAPX - Change in NWCEBIT = 1,200 - 850 - 35 = 315; Ch. NWC = (60+60-25) - (50+50-20) = 15FCF = 315 * (1-.38) + 35 - 40 - 15 = 175.3
13

Beware!Note:
We ignored interest paymentsWe computed taxes on EBIT
Do not take the effect of financing (e.g., interest) into account at this stage.
Remember our plan:First, determine the expected cash-flows as if the project were 100% equity financed.Later, we will adjust for financing.
If you count financing costs in cash-flow, you count them twice.
14

TW ExampleXYZ, a profitable widget producer ($100M annual after-tax profit) contemplates introducing new Turbo Widgets (TWs), developed in its labs at an R&D cost of $1M over the past 3 years.
New plant to produce TW wouldcost $20M todaylast 10 years with salvage value of $5Mbe depreciated to $0 over 5 years using straight-line
TWs need painting: Use 40% of the capacity of a painting machinecurrently owned and used by XYZ at 30% capacitywith maintenance costs of $100,000 (regardless of capacity used)
Annualoperating costs: $400,000operating income generated: $42Moperating income of regular widgets would decrease by $2M
Working capital (WC): $2M needed over the life of the project
Corporate tax rate 36%15

TW Example (cont.)Ignore the $100M after-tax profit and focus on incremental cash-flows
R&D cost of $1M over the past three years: Sunk cost ==> Ignore it
The plant’s $20M cost: It’s a CAPX ==> Count it
Machine’s $100K maintenance cost: Not incremental ==> Ignore itIncurred with or without TW productionTrue even if accounting charges TW production a fraction of these
Op. income of regular widgets decrease by $2M due to cannibalizationWould not occur without TW productionIt is an opportunity cost ==> Count it
Year 0 1 2 3 4 5 6 7 8 9 10CAPX 20 0 0 0 0 0 0 0 0 0 0RW Inc. decrease 0 2 2 2 2 2 2 2 2 2 2
16

Use Incremental Cash Flows
Compare firm value with and without the projectV(project) = V(firm w/ project) - V(firm w/o project)
Use only cash flows (in and out) attributable to the projectSunk costs should be ignored
• They are spent w/ or w/o the project (bygones are bygones).
Opportunity costs should be accounted for• A project might exclude good alternatives (e.g., use of land).
Accounting illusions should be avoided• e.g. the project might be “charged” for a fraction of expenses that would
be incurred anyway.
17

Use After-tax Cash Flows
These are what you have left after paying capital suppliers
Make sure to count the benefits of expensing, depreciation, etc.
CAPX and Depreciation:CAPX are not directly subtracted from taxable incomeInstead, a fraction of CAPX (depreciation) is subtracted over a number of years
18
TW Example (cont.)
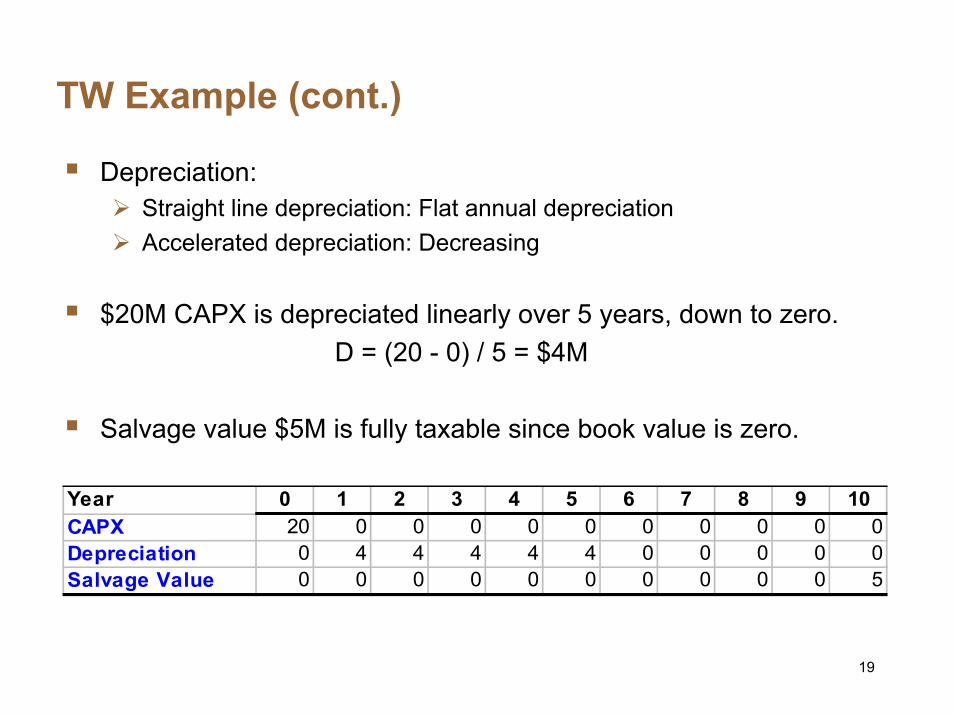
Depreciation:Straight line depreciation: Flat annual depreciationAccelerated depreciation: Decreasing
$20M CAPX is depreciated linearly over 5 years, down to zero.D = (20 - 0) / 5 = $4M
Salvage value $5M is fully taxable since book value is zero.
Year 0 1 2 3 4 5 6 7 8 9 10CAPX 20 0 0 0 0 0 0 0 0 0 0Depreciation 0 4 4 4 4 4 0 0 0 0 0Salvage Value 0 0 0 0 0 0 0 0 0 0 5
19

TW Example (cont.)
Year 0 1 2 3 4 5 6 7 8 9 10CAPX 20.0 - - - - - - - - - - Income - 42.0 42.0 42.0 42.0 42.0 42.0 42.0 42.0 42.0 42.0 RW Inc. decr. - 2.0 2.0 2.0 2.0 2.0 2.0 2.0 2.0 2.0 2.0 Incr. income - 40.0 40.0 40.0 40.0 40.0 40.0 40.0 40.0 40.0 40.0 Incr. cost - 0.4 0.4 0.4 0.4 0.4 0.4 0.4 0.4 0.4 0.4 Salvage value - - - - - - - - - - 5.0 Incr. profit - 39.6 39.6 39.6 39.6 39.6 39.6 39.6 39.6 39.6 44.6 Depreciation - 4.0 4.0 4.0 4.0 4.0 - - - - - EBIT - 35.6 35.6 35.6 35.6 35.6 39.6 39.6 39.6 39.6 44.6 Incr. taxes (36%) - 12.8 12.8 12.8 12.8 12.8 14.3 14.3 14.3 14.3 16.1 Incremental CF -20.0 26.8 26.8 26.8 26.8 26.8 25.3 25.3 25.3 25.3 28.5
Note: We do as if entire EBIT is taxable ==> We ignore (for now) the fact that interest payments are not taxable.
20

So far (but we’re not done yet):
CF CF = Incr. Profit = Incr. Profit –– Taxes Taxes –– CAPXCAPX
= Incr. Profit = Incr. Profit –– t * (Incr. Profit t * (Incr. Profit –– DeprDepr.) .) –– CAPXCAPX
= (1 = (1 –– t) * Incr. Profit + t * t) * Incr. Profit + t * DeprDepr. . –– CAPXCAPX
Example: We could have computed the CF in year 1 as(1 - 36%) * 39.6 + 36% * 4 - 0 = $26.8M
21
Changes in (Net) Working Capital
Remark 1:Many projects need some capital to be tied up (working capital) which constitutes an opportunity cost.We need the Change in Working Capital implied by the project.
Remark 2:Accounting measure of earnings
Sales - Cost of Goods SoldIncome and expense are reported when a sale is declared.
COGS in 2000 includes the costs of items sold in 2000 even if the cost was incurred in 1999 or hasn’t been incurred yet.Sales in 2000 include the income from items sold in 2000 even if the payment has not been received yet.
Working Capital = Inventory + A/R - A/P
22

TW Example (cont.)
Year 0 1 2 3 4 5 6 7 8 9 10CAPX 20.0 - - - - - - - - - - Incr. profit - 39.6 39.6 39.6 39.6 39.6 39.6 39.6 39.6 39.6 44.6 Incr. taxes (36%) - 12.8 12.8 12.8 12.8 12.8 14.3 14.3 14.3 14.3 16.1 NWC 2.0 2.0 2.0 2.0 2.0 2.0 2.0 2.0 2.0 2.0 - Change in NWC 2.0 - - - - - - - - - -2.0Total -22.0 26.8 26.8 26.8 26.8 26.8 25.3 25.3 25.3 25.3 30.5
23
Putting It All Together
FCF = (1 FCF = (1 –– t) * Incr. Profit + t * t) * Incr. Profit + t * DeprDepr. . –– CAPX CAPX –– ∆∆NWCNWC
This can also be rewritten asThis can also be rewritten as
FCF = (1 FCF = (1 –– t) * EBIT + t) * EBIT + DeprDepr. . –– CAPX CAPX –– ∆∆NWCNWC
24

Finding the Value of the Cash Flows
Decision RuleAccept any project with positive NPV. The NPV tells you how much value the project creates.
...r)(1
]E[CFr)(1
]E[CFr)(1
]E[CFr)(1
]E[CFCF NPV 44
33
221
0 ++
++
++
++
+=
We know how to find the expected free cash flows
We need to find the appropriate discount rate for a project
We need to account for the tax benefits of interest paymentsIgnore this for now, and assume that the project is 100% equity financed
25

What is the appropriate discount rate for a project?
The discount rate is the opportunity cost of capital for the project.
It answers the question: What rate can investors earn on an investments with comparable risk?
What does comparable risk mean?
26

Using the CAPM
What does ‘comparable risk’ mean?CAPM: risk = β
How does risk translate into a discount rate?CAPM: E[rE] = rf + βE E[RM – rf]
Practical issuesEstimating betasEstimating the market risk premiumLeverage
27

Beta = regression slope
-25%
-17%
-8%
0%
8%
17%
25%
-30% -20% -10% 0% 10% 20% 30%
28

Leverage, returns, and risk
Firm is a portfolio of debt and equity
Assets
Assets
Debt
Equity
Liab & Eq
Therefore …
rA = ED r AE r
AD
+ and βA = ED AE
AD
β+β
29

Estimating Betas
Equity BetaSimply regress past stock returns on the market return
Asset BetaFor an all-equity firm, equity beta = asset betaHow about levered firms?Hint:
• You can view the firm as a portfolio of debt and equity• Recall: portfolio beta = weighted average of individual asset betas• Question: What are the appropriate weights?• You can assume that debt is risk-free or that debt beta is between 0.1
and 0.3 (based on empirical studies)
30