Embed Size (px)
Citation preview

Valuation in Life Sciences

Boris Bogdan · Ralph Villiger
Valuationin Life SciencesA Practical Guide
With 92 Figures and 77 Tables
123

Dr. Boris BogdanRalph Villiger
Avance, Basel GmbHPfluggässlein 14CH-4001Switzerland
[email protected]@avance.ch
Library of Congress Control Number: 2006938913
ISBN 978-3-540-45565-3 Springer Berlin Heidelberg New York
This work is subject to copyright. All rights are reserved, whether the whole or part of the material isconcerned, specifically the rights of translation, reprinting, reuse of illustrations, recitation, broad-casting, reproduction on microfilm or in any other way, and storage in data banks. Duplication ofthis publication or parts thereof is permitted only under the provisions of the German CopyrightLaw of September 9, 1965, in its current version, and permission for use must always be obtainedfrom Springer. Violations are liable to prosecution under the German Copyright Law.
Springer is part of Springer Science+Business Media
springer.com
© Springer-Verlag Berlin Heidelberg 2007
The use of general descriptive names, registered names, trademarks, etc. in this publication doesnot imply, even in the absence of a specific statement, that such names are exempt from the relevantprotective laws and regulations and therefore free for general use.
Production: LE-TEX Jelonek, Schmidt & Vockler GbR, LeipzigCover-design: WMX Design GmbH, Heidelberg
SPIN 11874720 43/3100YL - 5 4 3 2 1 0 Printed on acid-free paper
Foreword
Capital, whether it originates from venture, public equity, private, or gov-ernment sources, continues to be biotech’s source of sustenance. In fact, access to financing can make or break a company, regardless of whether it has Nobel Prize winning science or a top-flight business school manage-ment team.
In order to attract capital there has to be a “value proposition” that is sufficiently engaging and well constructed that will not only capture the imagination of investors but also make them want to ultimately invest.
This book recognizes that there is no consent on how to apply valuation methodologies in life sciences. One of the complicating factors is that, compared to other industries, valuation of biotech innovation is much more demanding. The long 10-15-year development and clinical trials process still represents the main risks faced by any biotech company. Added to that is the fact that getting a drug across the regulatory goal line and receiving Food and Drug Administration approval (or other regulatory agency ap-proval in the United States or elsewhere in the world) for marketing is no longer good enough. Since the biotechnology industry is not isolated from the major influences affecting the overall healthcare industry, the reality of de facto healthcare cost controls will mean a significant reduction in “peak sales” for individual drugs. Science will no longer be the deciding factor; payor agents will play a far more activist role via reimbursement criteria, co-payment arrangements and similar rationing technologies. Reimburse-ment planning starts with clinical planning.
At the dawn of the biotechnology industry, early investors had very few metrics with which to base and compare their investment decisions and valuations of such fledgling companies as Amgen and Genentech were “negotiated events”. Investors bought into the hopes, dreams and expecta-tions that the scientists and entrepreneurs were selling.
Fast forward to today and the industry is still extolling those same hopes and dreams that its innovation can make a difference…meet an unmet medical need with a breakthrough therapeutic; create better crops; improve the environment, or protect the population from the threat of bioterrorism.
VI Foreword
By and large, the investment community and capital markets has liked what they have heard. For the comparative short 30-plus year history, this industry has attracted almost $400 billion. Capital continues to flow into biotechnology companies at incredible rates and this year alone we predict that a new milestone will be reached for the industry with $40 billion being invested in the United States alone. We have come a long way in a very short space of time.
Those of us who fund innovative, but relatively immature enterprises not only have to recognize the best-in-class companies but also understand how the future will unfold in the light of constant technology change. The maturing industry that is now melding its scientific entrepreneurship with the needs and culture of its larger commercial reality is an ever-increasing challenge. In the early days, the dream of an emerging biotechnology company was to become a fully integrated pharmaceutical company and lever its intellectual property portfolio into a stream of blockbuster drugs.
To demonstrate how dramatically this business model and landscape can change – the focus on a one-size fits-all blockbuster drug is a strategy that may have run its course. The best selling drug of 2020 is somewhere be-tween the bench and pre-clinic trials … but who knows if big Pharma, as we know it, will develop it. The successful companies of the future will be those that marry both molecular diagnostics with targeted drugs and deliver effec-tive personalized therapies. We are witnessing an unprecedented rate of evo-lution and transformation in the life sciences and healthcare. We are in an era of personalized medicine where the promise is compelling for the future of health care…personalized medicine offers earlier and more precise diag-noses, treatments tailored to the individual, reduction of side affects and ad-verse reactions to drugs, breakthroughs in treatment, and ultimately preven-tion of major diseases such as cancer, diabetes and Alzheimer’s.
On the other side of the ledger the move to a more personalized, predic-tive and preventive medicine (the three “P’s”) world that will revolutionalize the health care system, as we know it today, is challenging pharmaceutical and biotechnology companies alike to adapt. Up until recently, their focus has been on the discovery of blockbuster drugs. Now, with the conver-gence of IT and genomics, smarter drug delivery and “labs” on a chip are moving us down an inevitable path towards targeted personalized medicines – away from “blockbusterology” – and spotting “early warning” signs of impending health problems. Science is leading into a promising realm of new technologies such as theranostics, responder/non-responder effect of biomarkers, molecular diagnostics and the re-emergence of genomics and proteomics companies in an era of tougher regulations governing the safety of drugs with payors looking to decrease the costs of health care.
Foreword VII
Creating a successful and profitable biotechnology enterprise is there-fore just as complicated as the genetic and cellular innovations that the company is trying to commercialize. Conservative estimates tell us that a biotech company will need close to $2 billion (according to recent esti-mates) and at least 12-15 years before any patient receives its novel drug therapy and returns on this massive investment can be generated. Along the way, the company will face many challenges: For its product – nu-merous and stringent regulatory hurdles; for the corporation – fickle fi-nancial markets; product competition; rapidly changing technologies; and difficulties in recruiting and retaining skilled staff. Taking all these fac-tors into account small wonder that the chance of bringing a drug to mar-ket is about 1 in 1000!
Thus, as investors, we are taking a chance, it’s true, but we view this as a very necessary investment in the future of mankind – and that gives us courage. Also, there is an opportunity for moving the science forward into commercialization, and for creating value. This, of course, requires a tre-mendous amount of due diligence and dogged research, but those of us who have stayed with this industry for decades know that the effort is well worth it.
While, as investors we have the courage to be part of a better future our investment decisions have to be tempered with reality and on arriving at appropriately calculated valuations of the company’s worth … after all in-vestment comes at a price to the entrepreneur. As a long-time investor in life sciences and someone who has been involved in the process of “valua-tion” for many years this is where the rubber meets the road in the deal making process. Tension on both sides of the negotiation table might be ameliorated if there was one agreed on set of rules about what a piece of technology or biotech companies are actually worth.
The claim is made that the process of valuation in biotechnology is one part science and one part art. I would argue that there is a third essential ingredient, and perhaps the most important, and that is passion. Without it the biotechnology industry, perhaps would never have come into being.
Any assistance that can help us figure out, in a more rational way, the complexity of the “value proposition” will help both communities at the bargaining table reach more realistic valuations is welcomed. A company’s value lies in its potential to generate a stream of profits in the future. Profits can be generated from sales of drugs, services but also from up-front, milestone and royalty payments. All valuation exercises are based on determining a company’s future, which requires many assumptions such as: the state of the market targeted and the potential share obtainable; the
VIII Foreword
company’s intellectual property and its freedom to operate; third, the ability of management to deliver on the business plan; and fourthly, the absolute size of the financing and what’s needed to get to the next value inflection point. There is no “magic bullet” when it comes to valuation and it has remained a “black box” process for even the most seasoned in-vestment professionals.
The authors have, therefore, done an admirable job in setting out a roadmap for valuation in life sciences. They take us from this often times subjective operation to the more rational scientific process. The detailed worked examples are particular helpful in reducing the process into a more practical operation. This text will become a useful addition to the reference shelves of both the entrepreneur and investment professional alike and must reading for anyone contemplating raising investment capital.
G. Steven Burrill, November 2006 CEO, Burrill & Company San Francisco
Table of Contents
Foreword ................................................................................................... V
Abbreviations .......................................................................................... XI
Introduction................................................................................................1The Life Sciences Industry .....................................................................2
Academia............................................................................................2Biotech................................................................................................2Pharma................................................................................................3
Valuation ................................................................................................4The Role of Valuation ........................................................................4Current Problems in Valuation ...........................................................6
Fundamentals in Life Sciences..................................................................9Drug Development .................................................................................9
Drug Discovery ..................................................................................9Clinical Trials ...................................................................................10Value Drivers....................................................................................12
Medical Device Development and Approval........................................18Development and Approval in Europe .............................................18Development and Approval in the US..............................................18
Basics of Valuation...................................................................................21Introduction ..........................................................................................21Fundamentals........................................................................................21
Cash Flows .......................................................................................21Discounting.......................................................................................23
Valuation Methods ...............................................................................32Discounted Cash Flows Valuation ...................................................32Real Options .....................................................................................34Difference Between Real Options and Financial Options ................57
Valuation in Life Sciences .......................................................................65Discounting...........................................................................................65Volatility...............................................................................................69
X Table of Contents
Peak Sales ............................................................................................. 71Project Valuation .................................................................................. 73
Project Valuation with DCF ............................................................. 75Project Valuation with Real Options ................................................ 83Simulations of Projects..................................................................... 96
License Contract Valuation ................................................................ 105Structure of License Contracts ....................................................... 105Value Sharing ................................................................................. 111Valuation of License Contracts with Two Parties: DCF ................ 112Valuation of License Contracts with Two Parties: Real Options ... 120Simulation of License Contracts..................................................... 128
Early-Stage Licensing with Possible Sublicensing............................. 129Theory DCF.................................................................................... 133Theory Real Options....................................................................... 138
Negotiating License Deals.................................................................. 154Valuing Projects with Multiple Indications........................................ 160Valuing Projects with Multiple Markets............................................. 171Technology Valuation and Feed Rate................................................. 172IP Valuation........................................................................................ 173Pipeline Valuation .............................................................................. 181Portfolio Management ........................................................................ 183
Introduction .................................................................................... 183Qualitative Approaches .................................................................. 185Quantitative Approaches ................................................................ 185
Company and Stock Valuation ........................................................... 188Introduction to Company Valuation ............................................... 188Theory ............................................................................................ 190Interpretation of Valuation Results................................................. 202Simulation on Company Level ....................................................... 204Case Company Valuation ............................................................... 204Stock Valuation .............................................................................. 206
Exercises ................................................................................................. 215Introduction ........................................................................................ 215Exercises............................................................................................. 215Solutions ............................................................................................. 221
References............................................................................................... 241
Index ....................................................................................................... 243
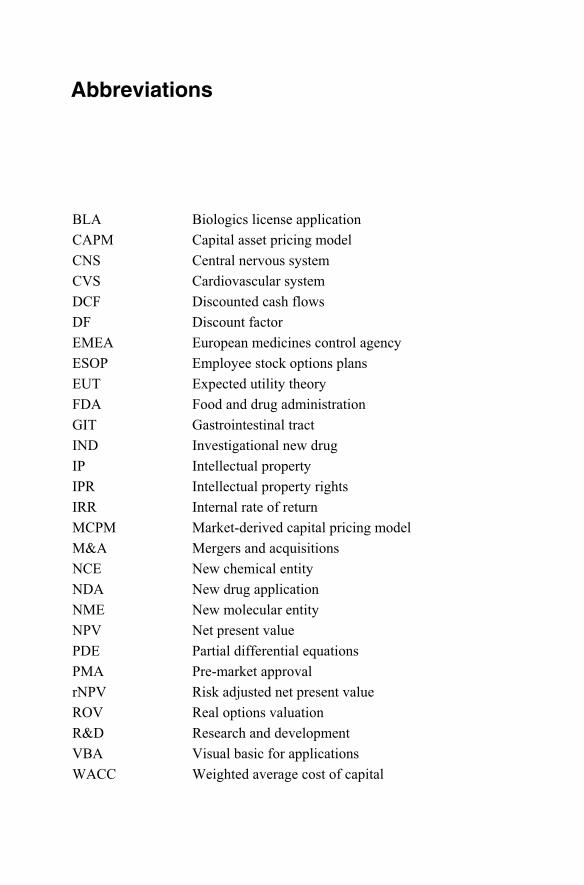
Abbreviations
BLA Biologics license application CAPM Capital asset pricing model CNS Central nervous system CVS Cardiovascular system DCF Discounted cash flows DF Discount factor EMEA European medicines control agency ESOP Employee stock options plans EUT Expected utility theory FDA Food and drug administration GIT Gastrointestinal tract IND Investigational new drug IP Intellectual property IPR Intellectual property rights IRR Internal rate of return MCPM Market-derived capital pricing model M&A Mergers and acquisitions NCE New chemical entity NDA New drug application NME New molecular entity NPV Net present value PDE Partial differential equations PMA Pre-market approval rNPV Risk adjusted net present value ROV Real options valuation R&D Research and development VBA Visual basic for applications WACC Weighted average cost of capital

Introduction
Valuation is a hot topic among life sciences professionals. There is no clear understanding on how to use the different valuation approaches and how to determine input parameters. Some do not value at all, arguing that it is not possible to get realistic and objective numbers out of it. Some claim it to be an art.
In the following chapters we will provide the user with a concise valua-tion manual, providing transparency and practical insight for all dealing with valuation in life sciences: project and portfolio managers, licensing execu-tives, business developers, technology transfer managers, entrepreneurs, in-vestors, and analysts. The purpose of the book is to explain how to apply discounted cash flow and real options valuation to life sciences projects, i.e. to license contracts, patents, and firms. We explain the fundamentals and the pitfalls with case studies so that the reader is capable of performing the valuations on his own and repeat the theory in the exercises.
The book is structured in five parts: In the first part, the introduction, we discuss the role of the players in the life sciences industry and their par-ticular interests. We describe why valuation is important to them, where they need it, and the current problems to it.
The second part deals with the input parameters required for valuation in life sciences, i.e. success rates, costs, peak sales and timelines.
The third part outlines the principles of valuation. The reader gets an overview of the essential tools for valuation. The theory outlined lays the foundation of discounted cash flows and real options valuation, the two most common methods to quantify life sciences projects.
The fourth part is the core of the book and guides the reader through theoretical aspects and practical applications of valuation in life sciences. We discuss the differences and the usability of DCF and ROV in valuation of projects, license contracts, technologies, IP, and firms and calculate the case studies in a way that the user can adapt and reproduce them in his own spreadsheets.
The last part of the book contains Excel exercises the reader can use as a template for future valuations.
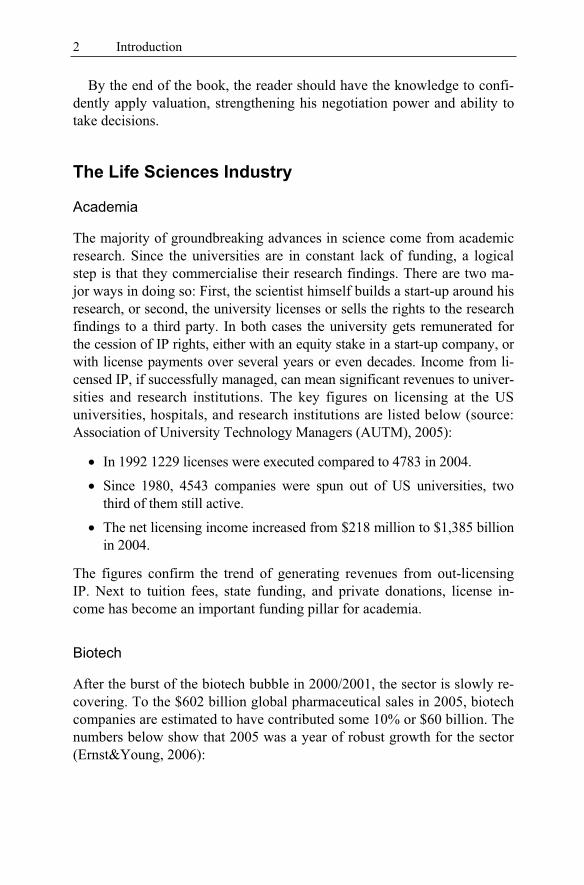
2 Introduction
By the end of the book, the reader should have the knowledge to confi-dently apply valuation, strengthening his negotiation power and ability to take decisions.
The Life Sciences Industry
Academia
The majority of groundbreaking advances in science come from academic research. Since the universities are in constant lack of funding, a logical step is that they commercialise their research findings. There are two ma-jor ways in doing so: First, the scientist himself builds a start-up around his research, or second, the university licenses or sells the rights to the research findings to a third party. In both cases the university gets remunerated for the cession of IP rights, either with an equity stake in a start-up company, or with license payments over several years or even decades. Income from li-censed IP, if successfully managed, can mean significant revenues to univer-sities and research institutions. The key figures on licensing at the US universities, hospitals, and research institutions are listed below (source: Association of University Technology Managers (AUTM), 2005):
In 1992 1229 licenses were executed compared to 4783 in 2004.
Since 1980, 4543 companies were spun out of US universities, two third of them still active.
The net licensing income increased from $218 million to $1,385 billion in 2004.
The figures confirm the trend of generating revenues from out-licensing IP. Next to tuition fees, state funding, and private donations, license in-come has become an important funding pillar for academia.
Biotech
After the burst of the biotech bubble in 2000/2001, the sector is slowly re-covering. To the $602 billion global pharmaceutical sales in 2005, biotech companies are estimated to have contributed some 10% or $60 billion. The numbers below show that 2005 was a year of robust growth for the sector (Ernst&Young, 2006):
The Life Sciences Industry 3
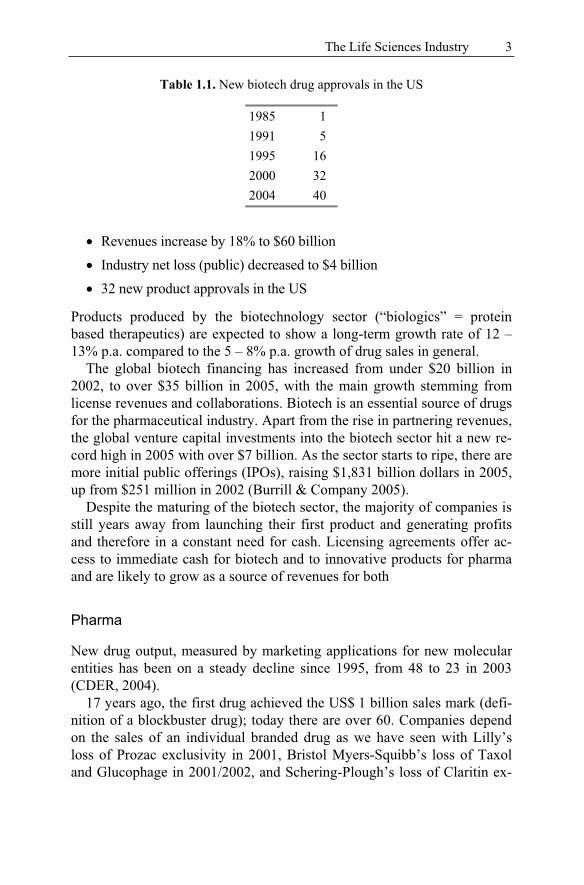
Table 1.1. New biotech drug approvals in the US
1985 1 1991 5 1995 16 2000 32 2004 40
Revenues increase by 18% to $60 billion Industry net loss (public) decreased to $4 billion 32 new product approvals in the US
Products produced by the biotechnology sector (“biologics” = protein based therapeutics) are expected to show a long-term growth rate of 12 – 13% p.a. compared to the 5 – 8% p.a. growth of drug sales in general.
The global biotech financing has increased from under $20 billion in 2002, to over $35 billion in 2005, with the main growth stemming from license revenues and collaborations. Biotech is an essential source of drugs for the pharmaceutical industry. Apart from the rise in partnering revenues, the global venture capital investments into the biotech sector hit a new re-cord high in 2005 with over $7 billion. As the sector starts to ripe, there are more initial public offerings (IPOs), raising $1,831 billion dollars in 2005, up from $251 million in 2002 (Burrill & Company 2005).
Despite the maturing of the biotech sector, the majority of companies is still years away from launching their first product and generating profits and therefore in a constant need for cash. Licensing agreements offer ac-cess to immediate cash for biotech and to innovative products for pharma and are likely to grow as a source of revenues for both
Pharma
New drug output, measured by marketing applications for new molecular entities has been on a steady decline since 1995, from 48 to 23 in 2003 (CDER, 2004).
17 years ago, the first drug achieved the US$ 1 billion sales mark (defi-nition of a blockbuster drug); today there are over 60. Companies depend on the sales of an individual branded drug as we have seen with Lilly’s loss of Prozac exclusivity in 2001, Bristol Myers-Squibb’s loss of Taxol and Glucophage in 2001/2002, and Schering-Plough’s loss of Claritin ex-
4 Introduction
clusivity in 2002. Analysts forecast that pharmaceutical revenues could fall US$ 40 billion short of investors’ expectations by 2007 due to patent expi-ries. More conservative estimates of drug sales lost to generics due to pat-ent expiry range from US$ 7 billion in 2004 to US$ 17 billion in 2007 (Lehmann Brothers, 2003)
Several factors have caused a decline in R&D output in the pharmaceu-tical industry (Ma et al. 2004). First, drug discovery has relied much more on new genomic screening strategies in the recent past. A myriad of new targets have been found this way, but these targets are not clinically vali-dated and thus have a much higher failure rate than existing targets. Zem-mel and Ma estimate the success rate of validated targets to be 50% higher. Second, regulatory obstacles are increasing. Recent scandals like Vioxx force the FDA to review their approval policy and will most likely lead to tougher regulatory requirements, finally increasing the cost of drug devel-opment. Third, the landscape in drug development is changing. Treatments are getting more efficacious and numerous. With more than 5,000 compa-nies in drug development to date, competition is fiercer; it requires better drugs to build a successful pipeline today than 20 years ago. Companies who missed the train struggle to get back on track.
The pharmaceutical sector has belonged to the most attractive industries over the last decade with yearly growth rates over 10%, but at present growth is slowing down. As the US, Europe, and Japan fight with rising health care costs and an increasing debt burden, the pharmaceutical indus-try experiences much more price pressure and will hardly be able to main-tain current growth rates. On the other hand, new markets are opening up. India and China offer a population of more than 2 billion persons. En-forcement of patent laws will allow fast growth in this area.
In the future, Biotech will play an essential role in fuelling the pipeline of big pharma. According to Ernst&Young, 66 biotech–pharma mergers took place in Europe in 2005 alone (Ernst&Young, 2005). The trend of in-licensing products from biotech and acquiring attractive companies will strengthen and might reach a point where, according to Novartis, 50% of the company’s products will derive from licensing.
Valuation
The Role of Valuation
Today, most academic institutions have an office for technology transfer, but only few of them possess the abilities to negotiate sustainable license
Valuation 5
income. The standard way to value a project relies on experience and gut feeling; often the first best offer is accepted. Later, when the project proves to be better than anticipated, the university tries to renegotiate deal terms. With simple and small deals this is negligible, but once a university starts to handle large contracts, small mistakes in the legal and financial structure of the deal mean a difference of millions of dollars to the university.
Research institutions with a long-standing licensing experience often have capable people with sound knowledge on valuation and deal structur-ing in their technology transfer office. These institutions succeed in gener-ating a respectable share of their research funding through licensing; other institutions of similar size, but with inexperienced personnel, do not make hardly any money with their inventions.
But even experienced licensing staff struggles to attribute the right value to a complicated license contract, as the contracts often include options and sublicensing clauses. The valuation is demanding and can only be per-formed using advanced methodologies, as we will show later. Neverthe-less, a clear understanding of the basics of valuation helps to value most of the license contracts with a rational framework and generates a sound ne-gotiation position for universities.
Biotech is often academia’s counterparty and must therefore be able to value the same contracts. In the following situations, biotech has to deal with valuation:
Fund raising Licensing Portfolio management M&A
Biotech often faces the question of the company’s value. When seeking to raise funds, as every biotech does, it has to be sure how much stake to give away in return of cash. Venture capitalists are tough partners in negotia-tions; a sound idea of the own company’s value is the prerequisite for the founders to keep a respectable stake in the company.
Licensing is the second situation where valuation plays a central role for biotech. Dealing with big pharma, biotech has to know the value of its compounds. While big pharma has experts for valuation and negotiation, in the biotech company the same person is in charge of fundraising and finding licensing partners. As these deals are vital for biotech, the com-pany’s management should not underestimate the importance of valuation. Pharma will not start negotiating without a solid valuation, based on thor-
6 Introduction
ough due diligence, showing the leeway of the negotiations; Biotech should follow that example.
The third application of valuation to biotech is portfolio management. For advanced biotech companies, knowing which projects generate value, and which do not, is key to success. In this regard, we should mention that those companies that only have one product in their pipeline do not need to value it. Abandoning the project would mean closing the company. M&A and IPOs are usually a smaller problem for biotech. Normally by that stage, companies have their advising investment bank performing the M&A and the IPO. But even an experienced investment bank does not guarantee the right valuation. The executive management of the biotech should at least un-derstand and agree on how the bank generated the proposed value.
Pharma, most often negotiating with biotech, encounters valuation in the same situations as biotech, sitting on the other side of the negotiation table. While biotech, being a young industry, often does not have the capabilities in valuation, pharma has its licensing, business development, or M&A team with all the necessary skills.
Current Problems in Valuation
At present, there is no consensus on how to apply valuation in life sci-ences. Due to inconsistent description and application of the different methods and input parameters, people feel insecure when applying valua-tion. Compared to other industries, valuation in life sciences is more de-manding due to the inherent complexity and length of R&D. Main con-cerns are the choice of the right valuation method, the methodology itself, the input parameters and the interpretation of the results.
Valuation methods and methodology. There are two major quantitative valuation approaches applied in the sector, DCF and real options. While DCF has been the gold standard for years, real options valuation is gaining grounds and is regarded as a possible alternative in life sciences. Both methods have their advantages and drawbacks. DCF, when applied to early stage projects, generally yields negative values; nevertheless the industry is profitable. Consequently, managers do not trust their valuations and dis-regard the recommendation retrieved from the valuations. Projects in early development are continued despite their negative DCF values. Often this translates into a general refusal of quantitative methods. As soon as it comes to licensing and M&A, the companies urgently need a valuation method that displays the correct value of early stage projects.
Valuation 7
Real options valuation on the other hand has been developed to over-come the shortfalls of DCF. It is still regarded as too complex and highly theoretic, compared to the easy to use DCF method. Today, there is no standard on how to apply the method to life sciences valuation. A multi-tude of different explanations and forms of real options do not facilitate its acceptance. This is partly attributable to the often repeated claim that real options should be treated like financial options. In fact, real options are just an expansion of DCF taking into account real flexibility of the man-agement. The inappropriate use of the Black-Scholes formula, the discount rate, or the volatility are a root for disagreement on real options and hinder a broader use of the method. Too many eye-catching but apparently wrong case studies severely harmed real options valuation’s image. Properly un-derstood and applied, the method represents the reality much better than DCF does, assuming that estimated input parameters for the valuation can change over time and that the management can react to this. We will dis-cuss the advantages and pitfalls of both methods in the life sciences sector and propose when and how to use DCF or real options.
Input parameters. Apart from the problem of using the right methodology, there is no consensus on how to define the essential input parameters in life sciences valuation. Mainly four parameters are problematic:
Discount rate
Costs
Success rate
Peak sales
The discount rate is not only a problem in life sciences; it is also a problem in valuation in general. It is the most important input factor with extreme impact on the valuation results. Unfortunately, the discount rate is to a large part not observable and relies mainly on theoretic models. Past and present methods to assess the discount rate have failed to generate consis-tent numbers. The CAPM, which has served as a basis for the determina-tion of the discount rate for almost five decades, does not deliver usable results for most life sciences companies. Moreover, it is of no use for early stage companies, not publicly listed. New methods like the market derived capital pricing model (MCPM) have evolved, but again do not yield appli-cable results in life sciences. We will outline alternative methods to define the discount rate.
8 Introduction
The second parameter posing difficulties are the costs. People not in-volved in everyday valuation will find it difficult to estimate the right costs of clinical trials and preclinical research, as well as of the post ap-proval phase. There are useful public sources for industry data that are often not known. Problematic is furthermore the differentiation between costs for small companies like early stage biotech and costs for big pharmaceutical companies. A thorough discussion of the essential num-bers for the life sciences sector will equip the user with a set of numbers for life sciences valuation.
The success rates, like the discount rate, have a tremendous impact on the valuation. Success rates and discount rates deal with risk and how to account for it in the valuation. People struggle with quantification of risk. The success rates need to be carefully chosen and adapted to the different valuation methods and sectors. A special chapter will explain in detail the success rates and the implications on DCF and real options valuation.
Peak sales, like the costs and the success rates, are a major value driver in the valuation, but hard to estimate. The assessment of sales potential for a product ten years from market is most often not more than a good guess. There needs to be a consistent way in how to define the sales figures, that unfortunately does not exist today. The reader will learn how to handle situations where peak sales are not predictable and practically apply the theory to the case studies.
Interpretation of results. Because of the above-discussed pitfalls, valuation results are not considered reliable and are not comparable. Ideally, valua-tion should yield reproducible numbers with the different methods allow-ing the user to base decisions on the outcome. Today this is not the reality. The case studies will instruct on the significance of the results and the sen-sitivity of the valuations on manipulation of input parameters.
The goal of the book is to serve as a roadmap for valuation in life sci-ence. The reader will know when to use the different valuation methods, how to choose the right input parameters, and most importantly, the reader will understand how to use the valuation results.
The reader can use the book to learn the fundamentals without prior knowledge in finance, valuation, or life science. Valuation professionals can focus on the theoretical and practical part to deepen their existing ex-pertise and to practice. The book includes advanced chapters for profes-sionals seeking advanced modeling concepts. These chapters should fuel new ideas in the industry.
Fundamentals in Life Sciences
In the following chapter the reader learns more about the data required for valuation in life sciences companies. We first discuss drug development and then medical device development. The chapter shall serve as a refer-ence for those readers not familiar with life science. For reasons of clarity, we have not included all publicly available data, but have generated a combination the user can apply to valuation.
Drug Development
Drug Discovery
Drug discovery following basic research can in most cases be broken down into four phases: Target identification, target validation, lead identification, and lead optimisation. In the following we briefly describe each phase for those readers not familiar with the topic.
Target identification: Biological research studies the basic cellular proc-esses in the healthy and pathologic state. By comparing these states, dis-ease responsible actors are identified as possible drug targets. These targets are mainly proteins, such as cell surface receptors. Once a target has been selected, its interacting partners, biologic, and biochemical function is ex-amined. A disease model is then set up and studied. Cultured human cells or animals such as mice serve as model.
Target validation: In search for the suitable target, each target for a given disease is compared to others and its potential in regulating biologic proc-esses is assessed. The most promising targets are selected for further drug development.
Hit identification: In the next step, compounds acting on the selected target and leading to the looked-for change are discovered and characterized. Usually large libraries consisting of thousands to millions of molecules are used. Compounds interacting with the target, leading to the looked-for
10 Fundamentals in Life Sciences
change, are selected, if present in the library. The identified compounds are called leads.
Lead optimisation: Lead optimisation is the stage during which medicinal chemists attempt to improve primary leads to achieve the best compromise between improved activity, bioavailability and safety. Often during this same stage of development, lead prioritisation studies are conducted in liv-ing organisms (in vivo) and in cells in the test tube (in vitro) to compare various lead compounds and how they are metabolised and affect the body. Once the optimised lead is chosen, it is taken to the last stage prior to hu-man testing, the preclinical studies.
Clinical Trials
Preclinical Testing: Once a lead compound is selected, its safety has to be tested in animals before human testing takes place. Preclinical tests in animals are designed to study the effect of the drug and its metabolites in the living organism. Toxicity, metabolic pathways, and excretion are stud-ied in detail. Preclinical studies are needed to see if the drug can safely be tested in humans, or if it causes dangerous toxicity. Due to the poor predic-tive value of current animal model, previously elaborated hypothesis on the mechanism of action often fail in this phase. It might be necessary to reformulate the drug, costing a lot of time.
When preclinical testing is done, several drugs that seemed promising are abandoned; the further development is stopped due to problems of poor absorption, toxicity or simply because the drug doesn’t work.
Clinical phase 1 trials: Phase 1 is the first phase of drug testing in humans. Phase 1 is conducted in a small group of healthy volunteers (20-80) and is designed to evaluate safety, dose range and side effects. The same ques-tions as in preclinical testing are now assessed in humans. Absorption of the drug (bioavailability) into the blood stream is studied, as well as the mechanism of action in men. This involves the assessment of biochemical and physiological effects of the drug, including the correlation of action and effect of the drug with its chemical structure. Furthermore, the safety profile of the drug is monitored and side effects are carefully studied and documented. A license, which is granted upon study of preclinical data, is required to start human drug trials. In the USA the Federal Drugs Agency (FDA), in Europe the European Medicine Controls Agency (EMEA) is re-sponsible for approval of human testing. In the US prior to starting human
Drug Development 11
clinical trials, an investigational new drug application (IND) must be filed to the FDA. Only if the IND is approved, clinical trial can start. In most countries, an independent committee, periodically reviewing results to en-sure proper conduct and respect of ethical issues, monitors human trials. If the drug shows no serious side effects and no toxicity, it can be taken to phase 1I trials. Phase 1 trials are often the endpoint for new drugs, as many fail to meet the expectations in men.
Clinical phase 2 trials: In phase 2 trials, the drug is studied in a group of people (100-300) having the disease to be treated. Clinical phase 2a studies are small studies to define the dose; phase 2b studies are designed to prove effectiveness. The goal of phase 2 trials is to show the proof-of-concept of the drug, i.e. that it is effective in the treatment of the target disease. Nev-ertheless, pharmacodynamics and pharmacokinetics need to be assessed again, as the drug effect might differ in the patient group from healthy vol-unteers. Special attention is needed in patients with impaired renal or liver function concerning the accumulation of the drug or its metabolites. An-other factor to be considered are the interactions between the drug under investigation and concomitant medications. In this stage, the drug might not show the wished effects in the patient group, which may mean the drug has to undergo modification or reformulation. However, in addition to all the absorption and excretion questions the drug also has to demonstrate a clear efficacy in the target patient group. New drugs often do not show a clear benefit over existing treatments in terms of efficacy, safety or deliv-ery and will therefore have less chance to be approved by regulatory au-thorities and fail when marketed. Thus, most companies decide not to con-tinue to develop a drug with poor efficacy at this point in testing.
Clinical phase 3 trials: If the drug looks promising at this stage, it is taken forward to large-scale phase 3 trials. The drug is tested in a large group of patients (500-20,000) with the condition to be treated. The main aim of this phase is to confirm the effectiveness of the treatment, to disclose any side effects, and to establish the right dosage for the future patient treat-ment. Questions to be answered are how effective the drug really is, whether it is more effective than other competing treatments on the mar-ket, and finally how should the patient labelling be.
Approval Phase: A company files a new drug application after successful clinical trials. The FDA or EMEA reviews the data and decides if the company is granted a marketing approval. Possibly, the regulatory author-
12 Fundamentals in Life Sciences
ity asks for further clinical trials or even rejects marketing approval. The time for reviewing the drug ranges from 1 to 2 years.
Phase 4 trials: Phase 4 trials are conducted after the drug has been launched. These trials give more information about long-term safety and efficacy of the drug. Alternative formulations, different dosage or new pa-tient populations are tested.
Value Drivers
Cost
In a recent study on the cost of drug development, DiMasi et al. estimate that it costs US$ 802 mn (year 2000 dollars, capitalised costs) to bring a new drug on the market (DiMasi et al. 2003). This figure includes all costs, including drug failures, and is a capitalised instead of discounted perspec-tive. Therefore, it is not appropriate as a starting point to estimate future expenditures in drug development. We cannot assume that a small biotech company will spend a couple of hundred million dollars to finally bring a drug to market. In the following, we will discuss the costs of drug devel-opment in more detail based on real life figures.
Lead optimisation: The costs for lead optimisation are very variable and depend on the size of the company. A smaller company spends US$ 0.5-6 mn (average US$ 2.5 mn), while large pharmaceutical companies spend US$ 3-8 mn (average US$ 6 mn).
Preclinical costs: The preclinical costs are again highly variable and de-pend as well on the company size. Small drug development firms spend US$ 1-9 mn (average US$ 3 mn), while the big pharmaceuticals spend 5-11 mn (average US$ 7 mn).
The costs for the clinical phases encompass all necessary expenses to conduct the trials, including project management, drug supplies, toxicol-ogy, investigator fees, or study design. The costs outlined below are an av-erage and vary according to the different disease groups, as certain studies are inherently more complex than others. Nevertheless, the costs are a good approximation to be used for the purpose of the valuation. Adjusting the patient number per phase for the different disease groups allows getting a more precise estimate of the costs. The costs furthermore represent a full clinical trial investigation. It is possible to conduct all those trials at less cost. Also, the costs for big pharma are higher than outlined below. DiMasi
Drug Development 13
can be used as a source for big pharma drug development costs. His fig-ures are not representative for young companies. A rule of thumb proposes that the drug development costs for biotech are a factor five smaller than what big pharma spends for the same phase.
Clinical phase 1 costs: The costs for an average phase 1 trial based on 100 patients excluding drug supply and non-clinical costs amounts to US$ 2 mn. If we include all costs, the expenditures for the phase 1 are US$ 4-5 mn.
Clinical phase 2 costs: Phase 2 costs for clinical expenditures are US$ 7-8 mn, and US$ 10-11 including non-clinical costs. This number is based on a trial with 300 patients. Smaller phase trial may cost less than $ 5 mn.
Clinical phase 3 costs: The clinical phase 3 is the most expensive phase as it involves the largest number of subjects. Average costs range from US$ 10-50 mn for the clinical trial costs and US$ 30-60 mn including non-clinical costs.
Approval costs: The approval cost including submission in the US and Europe are in the range of US$ 3 mn.
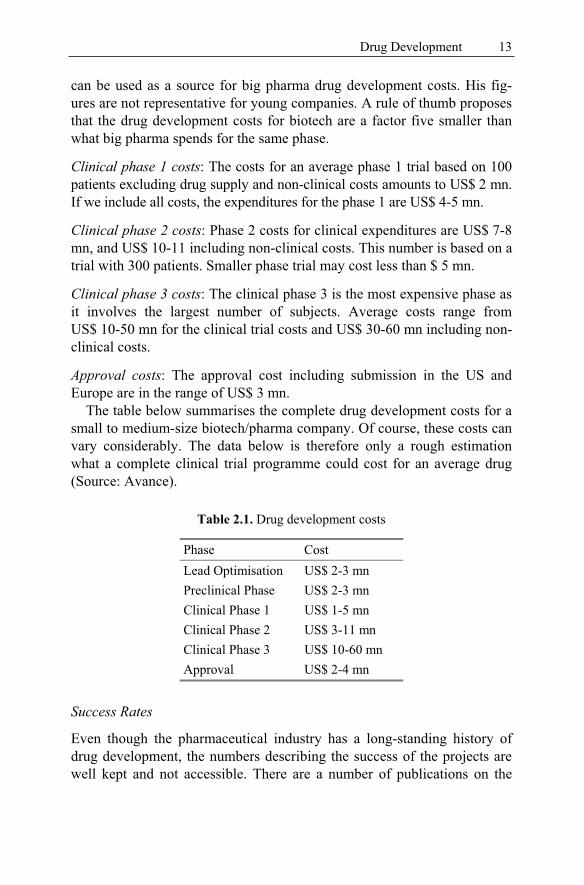
The table below summarises the complete drug development costs for a small to medium-size biotech/pharma company. Of course, these costs can vary considerably. The data below is therefore only a rough estimation what a complete clinical trial programme could cost for an average drug (Source: Avance).
Table 2.1. Drug development costs
Phase Cost Lead Optimisation US$ 2-3 mn Preclinical Phase US$ 2-3 mn Clinical Phase 1 US$ 1-5 mn Clinical Phase 2 US$ 3-11 mn Clinical Phase 3 US$ 10-60 mn Approval US$ 2-4 mn
Success Rates
Even though the pharmaceutical industry has a long-standing history of drug development, the numbers describing the success of the projects are well kept and not accessible. There are a number of publications on the
14 Fundamentals in Life Sciences
topic, most of which derive from the TUFTS Centre for the Study of Drug Development and which base mainly on data provided by big pharma.
The success rate is the chance that a project entering a development phase reaches the next phase. Success rates are assessed per phase and, once the drug is in clinical development, depend on the disease group. There are also major differences between the success rates of chemical and biological drugs.
The success rates for lead optimisation are 70%, and 65% for preclinical development for the average drug, independent of the disease group.
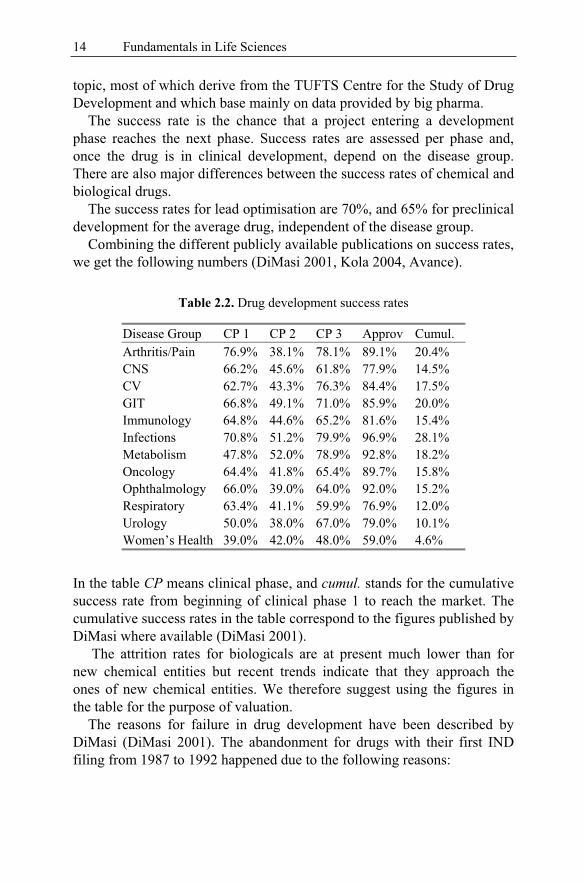
Combining the different publicly available publications on success rates, we get the following numbers (DiMasi 2001, Kola 2004, Avance).
Table 2.2. Drug development success rates
Disease Group CP 1 CP 2 CP 3 Approv Cumul. Arthritis/Pain 76.9% 38.1% 78.1% 89.1% 20.4% CNS 66.2% 45.6% 61.8% 77.9% 14.5% CV 62.7% 43.3% 76.3% 84.4% 17.5% GIT 66.8% 49.1% 71.0% 85.9% 20.0% Immunology 64.8% 44.6% 65.2% 81.6% 15.4% Infections 70.8% 51.2% 79.9% 96.9% 28.1% Metabolism 47.8% 52.0% 78.9% 92.8% 18.2% Oncology 64.4% 41.8% 65.4% 89.7% 15.8% Ophthalmology 66.0% 39.0% 64.0% 92.0% 15.2% Respiratory 63.4% 41.1% 59.9% 76.9% 12.0% Urology 50.0% 38.0% 67.0% 79.0% 10.1% Women’s Health 39.0% 42.0% 48.0% 59.0% 4.6%
In the table CP means clinical phase, and cumul. stands for the cumulative success rate from beginning of clinical phase 1 to reach the market. The cumulative success rates in the table correspond to the figures published by DiMasi where available (DiMasi 2001).
The attrition rates for biologicals are at present much lower than for new chemical entities but recent trends indicate that they approach the ones of new chemical entities. We therefore suggest using the figures in the table for the purpose of valuation.
The reasons for failure in drug development have been described by DiMasi (DiMasi 2001). The abandonment for drugs with their first IND filing from 1987 to 1992 happened due to the following reasons:
Drug Development 15
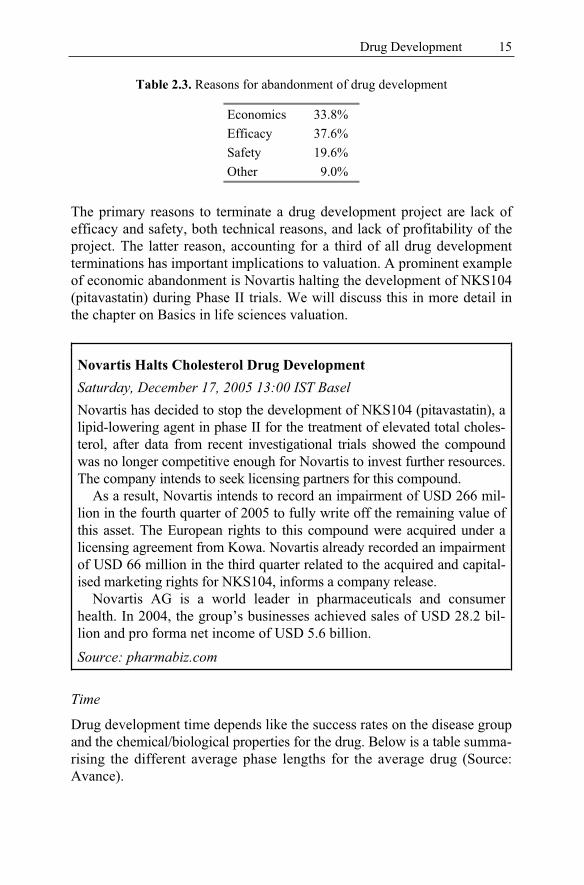
Table 2.3. Reasons for abandonment of drug development
Economics 33.8% Efficacy 37.6% Safety 19.6% Other 9.0%
The primary reasons to terminate a drug development project are lack of efficacy and safety, both technical reasons, and lack of profitability of the project. The latter reason, accounting for a third of all drug development terminations has important implications to valuation. A prominent example of economic abandonment is Novartis halting the development of NKS104 (pitavastatin) during Phase II trials. We will discuss this in more detail in the chapter on Basics in life sciences valuation.
Novartis Halts Cholesterol Drug Development Saturday, December 17, 2005 13:00 IST Basel Novartis has decided to stop the development of NKS104 (pitavastatin), a lipid-lowering agent in phase II for the treatment of elevated total choles-terol, after data from recent investigational trials showed the compound was no longer competitive enough for Novartis to invest further resources. The company intends to seek licensing partners for this compound.
As a result, Novartis intends to record an impairment of USD 266 mil-lion in the fourth quarter of 2005 to fully write off the remaining value of this asset. The European rights to this compound were acquired under a licensing agreement from Kowa. Novartis already recorded an impairment of USD 66 million in the third quarter related to the acquired and capital-ised marketing rights for NKS104, informs a company release.
Novartis AG is a world leader in pharmaceuticals and consumer health. In 2004, the group’s businesses achieved sales of USD 28.2 bil-lion and pro forma net income of USD 5.6 billion. Source: pharmabiz.com
Time
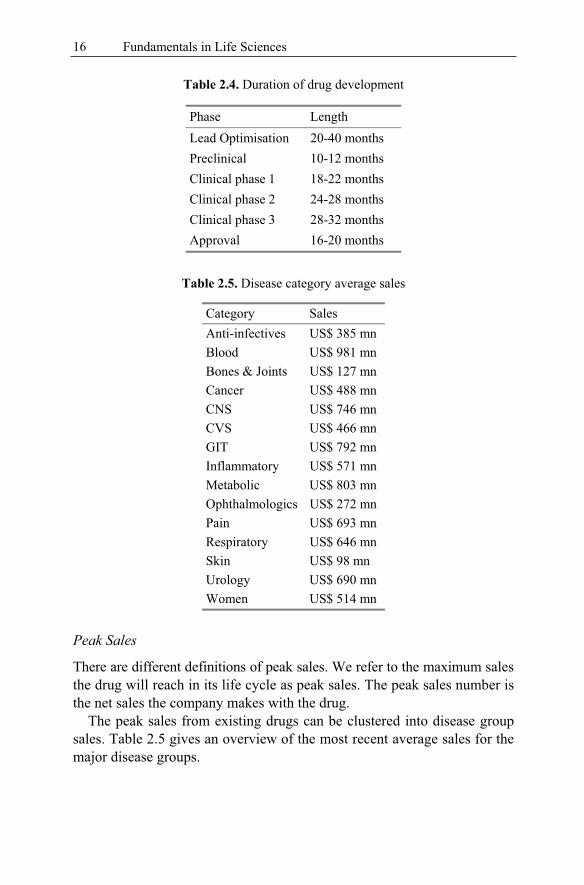
Drug development time depends like the success rates on the disease group and the chemical/biological properties for the drug. Below is a table summa-rising the different average phase lengths for the average drug (Source: Avance).
16 Fundamentals in Life Sciences
Table 2.4. Duration of drug development
Phase Length Lead Optimisation 20-40 months Preclinical 10-12 months Clinical phase 1 18-22 months Clinical phase 2 24-28 months Clinical phase 3 28-32 months Approval 16-20 months
Table 2.5. Disease category average sales
Category Sales Anti-infectives US$ 385 mn Blood US$ 981 mn Bones & Joints US$ 127 mn Cancer US$ 488 mn CNS US$ 746 mn CVS US$ 466 mn GIT US$ 792 mn Inflammatory US$ 571 mn Metabolic US$ 803 mn Ophthalmologics US$ 272 mn Pain US$ 693 mn Respiratory US$ 646 mn Skin US$ 98 mn Urology US$ 690 mn Women US$ 514 mn
Peak Sales
There are different definitions of peak sales. We refer to the maximum sales the drug will reach in its life cycle as peak sales. The peak sales number is the net sales the company makes with the drug.
The peak sales from existing drugs can be clustered into disease group sales. Table 2.5 gives an overview of the most recent average sales for the major disease groups.