Embed Size (px)
Citation preview
Portland, Oregon Chicago, Illinois New York, New York Washington, D.C. Atlanta, Georgia
Valuation of Intangible Assetsfor Fair Value Accounting Purposes
NACVA Illinois State Chapter MeetingFebruary 12, 2009
Presentation by:Robert F. Reilly
Pamela J. GarlandKevin M. Zanni
2Willamette Management Associates
Presentation Outline• Types of intangible assets• What is and isn’t an intangible asset• Reasons to value intangible assets• Intangible assets and generally accepted accounting
principles (GAAP)• Intangible assets and fair value measurements (FASB SFAS
No. 157) • Accounting for acquired intangible assets (FASB SFAS Nos.
141R, 142, and 144)• Intangible asset valuation approaches and methods• Intangible asset valuation illustrative examples• Questions and discussion
3Willamette Management Associates
Valuation Analyst Common Categorization of Intangible Assets
A valuation analyst’s common categorization of intangible assets:
1. Technology-related (e.g., engineering drawings, technical manuals and documentation, unpatented processes)
2. Customer-related (e.g., customer relationships, customer contracts, expected customer contract renewals)
3. Contract-related (e.g., favorable supplier contracts, franchises, permits, license agreements)
4. Data processing-related (e.g., computer software, automated data bases)
5. Human capital-related (e.g., trained and assembled workforce, employment agreements, noncompete agreements)
4Willamette Management Associates
Valuation Analyst Common Categorization of Intangible Assets (cont).
6. Marketing-related (e.g., advertising campaigns, product catalogs, promotional brochures)
7. Location-related (e.g., leasehold interests, water rights, air rights, easements, rights of way, mining and mineral exploitation rights)
8. Goodwill-related (e.g., goodwill, going concern value)9. Creative intellectual property (e.g., copyrights, trademarks
and trade names)10.Innovative intellectual property (e.g., patents, trade
secrets)
5Willamette Management Associates
Internal Revenue Code Section 197 Listing of Intangible Assets• Goodwill,• Going concern value,• Any of the following intangible items:
1.workforce in place,2.business books and records, operating systems, or any
other information base,3.any patent, copyright, formula, process, design, pattern,
know-how, format, or other similar item,4.any customer-based intangible,5.any supplier-based intangible, and any other similar
item
6Willamette Management Associates
Internal Revenue Code Section 197 Listing of Intangible Assets (cont.)• Any license, permit, or other right granted by a
governmental unit or any agency or instrumentality thereof,
• Any covenant not to compete entered into in connection with an acquisition of a trade or business, and
• Any franchise, trademark, or trade name.
7Willamette Management Associates
FASB SFAS No. 141R Listing of Intangible Assets• Marketing-related intangible assets
1.trademarks, trade names2.service marks, collective marks, certification marks3.trade dress (unique color, shape, or package design)4.newspaper mastheads5.Internet domain names6.noncompetition agreements
• Customer-related intangible assets1.customer lists2.order or production backlog3.customer contracts and related customer relationships4.noncontractual customer relationships
8Willamette Management Associates
FASB SFAS No. 141R Listing of Intangible Assets (cont.)• Artistic–related intangible assets (copyrights)
1.plays, operas, ballets2.books, magazines, newspapers, other literary works3.musical works such as compositions, song lyrics,
advertising jingles4.pictures, photographs5.video and audiovisual material, including motion
pictures, music videos, television programs
9Willamette Management Associates
FASB SFAS No. 141R Listing of Intangible Assets (cont.)• Contract-based intangible assets
1. licensing, royalty, standstill agreements2.advertising, construction, management, service or
supply contracts3. lease agreements4.construction permits5. franchise agreements6.operating and broadcast rights7.use rights such as drilling, water, air, mineral, timber
cutting, and route authorities8.servicing contracts such as mortgage servicing contracts9.employment contracts
10Willamette Management Associates
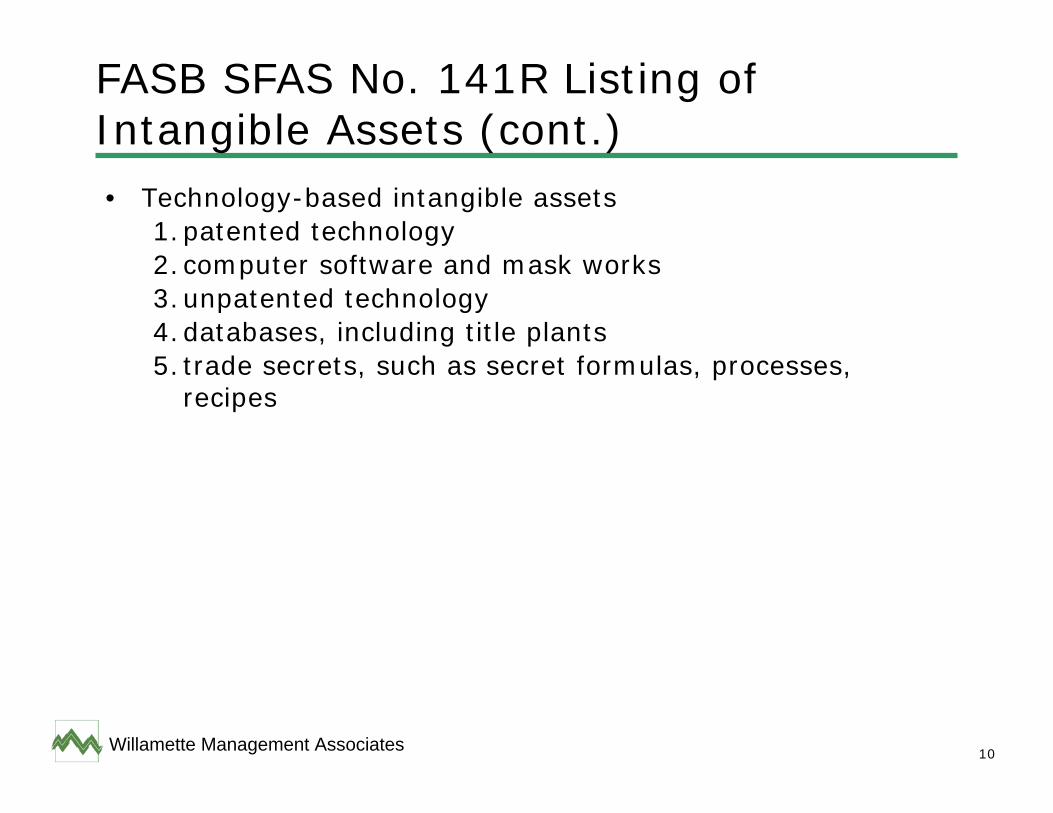
FASB SFAS No. 141R Listing of Intangible Assets (cont.)• Technology-based intangible assets
1.patented technology2.computer software and mask works3.unpatented technology4.databases, including title plants5.trade secrets, such as secret formulas, processes,
recipes
11Willamette Management Associates
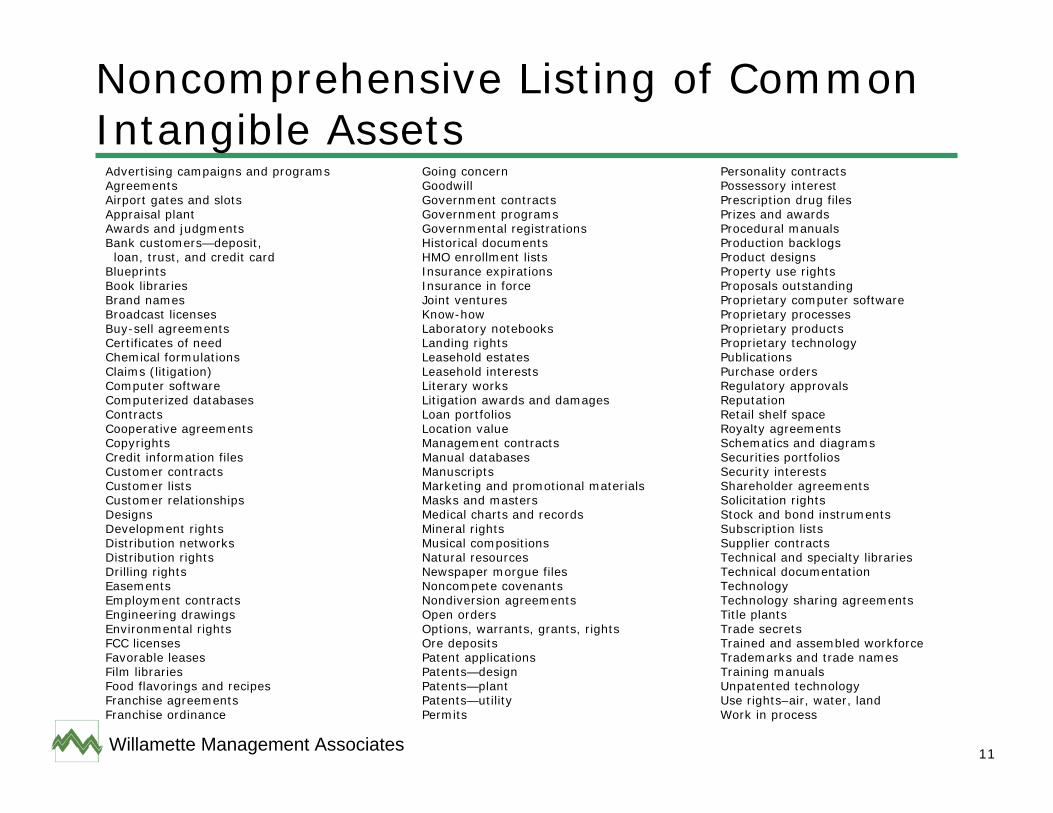
Noncomprehensive Listing of Common Intangible Assets
Advertising campaigns and programsAgreementsAirport gates and slotsAppraisal plantAwards and judgmentsBank customers—deposit, loan, trust, and credit card
BlueprintsBook librariesBrand namesBroadcast licensesBuy-sell agreementsCertificates of needChemical formulationsClaims (litigation)Computer softwareComputerized databasesContractsCooperative agreementsCopyrightsCredit information filesCustomer contractsCustomer listsCustomer relationshipsDesignsDevelopment rightsDistribution networksDistribution rightsDrilling rightsEasementsEmployment contractsEngineering drawingsEnvironmental rightsFCC licensesFavorable leasesFilm librariesFood flavorings and recipesFranchise agreementsFranchise ordinance
Going concernGoodwillGovernment contractsGovernment programsGovernmental registrationsHistorical documentsHMO enrollment listsInsurance expirationsInsurance in forceJoint venturesKnow-howLaboratory notebooksLanding rightsLeasehold estatesLeasehold interestsLiterary worksLitigation awards and damagesLoan portfoliosLocation valueManagement contractsManual databasesManuscriptsMarketing and promotional materialsMasks and mastersMedical charts and recordsMineral rightsMusical compositionsNatural resourcesNewspaper morgue filesNoncompete covenantsNondiversion agreementsOpen ordersOptions, warrants, grants, rightsOre depositsPatent applicationsPatents—designPatents—plantPatents—utilityPermits
Personality contractsPossessory interestPrescription drug filesPrizes and awardsProcedural manualsProduction backlogsProduct designsProperty use rightsProposals outstandingProprietary computer softwareProprietary processesProprietary productsProprietary technologyPublicationsPurchase ordersRegulatory approvalsReputationRetail shelf spaceRoyalty agreementsSchematics and diagramsSecurities portfoliosSecurity interestsShareholder agreementsSolicitation rightsStock and bond instrumentsSubscription listsSupplier contractsTechnical and specialty librariesTechnical documentationTechnologyTechnology sharing agreementsTitle plantsTrade secretsTrained and assembled workforceTrademarks and trade namesTraining manualsUnpatented technologyUse rights–air, water, landWork in process
12Willamette Management Associates
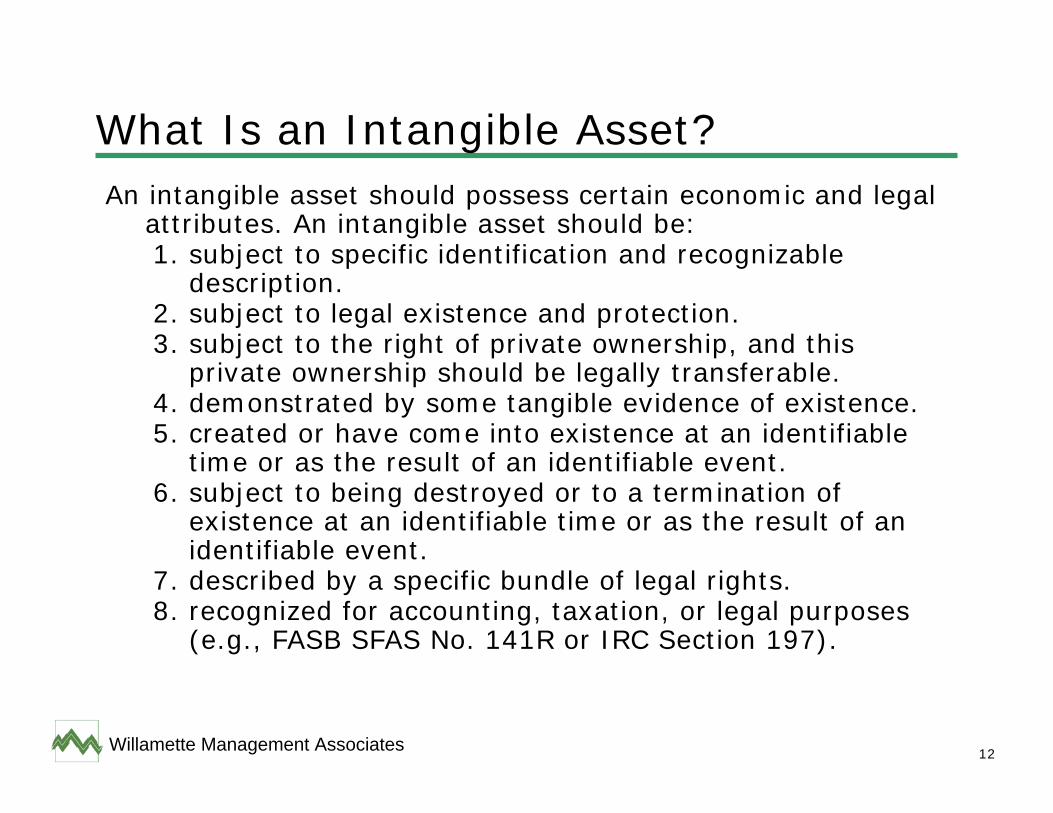
What Is an Intangible Asset?An intangible asset should possess certain economic and legal
attributes. An intangible asset should be:1. subject to specific identification and recognizable
description.2. subject to legal existence and protection.3. subject to the right of private ownership, and this
private ownership should be legally transferable.4. demonstrated by some tangible evidence of existence.5. created or have come into existence at an identifiable
time or as the result of an identifiable event.6. subject to being destroyed or to a termination of
existence at an identifiable time or as the result of an identifiable event.
7. described by a specific bundle of legal rights.8. recognized for accounting, taxation, or legal purposes
(e.g., FASB SFAS No. 141R or IRC Section 197).
13Willamette Management Associates
Intangible Asset Property Rights• Intangible asset property rights
– private ownership– title– transfer (sell, gift, etc.)– divide– legal protection– use (or not use)– possession– hypothecate
14Willamette Management Associates
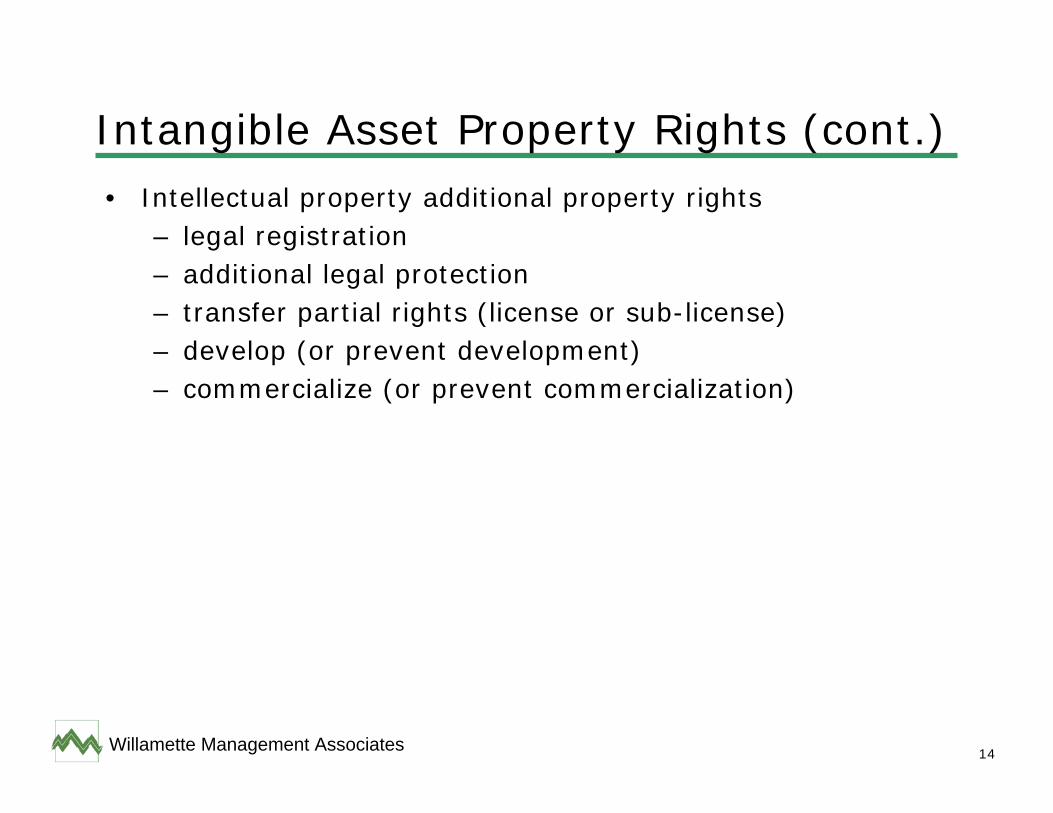
Intangible Asset Property Rights (cont.)• Intellectual property additional property rights
– legal registration– additional legal protection– transfer partial rights (license or sub-license)– develop (or prevent development)– commercialize (or prevent commercialization)
15Willamette Management Associates
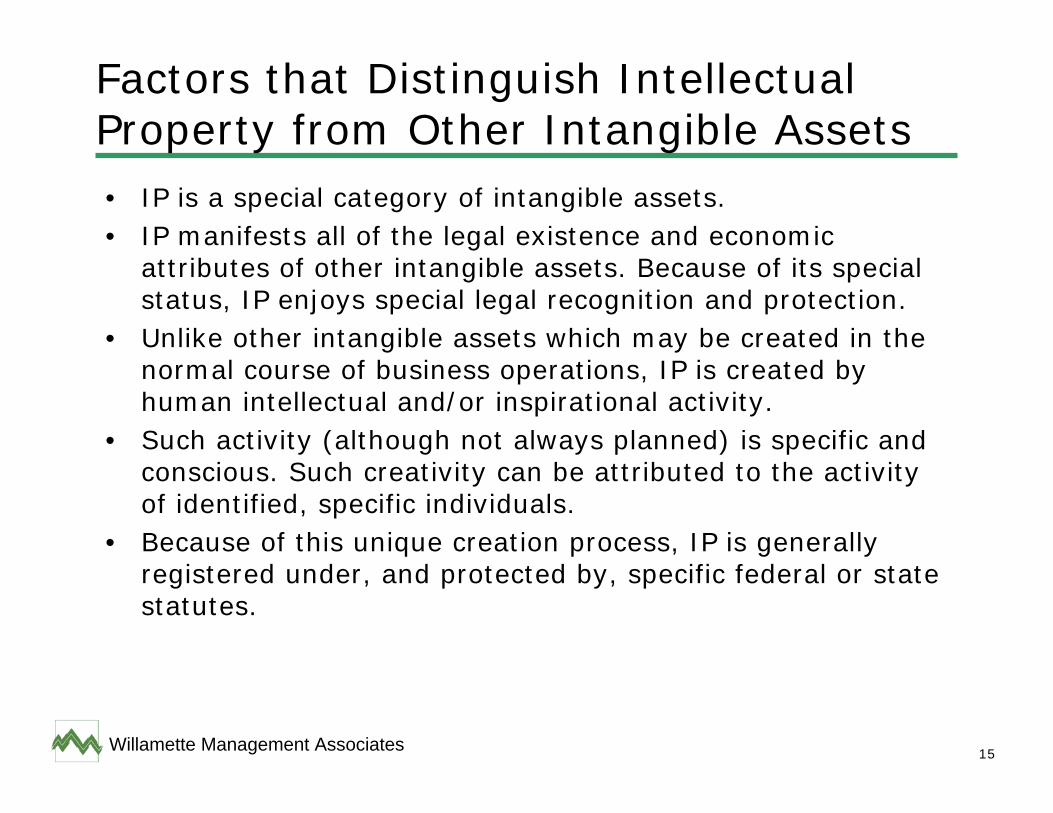
Factors that Distinguish Intellectual Property from Other Intangible Assets• IP is a special category of intangible assets.• IP manifests all of the legal existence and economic
attributes of other intangible assets. Because of its special status, IP enjoys special legal recognition and protection.
• Unlike other intangible assets which may be created in the normal course of business operations, IP is created by human intellectual and/or inspirational activity.
• Such activity (although not always planned) is specific and conscious. Such creativity can be attributed to the activity of identified, specific individuals.
• Because of this unique creation process, IP is generally registered under, and protected by, specific federal or state statutes.
16Willamette Management Associates
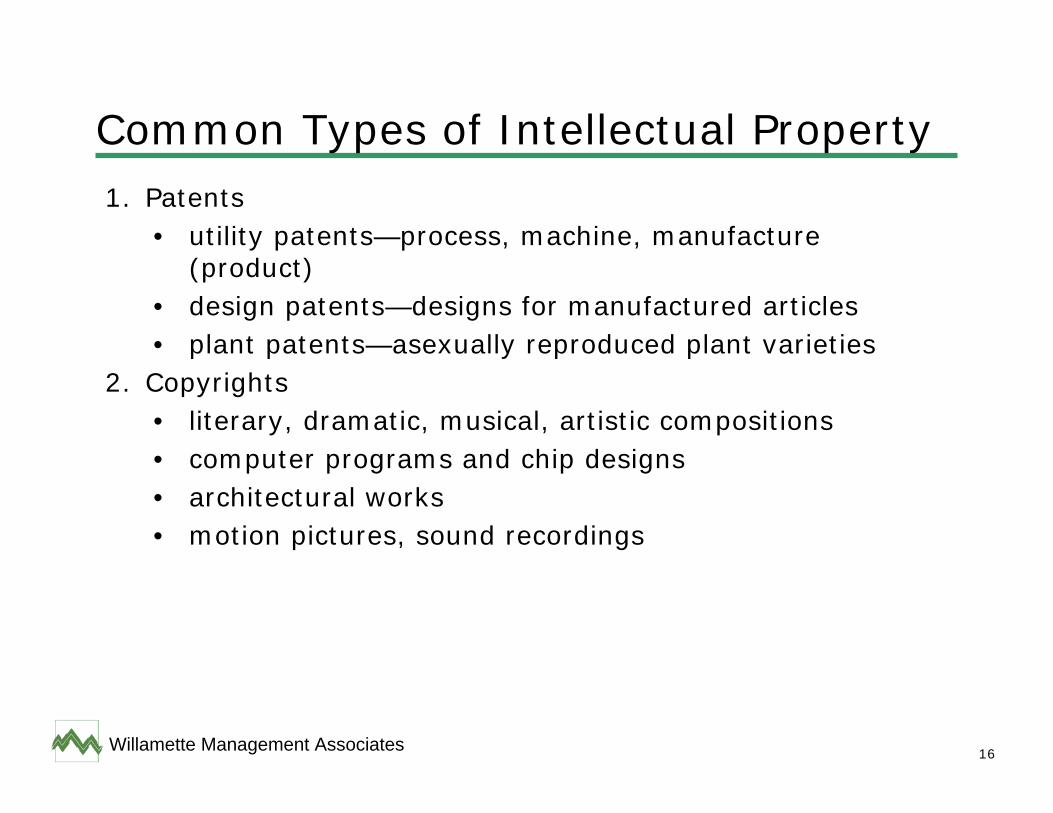
Common Types of Intellectual Property1. Patents
• utility patents—process, machine, manufacture (product)
• design patents—designs for manufactured articles• plant patents—asexually reproduced plant varieties
2. Copyrights• literary, dramatic, musical, artistic compositions• computer programs and chip designs• architectural works• motion pictures, sound recordings
17Willamette Management Associates
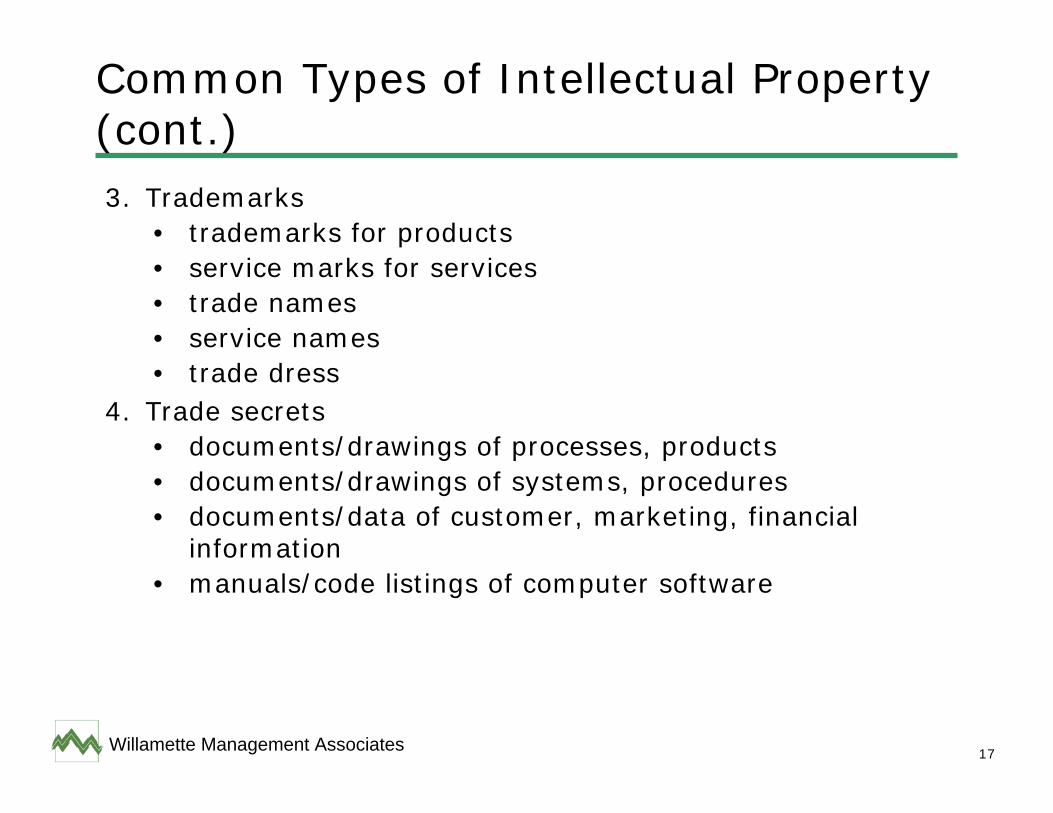
Common Types of Intellectual Property (cont.)3. Trademarks
• trademarks for products• service marks for services• trade names• service names• trade dress
4. Trade secrets• documents/drawings of processes, products• documents/drawings of systems, procedures• documents/data of customer, marketing, financial
information• manuals/code listings of computer software
18Willamette Management Associates
Intangible Asset Common Bundles of Legal/Ownership Rights• Fee simple interest• Term interest• Life interest• Residual interest• Licensee/licensor interest• Use rights• Development rights• Commercialization rights• Territorial rights• Sub-license rights
19Willamette Management Associates
What Isn’t an Intangible Asset?• Economic phenomena that do not have the economic or
legal attributes described previously are not intangible assets.
• Some economic phenomena are descriptive or expository in nature. They may describe conditions that contribute to the value of intangible assets.
• Some economic phenomena represent intangible influences on the value of either tangible assets or intangible assets.
20Willamette Management Associates
What Isn’t an Intangible Asset? (cont.)• Such “descriptive” economic phenomena include:
– high market share– high visibility– high profitability– lack of regulation (or a regulated environment)– monopoly position– market potential– first to market
• While these “descriptive” conditions do not qualify as an intangible asset, they may indicate that an intangible asset does exist and does have value.
21Willamette Management Associates
What are Intangible Influences?1. Intangible influences are not intangible assets.2. Intangible influences are not assets.3. Intangible influences are not recognized for accounting,
legal, taxation, or other purposes.4. Intangible influences may affect (and typically increase)
the value of tangible assets and intangible assets.5. Examples of intangible influences include:
• liquidity • view• diversification • curb appeal• risk limitation • proximity
6. While intangible influences may affect the value of intangible assets, they are not intangible assets.
22Willamette Management Associates
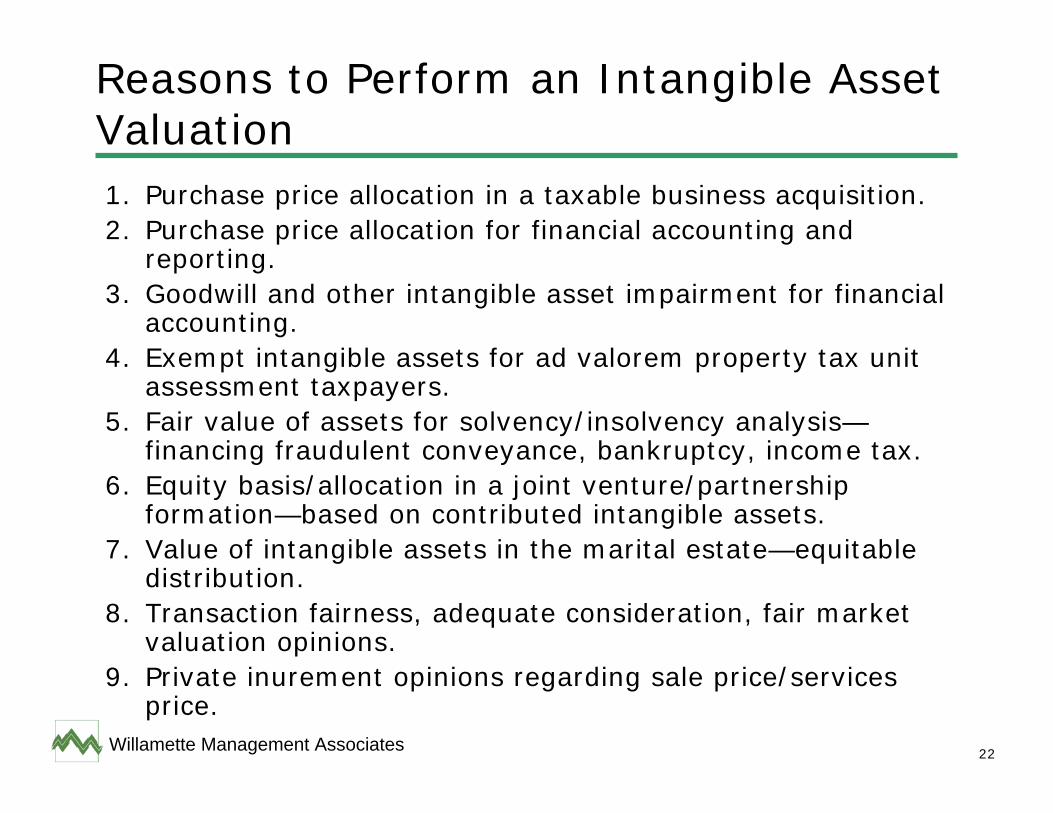
Reasons to Perform an Intangible Asset Valuation1. Purchase price allocation in a taxable business acquisition.2. Purchase price allocation for financial accounting and
reporting.3. Goodwill and other intangible asset impairment for financial
accounting.4. Exempt intangible assets for ad valorem property tax unit
assessment taxpayers.5. Fair value of assets for solvency/insolvency analysis—
financing fraudulent conveyance, bankruptcy, income tax.6. Equity basis/allocation in a joint venture/partnership
formation—based on contributed intangible assets.7. Value of intangible assets in the marital estate—equitable
distribution.8. Transaction fairness, adequate consideration, fair market
valuation opinions.9. Private inurement opinions regarding sale price/services
price.
23Willamette Management Associates
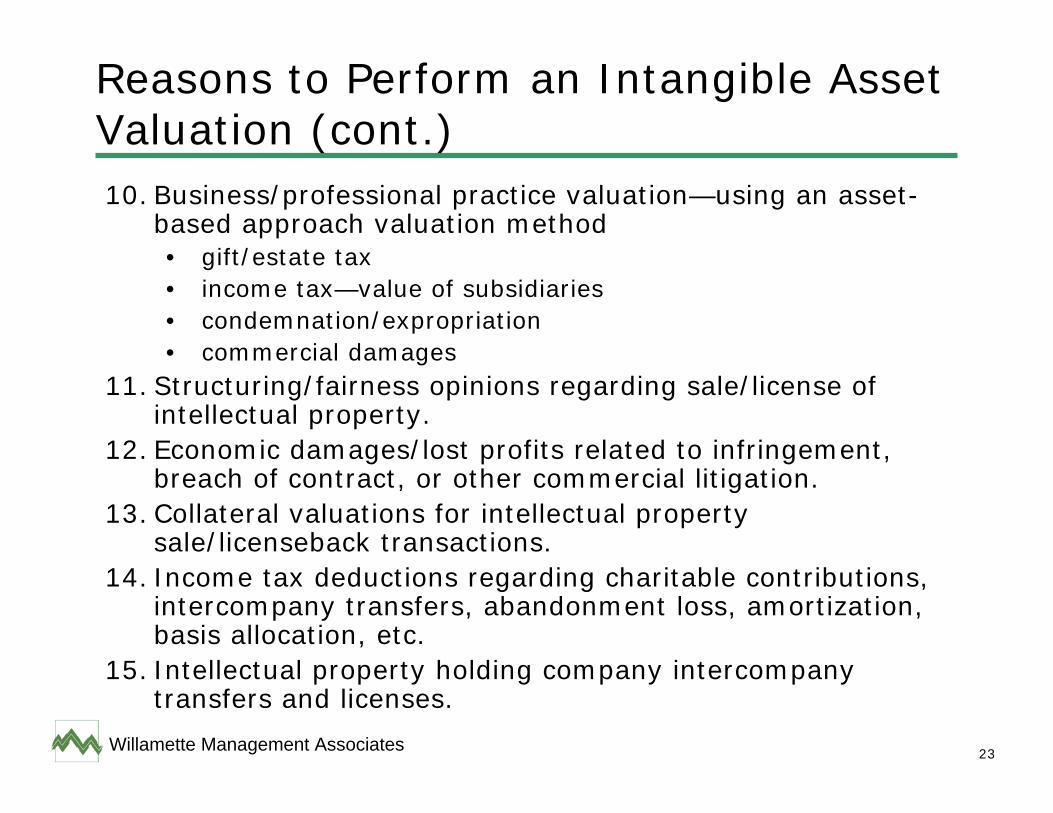
Reasons to Perform an Intangible Asset Valuation (cont.)10. Business/professional practice valuation—using an asset-
based approach valuation method• gift/estate tax• income tax—value of subsidiaries• condemnation/expropriation• commercial damages
11. Structuring/fairness opinions regarding sale/license of intellectual property.
12. Economic damages/lost profits related to infringement, breach of contract, or other commercial litigation.
13. Collateral valuations for intellectual property sale/licenseback transactions.
14. Income tax deductions regarding charitable contributions, intercompany transfers, abandonment loss, amortization, basis allocation, etc.
15. Intellectual property holding company intercompany transfers and licenses.
24Willamette Management Associates
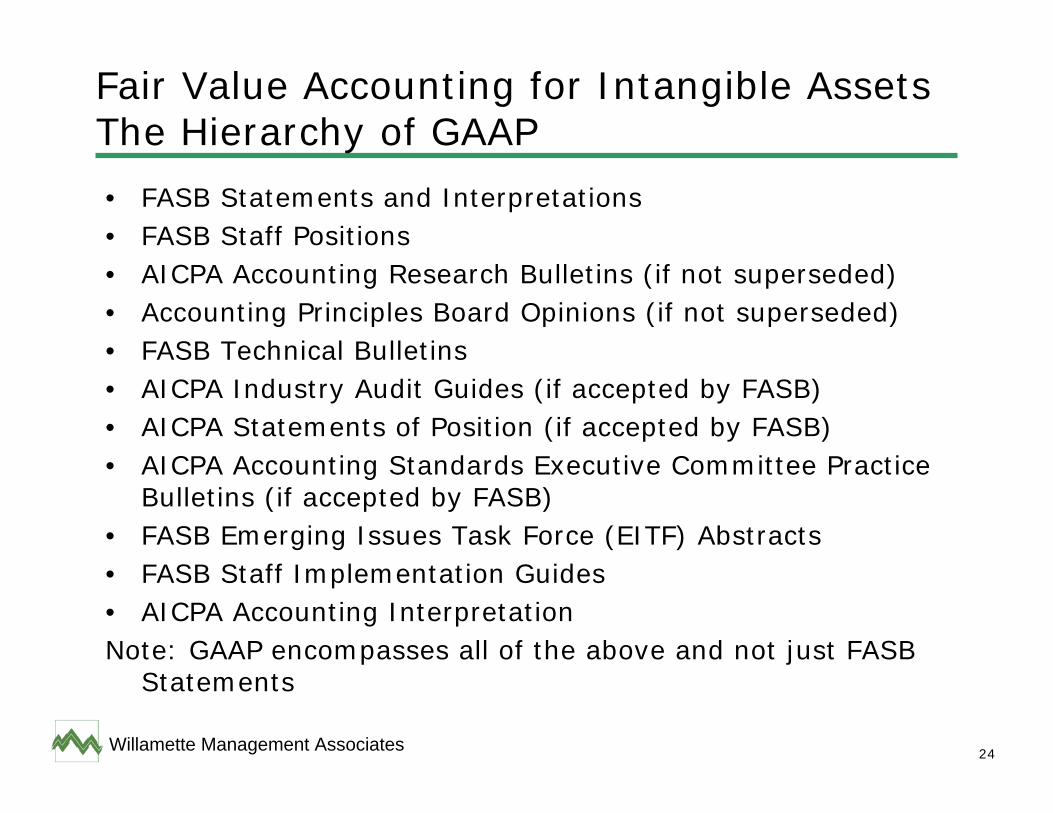
Fair Value Accounting for Intangible Assets The Hierarchy of GAAP
• FASB Statements and Interpretations• FASB Staff Positions• AICPA Accounting Research Bulletins (if not superseded)• Accounting Principles Board Opinions (if not superseded)• FASB Technical Bulletins• AICPA Industry Audit Guides (if accepted by FASB)• AICPA Statements of Position (if accepted by FASB)• AICPA Accounting Standards Executive Committee Practice
Bulletins (if accepted by FASB)• FASB Emerging Issues Task Force (EITF) Abstracts• FASB Staff Implementation Guides• AICPA Accounting InterpretationNote: GAAP encompasses all of the above and not just FASB
Statements
25Willamette Management Associates
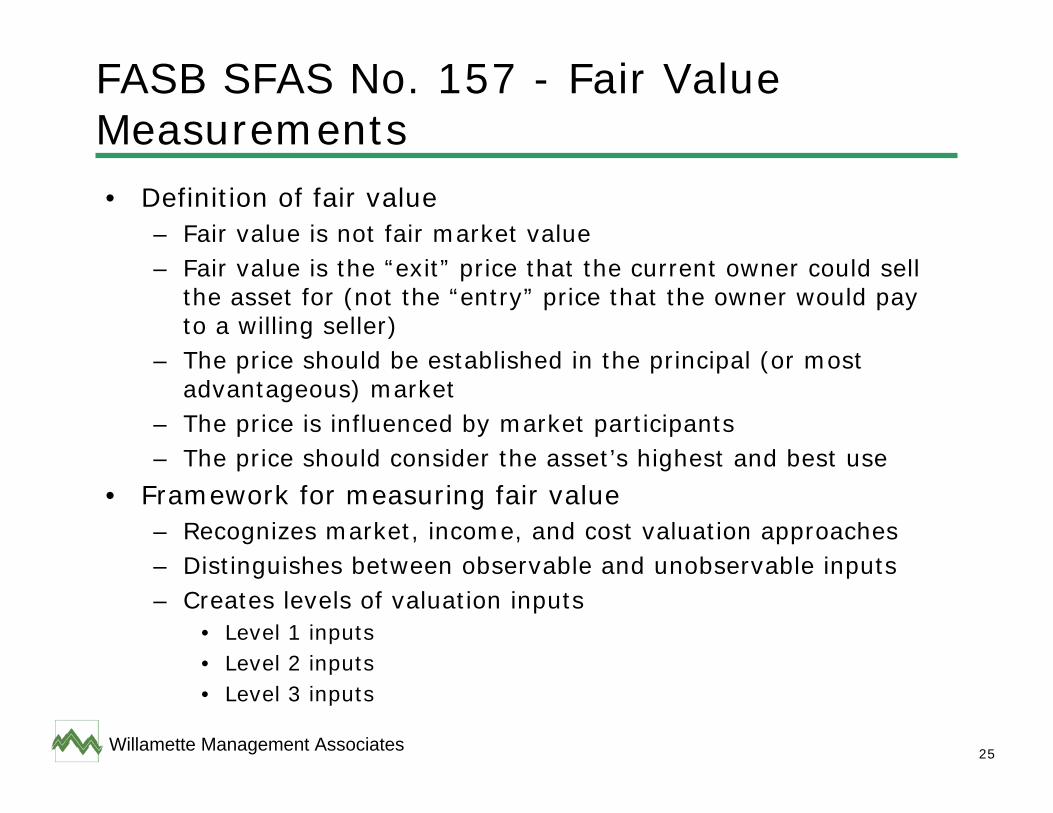
FASB SFAS No. 157 - Fair Value Measurements• Definition of fair value
– Fair value is not fair market value– Fair value is the “exit” price that the current owner could sell
the asset for (not the “entry” price that the owner would pay to a willing seller)
– The price should be established in the principal (or most advantageous) market
– The price is influenced by market participants– The price should consider the asset’s highest and best use
• Framework for measuring fair value– Recognizes market, income, and cost valuation approaches– Distinguishes between observable and unobservable inputs– Creates levels of valuation inputs
• Level 1 inputs• Level 2 inputs• Level 3 inputs
26Willamette Management Associates
FASB SFAS No. 157 - Fair Value Measurements (cont.)• Expands disclosures regarding fair value measurements• Applicable to all GAAP that currently requires fair value
measurements, but does not expand the requirements for fair value measurement
27Willamette Management Associates
FASB Statements Related to Intangible Asset Valuation Analyses• SFAS No. 141R (revised 2007)
Business Combinations• SFAS No. 142
Goodwill and Other Intangible Assets• SFAS No. 144
Accounting for the Impairment or Disposal of Long-Lived Assets
28Willamette Management Associates
SFAS No. 141R – Business Combinations• Applies only to business combinations but only to the acquired
company• Based on the acquisition method (previously called the purchase
method) of accounting• Purchase price is cash paid plus liabilities assumed plus contingent
consideration• Recognize identifiable assets that are either:
– Capable of being separately sold, transferred, licensed, rented, or exchanged either individually or with other assets, or
– Arising from a contractual or legal right regardless of whether the rights are separable or transferable
• Measures goodwill acquired or gain on a bargain sale—both as a residual
• Recognizes five categories of intangible assets– Marketing intangible assets– Customer intangible assets– Artistic intangible assets– Contract intangible assets– Technology intangible assets
29Willamette Management Associates
SFAS No. 142 – Goodwill and Other Intangible Assets• Provides guidance on post-recognition accounting for
goodwill and other intangible assets• Allows for the amortization of intangible assets with a
determinable remaining useful life (RUL)• Provides for the impairment loss of intangible assets not
subject to amortization• Provides for the annual test of goodwill impairment• Goodwill impairment test is conducted at the reporting unit
level• Goodwill impairment is based on the reporting unit business
value
30Willamette Management Associates
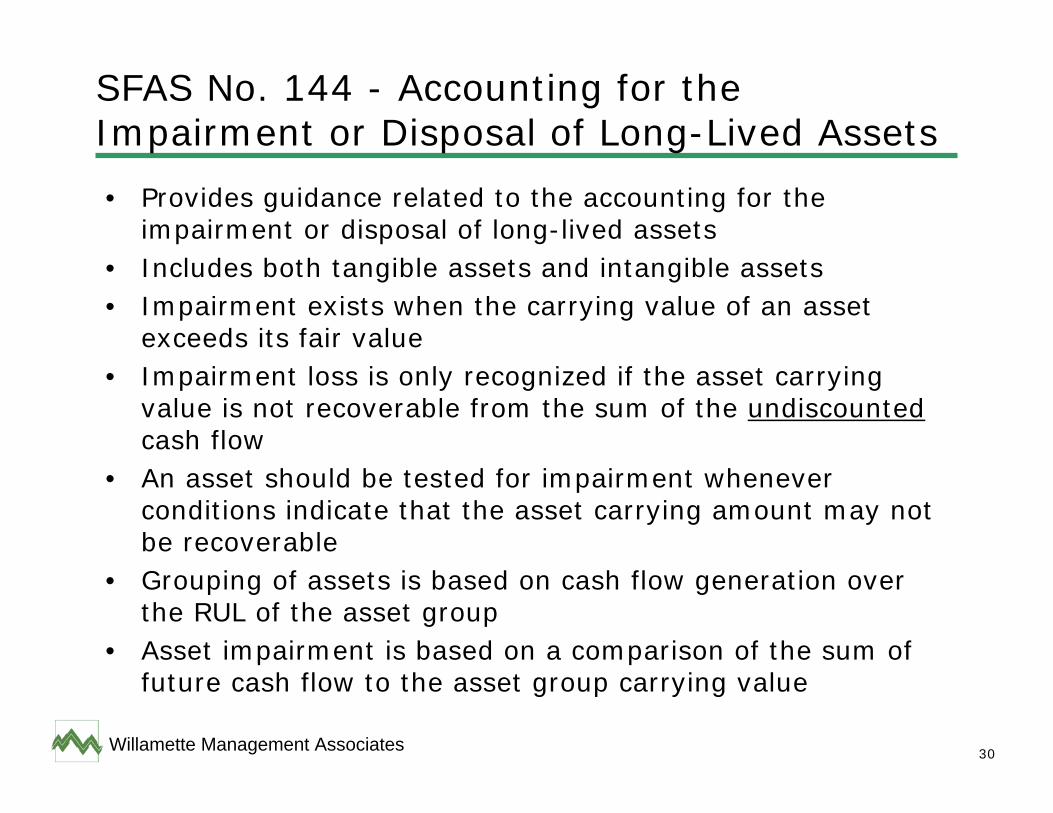
SFAS No. 144 - Accounting for the Impairment or Disposal of Long-Lived Assets
• Provides guidance related to the accounting for the impairment or disposal of long-lived assets
• Includes both tangible assets and intangible assets• Impairment exists when the carrying value of an asset
exceeds its fair value• Impairment loss is only recognized if the asset carrying
value is not recoverable from the sum of the undiscountedcash flow
• An asset should be tested for impairment whenever conditions indicate that the asset carrying amount may not be recoverable
• Grouping of assets is based on cash flow generation over the RUL of the asset group
• Asset impairment is based on a comparison of the sum of future cash flow to the asset group carrying value
31Willamette Management Associates
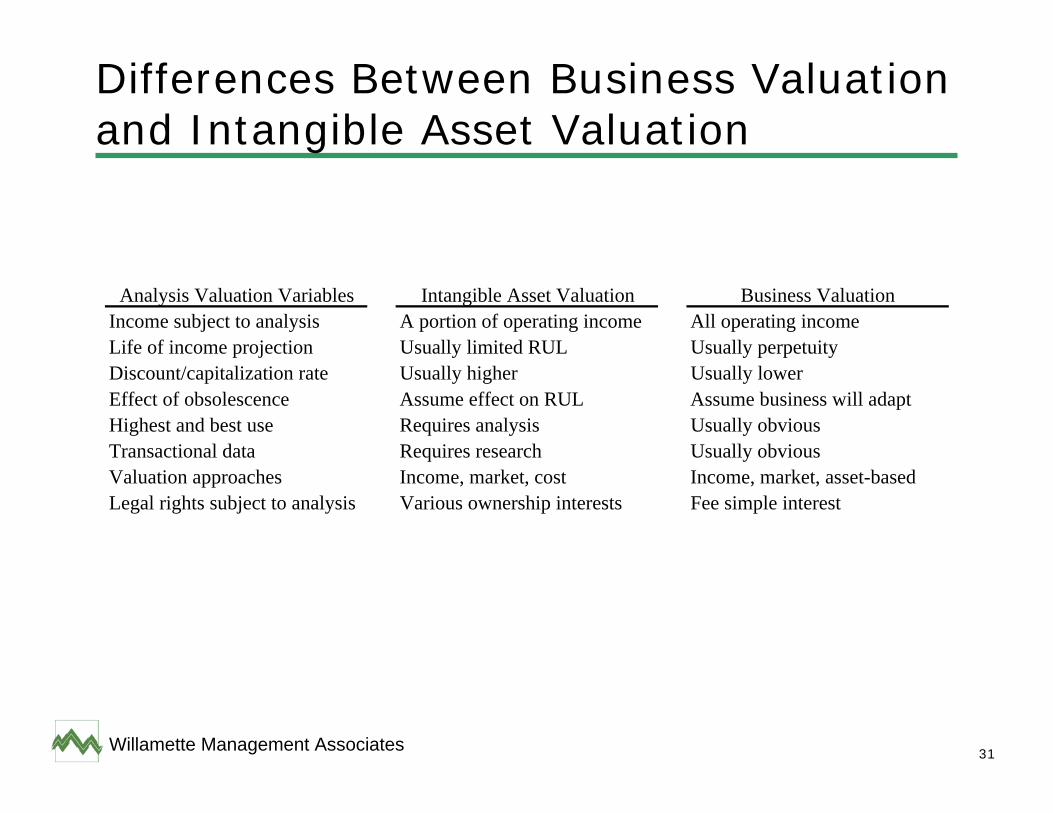
Differences Between Business Valuation and Intangible Asset Valuation
Analysis Valuation Variables Intangible Asset Valuation Business ValuationIncome subject to analysis A portion of operating income All operating incomeLife of income projection Usually limited RUL Usually perpetuityDiscount/capitalization rate Usually higher Usually lowerEffect of obsolescence Assume effect on RUL Assume business will adaptHighest and best use Requires analysis Usually obviousTransactional data Requires research Usually obviousValuation approaches Income, market, cost Income, market, asset-basedLegal rights subject to analysis Various ownership interests Fee simple interest
32Willamette Management Associates
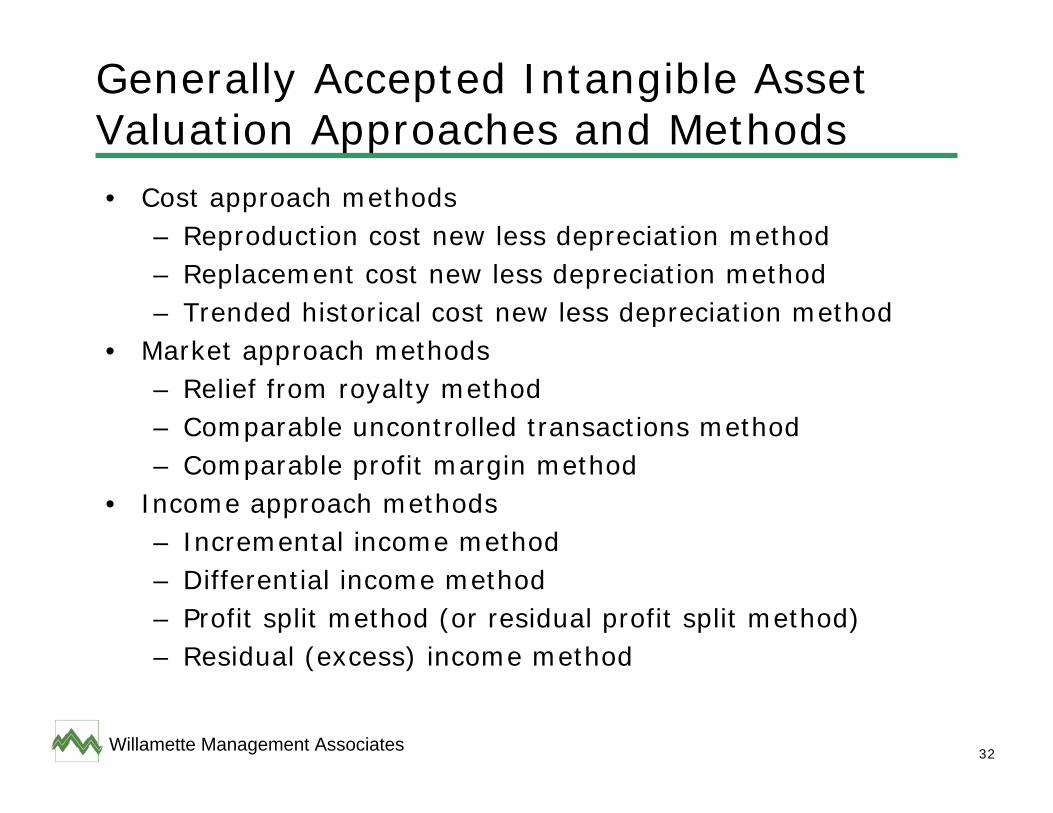
Generally Accepted Intangible Asset Valuation Approaches and Methods• Cost approach methods
– Reproduction cost new less depreciation method– Replacement cost new less depreciation method– Trended historical cost new less depreciation method
• Market approach methods– Relief from royalty method– Comparable uncontrolled transactions method– Comparable profit margin method
• Income approach methods– Incremental income method– Differential income method– Profit split method (or residual profit split method)– Residual (excess) income method
33Willamette Management Associates
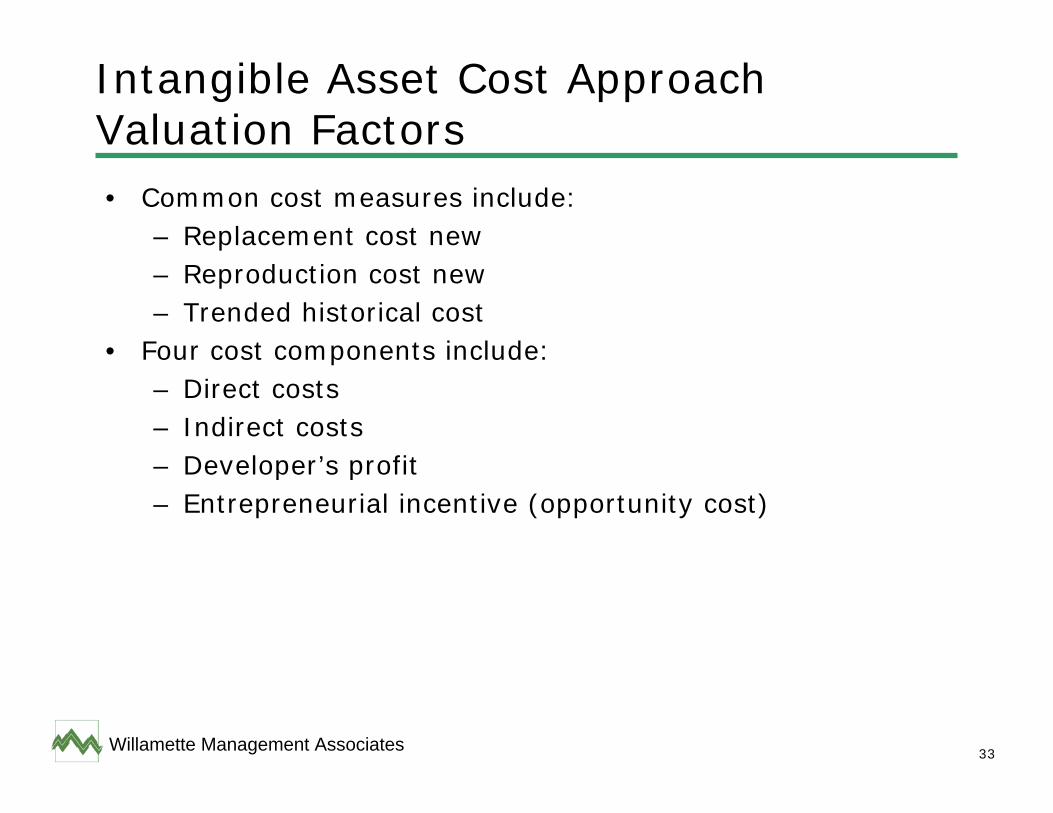
Intangible Asset Cost Approach Valuation Factors• Common cost measures include:
– Replacement cost new– Reproduction cost new– Trended historical cost
• Four cost components include:– Direct costs– Indirect costs– Developer’s profit– Entrepreneurial incentive (opportunity cost)
34Willamette Management Associates
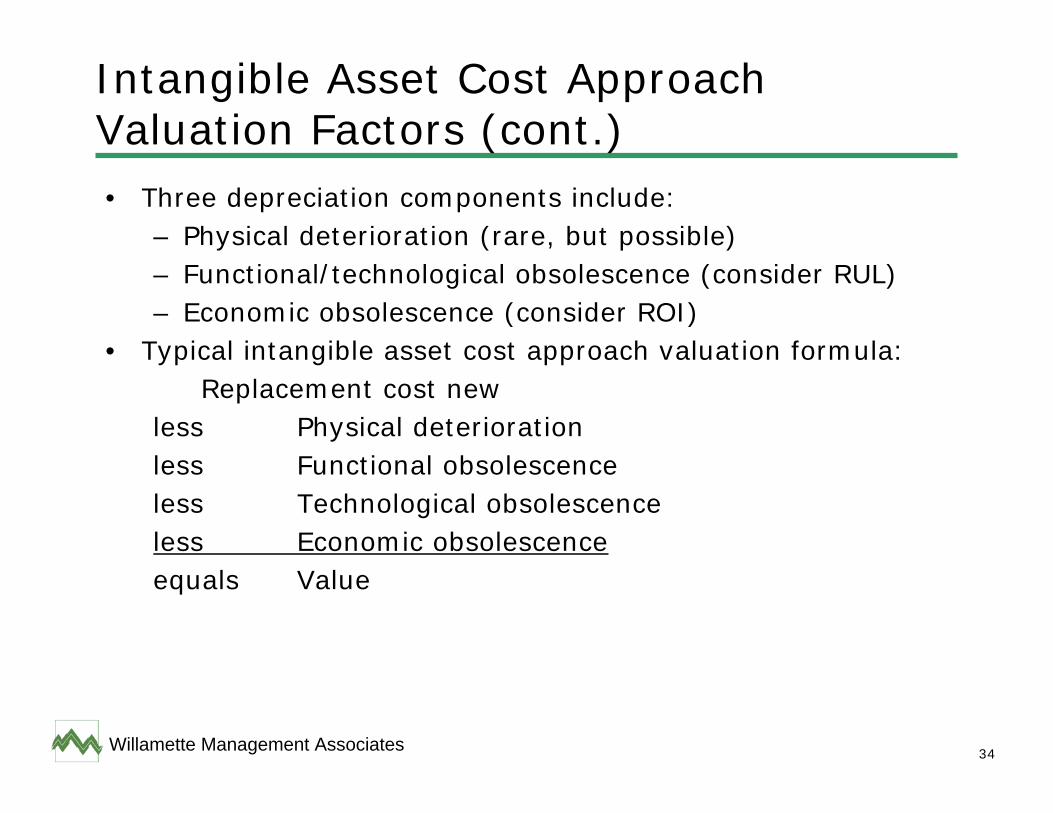
Intangible Asset Cost Approach Valuation Factors (cont.)• Three depreciation components include:
– Physical deterioration (rare, but possible)– Functional/technological obsolescence (consider RUL)– Economic obsolescence (consider ROI)
• Typical intangible asset cost approach valuation formula:Replacement cost new
less Physical deteriorationless Functional obsolescenceless Technological obsolescenceless Economic obsolescenceequals Value
35Willamette Management Associates
Intangible Asset Cost Approach Valuation Factors (cont.)• Cost approach valuation considerations:
– Capture all cost components– Consider the state of competition– Include all obsolescence components
36Willamette Management Associates
Cost Approach Methods• Cost approach methods analyze intangible asset utility
characteristics.• The cost approach is most useful when the intangible asset
is relatively new.• The cost approach is often used to estimate value of
fungible or “backroom” intangible assets where there is1. little potential for sale or license2.no directly associated income stream
37Willamette Management Associates
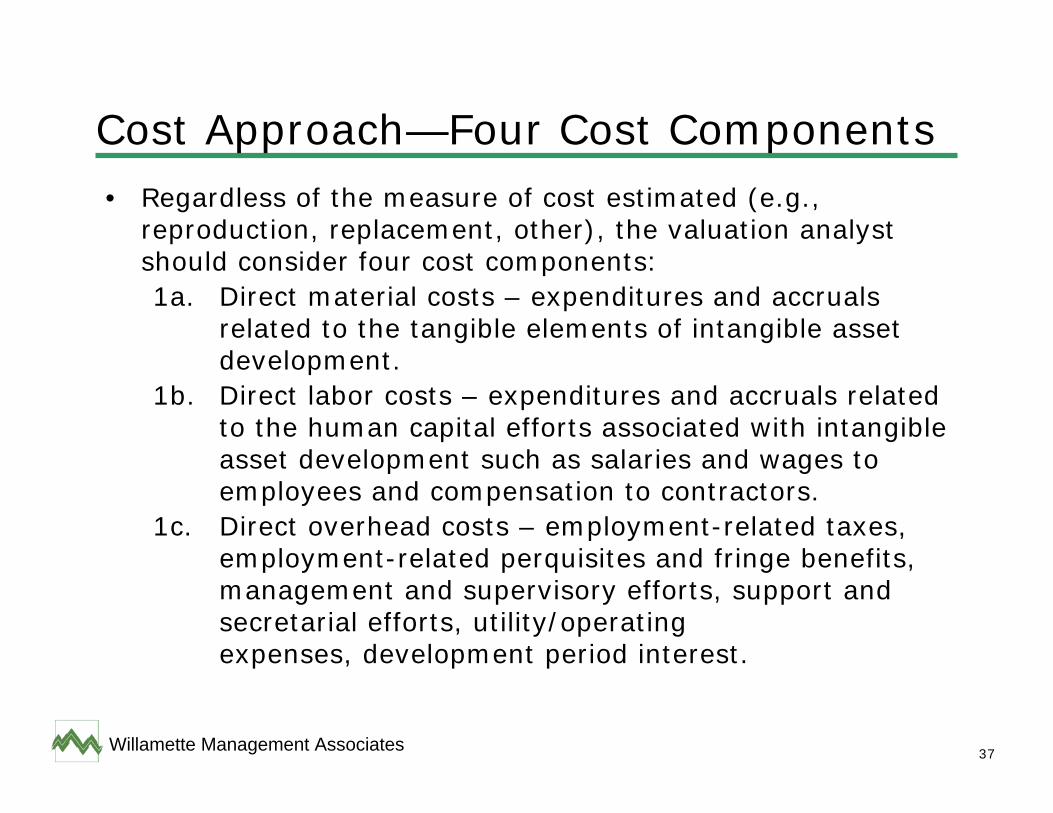
Cost Approach—Four Cost Components• Regardless of the measure of cost estimated (e.g.,
reproduction, replacement, other), the valuation analyst should consider four cost components:1a. Direct material costs – expenditures and accruals
related to the tangible elements of intangible asset development.
1b. Direct labor costs – expenditures and accruals related to the human capital efforts associated with intangible asset development such as salaries and wages to employees and compensation to contractors.
1c. Direct overhead costs – employment-related taxes, employment-related perquisites and fringe benefits, management and supervisory efforts, support and secretarial efforts, utility/operating expenses, development period interest.
38Willamette Management Associates
Cost Approach—Cost Components (cont.)
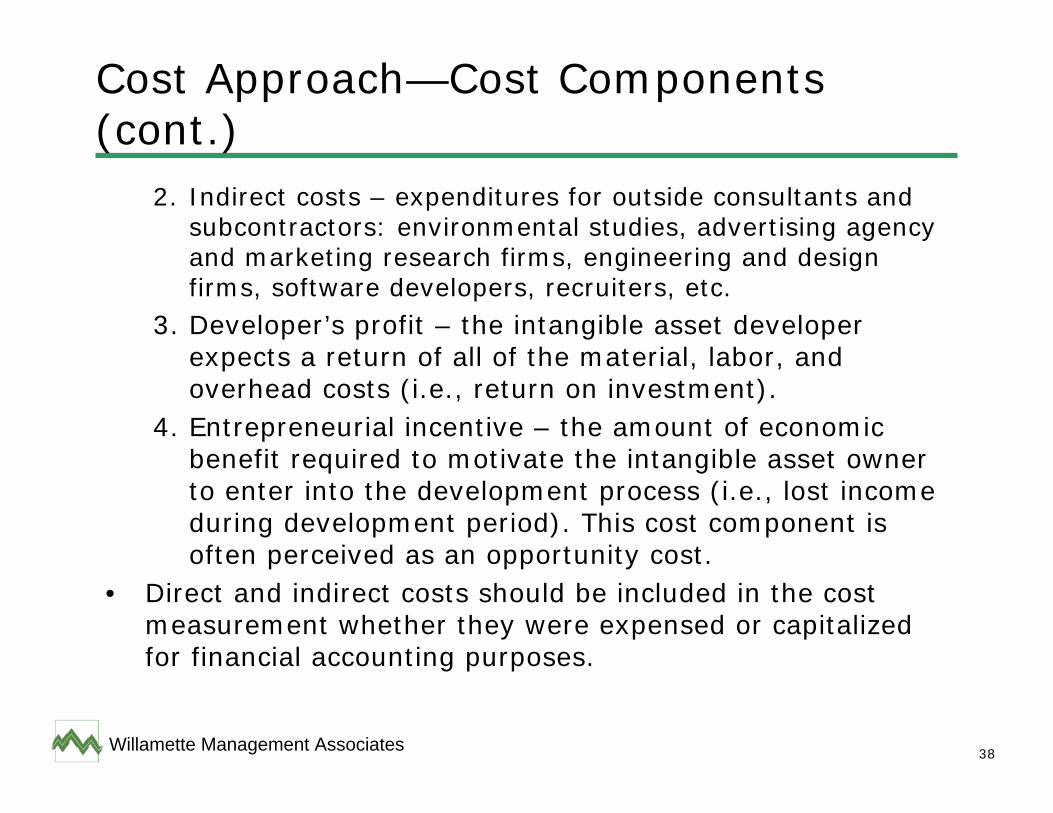
2. Indirect costs – expenditures for outside consultants and subcontractors: environmental studies, advertising agency and marketing research firms, engineering and design firms, software developers, recruiters, etc.
3. Developer’s profit – the intangible asset developer expects a return of all of the material, labor, and overhead costs (i.e., return on investment).
4. Entrepreneurial incentive – the amount of economic benefit required to motivate the intangible asset owner to enter into the development process (i.e., lost income during development period). This cost component is often perceived as an opportunity cost.
• Direct and indirect costs should be included in the cost measurement whether they were expensed or capitalized for financial accounting purposes.
39Willamette Management Associates
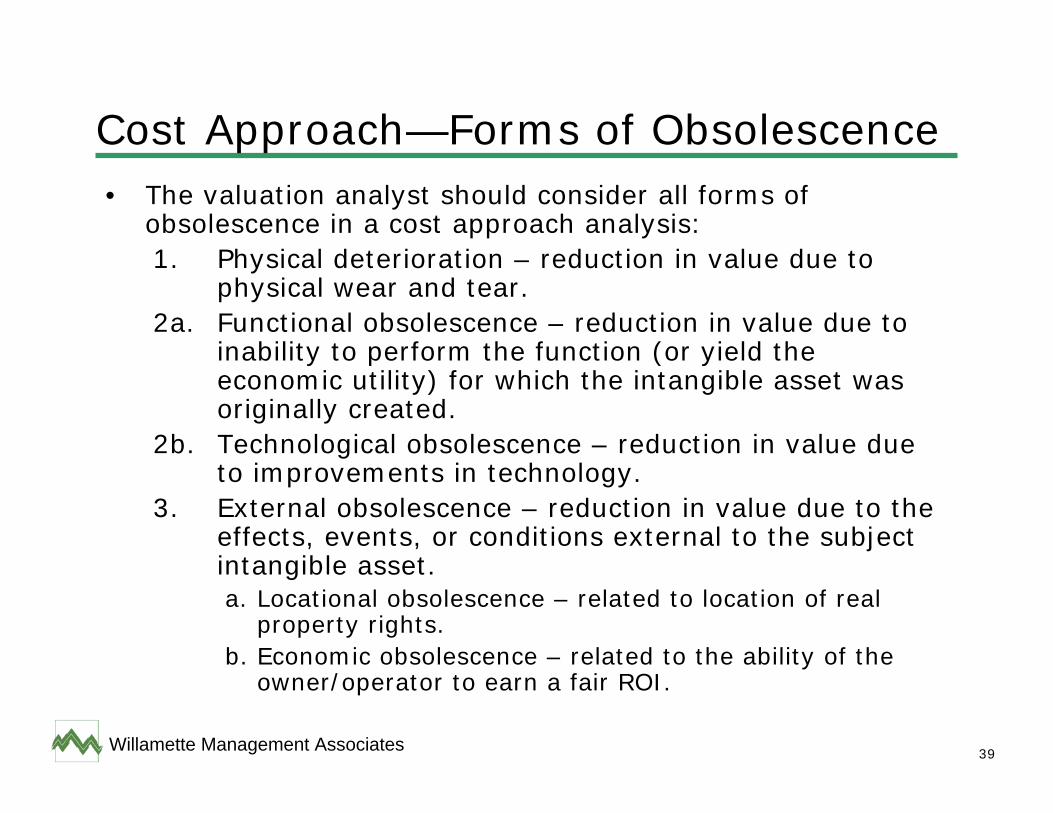
Cost Approach—Forms of Obsolescence• The valuation analyst should consider all forms of
obsolescence in a cost approach analysis:1. Physical deterioration – reduction in value due to
physical wear and tear.2a. Functional obsolescence – reduction in value due to
inability to perform the function (or yield the economic utility) for which the intangible asset was originally created.
2b. Technological obsolescence – reduction in value due to improvements in technology.
3. External obsolescence – reduction in value due to the effects, events, or conditions external to the subject intangible asset.a. Locational obsolescence – related to location of real
property rights.b. Economic obsolescence – related to the ability of the
owner/operator to earn a fair ROI.
40Willamette Management Associates
Functional Obsolescence• Excess development costs compares the cost to create the
subject intangible asset today—versus the historical development cost.
• Excess operating costs compares the cost of maintaining/operating the subject intangible asset—versus the cost of maintaining/operating a replacement intangible asset.
41Willamette Management Associates
Economic Obsolescence• Economic obsolescence may be identified by the question:
Can the subject intangible asset generate a fair rate of return to the intangible asset owner/operator based on the estimated cost measure less depreciation?
42Willamette Management Associates
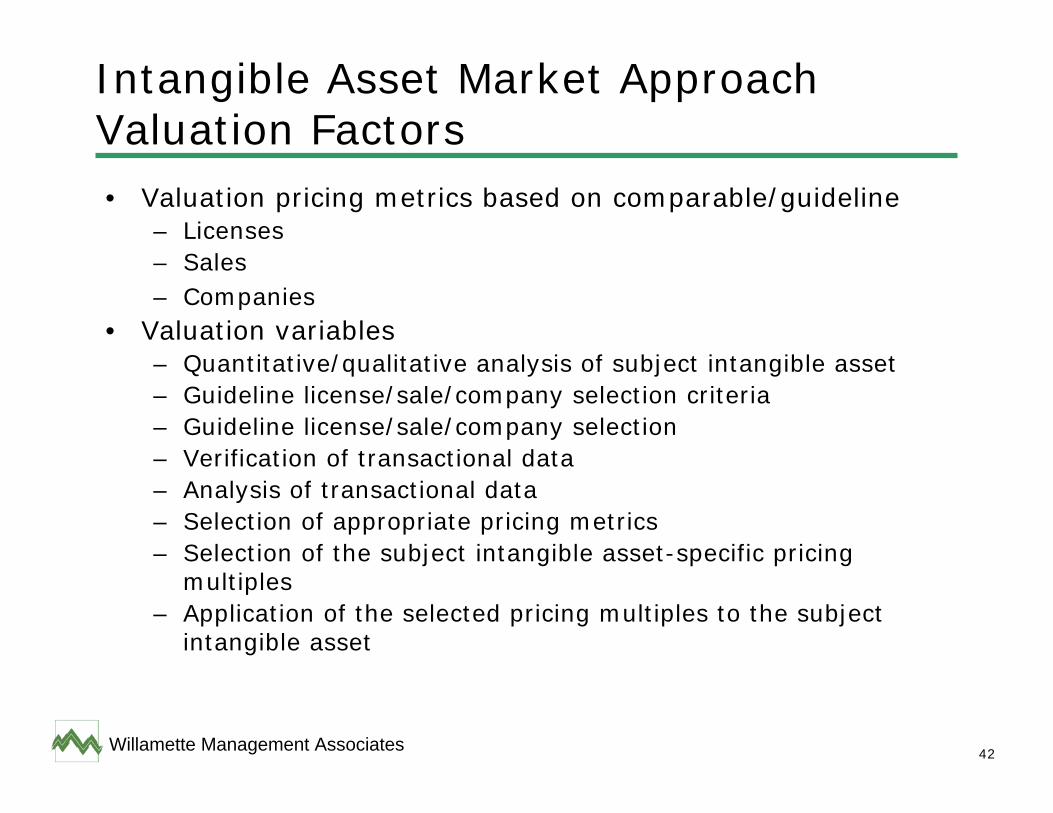
Intangible Asset Market Approach Valuation Factors• Valuation pricing metrics based on comparable/guideline
– Licenses– Sales– Companies
• Valuation variables– Quantitative/qualitative analysis of subject intangible asset– Guideline license/sale/company selection criteria– Guideline license/sale/company selection– Verification of transactional data– Analysis of transactional data– Selection of appropriate pricing metrics– Selection of the subject intangible asset-specific pricing
multiples– Application of the selected pricing multiples to the subject
intangible asset
43Willamette Management Associates
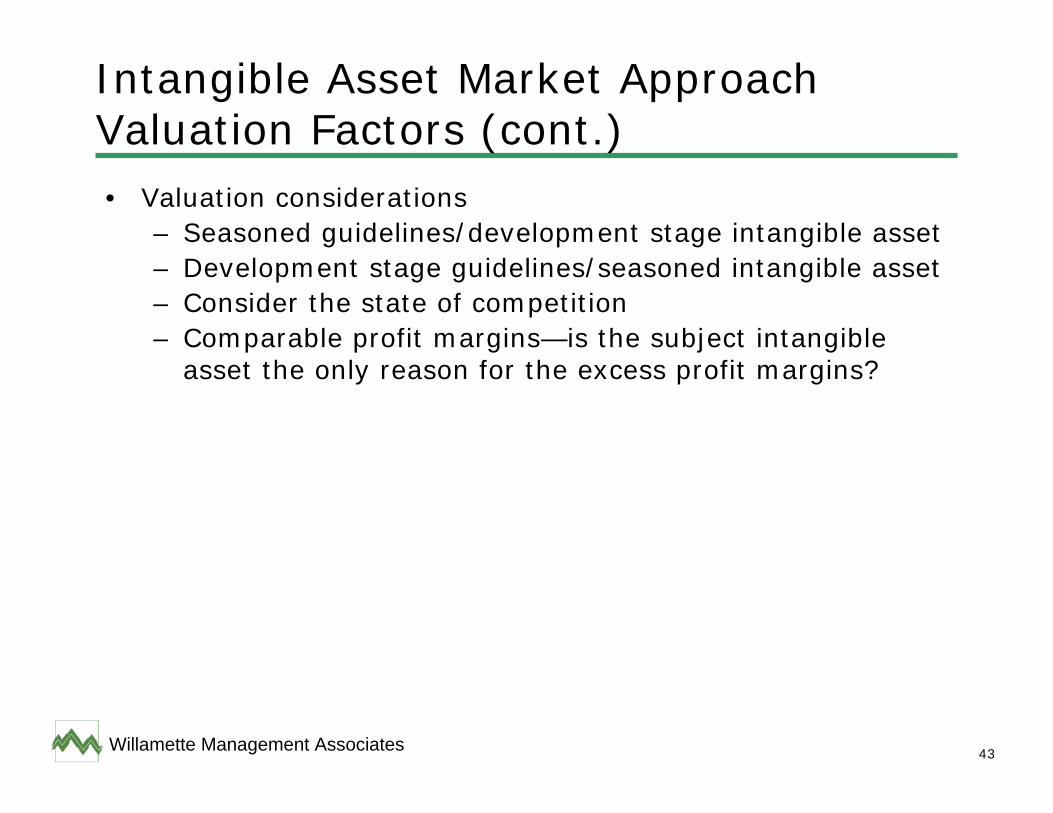
Intangible Asset Market Approach Valuation Factors (cont.)• Valuation considerations
– Seasoned guidelines/development stage intangible asset– Development stage guidelines/seasoned intangible asset– Consider the state of competition– Comparable profit margins—is the subject intangible
asset the only reason for the excess profit margins?
44Willamette Management Associates
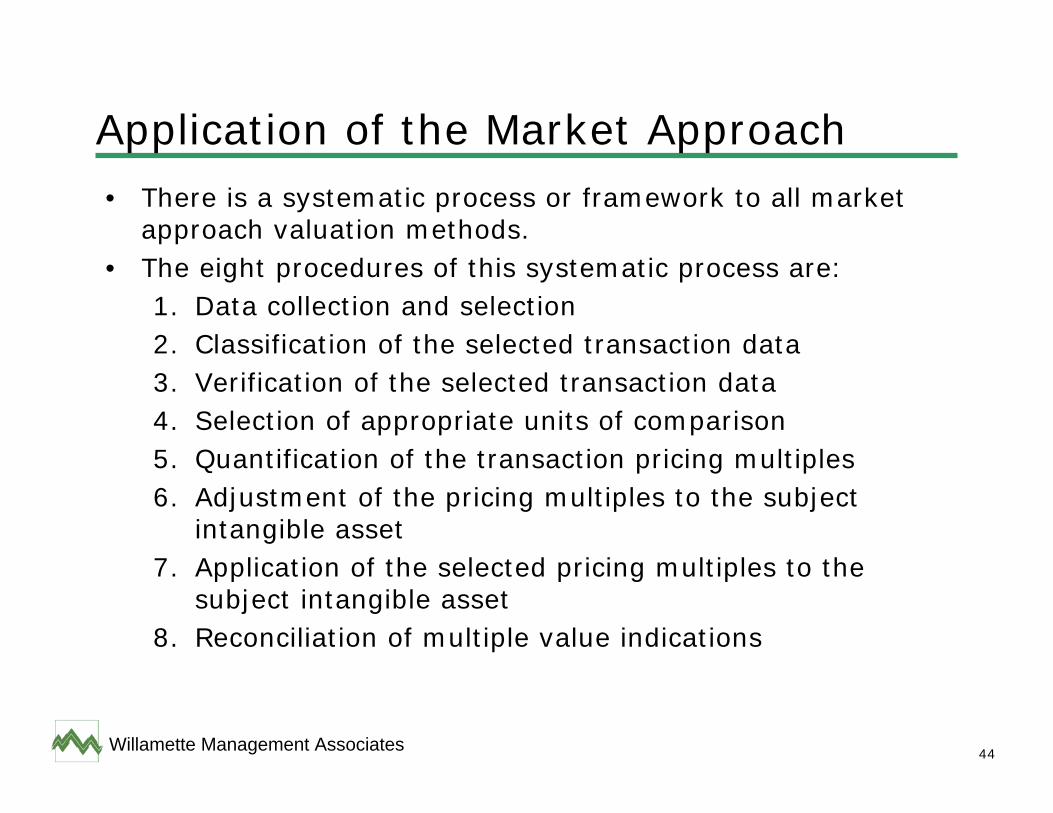
Application of the Market Approach• There is a systematic process or framework to all market
approach valuation methods.• The eight procedures of this systematic process are:
1. Data collection and selection2. Classification of the selected transaction data3. Verification of the selected transaction data4. Selection of appropriate units of comparison5. Quantification of the transaction pricing multiples6. Adjustment of the pricing multiples to the subject
intangible asset7. Application of the selected pricing multiples to the
subject intangible asset8. Reconciliation of multiple value indications
45Willamette Management Associates
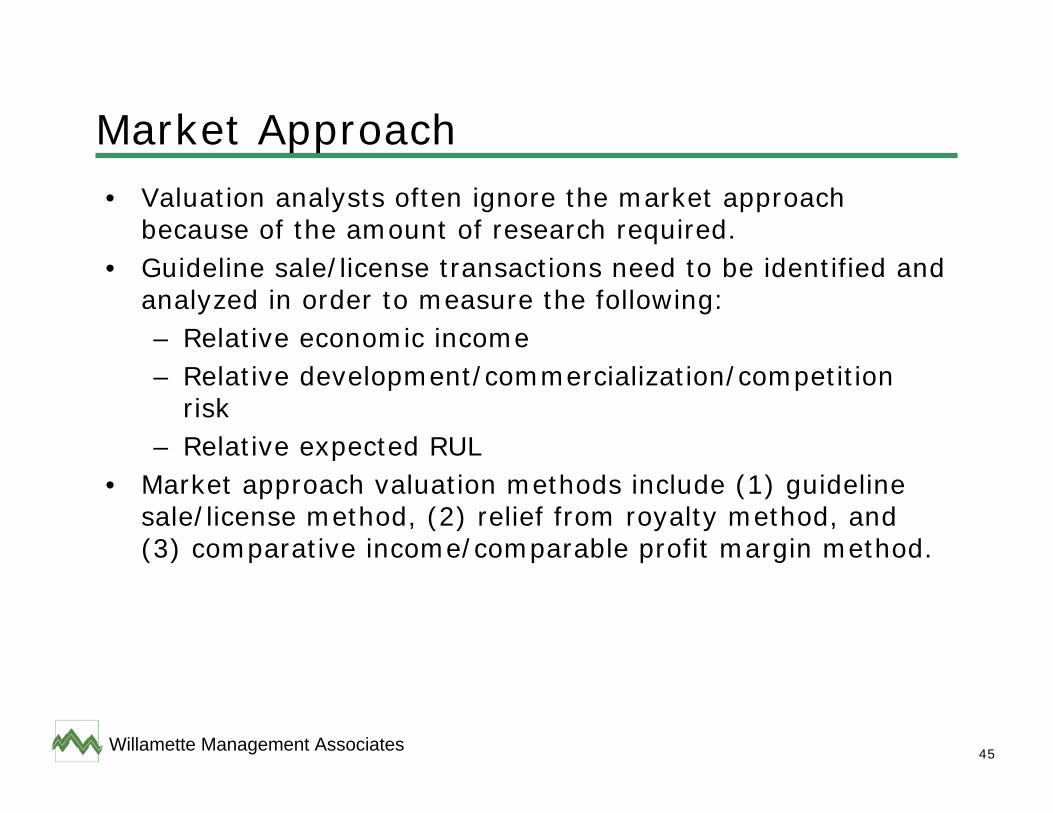
Market Approach• Valuation analysts often ignore the market approach
because of the amount of research required.• Guideline sale/license transactions need to be identified and
analyzed in order to measure the following:– Relative economic income– Relative development/commercialization/competition
risk– Relative expected RUL
• Market approach valuation methods include (1) guideline sale/license method, (2) relief from royalty method, and (3) comparative income/comparable profit margin method.
46Willamette Management Associates
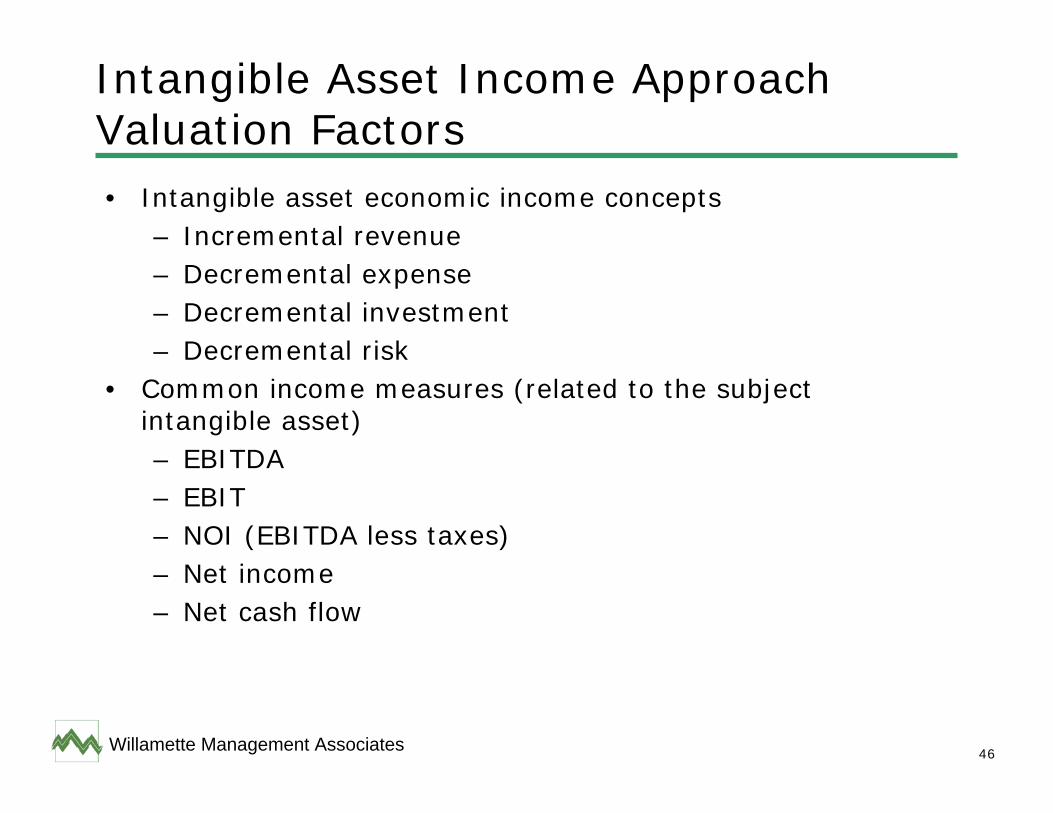
Intangible Asset Income Approach Valuation Factors• Intangible asset economic income concepts
– Incremental revenue– Decremental expense– Decremental investment– Decremental risk
• Common income measures (related to the subject intangible asset)– EBITDA– EBIT– NOI (EBITDA less taxes)– Net income– Net cash flow
47Willamette Management Associates
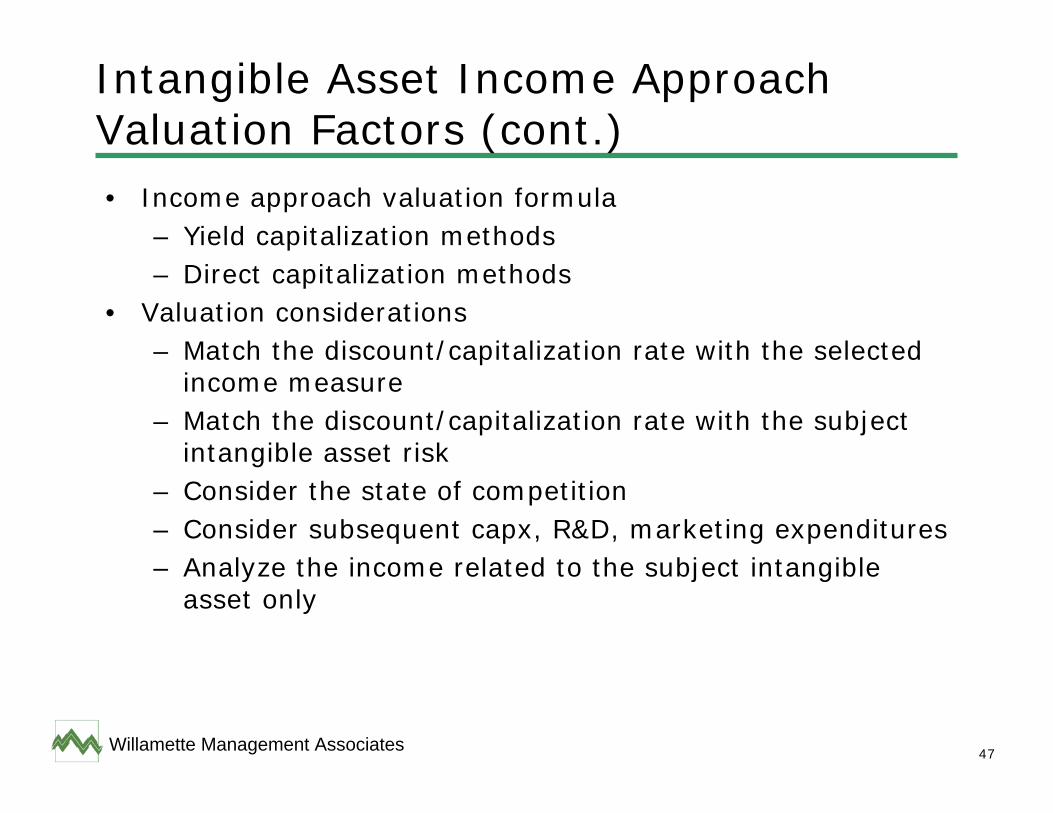
Intangible Asset Income Approach Valuation Factors (cont.)• Income approach valuation formula
– Yield capitalization methods– Direct capitalization methods
• Valuation considerations– Match the discount/capitalization rate with the selected
income measure– Match the discount/capitalization rate with the subject
intangible asset risk– Consider the state of competition– Consider subsequent capx, R&D, marketing expenditures– Analyze the income related to the subject intangible
asset only
48Willamette Management Associates
Income Approach Procedures• The three principal procedures of each intangible asset
income approach valuation method are:1. The estimation of the subject intangible asset economic
income.2. The estimation of the term of the economic income
projection period.3. The estimation of the appropriate income
discount/capitalization rate.
49Willamette Management Associates
Income Approach Methods• Yield capitalization methods
– Procedure 1 – estimate the appropriate measurement of the economic income.
– Procedure 2 – estimate the expected RUL of the economic income projection.
– Procedure 3 – estimate a discrete income projection.– Procedure 4 - estimate a present value discount rate—
the yield capitalization rate—to convert the projected economic income to a present value.
50Willamette Management Associates
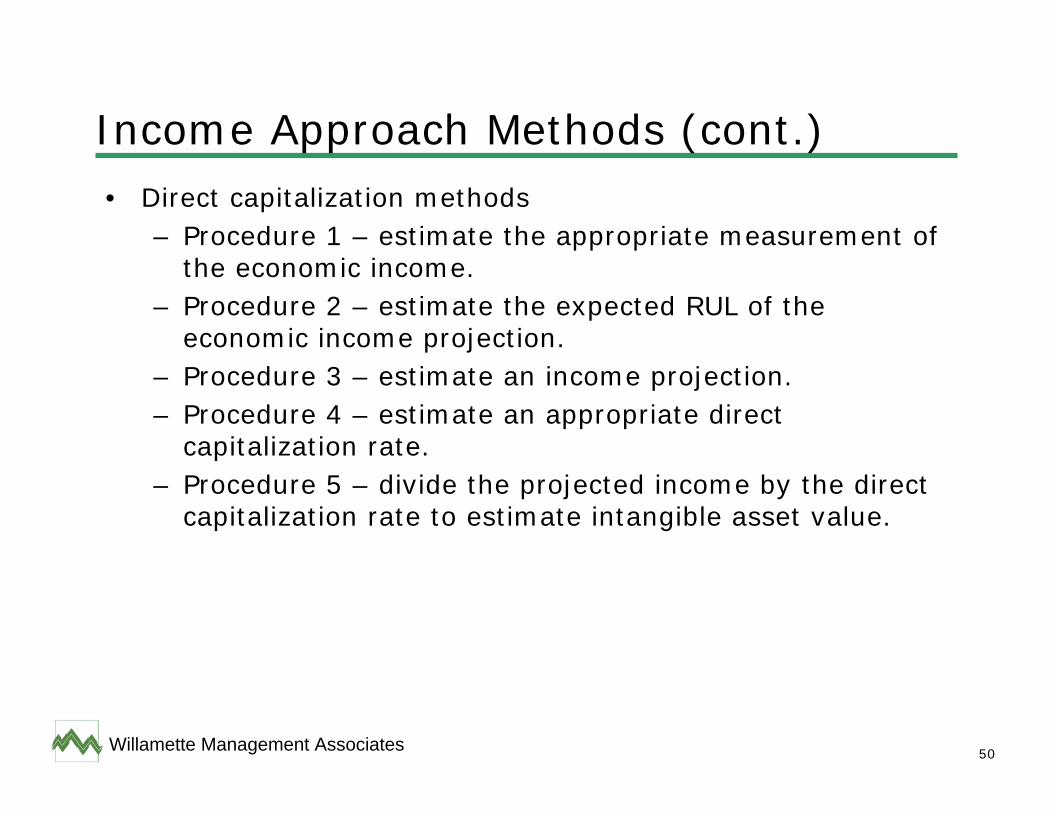
Income Approach Methods (cont.)• Direct capitalization methods
– Procedure 1 – estimate the appropriate measurement of the economic income.
– Procedure 2 – estimate the expected RUL of the economic income projection.
– Procedure 3 – estimate an income projection.– Procedure 4 – estimate an appropriate direct
capitalization rate.– Procedure 5 – divide the projected income by the direct
capitalization rate to estimate intangible asset value.
51Willamette Management Associates
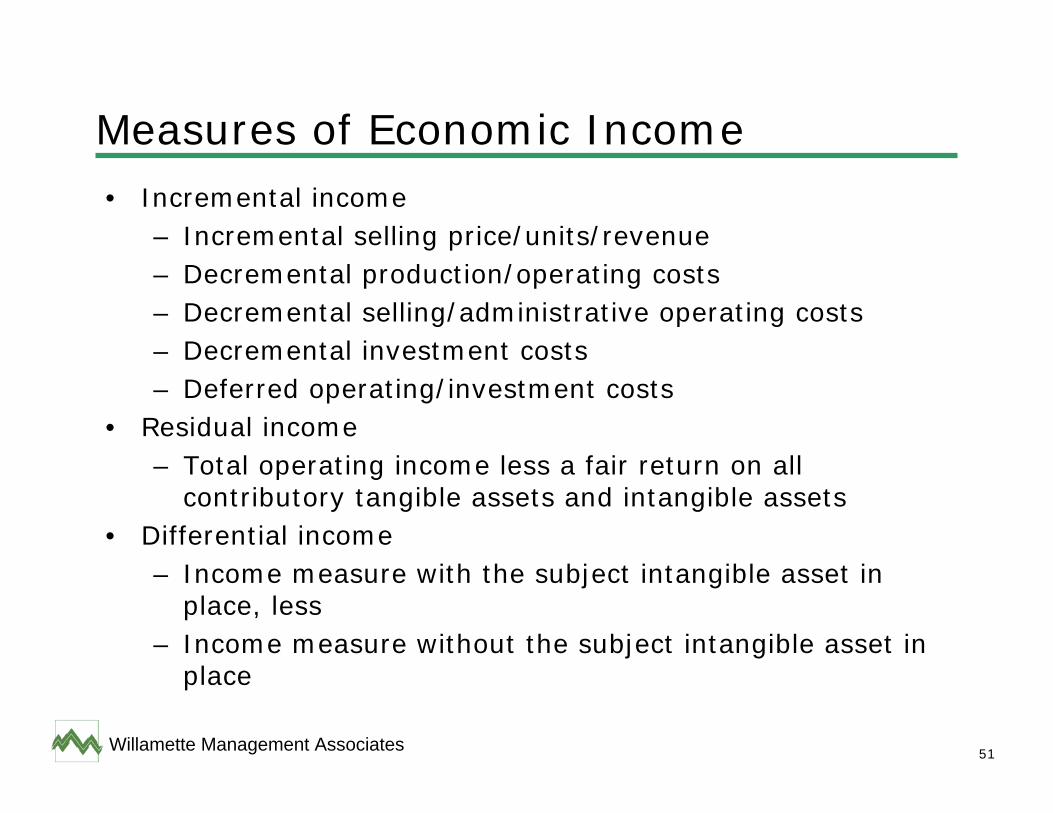
Measures of Economic Income• Incremental income
– Incremental selling price/units/revenue– Decremental production/operating costs– Decremental selling/administrative operating costs– Decremental investment costs– Deferred operating/investment costs
• Residual income– Total operating income less a fair return on all
contributory tangible assets and intangible assets• Differential income
– Income measure with the subject intangible asset in place, less
– Income measure without the subject intangible asset in place
52Willamette Management Associates
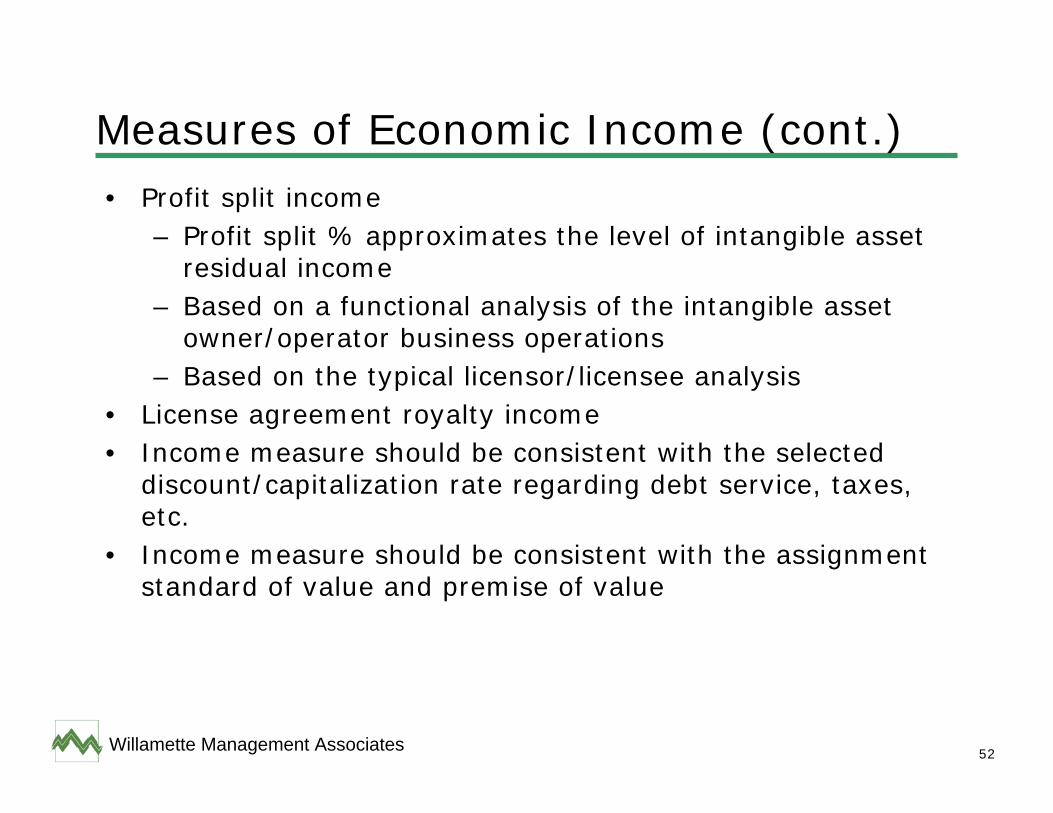
Measures of Economic Income (cont.)• Profit split income
– Profit split % approximates the level of intangible asset residual income
– Based on a functional analysis of the intangible asset owner/operator business operations
– Based on the typical licensor/licensee analysis• License agreement royalty income• Income measure should be consistent with the selected
discount/capitalization rate regarding debt service, taxes, etc.
• Income measure should be consistent with the assignment standard of value and premise of value
53Willamette Management Associates
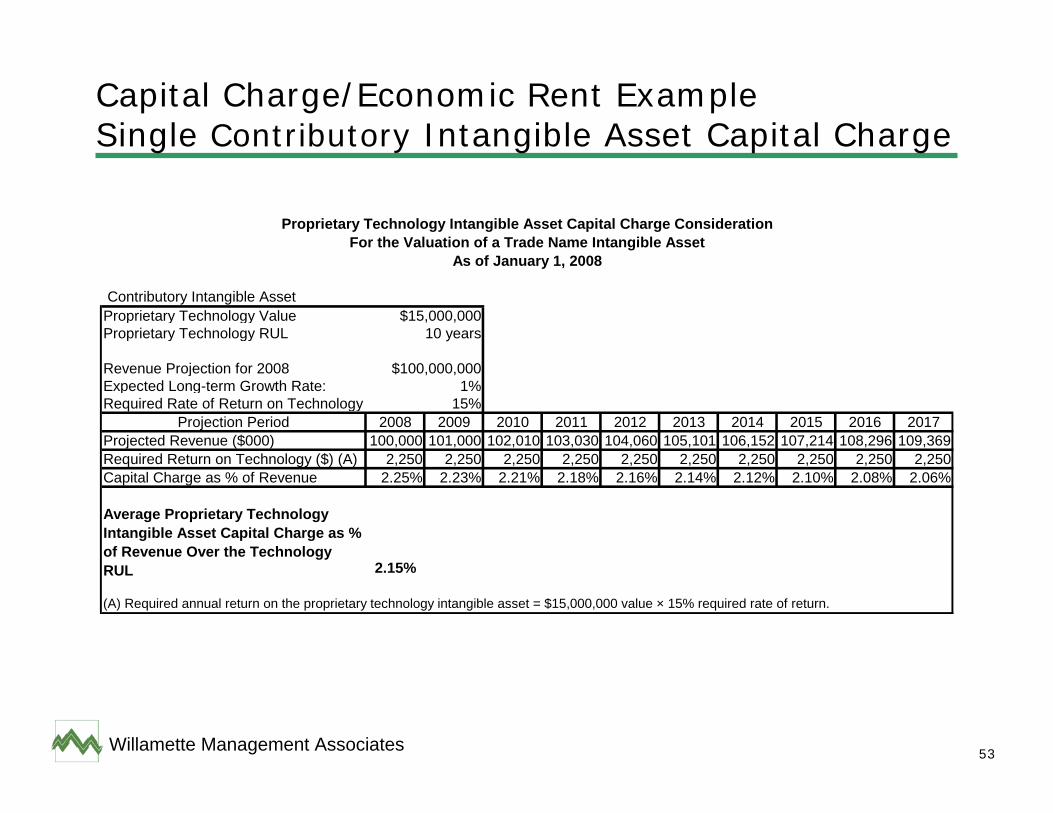
Capital Charge/Economic Rent ExampleSingle Contributory Intangible Asset Capital Charge
Contributory Intangible AssetProprietary Technology ValueProprietary Technology RUL
Revenue Projection for 2008Expected Long-term Growth Rate: 1%
15%Projection Period 2008 2009 2010 2011 2012 2013 2014 2015 2016 2017
Projected Revenue ($000) 100,000 101,000 102,010 103,030 104,060 105,101 106,152 107,214 108,296 109,369Required Return on Technology ($) (A) 2,250 2,250 2,250 2,250 2,250 2,250 2,250 2,250 2,250 2,250Capital Charge as % of Revenue 2.25% 2.23% 2.21% 2.18% 2.16% 2.14% 2.12% 2.10% 2.08% 2.06%
2.15%
(A) Required annual return on the proprietary technology intangible asset = $15,000,000 value × 15% required rate of return.
Proprietary Technology Intangible Asset Capital Charge Consideration
$15,000,000 10 years
$100,000,000
Required Rate of Return on Technology
Average Proprietary Technology Intangible Asset Capital Charge as % of Revenue Over the Technology RUL
For the Valuation of a Trade Name Intangible AssetAs of January 1, 2008
54Willamette Management Associates
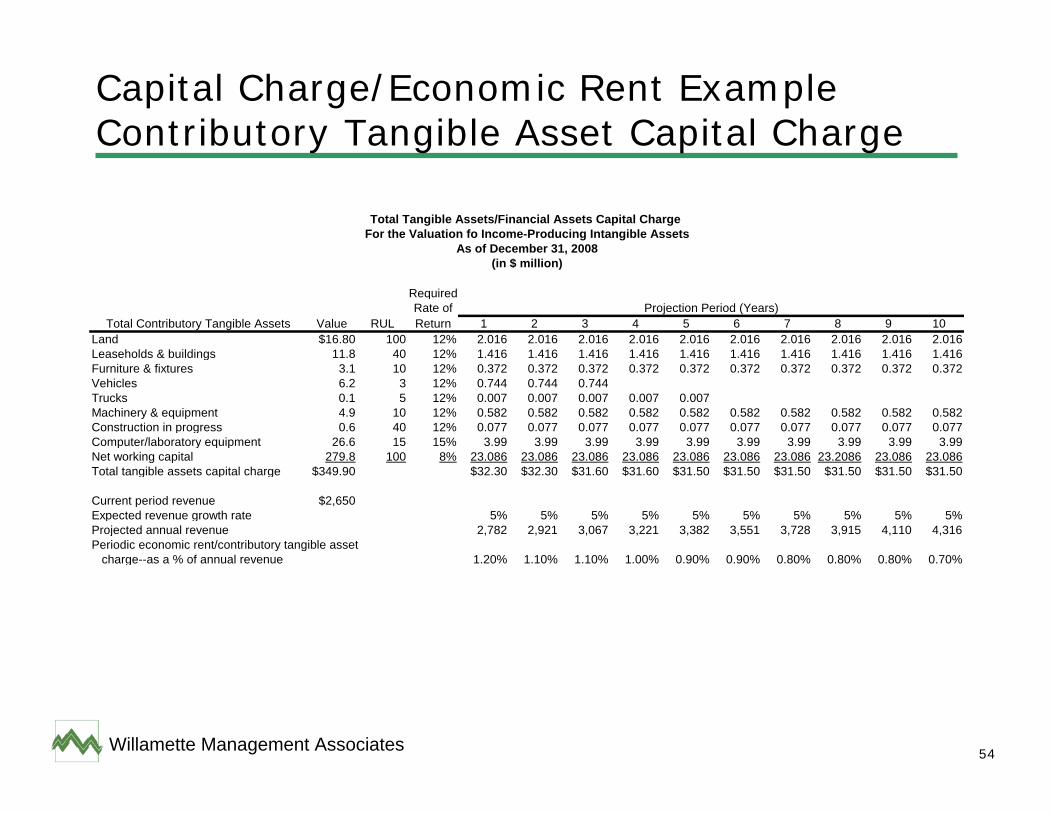
Capital Charge/Economic Rent ExampleContributory Tangible Asset Capital Charge
RequiredRate of
Total Contributory Tangible Assets Value RUL Return 1 2 3 4 5 6 7 8 9 10Land $16.80 100 12% 2.016 2.016 2.016 2.016 2.016 2.016 2.016 2.016 2.016 2.016Leaseholds & buildings 11.8 40 12% 1.416 1.416 1.416 1.416 1.416 1.416 1.416 1.416 1.416 1.416Furniture & fixtures 3.1 10 12% 0.372 0.372 0.372 0.372 0.372 0.372 0.372 0.372 0.372 0.372Vehicles 6.2 3 12% 0.744 0.744 0.744Trucks 0.1 5 12% 0.007 0.007 0.007 0.007 0.007Machinery & equipment 4.9 10 12% 0.582 0.582 0.582 0.582 0.582 0.582 0.582 0.582 0.582 0.582Construction in progress 0.6 40 12% 0.077 0.077 0.077 0.077 0.077 0.077 0.077 0.077 0.077 0.077Computer/laboratory equipment 26.6 15 15% 3.99 3.99 3.99 3.99 3.99 3.99 3.99 3.99 3.99 3.99Net working capital 279.8 100 8% 23.086 23.086 23.086 23.086 23.086 23.086 23.086 23.2086 23.086 23.086Total tangible assets capital charge $349.90 $32.30 $32.30 $31.60 $31.60 $31.50 $31.50 $31.50 $31.50 $31.50 $31.50
Current period revenue $2,650 Expected revenue growth rate 5% 5% 5% 5% 5% 5% 5% 5% 5% 5%Projected annual revenue 2,782 2,921 3,067 3,221 3,382 3,551 3,728 3,915 4,110 4,316 Periodic economic rent/contributory tangible asset charge--as a % of annual revenue 1.20% 1.10% 1.10% 1.00% 0.90% 0.90% 0.80% 0.80% 0.80% 0.70%
Total Tangible Assets/Financial Assets Capital Charge
Projection Period (Years)
For the Valuation fo Income-Producing Intangible AssetsAs of December 31, 2008
(in $ million)
55Willamette Management Associates
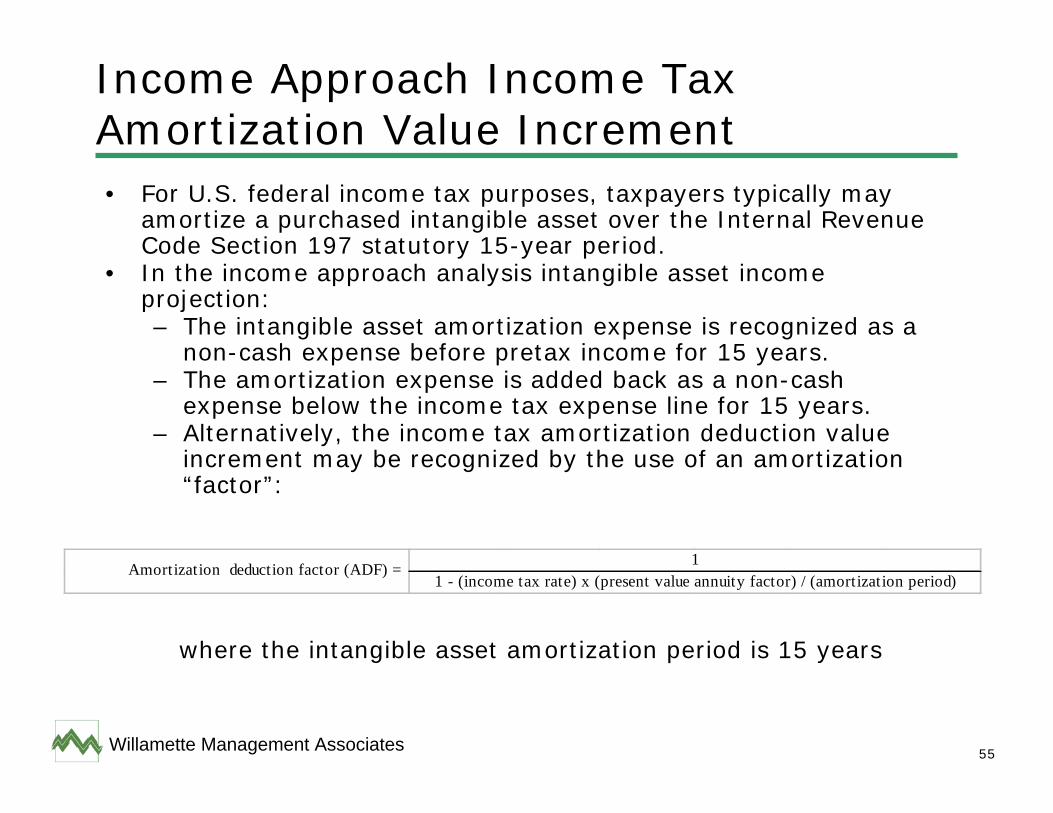
Income Approach Income Tax Amortization Value Increment• For U.S. federal income tax purposes, taxpayers typically may
amortize a purchased intangible asset over the Internal Revenue Code Section 197 statutory 15-year period.
• In the income approach analysis intangible asset income projection:– The intangible asset amortization expense is recognized as a
non-cash expense before pretax income for 15 years.– The amortization expense is added back as a non-cash
expense below the income tax expense line for 15 years.– Alternatively, the income tax amortization deduction value
increment may be recognized by the use of an amortization “factor”:
where the intangible asset amortization period is 15 years
Amortization deduction factor (ADF) = 11 - (income tax rate) x (present value annuity factor) / (amortization period)
56Willamette Management Associates
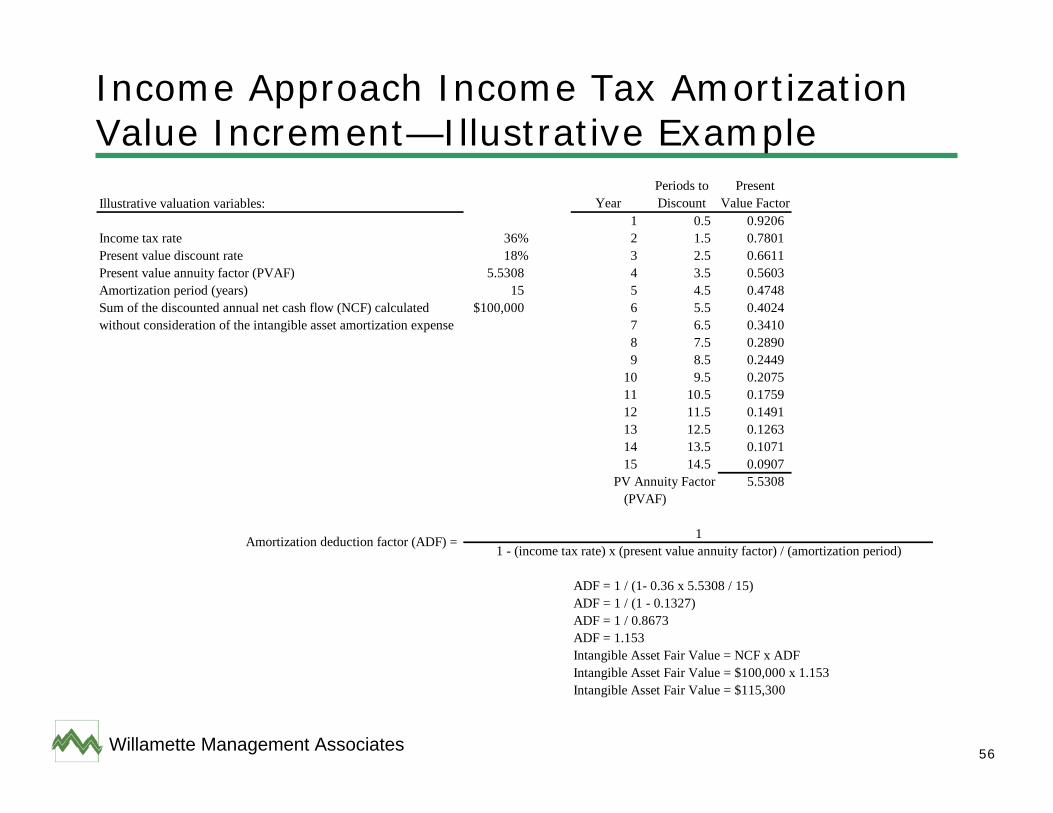
Income Approach Income Tax Amortization Value Increment—Illustrative Example
Illustrative valuation variables: YearPeriods to Discount
Present Value Factor
1 0.5 0.9206 Income tax rate 36% 2 1.5 0.7801 Present value discount rate 18% 3 2.5 0.6611 Present value annuity factor (PVAF) 5.5308 4 3.5 0.5603 Amortization period (years) 15 5 4.5 0.4748 Sum of the discounted annual net cash flow (NCF) calculated $100,000 6 5.5 0.4024 without consideration of the intangible asset amortization expense 7 6.5 0.3410
8 7.5 0.2890 9 8.5 0.2449
10 9.5 0.2075 11 10.5 0.1759 12 11.5 0.1491 13 12.5 0.1263 14 13.5 0.1071 15 14.5 0.0907
PV Annuity Factor 5.5308
ADF = 1 / (1- 0.36 x 5.5308 / 15)ADF = 1 / (1 - 0.1327)ADF = 1 / 0.8673ADF = 1.153Intangible Asset Fair Value = NCF x ADFIntangible Asset Fair Value = $100,000 x 1.153Intangible Asset Fair Value = $115,300
(PVAF)
Amortization deduction factor (ADF) = 11 - (income tax rate) x (present value annuity factor) / (amortization period)
57Willamette Management Associates
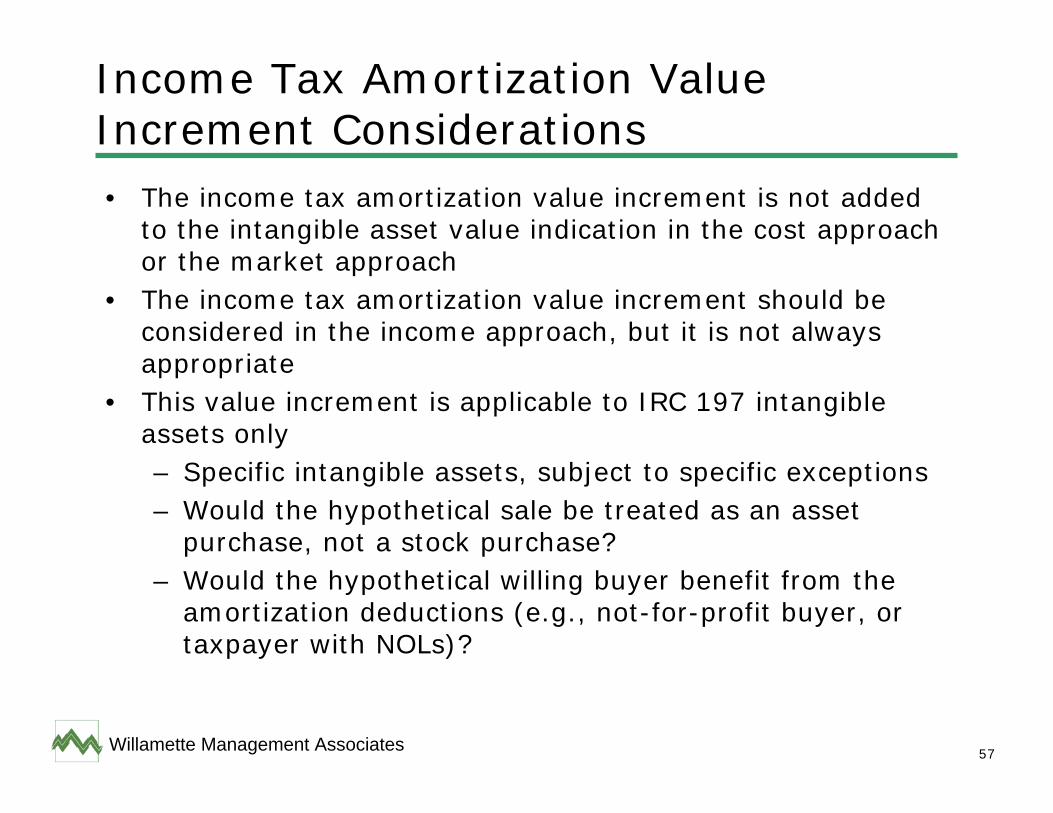
Income Tax Amortization Value Increment Considerations• The income tax amortization value increment is not added
to the intangible asset value indication in the cost approach or the market approach
• The income tax amortization value increment should be considered in the income approach, but it is not always appropriate
• This value increment is applicable to IRC 197 intangible assets only– Specific intangible assets, subject to specific exceptions– Would the hypothetical sale be treated as an asset
purchase, not a stock purchase?– Would the hypothetical willing buyer benefit from the
amortization deductions (e.g., not-for-profit buyer, or taxpayer with NOLs)?
58Willamette Management Associates
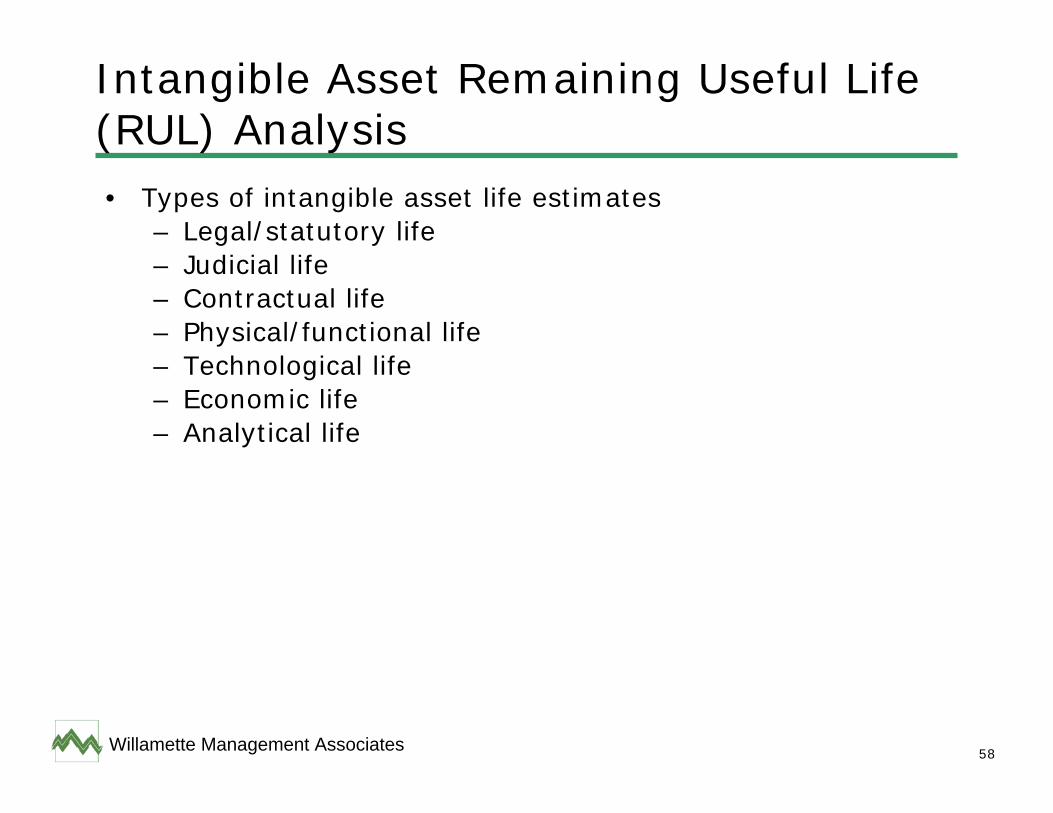
Intangible Asset Remaining Useful Life (RUL) Analysis• Types of intangible asset life estimates
– Legal/statutory life– Judicial life– Contractual life– Physical/functional life– Technological life– Economic life– Analytical life
59Willamette Management Associates
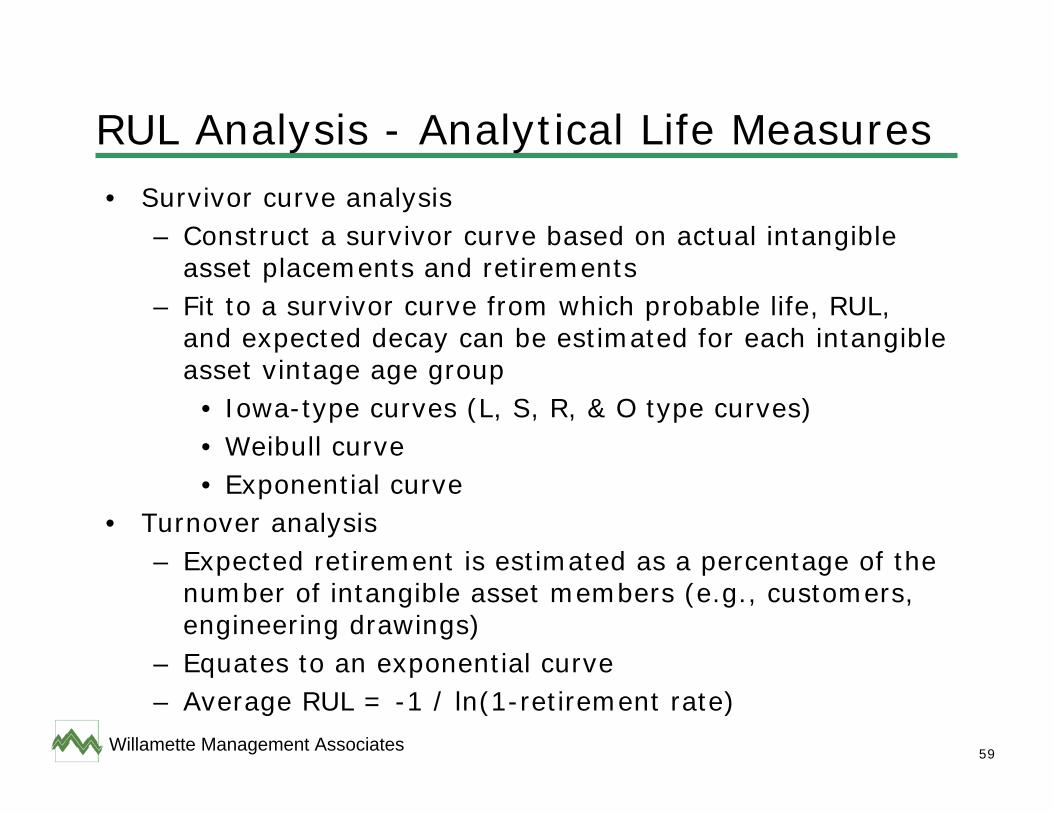
RUL Analysis - Analytical Life Measures• Survivor curve analysis
– Construct a survivor curve based on actual intangible asset placements and retirements
– Fit to a survivor curve from which probable life, RUL, and expected decay can be estimated for each intangible asset vintage age group• Iowa-type curves (L, S, R, & O type curves)• Weibull curve• Exponential curve
• Turnover analysis– Expected retirement is estimated as a percentage of the
number of intangible asset members (e.g., customers, engineering drawings)
– Equates to an exponential curve – Average RUL = -1 / ln(1-retirement rate)
60Willamette Management Associates
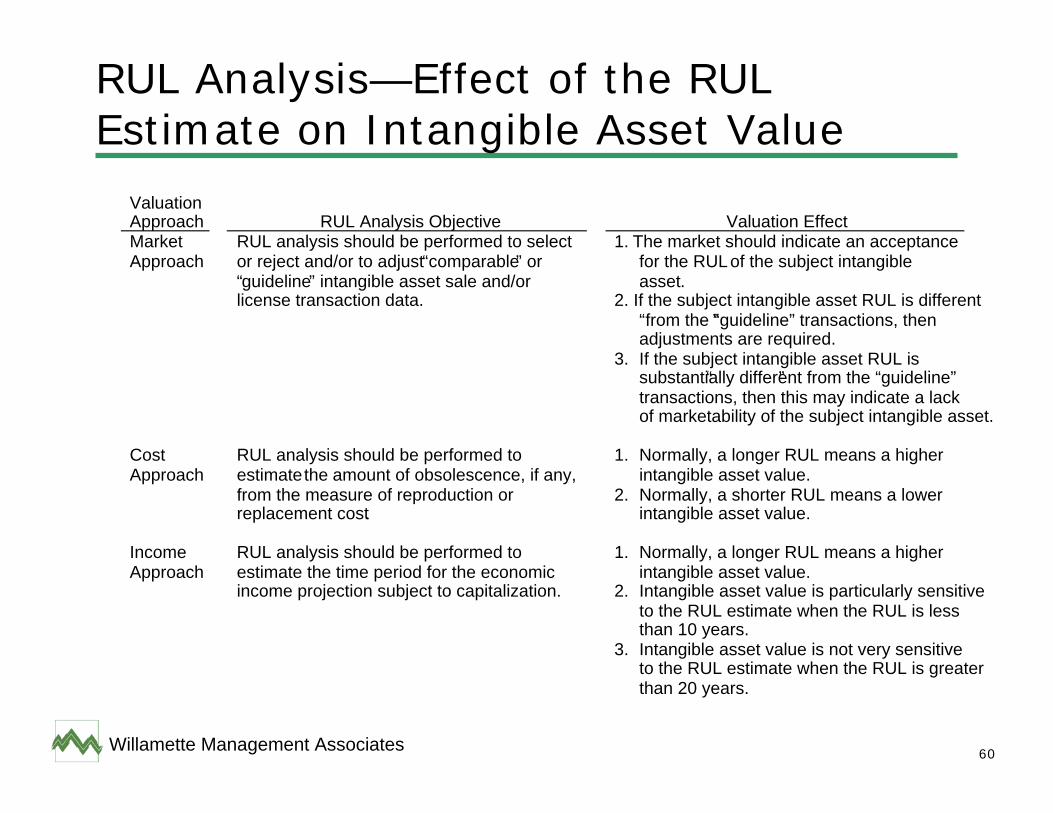
RUL Analysis—Effect of the RUL Estimate on Intangible Asset Value
ValuationApproach RUL Analysis Objective Valuation EffectMarketApproach
RUL analysis should be performed to select or reject and/or to adjust “comparable” or “guideline” intangible asset sale and/or license transaction data.
1. The market should indicate an acceptance for the RUL of the subject intangible asset.
2. If the subject intangible asset RUL is different“from the “guideline” transactions, then”adjustments are required.
3. If the subject intangible asset RUL issubstantially different from the “guideline”“ ”transactions, then this may indicate a lackof marketability of the subject intangible asset.
Cost Approach
RUL analysis should be performed to estimate the amount of obsolescence, if any, from the measure of reproduction or replacement cost.
1. Normally, a longer RUL means a higher intangible asset value.
2. Normally, a shorter RUL means a lower intangible asset value.
IncomeApproach
RUL analysis should be performed to estimate the time period for the economic income projection subject to capitalization.
1. Normally, a longer RUL means a higher intangible asset value.
2. Intangible asset value is particularly sensitiveto the RUL estimate when the RUL is lessthan 10 years.
3. Intangible asset value is not very sensitiveto the RUL estimate when the RUL is greaterthan 20 years.
61Willamette Management Associates
Intangible Asset Valuation—Simplified Illustrative Examples• Customer relationships valuation—income approach
illustrative example• Computer software valuation—cost approach illustrative
example• Assembled workforce valuation—cost approach illustrative
example• Patent valuation—market approach illustrative example
62Willamette Management Associates
Customer Relationships Valuation—Income Approach Illustrative Example• You are retained to perform an SFAS No. 141R purchase
price allocation related to the acquisition of a manufacturing company, XYZ Manufacturing, Inc. (“XYZ Mfg.”).
• You decide to use the income approach and the yield capitalization method to value the customer relationships
• You were provided with sufficient data to perform an analytical remaining useful life analysis: start dates for each active customer and five years of retirement data, (including start and stop date for each retired customer)
• The customer relationships intangible asset includes all customers in existence as of the valuation date, but not any future customers (i.e., customers who start doing business with XYZ Mfg. after the valuation date)
63Willamette Management Associates
Customer Relationships Illustrative Example - Valuation Variables• The revenue generated by the active customer relationships
over the last 12 months was $1.25 billion• Based on discussions with company management, analysis
of XYZ Mfg. customer purchases, and analysis of industry data, you concluded the following expected growth rate in revenue for continuing customer relationships (i.e., before consideration of customer retirements):– 5 percent for the next 5 years– 3 percent, thereafter
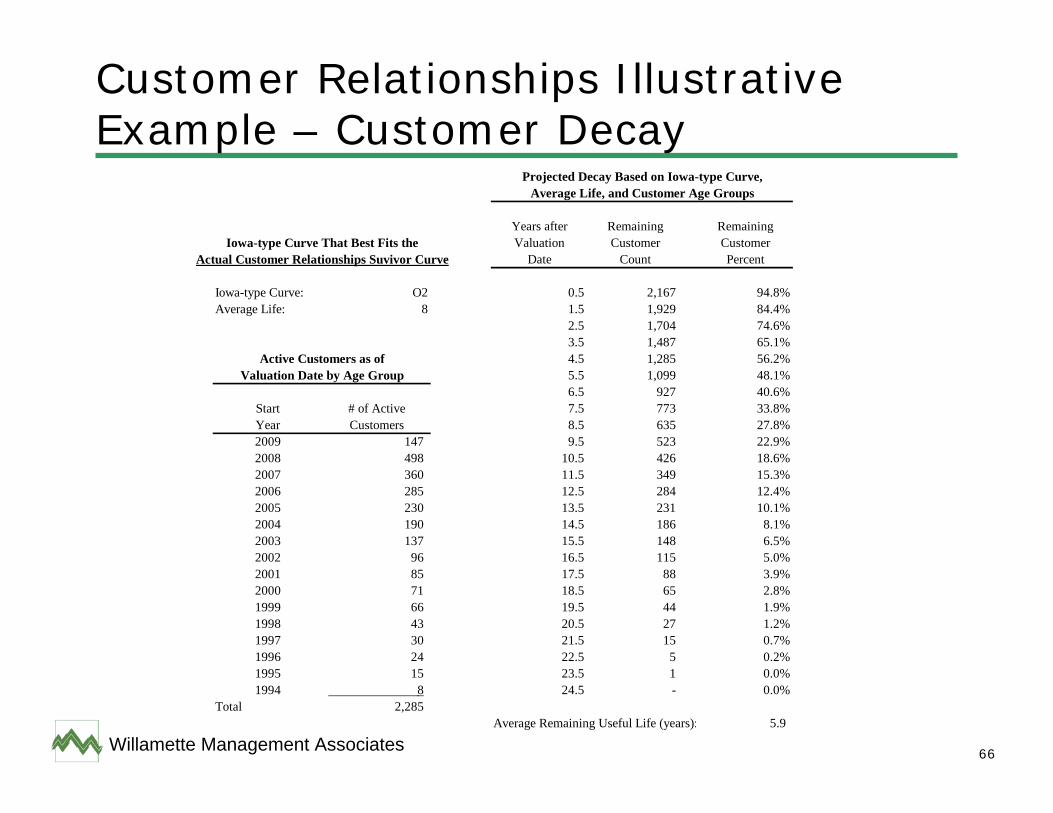
• The conclusion of your remaining useful life analysis is that the best-fitting Iowa-type survivor curve was an O2 curve with an average life of 8 years
• From (1) the above survivor curve and the average life and (2) the start dates of the active customers, you are able to project the expected decay of the customer relationships
64Willamette Management Associates
Customer Relationships Illustrative Example - Valuation Variables (cont.)• Based on the projected customer decay, you selected an
income projection period of 17 years• Based on an analysis of historical financial statements and
projected financial statements, as well as discussions with company management, you concluded the following customer relationships valuation variables:– cost of goods sold = 48 percent of revenue– SG&A expense = 25 percent of revenue– depreciation and amortization expense is projected to be
approximately equal to capital expenditures– no projected increases in net working capital
• You estimated an income tax rate of 36 percent• You concluded a discount rate of 17 percent
65Willamette Management Associates
Customer Relationships Illustrative Example - Valuation Variables (cont.)• You calculated a capital charge on contributory assets of
6.5 percent of revenue, based on the required returns on the values of:– tangible property (real and personal)– trademarks– patents– assembled workforce– net working capital
66Willamette Management Associates
Customer Relationships Illustrative Example – Customer Decay
Years after Remaining RemainingValuation Customer Customer
Date Count Percent
Iowa-type Curve: O2 0.5 2,167 94.8%Average Life: 8 1.5 1,929 84.4%
2.5 1,704 74.6%3.5 1,487 65.1%4.5 1,285 56.2%5.5 1,099 48.1%6.5 927 40.6%
Start # of Active 7.5 773 33.8%Year Customers 8.5 635 27.8%2009 147 9.5 523 22.9%2008 498 10.5 426 18.6%2007 360 11.5 349 15.3%2006 285 12.5 284 12.4%2005 230 13.5 231 10.1%2004 190 14.5 186 8.1%2003 137 15.5 148 6.5%2002 96 16.5 115 5.0%2001 85 17.5 88 3.9%2000 71 18.5 65 2.8%1999 66 19.5 44 1.9%1998 43 20.5 27 1.2%1997 30 21.5 15 0.7%1996 24 22.5 5 0.2%1995 15 23.5 1 0.0%1994 8 24.5 - 0.0%
Total 2,285 Average Remaining Useful Life (years): 5.9
Projected Decay Based on Iowa-type Curve,Average Life, and Customer Age Groups
Active Customers as ofValuation Date by Age Group
Iowa-type Curve That Best Fits theActual Customer Relationships Suvivor Curve
67Willamette Management Associates
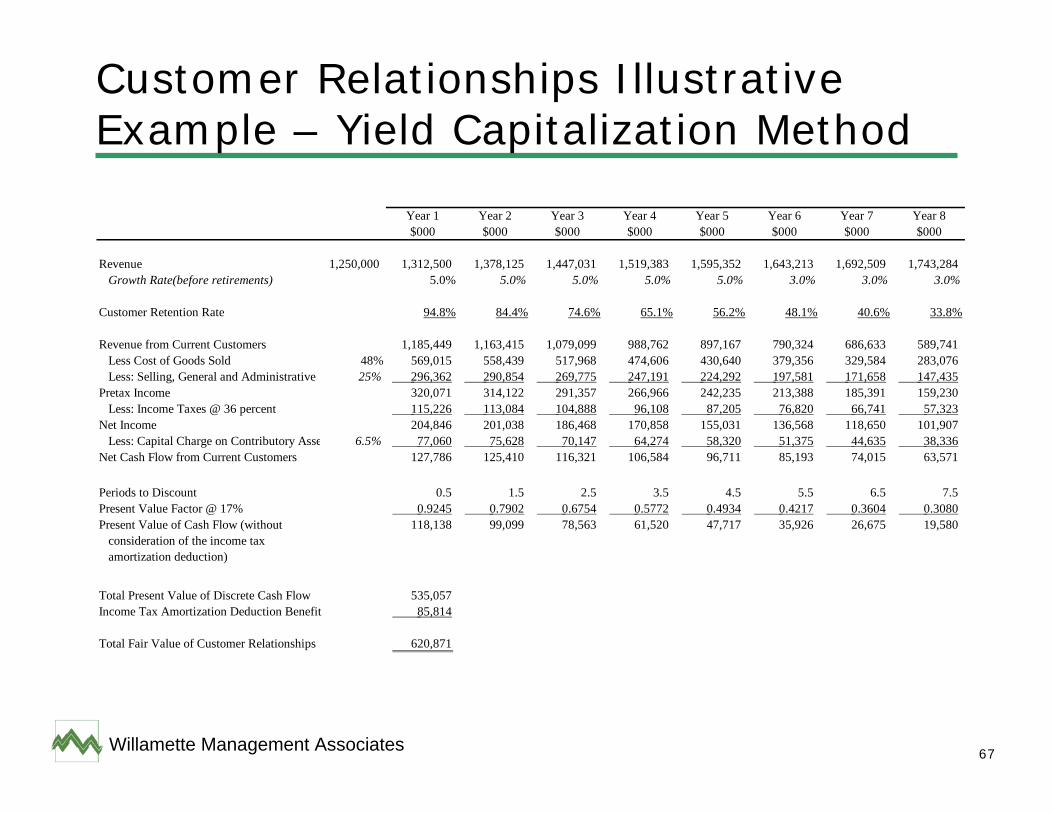
Customer Relationships Illustrative Example – Yield Capitalization Method
Year 1 Year 2 Year 3 Year 4 Year 5 Year 6 Year 7 Year 8$000 $000 $000 $000 $000 $000 $000 $000
Revenue 1,250,000 1,312,500 1,378,125 1,447,031 1,519,383 1,595,352 1,643,213 1,692,509 1,743,284 Growth Rate(before retirements) 5.0% 5.0% 5.0% 5.0% 5.0% 3.0% 3.0% 3.0%
Customer Retention Rate 94.8% 84.4% 74.6% 65.1% 56.2% 48.1% 40.6% 33.8%
Revenue from Current Customers 1,185,449 1,163,415 1,079,099 988,762 897,167 790,324 686,633 589,741 Less Cost of Goods Sold 48% 569,015 558,439 517,968 474,606 430,640 379,356 329,584 283,076 Less: Selling, General and Administrative 25% 296,362 290,854 269,775 247,191 224,292 197,581 171,658 147,435 Pretax Income 320,071 314,122 291,357 266,966 242,235 213,388 185,391 159,230 Less: Income Taxes @ 36 percent 115,226 113,084 104,888 96,108 87,205 76,820 66,741 57,323 Net Income 204,846 201,038 186,468 170,858 155,031 136,568 118,650 101,907 Less: Capital Charge on Contributory Asse 6.5% 77,060 75,628 70,147 64,274 58,320 51,375 44,635 38,336 Net Cash Flow from Current Customers 127,786 125,410 116,321 106,584 96,711 85,193 74,015 63,571
Periods to Discount 0.5 1.5 2.5 3.5 4.5 5.5 6.5 7.5 Present Value Factor @ 17% 0.9245 0.7902 0.6754 0.5772 0.4934 0.4217 0.3604 0.3080 Present Value of Cash Flow (without 118,138 99,099 78,563 61,520 47,717 35,926 26,675 19,580 consideration of the income tax amortization deduction)
Total Present Value of Discrete Cash Flow 535,057 Income Tax Amortization Deduction Benefit 85,814
Total Fair Value of Customer Relationships 620,871
68Willamette Management Associates
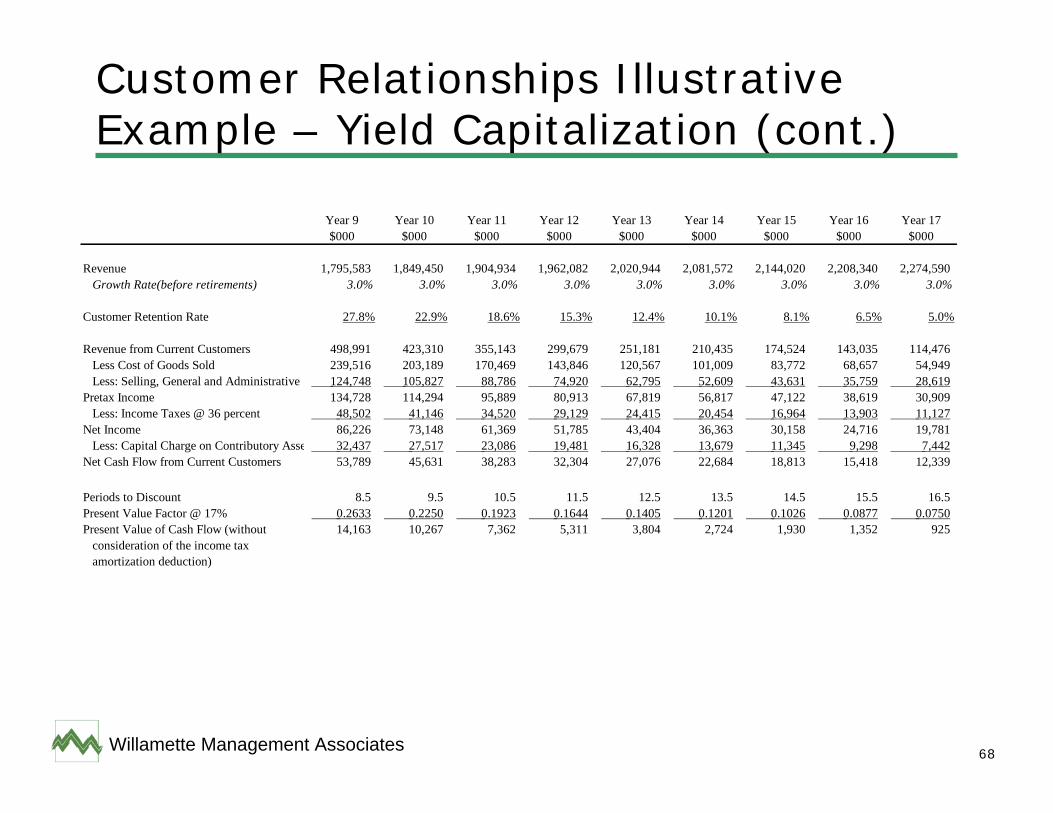
Customer Relationships Illustrative Example – Yield Capitalization (cont.)
Year 9 Year 10 Year 11 Year 12 Year 13 Year 14 Year 15 Year 16 Year 17$000 $000 $000 $000 $000 $000 $000 $000 $000
Revenue 1,795,583 1,849,450 1,904,934 1,962,082 2,020,944 2,081,572 2,144,020 2,208,340 2,274,590 Growth Rate(before retirements) 3.0% 3.0% 3.0% 3.0% 3.0% 3.0% 3.0% 3.0% 3.0%
Customer Retention Rate 27.8% 22.9% 18.6% 15.3% 12.4% 10.1% 8.1% 6.5% 5.0%
Revenue from Current Customers 498,991 423,310 355,143 299,679 251,181 210,435 174,524 143,035 114,476 Less Cost of Goods Sold 239,516 203,189 170,469 143,846 120,567 101,009 83,772 68,657 54,949 Less: Selling, General and Administrative 124,748 105,827 88,786 74,920 62,795 52,609 43,631 35,759 28,619 Pretax Income 134,728 114,294 95,889 80,913 67,819 56,817 47,122 38,619 30,909 Less: Income Taxes @ 36 percent 48,502 41,146 34,520 29,129 24,415 20,454 16,964 13,903 11,127 Net Income 86,226 73,148 61,369 51,785 43,404 36,363 30,158 24,716 19,781 Less: Capital Charge on Contributory Asse 32,437 27,517 23,086 19,481 16,328 13,679 11,345 9,298 7,442 Net Cash Flow from Current Customers 53,789 45,631 38,283 32,304 27,076 22,684 18,813 15,418 12,339
Periods to Discount 8.5 9.5 10.5 11.5 12.5 13.5 14.5 15.5 16.5 Present Value Factor @ 17% 0.2633 0.2250 0.1923 0.1644 0.1405 0.1201 0.1026 0.0877 0.0750 Present Value of Cash Flow (without 14,163 10,267 7,362 5,311 3,804 2,724 1,930 1,352 925 consideration of the income tax amortization deduction)
69Willamette Management Associates
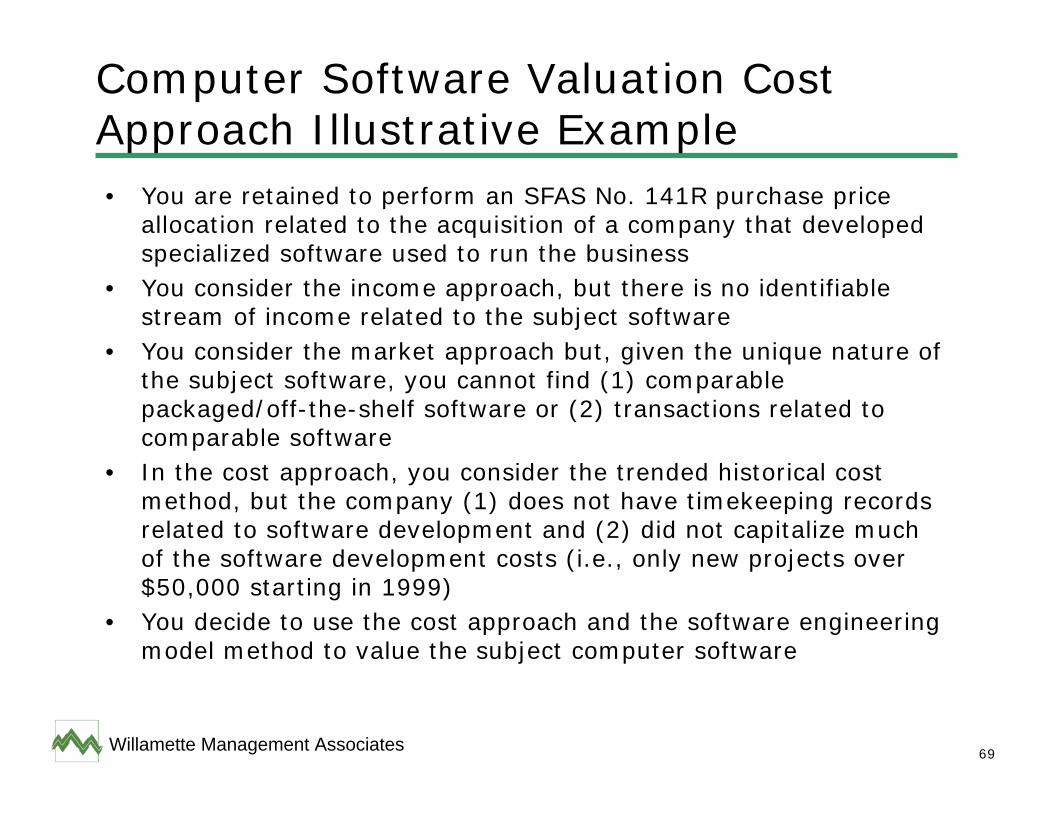
Computer Software Valuation Cost Approach Illustrative Example• You are retained to perform an SFAS No. 141R purchase price
allocation related to the acquisition of a company that developed specialized software used to run the business
• You consider the income approach, but there is no identifiable stream of income related to the subject software
• You consider the market approach but, given the unique nature ofthe subject software, you cannot find (1) comparable packaged/off-the-shelf software or (2) transactions related to comparable software
• In the cost approach, you consider the trended historical cost method, but the company (1) does not have timekeeping records related to software development and (2) did not capitalize much of the software development costs (i.e., only new projects over $50,000 starting in 1999)
• You decide to use the cost approach and the software engineeringmodel method to value the subject computer software
70Willamette Management Associates
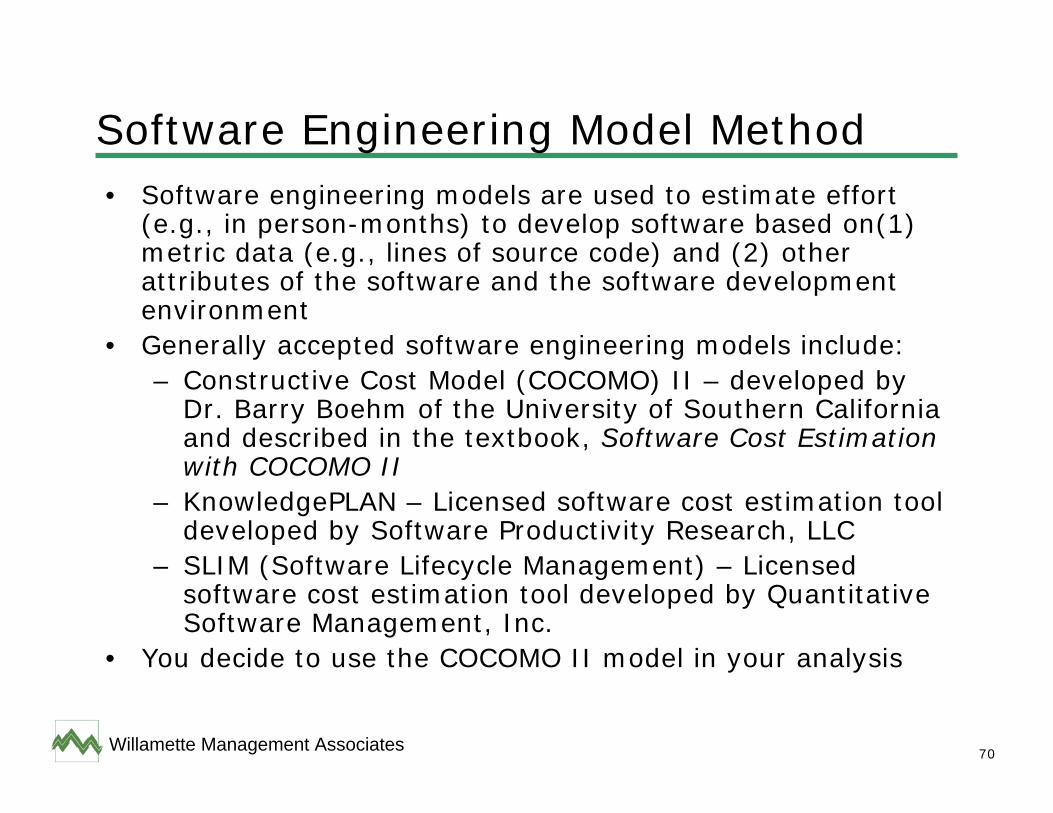
Software Engineering Model Method• Software engineering models are used to estimate effort
(e.g., in person-months) to develop software based on(1) metric data (e.g., lines of source code) and (2) other attributes of the software and the software development environment
• Generally accepted software engineering models include:– Constructive Cost Model (COCOMO) II – developed by
Dr. Barry Boehm of the University of Southern California and described in the textbook, Software Cost Estimation with COCOMO II
– KnowledgePLAN – Licensed software cost estimation tool developed by Software Productivity Research, LLC
– SLIM (Software Lifecycle Management) – Licensed software cost estimation tool developed by Quantitative Software Management, Inc.
• You decide to use the COCOMO II model in your analysis
71Willamette Management Associates
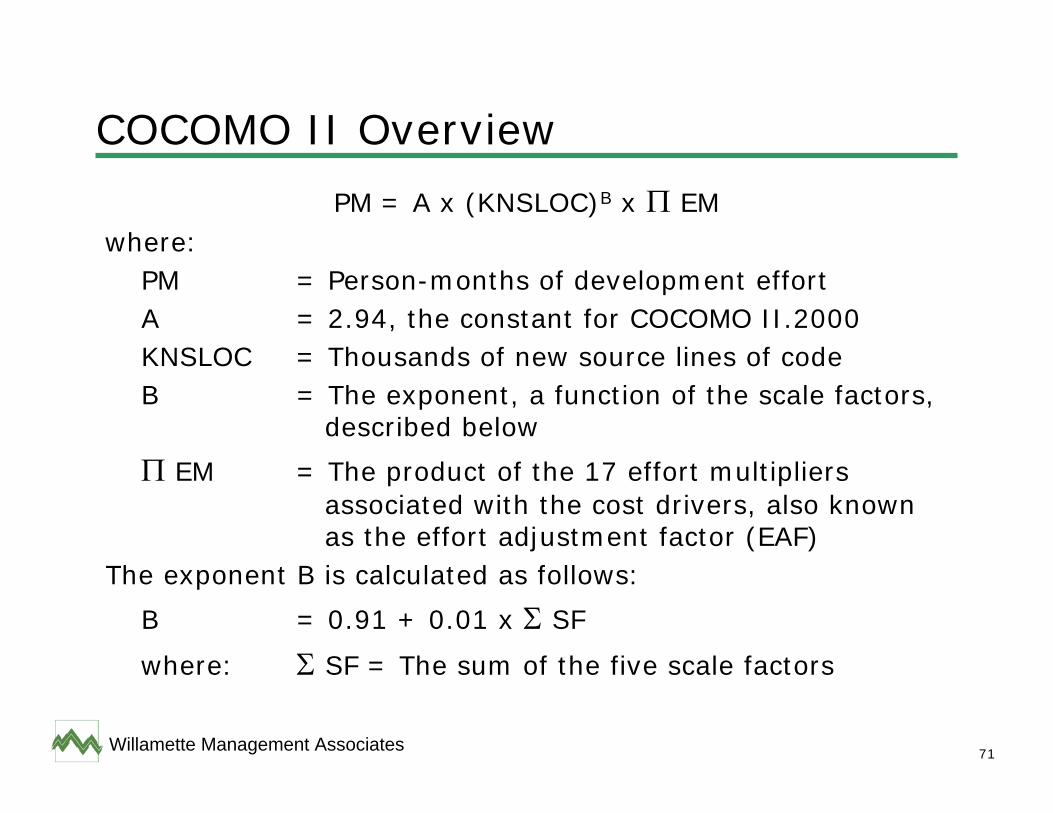
COCOMO II Overview
PM = A x (KNSLOC)B x Π EMwhere:
PM = Person-months of development effortA = 2.94, the constant for COCOMO II.2000KNSLOC = Thousands of new source lines of codeB = The exponent, a function of the scale factors,
described below
Π EM = The product of the 17 effort multipliers associated with the cost drivers, also known as the effort adjustment factor (EAF)
The exponent B is calculated as follows:
B = 0.91 + 0.01 x Σ SF
where: Σ SF = The sum of the five scale factors
72Willamette Management Associates
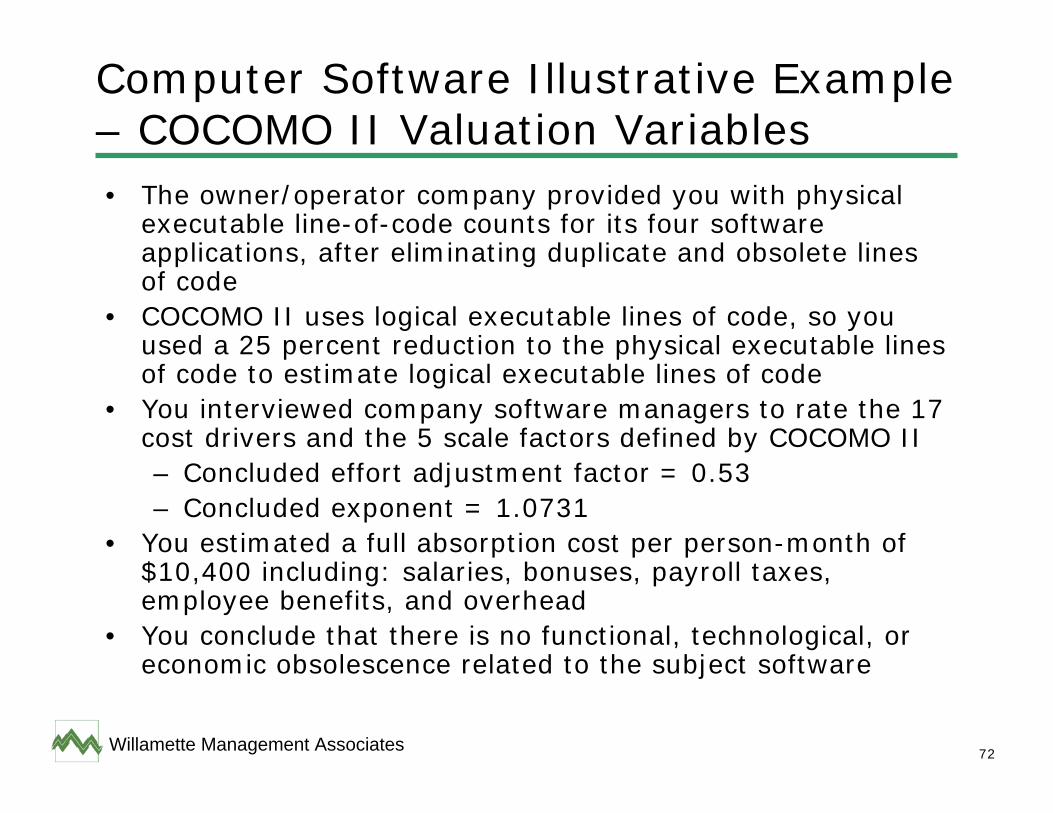
Computer Software Illustrative Example – COCOMO II Valuation Variables• The owner/operator company provided you with physical
executable line-of-code counts for its four software applications, after eliminating duplicate and obsolete lines of code
• COCOMO II uses logical executable lines of code, so you used a 25 percent reduction to the physical executable lines of code to estimate logical executable lines of code
• You interviewed company software managers to rate the 17 cost drivers and the 5 scale factors defined by COCOMO II– Concluded effort adjustment factor = 0.53– Concluded exponent = 1.0731
• You estimated a full absorption cost per person-month of $10,400 including: salaries, bonuses, payroll taxes, employee benefits, and overhead
• You conclude that there is no functional, technological, or economic obsolescence related to the subject software
73Willamette Management Associates
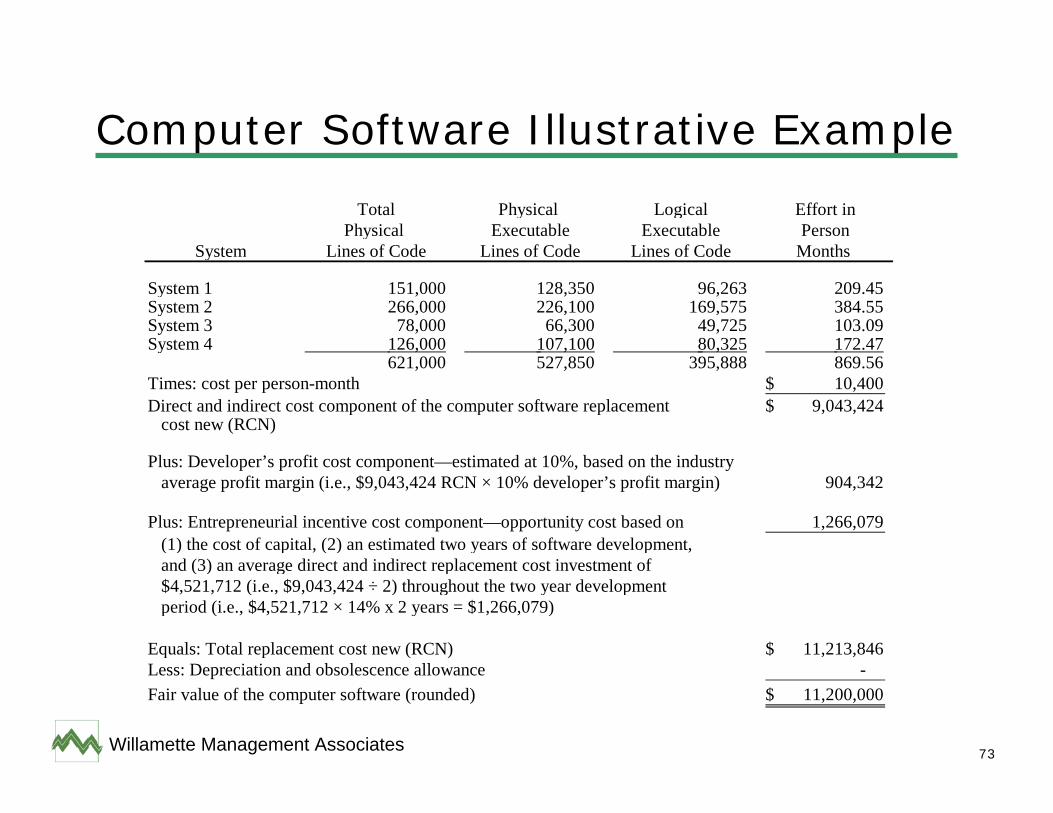
Computer Software Illustrative Example
Total Physical Logical Effort inPhysical Executable Executable Person
System Lines of Code Lines of Code Lines of Code Months
System 1 151,000 128,350 96,263 209.45 System 2 266,000 226,100 169,575 384.55 System 3 78,000 66,300 49,725 103.09 System 4 126,000 107,100 80,325 172.47
621,000 527,850 395,888 869.56 Times: cost per person-month 10,400$ Direct and indirect cost component of the computer software replacement 9,043,424$ cost new (RCN)
Plus: Developer’s profit cost component—estimated at 10%, based on the industry average profit margin (i.e., $9,043,424 RCN × 10% developer’s profit margin) 904,342
Plus: Entrepreneurial incentive cost component—opportunity cost based on 1,266,079 (1) the cost of capital, (2) an estimated two years of software development, and (3) an average direct and indirect replacement cost investment of $4,521,712 (i.e., $9,043,424 ÷ 2) throughout the two year development period (i.e., $4,521,712 × 14% x 2 years = $1,266,079)
Equals: Total replacement cost new (RCN) 11,213,846$ Less: Depreciation and obsolescence allowance - Fair value of the computer software (rounded) 11,200,000$
74Willamette Management Associates
Assembled Workforce and SFAS Nos. 141R and 142• Assembled workforce is not an identifiable intangible asset
under SFAS No. 141R• However, the valuation of an assembled workforce may be
necessary in order to estimate a capital charge to be used when using an income approach to estimate the value of other intangible assets under SFAS No. 141R
• Also, the valuation of an assembled workforce may be necessary so that this value can be subtracted in testing goodwill for impairment under SFAS No. 142
75Willamette Management Associates
Assembled Workforce Cost Approach Valuation Analysis1. Based on the economic principle of substitution – i.e., the
cost to create a substitute workforce2. Replacement cost new – the cost to create the ideal
workforceReproduction cost new – the cost to recreate the actual current workforce
3. Four cost components• Direct costs – recruitment/relocation fees• Indirect costs – interview/hiring/training time• Developer’s profit – return on direct and indirect costs• Entrepreneurial incentive – lost income during the
workforce assemblage period (i.e., an opportunity cost)
76Willamette Management Associates
Assembled Workforce Cost Approach Valuation Analysis (cont.)4. The depreciation components
• Physical deterioration – e.g., age, injury• Functional obsolescence – e.g., classifications, excess
employees• External obsolescence – e.g., union contract
requirements5. Value is not RCN
Value is RCNLD
77Willamette Management Associates
Economic Attributes of the Assembled Workforce Intangible Asset• Workforce-related human capital• The assembled workforce intangible asset is the:
– Expectation that employees will be trained– Expectation that employees will be assembled– Expectation that employees will be efficient– Expectation that the subject workforce will be an optimal
size
78Willamette Management Associates
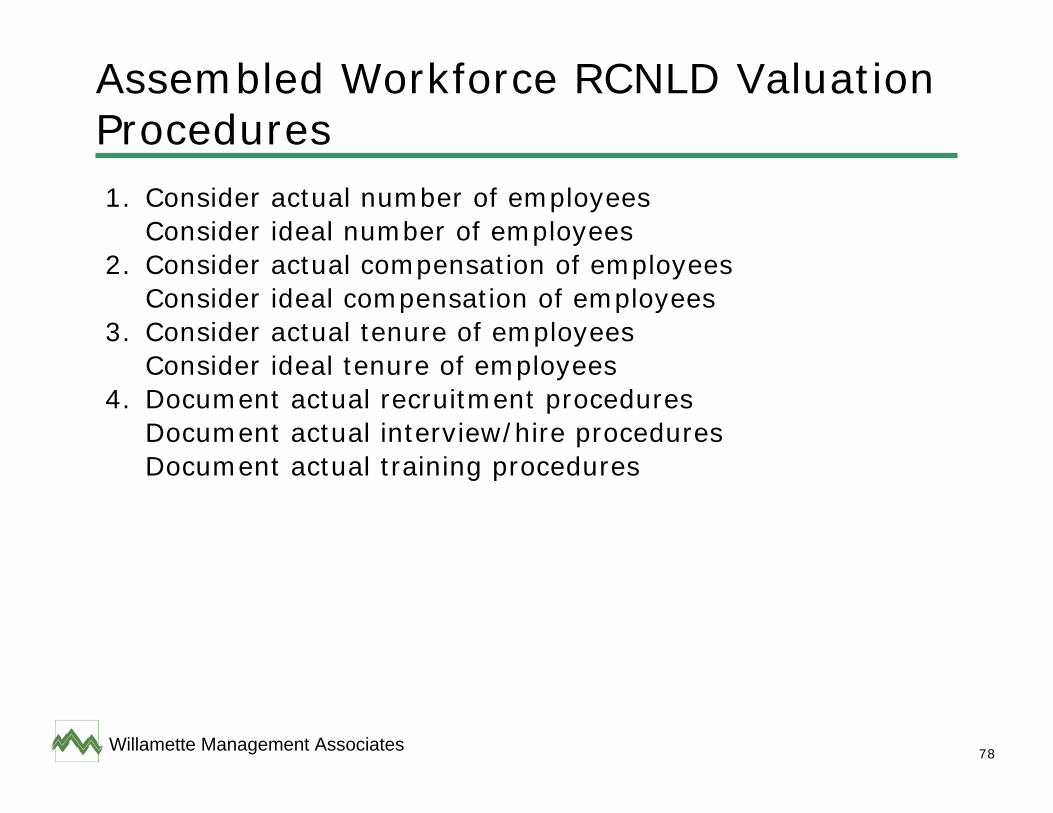
Assembled Workforce RCNLD Valuation Procedures1. Consider actual number of employees
Consider ideal number of employees2. Consider actual compensation of employees
Consider ideal compensation of employees3. Consider actual tenure of employees
Consider ideal tenure of employees4. Document actual recruitment procedures
Document actual interview/hire proceduresDocument actual training procedures
79Willamette Management Associates
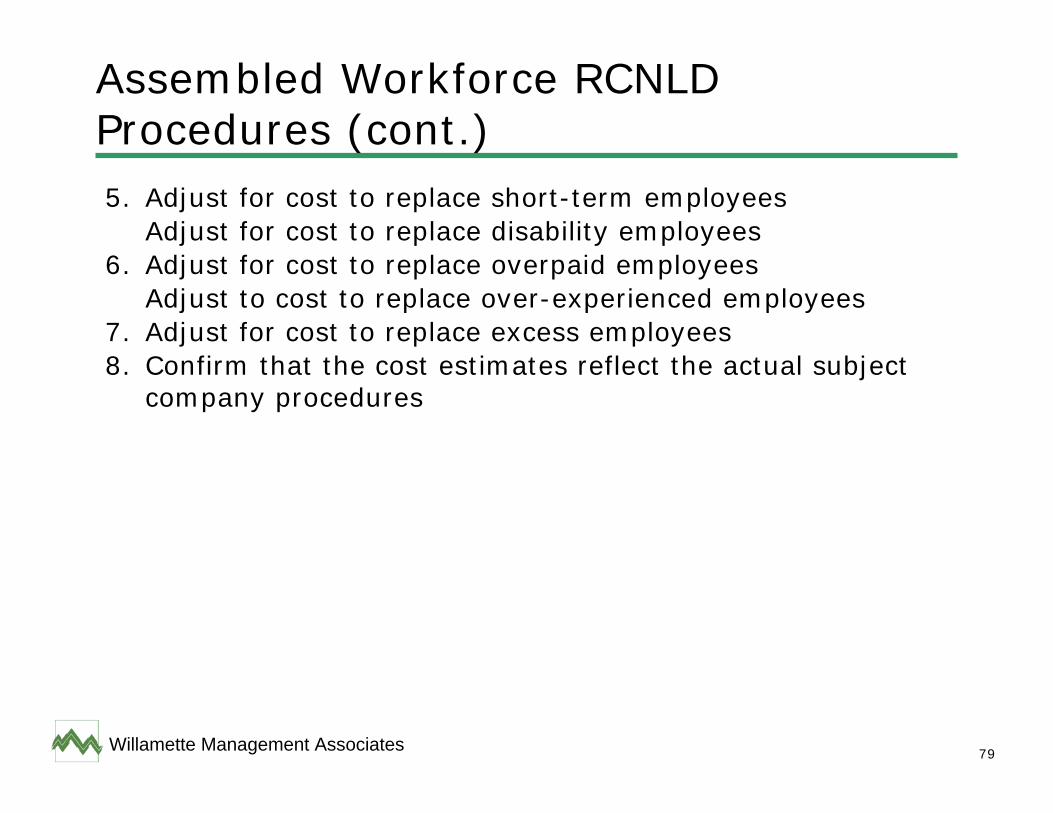
Assembled Workforce RCNLD Procedures (cont.)5. Adjust for cost to replace short-term employees
Adjust for cost to replace disability employees6. Adjust for cost to replace overpaid employees
Adjust to cost to replace over-experienced employees7. Adjust for cost to replace excess employees8. Confirm that the cost estimates reflect the actual subject
company procedures
80Willamette Management Associates
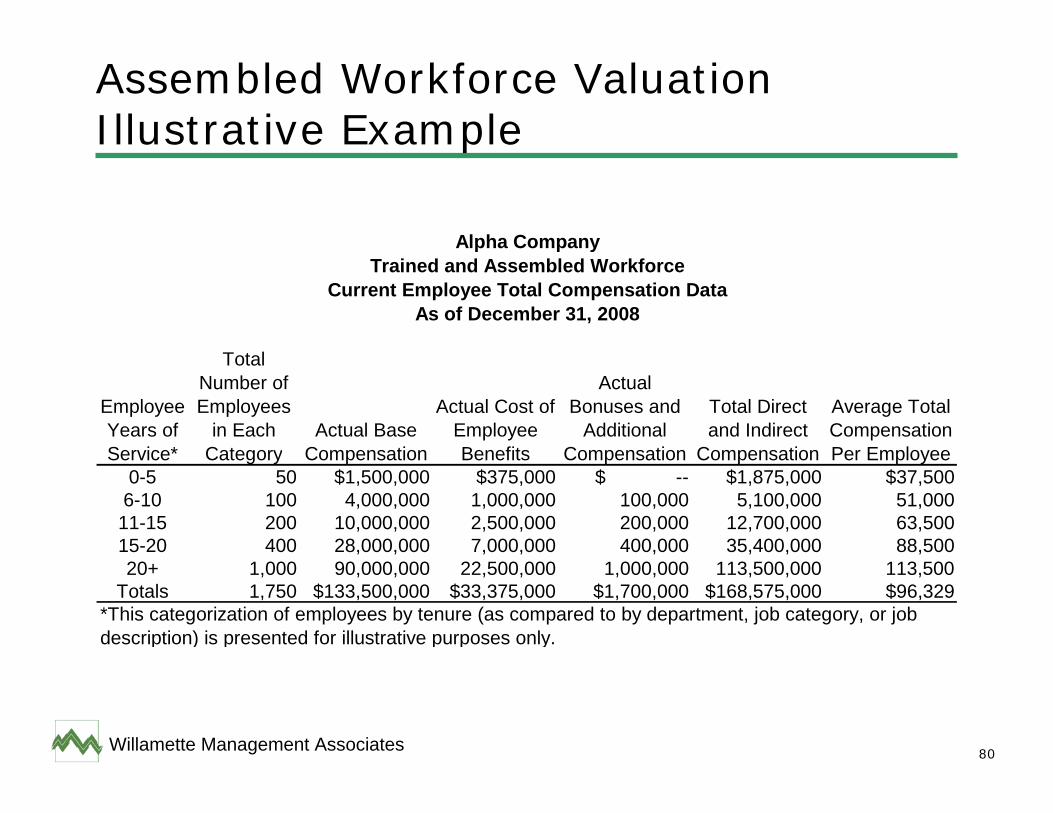
Assembled Workforce Valuation Illustrative Example
Employee Years of Service*
Total Number of Employees
in Each Category
Actual Base Compensation
Actual Cost of Employee Benefits
Actual Bonuses and
Additional Compensation
Total Direct and Indirect
Compensation
Average Total Compensation Per Employee
0-5 50 $1,500,000 $375,000 $ -- $1,875,000 $37,500 6-10 100 4,000,000 1,000,000 100,000 5,100,000 51,00011-15 200 10,000,000 2,500,000 200,000 12,700,000 63,50015-20 400 28,000,000 7,000,000 400,000 35,400,000 88,50020+ 1,000 90,000,000 22,500,000 1,000,000 113,500,000 113,500
Totals 1,750 $133,500,000 $33,375,000 $1,700,000 $168,575,000 $96,329 *This categorization of employees by tenure (as compared to by department, job category, or job description) is presented for illustrative purposes only.
Alpha CompanyTrained and Assembled Workforce
Current Employee Total Compensation DataAs of December 31, 2008
81Willamette Management Associates
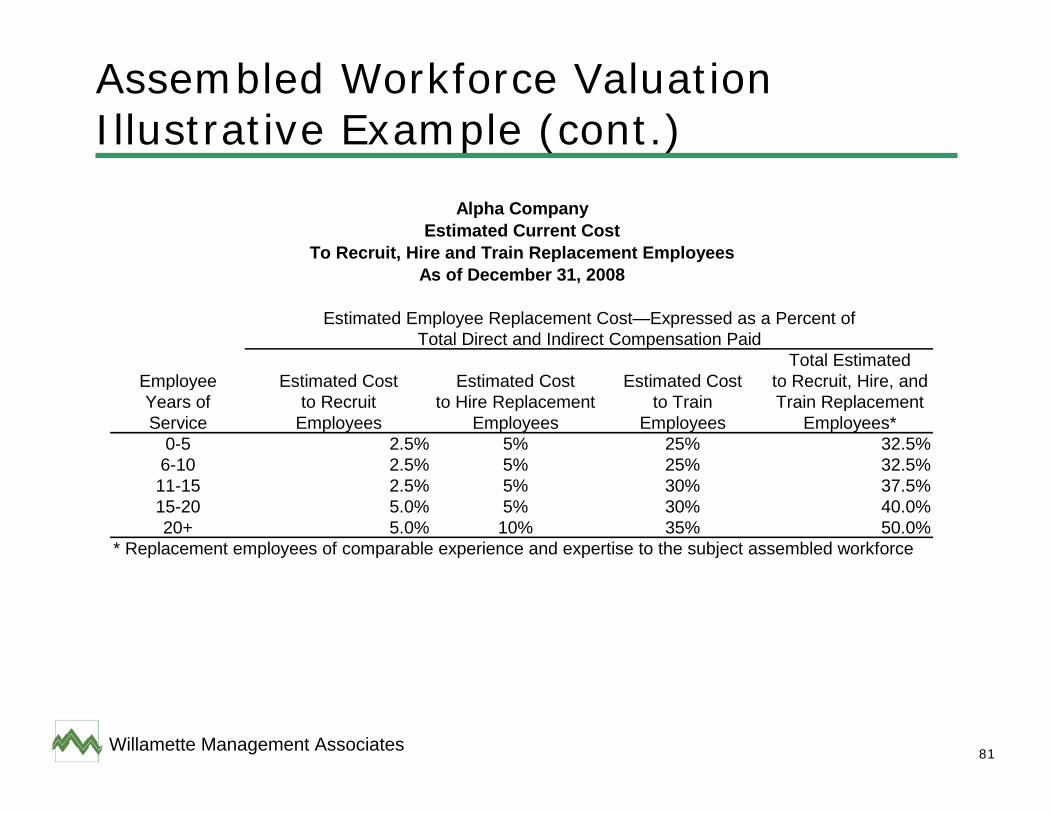
Assembled Workforce Valuation Illustrative Example (cont.)
Total Estimated Employee Estimated Cost Estimated Cost Estimated Cost to Recruit, Hire, andYears of to Recruit to Hire Replacement to Train Train ReplacementService Employees Employees Employees Employees*
0-5 2.5% 5% 25% 32.5%6-10 2.5% 5% 25% 32.5%11-15 2.5% 5% 30% 37.5%15-20 5.0% 5% 30% 40.0%20+ 5.0% 10% 35% 50.0%
Estimated Employee Replacement Cost—Expressed as a Percent ofTotal Direct and Indirect Compensation Paid
* Replacement employees of comparable experience and expertise to the subject assembled workforce
Alpha CompanyEstimated Current Cost
To Recruit, Hire and Train Replacement EmployeesAs of December 31, 2008
82Willamette Management Associates
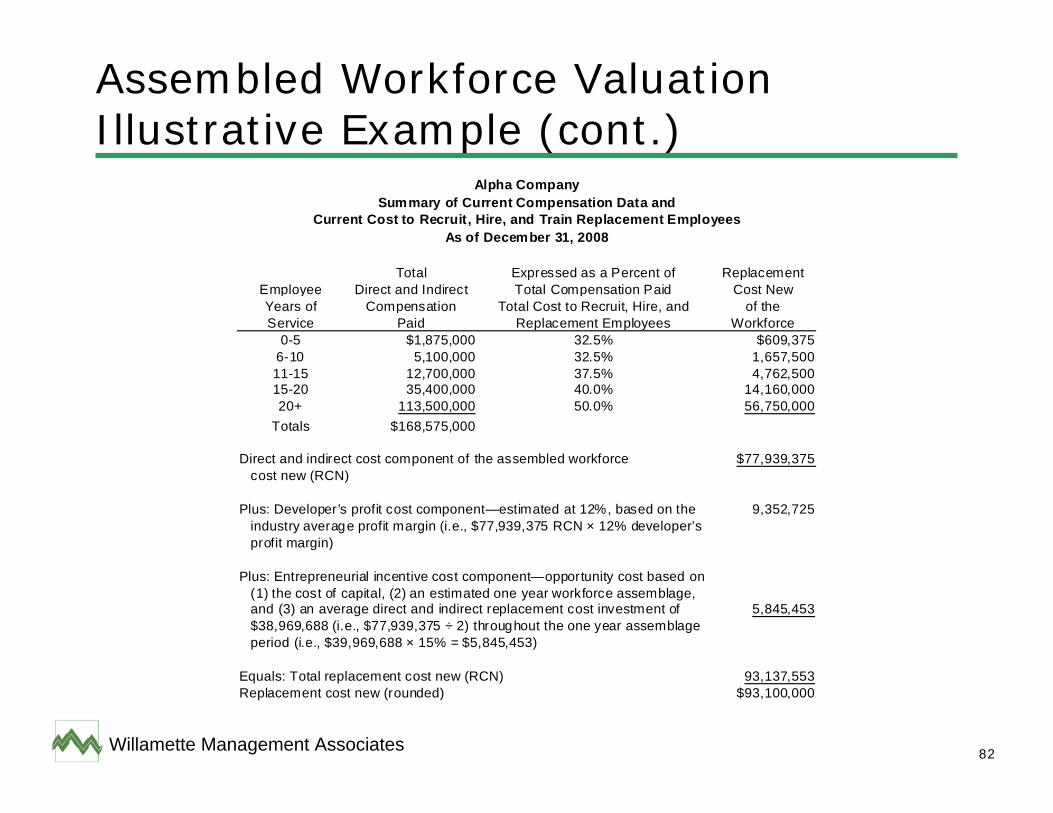
Assembled Workforce Valuation Illustrative Example (cont.)
Total Expressed as a Percent of ReplacementEmployee Direct and Indirect Total Compensation Paid Cost NewYears of Compensation Total Cost to Recruit, Hire, and of the Service Paid Replacement Employees Workforce
0-5 $1,875,000 32.5% $609,375 6-10 5,100,000 32.5% 1,657,50011-15 12,700,000 37.5% 4,762,50015-20 35,400,000 40.0% 14,160,00020+ 113,500,000 50.0% 56,750,000
Totals $168,575,000
profit margin)
5,845,453
93,137,553$93,100,000 Replacement cost new (rounded)
Alpha CompanySummary of Current Compensation Data and
Current Cost to Recruit, Hire, and Train Replacement EmployeesAs of December 31, 2008
and (3) an average direct and indirect replacement cost investment of $38,969,688 (i.e., $77,939,375 ÷ 2) throughout the one year assemblage period (i.e., $39,969,688 × 15% = $5,845,453)
Equals: Total replacement cost new (RCN)
industry average profit margin (i.e., $77,939,375 RCN × 12% developer’s 9,352,725
Plus: Entrepreneurial incentive cost component—opportunity cost based on (1) the cost of capital, (2) an estimated one year workforce assemblage,
Direct and indirect cost component of the assembled workforce cost new (RCN)
$77,939,375
Plus: Developer’s profit cost component—estimated at 12%, based on the
83Willamette Management Associates
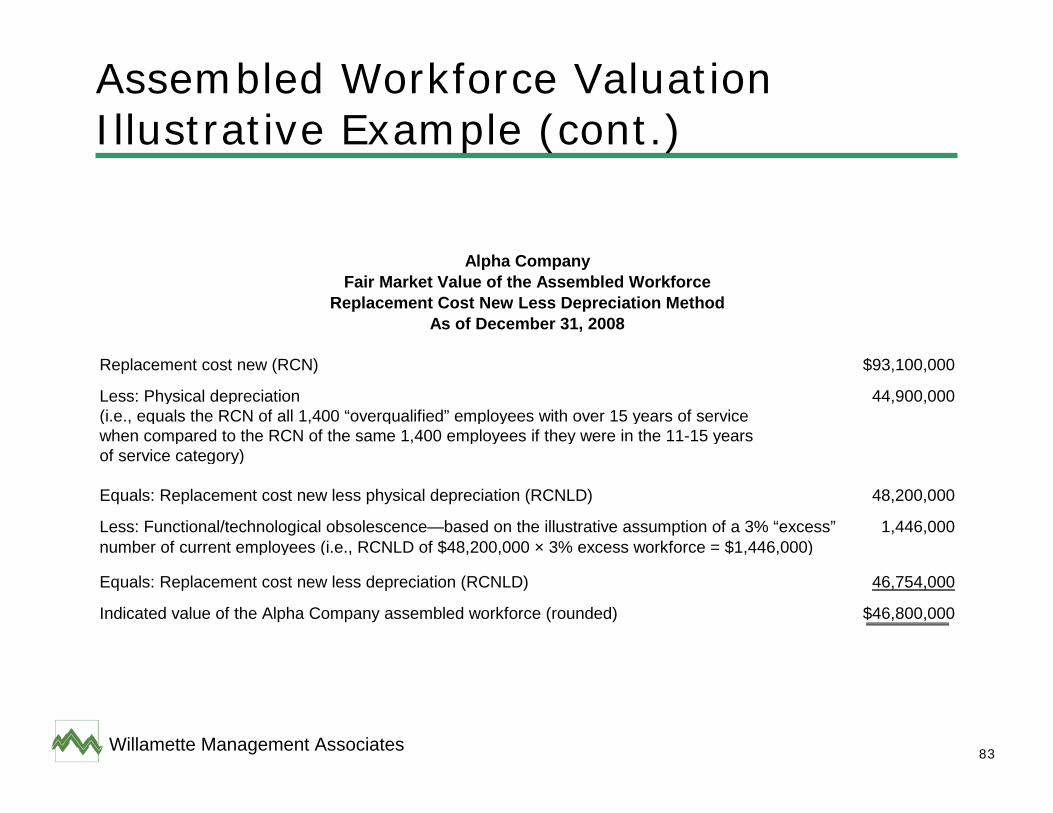
Assembled Workforce Valuation Illustrative Example (cont.)
Less: Physical depreciation(i.e., equals the RCN of all 1,400 “overqualified” employees with over 15 years of service when compared to the RCN of the same 1,400 employees if they were in the 11-15 yearsof service category)
Less: Functional/technological obsolescence—based on the illustrative assumption of a 3% “excess” number of current employees (i.e., RCNLD of $48,200,000 × 3% excess workforce = $1,446,000)
Indicated value of the Alpha Company assembled workforce (rounded) $46,800,000
1,446,000
Equals: Replacement cost new less depreciation (RCNLD) 46,754,000
Replacement cost new (RCN) $93,100,000
44,900,000
Equals: Replacement cost new less physical depreciation (RCNLD) 48,200,000
Alpha CompanyFair Market Value of the Assembled Workforce
Replacement Cost New Less Depreciation MethodAs of December 31, 2008
84Willamette Management Associates
Patent Market Approach Valuation Analysis1. You are retained to perform an SFAS No. 141R business
combination purchase accounting price allocation of Val Aid Corp (VAC), a pharmaceutical company.
2. VAC owns a number of patents on pharmaceutical drug compounds.
3. You decide to use the relief from royalty method to value the patent for one drug—ABVigor (ABV).
4. ABV treats a common valuation analyst condition—economic dysfunction (ED).
5. Analysts with ED can’t produce valuations that stand up to robust professional standards.
85Willamette Management Associates
Patent Market Approach Valuation Analysis (cont.)6. These flaccid valuations don’t satisfy the analyst’s client.7. ABV allows analysts to achieve a firm conclusion whenever
their client is ready.8. Analysts who experience rigid thinking for more than 4
hours should see a physician.
86Willamette Management Associates
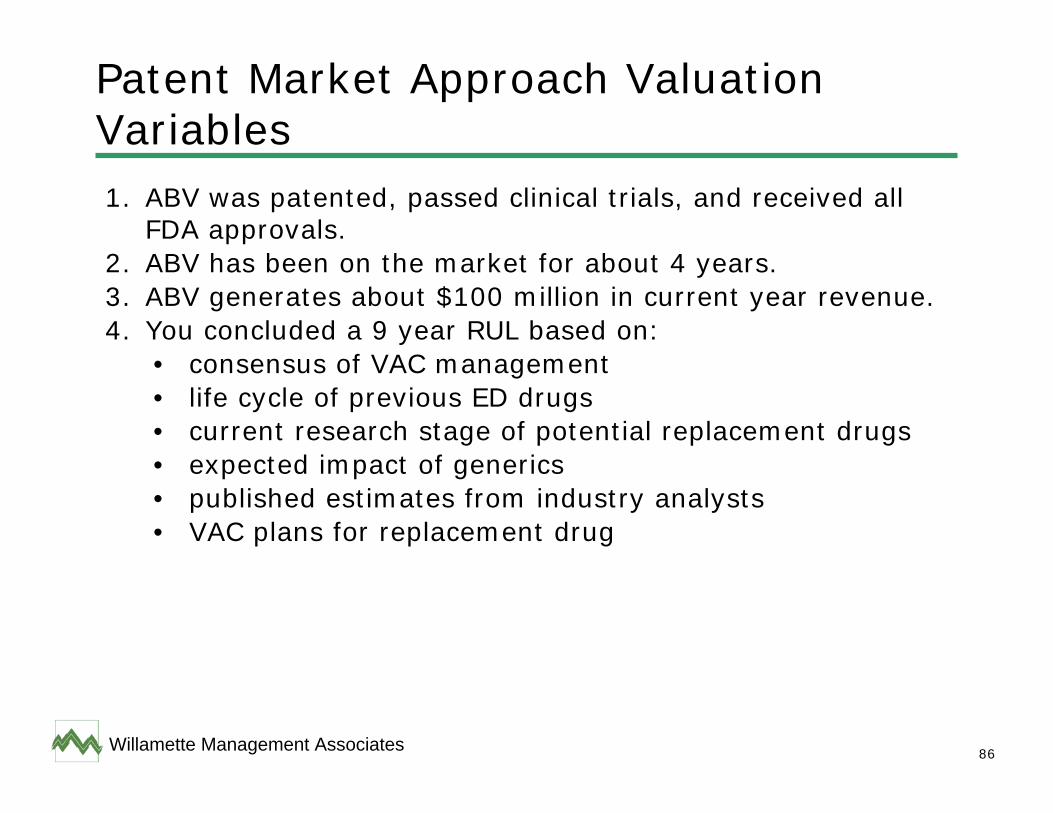
Patent Market Approach Valuation Variables1. ABV was patented, passed clinical trials, and received all
FDA approvals.2. ABV has been on the market for about 4 years.3. ABV generates about $100 million in current year revenue.4. You concluded a 9 year RUL based on:
• consensus of VAC management• life cycle of previous ED drugs• current research stage of potential replacement drugs• expected impact of generics• published estimates from industry analysts• VAC plans for replacement drug
87Willamette Management Associates
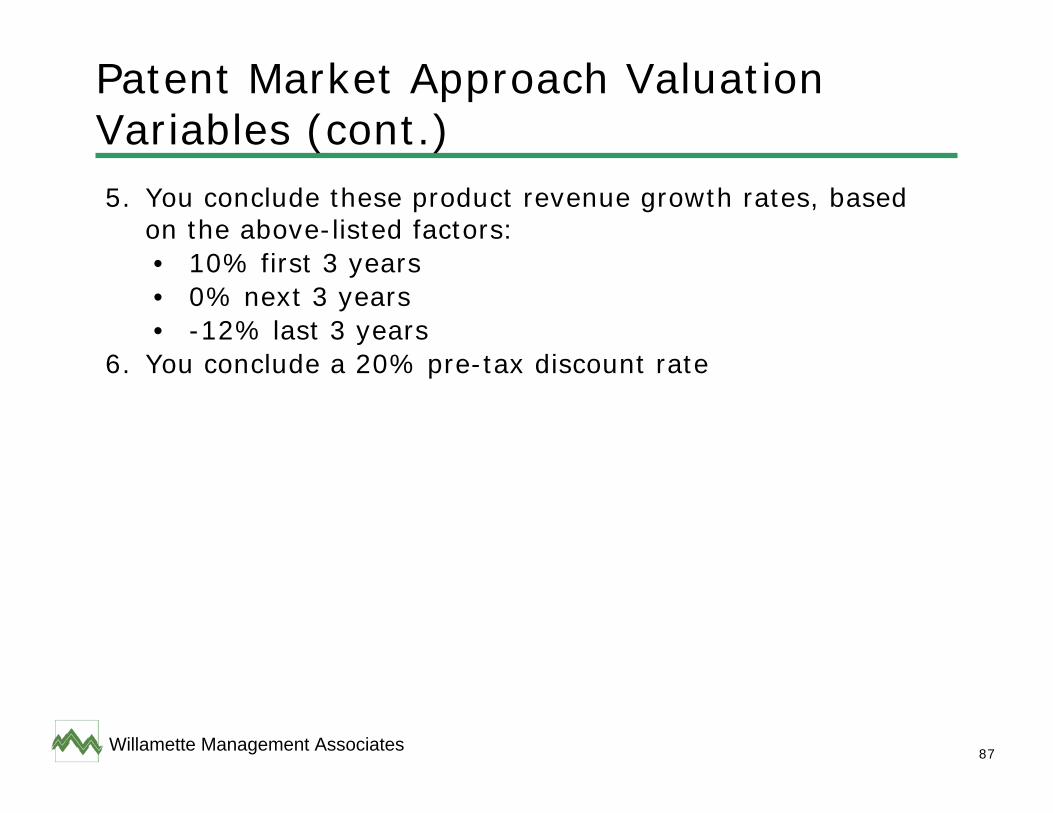
Patent Market Approach Valuation Variables (cont.)5. You conclude these product revenue growth rates, based
on the above-listed factors:• 10% first 3 years• 0% next 3 years• -12% last 3 years
6. You conclude a 20% pre-tax discount rate
88Willamette Management Associates
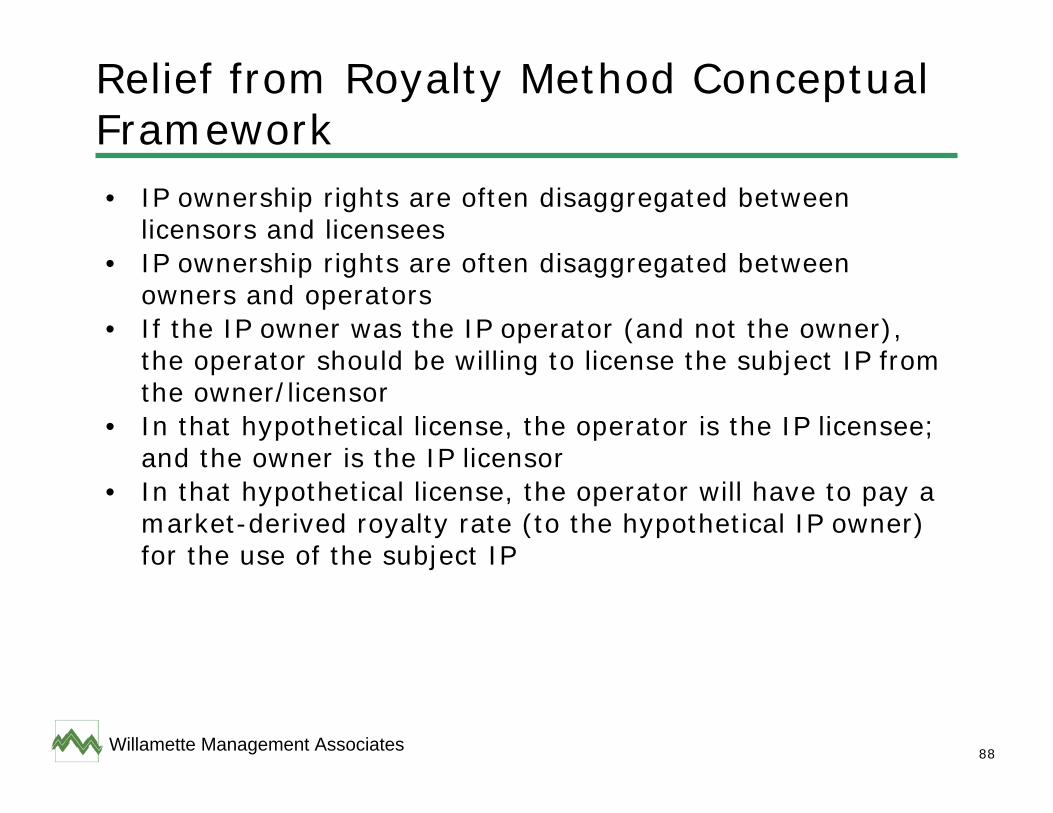
Relief from Royalty Method Conceptual Framework• IP ownership rights are often disaggregated between
licensors and licensees• IP ownership rights are often disaggregated between
owners and operators• If the IP owner was the IP operator (and not the owner),
the operator should be willing to license the subject IP from the owner/licensor
• In that hypothetical license, the operator is the IP licensee; and the owner is the IP licensor
• In that hypothetical license, the operator will have to pay a market-derived royalty rate (to the hypothetical IP owner) for the use of the subject IP
89Willamette Management Associates
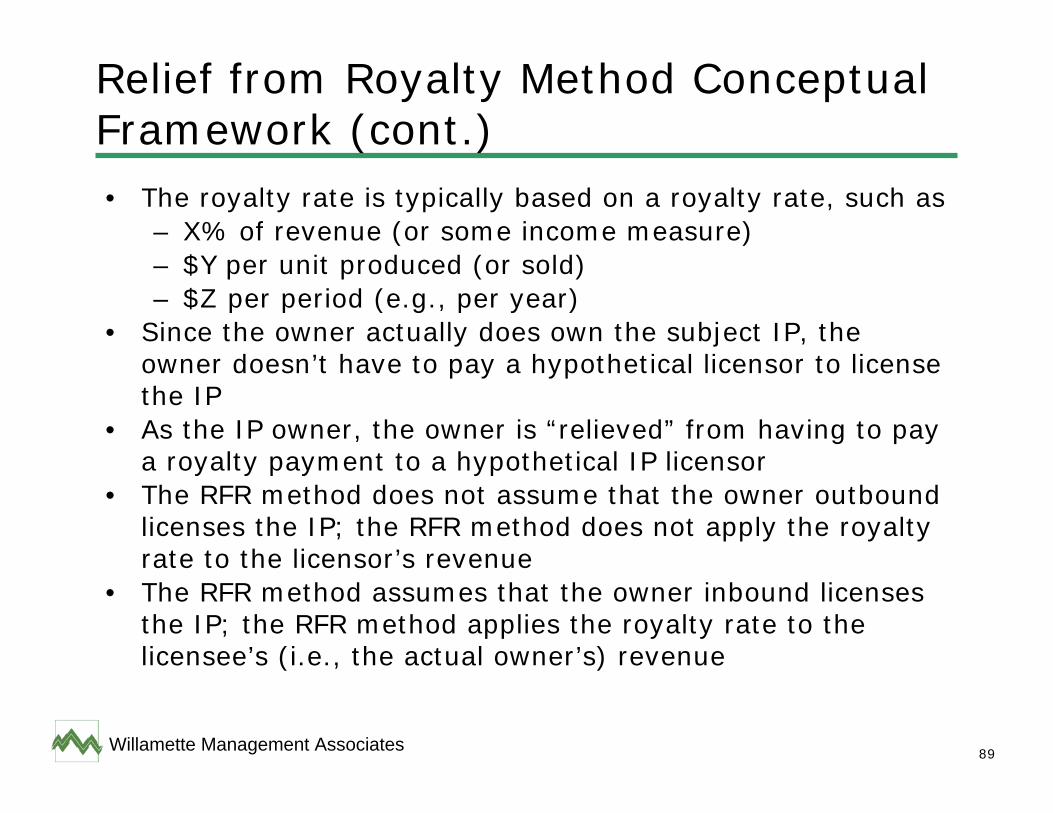
Relief from Royalty Method Conceptual Framework (cont.)• The royalty rate is typically based on a royalty rate, such as
– X% of revenue (or some income measure)– $Y per unit produced (or sold)– $Z per period (e.g., per year)
• Since the owner actually does own the subject IP, the owner doesn’t have to pay a hypothetical licensor to license the IP
• As the IP owner, the owner is “relieved” from having to pay a royalty payment to a hypothetical IP licensor
• The RFR method does not assume that the owner outbound licenses the IP; the RFR method does not apply the royalty rate to the licensor’s revenue
• The RFR method assumes that the owner inbound licenses the IP; the RFR method applies the royalty rate to the licensee’s (i.e., the actual owner’s) revenue
90Willamette Management Associates
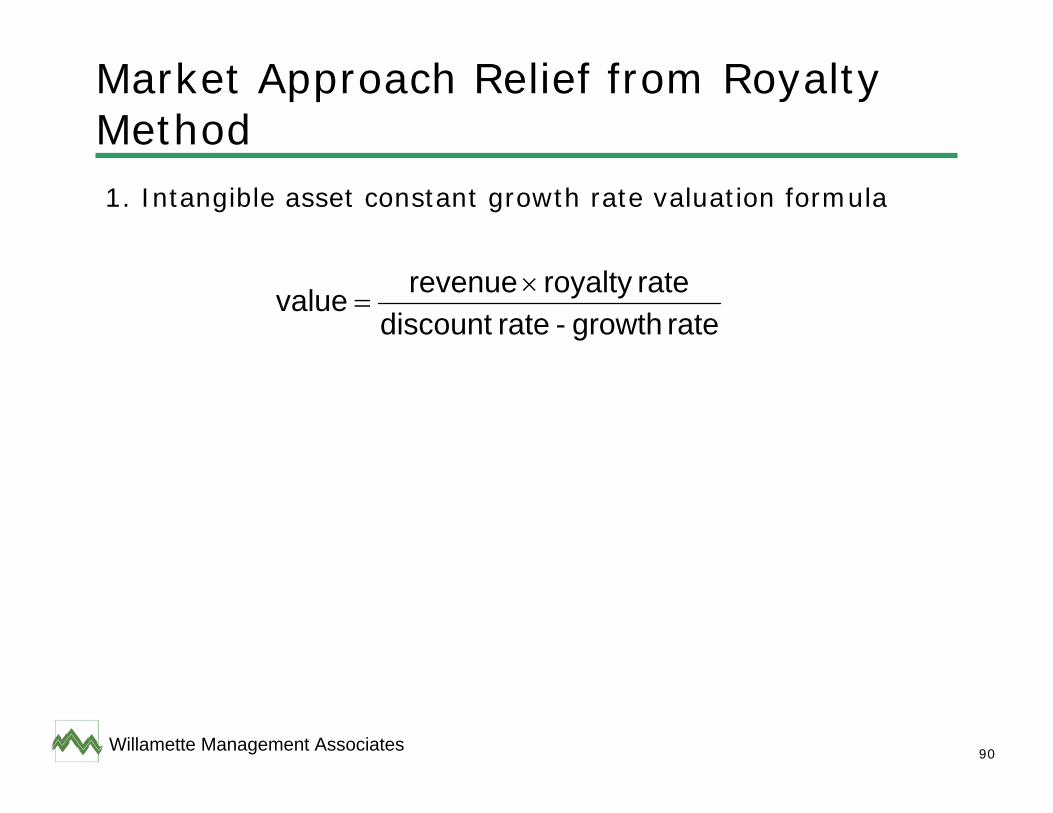
Market Approach Relief from Royalty Method1. Intangible asset constant growth rate valuation formula
rate growth - rate discount
rateroyalty revenue value ×=
91Willamette Management Associates
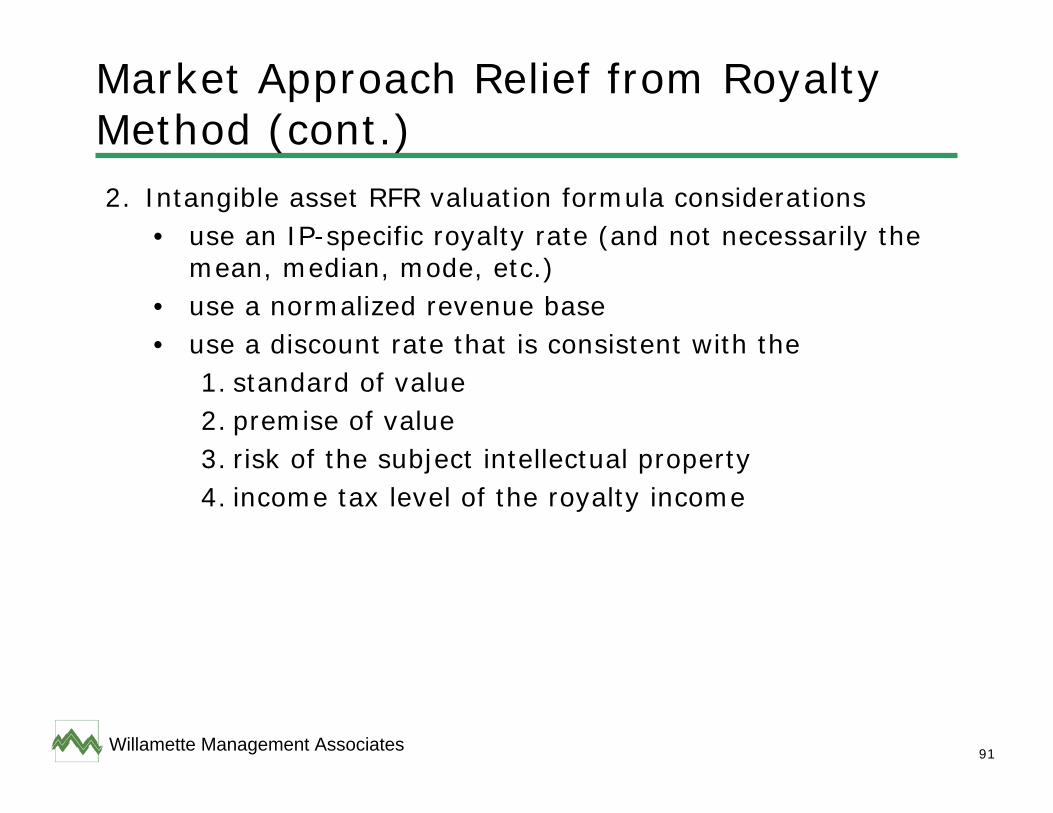
Market Approach Relief from Royalty Method (cont.)2. Intangible asset RFR valuation formula considerations
• use an IP-specific royalty rate (and not necessarily the mean, median, mode, etc.)
• use a normalized revenue base• use a discount rate that is consistent with the
1. standard of value2. premise of value3. risk of the subject intellectual property4. income tax level of the royalty income
92Willamette Management Associates
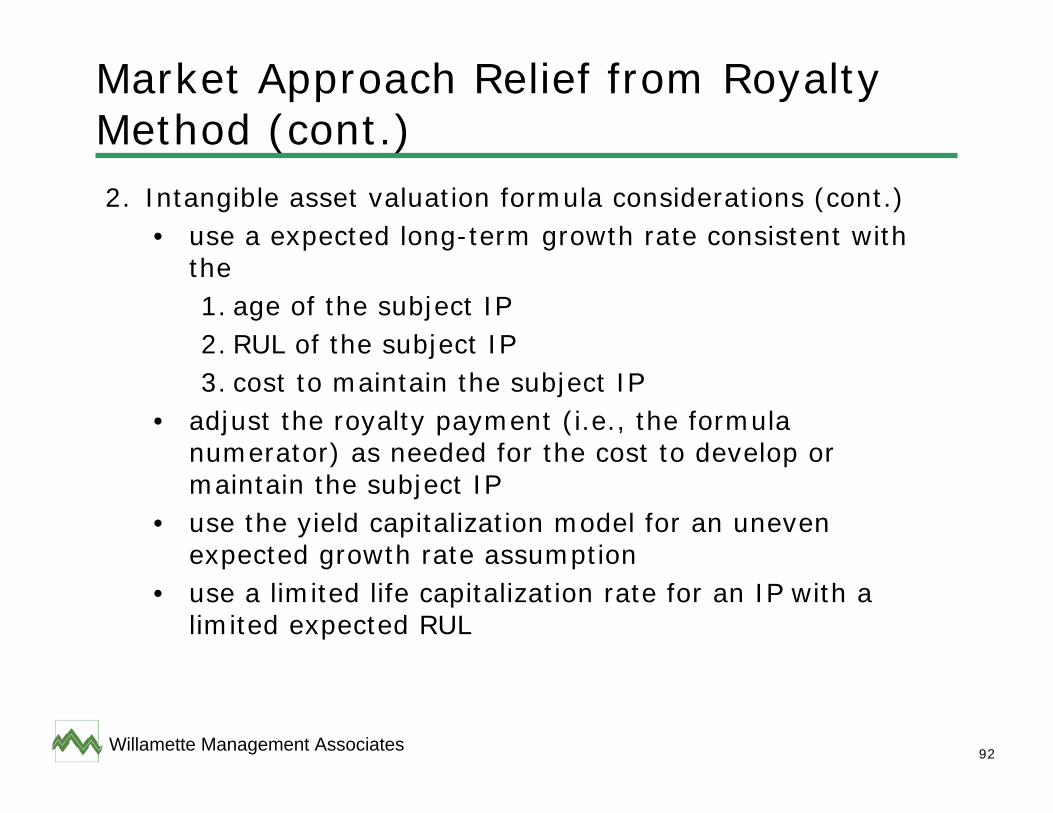
Market Approach Relief from Royalty Method (cont.)2. Intangible asset valuation formula considerations (cont.)
• use a expected long-term growth rate consistent with the1. age of the subject IP2. RUL of the subject IP3. cost to maintain the subject IP
• adjust the royalty payment (i.e., the formula numerator) as needed for the cost to develop or maintain the subject IP
• use the yield capitalization model for an uneven expected growth rate assumption
• use a limited life capitalization rate for an IP with a limited expected RUL
93Willamette Management Associates
Factors to Consider in the Application of the Relief from Royalty Method
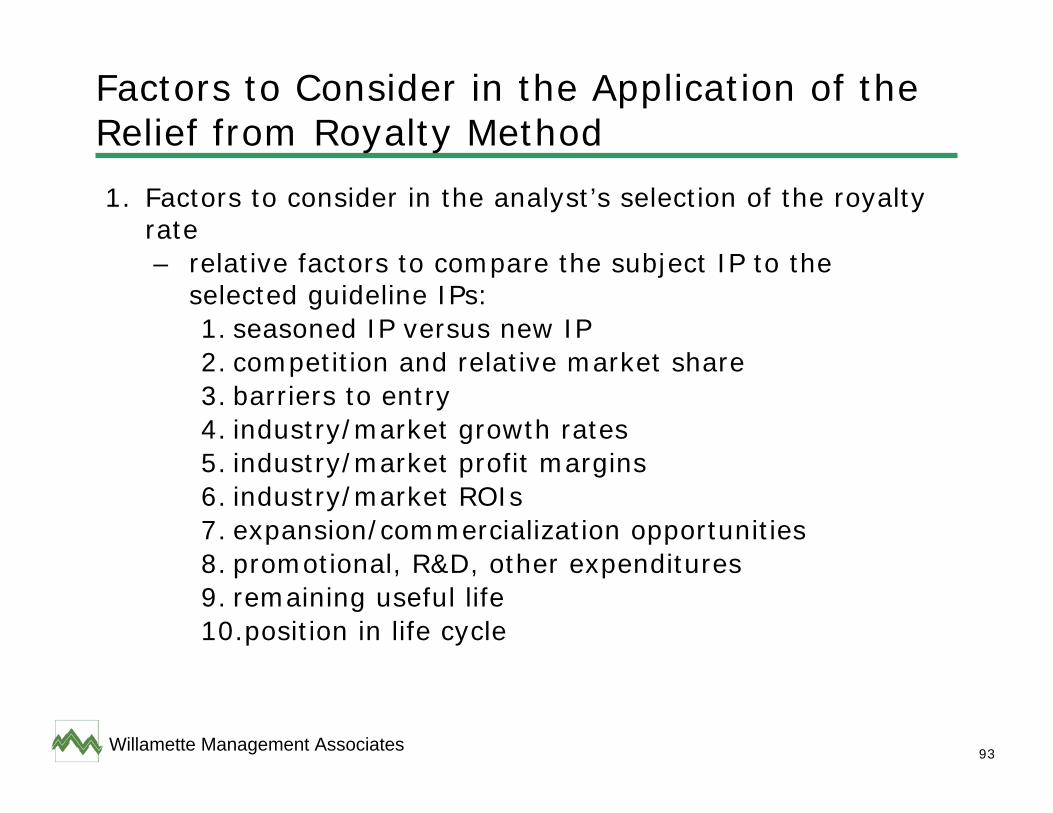
1. Factors to consider in the analyst’s selection of the royalty rate– relative factors to compare the subject IP to the
selected guideline IPs:1. seasoned IP versus new IP2. competition and relative market share3. barriers to entry4. industry/market growth rates5. industry/market profit margins6. industry/market ROIs7. expansion/commercialization opportunities8. promotional, R&D, other expenditures9. remaining useful life10.position in life cycle
94Willamette Management Associates
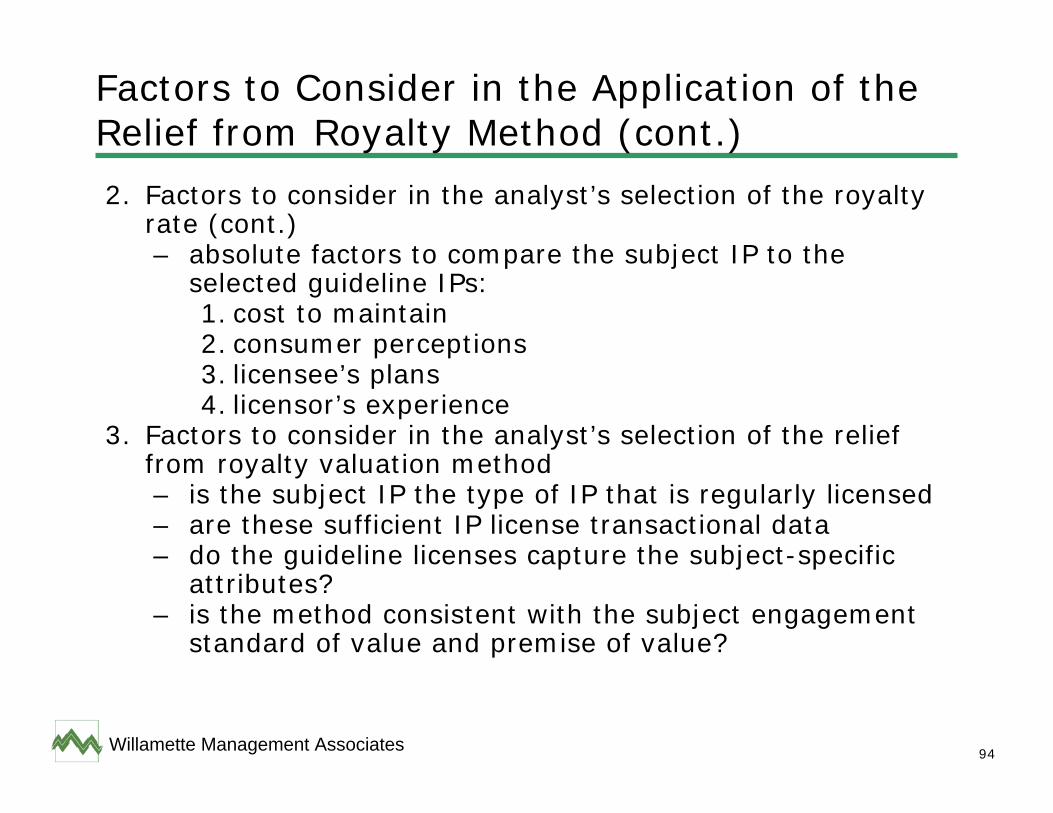
Factors to Consider in the Application of the Relief from Royalty Method (cont.)
2. Factors to consider in the analyst’s selection of the royalty rate (cont.)– absolute factors to compare the subject IP to the
selected guideline IPs:1. cost to maintain2. consumer perceptions3. licensee’s plans4. licensor’s experience
3. Factors to consider in the analyst’s selection of the relief from royalty valuation method– is the subject IP the type of IP that is regularly licensed– are these sufficient IP license transactional data– do the guideline licenses capture the subject-specific
attributes?– is the method consistent with the subject engagement
standard of value and premise of value?
95Willamette Management Associates
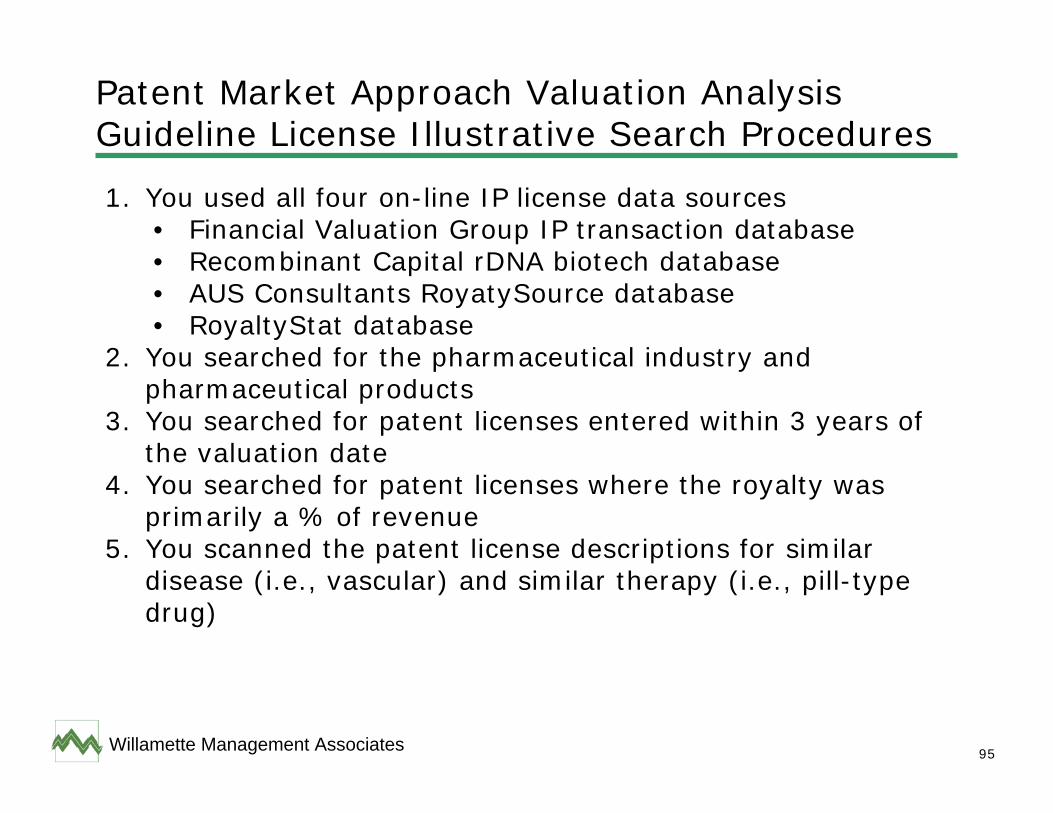
Patent Market Approach Valuation AnalysisGuideline License Illustrative Search Procedures
1. You used all four on-line IP license data sources• Financial Valuation Group IP transaction database• Recombinant Capital rDNA biotech database• AUS Consultants RoyatySource database• RoyaltyStat database
2. You searched for the pharmaceutical industry and pharmaceutical products
3. You searched for patent licenses entered within 3 years of the valuation date
4. You searched for patent licenses where the royalty was primarily a % of revenue
5. You scanned the patent license descriptions for similar disease (i.e., vascular) and similar therapy (i.e., pill-type drug)
96Willamette Management Associates
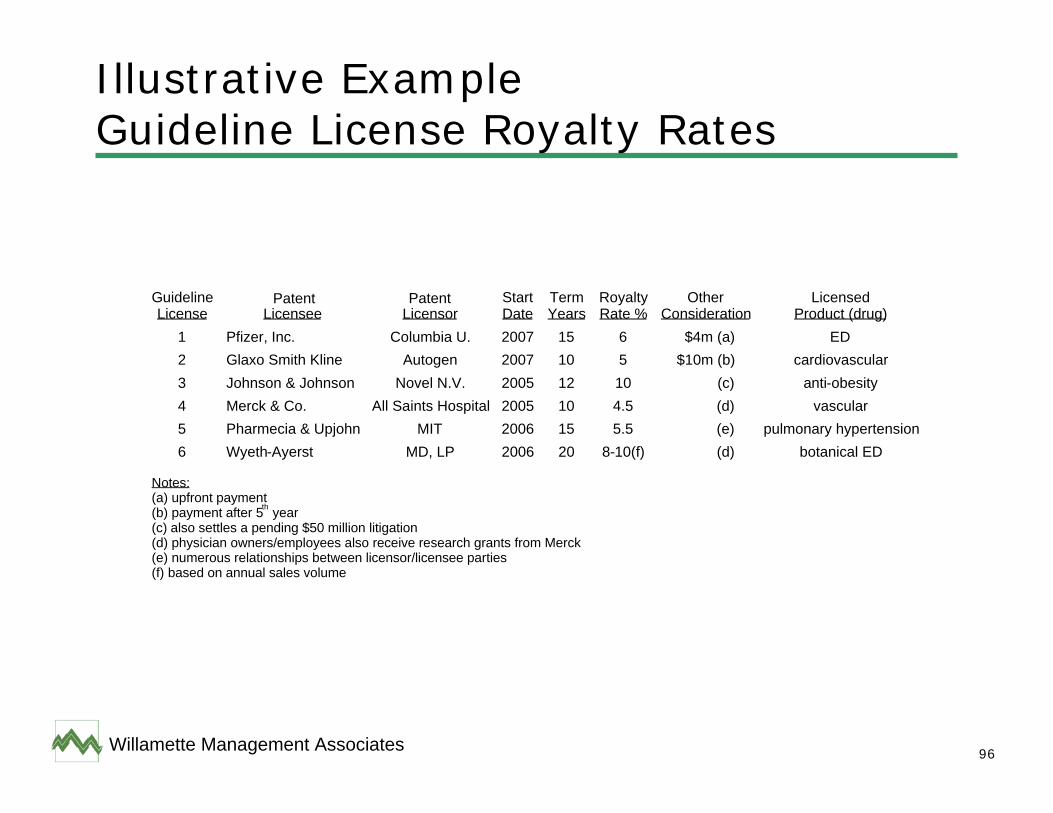
Illustrative ExampleGuideline License Royalty Rates
GuidelineLicense Licensee Licensor
StartDate
TermYears
RoyaltyRate %
OtherConsideration
LicensedProduct (drug)
1 Pfizer, Inc. Columbia U. 2007 15 6 $4m (a) ED2 Glaxo Smith Kline Autogen 2007 10 5 $10m (b) cardiovascular3 Johnson & Johnson Novel N.V. 2005 12 10 (c) anti-obesity4 Merck & Co. All Saints Hospital 2005 10 4.5 (d) vascular5 Pharmecia & Upjohn MIT 2006 15 5.5 (e) pulmonary hypertension6 Wyeth-Ayerst MD, LP 2006 20 8-10(f) (d) botanical ED
Notes:(a) upfront payment(b) payment after 5th year(c) also settles a pending $50 million litigation(d) physician owners/employees also receive research grants from Merck(e) numerous relationships between licensor/licensee parties(f) based on annual sales volume
Patent Patent
97Willamette Management Associates
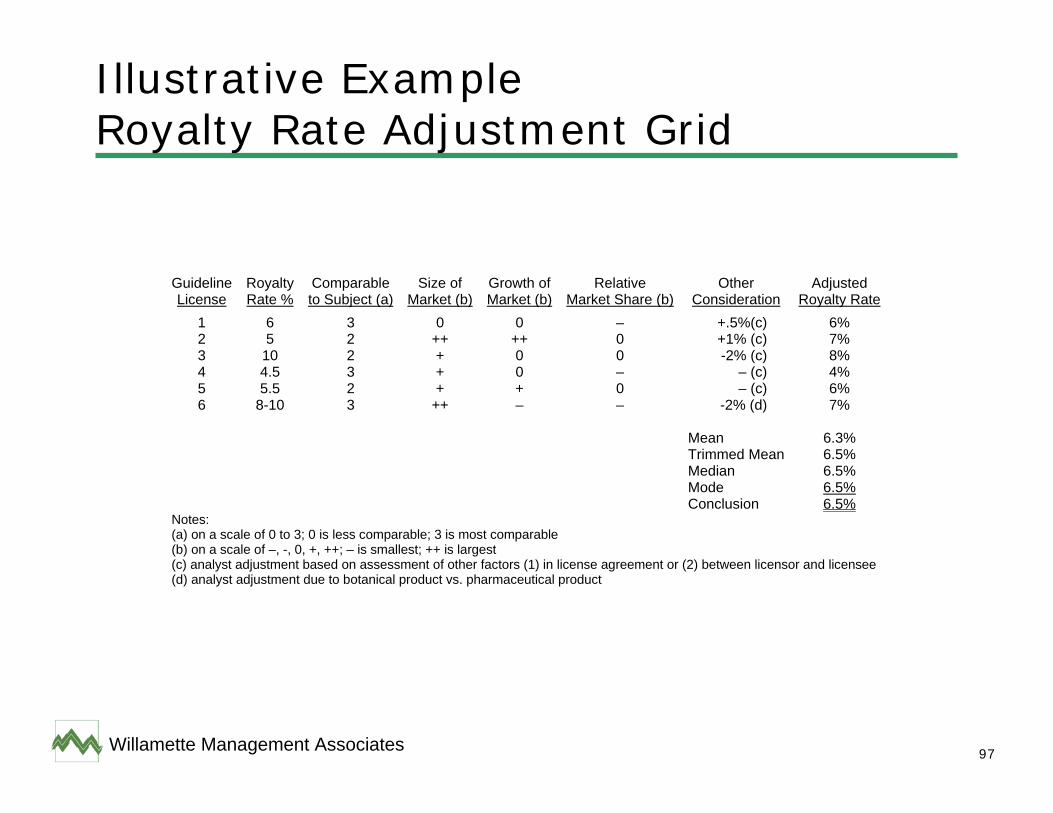
Illustrative Example Royalty Rate Adjustment Grid
Guideline License
Royalty Rate %
Comparable to Subject (a)
Size of Market (b)
Growth of Market (b)
Relative Market Share (b)
Other Consideration
Adjusted Royalty Rate
1 6 3 0 0 – +.5%(c) 6% 2 5 2 ++ ++ 0 +1% (c) 7% 3 10 2 + 0 0 -2% (c) 8% 4 4.5 3 + 0 – – (c) 4% 5 5.5 2 + + 0 – (c) 6% 6 8-10 3 ++ – – -2% (d) 7% Mean 6.3% Trimmed Mean 6.5% Median 6.5% Mode 6.5% Conclusion 6.5%
Notes: (a) on a scale of 0 to 3; 0 is less comparable; 3 is most comparable (b) on a scale of –, -, 0, +, ++; – is smallest; ++ is largest (c) analyst adjustment based on assessment of other factors (1) in license agreement or (2) between licensor and licensee (d) analyst adjustment due to botanical product vs. pharmaceutical product
98Willamette Management Associates
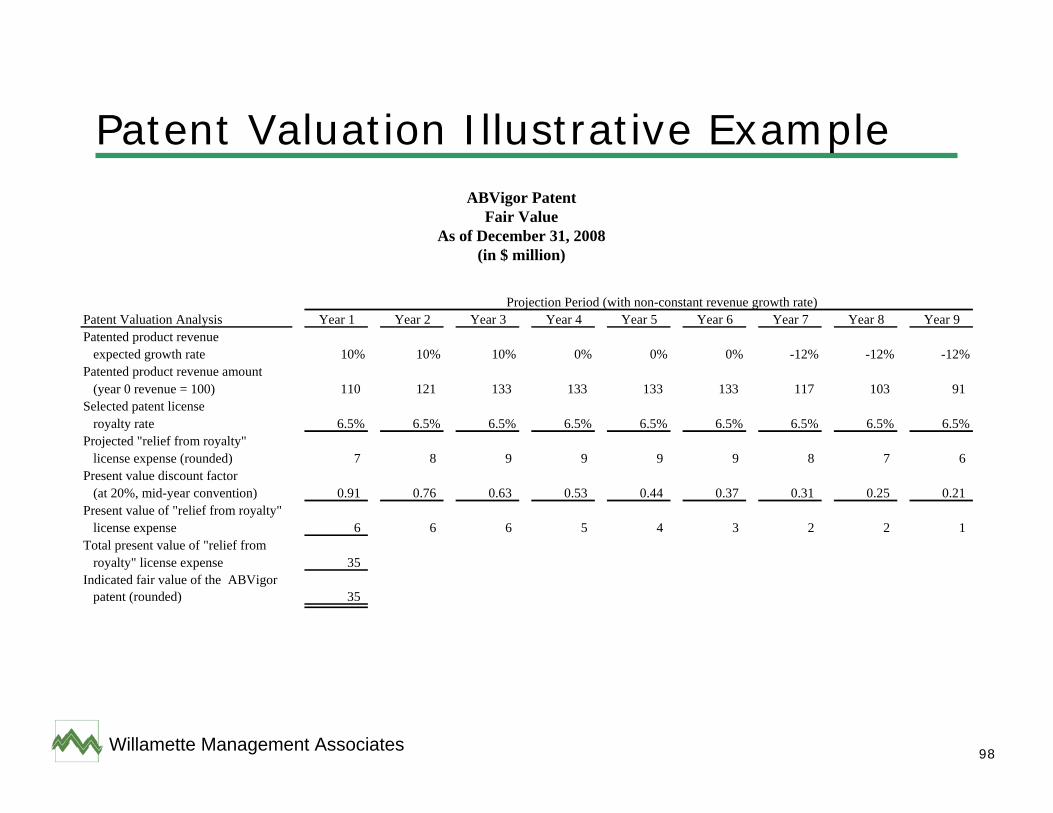
Patent Valuation Illustrative Example
Patent Valuation Analysis Year 1 Year 2 Year 3 Year 4 Year 5 Year 6 Year 7 Year 8 Year 9Patented product revenue
expected growth rate 10% 10% 10% 0% 0% 0% -12% -12% -12%Patented product revenue amount
(year 0 revenue = 100) 110 121 133 133 133 133 117 103 91Selected patent license
royalty rate 6.5% 6.5% 6.5% 6.5% 6.5% 6.5% 6.5% 6.5% 6.5%Projected "relief from royalty"
license expense (rounded) 7 8 9 9 9 9 8 7 6Present value discount factor
(at 20%, mid-year convention) 0.91 0.76 0.63 0.53 0.44 0.37 0.31 0.25 0.21Present value of "relief from royalty"
license expense 6 6 6 5 4 3 2 2 1Total present value of "relief from
royalty" license expense 35Indicated fair value of the ABVigor
patent (rounded) 35
Projection Period (with non-constant revenue growth rate)
ABVigor PatentFair Value
As of December 31, 2008(in $ million)
99Willamette Management Associates
Summary and Conclusion• Types of intangible assets• What is and isn’t an intangible asset• Reasons to value intangible assets• Intangible assts and generally accepted accounting
principles (GAAP)• Intangible assets and fair value measurements (FASB SFAS
No. 157) • Accounting for acquired intangible assets (FASB SFAS Nos.
141R, 142, and 144)• Intangible asset valuation approaches and methods• Intangible asset valuation illustrative examples• Questions and discussion


![VALUATION OF INTANGIBLE ASSETS[2][1]€¦ · Valuation of Intangible Assets - Goodwill & Patent Right, the Case of ABB Group Winfred Agbeko Torgby Emmanual Kofi Penney . Graduate](https://img.pdfslide.net/doc/110x75/5ebb63198161781ed85fc629/valuation-of-intangible-assets21-valuation-of-intangible-assets-goodwill-.jpg)