Embed Size (px)
Citation preview
Valuation of urban green space and provide management solutions
to increase prosperity and desirability of urban citizens
KOMEIL JAHANIFAR1*, ZAHRA ABEDI1, MOSTAFA JAFARI KOJOR1, MEHDI ZIAEI2, MAHDIYEH JAHANIMEHR3
1- Department of Environment and Energy, Science and Research Branch, Islamic Azad University, Tehran, IRAN Email: [email protected]
2- Department of Civil and Environment Engineering, University of Birjand, IRAN
3- Department of Management, Shomal University, Amol, IRAN
Abstract: - One cannot ignore the importance and role of parks and urban green space in providing the lost relief and welfare of people in industrial and civil life today as its importance and value is increasing day by day. Parks, having green space, provide a peaceful and suitable place for leisure and recreation. Recreation can include all leisure activities which rake place outdoors. Environment is regarded as a very valuable property form economic point of view with a wide economic range. Today, environmental economy uses different valuation methods to calculate the value of a park or an urban green space. Thereon, the value of Golestan e Noshirvani urban park in Babol was calculated by using valuated individual travel cost solution and physical and real carrying capacity of visitors from park. The results show that the average number of visitors in a day is 1000 -1100 people and the number of useful visiting days is 185. Regarding the average number of visitors and their traveling cost, the economic-recreational value of the park was estimated at 90.000 dollars in a useful day and 1.665.000 dollars in one year. Moreover, the physical carrying capacity of this park is estimated at 90.000 people per day and the real carrying capacity -after regarding restricting factors- is about 60.000 people per day.
Key-Words: Urban Park, Travel Cost Method, Carrying Capacity, Golestan e Noshirvani urban park.
1. Introduction
Today, valuation is one of the main and interesting issues for environmental issue experts and specialists. Over the past years, nonmarket goods like parks, woodlands, grasslands and wetlands have suffered much loss against the concept of sustainable development due to the lack of a real market to evaluate them. The main purpose of the economic valuation of goods and nonmarket services is to provide information which helps decision-makers to use available sources effectively and efficiently to maximize the social welfare and improvement [3]. It is necessary to analyze parks and resorts from economic and social views in order for principled planning [14].
In this regard, environmental management is a significant factor in controlling and monitoring human activities in order to protect and balance human-environment relationships to reach sustainable development. In today’s life, such valuations are inevitable and rejecting them will be regretted in the future. If valuation is based on units incomparable to other goods, people would just think that environmental services and goods are free and this will lead to unstable policy in various levels of decision-making [3]. Among them, economic valuation based on environmental economics can be used as an effective tool for the decision making and planning of development plans for managers and
Recent Researches in Environmental Science and Landscaping
ISBN: 978-1-61804-090-9 161
planners. The purpose of this research is to determine the recreational value of Noshirvani City Park as one of the main parks of northern Iran.
1.1 Theoretical principles
The idea of valuating parks and resorts has been followed seriously since 1947. Hatling suggests the highest calculated travel cost considered as the resort value or the cost of the farthest spot as the market price should be equal to one time use of resorts. The National Park Office of the US suggests the revenue from investment in resorts to be equal to or more than its costs as the recreational value since 1949. Vantrop suggests charging an entry fee for all American resorts systems in order to define the relationship between the cost and the times of using resorts as users' reactions toward the cost [1]. This method is similar to pricing for consumable goods and services. Clawson and Kenage proposed a method in which the number of users of recreational centers and the distance between their homes and the park are estimated after interviews. Kenage and Davis also conducted a study on users' willingness to pay the
entry fee or fees suggested by resort owners.
Ali Yakhkeshi in 1982 posed and studied the problem of resorts seriously for the first time in Iran. In 1987, Henric Majnunian carried out a research on the economic and social value estimation of two main parks in Tehran through Clawson Method. In her master's thesis advised by Dr. Abbas Esmaieli Sari in 2004, Katayun Pishkari valuated the economic-recreational value of Taleghani Park in Tehran. In her research, she used Clawson Method which is based on the estimation of the relationship between the number of people visiting a park and the distance from their homes to the park as well as on the average access cost [7]. Finally, the daily recreational value of Taleghani Park was calculated to be 42,400 dollars. In 1997, Kamiar Kavianpur carried out the economic valuation of Sisangan Forest Park. Accordingly, He put the park in the center of a circle and drew other circles around it with similar radiuses to divide the whole country into six zones. Then, having calculated the area and population of each zone, he estimated the cost of accessing the park for visitors from the six areas and with the aid of other data obtained from questionnaires. He also estimated the regressive equality among the mentioned parameters. In the end, she estimated the economic value of the park to be 5,293.2 million dollars after drawing the visitors' demand curve [12]. Ali Imami et al (2005) estimated the amusement-recreational value of Saie Park in Tehran. In that research, they measured visitors' willingness-to-pay for recreational
purposes in this park using the conditional valuation method (CVM) and the two-choice questionnaire. The Logit model was used to measure the WTP and the parameters of this model were estimated through the maximum validity method. The results show that the 60 percent of the interviewees in this study are willing to pay some money to use Saie Park for recreation or amusement and the average WTP for the amusement or recreational value of the park was 1.417dollars for each visitor [2]. The monthly recreational value and the total annual value of this park were estimated to be more than 17,500 and
200,000 dollars respectively [4].
2. Materials and Methods
2.1 Noshirvani Urban Park
Golestan Noshirvani Park with an area of six hectares lies at latitude 52o north and longitude 30o east in Babol and is regarded as one of the main and most beautiful urban parks in Mazandaran Province. This park includes a pool with recreational boats, an amusement park and a beautiful and unique green space hosting travelers and residents from Babol and other cities. The city hall of Babol endeavored to construct this park from 2000 to 2003. Moreover, the public can visit the park free without paying any entry fees.
2.2 Travel Cost Method
The travel cost method (TCM) was used in this research to valuate Golestan Noshirvani Urban Park in Babol. This method is one of the most precise and suitable methods of determining the recreational value (valuation) of non-market goods like parks and forests [5]. The underlying assumption in TCM is that the value of a place is equal to the costs repliers pays to use that place. The unique advantage of TCM lies in being based on factual data rather than on hypothetical data and it thus provides real values. TCM is based on the simple assumption that the recreational value of a place is directly related to the travel cost somebody pays to reach that given place [8]. There are two forms of travel costs: the zonal travel cost method (ZTCM) and the individual travel cost method (ITCM). The latter method is used in
this research to determine the recreational value.
Generally, some data on the number of visitors from places with different distances are collected in ZTCM. Since the cost and time of travelling increase by distance, these data allow the researcher to calculate the number of visitors at different costs. These data are used to draw the regional demand
Recent Researches in Environmental Science and Landscaping
ISBN: 978-1-61804-090-9 162
curve and to estimate the extra visitors or the economic profits of the recreational services over the area [6].
In comparison to ZTCM, the number of visits paid by an individual per year is mostly used to draw the demand curve in ITCM [13]. This method requires the collection of more data and a more complicated analysis. In this method, like in ZTCM, consumer's extra welfare and the real and physical capacity boards of the recreational site can be calculated [15]. Applying TCM is quite a cheaper method than other recreational valuation methods and the interpretation of its results is also simpler and
more understandable for the public.
2.3 Research Methodology
The research methodology is based on collecting information and qualitative and quantitative data, visiting the site, designing a questionnaire to be filled by visitors and finally analyzing the data by SPSS and EXCEL. The steps in the research are:
Step one: visiting the park and identifying its main equipments and qualities as well as its visitors and native people's dominant characteristics.
Step two: collecting data on the number of visitors in certain time units (day, week, month etc).
Step Three: estimating the average number of visitors during a day and in different days of a week
(whether weekdays or the weekend)
Step four: designing and developing questionnaires, administering the pre-test and the main stage of filing out the questionnaires and conducting face-to-face interviews
Step five: analyzing the data and information collected from the questionnaires by the mentioned
software programs
Step six: estimating the economic-recreational value of the park, extracting the visitors' demand curve and
calculating the (physical or real) capacity boards.
As it was mentioned earlier, collecting the raw data from the target population is the most important part of the research. Therefore, a questionnaire with 22 questions was first designed and it was distributed among visitors before the actual administration in order to remedy the possible deficiencies or shortcomings in some questions [10]. The questions divide into three parts: economic, social and related-questions.
Sampling was made during the weekend and weekdays in June, July and August. In total, 120 questionnaires were filled and a number of which that were illogical and incomplete were later omitted after being collected and examined carefully. Finally, 110 questionnaires were selected and analyzed [9]. Visitors' total travel costs were calculated in this research from the total travelling fare (or the cost of the consumed gas or gasoline and the car depreciation in case a personal car was used), the travel opportunity cost and the expenses in the park [11].
3. Results
3.1 Social results
Social variables are one of the important factors in recognizing the recreational-amusement values. Factors like the level of education and age affect people's needs and demands for urban green spaces. The results from filling questionnaires and face-to-face interviews show that 72 percent of visitors are male and only eight percent of them are female. In fact, this considerable difference indicates that the main cost of travelling is paid by men who are mainly the breadwinners. The age groups of the visitors show that the first and second largest percentages of visitors are in the 31-40 and 21-30 age groups with about 36 percent and 32 percent of the whole visitors respectively and the rest of visitors are in other age groups.
The level of visitors' education revealed that about 70 percent of them have a high school diploma or lower degrees. These figures and statistics imply that most visitors to the park are from the common man. Concerning the time selected by visitors to visit the park, we can say that 72 percent select Friday (the weekend in Iran) and holidays to sightsee while it makes no difference for 25 percent of them. Moreover, 64 percent of visitors choose the summer for outing but 25 percent of them are not concerned with the season to use the park in. The company was the noteworthy point in the questionnaire. The results indicate the social value issue of the park in a way that about 85 percent of visitors, forming 45 percent of the total population, go to the park in groups of five or more. Concerning visitors' average access time, it can be said the 45 percent of visitors spend 10-20 minutes to arrive in the park while 25 percent
of them spend 20-30 minutes.
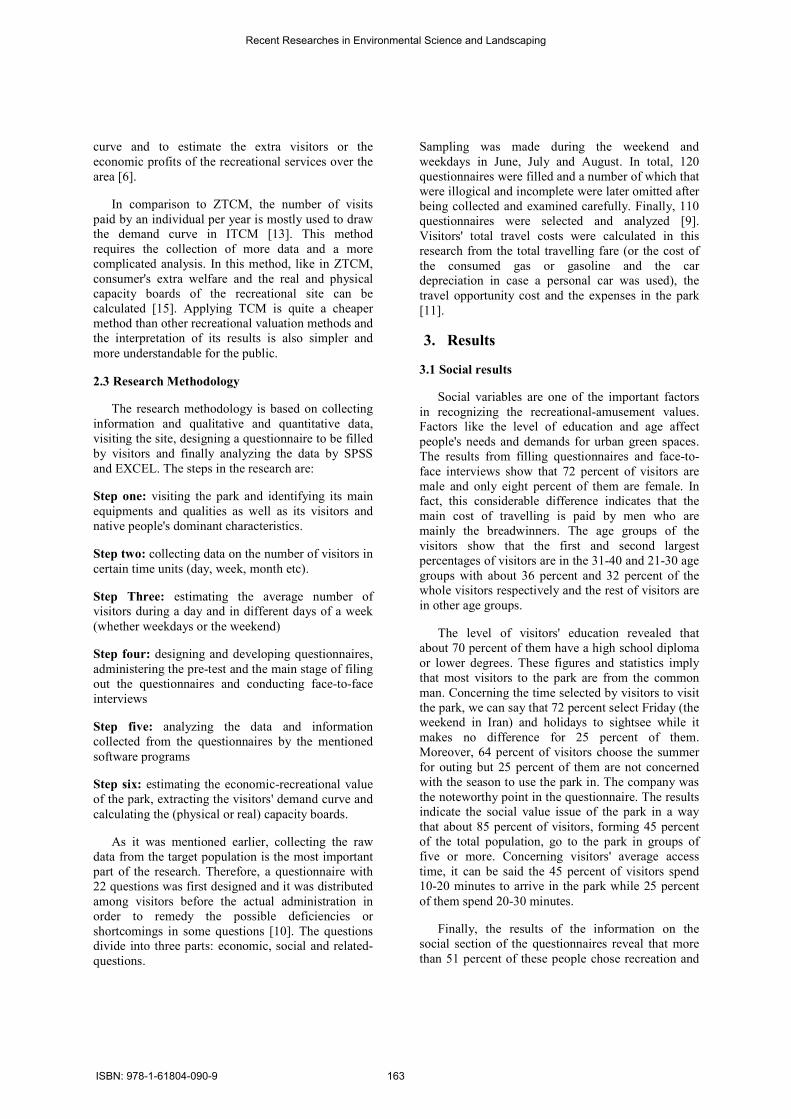
Finally, the results of the information on the social section of the questionnaires reveal that more than 51 percent of these people chose recreation and
Recent Researches in Environmental Science and Landscaping
ISBN: 978-1-61804-090-9 163
amusement as the main reasons for their visits to the park. Furthermore, such reasons as closeness home, the lack of an alternative park in the city and using the amusement park are main reasons why
people visit the park so widely (Fig
Figure 1: The main reasons for visiting the park from visitors' view
3.2 Economic results
Interesting information and data are extracted from the economic questions section. visitors in different days and hours, visit the park in their free or leisure time sometimes replace the working hours with visithe park which is regarded as the wasted opportunity cost in estimating the economic value of the park. Concerning the average monthly incomesee quite a regular distribution of data in different levels of income. For example, 36 percent earn 200-300 dollars a month and 25 percent earn 300-400 dollars during the same time (
Figure 2: Visitors' average monthly income
On the other hand, as it was mentioned in the previous section, this park has no entry free and open to the public. The resultof the visitors show that 47 percent still visit the park in case an entry fee is charged willingness to and satisfaction with setting such a fee. On the other hand, 53 percent of visitors disagree with entry fees and would not
2%
15% 14%
5%
13%
0
10
20
30
40
50
60
4% 3%
16%
36%
0
5
10
15
20
25
30
35
40
No Incom < $ 100 101 to $
200
201 to $
300
amusement as the main reasons for their visits to the such reasons as closeness to the
home, the lack of an alternative park in the city and using the amusement park are main reasons why
1).
he main reasons for visiting the park from
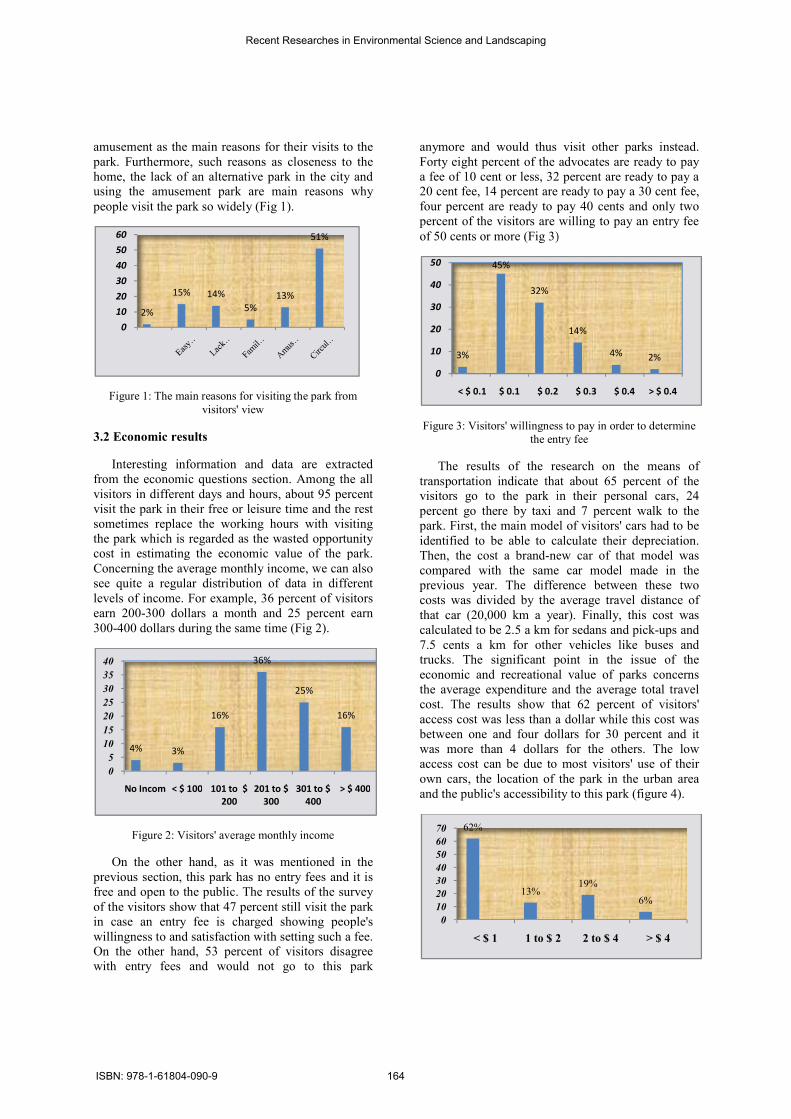
Interesting information and data are extracted from the economic questions section. Among the all visitors in different days and hours, about 95 percent visit the park in their free or leisure time and the rest sometimes replace the working hours with visiting the park which is regarded as the wasted opportunity cost in estimating the economic value of the park. Concerning the average monthly income, we can also see quite a regular distribution of data in different
For example, 36 percent of visitors 300 dollars a month and 25 percent earn
during the same time (Fig 2).
isitors' average monthly income
as it was mentioned in the has no entry fees and it is The results of the survey
47 percent still visit the park showing people's
willingness to and satisfaction with setting such a fee. nt of visitors disagree
with entry fees and would not go to this park
anymore and would thus visit other parks instead. Forty eight percent of the advocates a fee of 10 cent or less, 32 percent are ready to pay 20 cent fee, 14 percent are ready to pay a 30 cent fee, four percent are ready to pay 40 cents and only two percent of the visitors are willing to
of 50 cents or more (Fig 3)
Figure 3: Visitors' willingness to pay the entry fee
The results of the research on the means of transportation indicate that about 65 percent of the visitors go to the park in their personal cars, 24 percent go there by taxi and 7 percent walk to the park. First, the main model of visitors' cars identified to be able to calculate their depreciation. Then, the cost a brand-new car of that model compared with the same car previous year. The difference between costs was divided by the average travelthat car (20,000 km a year)calculated to be 2.5 a km for sedans 7.5 cents a km for other vehicles like buses and trucks. The significant point in the issue of economic and recreational value of the average expenditure and the average cost. The results show that 62 percent of visitors' access cost was less than a dollar while this cost was between one and four dollars was more than 4 dollars for thaccess cost can be due to own cars, the location of the park in the urban areaand the public's accessibility
13%
51%
25%
16%
201 to $
300
301 to $
400
> $ 400
3%
45%
32%
0
10
20
30
40
50
< $ 0.1 $ 0.1 $ 0.2
62%
13%
0
10
20
30
40
50
60
70
< $ 1 1 to $ 2
would thus visit other parks instead. the advocates are ready to pay
or less, 32 percent are ready to pay a 14 percent are ready to pay a 30 cent fee,
four percent are ready to pay 40 cents and only two percent of the visitors are willing to pay an entry fee
3)
isitors' willingness to pay in order to determine the entry fee
The results of the research on the means of transportation indicate that about 65 percent of the
go to the park in their personal cars, 24 percent go there by taxi and 7 percent walk to the
he main model of visitors' cars had to be dentified to be able to calculate their depreciation.
new car of that model was the same car model made in the
previous year. The difference between these two divided by the average travel distance of
that car (20,000 km a year). Finally, this cost was for sedans and pick-ups and
7.5 cents a km for other vehicles like buses and The significant point in the issue of the
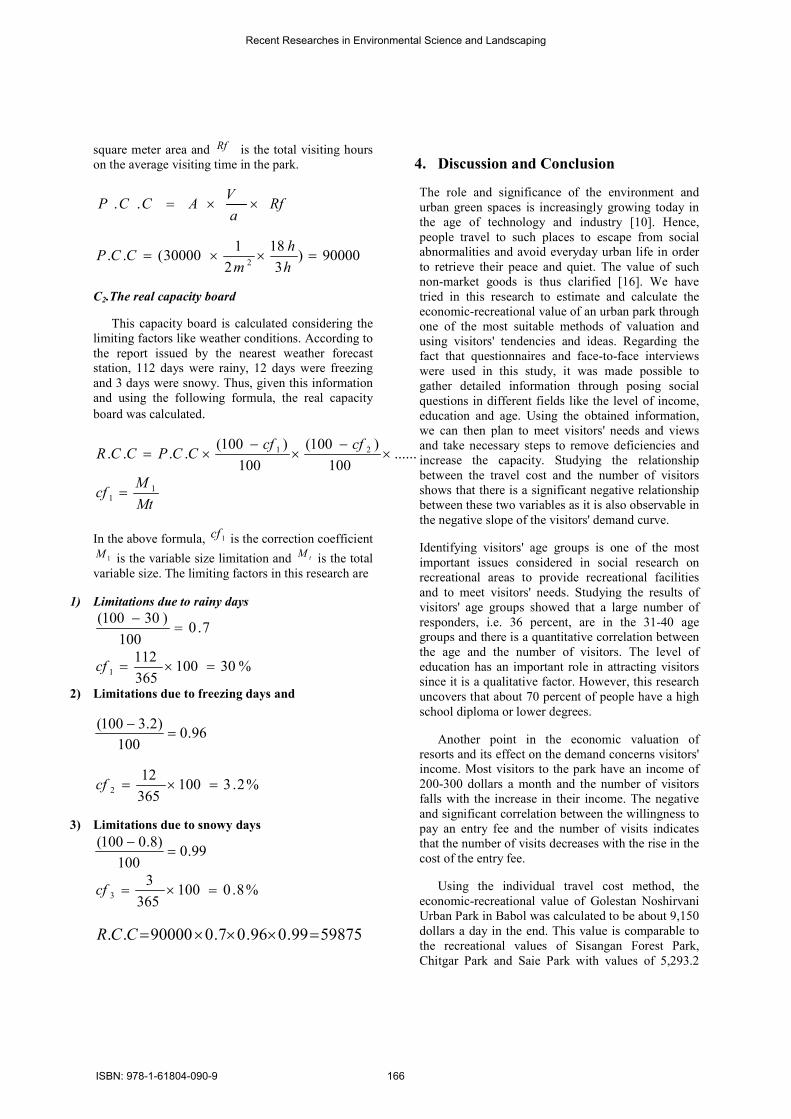
economic and recreational value of parks concerns the average expenditure and the average total travel cost. The results show that 62 percent of visitors'
was less than a dollar while this cost was between one and four dollars for 30 percent and it was more than 4 dollars for the others. The low
most visitors' use of their own cars, the location of the park in the urban area
accessibility to this park (figure 4).
14%
4%2%
2 $ 0.3 $ 0.4 > $ 0.4
19%
6%
1 to $ 2 2 to $ 4 > $ 4
Recent Researches in Environmental Science and Landscaping
ISBN: 978-1-61804-090-9 164
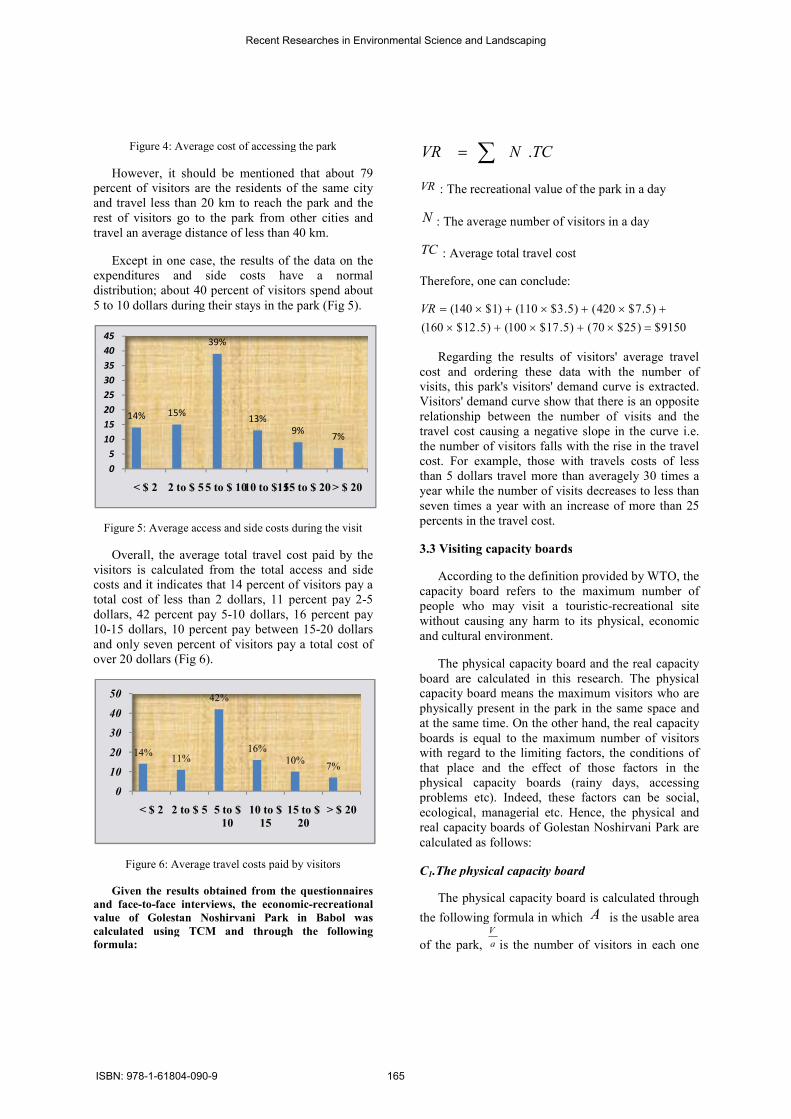
Figure 4: Average cost of accessing the park
However, it should be mentioned that about 79 percent of visitors are the residents of the same city and travel less than 20 km to reach the parkrest of visitors go to the park from other cities and travel an average distance of less than 40 km.
Except in one case, the results of the data expenditures and side costs distribution; about 40 percent of visitors s
5 to 10 dollars during their stays in the
Figure 5: Average access and side costs during the
Overall, the average total travel cost paid by the visitors is calculated from the total access and side costs and it indicates that 14 percent of visitors pay a total cost of less than 2 dollars, 11 percent pay 2dollars, 42 percent pay 5-10 dollars, 10-15 dollars, 10 percent pay between 15and only seven percent of visitors pay a total cost of over 20 dollars (Fig 6).
Figure 6: Average travel costs paid by visitors
Given the results obtained from the questionnaires
and face-to-face interviews, the economic
value of Golestan Noshirvani Park in Babol was
calculated using TCM and through the
formula:
14% 15%
39%
13%
0
5
10
15
20
25
30
35
40
45
< $ 2 2 to $ 55 to $ 1010 to $15
14%11%
42%
16%
0
10
20
30
40
50
< $ 2 2 to $ 5 5 to $
10
10 to $
15
verage cost of accessing the park
However, it should be mentioned that about 79 are the residents of the same city
and travel less than 20 km to reach the park and the rest of visitors go to the park from other cities and travel an average distance of less than 40 km.
xcept in one case, the results of the data on the and side costs have a normal
40 percent of visitors spend about
5 to 10 dollars during their stays in the park (Fig 5).
verage access and side costs during the visit
Overall, the average total travel cost paid by the is calculated from the total access and side
14 percent of visitors pay a total cost of less than 2 dollars, 11 percent pay 2-5
10 dollars, 16 percent pay 15 dollars, 10 percent pay between 15-20 dollars
and only seven percent of visitors pay a total cost of
verage travel costs paid by visitors
Given the results obtained from the questionnaires
face interviews, the economic-recreational
Golestan Noshirvani Park in Babol was
calculated using TCM and through the following
∑= TCNVR .
VR : The recreational value of
N : The average number of visitors in a day
TC : Average total travel cost
Therefore, one can conclude:
17$100()5.12$160(
3$110()1$140(
×+×
×+×=VR
Regarding the results of visitors' average travel cost and ordering these data with the number of visits, this park's visitors' demand curve Visitors' demand curve show that there is an relationship between the number of visits and the travel cost causing a negative slope the number of visitors falls with the rise in the travel cost. For example, those with than 5 dollars travel more than averagely 30 times year while the number of visits decreases to less than seven times a year with an increase of more than 25 percents in the travel cost.
3.3 Visiting capacity boards
According to the definition provided by WTOcapacity board refers to the maximum number of people who may visit a touristicwithout causing any harm to its physical, economic and cultural environment.
The physical capacity board board are calculated in this research. The physical capacity board means the maximum visitors who are physically present in the park in the at the same time. On the other hand, the real boards is equal to the maximum numberwith regard to the limiting factors, the conditions of that place and the effect of those factors physical capacity boardsproblems etc). Indeed, these factors ecological, managerial etc. Hence, real capacity boards of Golestan Noshirvani Park are
calculated as follows:
C1.The physical capacity board
The physical capacity board is calculated through
the following formula in which
of the park, a
V
is the number of visitors in each
9%7%
10 to $1515 to $ 20> $ 20
10%7%
10 to $ 15 to $
20
> $ 20
recreational value of the park in a day
average number of visitors in a day
total travel cost
Therefore, one can conclude:
9150$)25$70()5.17
)5.7$420()5.3
=×+
+×+
Regarding the results of visitors' average travel ordering these data with the number of
this park's visitors' demand curve is extracted. show that there is an opposite
relationship between the number of visits and the travel cost causing a negative slope in the curve i.e. the number of visitors falls with the rise in the travel
those with travels costs of less than 5 dollars travel more than averagely 30 times a year while the number of visits decreases to less than seven times a year with an increase of more than 25
capacity boards
definition provided by WTO, the refers to the maximum number of
people who may visit a touristic-recreational site without causing any harm to its physical, economic
capacity board and the real capacity are calculated in this research. The physical
the maximum visitors who are physically present in the park in the same space and at the same time. On the other hand, the real capacity
the maximum number of visitors with regard to the limiting factors, the conditions of that place and the effect of those factors in the
capacity boards (rainy days, accessing problems etc). Indeed, these factors can be social,
, managerial etc. Hence, the physical and real capacity boards of Golestan Noshirvani Park are
he physical capacity board
board is calculated through
the following formula in which A is the usable area
is the number of visitors in each one
Recent Researches in Environmental Science and Landscaping
ISBN: 978-1-61804-090-9 165
square meter area and Rf is the total visiting hours on the average visiting time in the park.
Rfa
VACCP ××=..
90000)3
18
2
130000(..
2=××=
h
h
mCCP
C2.The real capacity board
This capacity board is calculated considering the limiting factors like weather conditions. According to the report issued by the nearest weather forecast station, 112 days were rainy, 12 days were freezing and 3 days were snowy. Thus, given this information and using the following formula, the real capacity
board was calculated.
......100
)100(
100
)100(.... 21 ×
−×
−×=
cfcfCCPCCR
Mt
Mcf 1
1 =
In the above formula, 1cf is the correction coefficient
1M is the variable size limitation and tM is the total variable size. The limiting factors in this research are
1) Limitations due to rainy days
7.0100
)30100(=
−
%30100365
1121 =×=cf
2) Limitations due to freezing days and
96.0100
)2.3100(=
−
%2.3100365
122 =×=cf
3) Limitations due to snowy days
99.0100
)8.0100(=
−
%8.0100365
33 =×=cf
5987599.096.07.090000.. =×××=CCR
4. Discussion and Conclusion
The role and significance of the environment and urban green spaces is increasingly growing today in the age of technology and industry [10]. Hence, people travel to such places to escape from social abnormalities and avoid everyday urban life in order to retrieve their peace and quiet. The value of such non-market goods is thus clarified [16]. We have tried in this research to estimate and calculate the economic-recreational value of an urban park through one of the most suitable methods of valuation and using visitors' tendencies and ideas. Regarding the fact that questionnaires and face-to-face interviews were used in this study, it was made possible to gather detailed information through posing social questions in different fields like the level of income, education and age. Using the obtained information, we can then plan to meet visitors' needs and views and take necessary steps to remove deficiencies and increase the capacity. Studying the relationship between the travel cost and the number of visitors shows that there is a significant negative relationship between these two variables as it is also observable in the negative slope of the visitors' demand curve.
Identifying visitors' age groups is one of the most important issues considered in social research on recreational areas to provide recreational facilities and to meet visitors' needs. Studying the results of visitors' age groups showed that a large number of responders, i.e. 36 percent, are in the 31-40 age groups and there is a quantitative correlation between the age and the number of visitors. The level of education has an important role in attracting visitors since it is a qualitative factor. However, this research uncovers that about 70 percent of people have a high school diploma or lower degrees.
Another point in the economic valuation of resorts and its effect on the demand concerns visitors' income. Most visitors to the park have an income of 200-300 dollars a month and the number of visitors falls with the increase in their income. The negative and significant correlation between the willingness to pay an entry fee and the number of visits indicates that the number of visits decreases with the rise in the cost of the entry fee.
Using the individual travel cost method, the economic-recreational value of Golestan Noshirvani Urban Park in Babol was calculated to be about 9,150 dollars a day in the end. This value is comparable to the recreational values of Sisangan Forest Park, Chitgar Park and Saie Park with values of 5,293.2
Recent Researches in Environmental Science and Landscaping
ISBN: 978-1-61804-090-9 166
dollars, 5.189.55 dollars and 17.500 dollars respectively and it indicates the high recreational value of this resort. We can conclude from these results than the creation of parks or green spaces is successful in attracting visitors and establishing a peaceful setting for families. We hope that these results can provide an appropriate model for authorities to make plans and policies in this field to
conduct such activities.
5. Acknowledgments
At the end, we would like to express my gratitude
for the cooperation of the Environment and Energy Department of Islamic Azad University, Science and Research Branch of Tehran, and its chancellor, Professor Majid Abbaspour and also from Mazandaran province Central Department of Environment Organization, the management of Babol's municipality and from all experts and specialists who has helped us in conducting this
research.
6. References
[1] Esmaieli sari. A, Kavianpur. K, Economic
(Recreational) Valuation of Si- Sangan Wild
Park, The Journal of Environmental science and technology, Vo.4, No.15, 2001, pp. 33-41.
[2] Imami. A., Ghazi. F, Estimation of
Environmental Recreation Value in Tehran, case
study: Saee‘s Urban Park, The journal of Environmental Sciences, Vo. 3, No.21, 2007, pp. 56-61.
[3] Fazli. M, Economic Valuation of Chitgar’s Park
by using Clawson Method, The Journal of Environmental science and technology, Vol.1, No.12, 2003, pp. 68-71.
[4] Farina. C. Alexander, A new Theory of Urban
Design, New York: Oxford University Press, 1987.
[5] Frey. Hm, designing the city: Toward a more
sustainable Urban from London, E& F.N. Spon, 1999.
[6] Ghorbani. M., Firuzzare. A, Introduction to
Valuation of Environment, Ferdowsi Mashhad University Press, 2007.
[7] Holden. A, Environment and Tourism. Rutledge Introductions to Environment series, 2000
[8] John. A, Adjaye. Environmental Economics for
Non- Economists, Translated by: S.Dehghanian and Z. Faradjzadeh, Ferdowsi Mashhad University Press, 2002.
[9] Karimzadegan. H, Principles of Environmental
Economic, Naghshe mehr, (2003).
[10] Kerry Turner. R., Pearce, D. Bateman, I, Environmental economics: an elementary
introduction, Ferdowsi Mashhad University Press, 1999.
[11] Majnunian. H, Methods of economic assessment
of parks, Environment knowledge magazine, Iran’s Department of Environment press, 1995.
[12] Moons. E, The development and Application of
Economic Valuation Techniques and their Use in
Environmental Policy, a Survey. K. U. Leuven - CES – ETE, (2003).
[13] Pishkari. K, Economic Valuation of Taleghani
Wild Park, The journal of Environmental Sciences, Vo. 12, No.11, 2008, pp. 76-80.
[14] Rashev. B, Alternative Economics Valuation of
Pirin National park, Bulgaria, Application of
Valuation and travel Cost Method, Brandenburg University of Technology Cottbus, 2003.
[15] Rowley. A, Mixed used development:
ambiguous, simplistic and wishful thinking, Plan Park Press, 1996.
[16] Sohngen. B, Environmental and Natural
Resource Economics, AEDE (Department of Agricultural, Environmental and Development Economics). www.Agecon.ag.ohio – state.edu / class/AEDE531/Sohngen/EnvBenefits/m5les1.htm, 2003.
Recent Researches in Environmental Science and Landscaping
ISBN: 978-1-61804-090-9 167