Embed Size (px)
Citation preview

ValuationApr 19, 20231
Cost of Capital in Valuation and Corporate Models

Cost of CapitalApr 19, 20232
Cost of Capital Contents
• Actual Cost of Capital Process
• WACC Computation and Theory
• Alternative Models
• Capital Asset Pricing Model
Beta Measurement
Market Premium
Asset Beta

Cost of CapitalApr 19, 20233
• A crucial issue in financial analysis is establishing the discount rate and risk measurement using capital asset pricing models.
• Financial principles of efficient markets, market expectations and event studies lie behind a number of modeling and financial management concepts.
• The general opinion is that cost of capital is over-estimated and compensated for with optimistic assumptions.
• Recent work on cost of capital
Lower equity risk premium
CAPM discredited
Analyst growth rates are too high
Financial Management and Finance Theory
Cost of CapitalApr 19, 20234
Example of Discount Rates in Merger Analysis
• In order to determine the value of Pennzoil-Quaker State's common stock, Morgan Stanley performed a 5-year discounted cash flow analysis that included the use of two different scenarios, or case assumptions. The Management Case reflects Pennzoil-Quaker State management's estimates of the company's future financial performance, excluding any future acquisitions.
• The Market Case reflects publicly available estimates of Pennzoil-Quaker State's future performance of certain securities research analysts. These cases were used to project future cash flows which were discounted back to a present value using a range of discount rates of 8% to 10%.
• The range was determined based upon a calculation of Pennzoil-Quaker State's weighted average cost of capital (WACC), which was calculated based upon the WACC for comparable companies in three industry segments: Mid-Cap Consumer Products, Auto Aftermarket and Auto OEM.
• Morgan Stanley also applied a terminal EBITDA multiple of 7.0x to 9.0x to the projected 2006 EBITDA, for purposes of calculating a terminal value of Pennzoil-Quaker State at the end of 2006. This terminal value together with the projected annual un-levered free cash flows from 2002 through 2006 was then discounted to the present, assuming cash flows occurred mid-year, using discount rates of 8% to 10%.
Cost of CapitalApr 19, 20235
Cost of Capital Example
• The estimated after-tax free cash flows for BellSouth’s Wireline segment for calendar years 2006 through 2008 and the terminal values calculated for BellSouth’s Wireline segment were then discounted to the present value using discount rates of 7.0% to 8.0%.
• The estimated after-tax free cash flows for Cingular for calendar years 2006 through 2008 and the terminal values calculated for Cingular were then discounted to the present value using discount rates of 8.5% to 9.5% and multiplied by 40%. The estimated after-tax free cash flows for BellSouth’s Directories segment for calendar years 2006 through 2008 and the terminal values calculated for BellSouth’s Directories segment were then discounted to the present value using discount rates of 7.0% to 8.0%.
• Lehman Brothers and Evercore discounted the unlevered free cash flow streams and the estimated terminal value to a present value at a range of discount rates from 7.5% to 8.5%. The discount rates utilized in this analysis were chosen by Lehman Brothers and Evercore based on their expertise and experience with the telecommunications industry and also on an analysis of the weighted average cost of capital of BellSouth and other comparable companies.
Cost of CapitalApr 19, 20236
Surveys of Managers
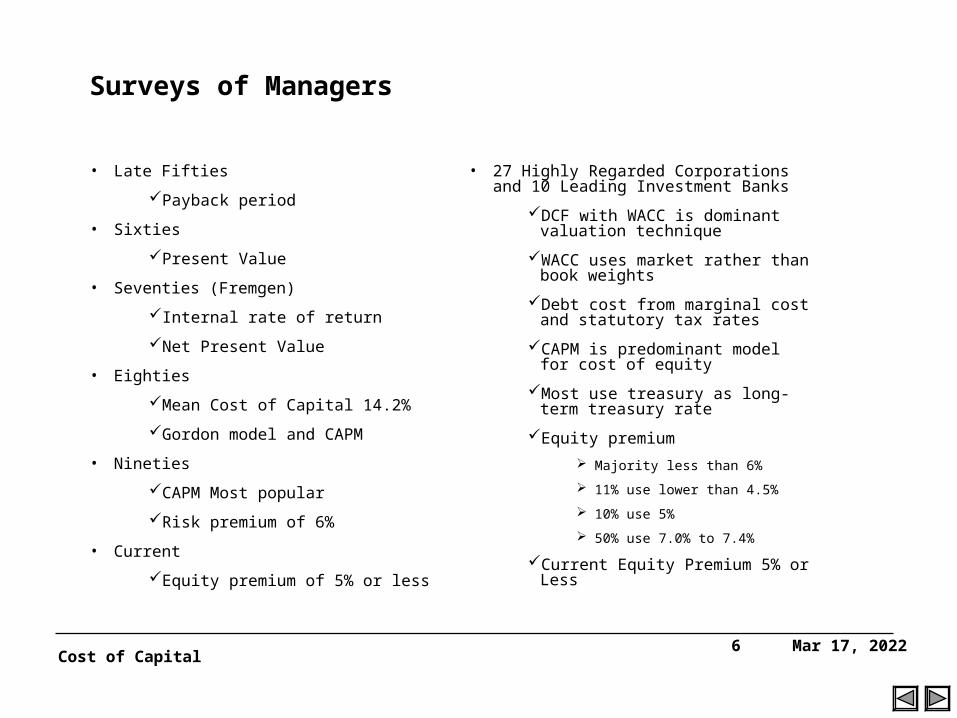
• Late Fifties
Payback period
• Sixties
Present Value
• Seventies (Fremgen)
Internal rate of return
Net Present Value
• Eighties
Mean Cost of Capital 14.2%
Gordon model and CAPM
• Nineties
CAPM Most popular
Risk premium of 6%
• Current
Equity premium of 5% or less
• 27 Highly Regarded Corporations and 10 Leading Investment Banks
DCF with WACC is dominant valuation technique
WACC uses market rather than book weights
Debt cost from marginal cost and statutory tax rates
CAPM is predominant model for cost of equity
Most use treasury as long-term treasury rate
Equity premium
Majority less than 6%
11% use lower than 4.5%
10% use 5%
50% use 7.0% to 7.4%
Current Equity Premium 5% or Less
Cost of CapitalApr 19, 20237
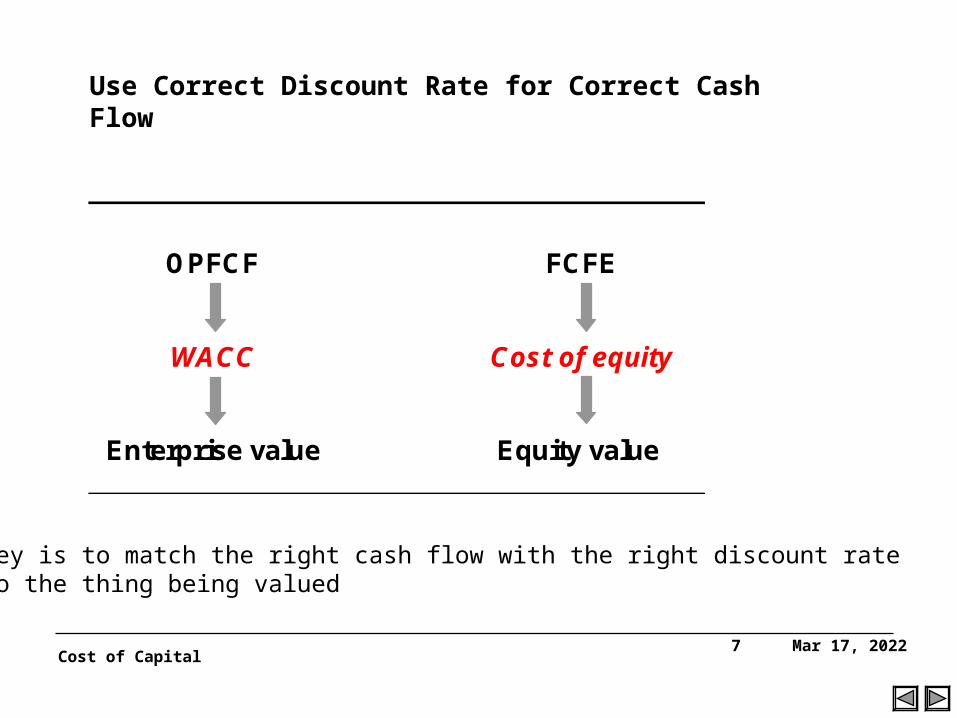
OPFCF FCFE
WACC Cost of equity
Enterprise value Equity value
The key is to match the right cash flow with the right discount rateAnd to the thing being valued
Use Correct Discount Rate for Correct Cash Flow

Cost of CapitalApr 19, 20238
Common Problems in Applying Cost of Capital to Cash Flow
• Given difficulties in estimating cost of capital, present a range in cost of capital in valuations.
• Discount rate should reflect project characteristics
Contracts
Risks
• Generally companies over-estimate the cost of capital (McKinsey)
2001 Survey – managers use 12.2%
Actual market premium is much less
• Optimistic assumptions to compensate for high required return
• Over-payment for acquisitions
• Mis-timing of investments in commodity price businesses
ValuationApr 19, 20239
Weighted Average Cost of Capital

Cost of CapitalApr 19, 202310
WACC Points
• Use target capital structure
• Use nominal cost of capital in currency consistent with the free cash flow
• Should be market weights and incremental cost of capital
• Tricky Items
Convertible Bonds
Lower rate is due to equity value
Bond value Equity Option
Term of Debt
Credit Spread on Debt
Callable and No callable debt (effect on cash flow)
Cost of CapitalApr 19, 202311
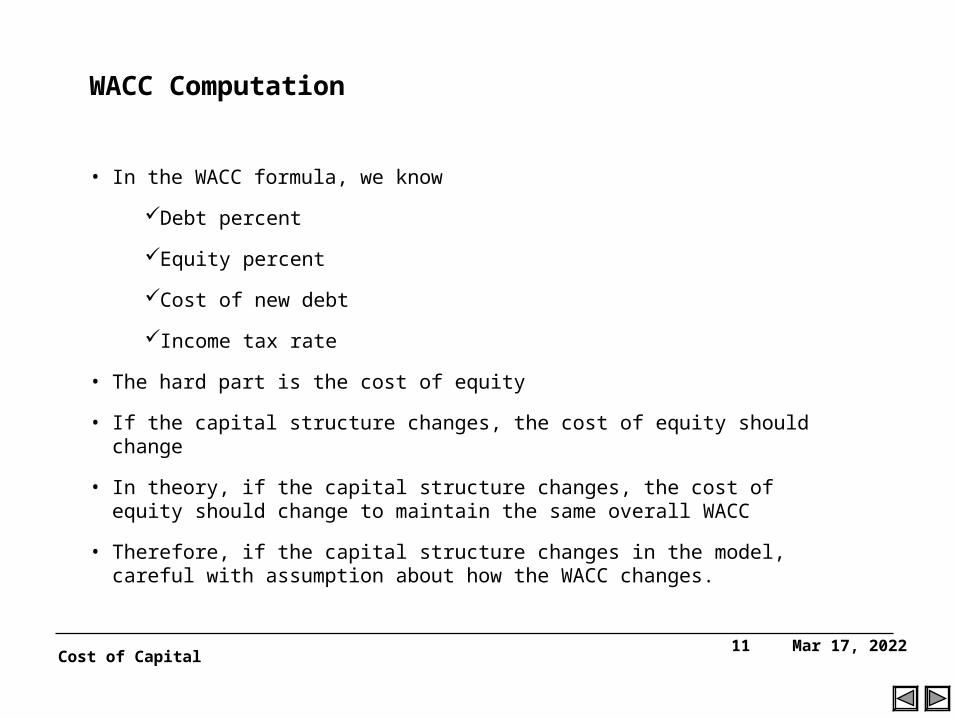
WACC Computation
• In the WACC formula, we know
Debt percent
Equity percent
Cost of new debt
Income tax rate
• The hard part is the cost of equity
• If the capital structure changes, the cost of equity should change
• In theory, if the capital structure changes, the cost of equity should change to maintain the same overall WACC
• Therefore, if the capital structure changes in the model, careful with assumption about how the WACC changes.

Cost of CapitalApr 19, 202312
Weighted Average Cost of Capital
• Step 1:
Equity Cost from Asset Cost
Ke = Be x Rm + Rf
Ke = (Ba x (V/E)) x Rm + Rf
• Step 2
Debt Cost from Rf plus Credit Spread
Kd = Rf + CS
After tax Kd
• Step 3
WACC = (D/V) * Kd x (1-t) + (E/V) * Ke

Cost of CapitalApr 19, 202313
Alternative Approaches to Computing the Cost of Capital
• Dividend growth model (analogous to P/E ratio)
Works if there are stable dividends
A variant is P/E = (1-g/r)/(k-g)
• Debt capacity model (project finance)
• Risk premium method (analogous to the CAPM)
K = Rf + Risk Premium
• Implied cost of capital in EBITDA ratios
• Arbitrage Pricing Model (extension of CAPM and related to risk neutral valuation)
• Implied cost of capital from reverse engineering financial models (described in the M&A discussion)
Cost of CapitalApr 19, 202314
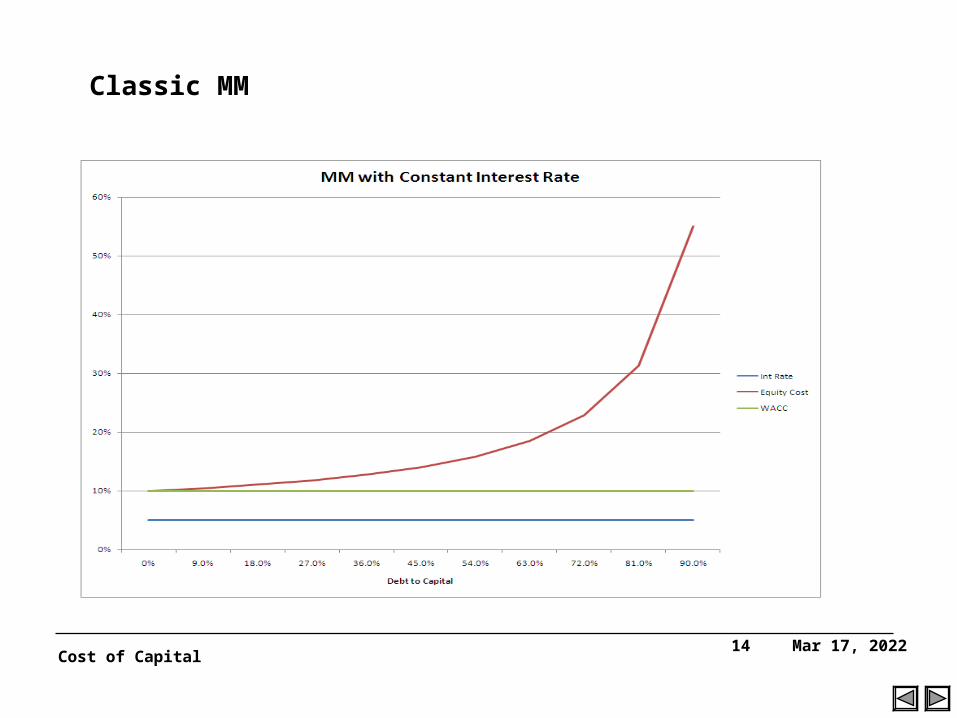
Classic MM

Cost of CapitalApr 19, 202315
MM without Tax and WACC – Increasing Interest Cost
• .
0%
5%
10%
15%
20%
25%
30%
35%
40%
0% 9.0% 18.0% 27.0% 36.0% 45.0% 54.0% 63.0% 72.0% 81.0% 90.0%
Debt to Capital
WACC and Cost of Equity with MM
Int Rate
Equity Cost
WACC

Cost of CapitalApr 19, 202316
MM with increasing Debt Cost – Equity Cost Decreases because of Option in Equity Cost
Higher Interest Rate with Higher Probability of Default

ValuationApr 19, 202317
CAPM: k = rf + β x rm

Cost of CapitalApr 19, 202318
CAPM Inputs
• Rf,i is the risk free rate for the current period (i) and it is the only variable directly affected by movements in the overall cost of capital in the economy.
• βi is the covariance between returns on the security and the market returns divided by the overall variance of market returns. This parameter is the only input affected by the risk of the security in question and the βi parameter is not expected to vary over time unless there is a change in business and/or the financial risk of the company.
• EMRP is the expected return on a fully diversified portfolio of equity securities over and above the rate of return on risk free securities. This variable is a function only of aggregate preferences by people in the economy for risky investments versus risk free investments. It is not affected by current interest rates, the risk of the security, or movements in the overall stock market.

Cost of CapitalApr 19, 202319
Real
InflationPlus RealRate - Rf
Asset/Ungeared equity – Ba x MarketMarket Premium
Geared EquityBe
DebtAverage
CAPM and Real and Risk Free Rate
Cost of CapitalApr 19, 202320
CAPM Theory
• CAPM has many problems, but the basic theory upon which the CAPM is built is a foundation of finance.
• The foundation of the CAPM is:
Risk is measured by variation and standard deviation in returns
Standard deviation is reduced from diversification
Variance (a + b) where the portfolio if a and b are have a weight of .5 is:
.25 variance (a) + .25 variance (b) + .5 covariance(a,b)
If the covariance is zero, the variance of the portfolio is much lower than the variance without diversification

Cost of CapitalApr 19, 202321
CAPM Problems
• Problems with the CAPM theory are recounted by Ravi Jagannathan and Iwan Meier in their 2001 article “Do We Need CAPM for Capital Budgeting:”
• The CAPM as a model has been seriously challenged in the academic literature…. [S]ince the critique by Fama and French (1992) there is consensus in the academic literature that the CAPM as taught in MBA classes is not a good model – it provides a very imprecise estimate of the cost of capital…. [T]here is overwhelming evidence in the academic literature that for over two decades business schools have been teaching the wrong model – or at least recommending the use of the wrong inputs – for calculating the cost of capital.[1]
•[1] Jagannathan, R. and Meier, I. 2001, “Do We Need CAPM For Capital Budgeting?”, Kellogg School of Management, Finance Department, pp 1-3.

Cost of CapitalApr 19, 202322
CAPM Problems
• “Not only has the CAPM proved wrong, but we do not even know that the market premium is.”
Ravi Jagannathan and Iwan Meyer, “Do We Need CAPM for Capital Budgeting” Kellog School of Management
• Fama and French:
Statistical analysis showing no relation between returns and beta
Statistical modeling: Time series to compute the Beta and then cross section to compute the significance
Statistical problems: errors in variables and all variables should be based on expectations rather than actual
CAPM may be un-testable

Cost of CapitalApr 19, 202323
Cost of Capital and the CAPM
• Use of CAPM to compute equity cost of capital and cost of capital to apply to free cash flow
Risk free rate to apply in the CAPM
Alternative methods to evaluate the risk premium for the overall market
Data sources and computation of Beta
Adjustments to Beta to compute Beta for application to free cash flow
Adjustments to CAPM for interest tax shield
Theoretical problems with the CAPM
Alternative approaches to the CAPM
Cost of CapitalApr 19, 202324
Discussion of CAPM Components
• The CAPM requires estimation of three components (Rf, Rm and Beta). Each of these has some controversy.
Rf
Should the long-term treasury rate be used
Country premiums
Rm
Method of estimation expected returns
Actual use in practice
Beta
Estimation
Accuracy
ValuationApr 19, 202325
Risk Free Rate in CAPM

Cost of CapitalApr 19, 202326
Risk Free Rate Discussion
• There are debates concerning implementation of the risk free rate in the CAPM.
Some suggest using long-term Treasury bond yields, some advocate short-term Treasury Bills and still others argue for use of the yield on inflation indexed bonds plus the expected rate of inflation.
The primary argument against using long-term Treasury Bond yields as a proxy for the risk free rate is that holders of long-term bonds accept inflation risk and those yields are therefore not risk-free.
Further, during times at which an inverted yield curve exists, the long-term treasury yield will produce a lower risk free parameter than the Treasury Bill rate.
Those opposed to use of a short-term rate contend that the duration of cash flows from short-term investments does not match the duration of cash flows received from an investment in a stock.

Cost of CapitalApr 19, 202327
CAPM - Risk Free Rate
• The primary issue in estimating the risk free rate is what risk free security should be used:
Common equity pays cash flow to investors over a long period
In theory the duration of dividends could be computed
Use t-bill yield to maturity of 10 years
Example
Treasury Bond Yield -- 2016 -- 5.53%
Treasury Bond Yield -- 2011 -- 4.98%

Cost of CapitalApr 19, 202328
CH 10 Year RMB Govt bondHK HKMA Hong Kong Exchange Fund Notes 10 YearsID Indonesia SBI 1 Month Auction Average YieldMA Malaysia Government Bonds 10 Year GovernmentTH Thailand Government Bonds 10 Year NoteKO South Korea 10 Year Government GenericIN India Government Bonds 10 YearPH Philippines Generic 10-Year Fix Treasury Note T-BondSI Monetary Authority of Singapore - Government Benchmark : 10 Year YieldTW Taiwan Government Bonds 10 Year Note Generic Bid Yield
Sources of Risk Free Rate

Cost of CapitalApr 19, 202329
Country Adjustments to Risk Free Rate

ValuationApr 19, 202330
Equity Market Risk Premium

Cost of CapitalApr 19, 202331
General Points on EMRP
• The EMRP is expressed in real terms and is not a nominal number. This means the EMRP does not increase or decrease when interest rates change or when the expected rate of inflation changes. It would be wrong, for example, to update this number in the midst of a case because of changes in the interest rate.
• The EMRP comes from the general risk preferences of agents in an economy for equities relative to risk free securities. If people did not have risk aversion for equities relative to risk free bonds, the EMRP would be zero. This means changes in the EMRP are driven by changes in general preferences for equities relative to risk free securities. Because the EMRP comes from risk preferences, it should be stable over long time periods as risk preferences do not swing from month to month or year to year.
• Third, the EMRP is an expected number rather than a number that can be directly measured from actual realized returns. The fact that the EMRP is an expected number means that it does not change when the stock market goes up or down because realized earnings change or because general economic activity is robust or depressed.
• Fourth, the EMRP is an economy wide number not unique to ComEd. Unlike Beta which measures the risk associated with a specific company, the EMRP is the same whether it is used in valuing a paper company, gauging the rate of return for an oil project or assessing the share price of an airline company.
• Fifth, the EMRP has been the subject of a very large body of research. This research has been performed by people who are not funded by parties who have a vested interest in producing a particularly high or a particularly low risk premium number. Since the EMRP is not unique to ComEd, since it is an expected number difficult to calculate, and since it is not expected to change over short time periods, the EMRP research is directly relevant to this and other regulatory proceedings.

Cost of CapitalApr 19, 202332
Current Opinions with Respect to EMRP
• Enrique Arzac recaps a wide body of research by stating “We show that both the historic record, financial theory, and prospective estimates based on stock prices and growth expectations, all indicate that the future equity premium in developed capital markets is likely between 3 and 5%...”
• Seth Artimage summarizes many different studies by noting: “Consensus is lacking at present on the best way of estimating the equity premium, and reasonable estimates lie in the rage of 1% or 5%...”
• Koller et al. describe the general biases in EMRP: “Historical estimates found in most textbooks (and locked in the mind of many), which often report numbers near 8% are too high for valuation purposes because they compare the market risk premium versus short-term bonds, use only 75 years of data, and are biased by the historical strength of the U.S. market.

Cost of CapitalApr 19, 202333
Historic EMRP
• Enrique Arzac refers to research by Blanchard who “developed a dynamic model of the expectations of real returns on stocks and bonds. He found that the risk premium during the 1930’s and 1940’s was unusually high ranging from 3 to 5% in the early 1930’s to more than 10% in the 1940’s. Afterwards, it started a gradual decline with some relatively minor fluctuations and reached between 2 and 3% in the early 1990’s.”
• Claus and Thomas emphasize the notion that historic returns exceed the expected amounts: “Despite substantial variation in the underlying fundamentals across markets and over time, observing that every one of our 69 country-year estimates lies well below eight percent suggests that the Ibbotson estimate is too high for our sample period.”

Cost of CapitalApr 19, 202334
Use of DCF to Estimate EMRP
• Seth Armitage describes the DCF studies as follows: “The arithmetic mean real premium between 1900 and 2000 was … 7.0% for the United States, measured against the yield on long-term bonds. But a simple forward looking estimate based on applying the dividend discount model to the market suggests a risk premium of 3% to 4%. This is why many people do not expect the premium in the future to be as large as it has been in the past, especially in the second half of the twentieth century. They place more faith in reasonable expectations about the future than in outcomes observed in recent decades. Furthermore, several researchers have argued recently that investors did not expect premiums as large as they got in the twentieth century. Armitage concludes that Most of the studies indicate a range for historic ex ante premiums … of between 1.5% and 4.5% -- considerably below the actual arithmetic mean premium since 1920…”
• Enrique Arzac uses a DCF model to estimate the equity market premium of between 3.08% and 3.32%.
• In their widely cited 2002 article, Fama and French state that “the equity premium estimates from the dividend and earnings growth models, 2.55 percent and 4.32 percent, are far below the estimate from the average return, 7.43 percent….The expected return estimates from the dividend and earnings growth models are more precise than the average return. The standard error of the dividend growth estimate of the expected return for 1951 to 2000 is 0.74 percent, versus 2.43 percent for the average stock return….The earnings growth model is not, however, clearly superior to the dividend growth model.”

Cost of CapitalApr 19, 202335
Surveys of Investors
• “In the US, Merrill Lynch publishes ‘bottom up’ expected returns on the Standard and Poor’s 500, derived by averaging expected return estimates for stocks in the Standard & Poor’s 500….In recent years, the Merrill Lynch expected return estimates have indicated an EMRP in the region of 4% to 5%.
• “The Value Line projected market risk premia are somewhat more volatile than those from the Merrill Lynch DDM model. In recent years they have generally ranged from 2% to 6%....”
• Greenwich Associates had published the results of an annual survey of pension plan officers regarding expected returns on the Standard and Poor’s 500 for a five-year holding period. The Greenwich Associates survey has generally indicated and EMRP in a 2%-3% range.”
• Claus and Thomas also cite investor expectations. They summarize the information as follows: “Surveys of institutional investors also suggest an equity premium substantially below eight percent (e.g., Burr (1998)), and there are indications that this belief has been held for many years (e.g., Benore (1983)) . Also, the weighted average cost of capital used in discounted cash flow valuations provided in analysts’ research reports usually implies an equity premium below five percent.”

Cost of CapitalApr 19, 202336
Risk Premium
• There is a wide range in premiums used in theory and practice. The following shows results from one study.

Cost of CapitalApr 19, 202337
Equity Market Risk Premium
• A well known study by Fama and French, published in 2002, finds that “estimates [of the equity market risk premium] for 1951 to 2000, 2.55 percent and 4.32 percent, are much lower than the equity premium produced by the average stock return, 7.43 percent.”
• In another oft cited paper published in 2001 by Claus and Thomas titled “Equity Premia as Low as Three Percent? Evidence from Analysts’ Earnings Forecasts for Domestic and International Stock Markets,” the authors conclude that “for each year between 1985 and 1998, we find that the equity premium is around three percent (or less) in the United States and five other markets.”
• “The Cost of Capital: Intermediate Theory” which was published in 2005 summarizes the current research as follows: “Almost all researchers on this question agree that the premium in the twentieth century in the United States … has turned out to be larger than investors expected it to be.”

Cost of CapitalApr 19, 202338
Estimated Risk Premiums from Actual Returns
• The market premium is unobservable
• Studies have attempted to measure the expected market premium using the PE method
• Actual Market Risk Premiums
1926-1998
Arithmetic 7.8%
Geometric 5.9%
1974 – 1998
Arithmetic 5.5%
Geometric 4.9%
1964 – 1998
Arithmetic 4.7%
Geometric 3.6%

Cost of CapitalApr 19, 202339
CAPM - Market Premium
• McKinsey -- 4.50%
• Investment Bank Low -- 3.5%
• Investment Bank High -- 5.5%
• Brealy and Meyers – 6% to 8.5%
• Gordon’s model – 2.9%
• Exelon Rate Case -- 9.98%
• Issue: Sample Bias from Bankruptcy

Cost of CapitalApr 19, 202340
Hong Kong equity premium calculation
The median estimate of ERP is in the 4-5% range for mature markets
Equity Risk Premium in Hong Kong

Cost of CapitalApr 19, 202341
Problems with historic data in estimating market premium
• The problem with market premium estimates is that the market premium should be an expected return rather than the historical actual returns that may or may not have been expected:
Real time now matters more than historic periods.
Samples drawn from the past have little relevance to what investors expect now.
What was 75% probable yesterday has an unknown probability tomorrow.
ValuationApr 19, 202342
Beta

Cost of CapitalApr 19, 202343
Sources of Beta and Differences in Measurement
• The table below shows that beta measurement can be dramatically different for the same companies.
Beta fromGooglefinance
Website
Beta fromYahoo
WebsiteValue
Line Beta
AGL Resources Inc. (ATG) 0.49 0.13 0.95 Energy East Corp. (EAS) 0.50 0.34 0.90 IdaCorp, Inc. (IDA) 0.80 0.49 1.00 Nisource Inc. (NI) 0.61 0.18 0.90 Peoples Energy Corp. (PGL) 0.37 0.66 0.90 Pepco Holdings Inc. (POM) 0.45 0.57 0.90 SCANA Corp. (SCG) 0.53 0.36 0.80 Southern Co. (SO) (0.12) 0.23 0.65 WGL Holdings Inc. (WGL) 0.25 0.71 0.80 Wisconsin Energy Corp. (WEC) 0.14 0.46 0.80 Xcel Energy Inc. (XEL) 1.13 0.52 0.90
Median 0.49 0.46 0.90
Average 0.47 0.42 0.86

Cost of CapitalApr 19, 202344
Betas

Cost of CapitalApr 19, 202345
Beta Measurement
• Beta is measured from historic returns
• Beta is cov(Rm,Rt)/variance(Rm)

Cost of CapitalApr 19, 202346
Beta Adjustments
• Value Line computes its beta from a regression equation that measures an unadjusted beta. Then, Value Line adds an adjustment to move the beta toward 1.0 using the following equation[1]:
• Adjusted beta = 2/3 x Unadjusted beta + 1/3 x 1.0
• or
• Unadjusted beta = Adjusted beta x 3/2 – 1/2
•[1] Patterson, C.S., 1995, The Cost of Capital: Theory and Estimation, Westport CT: Quorum Books, p. 130.

Cost of CapitalApr 19, 202347
Beta Adjustments for Mean Reversion
• The adjustment for betas is generally accepted in cost of capital literature for companies with betas above 1.0 because of a tendency of betas to revert to the mean. Statistical studies have demonstrated that “there appeared to be greater measurement error associated with the betas of extreme values.”[1] The mean reversion adjustment is accepted for companies with observed high betas. The risk of these high beta companies often moves towards 1.0 over time due to statistical measurement problems and due to the tendency of high business risk companies to eventually moderate. However, the mean reversion is far less accepted for utility companies with betas of below 1.0. [1] Ogier, T, Rugman, J., Spicer, L., 2004, The Real Cost of Capital A Business Field Guide to Better Financial Decisions, Great Britain: FT Prentice Hall, page 54.

Cost of CapitalApr 19, 202348
Example of Beta Adjustments
• The case of NICOR demonstrates that using a mean reversion adjustment wherein betas are pushed towards 1.0 to correct statistical irregularity is inappropriate for utility companies. Instead, the statistical anomalies should push the beta back to the industry average beta for utility companies. The 1.10 beta obviously does not measure prospective risk and making a correction by moving the beta towards 1.0 would not help. The NICOR example effectively demonstrates that mean reversion adjustments of utility betas are not appropriate. These adjustments do not improve the measurement of beta but instead simply result in increased cost of equity numbers.
• .
NICOR and S&P Indicies: Beta from 02/00 to 12/05 -- 0.50 Beta from 07/02 to 12/05 -- 1.18 Beta from 02/00 to 07/03 -- 0.53
Beta from 08/03 to 12/05 -- 0.32
0.60
0.80
1.00
1.20
1.40
1.60
1/3
/200
0
5/3
/200
0
9/3/
2000
1/3
/20
01
5/3
/20
01
9/3/
2001
1/3
/200
2
5/3
/20
02
9/3
/20
02
1/3
/200
3
5/3
/200
3
9/3/
200
3
1/3/
200
4
5/3
/200
4
9/3
/200
4
1/3
/200
5
5/3
/200
5
9/3
/200
5
Ind
ex NICOR
S&P 500

Cost of CapitalApr 19, 202349
Asset Beta versus Equity Beta
• Without Taxes
Ba = (D/V)*Bd + (E/V)*Be
Be measured with stock prices
D,V,E are debt, enterprise value and equity value measured at market value.
Often assume Bd = 0
Or, Be = (Ba – (D/V)*Bd) * V/E
• With taxes
Ba = (D x (1-t))/(E+D*(1-t)) * Bd + (E/(D*(1-t) + E *(1-t))*Be
Assumes that all cash flows from debt are tax deductible

Cost of CapitalApr 19, 202350
Equity beta Debt/ Equity Asset beta
CPA 1.3 50% 0.91
SIA 1.09 25% 0.91
• Cathay Pacific has an observed beta of 1.3 and a debt to equity ratio of 50%. Singapore Airlines has a debt equity ratio of 25%. Calculate the equity beta of Singapore Airlines. The tax rates in Hong Kong and Singapore are 15 and 20% respectively.
Example of Asset and Equity Beta

Cost of CapitalApr 19, 202351
WACC Illustration Using Unlevered Beta
• The WACC Slide shows the relation between the WACC and the Asset Beta

Cost of CapitalApr 19, 202352
Asset Beta

Cost of CapitalApr 19, 202353
Adjustments to Cost of Equity
• Additional Premiums for
Size
Liquidity
Three Factor Model: Size, Beta, Market to Book
• Arbitrage Pricing Model
• Liquidity Dimensions
Size
Time
Quantity

ValuationApr 19, 202354
Gordon’s Model and Implicit Discount Ratesk = D1/P + g

Cost of CapitalApr 19, 202355
DCF Issues
• How should one select an appropriate sample of comparable companies with similar risk to ComEd to derive the implied cost of equity capital;
• What method should be used to compute the constant expected growth rate of marginal investors for each company in the comparable sample;
• Whether a valuation model for using earnings is a better way to derive the implicit cost of equity capital than dividend growth model; and,
• Should adjustments for quarterly compounding be made in deriving implicit discount rates.

Cost of CapitalApr 19, 202356
Growth Rate Issues
• In their text titled “Valuation: Measuring and Managing the Value of Companies” published in 2005, Tim Koller, Marc Goedhart and David Wessels state that “analyst forecasts focus on the short term and are severely upward biased.”
• Enrique Arzac comments on the difficulty of predicting growth rates and the potential for the DCF model to over-estimate the cost of equity as follows: “The problem with [the DCF] approach is that long-term dividend growth rate of an individual company cannot be estimated with any degree of precision. Hence, the dividend growth model is not likely to produce reliable estimates of the cost of equity capital of individual companies….A number of empirical studies have documented optimistic bias in analysts’ opinions….Thus, it seems reasonable to conclude that [the DCF equation] yields an upper bound to the equity premium.”
• Claus and Thomas conclude that earnings and dividend growth rates used for the DCF model “exhibit substantial optimism bias and need to be adjusted downward.”
• Louis Chan and his coauthors conclude that “over the period 1982 to 1998, the median of the distribution of IBES growth forecasts is about 14.5 percent, a far cry from the median realized five year growth rate of about 9 percent for income before extraordinary items.”
• Fama and French state that “In short, we find no evidence to support a forecast of strong future dividend or earnings growth at the end of our sample period.”

Cost of CapitalApr 19, 202357
Use of ROE x (1-Payout) to Estimate Growth
• If the dividend payout ratio is 100% then even when a utility is currently earning more than its cost of capital (such as Exelon and NICOR) the earnings and book value do not grow (unless equity is issued at a market to book value above 1.0). Since the equity base does not increase because no earnings are retained, a constant future return on equity applied to a constant amount of equity means that the income also remains constant. With no earnings growth, the EPS growth is zero.
• At the other extreme, if the dividend payout ratio is zero, then earnings increase book value of equity on a one for one basis. In this case without dividend payments (again assuming a constant return on equity) the book value of equity increases by the return on equity multiplied by the initial amount of equity on the balance sheet. Assuming a constant return is multiplied by the book value that increases at a growth rate defined by the return on equity, the earnings also growth at the return on equity. This is the growth rate implied by the formula above.
• For intermediate cases where the dividend payout is between zero and one, the growth rate in earnings is the return on equity multiplied by one minus the dividend payout ratio under the assumption of a constant return on equity.

Cost of CapitalApr 19, 202358
• Investment decisions and cost of capital
• Cost of capital and valuation
• Cost of capital applied to free cash flow
• Residual value
• Relative valuation
• DCF Compared to payback rule and accounting earnings criteria
Importance of Cost of Capital in Decision Making

Cost of CapitalApr 19, 202359
Example of Discounted Dividends
• Morgan Stanley calculated terminal values by applying a range of multiples to the estimated EPS in fiscal year 2009 and the dividend streams and terminal values were then discounted to the present using a range of discount rates representing an estimated range of the cost of equity for each of PSEG and Exelon. Based on this analysis, Morgan Stanley calculated per share values for PSEG ranging from $42.75 to $47.10. Morgan Stanley noted that the implied consideration to be paid for each share of PSEG common stock was $53.14 as of December 15, 2004, which was greater than the range implied by this analysis. In addition, based on this analysis, Morgan Stanley calculated per share values for Exelon ranging from $38.15 to $42.01 and noted that the closing price of Exelon common stock on December 15, 2004 was $43.38, which was greater than the range implied by this analysis.

Cost of CapitalApr 19, 202360
Company Profiles

Cost of CapitalApr 19, 202361
Impact of the Cost of Capital on Value
• Compute free cash flow from calculations sheet in the corporate model
• Apply different discount rates to the free cash flow
• Assume the final year cash flow occurs into perpetuity
• Compute enterprise value, equity value and equity value per share

Cost of CapitalApr 19, 202362
Deriving Implicit Discount Rate with Corporate Models
• Using the same discount rate is a very lose form of risk neutral valuation
• Using the this process illustrates how your stock is the currency of the transaction
• Step by Step Approach
Value your company using a set of base case assumptions
Back into the discount rate that makes the value in the model equal to the current market value
Use same discount rate and same set of assumptions to value the target

ValuationApr 19, 202363
Adjusted Net Present Value

Cost of CapitalApr 19, 202364
Objectives of APV
• NPV assumes
Capital structure remains the same
Leveraged Buyout
Constant Tax Rates
NOL
• APV corrects for some assumptions
Changing WACC
Distortions in WACC for capital structure
Changing tax rates

Cost of CapitalApr 19, 202365
Adjusted Net Present Value
• Value the Company as if it were entirely financed by equity using the statutory income rates
• Add the tax shields due to interest expense separately and use the debt discount rate to value this shield
• Compute the present value of net operating losses using the equity discount rate

Cost of CapitalApr 19, 202366
Adjusted Net Present Value
• Steps
Present Value of Free Cash Flow at discount rate using Ba without tax adjustments
Present value of tax shield from interest at the debt rate
Present Value of net operating loss
• Interest Tax Shield
PV of interest x tax rate
Plus: terminal value of debt

Cost of CapitalApr 19, 202367
Comparison between AVP and DCF with WACC
• WACC
Tax shield in the discount rate
Different accounting for NOL (WACC must use changing effective tax rates)
Changing value of debt
Timing of debt repayments
• Example
Same operating cash flows
Alternative debt payoff assumptions
Cost of CapitalApr 19, 202368
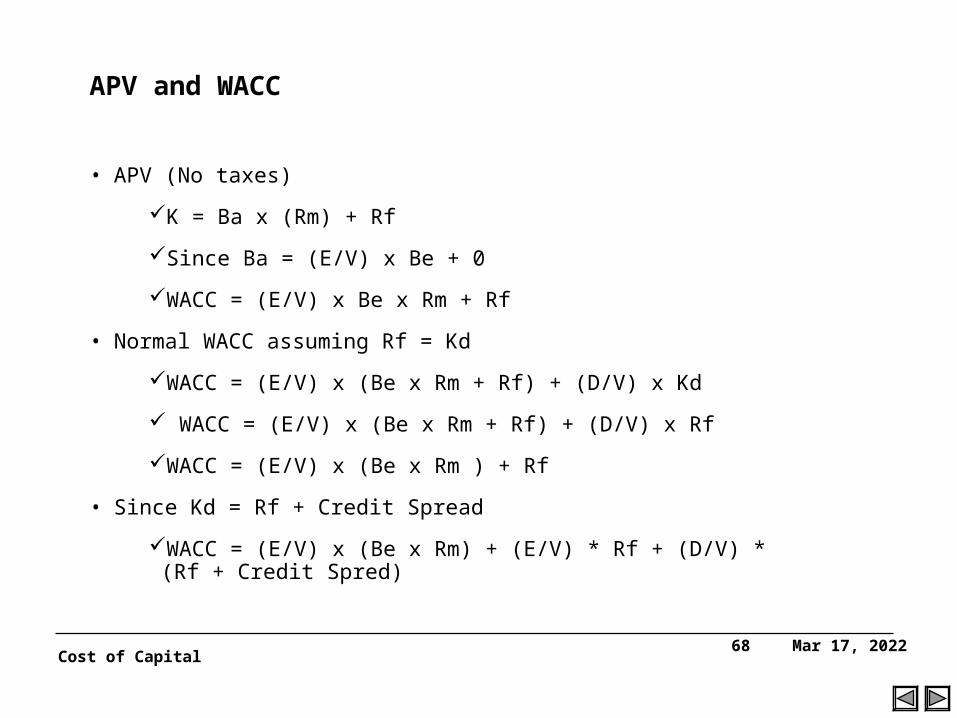
APV and WACC
• APV (No taxes)
K = Ba x (Rm) + Rf
Since Ba = (E/V) x Be + 0
WACC = (E/V) x Be x Rm + Rf
• Normal WACC assuming Rf = Kd
WACC = (E/V) x (Be x Rm + Rf) + (D/V) x Kd
WACC = (E/V) x (Be x Rm + Rf) + (D/V) x Rf
WACC = (E/V) x (Be x Rm ) + Rf
• Since Kd = Rf + Credit Spread
WACC = (E/V) x (Be x Rm) + (E/V) * Rf + (D/V) * (Rf + Credit Spred)
Cost of CapitalApr 19, 202369
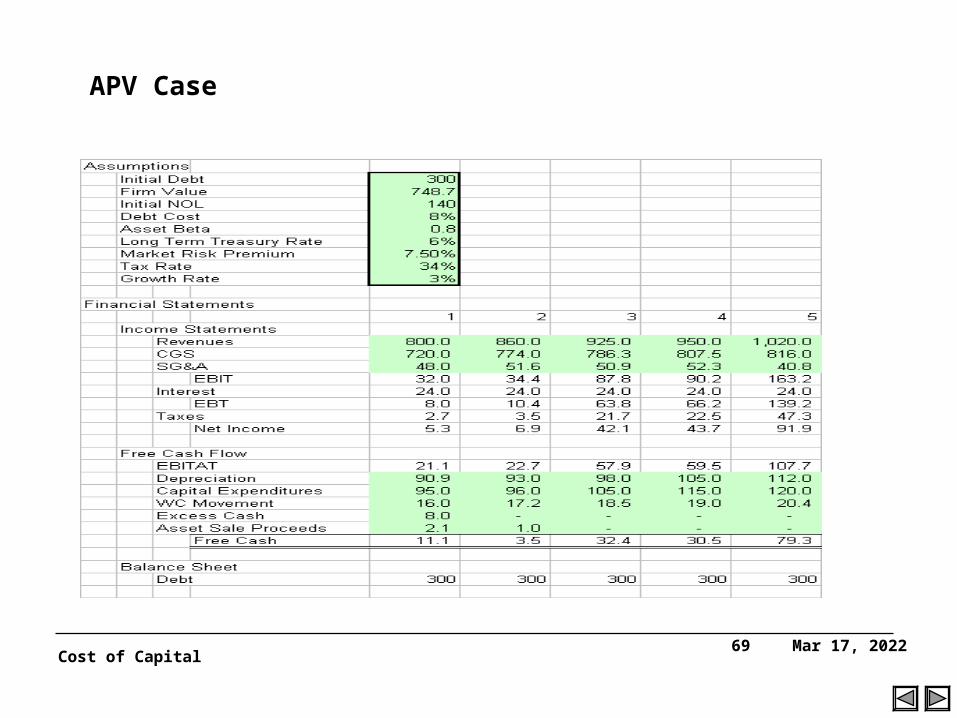
APV Case

Cost of CapitalApr 19, 202370
• A stable growth rate is a growth rate that can be sustained forever. Since no firm, in the long term, can grow faster than the economy which it operates it - a stable growth rate cannot be greater than the growth rate of the economy.
• It is important that the growth rate be defined in the same currency as the cash flows and that be in the same term (real or nominal) as the cash flows.
• In theory, this stable growth rate cannot be greater than the discount rate because the risk-free rate that is embedded in the discount rate will also build on these same factors - real growth in the economy and the expected inflation rate.
Growth Rate and Discount Rate

Cost of CapitalApr 19, 202371
• The most common errors in dividend discount model valuation are in the assumptions about the payout ratio as the growth rate changes.
• Many high growth firms either pay low dividends or no dividends. As the growth rate changes, the dividend payout ratio should rise. If it does not, these firms will not be worth much using these models.
Common errors in dividend discount model valuation

Cost of CapitalApr 19, 202372
geared ungeared
ungearedgeared
Vd(1- Tax rate)Ve
Vd(1- Tax rate)Ve
1
1
thus
Asset and Equity Beta with Taxes
• The asset beta can be computed using the formula:
• B(asset) = B(equity) x (Equity/EV) + B(debt) x (Debt/EV)
• The weights must be at market value
Cost of CapitalApr 19, 202373
What Term of Treasury Bond Should be Used
• One of the slides says we should use 10-year treasury as risk-free rate. It would be helpful to give more depth, such as, do you use a 10-year US government bond or local currency bond and why not 30-years bond rather than 10-year bond.
• In theory, the duration of the risk free rate should be the same as the duration of the equity cash flows to eliminate interest rate risk. To see this, consider the venture capital example when the cash flows all occurred in 7 years. Pretend that somehow the cash flow could be hedged in futures markets in year 7 and there is no risk. In this example, a risk free zero coupon rate bond that matures in 7 years would clearly match the cash flow of the equity. A bond with a seven year duration would accomplish this.

Cost of CapitalApr 19, 202374
What Term of Treasury Bond Should be Used
• One of the slides says we should use 10-year treasury as risk-free rate. It would be helpful to give more depth, such as, do you use a 10-year US government bond or local currency bond and why not 30-years bond rather than 10-year bond.
• In practice of course, the duration of equity cash flows is not known. The duration is computed using the formula:
• Duration = ∑ (t x PV of Cash Flow)/Present Value
• The duration can be computed for a 10 year bond and for equity as illustrated in the following slides.

Cost of CapitalApr 19, 202375
Duration of 10 Year Bond
Coupon 5% Value 1000Term 10 Sum PV x t 15,979 Par 1000 Duration 7.99 YTM 5%Credit Spread 0%
Date PeriodCash Flow
DiscoutRate PV x t
1/1/2005 1 25 0.98 24.39 7/1/2005 2 25 0.95 47.59 1/1/2006 3 25 0.93 69.64 7/1/2006 4 25 0.91 90.60 1/1/2007 5 25 0.88 110.48 7/1/2007 6 25 0.86 129.34 1/1/2008 7 25 0.84 147.22 7/1/2008 8 25 0.82 164.15 1/1/2009 9 25 0.80 180.16 7/1/2009 10 25 0.78 195.30 1/1/2010 11 25 0.76 209.59 7/1/2010 12 25 0.74 223.07 1/1/2011 13 25 0.73 235.76 7/1/2011 14 25 0.71 247.70 1/1/2012 15 25 0.69 258.92 7/1/2012 16 25 0.67 269.45 1/1/2013 17 25 0.66 279.31 7/1/2013 18 25 0.64 288.52 1/1/2014 19 25 0.63 297.13 7/1/2014 20 1025 0.61 12,510.55
Duration of 10 year Bond at 5%
Coupon 0% Value 610.27094Term 10 Sum PV x t 12,205 Par 1000 Duration 10.00 YTM 5%Credit Spread 0%
Date PeriodCash Flow
DiscoutRate PV x t
1/1/2005 1 0 0.98 - 7/1/2005 2 0 0.95 - 1/1/2006 3 0 0.93 - 7/1/2006 4 0 0.91 - 1/1/2007 5 0 0.88 - 7/1/2007 6 0 0.86 - 1/1/2008 7 0 0.84 - 7/1/2008 8 0 0.82 - 1/1/2009 9 0 0.80 - 7/1/2009 10 0 0.78 - 1/1/2010 11 0 0.76 - 7/1/2010 12 0 0.74 - 1/1/2011 13 0 0.73 - 7/1/2011 14 0 0.71 - 1/1/2012 15 0 0.69 - 7/1/2012 16 0 0.67 - 1/1/2013 17 0 0.66 - 7/1/2013 18 0 0.64 - 1/1/2014 19 0 0.63 - 7/1/2014 20 1000 0.61 12,205.42
Duration of 10 year Bond at 5%

Cost of CapitalApr 19, 202376
What Term of Treasury Bond Should be Used
• One of the slides says we should use 10-year treasury as risk-free rate. It would be helpful to give more depth, such as, do you use a 10-year US government bond or local currency bond and why not 30-years bond rather than 10-year bond.
• Practical – “The 10-year rate is less susceptible to two problems involved in using a longer rate, such as a 30 year Treasury Bond rate. Its price is less sensitive to unexpected changes in inflation and so has a smaller beta that the thirty year rate. Also, the liquidity built into 10 year rates may be lower than that of 30 year bonds.
Cost of CapitalApr 19, 202377
WACC and Cost of Capital Estimation in Practice
• Rather than just providing the formula of WACC, it would be useful to give instructions on where to find the market premium data, betas and what is the best method vs the most practical method.
Should we include country risk, exchange rate risks etc and how to get them.
Copeland says: “the most common errors in setting the WACC are:
Making ad hoc adjustments for risk, and
Using the WACC to discount foreign currency cash flow

Cost of CapitalApr 19, 202378
WACC and Cost of Capital Estimation in Practice
• Rather than just providing the formula of WACC, it would be useful to give instructions on where to find the market premium data, betas and what is the best method vs the most practical method.
Example: Assume that you are valuing Dragon Air and there is no Beta available for this company.
Assume you use US Airlines with and that the average Beta is 1.0.
The Beta is Cov(Rm,Ri)/Var(Rm)
In this case Rm is US Market
Cost of Capital in US is Rf+Rm
Cost of capital in HK should by Rf(HK) + Rm (US),
not Rf(HK) + Rm (HK), because the Beta was computed from the US Rm
Use US Rm, otherwise, the Beta would not be consistent with the Rm

Cost of CapitalApr 19, 202379
Practical Estimation of WACC and Cost of Capital
• Try some very simple steps:
• Divide the market into three beta groups
Above average 1.2
Below average .8
Average 1.0
• Find out what investors expect in local markets in terms of the premium above the risk free rate.
E.g. 5% in London and 7% in China
• Add the local risk free rate to the market premium adjusted for the three categories of beta.
• Make adjustments for country risk with political risk insurance rates

Cost of CapitalApr 19, 202380
Example of Beta and Risk Premium Computation
• Assume that Rm in Hong Kong is 7% and the Rm is the US is 5%.
• If Beta is used for a comparable 1.0 and is measured in the US, the expected return is 5% plus the Rf. This reflects the return investors require to be compensated for risk. If it is applied to a company with similar risks in Hong Kong, the
• If this Beta is applied to the Hong Kong Rm, the cost of capital implied is 7% plus the Rf.
Cost of CapitalApr 19, 202381
WACC and Cost of Capital Estimation in Practice
• Rather than just providing the formula of WACC, it would be useful to give instructions on where to find the market premium data, betas and what is the best method vs the most practical method.
In computing WACC in a merger, should you use the incremental cost of debt for the target or the acquirer
Often the debt is retired, in which case it is clear that the cost of debt of the acquirer should be used
Future debt will be financed by the acquirer not the target, so the acquirer cost of debt should be used
The value of debt in the valuation should also be at the acquirer cost of debt as in the example we developed in class

Cost of CapitalApr 19, 202382
WACC and Cost of Capital Estimation in Practice
• Rather than just providing the formula of WACC, it would be useful to give instructions on where to find the market premium data, betas and what is the best method vs the most practical method.
To compute premiums for country risk, I suggest using risk insurance premiums that are offered by institutions such as the ADB.
The ADB provides insurance for nationalization, non conversion of currency and contract abrogation. After these risks are removed, the risk should be similar to places where these risks are not present.
The ADB provides percentages to add to debt which can be added to the Rf

Cost of CapitalApr 19, 202383
Contacts
• Ed Bodmer
• www.edbodmer.com
• 1-630-886-2745