Embed Size (px)
Citation preview

Praise for Value Above Cost
“Value Above Cost reminds us that superior financial performance must be at theheart of every decision and every action we take as business professionals. And inaddition to bringing fresh insight and accompanying techniques, the Customer ValueAdded™ metric provides a formula with which to measure results and the tools todeliver on that responsibility.”
—Mark Yolton, Senior Vice President, SAP
“Marketers can always spend money to hide a flawed business strategy. Whenmoney is tougher to come by, we need to be much smarter about how we spend it.Value Above Cost shows us how to be smarter. It underscores the potential contribu-tion marketers can deliver if they diligently pay attention to this ratio.”
—Chris Gaebler, Vice President, Corporate Marketing,Sony Electronics
“CVA® is such a simple yet ingenious concept. Every businessperson from marketingto operations to finance should put this concept into everyday practice. All organiza-tions need to get back to the basics of measuring, monitoring, and increasing cus-tomer value. After all, customer value is the net value created for society. Don’s bookgives a great framework on how to achieve that nirvana.”
—Alfred Lin, Chairman and COO/CFO, Zappos.com
“In challenging economic times, it is essential to have a clear path for extracting themaximum value from your investments in product design and development. Thisbook offers the tools to plan and evaluate your marketing program.”
—Ed Reilly, Chief Executive Officer, AmericanManagement Association
“Finally, a straightforward and practical way to show the value of marketing efforts interms of revenue and profits. Don Sexton clearly explains why marketing works andhow to determine whether or not your marketing efforts are effective.”
—Bernd Schmitt, Robert D. Calkins Professor of International Business,Faculty Director, Center on Global Brand Leadership;
author, Big Think Strategy
“The book is really a substantial step in bringing marketing and finance together.Corporations have been grappling with the problem of overlapping effects of thesedecisions, and Don’s book provides a simple paradigm that can be measured andimplemented in most industries in most countries.”
—Kamal Sen, Regional Director, Business Researchand Corporate Planning, Hindustan Lever Ltd.

“CVA® is an important topic in today’s world of budgetary control. It makes a no-nonsense case for marketing and finance working closely together in assessing appro-priate and necessary spend through the perspective of customers. The future ofbusiness is directly tied to the concepts which Don has crafted through his outstand-ing work.”
—Mark C. Kershisnik, Executive Director, Eli Lilly and Company
“Securing long-term preference by managing customer perceived value should haveas much strategic focus as managing costs. There are great insights in Value AboveCost: to strategically manage both sides of the equation to ensure customer loyaltyand drive superior financial performance.”
—Steven Haro, Brand Manager, Boeing Commercial Airplanes
“Don Sexton renders a simple yet profound truth visible when he defines marketingas ‘managing perceived value.’ Customer Value Added (CVA®) is breakthroughthinking about the way customers understand value and how organizations candeliver and measure value. His 40 years of award-winning teaching, writing, andresearch in the field of marketing at Columbia University are now concise andactionable insights for the mere price of a book.”
—Kevin Clark, President and Founder, Content EvolutionLLC Worldwide; Program Director emeritus,
IBM Brand & Values Experience
“If marketing is about creating value, some marketers struggle with staying focusedon the objective. Others struggle with proving they’ve achieved it. Dr. Sexton’s bookis a must-read for both.”
—Steve Smith, CMO, Enterprise Rent-A-Car
“CVA® will be a powerful addition to the business lexicon, helping to bridge the gapbetween the CMO’s budget request and the CFO’s perceived value of marketingspend. Value Above Cost should be required reading for both.”
—Shailendra Ghorpade, Group Managing Director,Europe, Middle East, and India, MetLife
“Effective brand management requires a solid understanding of the value beingdelivered by the brand and how the business strategies link together in delivering thevalue of the brand. The concepts that Don Sexton has summarized in Value AboveCost provides practical tools and many examples on how to understand the valuecomponents. With these tools, marketers and business managers should be able toimprove the performance of their businesses while delivering the best value to theircustomers.”
—Dean Adams, Principal Brand Strategist, LEVEL

“Marketing commitments can be viewed as an expense or as an investment. DonSexton’s Value Above Cost establishes the framework for differentiating betweeninvestment with payback that should be optimized and an expense that should beminimized.”
—Tom Finneran, EVP, Agency Management Services,American Association of Advertising Agencies
“In describing how Customer Value Added™ can be used by organizations to improvetheir financial performance, Professor Sexton has bridged the gap between theoryand application…between marketing and finance. Using his techniques, CEOs andmarketing executives can evaluate alternatives and make decisions to maximize mar-ket share and profitability.”
—Daniel C. Petri, Group President—International (retired),Verizon Communications
“Don Sexton writes like he lectures: clearly, succinctly, relevantly, and always sprin-kled with a good sense of humor.”
—James R. Gregory, CEO, CoreBrand
“Don Sexton has managed to weld key ideas from marketing, economics, finance,and statistics to explain clearly how marketing drives the financial performance of acompany. Furthermore, he has given us forward control through his Customer ValueAdded™ metric that allows us to predict a company’s future performance.”
—JC Larreche, INSEAD Alfred H. Heineken Professor of Marketing;author of The Momentum Effect
“In synthesizing basic economic, financial, and brand marketing concepts under thebanner of ‘Customer Value Added™,’ Don Sexton has designed a powerful tool thatcreates a foundation for a company-wide shared view of how to think about and howto measure the financial impact of its brand marketing efforts. In this time of height-ened scrutiny of expenditures and strict accountability, we should all keep ValueAbove Cost close at all times.”
—Frank Cooper III, Chief Marketing Officer, Sparkling Beverages,Pepsi-Cola North American Beverages
“Price, marginal cost, gross profit, product attribute cost/benefit analysis, advertisingeffectiveness, and marketing ROI all have value in the senior manager’s toolkit, butCVA® is the one metric I have found that brings these together, creating a commonreference for operations, marketing, sales, and finance. This is a powerful tool everymanager needs to understand and use.”
—Mark Osterhaus, Vice President and Assistant General Manager,Harrah’s Council Bluffs

“A book that blends the disciplines of finance, economics, marketing, and brandingin a logical and thought-provoking way is one that provides real ‘Customer ValueAdded™.’”
—John Dodds, Global Branding and MarketingCommunications Director, Air Products
“A probing discussion and rewarding read. Don’s premise on the valuation of brandscontains the analytics, relevant business examples, and commentary of what to doand how to do it. Take advantage of his insights.”
—Gary Elliott, Vice President, Brand Marketing, Hewlett-Packard
“Don Sexton’s book clearly lays out best practices for gaining maximum value foryour marketing investment. This is a must-read in these tough economic times whenevery marketing dollar is being seriously questioned. This book will help you to char-ter unchartered waters!”
—Ed Faruolo, Principal, VitaLincs, LLC
“Too many business people take a conventional view of pricing as a simple cost plusexercise. This doesn’t take into consideration the value of a brand, nor consumers’willingness to buy a brand versus a mere product—as a sum of its raw material plusmargin. In Value Above Cost, Don Sexton gives us ideas as well as methods to moreaccurately understand the value of our brands to consumers and to maximize profitand grow brand equity. I will recommend his book to anyone who has influence over‘brand pricing’ as a way to better manage brands and their businesses.”
—Marshall Dawson, cofounder, Deviate Marketing; formerGlobal Brand Director, Bombay Sapphire Gin
“Customer Value Added™ combines a discipline with an insightful approach toassessing and capturing the intrinsic value of business opportunities.”
—Scott Fuson, Vice President, Specialty Chemicals andGlobal Executive Director Life Sciences, Dow Corning
“Marketing no longer has a seat at the boardroom table in many companies becausethey can’t discuss CVA® and link it to the financial performance of their company.Read on.”
—Grahame Dowling, Professor of Marketing, Australian Schoolof Business, The University of New South Wales
“CVA® serves to normalize data for multinationals like Lenovo that seek to attractboth up-market and emerging market audiences. This is no easy feat, but Don Sex-ton’s book demonstrates that it can be done. As marketers increasingly are heldaccountable for return on their in-market investments, this kind of sensible constructcan only help provide them with the ammunition they so desperately need!”
—Glen Gilbert, VP, Brand Management & Marketing Strategy, Lenovo

Value Above Cost

This page intentionally left blank

Value Above CostDriving Superior Financial
Performance with CVA®, the MostImportant Metric You’ve Never Used
Donald E. Sexton, Ph.D.

Vice President, Publisher: Tim MooreAssociate Publisher and Director of Marketing: Amy NeidlingerAcquisitions Editor: Tim MooreEditorial Assistant: Pamela BolandOperations Manager: Gina KanouseDigital Marketing Manager: Julie PhiferPublicity Manager: Laura CzajaAssistant Marketing Manager: Megan ColvinCover Designer: Alan ClementsManaging Editor: Kristy HartProject Editor: Chelsey MartiCopy Editor: Harrison Ridge ServicesProofreader: Leslie JosephSenior Indexer: Cheryl LenserCompositor: Nonie RatcliffManufacturing Buyer: Dan Uhrig
© 2009 by Pearson Education, Inc.Publishing as FT PressUpper Saddle River, New Jersey 07458
FT Press offers excellent discounts on this book when ordered in quantity for bulk purchasesor special sales. For more information, please contact U.S. Corporate and Government Sales,1-800-382-3419, [email protected]. For sales outside the U.S., please contactInternational Sales at [email protected].
Company and product names mentioned herein are the trademarks or registered trademarksof their respective owners.
All rights reserved. No part of this book may be reproduced, in any form or by any means,without permission in writing from the publisher.
Printed in the United States of America
First Printing April 2009
ISBN-10: 0-13-604332-1ISBN-13: 978-0-13-604332-4
Pearson Education LTD.Pearson Education Australia PTY, Limited.Pearson Education Singapore, Pte. Ltd.Pearson Education North Asia, Ltd.Pearson Education Canada, Ltd.Pearson Educación de Mexico, S.A. de C.V. Pearson Education—JapanPearson Education Malaysia, Pte. Ltd.
Library of Congress Cataloging-in-Publication Data
Sexton, Donald E., 1943-Value above cost : driving superior financial performance with CVAÆ, the most importantmetric you’ve never used / Donald E. Sexton.
p. cm.Includes index.ISBN 0-13-604332-1 (hbk. : alk. paper) 1. Marketing—Management. 2. Economic valueadded. I. Title. HF5415.13.S458 2009658.8—dc22
2008040502

To all the members of my wonderful family:Laura, Mitra, Daniel, Jonathan, Ian, Matt, and Nan,
who are always in my thoughts.

This page intentionally left blank

Contents
Foreword . . . . . . . . . . . . . . . . . . . . . . . . . xviii
Acknowledgments . . . . . . . . . . . . . . . . . . . . xx
About the Author . . . . . . . . . . . . . . . . . . . . xxi
Chapter 1: Marketing and Financial Performance . . . . 1Determining Marketing Accountability . . . . . . . . . 5The Value of a Business . . . . . . . . . . . . . . . . . . . . . 7Customer Value and Costs . . . . . . . . . . . . . . . . . . . 9Perceived Value . . . . . . . . . . . . . . . . . . . . . . . . . . 10A New Definition of Marketing. . . . . . . . . . . . . . 11CVA®. . . . . . . . . . . . . . . . . . . . . . . . . . . . . . . . . . . 12Cost Orientation . . . . . . . . . . . . . . . . . . . . . . . . . 13Value Orientation . . . . . . . . . . . . . . . . . . . . . . . . . 17CVA® Orientation . . . . . . . . . . . . . . . . . . . . . . . . . 19Strategic Themes. . . . . . . . . . . . . . . . . . . . . . . . . . 21Design and Communication . . . . . . . . . . . . . . . . . 25CVA® and Economic Development . . . . . . . . . . . 29Conclusions . . . . . . . . . . . . . . . . . . . . . . . . . . . . . . 32
Chapter 2: How CVA® Affects FinancialPerformance . . . . . . . . . . . . . . . . . . . . . . . 33CVA® and Financial Performance:Executive Summary . . . . . . . . . . . . . . . . . . . . . . . 33Perceived Value and Price . . . . . . . . . . . . . . . . . . 35Demand Curves . . . . . . . . . . . . . . . . . . . . . . . . . . 39Perceived Value and Revenue . . . . . . . . . . . . . . . 41Contribution . . . . . . . . . . . . . . . . . . . . . . . . . . . . 42Revenue and Contribution: An Example . . . . . . 44Shifting the Demand Curve . . . . . . . . . . . . . . . . . 45

Sexton’s Laws . . . . . . . . . . . . . . . . . . . . . . . . . . . . 48Sexton’s Revenue Law . . . . . . . . . . . . . . . . . . . . . 48Sexton’s Contribution Law . . . . . . . . . . . . . . . . . 50
Employing Sexton’s Contribution Law . . . . . . . . 52Contribution and Profit, Cash Flow,Shareholder Value, and Share Price . . . . . . . . . . 56CVA® and Life Time Customer Value . . . . . . . . . 58Conclusions . . . . . . . . . . . . . . . . . . . . . . . . . . . . . . 62Appendix: Derivations. . . . . . . . . . . . . . . . . . . . . . 63
Chapter 3: CVA® over Time . . . . . . . . . . . . . . . . . . . . . 65Levels of Sales Life Cycles . . . . . . . . . . . . . . . . . . 66The Competitive Life Cycle . . . . . . . . . . . . . . . . . 67Sales Life Cycle . . . . . . . . . . . . . . . . . . . . . . . . . . . 69Margin Life Cycle . . . . . . . . . . . . . . . . . . . . . . . . . 69Unit Cost Life Cycle . . . . . . . . . . . . . . . . . . . . . . . 69Perceived Value Life Cycle . . . . . . . . . . . . . . . . . . 70CVA® Life Cycle . . . . . . . . . . . . . . . . . . . . . . . . . . 73Financial Performance over Time . . . . . . . . . . . . 76Brand Equity . . . . . . . . . . . . . . . . . . . . . . . . . . . . . 78Valuing Brand Equity . . . . . . . . . . . . . . . . . . . . . . 81Estimating Brand Equity . . . . . . . . . . . . . . . . . . . 83Conclusions . . . . . . . . . . . . . . . . . . . . . . . . . . . . . . 86
Chapter 4: Perceived Value . . . . . . . . . . . . . . . . . . . . . 89Expected, Actual, and PerceivedPerformance . . . . . . . . . . . . . . . . . . . . . . . . . . . . . 90Marketing Ratios . . . . . . . . . . . . . . . . . . . . . . . . . . 91Determinants of Perceived Value. . . . . . . . . . . . . 92Branding and Perceived Value . . . . . . . . . . . . . . . 95Development of Perceived Value . . . . . . . . . . . . . 98Stages of Buyer Behavior . . . . . . . . . . . . . . . . . . . 99Managing Perceived Value . . . . . . . . . . . . . . . . . 104Measuring Perceived Value . . . . . . . . . . . . . . . . 112Estimating Demand Curves . . . . . . . . . . . . . . . . 121Conclusions . . . . . . . . . . . . . . . . . . . . . . . . . . . . . 125
xii VALUE ABOVE COST

CONTENTS xiii
Chapter 5: Costs . . . . . . . . . . . . . . . . . . . . . . . . . . . . . 127The Income Statement in CustodialFormat . . . . . . . . . . . . . . . . . . . . . . . . . . . . . . . . 127Types of Costs. . . . . . . . . . . . . . . . . . . . . . . . . . . 129The Income Statement in ContributionFormat . . . . . . . . . . . . . . . . . . . . . . . . . . . . . . . . . 131Identifying Costs for CVA® . . . . . . . . . . . . . . . . 134Employing the Variable Margin Rate. . . . . . . . . 136Graphing Contribution . . . . . . . . . . . . . . . . . . . . 138Fixed Costs . . . . . . . . . . . . . . . . . . . . . . . . . . . . . 139Breakeven Sales Level . . . . . . . . . . . . . . . . . . . . 139Direct and Indirect Fixed Costs . . . . . . . . . . . . . 144Shutdown Sales Level . . . . . . . . . . . . . . . . . . . . . 146Evaluating Contribution . . . . . . . . . . . . . . . . . . . 147Conclusions . . . . . . . . . . . . . . . . . . . . . . . . . . . . . 149
Chapter 6: Managing CVA® . . . . . . . . . . . . . . . . . . . . 151Marketing Strategy Versus MarketingTactics . . . . . . . . . . . . . . . . . . . . . . . . . . . . . . . . . 151Components of a Marketing Strategy. . . . . . . . . 154Identifying Possible Target Markets. . . . . . . . . . 156Evaluating Possible Positions for theProduct or Service. . . . . . . . . . . . . . . . . . . . . . . . 159Determining Design . . . . . . . . . . . . . . . . . . . . . 167Selecting Target Segments . . . . . . . . . . . . . . . . . 170Developing Communications . . . . . . . . . . . . . . . 173Managing the Brand . . . . . . . . . . . . . . . . . . . . . . 176Conclusions. . . . . . . . . . . . . . . . . . . . . . . . . . . . . 179
Chapter 7: Managing CVA® over Time . . . . . . . . . . . 181Managing CVA® Through the MarketLife Cycle . . . . . . . . . . . . . . . . . . . . . . . . . . . . . . 181Financial Objectives Throughout theCompetitive Life Cycle . . . . . . . . . . . . . . . . . . . . 185Managing CVA® Throughout theCompetitive Life Cycle . . . . . . . . . . . . . . . . . . . . 187Introduction Stage. . . . . . . . . . . . . . . . . . . . . . . . 192

xiv VALUE ABOVE COST
Rapid Growth Stage . . . . . . . . . . . . . . . . . . . . . . 196Competitive Turbulence Stage . . . . . . . . . . . . . . 199Maturity Stage . . . . . . . . . . . . . . . . . . . . . . . . . . . 202Decline Stage . . . . . . . . . . . . . . . . . . . . . . . . . . . 203Optimizing Financial Performance over Time. . . . . . . . . . . . . . . . . . . . . . . . . . . . . . . 205Conclusions . . . . . . . . . . . . . . . . . . . . . . . . . . . . . 210
Chapter 8: Utilizing CVA® for StrategicDecisions . . . . . . . . . . . . . . . . . . . . . . . . . . 211Targeting . . . . . . . . . . . . . . . . . . . . . . . . . . . . . . . 212CVA® and Market Segmentation . . . . . . . . . . . . 215Using CVA® to Target Market Segments . . . . . . 219Positioning . . . . . . . . . . . . . . . . . . . . . . . . . . . . . . 223Using CVA® to Determine Positioning . . . . . . . 226Using CVA® to Evaluate Multiple Positions . . . 227CVA® and “Grey Markets” . . . . . . . . . . . . . . . . . 232Branding . . . . . . . . . . . . . . . . . . . . . . . . . . . . . . . 233Using CVA® to Build a Brand . . . . . . . . . . . . . . 235CVA® and Brand Architecture . . . . . . . . . . . . . . 237CVA® and Brand Extensions. . . . . . . . . . . . . . . . 241CVA® and Co-Branding . . . . . . . . . . . . . . . . . . . 243Conclusions . . . . . . . . . . . . . . . . . . . . . . . . . . . . . 246
Chapter 9: Utilizing CVA® for Marketing ProgramDecisions . . . . . . . . . . . . . . . . . . . . . . . . . . 247Communications . . . . . . . . . . . . . . . . . . . . . . . . . 249CVA® and Communications . . . . . . . . . . . . . . . 255Using CVA® to DetermineCommunications Spending . . . . . . . . . . . . . . . . 257Pricing . . . . . . . . . . . . . . . . . . . . . . . . . . . . . . . . . 259CVA® and Pricing . . . . . . . . . . . . . . . . . . . . . . . . 262Using CVA® to Determine Pricing . . . . . . . . . . 262Pricing in Multiple Markets. . . . . . . . . . . . . . . . 265CVA® and Distribution . . . . . . . . . . . . . . . . . . . . 269Conclusions . . . . . . . . . . . . . . . . . . . . . . . . . . . . . 273

CONTENTS xv
Chapter 10: Building the Marketing AccountabilityScorecard . . . . . . . . . . . . . . . . . . . . . . . . . 275General Practice . . . . . . . . . . . . . . . . . . . . . . . . . 276Use of Specific Marketing ROI Measures . . . . . 279Searching for a Marketing AccountabilityScorecard . . . . . . . . . . . . . . . . . . . . . . . . . . . . . . . 284Conclusions . . . . . . . . . . . . . . . . . . . . . . . . . . . . . 291
Chapter 11: Organizing to Manage CVA® . . . . . . . . . . 293How Individuals and Organizations Behave . . . 295Task Clarity . . . . . . . . . . . . . . . . . . . . . . . . . . . . . 297Effort. . . . . . . . . . . . . . . . . . . . . . . . . . . . . . . . . . 299Rewards . . . . . . . . . . . . . . . . . . . . . . . . . . . . . . . 300Capabilities . . . . . . . . . . . . . . . . . . . . . . . . . . . . . 301Environment. . . . . . . . . . . . . . . . . . . . . . . . . . . . 307Results. . . . . . . . . . . . . . . . . . . . . . . . . . . . . . . . . 309Conclusions. . . . . . . . . . . . . . . . . . . . . . . . . . . . . 310
Endnotes . . . . . . . . . . . . . . . . . . . . . . . . . . 311
Index . . . . . . . . . . . . . . . . . . . . . . . . . . . . . 329

This page intentionally left blank

Foreword
Customer Value Added is the most critical concept for the busi-ness community to understand, embrace, and practice. The greaterthe value added, the greater the opportunity to drive profitability and,therefore, increase shareholder value—which is the primary objec-tive of the CEO.
As business people, our primary responsibilities are to driveshareholder value by selling sufficient quantities of preferred andprofitable products and services to consumers and customers. Thekey word in that sentence for marketers is preferred. Preference byconsumers and customers may be real or it may be perceived—but itis a preference nonetheless.
Our job as marketers is to create preference via distinctive anddifferentiated communications. Not only must marketers create pref-erence, but we must also try and grow it over time to ensure that theproduct or service can contribute positive cash flow to the businessenterprise over the longer term. Preference equals perceived value.The more preference that marketers can drive, the more perceivedvalue can be delivered to customers—thereby driving increasinglevels of cash flow and shareholder value.
Professor Sexton can certainly explain these business dynamicsfar better than I—and he does—in this eloquent masterpiece of busi-ness marketing and economics. What is magnificent in Professor Sex-ton’s work is that he provides the fundamentals of how this businessmodel effectively operates. By paying attention to these core funda-mentals, marketers will improve their odds for delivering upon theCEO’s ultimate objective—driving shareholder value.
Many successful marketers have paid attention to the fundamen-tals—and have succeeded as a result. Let’s take a look at a few recentexamples:
• Apple’s iPod was brilliant—not in its technology—but in itsmarketing. Apple didn’t invent MP3 players or flash technologyor recorded music. But what it did so well was it marketed the

perceived benefits of portable and customized music. Apple’stechnology was easily replicated—but not its leadership posi-tion. Consumers perceived that Apple was the preferred devicefor personal, customized music management. Customer valueadded could not have been higher as it reflected substantialmarketplace preference.
• Procter & Gamble’s Pampers brand is reinventing how parentschoose diapers. Pampers created enormous equity and cus-tomer value by changing the conversation with consumers.While parents care about keeping their babies dry, Pamperswent one step further and expanded the focus on total babycare. By doing so, Pampers tapped into the reservoir ofparental goodwill, which was rapidly transferred to Pampers interms of trust and preference. That meant marketplace leader-ship and growing profits. Was Pampers necessarily a better dia-per? Probably not, but in the minds of parents it certainly was.
Does a lot of this sound familiar? Well it should—because this isthe essence of building a successful brand. There is no greater respon-sibility for a marketer than to preserve, if not build, brand value.Building strong brands creates the core customer loyalty and long-term demand that gives marketers great latitude for creating pricepremiums among a sea of commodity-like products. What kind ofprice premium can marketers charge? Quite simply, it’s the perceivedvalue that consumers ascribe to the product and service. The greaterthe perceived value, the greater opportunity to build margins viaprice, thereby increasing positive cash flows and brand profitability.
Professor Sexton’s book wonderfully and easily navigates the mar-ketplace strategies and theories that serve as beacons for successfulbrand management. As you leap into the contours of this outstandingbrand management perspective, know that there are many pitfallslurking that can undercut a marketer’s ability to deliver the goods.Good marketers must follow core brand management practices thatcan often escape even the most savvy of marketers, for example:
• Strong marketing accountability practices. Insufficientmetrics and measurements can derail any good brand buildingmanagement. In fact, it’s an old axiom, “You can’t manage what
xviii VALUE ABOVE COST

you can’t measure.” Marketers must continue to work to linkmarketing, finance, and a solid analytics to create targeted met-rics that provide quick and compelling feedback on the impactof brand management programs.
• Effective integrated marketing communications. As mar-keters have an expanding array of media to pursue their cus-tomer and consumer targets, they need to have a good footholdas to how they select the most effective media and decide onthe levels of financial resources to devote to the use of variousmarketing approaches.
• Outstanding marketing and media talent. The field ofmarketing has received increasing criticism for failing to keepthe marketing management pipeline full of holistic businessthinkers that can blend great creativity with dynamic leader-ship potential and superb business savvy. Those needs are criti-cal, not only at the brand management level, but also in termsof the support resources at advertising and media agencies.
It’s certainly not easy being a marketer. But Professor Sextonmakes it a lot easier by providing guidance on how to think aboutmanaging the significant challenges marketers face each and everyday. And, now, it’s time for you to move from my take on ProfessorSexton’s work and to create your own perspective. Enjoy the goodreading. You probably won’t come across this wonderful path again.
Many thanks Professor Sexton—not many could have said it aswell as you.
Bob LiodicePresident & CEOANA—The Association of National Advertisers
FOREWORD xix

xx VALUE ABOVE COST
Acknowledgments
Many thanks to many people: Peter Farquhar, Jim Gregory, andDon Lehmann, professional colleagues and friends, whose ideas arealways fresh, always stimulating. Bob Liodice, CEO of the Associa-tion of National Advertisers, for his breadth of vision, thoughtful mar-keting insights, and long-time encouragement. Barbara Bacci Mirquefor her much-appreciated support. All the executives who generouslyshared their experience and insights in their sidebars: Dean Adams,Susan Avarde, Serdar Avsar, Michael Bentivegna, Jeff Berman,Robert Bordley, Kevin Clark, Eduardo Conrado, Marshall Dawson,Jamie DePeau, John Dodds, Gary Elliott, Carlos Falchi, Ed Faruolo,Tom Finneran, Lauren Flaherty, Amy Fuller, Scott Fuson, ChrisGaebler, Shailendra Ghorpade, Andrew Giangola, Steven Haro, TonyHsieh, Peter Neiman, Mark Osterhaus, Evan Oster, Dan Petri, EdRiley, Cheryl Sawyer, Becky Saeger, Kamal Sen, Steve Smith, and JonSpector, all singularly effective managers whose paths I have had thegood fortune to cross. Rajinder Balaraman and Venu Gorti for our
many years ago and whose wit provides perspective on everything.vigorous discussions. Ashleigh Brilliant, whom I met in Santa Barbara
Pearson for the many ways they have helped. Thanks to all.Tim Moore, Gina Kanouse, Anne Goebel, and Megan Colvin of

About the Author
Donald E. Sexton is Professor of Marketing and Decisions,Risk, and Operations, and Director of the Jerome A. Chazen Instituteof International Business, Columbia University. Don received hisB.A. in mathematics and economics from Wesleyan University andhis Ph.D. and M.B.A. in business economics and mathematical meth-ods and statistics from the University of Chicago. He has been teach-ing at Columbia for more than 40 years in the areas of marketing,international business, and quantitative methods, and is a recipient ofthe Business School’s Distinguished Teaching Award. Don is a visitingprofessor at the China Europe International Business School inShanghai and has also taught at the University of California-Berkeley,INSEAD, the Indian School of Business, the Australian GraduateSchool of Management, Skolkovo (The Moscow School of Manage-ment), the University of Tehran, the US Business School in Prague,and the Hong Kong University of Science and Technology. He hasmore than 100 publications and has published articles in numerousjournals such as the Harvard Business Review, Journal of Marketing,Journal of Marketing Research, Journal of Advertising Research, andManagement Science. He is frequently quoted in media such as theNew York Times, BusinessWeek, Ad Age, Brandweek, and Beijing’sChina Economic Daily. Don is the Program Director of the Confer-ence Board’s Marketing Effectiveness Conference and MarketingResearch Councils and is a frequent speaker at Association of NationalAdvertisers events. His research concerns marketing return on invest-ment and marketing and branding strategy. His best-selling book onmarketing management, Marketing 101 (Wiley), has been translatedinto several languages including Chinese, Turkish, Polish, and Indone-sian. His book on building and managing brands, Branding 101(Wiley), was published in 2008. Don is the principal of The ArrowGroup, Ltd.®, which has provided consulting and training services tocompanies such as GE, IBM, Pfizer, Unilever, Citigroup, DuPont, andVerizon. You can reach Don at [email protected] or log ontowww.cva.us.com.

This page intentionally left blank

Marketing and Financial Performance
Today’s competitive environment creates enormous pressures onall managers to be more effective (Exhibit 1.1). Managers at everylevel from Chief Executive Officer, Chief Marketing Officer, andChief Financial Officer to the assistant to the Assistant Brand Man-ager feel these pressures.1
1
1
MARKETINGMANAGERS
COMPETITIVEENVIRONMENT
COMPETITORSCUSTOMERS
ECONOMY TECHNOLOGY
INTERNAL PRESSUREBOARD CEO CFO OTHER MANAGERS
REGULATIONPOPULATION
Exhibit 1.1 Pressures on marketing

Marketing managers feel not only the external pressures of thecompetitive environment but also internal pressures from fellowmanagers who ask reasonable questions within their organizations,such as:
• What is the return on our marketing efforts? • What would our sales or profits be if we cut back on the mar-
keting budget?• Why should we increase efforts in marketing?
In their surveys of marketing managers, the Association ofNational Advertisers (ANA) has found that relatively few managersare satisfied with their ability to estimate the return on their market-ing efforts, and relatively few believe that they can forecast theimpact of a 10 percent cut in the marketing budget (Exhibit 1.2).2
Exhibit 1.2 Marketing manager’s views on their ability to evaluatemarketing
How would you evaluate your ability to determine marketing ROI?
Very Satisfied or Satisfied
2005 (ANA) 13%
2006 (ANA) 23%
2007 (ANA) 11%
2008 (ANA) 13%
“I can forecast the impact of a 10% cut in the marketing budget.”
2005 (ANA) 16%
2006 (ANA) 28%
2007 (ANA) 18%
2008 (ANA) 10%
It is, therefore, not at all surprising that about 60 percent offinance managers surveyed by Financial Executive Magazine havedoubts about marketing forecasts (Exhibit 1.3).3 In fact, given the dis-couraging opinions of marketing managers regarding their own fore-casts, it is surprising that about 35 percent of the finance executiveswere found to be willing to believe the marketing numbers!
2 VALUE ABOVE COST

Exhibit 1.3 Financial managers’ views on marketing’s ability toevaluate marketing return
No
Given that marketing forecasts are often input to financial guidance,do you believe these forecasts are audit-ready? 60%
Do you believe that marketing has adequate understanding offinancial controls? 63.1%
Financial Executive Magazine and Marketing Management Analytics, 2008.
Few managers are satisfied with their abilityto estimate the return on their marketing efforts.
These findings are remarkably consistent—not only over studiesconducted by a wide range of organizations including the ANA, theConference Board, the American Productivity and Quality Center,the CMO Council, and various consultancies—but also over time. Infact, in all these various studies, the percentage of managers very sat-isfied or satisfied with their ability to evaluate marketing ROI is gen-erally between 10 percent and 20 percent, with no upward trend. Atthe same time, 80 percent of senior marketing managers surveyed inlate 2008 believed that the demands of board members and C-levelexecutives for proof of the effectiveness of marketing and brandinginitiatives were increasing.4
Today’s intensely competitive environment makes it increasinglydifficult to determine marketing accountability. Marketing returnsare affected by numerous, powerful marketplace forces such asknowledgeable customers, aggressive competitors, shifting macrotrends, and technological changes—evolutionary changes that pro-duce new industry leaders and revolutionary changes that producenew industries.
This book provides marketing managers and other managers,including finance managers, with tools to answer questions about theimpact of marketing efforts on an organization’s financial perform-ance. The heart of the book is the concept of Customer Value Added(CVA®). CVA® is the difference between the value an organizationprovides customers and the cost of providing that value—ValueAbove Cost (Exhibit 1.4).
CHAPTER 1 • MARKETING AND FINANCIAL PERFORMANCE 3

Exhibit 1.4 Customer Value Added
CVA® is the net value to society created by an organization. Thehigher the CVA®, the more economically successful the organization.The lower the CVA®, the less successful the organization. It is thatsimple.
CVA® is the net value to society created by an organization.
This chapter explains how you can use CVA® to improve market-ing decision-making.
4 VALUE ABOVE COST
Total net value per unit created as perceived by customer
Net value shared by the producer, resellers, and customer
Associated with contribution, profit, and cash flow
CVA® = Perceived Value Per Unit – Variable Cost Per Unit
Unum: Marketing and Shareholder Value
Scroll half way down the Fortune 500 list and you’ll find a com-pany called Unum. Rooted in a 150-year heritage, it was knownprimarily to Human Resource and Benefits professionals as theleading disability insurance company in the country. It was alsoknown for having stumbled early this decade due to litigationissues and some strategic missteps. In fact, the stock price hadfallen from a high of $33 in May, 2001, to just $6 in March, 2003.
Because Unum products are sold through brokers and offeredthrough the workplace, the company’s previous promotional cam-paigns had been trade-focused. But in the summer of 2007, to helpgive more visibility to Unum’s brand—and to reposition the com-pany from a disability insurance company to a leading employeebenefits company, Unum launched a multi-million dollar advertis-ing and branding campaign. The work centered on the company’snew tagline “better benefits at work” and included a new logo,visual identity system, sales literature, television advertising, tradeprint, consumer print and a sponsorship of ESPN’s Injury Report.

Determining Marketing AccountabilityInterest in how marketing affects financial performance has a
long history. Nearly 40 years ago, the author’s first published journalarticles concerned marketing accountability (Exhibit 1.5). Over theyears, many qualified researchers have spent considerable time andeffort attempting to estimate the return from marketing activities. Yetthe answers have remained elusive, and today marketing accountabil-ity remains one of the most important issues facing marketers.5
CHAPTER 1 • MARKETING AND FINANCIAL PERFORMANCE 5
The new work energized the sales force and gave them somethingnew to talk about with brokers and companies. In the past year,Unum’s corporate reputation has improved dramatically with bro-kers, employers of all sizes, and most importantly, with Wall Streetand the ratings agencies. In fact, today the stock price is back up toalmost $24 a share.
—Peter Neiman, Vice President, Advertising and Branding, UnumReprinted with permission of Peter Neiman
“Estimation of Marketing Policy Effects on Sales,” Journal of Marketing Research , August 1970.“Overspending on Advertising,”
Journal of Advertising Research, December 1971.
“Pricing, Perceived Value, and Communications,” The Advertiser, April 2006.“Hidden Wealth in B2B Brands,” with James R. Gregory, Harvard Business Review, March 2007.
35 + years!
Exhibit 1.5 Personal involvement in marketing accountability research
Marketing managers seem to believe that the evaluation of thereturn on the marketing investment is important. In 2006, membersof the CMO Council placed issues involving marketing ROI as threeof their top five concerns.6 A 2007 Conference Board survey foundnearly 80 percent of the respondents considered marketing ROI andmarketing metrics among their most important challenges.7

Given the amount of interest and efforts over many years, onewould expect some success. Yet, a 2008 study by the ConferenceBoard found that only 19 percent of the organizations surveyed feltthat they had made good progress in measuring marketing ROI, andmore than 50 percent had not started or had just started their effortsto measure marketing ROI.8 A 2007 Marketing NPV study foundfewer than 10 percent of respondents felt their ability to measuremarketing ROI to be “as good as it needs to be.”9 While a 2008 studyby the Lenskold Group found that 26 percent of the firms surveyedcalculated some profitability measure for at least some marketinginvestments, that is still far from a majority.10
This lack of progress is reflected in the budgeting process. Nearlytwo-thirds of marketing budgets are set based on history—last year’sbudget, according to the ANA surveys and corroborated by otherstudies.11
In Chapter 11, “Organizing to Manage CVA®,” the reasons forthis lack of progress are examined in detail.12 In brief, numerous stud-ies suggest that the main factors slowing progress in determiningmarketing accountability are:
1. Lack of clarity as to what marketing return is. Many man-agers report that there is no definition of marketing ROI withintheir organization.13
2. Lack of time devoted to marketing return. Time spent onmarketing return is one of the most useful predictors ofprogress, but many organizations have not even started todevelop systems to examine marketing return.
3. Lack of motivation for people to work on marketingreturn. Relatively few compensation or recognition systemsseem to encourage work on marketing return.
4. Lack of skills and resources. Many organizations feel theydo not have the appropriate data or the appropriate analyticalskills to evaluate marketing return.
5. Lack of cooperation between marketing and finance.Marketing and finance silos still seem to be the reality in manyorganizations.
6. Inertia. Many managers seem comfortable with what they arecurrently doing and neither feel the pressure to change norhave the time to change their approaches.
6 VALUE ABOVE COST

This book focuses on how to think about the return on marketingactivities. It shows how a company’s marketing and branding effortsplay a major role in determining the financial performance of anyorganization, including revenue, profits, cash flow, and shareholdervalue and how those efforts can be monitored and evaluated for max-imum impact.
Will this book solve all the problems in determining marketingaccountability? No, of course not. But it provides methodologies andapproaches that are broadly rooted in many disciplines—marketing,economics, finance, and accounting—and which are supported bymultiple studies. The book explains how to evaluate marketing effortswith a straightforward concept—CVA®—that has a direct relation-ship to contribution. Its use has been proven in practice by theauthor’s corporate clients.
CHAPTER 1 • MARKETING AND FINANCIAL PERFORMANCE 7
©Ashleigh Brilliant, 2008. Used with permission.
The Value of a Business
The value of a business depends on its future, not its past.
Managers, investors, and others concerned about the well-beingof an organization need to look at where it is going, not where it has

been. A company’s future financial performance depends on its long-term abilities to manage both the value it provides customers and itscosts. Expected future financial performance, in turn, determinesshareholder value. The company value meltdowns in the Fall of 2008,such as that of AIG, were due to lack of confidence in the futurefinancial performance of those organizations.14
There is a huge body of thought and writing devoted to the deter-minants of the value of a corporation.15 Many factors have been sug-gested, including managerial talent, resources, innovation ability, andcore competencies. While all of these factors surely affect the finan-cial performance of an organization, none of them provide a directlink to financial performance. Managerial talent and resources arevery broad categories. Innovation may be managed but is difficult, byits nature, to predict. Core competencies are specific but look inward(at the organization) rather than outward (toward the customers andcompetitors). Intangible assets, such as brands, have appeared topose especially difficult valuation problems for many companies.16
In lieu of factors that are linked directly to financial performance,many managers attempt to predict performance by relying on variousfinancial ratios such as return on sales and turnover.17 The problemwith many of those measures is that they look backward rather thanforward .18 A manager should always prefer leading indicators to lag-ging indicators because forward control is preferable to backwardcontrol. One wants to steer by looking through the windshield, notthrough the rear-view mirror.
CVA® is both outward looking—toward customers and competi-tors—and forward looking, in that it indicates the future performanceof an organization.
8 VALUE ABOVE COST
3M: Relation of Loyalty to Growth and Profit
3M has more than 50,000 products, 36 divisions spanning almostall major markets and subsidiary companies in 65 countries. Withthat complexity, building powerful brands is a difficult task. A keyelement of powerful brands is delivering relevance and differenti-ation. Maintaining relevance and differentiation over a long period

Customer Value and CostsIn the long-run, an organization’s financial success depends on how
well they manage two things: value to customers and costs. Both deter-mine margin and demand, and both need to be managed in concert.
Over the years, some management gurus have suggested thatbeing the customer value leader or the cost leader produces winning
CHAPTER 1 • MARKETING AND FINANCIAL PERFORMANCE 9
of time can be difficult without a solid new product engine. Fortu-nately, one of 3M’s greatest strengths is it’s strong culture of inno-vation and new product development.
To accelerate growth and build lasting customer relationships, 3Mhas processes for measuring end user loyalty to its brands. In stud-ies over time, 3M has seen loyalty increase as it focuses it efforts onimproving the specific drivers of end user loyalty. The businessesthat have achieved above average loyalty, compared to the Corpo-rate average, enjoy faster growth and higher margins.
An example is the Dental business at 3M. The 3M Dental businesswon the Baldridge award in 1997 which included tough customermeasures. The business measured end user satisfaction and loyalty.The measures were connected to the drivers of loyalty and pro-grams put in place to correct any gaps that were detected. The 3Mbusinesses that have successfully aligned programs against the gapshave achieved above average growth.
Measures and processes are necessary but not sufficient to achievethe superior performance. Business leadership and programs thatalign the resources against the priorities are required. Leadershipthat inspires employees is necessary. No strong brand can be builtwithout employees who know what to do, have the resources to dowhat is needed and are supported by their management. The Den-tal business has consistently delivered its brand promise over manyyears with several changes in management.
—Dean Adams, Director, Corporate Brand Management, 3MReprinted with permission of 3M Company
strategies.19 That is not the case. Focusing solely on customer value orcost can lead to implementation of lopsided strategies.
Having the highest customer value does not guarantee success,just as having the lowest costs does not guarantee success. Highcustomer value can lead to high costs. Low costs can lead to low cus-tomer value. Customer value and costs must be in balance.
What determines financial success is how well an organizationmaximizes the difference between the value to customers and thecosts of providing that value. That difference is known as CustomerValue Added (CVA®), the focus of this book.
CVA® has two important components: perceived value and cost.Perceived value is discussed at length in Chapter 4, “PerceivedValue,” and costs are explored in Chapter 5, “Costs.”
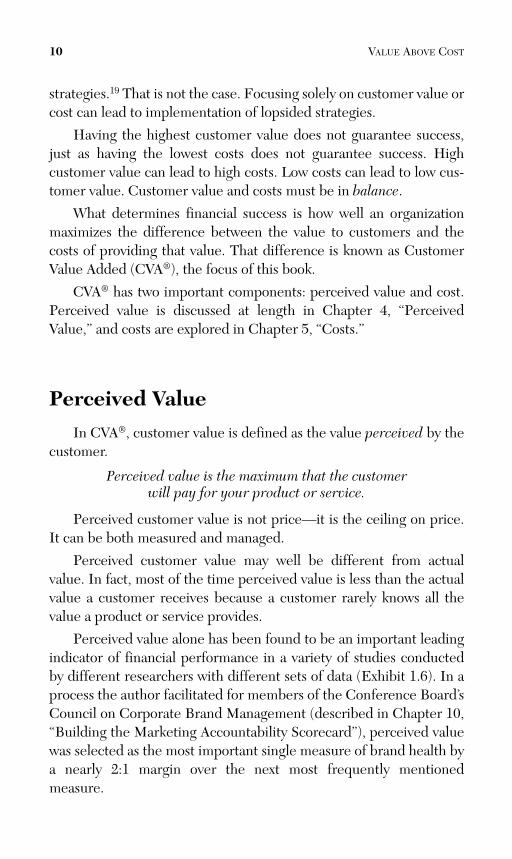
Perceived ValueIn CVA®, customer value is defined as the value perceived by the
customer.
Perceived value is the maximum that the customerwill pay for your product or service.
Perceived customer value is not price—it is the ceiling on price.It can be both measured and managed.
Perceived customer value may well be different from actualvalue. In fact, most of the time perceived value is less than the actualvalue a customer receives because a customer rarely knows all thevalue a product or service provides.
Perceived value alone has been found to be an important leadingindicator of financial performance in a variety of studies conductedby different researchers with different sets of data (Exhibit 1.6). In aprocess the author facilitated for members of the Conference Board’sCouncil on Corporate Brand Management (described in Chapter 10,“Building the Marketing Accountability Scorecard”), perceived valuewas selected as the most important single measure of brand health bya nearly 2:1 margin over the next most frequently mentionedmeasure.
10 VALUE ABOVE COST

“The relationship between brand equity and stock returnwas…strong.”—Jacobson and Aaker, EquiTrend data
“Brand differentiation and relevance are leading indicatorsof brand success.”—Agres, BrandAsset Valuator data
“There is no doubt that relative perceived quality andprofitability are strongly related.”—Buzzell & Gale, PIMS data
“…brand equity is found to have nearly as strong aninfluence as ROI [on stock return].”—Jacobson and Aaker, Techtel data
“…Corporate brand image actually has some degree ofinfluence on a significant 75 percent of the key factors thatexplain stock price.”—Gregory, Fortune 500 data
Exhibit 1.6 Research findings regarding perceived value and financialperformance20
A New Definition of MarketingMany people routinely define marketing as the “4 P’s”: product,
pricing, place, and promotion. The author never uses the 4 P’s defini-tion of marketing. Except perhaps for product, the 4 P’s definition ofmarketing concentrates on the tactical aspects of marketing such aspricing, distribution, and advertising and promotion. While tactics arecertainly important, the marketing strategy, including in particulartarget marketing and positioning, must be appropriate in order forthe tactics to have effect.
Marketing is managing perceived value.
The author’s definition of marketing is managing perceived value.Managing perceived value incorporates both the strategic and tactical
CHAPTER 1 • MARKETING AND FINANCIAL PERFORMANCE 11

areas of marketing. Frances Farrow, executive member of the boardof Virgin Atlantic, described how their marketing focuses on manag-ing value to the customer “…the customer viewpoint remains theheart of our companies’ origins…[We evaluate opportunities by ask-ing:] Are we meeting a gap where there is a need? Does it offer con-sumers a better deal? Can we offer both substance and a uniqueVirgin flair across many consumer touchpoints?”21
To attain high value perceived by target customers, it is necessaryto think strategically and design or position the product or service fora target group. It is also necessary to think tactically, for example, bycommunicating the product or service position effectively to the tar-get customers.
Products with on-target design that no one knows about do notsell. Products that are communicated widely but that have poordesign may sell once, but not again. There is a saying in advertising,“Great advertising makes poor products fail even faster”—since peo-ple are persuaded to try them and find they do not like them.
Perceived value per unit can be increased with managerial atten-tion, and it can also be decreased through managerial inattention.However, for any level of costs, the higher the perceived value, thestronger the company’s position in the market, both now and in thefuture.
While CVA® depends on both perceived customer value andcosts, much of this book concerns perceived value because managingthe value perceived by the customer should be the primary purposeof all marketing and branding efforts.
CVA®
CVA® is the difference between perceived value per unit and thevariable cost per unit for a product or service (Exhibit 1.7). CVA® isthe net value—as perceived by customers—that an organization pro-vides society.
12 VALUE ABOVE COST

Reprinted with permission from “How Marketing Affects Shareholder Value,” The ArrowGroup, Ltd.®, New York, NY, 2008.
Exhibit 1.7 Customer Value Added
If CVA® is high, an organization is perceived as providing value tosociety and will be rewarded with strong financial results. However, ifCVA® is low, the financial results will be weak. At the extreme, ifCVA® is negative, in a free market the organization will likely go outof business because the inputs it is using cost more than the value ofthe products or services it is producing. In open markets, such organ-izations fail.
Keep in mind, as mentioned earlier, that perceived value per unitis typically below actual value, as shown in Exhibit 1.7, because cus-tomers usually do not know all the benefits that they receive from aproduct or service.
Cost Orientation Unfortunately, all too often managers become preoccupied with
costs to the detriment of value to customers. With a cost orientation,managers pay minimal attention to customer value (Exhibit 1.8).
CHAPTER 1 • MARKETING AND FINANCIAL PERFORMANCE 13
Perceived Value Per Unit
Variable Delivered Cost Per Unit
0
CVA®
Actual Value Per Unit
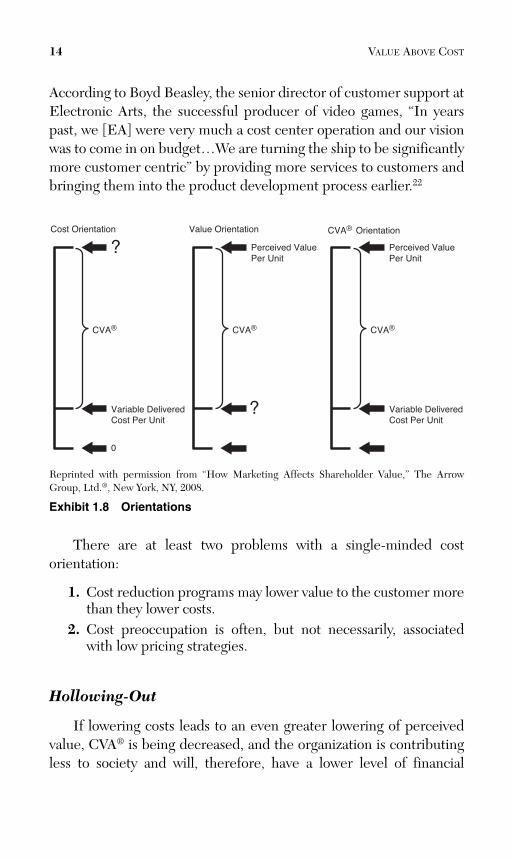
According to Boyd Beasley, the senior director of customer support atElectronic Arts, the successful producer of video games, “In yearspast, we [EA] were very much a cost center operation and our visionwas to come in on budget…We are turning the ship to be significantlymore customer centric” by providing more services to customers andbringing them into the product development process earlier.22
14 VALUE ABOVE COST
Variable Delivered Cost Per Unit
Variable Delivered Cost Per Unit
Cost Orientation
0
?
?
Perceived ValuePer Unit
Orientation
Perceived ValuePer Unit
Value Orientation
Reprinted with permission from “How Marketing Affects Shareholder Value,” The ArrowGroup, Ltd.®, New York, NY, 2008.
Exhibit 1.8 Orientations
There are at least two problems with a single-minded costorientation:
1. Cost reduction programs may lower value to the customer morethan they lower costs.
2. Cost preoccupation is often, but not necessarily, associatedwith low pricing strategies.
Hollowing-Out
If lowering costs leads to an even greater lowering of perceivedvalue, CVA® is being decreased, and the organization is contributingless to society and will, therefore, have a lower level of financial

performance. Decreasing CVA® when lowering costs represents thehollowing out of a brand.23
During a hollowing-out process, because CVA® depends on theperceptions of customers, there may be a time lag between the lower-ing of costs and the lowering of perceived value. There is inertia inperceptions—customers may be forgiving at the first signs of loweredproduct or service value.
An example of how easy it is for managers to begin the hollowingout of a brand: Typically the author travels to China two or threetimes a year with a major US airline. In the past, they provided sand-wiches in the middle of the trip—the time in the air is 14 to 15 hoursso the sandwiches were welcome. Recently, the airline decided toeliminate the sandwiches, cutting back on their value to customers.Notice the price of a round-trip business class ticket is in the vicinityof $10,000; the cost of providing a sandwich perhaps a dollar or two.By cutting back on costs, they risk losing the entire fare because thereare other carriers flying the same route that are not cutting back onthe small comforts that make a trip bearable. Truly, the airline is fol-lowing a policy of “penny wise, pound foolish.”
When the author mentioned the loss of sandwiches to a flightattendant, she said, “Yes, they are just getting very chintzy—and I amtired of reporting the negative passenger reactions. The managersdon’t understand.” Perhaps it would be helpful if the cost-cutterswere asked to experience a 15-hour flight sometime and learn howthe world looks from a passenger’s point of view.
Incidentally, whenever the author sees one of this airline’s expen-sive print ads, he immediately thinks, “How many sandwiches is thatad worth?” Glossy advertising does not offset perceived product orservice deficiencies—as eventually the top managers of this airlinemight learn. In fact, glossy advertising makes customers more sensi-tive to perceived value deficiencies.
One can see hollowing out actions all the time and everywhere.When a local bank promises wonderful service and a customer doesnot receive that level of service, perceived value falls even faster thanany cost savings. When a chemical produces lags in their delivery,perceived value may decrease more than any shipping costs saved.
CHAPTER 1 • MARKETING AND FINANCIAL PERFORMANCE 15

The time lag between when a cost is cut and when customervalue falls can tempt a senior manager to cut costs because they canappear to be successful with a cost-cutting program as long ascustomers have not yet noticed the decline in customer value. Theirsuccessor will discover later that the cost decreases have eroded thecustomer value and brand reputation of the organization, compromis-ing the brand’s power to generate revenue, profits, and cash flow,sometimes irretrievably.24
All cost reduction programs should be calibrated against theimpact on customer value as perceived by the customer—value engi-neering from the customer’s point of view. Unfortunately, manyorganizations are cost-oriented because they do not know the per-ceived value associated with their product or service and, therefore,are unable to discover the impact of cost changes on value as per-ceived by their customers.
An infamous example of failing to consider CVA® is the Schlitzbeer story. In the 1970’s, Schlitz was the number two brewer in theUS. Concerned with their stock price, top management cut costs byusing less expensive hops and reducing the time to age the beer. Inthe short run, profits increased and so did the stock price, but thencustomers started to realize that the Schlitz taste had deterioratedand they stopped buying the beer. Schlitz was never able to climbback to their number two position. It was a classic case of deliberatelydecreasing CVA® for short-term gain and consequently hollowing outa once strong brand.25
Price-Cutting
Organizations focused on costs often seem to focus on price-cutting strategies. As a result, they risk training their customers to beconcerned about price to the exclusion of value and often incite pricewars. The airline, telecommunications, and automotive industriesinclude competitors that seem to have adopted this approach.26
There is usually only one winner of a price war: the customer. Ofthe companies involved in the price war, the lowest-cost producermay do the best; but their financial results may or may not be attrac-tive. As demonstrated in Chapter 5, as prices are lowered, unit vol-ume must increase substantially simply to maintain contribution.
16 VALUE ABOVE COST

Meanwhile, in such an industry, many customers become price-shoppers instead of value-shoppers. That simply intensifies thepressure to lower prices and accelerates the vicious spiral of pricecuts. Price wars not only erode profits, but also train customers toexpect the same prices and to assume that all products and servicesperform the same—even if that is not true.
Appropriate Costs
A preoccupation chiefly with costs can keep one from achievingan optimal strategy for all the reasons above. But the situation is evenworse. As discussed in Chapter 5, many organizations do not evenknow their appropriate costs and, instead, use some form of averagefull-costing, which compounds the errors associated with a costorientation.
Value OrientationSome time ago the author listened to an economist, a colleague,
discuss his research concerning luxury products. At one point, hesaid, “You will not believe this, but in the luxury product industry,prices do not follow costs.” In that one sentence, he captured the keydifference between economics and marketing—one of point of view,not theory.
Economics and marketing are both consistent in concept. How-ever, an implicit assumption in economics is the movement of mar-kets toward equilibrium as prices decline and profit margins acrossindustries approach some equivalent levels. That equilibrium, in fact,would be achieved in open markets with free flows of information,resources, and products and services.
However, marketers try to interrupt the forces driving markets toequilibrium through innovation, continual redesign, and communica-tions—a focus on customer value. While economists might declarethat prices should follow costs if a market reaches equilibrium, mar-keters would say that their job is to keep a market from reaching thatequilibrium by continually adding value and communicating thosevalue increases to the customer.
CHAPTER 1 • MARKETING AND FINANCIAL PERFORMANCE 17

All marketers try to keep prices from following costs. The mar-keting task is to break away from the pack of commodity products andservices and distinguish their product or service for their target cus-tomers. The CVA® for differentiated products or services will gener-ally be high, while the CVA® for commodity products and serviceswill generally be low (Exhibit 1.9).
18 VALUE ABOVE COST
Variable Delivered Cost Per Unit
0
CVA®
CVA®
Perceived ValuePer Unit
Variable Delivered Cost Per Unit
0
Perceived ValuePer Unit
Commodity Product or Service
Differentiated Product or Service
Reprinted with permission from “Pricing, Perceived Value, and Communications,” Donald E.Sexton, New York, NY, 2008.
Exhibit 1.9 Differentiated products and services versus commodityproducts and services
However, a value orientation that translates as value at any costshould not be the objective. Many books on customer satisfaction andcustomer loyalty often employ the phrase, “Delight your customers.”Yes, one wants to delight customers, but one needs to make a profitwhile doing so. One should not try to increase continually perceivedvalue without regard to the increases in costs associated with thosevalue changes. At some point the costs of delighting customers maybecome greater than the value that they are willing to pay for.
There was an industrial supply distributor that held a muchhigher percentage of parts in their catalog in inventory than did theircompetitors. Their customers were delighted with the higher chanceof finding the parts they needed at this distributor. They were lessdelighted when the distributor went out of business due to its highinventory costs.

Costs and perceived customer value must be monitored, meas-ured, and managed together.
CVA® OrientationA CVA® orientation is about balancing perceived customer value
and costs. Because CVA® is the difference between perceived valueper unit and cost per unit, it rewards those organizations that canmeasure, monitor, and manage both customer value and costs.
How many people in the typical organization measure, monitor,and manage costs? Usually a lot of people. How many people in thetypical organization measure, monitor, and manage customer value?All too frequently, very few.
How many people in the typical organization measure,monitor, and manage customer value?
There are some organizations that are proficient at evaluatingcustomer value, and managers from many of those organizations haveprovided sidebars for this book. Often, however, when the authoraddresses audiences on the topic of marketing accountability and askshow many people know the perceived value for their products orservices, very few raise their hands. A follow-up question concernshow many of the attendees know about some of the techniques formeasuring perceived value—and again very few raise their hands.The CVA® orientation forces managers to look at customer value andcosts and then rewards them for their efforts with strategies that aremore effective in achieving desired financial goals. Gordon Bethunedramatically raised the performance of Continental Airlines byexamining the implications of all decisions on both customer valueand cost. For example, before the Bethune takeover, pilots weregiven bonuses for using less fuel—which they accomplished by goingmore slowly resulting in missed connections for Continental passen-gers. The pilot incentives constituted a classic example of single-minded thinking, lowering costs without regard to the impact onCVA®—an attitude that Bethune completely changed with dramaticresults.27
CHAPTER 1 • MARKETING AND FINANCIAL PERFORMANCE 19
20 VALUE ABOVE COST
American Association of Advertising Agencies: The Role of Marketing
Marketing is a dynamic and foundational component of all com-merce. Marketing resides at the intersection of the seller’s eco-nomic interests and the buyer’s behavioral values. When done well,marketing can and will inform, inspire, and motivate consumersinto action.
Over the course of the past thirty years, there are countless exam-ples of marketing strategies and advertising tactics that have dra-matically changed the fortunes of companies, product categories,and individual brands:
• Graphics and design elements define many categories andbrands—think Chanel (perfume category), Method (cleaningproducts), or Absolut (vodka).
• Pricing strategy has become a communications vehicle thatestablishes an audience profile and value framework that canrange from prestige and luxury (Hermès, Rolls-Royce, Gucci,Haagen-Dazs) to everyday affordable (Wal-Mart, Costco,Ikea, Southwest Airlines).
• Business model innovations are almost always predicated oninsightful marketing (eBay, Nintendo, TiVo, Google)
• Advertising initiatives have introduced revolutionary prod-ucts (Swiffer, Palm’s PDA), changed pop culture (Apple’siPod), altered societal norms (Viagra—Bob Dole, FriendsDon’t Let Friends Drive Drunk—Nat’l Highway TrafficSafety), rejuvenated tired categories (Got Milk—CaliforniaMilk Processors Board), and won presidential elections(George H.W. Bush’s Willie Horton release from prison ad in1988).
• Iconic Ad campaigns now define a significant number of For-tune 500 company brands. To name just a few: Just Do It(Nike), Priceless (MasterCard), You’re in Good Hands (All-state), or When it Absolutely, Positively has to be thereovernight (FedEx).

Strategic ThemesThe power of the CVA® concept can be seen in a comprehensive
industry study conducted by William Hall. He studied 64 companiesin eight industries, four business-to-business industries and four con-sumer industries.28 The industries Hall studied included steel, tireand rubber, heavy-duty trucks, construction and materials handlingequipment, automotive, major home appliances, beer, and cigarettes.All were characterized by single-digit annual growth and intensecompetition.
In each industry, Hall identified two companies that were leadersin regard to annual revenue growth rate and return on equity, notonly in their respective industries, but among all US companies. Inhis seminal article, he described the strategies of these winning com-panies with what the author calls the Strategic Themes Matrix (seeExhibit 1.10).
In Hall’s formulation of the matrix, the horizontal axis is “relativedelivered cost.” Relative delivered costs are all costs involved in plac-ing the product or service in the hands of the customer: operationscosts, but also costs such as distribution costs and marketing costs.The vertical axis of Hall’s matrix is “relative product/service differ-entiation” and refers to product or service performance relative tocompetitors.
CHAPTER 1 • MARKETING AND FINANCIAL PERFORMANCE 21
Marketing is the seller’s investment in their brand, which definesthe distinctive public face of a product or service. For sellers thequestion is not if they should market their brands. The operativequestions are how, where, when and how much should be investedin order to optimize a brand through marketing.
Don Sexton’s seminal work in the areas of marketing accountabil-ity, pricing, metrics scorecards and now “Customer Value Added”has advanced the dialogue that sellers need to consider in order tooptimize their commercial interests.
—Tom Finneran, EVP, American Association of AdvertisingAgenciesReprinted with permission of Tom Finneran

Exhibit 1.10 Strategic Themes Matrix
In the reformulation of Hall’s matrix for this book, the definitionsof the horizontal and vertical axes have been refined.
The horizontal axis is defined here as “variable delivered cost perunit”—all the incremental costs involved in bringing a unit of theproduct or service to the customer. That definition is fairly close tothat of Hall.
The vertical axis is defined here as “perceived value per unit.”Recall that the perceived value per unit is the maximum that a cus-tomer is willing to pay for a unit of a product or service. That defini-tion varies from Hall’s definition with the addition of the wordperceived. Even if a product or service is differentiated from its com-petitor’s product or service, that differentiation must be perceived bythe customer to have an impact on their purchases.
The most powerful strategic position on the Strategic ThemesMatrix is the upper right position—lowest cost per unit and highestperceived value per unit. However, among the 16 leading companiesthat Hall identified, only 2 companies occupied that position at thetime of his study: Caterpillar in earthmoving equipment and PhilipMorris in cigarettes. Today, companies in the upper right positionarguably include companies such as Southwest Airlines and Trader
22 VALUE ABOVE COST
MEDIUM
MEDIUM
HIGH
LOWHIGH
LOW
PE
RC
EIV
ED
VA
LU
E P
ER
UN
IT
INCREMENTAL DELIVERED COST PER UNITSource: Adapted from William K. Hall, “Survival Strategies in a Hostile Environment,”Harvard Business Review , September 1980, pp. 74-85.
Joe’s.29 There are two other winning positions on the matrix—thehighest perceived value per unit combined with the medium (oracceptable) cost per unit and the medium (or acceptable) perceivedvalue per unit combined with the lowest cost per unit. In Hall’s study,in heavy-duty trucks those positions were occupied, respectively, byPaccar and Ford.
A company would not want to be in the four cells on the lowerleft-hand side of the matrix—low or medium perceived value coupledwith high or medium costs, which Michael Porter of Harvard Busi-ness School has memorably termed stuck in the middle. Stuck-in-the-middle companies lose their performance-minded customers to theirhigher perceived value competitors and their economy-minded cus-tomers to their lower cost competitors.
The upper left position is filled by elite companies with highvalue products such as Hermès, Chanel, or Carlos Falchi.30 The lowerright position is filled by companies producing cheap but shoddyproducts or services. A company can succeed in either of those twopositions, but they require very special types of managerial thinking.Elite companies typically focus on market niches, while shoddy prod-uct companies do not expect much repeat business.
The Strategic Themes Matrix clearly shows the two main factorsdriving business success: perceived customer value and cost. Thesesame themes have been identified and discussed by numerous highlyregarded management thinkers such as Michael Porter, PeterDrucker, Al Reiss, and Frederick Reicheld. When such diversethinkers agree, that is a signal that the idea is significant.
The importance of perceived customer value and cost in deter-mining financial performance has also been validated by severaldiverse empirical studies over many years. (See Exhibit 1.6.) Differ-ent researchers such as Jim Gregory of CoreBrand, Stuart Agres ofYoung and Rubicam, and Robert Buzzell and Brad Gale of the PIMSProject, and professors including David Aaker, Robert Jacobson,Dominique Hanssens, and Natalie Mizik have all arrived at similarconclusions using different data bases—perceived value is clearlylinked to measures of financial return.31
CHAPTER 1 • MARKETING AND FINANCIAL PERFORMANCE 23

When an idea is supported both by well-known managementgurus and by highly respected researchers, the idea is not only signif-icant, but one that works and has been proved in practice.
24 VALUE ABOVE COST
Carlos Falchi: The Real Meaning of Luxury
LUXURY—EXPENSIVE…DOES NOT SYSTEMATICALLYMEAN QUALITY.
INEXPENSIVE DOES NOT AUTOMATICALLY MEANCHEAP.
A PRODUCT CARRIED BY A CELEBRITY DOES NOTMAKE IT LUXURY.
Real luxury and value are beyond celebrities photographed wear-ing them and all the brand advertising.
The value and luxury that a customer receives when making herpurchase is in the caring, thoughtfulness, time spent, and topquality materials assembled to achieve a product of distinction. Aproduct that I can offer with pride.
When I see a customer who is still carrying one of my handbagsafter 30 years and wearing it with the same pleasure she had theday she bought it, I am deeply touched she has had so many yearsof pleasure from something made with care. Thirty years of wearand still worn with pride. That is satisfying.
Quality is a lasting value.
Some countries show their appreciation of this principle by makingpeople who excel in their trade a “National treasure.” Be it the bestrice grower, best scientist, best artist, best photographer or besttailor. The title is given for constant Zen dedication in achievingthe best.
When all these ingredients come together everyone is satisfied.
Thank you,
—Carlos Falchi, Designer, Design and Development Lab, LLCReprinted with permission

Design and CommunicationTo succeed, an organization needs to provide customer value at
acceptable costs and communicate that value to target customers.Design and communications must both be focused on the customer.As Tony Davidson, president of the D&AD Global Awards, pointedout, “In the end, it’s not just about whether something [an advertise-ment] is a good idea. It’s about whether it’s a good idea and relevant.”32
Customer value comes from innovations in design—the newproducts and services or improvements in products, services, andprocesses that a company generates over time. At the heart of commu-nications is branding—the reputation of the company in the minds ofits target customers. Without innovation, branding withers. But with-out branding, the company is not rewarded for its innovations.
For example, many years ago Xerox developed many innovationsin computing—but never truly received credit for their achievementsin terms of their brand. On the other hand, Levi’s has been a verypowerful brand, but failures to keep pace with innovations in stylingeroded the brand’s value.33
In the long run, both innovation and branding are required forsuccess, as shown in the sidebar, a 30-year tale of two companies:Harley-Davidson and Norton Villiers Triumph.34
CHAPTER 1 • MARKETING AND FINANCIAL PERFORMANCE 25
Winners and Losers: The US Motorcycle Industry
The 1970s
In the 1970s, the motorcycle market in the United States wasunder fierce attack from the Japanese motorcycle manufacturers.At one time, Harley-Davidson held nearly 100 percent of the USmotorcycle market, but by 1981, the Japanese companies hadsecured 94 percent of that market (Table 1.1).

26 VALUE ABOVE COST
Table 1.1 United States Motorcycle Shares
Harley
Year Honda Yamaha Kawasaki Suzuki Davidson BMW NVT
1974 TOTAL 43.0% 20.0% 13.0% 11.0% 6.0% .9% 1.4%
1981 TOTAL 38.0 25.0 17.0 14.0 5.0 .4 .2
<750 CC 41.0 27.0 18.0 14.0 0 .2 N/A
>750 CC 31.0 21.0 16.0 14.0 17.0 .8 N/A
1991 TOTAL 26.0 9.5 14.5 17.0 31.0 2.0 0
2001 TOTAL 26.6 20.0 11.2 11.1 24.0 1.8 0
2005 TOTAL 28.6 17.4 9.6 12.5 25.6 1.3 .8
Source: “Top Motorcycle Makers.” Dealer News, Market Share Reporter, Thomson Gale,various years.
The Japanese motorcycle manufacturers used a classic interna-tional strategy to defeat Harley: They obtained a beachhead in themarket with innovative products—small motorcycles—then builttheir brand and introduced larger and larger bikes.
Compared to Harley, the Japanese manufacturers Honda,Kawasaki, Yamaha, and Suzuki were more efficient producers,built more reliable motorcycles, and spent more on customeradvertising. When AMF merged with Harley, they increased out-put three-fold. The speed of the expansion had its consequences.More than half the Harley’s produced were missing parts, and theothers leaked oil. Bikers said you needed to buy two Harley’s, oneto provided spare parts to keep the other on the road.
The 1980s
Harley-Davidson and Norton Villiers Triumph (NVT) both lostshare to the Japanese companies during the 1970s. In the 1980s,NVT eventually went out of business, but Harley-Davidson usedinnovation and branding to not only survive, but also regain itsposition as a force in the motorcycle industry.
At the beginning of the 1980s, both Harley-Davidson and NVT,arguably, were stuck in the middle in the Strategic Themes Matrix.

CHAPTER 1 • MARKETING AND FINANCIAL PERFORMANCE 27
In the middle of the top row was BMW, which was widely regardedas a high-performance, reliable motorcycle and, seemingly, con-tent to stay in that position. In the right-most column were the fourJapanese producers, led by Honda, all driving toward the upper-right hand high value/low cost position.
Meanwhile, the situation was getting worse for both Harley andNVT. Their bikes had poor reputations for reliability, and theywere behind in product design. Both Harley-Davidson and NVThad to take action if they were to survive. In 1981, 13 Harley man-agers purchased the company from AMF and proceeded todecrease their costs by cutting their workforce by 40 percent,decreasing salaries by 9 percent, and then freezing hiring andsalaries. They adopted cost-lowering methods such as just-in-timeinventory, which they learned from visits to the production lines oftheir Japanese competitors. They also improved their quality con-trol.
These changes in operations required time. Their chief designer,William “Willie G.” Davidson, provided that time. He designednew Harley bikes such as the Super Glide that did not require sub-stantial time for retooling. Davidson’s designs permitted Harley toincrease their perceived value per unit in the short-run, while theywaited for their longer-term efforts to pay off. In 1984, for exam-ple, they introduced a new engine, the Evolution, which was verywell-received.
The Harley brand was in danger of being hollowed out by the prioractions of AMF. While Harley had improved their product, theirbrand had to be revived by communicating the product improve-ments to their customers.
Once they had restored the performance of their product, Harleyused print ads to communicate with their target customers, includ-ing a memorable print ad showing a group of tough-looking bikerswith the headline, “Would you sell an unreliable motorcycle tothese guys?”
Another key part of the revival of their brand was the HarleyOwners Group (HOG). Started by Harley in 1983, today it is the

28 VALUE ABOVE COST
largest motorcycle club in the world—and an excellent example ofhow to build relationships with your customers.
Increasing CVA® by simultaneously increasing perceived customervalue per unit and decreasing cost per unit worked for Harley. In1991, they had more than a 30 percent share of the total US mar-ket for motorcycles and nearly 50 percent of the cruiser (large)motorcycle market.
Meanwhile, during the 1980s, NVT was struggling and continuingtheir retreat strategy of the 1970s, dropping models from theirline. They had labor problems. Their motorcycles continued tohave product defects. Their policy with regard to warranty claimscould be described as grudging. Spare parts were difficult to find.They lost orders destined for police departments in the UK.
Their brand was spiraling down the failure route, and their cashflow problems made it difficult for them to innovate. In efforts tolower costs, they cut models from their line until, finally, theycould no longer cover their overhead. In 1983, NVT closed theirMeriden factory and the company was liquidated.
The 1990s and Beyond
Honda eventually reached the upper right-hand corner—the highvalue/low cost position on the Strategic Themes Matrix—andremains a formidable competitor to Harley-Davidson. Harleyoccupies a position on the high perceived value top row. They con-tinuously reinvigorate their brand with a stream of new engines,new transmissions, and new bikes (10 new models launched in2005-6). They have also focused their efforts on lucrative new seg-ments among older bikers. In 1987, the median age of a Harleybuyer was 35; in 2006, it was 47. More than 20 percent of theirsales are outside the US, in markets such as China and Japan,where Harley has the leading share in heavyweight motorcycles.
Going forward, Harley still faces challenging decisions concernedwith younger riders. The competitive environment does not getquieter.

CVA® and Economic DevelopmentThis book is about how CVA® can be used by organizations to
improve their financial performance. CVA® also has implications forhow economies are managed to increase Gross Domestic Product(GDP).
There continues to be substantial discussion regarding the eco-nomic futures of China and India. To the extent managers in eithercountry are successful with their marketing and branding efforts todevelop specialty products and services, the GDP of their countrywill increase far beyond what might be expected were they producingcommodity-like products or services.36
CHAPTER 1 • MARKETING AND FINANCIAL PERFORMANCE 29
Lessons
In the 1970s, both Harley-Davidson and Norton Villiers Triumphwere multi-domestic companies, succeeding in their home mar-kets and selected export markets. They did not seek competitors,but the competitors—the Japanese motorcycle companies—cameto them. Both Harley and NVT were slow to react, and both lostshare in the US market in the 1970s. However Harley-Davidsonwas able to use innovation and branding to recover. NVT wasunable to innovate and reverse their brand failure route.
Harley-Davidson’s recovery is even more dramatic if one recallsthe backdrop. In the 1970s and 1980s, many managers of US com-panies were complaining about the “unfair” practices of Japanesecompanies. One Harley executive commented, “First, we thoughtit was the Japanese pricing, then we thought it was the Japaneseculture…. Finally, we realized the problem was us, not them.”
Although NVT disappeared, Triumph motorcycles live on. A new,privately-owned company—Triumph Motorcycles Limited—wasstarted in the mid-1980s. Six brand new Triumph motorcycleswere launched in 1990, followed by more innovations and moremodels. One might say that innovation and branding Triumphonce again.35
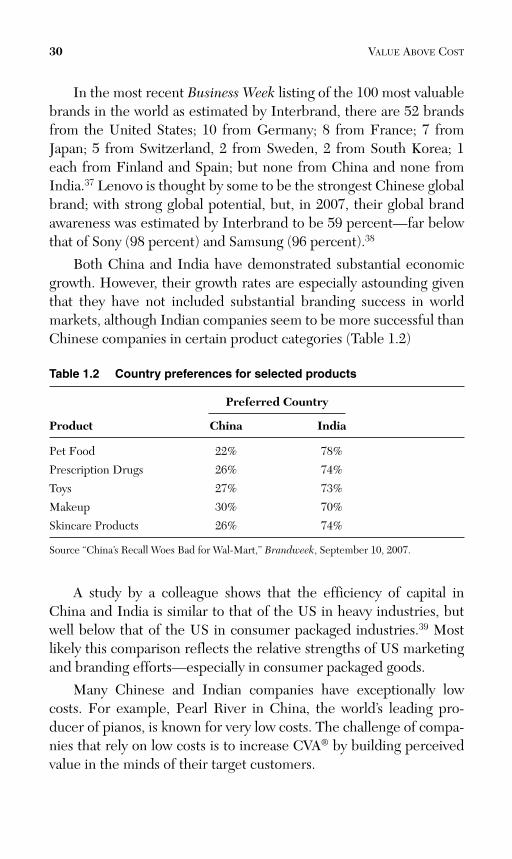
In the most recent Business Week listing of the 100 most valuablebrands in the world as estimated by Interbrand, there are 52 brandsfrom the United States; 10 from Germany; 8 from France; 7 fromJapan; 5 from Switzerland, 2 from Sweden, 2 from South Korea; 1each from Finland and Spain; but none from China and none fromIndia.37 Lenovo is thought by some to be the strongest Chinese globalbrand; with strong global potential, but, in 2007, their global brandawareness was estimated by Interbrand to be 59 percent—far belowthat of Sony (98 percent) and Samsung (96 percent).38
Both China and India have demonstrated substantial economicgrowth. However, their growth rates are especially astounding giventhat they have not included substantial branding success in worldmarkets, although Indian companies seem to be more successful thanChinese companies in certain product categories (Table 1.2)
Table 1.2 Country preferences for selected products
Preferred Country
Product China India
Pet Food 22% 78%
Prescription Drugs 26% 74%
Toys 27% 73%
Makeup 30% 70%
Skincare Products 26% 74%
Source “China’s Recall Woes Bad for Wal-Mart,” Brandweek, September 10, 2007.
A study by a colleague shows that the efficiency of capital inChina and India is similar to that of the US in heavy industries, butwell below that of the US in consumer packaged industries.39 Mostlikely this comparison reflects the relative strengths of US marketingand branding efforts—especially in consumer packaged goods.
Many Chinese and Indian companies have exceptionally lowcosts. For example, Pearl River in China, the world’s leading pro-ducer of pianos, is known for very low costs. The challenge of compa-nies that rely on low costs is to increase CVA® by building perceivedvalue in the minds of their target customers.
30 VALUE ABOVE COST

Because of their low cost positions, price has often been a majorweapon of many Chinese and Indian companies for acquiring cus-tomers. For example, from 2000 to 2003, local Chinese cell phonemanufacturers such as Bird, Amoi, and Panda moved from a 0 per-cent market share to nearly 50 percent by cutting prices againstNokia, Motorola, and other international brands. Tata has producedan extraordinarily low-priced automobile. Unfortunately, low pricestrategies often foment price wars. Preoccupation with low prices canbe a major distraction to building customer perceived value.
While they are in position to build their brands, Chinese andIndian companies especially need to be wary of the temptation toenter foreign markets by offering low prices. While such an approachmay provide a quick market entry, there are long-term conse-quences—both to their own brands and to their country’s brands.40 Ifa company starts at a low price point, then it can take much longer tobuild a brand that connotes value to customers. Today Samsung andHyundai are valuable brands; but when each entered the UnitedStates, they exploited low prices. It took many years of brand-building for Samsung to raise their customer perceived values to theirdeserved position and Hyundai, one of the top three on J.D. Powersand Associates’ automobile overall product quality list, continuestheir efforts to raise their perceived value to their actual value.41
Akio Morita, the founder of Sony, used to tell this story: One ofthe first very successful products of Sony was the transistor radio.Supposedly a department store in New York City told Mr. Morita thatthey wanted to order thousands for the holiday sales season. His replywas, “No.”
Akio Morita knew that at that point in time the reputation of the“Japan Brand” was low. If something broke, at that time people in theUnited States often said that, “It must have been made in Japan.”Morita knew that if he tried to produce the thousands of units thestore wanted, the Sony quality control would falter—and the prod-ucts would not represent the brand he was trying to build. So he saidno to the large order the department store wanted, but agreed to fur-nish them the number of transistor radios he felt he could produce ata quality level of which he could be proud. How important was hisdecision? It was the foundation for the Sony brand in the US. Actionstoday determine the brand tomorrow.
CHAPTER 1 • MARKETING AND FINANCIAL PERFORMANCE 31

If Chinese and Indian companies succeed with their marketingefforts to increase their perceived value, then the GDPs of bothChina and India will increase substantially—perhaps by 30 percent—even without increases in production capacity! The same observationcan be made of most fast-developing economies.
ConclusionsMarketing is managing customer perceived value. In turn, cus-
tomer perceived value is a key component of CVA®. Perceived valueper unit and cost per unit—CVA®—determine the net value anorganization provides society according to the perceptions of cus-tomers. CVA® has a direct relationship to the contribution earned byan organization, which in turn affects profit, cash flow, shareholdervalue, and share price.
Managing CVA® provides forward control over the financial per-formance of an organization as well as the financial performance of aneconomy.
The next chapter explains exactly how CVA® determines financialperformance.
Visit CVA® at www.cva.us.com.
32 VALUE ABOVE COST

INDEXAAaker, David, 23accessibility of information, 105achieving results, steps to,
295-296capability, 301-306effort, 299environment, 307-309rewards, 300-301task clarity, 297-298usage of marketing ROI
information, 309action (buyer behavior stage), 102actual value
defined, 90marketing ratios and, 91-92
Actual Value Chart, 167Adams, Dean, 9Adams, Roger, 96Agres, Stuart, 23airline industry example
Competitive Advantage Analysis,166-167
Design Analysis, 169-170Perceived Value Analysis,
175-176
329
Segment Identification Analysis,158-159
Segment Selection Analysis, 173Altoids, 105Ambler, Tim, 252American Management
Association example (brandingintangibles), 254-255
appropriate costs, not realizing, 17
assembly of strategy, defined, 155associations (in branding), 96, 233attractiveness (Segment Selection
Analysis), defined, 171attributes (in branding), 95, 233automobile insurance example
(competitive life cycle), 202Avarde, Susan, 95average fixed costs per unit, 129average full costs, 127average total cost per unit, 135Avsar, Serdar, 284
Bbalancing perceived customer
value and costs. See CVA®
barriers to marketing ROImeasurement, 307-309

330 INDEX
Bayer example (micro-targeting),219
Beasley, Boyd, 14beer industry example (marketing
strategy), 156behavior, steps to achieving
results, 295-296capability, 301-306effort, 299environment, 307-309rewards, 300-301task clarity, 297-298usage of marketing ROI
information, 309benefit advantages, 160, 223benefits for customers,
communication of, 105-109Bentivegna, Michael P., 232Berman, Jeff, 104Bethune, Gordon, 19Boeing 777 example (managing
perceived value), 110-112Bombay Sapphire example (brand
management), 177-179Bordley, Robert F., 268brand. See also branding
brand awareness, 189components of, 95-96, 233, 286consistency in, 106corporate brand management,
181-185hollowing out, 14-16, 189-190perceived value and, 93-97,
107, 235financial services example,
94-95Harrah’s Entertainment
example, 97-98MySpace example, 102-104
repositioning, 235-236value of. See brand equity
brand affinity, TIAA-CREFexample, 211-212
brand architecture, CVA® and,237-241
brand awareness, 189measuring marketing ROI, 277overemphasis on, 234
brand building, Nortel example, 190
brand equityin China and India, 29-32defined, 78-81in distribution, MetLife
example, 271-273estimating, 81-84
alternative methods of, 87-88
Tetley Tea example, 84Unilever example, 37, 39
brand extensions, CVA® and,241-242
brand formation (buyer behaviorstage), 101
brand image, effect of, 268brand investment example,
208-210brand management, 176-177
Bombay Sapphire example, 177-179
in online environment, Sonyexample, 306-307
perceived value and, 187-188Pfizer example, 231-232
brand measures (marketingaccountability scorecard), 286
brand positioning, overestimating, 235

INDEX 331
brand strength, 3M example, 8branding. See also brand
co-brandingCVA® and, 243-245NASCAR example, 245-246
CVA® and, 235-236defined, 233-234Dow Corning example, 75-76innovation and, 25intangibles, American
Management Associationexample, 254-255
mistakes in, 234-235motorcycle industry example,
25-29Vodafone/Omnitel example,
34-35breakeven sales level, 139Brooks, Paul, 71Burger King example (brand
management), 176business, determining value of,
7-8business objectives, defined, 155buyer behavior
stages of, 98-102types of, 99
Buzzell, Robert, 23
Ccamera industry example
(competitive life cycle), 204-205Capabilities Chart, 161-164capability
defined, 295explained, 301-306
case studiesconjoint analysis, 117-119corporate brands, 239-241
CVA® and life time customervalue, 61-63
estimating demand curves, 123evaluating communications
spending, 258-259pricing strategy, 140-144Sexton’s Contribution Law,
54-56value-in-use calculation, 114
cash flow, contribution and, 57-58Charles Schwab example
(measuring perceived value), 120
China, brand value in, 29-32Cisco example (financial impact
of marketing management), 294Clancy, Kevin, 211Clark, Kevin, 279clarity. See task clarityco-branding
CVA® and, 243-245NASCAR example, 245-246
Coca-Cola examplemicro-targeting, 219standardization versus
localization, 228commodity products
CVA® for, 18defined, 262
communication of benefits, 105-109
communications, 249CVA® and, 255-257determining spending,
limitations on methods, 250-253
developing, 173-175gaps in, 175pricing strategies and, 262return on spending, 257-259

332 INDEX
community, impact of, 236-237company growth, relationship
with loyalty, 8compensatory rules (brand
consideration), 102competition
deviating from, 177ignoring, 225
competitive advantage, 160, 223Competitive Advantage Analysis,
159-167competitive life cycles, 67-68
communications during, 255-257Competitive Advantage Analysis
in, 164-165CVA® life cycle during, 73-75CVA® management in, 187-188
Competitive Turbulencestage, 199-201
Decline stage, 203-204Introduction stage, 192-195Maturity stage, 202Rapid Growth stage,
196-198financial performance over,
76-78margin life cycle during, 69perceived value life cycle during,
70-71prioritizing financial objectives
in, 185-187sales life cycle during, 69stages of, 68unit cost life cycle during, 69
competitive paritycommunications model, 250-251
Competitive Turbulence stage(competitive life cycle), 68communications during, 256CVA® management in, 199-201Mountain Dew example, 201
conjoint analysis, measuringperceived value, 115-119
Conrado, Eduardo, 154consistency in branding, 106constrained choice methods
(measuring perceived value), 117
contributioncash flow and, 57-58components of, 36defined, 42-44evaluating based on costs, 147graphing, 138market segmentation and, 221micro-targeting and, 218profit and, 57revenue and contribution
example, 44-45Sexton’s Contribution Law,
50-56shareholder value and, 58shifting the demand curve, 45-47
contribution format for incomestatements, 131-132
contribution per unit, 135contribution rate, 135conviction (buyer behavior
stage), 102cooperation among departments,
importance of, 305core competency, 160corporate brand management,
181-185corporate brands, CVA® and,
237-241corporation. See businesscost evaluation (Zappos example),
132-134cost life cycles. See unit cost
life cycles

INDEX 333
cost orientation, problems with,13-14appropriate costs, not
realizing, 17hollowing-out (of brand), 14-16price-cutting strategies, 16
cost-plus pricing strategy, 260-261costs. See also pricing strategy
average full costs, 127balancing with customer value,
9-10. See also CVA®
evaluating contribution, 147fixed costs
breakeven sales level and, 139
defined, 129direct fixed costs, 144-146indirect fixed costs, 145role of, 139
identifying for CVA®, 134-136income statements
in contribution format, 131-132
in custodial format, 127-129perceived customer value versus,
12-13relative delivered costs, 21types of, 129-130variable costs, 129, 138
costs of goods sold, defined, 128cross-functional teams in
marketing ROI, 305cumulative retention rate, 59custodial format for income
statements, 127-129customer expectations, meeting,
167-168customer measures (marketing
ROI), effectiveness of, 280-281customer preferences in value
exchange, 283-284
customer relationships (Zapposexample), 132-134
customer satisfaction method(estimating brand equity), 87
customer value. See alsoperceived customer valuebalancing with costs, 9-10Sony example, 306-307value orientation, 17-18
Customer Value Added. See CVA®
customer value research,estimating demand curves, 122
customerscommunication of benefits for,
105-109ignoring, 224life time customer value, 58-63perceived value specific to, 93
CVA® (Customer Value Added)brand architecture and, 237-241brand extensions and, 241-242branding and, 235-236co-branding and, 243-245cost identification for, 134-136decreasing while lowering costs,
14-16defined, 3-4, 10-13differentiated products versus
commodity products, 18economic development and,
29-32financial performance and
contribution, 42-44contribution and cash flow,
57-58contribution and profit, 57contribution and
shareholder value, 58demand curves, 39-41life time customer value,
58-63

334 INDEX
overview, 33-34pricing strategy, 35-37revenue, 41-42revenue and contribution
example, 44-45Sexton’s Contribution Law,
50-56Sexton’s Revenue Law,
48-49shifting the demand curve,
45-47marketing programs and, 247
communications, 249-258distribution, 269-271MasterCard example,
248-249pricing strategies, 259-267
positioning evaluation, 226-232Strategic Themes Matrix, 21-24target market identification,
219-222CVA® life cycles
during competitive life cyclestages, 73-75
financial performance over, 76-78
CVA® managementin competitive life cycle, 187-188
Competitive Turbulencestage, 199-201
Decline stage, 203-204Introduction stage, 192-195Maturity stage, 202Rapid Growth stage,
196-198corporate brand management
and, 181-185dynamic programming
optimization method, 205-208
marketing strategybeer industry example, 156brand management in,
176-177communications
development, 173-175components of, 154-155customer expectations,
meeting, 167-168marketing tactics versus,
151-153positioning evaluation,
159-166, 223-233Sexton’s Law of Micro-
Targeting, 215-219target market identification,
156-158, 212-215, 219-222target market selection,
170-172CVA® orientation, benefits of, 19
DDawson, Marshall, 179decision-making unit, perceived
value and, 93Decline stage (competitive life
cycle), 68camera industry example,
204-205communications during, 256CVA® management in, 203-204
decreasing CVA® while loweringcosts, 14-16
demand curves, 39-41estimating, 121-124revenue and, 41-42shifting, 45-47
DePeau, Jamie, 212Design Analysis, 167-170

INDEX 335
design gapsairline industry example,
169-170defined, 168
deviating from competition, 177differentiated products, CVA®
for, 18direct customer response,
measuring perceived value, 115direct fixed costs
defined, 144shutdown sales level and, 146
discounted cash flow method(estimating brand equity), 88
discrete choice modeling,measuring perceived value, 116
Disney example (brandextensions), 241
distributionbrand value in (MetLife
example), 271-273CVA® and, 269-271
“Do-Learn-Feel” situations, 252Dodds, John R. F., 185Dove example (standardization
versus localization), 229Dow Corning example (two-brand
strategy), 75-76Drucker, Peter, 23, 152DuPont example (CVA® and
distribution), 270Dutch Auctions, defined, 40dynamic programming
optimization method, 205-208
Eeconomic development, CVA®
and, 29-32Edsel example (marketing
ratios), 92
effortdefined, 295explained, 299
Elliott, Gary, 81environment
defined, 295explained, 307-309
environmental changes, ignoring, 225
estimatingbrand equity, 81-84
alternative methods of, 87-88
Tetley Tea example, 84demand curves, 121-124
evaluatingalternatives (buyer behavior
stage), 101communications spending,
257-259contribution based on costs, 147positioning, 159-166, 223
with CVA®, 226-232grey markets, 232-233mistakes in, 224-226
evoked set (brand consideration), 101
expected valuedefined, 90marketing ratios and, 91-92
experience (buyer behaviorstage), 102
experimental design, estimatingdemand curves, 124
extensive problem-solving, 99
FFalchi, Carlos, 24fan support (NASCAR), 245-246Farrow, Frances, 12

336 INDEX
Faruolo, Edward A., 210financial impact of
marketing management (Cisco example), 294
financial objectives, prioritizing incompetitive life cycles, 185-187
financial performanceCVA® and
contribution, 42-44contribution and cash flow,
57-58contribution and profit, 57contribution and
shareholder value, 58demand curves, 39-41life time customer value,
58-63overview, 33-34pricing strategy, 35-37revenue, 41-42revenue and contribution
example, 44-45Sexton’s Contribution Law,
50-56Sexton’s Revenue Law,
48-49shifting the demand curve,
45-47optimizing wiith dynamic
programming, 205-208over competitive life cycles,
76-78financial result measures
(marketing ROI), effectivenessof, 282-283
financial services example (brandand perceived value), 94-95
Finneran, Tom, 21
fixed costsbreakeven sales level and, 139defined, 129direct fixed costs
defined, 144shutdown sales level
and, 146indirect fixed costs, 145role of, 44, 139
Flaherty, Lauren, 192full-cost pricing, 260Fuller, Amy, 249Fuson, Scott, 76
GGablinger’s Beer example
(marketing strategy), 156Gaebler, Chris, 307Gale, Brad, 23Gallagher, Stewart, 105Gartenberg, Michael, 198GEICO example (competitive life
cycle), 202Ghorpade, Shailendra, 273Giangola, Andrew, 72, 246global segments. See localizationgraphing contribution, 138Gregory, Jim, 23grey markets, 232-233gross margin, defined, 128gross margin rate, defined, 136growth, relationship with loyalty
(3M example), 8
Hhabitual decision-making, 99Hall, William, 21-22Hanssens, Dominique, 23

INDEX 337
Harley-Davidson example(branding), 25-29
Haro, Steve, 112Harrah’s Entertainment example
(brand and perceived value), 97-98
Heineken example(standardization versuslocalization), 230
hidden brands, defined, 238hierarchy of effects
communications model, 251-253historic cost method (estimating
brand equity), 87historical analysis (estimating
demand curves), 122hollowing out brands, 14-16,
189-190Honda example (standardization
versus localization), 230Hsieh, Tony, 134Hyundai example (marketing
ratios), 91
Iidentifiers (brand), 95, 233incentive per unit, defined, 36income statements
in contribution format, 131-132in custodial format, 127-129
incremental profit per unit,defined, 36
India, brand value in, 29-32indirect customer response,
measuring perceived value, 115indirect fixed costs, defined, 145inept set (brand consideration), 101inert set (brand consideration), 101
information seeking (buyerbehavior stage), 100
innovation, branding and, 25intangibles, branding (American
Management Associationexample), 254-255
Introduction stage (competitivelife cycle), 68communications during, 255CVA® management in, 192-195Pets.com example, 195-196
iPod, 104
J–KJacobson, Robert, 23judgment
estimating demand curves, 124measuring perceived value,
119-120
Kellogg’s, 105Kodak example (competitive life
cycle), 204
LL’Oreal example (standardization
versus localization), 227“Learn-Feel-Do” situations, 252life cycles
competitive life cycles, 67-68communications during,
255-257Competitive Advantage
Analysis in, 164-165CVA® life cycle during,
73-75CVA® management in,
187-188, 192-204financial performance over,
76-78

338 INDEX
margin life cycle during, 69perceived value life cycle
during, 70-71prioritizing financial
objectives in, 185-187sales life cycle during, 69stages of, 68unit cost life cycle during, 69
financial performanceoptimization over, 205-208
margin life cyclesduring competitive life cycle
stages, 69financial performance over,
76-78market life cycles
CVA® management in, 181-183
defined, 66product or service life cycles
CVA® management in, 181-183
defined, 66sales life cycles, levels of, 66-67
life time customer value, CVA®
and, 58-63limited problem-solving, 99localization, standardization
versus, 227-232grey markets, 232-233Pfizer example, 231-232
Loveman, Gary, 195loyalty, relationship to company
growth (3M example), 8luxury, value of, 24
Mmanaging
CVA®. See CVA® managementperceived value, 104-112
margin life cyclesduring competitive life cycle
stages, 69financial performance over,
76-78marginal cost, 116market life cycles
CVA® management in, 181-183defined, 66
Market Segment Chart, 157market segmentation, 212
with CVA®, 219-222defined, 39, 157mistakes in, 213-215perceived value and, 93Sexton’s Law of Micro-Targeting,
215-219market value method (estimating
brand equity), 87marketing
defined, 11-12effect on shareholder value
(Unum example), 4role of, 20-21
marketing accountability, 5-7,284-287, 290
marketing management, financialimpact of (Cisco example), 294
marketing programs, CVA®
and, 247communications, 249-258defined, 155distribution, 269-271MasterCard example, 248-249pricing strategies, 259-267
marketing ratios, 91-92marketing ROI
capability, role of, 301-306difficulty of estimating, 1-3effort, role of, 299environment, role of, 307-309

INDEX 339
lack of measurement of, 6measuring
common methods for, 276-278
customer measures,effectiveness of, 280-281
financial result measures,effectiveness of, 282-283
marketing accountabilityscorecard, 284-287, 290
preceived value measures,290-291
tactic measures,effectiveness of, 281-282
rewards, role of, 300-301task clarity, achieving, 297-298usage of information,
importance of, 309marketing strategy
beer industry example, 156brand management in, 176-177communications development,
173-175components of, 154-155customer expectations, meeting,
167-168marketing tactics versus,
151-153Motorola example, 153-154positioning evaluation,
159-166, 223with CVA®, 226-232grey markets, 232-233mistakes in, 224-226
target market identification, 156-158, 212
with CVA®, 219-222mistakes in, 213-215Sexton’s Law of Micro-
Targeting, 215-219target market selection, 170-172
marketing tactics, marketingstrategy versus, 151-153
Marlboro example (brandrepositioning), 236
MasterCard examplemarketing programs, 248-249standardization versus
localization, 229Maturity stage (competitive life
cycle), 68automobile insurance
example, 202communications during, 256CVA® management in, 202
Maxim example (competitive lifecycle), 198-199
McDonald’s example (MySpacecampaigns), 103
measuring. See also estimatingmarketing ROI
common methods for, 276-278
customer measures,effectiveness of, 280-281
financial result measures,effectiveness of, 282-283
marketing accountabilityscorecard, 284-287, 290
perceived value measures,290-291
tactic measures,effectiveness of, 281-282
perceived value, 112-120Charles Schwab
example, 120motel room case study,
117-119MetLife example (brand value in
distribution), 271-273micro-targeting, 215-219Miller Lite example, 106, 156

340 INDEX
Mizik, Natalie, 23mobile phone industry example
(branding), 34-35model life cycles, defined, 67Momentum Effect
(MySpace), 103Morita, Akio, 31motel room case study (conjoint
analysis), 117-119motivation. See rewardsmotorcycle industry example
(branding), 25-29Motorola example (marketing
strategy), 153-154Mountain Dew example
(competitive life cycle), 201MTV example (standardization
versus localization), 228multi-attribute models (brand
consideration), 102multiple markets, pricing
strategies in, 265-267multiple of cash flow method
(estimating brand equity), 88MySpace example (word-of-
mouth marketing), 102-104
NNASCAR
fans’ role in, 71sponsorships, 245-246
Neiman, Peter, 5non-compensatory rules (brand
consideration), 101Nortel example (brand
building), 190NVT (Norton Villiers Triumph)
examplebranding, 25-29overhead allocation, 146
Oobjective and task
communications model, 251Ocean Spray, 105Omnitel example (branding),
34-35online community, impact of,
236-237online environment, brand
management in (Sony example),306-307
optimizing financial performanceover time, 205-208
organization. See businessOster, Evan, 291Osterhaus, Mark, 98overhead allocation (NVT
example), 146
Ppenetration pricing strategy,
defined, 37penetration strategy (establishing
perception of value), 194perceived value. See also CVA®
brand and, 93-97, 107, 187-188, 235
financial services example,94-95
Harrah’s Entertainmentexample, 97-98
MySpace example, 102-104buyer behavior stages, 98-102costs versus, 12-13defined, 10, 77, 89-90determinants of, 92-94estimating demand curves,
121-124managing, 104-112in marketing definition, 11-12

INDEX 341
marketing ratios and, 91-92measuring, 112-120
Charles Schwab example, 120
on demand curve, 41motel room case study,
117-119in Strategic Themes Matrix, 22value exchange and, 283-284
Perceived Value Analysis, 173-176Perceived Value Chart, 174perceived value life cycles
during competitive life cyclestages, 70-71
financial performance over, 76-78
perceived value measures(marketing accountabilityscorecard), importance of, 288,290-291
percentage of salescommunications model, 250
perfect competition, defined, 141performance, types of value
and, 90Petri, Daniel, 35Pets.com example (competitive
life cycle), 195-196Pfizer example (standardization
versus localization), 231-232Polaroid example, 65, 205Porter, Michael, 23positioning
brand positioning,overestimating, 235
defined, 154evaluating, 159-166, 223
with CVA®, 226-232grey markets, 232-233mistakes in, 224-226
practice, defined, 296
price premium gap (measuringmarketing ROI), 277
price premium method(estimating brand equity), 87
price-cutting strategies, problemswith, 16
pricing strategy, 259. See alsocostscase study, 140-144contribution and, 42-44, 138CVA® and, 35-37, 262-265demand curves, 39-41limitations of, 260-261in multiple markets, 265-267revenue and, 41-45Sexton’s Contribution Law,
50-56Sexton’s Revenue Law, 48-49shifting the demand curve, 45-47Unilever example, 37-39variable margin rate and,
136-138prioritizing financial objectives in
competitive life cycles, 185-187private-label pricing, 265-267problem recognition (buyer
behavior stage), 99Procter & Gamble example
(standardization versuslocalization), 229
product benefits, perceived valueand, 93
product or service life cycles. Seealso competitive life cyclesCVA® management in, 181-183defined, 66
profit, contribution and, 57programs. See marketing programsProgressive example (competitive
life cycle), 202promotions, defined, 40

342 INDEX
purchase cycle measures(marketing accountabilityscorecard), 286-287
Q–Rquality, value of, 24
range of possible prices, defined, 36
Rapid Growth stage (competitivelife cycle), 68communications during, 256CVA® management in, 196-198Taster’s Choice versus Maxim
example, 198-199Reicheld, Frederick, 23Reilly, Edward T., 255Reiss, Al, 23relative ability (Segment
Selection Analysis), defined, 171relative delivered costs,
defined, 21replacement cost method
(estimating brand equity), 87repositioning brands, 235-236results, steps to achieving,
295-296capability, 301-306effort, 299environment, 307-309rewards, 300-301task clarity, 297-298usage of marketing ROI
information, 309return on communications
spending, 257-259revenue
defined, 41-42, 138market segmentation and, 221micro-targeting and, 216-217
revenue and contributionexample, 44-45
Sexton’s Revenue Law, 48-49shifting the demand curve, 45-47
rewarddefined, 295explained, 300-301
Ries, Al, 106ROI. See marketing ROI
SSaeger, Becky, 121sales
breakeven sales level, 139shutdown sales level, 146
sales life cyclesduring competitive life cycle
stages, 69levels of, 66-67
Sawyer, Cheryl, 294Segment Identification Analysis,
156-159Segment Selection Analysis,
170-173segmentation analysis,
defined, 155segmenting markets. See market
segmentationselecting target markets, 170-172Sen, Kamal, 39Sexton’s Contribution Law, 50-56Sexton’s Law of Micro-Targeting,
215-219Sexton’s Revenue Law, 48-49shakeout, defined, 74shareholder value
contribution and, 58defined, 77effect of marketing on (Unum
example), 4

INDEX 343
sharing data, importance of, 303shaving cream case study
(estimating demand curves), 123shifting the demand curve, 45-47short-lived competitive
advantages, identifying, 164shutdown sales level, defined, 146Simmons, Gene, 194situation analysis, defined, 155skimming strategy (establishing
perception of value), 37, 193Smith, Steven, 148social networks, impact of,
236-237Sony, 31Sony example, 31, 306-307Spector, Jonathan, 237sponsorships (NASCAR example),
245-246standardization, localization
versus, 227-232grey markets, 232-233Pfizer example, 231-232
stock price method (estimatingbrand equity), 87
Strategic Themes Matrix, 21-24strategy. See marketing strategystuck-in-the-middle companies,
defined, 23sustainable competitive
advantages, identifying, 164
Ttactic measures (marketing ROI),
effectiveness of, 281-282tactics. See marketing programs;
marketing tacticstarget competitors, defined, 223
target marketsdefined, 154identifying, 156-158, 212
with CVA®, 219-222mistakes in, 213-215Sexton’s Law of Micro-
Targeting, 215-219selecting, 170-172
task claritydefined, 295explained, 297-298
Taster’s Choice example(competitive life cycle), 198-199
technology changes in Declinestage (competitive life cycle),204-205
Tetley Tea example (estimatingbrand equity), 84
Thom McAn example (brandmanagement), 176
3M exampleloyalty and company growth
example, 8standardization versus
localization, 228TIAA-CREF example (brand
affinity), 211-212timespan. See life cyclestrade-off analysis, measuring
perceived value, 116two-brand strategy (Dow Corning
example), 75-76
UUeberroth, Peter, 271Unilever example (pricing
strategy and brand equity), 37-39
344 INDEX
unit cost life cyclesduring competitive life cycle
stages, 69financial performance over,
76-78unit demand, defined, 36Unum example (marketing and
shareholder value), 4
VVakratsas, Demetrios, 252valuation, defined, 278-279value. See also brand equity;
perceived valueof business, determining, 7-8defined, 278-279of luxury, 24marketing ratios and, 91-92types of, 90
value engineering, defined, 116, 226
value exchange, perceived valueand, 283-284
value orientation, 17-18
value-in-use, measuring perceivedvalue, 113-114
values, defined, 278-279valuing. See estimatingvariable cost per unit,
defined, 134variable cost rate, defined, 135variable costs, defined, 129, 138variable margin per unit,
defined, 36variable margin rate in pricing
strategy, 136-138Verizon, 34-35Vodafone example (branding),
34-35Volkswagen, 107
W–Zword-of-mouth marketing
(MySpace example), 102-104Wynn, Steve, 155
Xiameter example (two-brandstrategy), 75-76
Zappos example (customerrelationships), 132-134