Embed Size (px)
Citation preview

Milliman Cl ient Report
December 1, 2008New York
One Pennsylvania Plaza38th F loorNew York, NY 10119 USA
Tel +1 212 279 7166Fax +1 212 629 5657
mi l l iman.com
Value-Based Insurance Designs for Diabetes Drug Therapy: Actuarial and Implementation Considerations
Prepared for:Takeda Pharmaceuticals North America, Inc.
Prepared by:Milliman
Kathryn Fitch, RN, MEdPrincipal and Healthcare Management Consultant
Kosuke Iwasaki, FIAJ, MAAAConsulting Actuary
Bruce Pyenson, FSA, MAAAPrincipal and Consulting Actuary


Value-Based Insurance Designs for Diabetes Drug Therapy
3
Milliman Cl ient Report
TABlE oF CoNTENTS
I. ExECuTIVE SuMMARy 4
Why diabetes? 5Cost and adherence impact of VBID scenarios 6
II. A PRIMER oN VBID 9
III. ABouT DIABETES 15
Why focus on diabetes? 15
IV. FINDINgS: CoST AND ADhERENCE IMPACT oF VBID STRATEgIES 21
utilization of diabetes drugs 21Contrasting utilization and adherence 22Impact of VBID for diabetes drugs 23
V. hoW To MEASuRE VAluE FRoM VBID PRogRAMS 27
VI. CoMPARINg VAluE To CuRRENT BENEFITS 29
VII. CoNCluSIoN 30
APPENDIx A: DESCRIPTIoN oF KEy DATA SouRCES AND ThEIR APPlICATIoN 31
APPENDIx B: STuDy METhoDology 32
APPENDIx C: DESCRIPTIoN oF VBID MoDElINg 34
APPENDIx D: glyCEMIC CoNTRol AND DIABETES DRug ThERAPy 39
REFERENCES 43
Value-Based Insurance Designs for Diabetes Drug Therapy
4
Milliman Cl ient Report
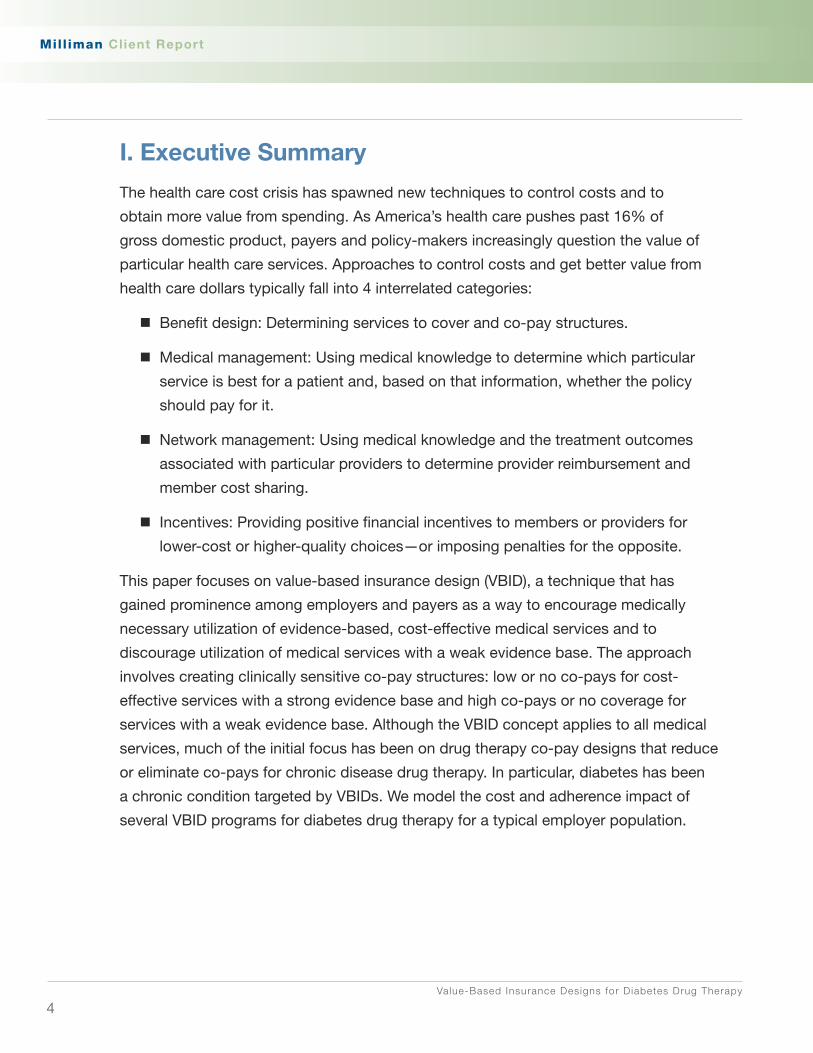
I. Executive Summary
The health care cost crisis has spawned new techniques to control costs and to
obtain more value from spending. As America’s health care pushes past 16% of
gross domestic product, payers and policy-makers increasingly question the value of
particular health care services. Approaches to control costs and get better value from
health care dollars typically fall into 4 interrelated categories:
Benefit design: Determining services to cover and co-pay structures. �
Medical management: Using medical knowledge to determine which particular �
service is best for a patient and, based on that information, whether the policy
should pay for it.
Network management: Using medical knowledge and the treatment outcomes �
associated with particular providers to determine provider reimbursement and
member cost sharing.
Incentives: Providing positive financial incentives to members or providers for �
lower-cost or higher-quality choices—or imposing penalties for the opposite.
This paper focuses on value-based insurance design (VBID), a technique that has
gained prominence among employers and payers as a way to encourage medically
necessary utilization of evidence-based, cost-effective medical services and to
discourage utilization of medical services with a weak evidence base. The approach
involves creating clinically sensitive co-pay structures: low or no co-pays for cost-
effective services with a strong evidence base and high co-pays or no coverage for
services with a weak evidence base. Although the VBID concept applies to all medical
services, much of the initial focus has been on drug therapy co-pay designs that reduce
or eliminate co-pays for chronic disease drug therapy. In particular, diabetes has been
a chronic condition targeted by VBIDs. We model the cost and adherence impact of
several VBID programs for diabetes drug therapy for a typical employer population.
Value-Based Insurance Designs for Diabetes Drug Therapy
5
Milliman Cl ient Report
Why diabetes?
Although treatment targets for glycemic (blood glucose) control (see description
of glycemic control in Appendix D) are well established by the American Diabetes
Association (ADA), and efficacious and safe drug therapies are readily available,
adherence to diabetes drug therapy has been disappointing. Adherence studies report
relatively poor adherence with diabetic drug therapy1-3 and other studies consistently
report findings that as co-pays for diabetes drug therapy increase, adherence
decreases.4,5 The second part of the equation is also well established: poor adherence
is associated with poor glycemic control. Studies report a strong correlation between
medication adherence and glycemic control.6-10 Landmark studies have established
the importance of glycemic control for diabetes patients. These studies report that
lower rates of complications—including heart attack, stroke, heart failure, peripheral
vascular disease, amputation, retinopathy, end-stage renal disease, and cataracts—are
associated with lower levels of hemoglobin A1c (HbA1c), a key marker of glycemic
control.11-13 However, our analysis of the 2003 to 2004 National Health and Nutrition
Examination Survey (NHANES) data found only 46% of working age diagnosed
diabetics have their HbA1c at or below the ADA-recommended target level of 7.
Value-Based Insurance Designs for Diabetes Drug Therapy
6
Milliman Cl ient Report
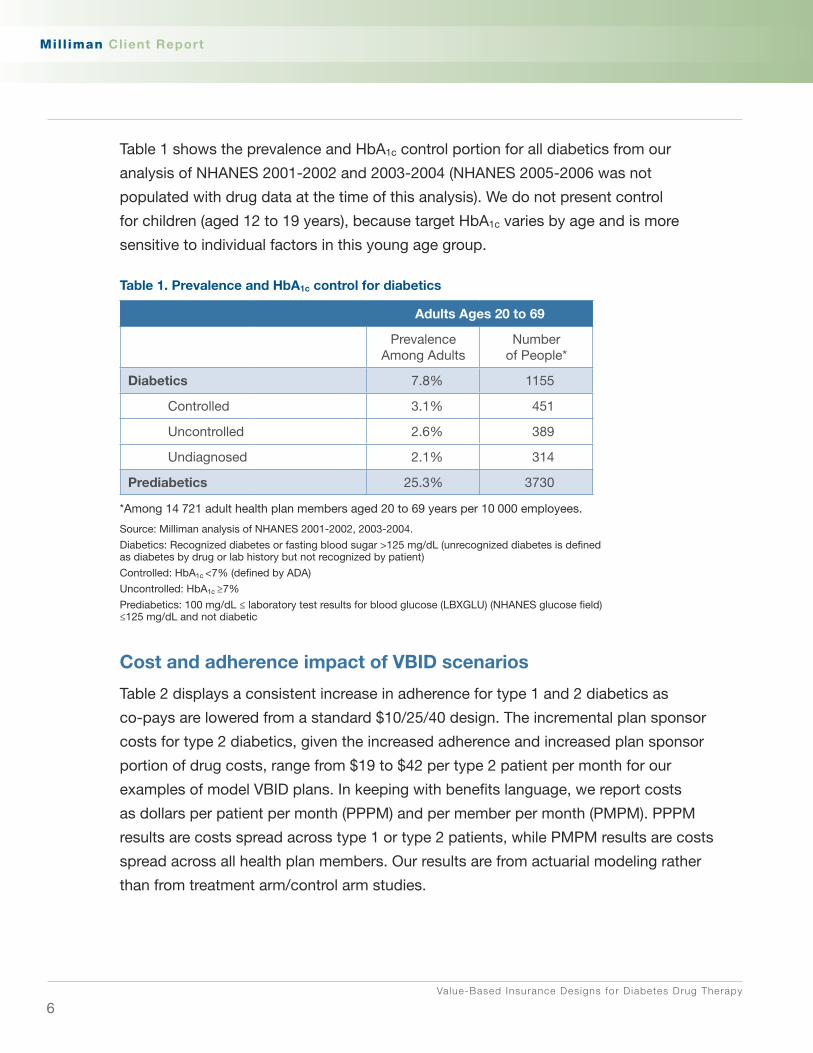
Table 1 shows the prevalence and HbA1c control portion for all diabetics from our
analysis of NHANES 2001-2002 and 2003-2004 (NHANES 2005-2006 was not
populated with drug data at the time of this analysis). We do not present control
for children (aged 12 to 19 years), because target HbA1c varies by age and is more
sensitive to individual factors in this young age group.
Table 1. Prevalence and hbA1c control for diabetics
Adults Ages 20 to 69
Prevalence Among Adults
Number of People*
Diabetics 7.8% 1155
Controlled 3.1% 451
Uncontrolled 2.6% 389
Undiagnosed 2.1% 314
Prediabetics 25.3% 3730
*Among 14 721 adult health plan members aged 20 to 69 years per 10 000 employees.
Source: Milliman analysis of NHANES 2001-2002, 2003-2004.
Diabetics: Recognized diabetes or fasting blood sugar >125 mg/dL (unrecognized diabetes is defined as diabetes by drug or lab history but not recognized by patient)
Controlled: HbA1c <7% (defined by ADA)
Uncontrolled: HbA1c ≥7%
Prediabetics: 100 mg/dL ≤ laboratory test results for blood glucose (LBXGLU) (NHANES glucose field) ≤125 mg/dL and not diabetic
Cost and adherence impact of VBID scenarios
Table 2 displays a consistent increase in adherence for type 1 and 2 diabetics as
co-pays are lowered from a standard $10/25/40 design. The incremental plan sponsor
costs for type 2 diabetics, given the increased adherence and increased plan sponsor
portion of drug costs, range from $19 to $42 per type 2 patient per month for our
examples of model VBID plans. In keeping with benefits language, we report costs
as dollars per patient per month (PPPM) and per member per month (PMPM). PPPM
results are costs spread across type 1 or type 2 patients, while PMPM results are costs
spread across all health plan members. Our results are from actuarial modeling rather
than from treatment arm/control arm studies.

Value-Based Insurance Designs for Diabetes Drug Therapy
7
Milliman Cl ient Report
We do not model the cost offsets that might be realized with better diabetes drug
therapy adherence. In section V, we make recommendations and provide a framework
for how a payer/employer might reasonably model cost offsets from improved
diabetes control.
Table 2. Cost and adherence impact of 3 benefit designs
Base Standard $10/25/40
VBID 1 $0/12.5/30
VBID 2 $0/0/0
VBID 3 $10/10/10
Type 1 Net of co-pay
PPPM 2008 $127 $158 $207 $169
PMPM 2008 $0.59 $0.74 $0.97 $0.79
PMPM Increment to base NA $0.14 $0.37 $0.20
Virtual adherence
Patients compliant 60% 72% 89% 75%
Increment to base NA 20% 48% 24%
Type 2 Net of co-pay
PPPM 2008 $60 $79 $102 $80
PMPM 2008 $2.16 $2.82 $3.65 $2.85
PMPM Increment to base NA $0.67 $1.49 $0.69
Virtual adherence
Patients compliant 49% 60% 69% 57%
Increment to base 0% 22% 41% 16%
Abbreviations: NA, not applicable; PMPM, per member per month; PPPM, per patient per month. Source: Milliman modeling of MedStat Commercial 2006.
Even though there are many definitions of value for health care,14 the extent of waste
and inefficiency in medical care delivery15 suggests that much progress can be made
without precisely defining value. Important targets include medical services in which
there is significant variation that is not explained by clinical severity or demographics.16
Services with significant unexplained geographic variation include spinal fusions, knee
arthroscopies, bariatric surgery, and high-tech imaging, as well as inpatient hospital
stays and inpatient bed days. Other targets for better value include reducing obvious
quality problems, such as hospital-acquired infections and other medical errors.17

Value-Based Insurance Designs for Diabetes Drug Therapy
8
Milliman Cl ient Report
We present the cost of several frequently covered benefits and vendor services
including medical management operations that may deserve comparative valuation
(Table 3). Making adjustments to co-pay designs for some benefits or reconsideration
of the value and expense of particular vendor program purchases could go a long way
to pay for evidence-based/value-based services such as diabetes drug VBID.
Table 3. Comparative benefits
Benefit Typical Incremental Cost PMPM
VBID diabetes options in this report $0.81 to $1.86
Diabetes disease management (total cost) $0.50 to $1.00
Wellness* (total cost) $0.40 to $14.00
Chiropractic care (total cost) $0.30 to $2.30
Decrease inpatient admissions by 1.7 per 1000 members (typically <4% reduction)
$1.40 to $1.50
Decrease spinal surgery and bariatric surgery by 20% $0.30 to $0.70
Abbreviations: PMPM, per member per month; VBID, value-based insurance design.*$0.40 PMPM includes basic promotion. $14.00 PMPM includes full range of services such as health risk assessment (HRA) incentives, gym subsidy, obesity benefit, administrative costs, etc.
This report was commissioned by Takeda Pharmaceuticals North America, Inc. While
the authors followed applicable Actuarial Standards of Practice,a this report does not
form a prescribed statement of actuarial opinion. Milliman does not intend to endorse
any product or to benefit any third party through this report; the report reflects the
findings of the authors. As with any financial forecast, our work is based on many
assumptions and cannot capture all influences. Therefore, actual experience will likely
vary from that presented here. If this report is distributed, it must be distributed in its
entirety, as material taken out of context can be misleading.
a ASOP No. 23, Data Quality (Doc No. 097; December 2004) and ASOP No. 41, Actuarial Communications (Doc No. 086; March 2002). www.actuarialstandardsboard.org/asops.asp.

Value-Based Insurance Designs for Diabetes Drug Therapy
9
Milliman Cl ient Report
II. A Primer on VBID
VBID involves creating clinically sensitive co-pay structures: low or no co-pays for
cost-effective services with a strong evidence base and high co-pays or no coverage
for services with a weak evidence base. Although VBID can apply to all medical
services, much of the initial focus has been on drug therapy co-pays, and diabetes
has been targeted by VBID programs. For years, standard actuarial practice has
recognized price elasticity—that increasing/decreasing drug co-pays decreases/
increases drug utilization. Recently, published studies make the same point about
drug therapy adherence. In this report we add our findings on the increased pharmacy
cost to employers and increased drug adherence associated with various VBIDs for
diabetes drugs.
The payer community is increasingly focusing on approaches to align payment with
evidence-based/value-based health care delivery including the following:
Pay for performance (P4P) health plan initiatives �
A federal executive order for promoting quality and efficiency in programs �
administered or sponsored by the federal government health care programs
Center for Medicare and Medicaid Services (CMS) policy to exclude payments for �
“never events”
VBID initiatives �
Value-based purchasing initiatives �
Employer and business group and coalition initiatives, eg, eValue8 (health care �
vendor performance rating tool)
Leapfrog Group (hospital rating for quality and safety practice) �
Bridges to Excellence (physician incentives for quality outcomes and care delivery �
processes)
A disciplined approach is required to design benefits that support this paradigm, and
VBID is a useful approach if thoughtfully implemented.

Value-Based Insurance Designs for Diabetes Drug Therapy
10
Milliman Cl ient Report
Mark Fendrick and Michael Chernew, noted advocates of the concept, coined VBID
in 2004 after developing the concept of benefit-based co-pay (BBC) in 2001. They
propose VBID as a response to the likely adverse clinical effects of the current trend
toward higher co-pays and advocate that co-pay rates be set based on the value of
clinical services (benefits and costs)—not exclusively the costs.18 They suggest that
VBID will encourage more appropriate utilization of medical services as cost sharing is
adjusted to account for the value of medical services.18 Other terms for similar concepts
are value-based benefits, clinically sensitive benefit designs, and, more broadly, value-
based health care.
VBID shifts the benefit design from one based on legacy or price to one based on
value and price. The design tailors co-pays at the point of service to the evidence base
and value of specific services for targeted groups or individual patients where value is
measured by clinical and economic benefit.
VBID strategies may adjust co-pay designs for a variety of targeted health services
including physician services, hospital services, ancillary services, and prescription
drugs. The intent is to evaluate the value and evidence base of specific benefits in
making benefit design decisions. Chart 1 provides a potential framework for evaluating
benefits within that context. The benefits were identified and placed in quadrants based
on the authors’ view of medical evidence from the literature and value in terms of size
of target population and cost of treatment. The placement of benefits in particular
quadrants is illustrative rather than definitive and designed to encourage readers to
create their own quadrant interpretation. For example, the authors considered that
landmark statin and angiotensin-converting enzyme inhibitor (ACEI) therapy studies,
for indicated populations, report significant reduction in adverse health events. We
placed these in what we label the VBID quadrant. Smoking cessation therapies have
an established evidence base, and a significant portion of working-age adults (24%
based on Milliman analysis of NHANES 2005-2006) smoke; therefore, we placed a
smoking cessation benefit in the VBID quadrant. We straddled weight loss programs
across the VBID quadrant and the left upper quadrant. The evidence base for weight
loss programs is mixed, although on the value access, the benefit would be high since
35% of working-age adults are considered obese, with a body mass index (BMI) ≥ 30
(Milliman analysis of NHANES 2005-2006 Appendix A). Disease management and

Value-Based Insurance Designs for Diabetes Drug Therapy
11
Milliman Cl ient Report
wellness programs are positioned midway on the value- and evidence-base axes,
because success with these programs and financial savings outcome reports have
been weak.
Chart 1. Framework for evaluating the value of benefits
Abbreviation: ACEI, angiotensin-converting enzyme inhibitor.
Key design concepts for VBID:
Target services known to be of high value without differentiating among �
individuals who receive the intervention (eg, ACEIs, flu shots, tobacco
cessation, hospice)
Target patients with select clinical diagnoses �
Lower co-pays for high-value services (eg, diabetic members’ annual eye –
exams, diabetic prescriptions); the design may adjust co-pay by condition
severity level (eg, lower statin co-pay for high risk individuals)

Value-Based Insurance Designs for Diabetes Drug Therapy
12
Milliman Cl ient Report
Target providers meeting quality outcome criteria �
Lower co-pay for members utilizing quality providers–
Target patient adherence behavior �
Adjust co-pays accordingly–
VBID fits well with current health care trends including consumerism, consumer-driven
health plans (CDHPs), evidence-based medicine, comparative effectiveness research,
P4P, disease management and wellness/prevention. And support is growing for VBID,
spearheaded by the University of Michigan Center for VBID (Mark Fendrick) and the
Center for Health Value Innovation (Cyndy Nayer). Uptake is slowly growing, with
several large corporations such as Marriott, IBM, Johnson & Johnson, and Procter &
Gamble adopting VBID along with several states and municipalities.
Outcomes studies are sparse, with only 3 reported in peer-reviewed journals:
An outcomes study from Pitney Bowes was published in 2005, several years 1.
after the company shifted all diabetes drugs and diabetes devices (test strips,
glucometers, etc) to tier 1.19 The study reports significant increases in medication
possession ratio (MPR), 6% decrease in overall claim costs, 26% decrease in
emergency department visits, and 7% decrease in average overall pharmacy
costs for diabetics.
A recent study by Active Health Management2. 20 reduced co-pays by
approximately 50% for brand-name ACEIs, angiotensin-receptor blockers
(ARBs), beta-blockers, diabetes medications (oral therapies and insulin), inhaled
corticosteroids, and statins. Nonadherence was reduced by 7% to 14% for all
medication classes except for inhaled corticosteroids, for which there was no
statistically significant difference in adherence.
The Asheville project waived co-pays for diabetes drugs and supplies and 3.
provided intensive pharmacy and diabetes education programs.21 The study
reports reductions in costs and sick time and improved HbA1c and lipid control.

Value-Based Insurance Designs for Diabetes Drug Therapy
13
Milliman Cl ient Report
Several considerations for payers arise when integrating VBID into benefit strategies:
Potential for short-term increase in utilization and cost. � VBID increases
compliance with the targeted drugs, which directly increases pharmacy spending
for those drugs. The expectation is that with better control there will be fewer
exacerbations of chronic conditions requiring emergency department and
inpatient care, but this outcome is uncertain.
Cost of operational implementation � . Implementation will be more costly for
programs that target patients as opposed to services. To target patients, eligibility
data must be transferred from the payer to the point of service, which is more
administratively burdensome.
Information technology (IT) infrastructure (point-of-service identification) � . The
systems for point-of-service claims administration need to be developed. If
particular patients are targeted, algorithms will be needed to identify specific
disease states, compliance levels, etc.
Insufficient evidence/research to target services and patient groups—ie, lack �
of comparative value agency such as the UK’s National Institute for Clinical
Excellence. Some disease areas do not have adequate research to differentiate
between high- and low-value services, yet sufficient evidence is available to
support VBID in selected diseases.
Communications/human resources role � . Effectively communicating to all
members/employees about VBID is essential to avoid confusion and to
encourage any target patient groups to use and appreciate the benefit.
Antidiscrimination barriers. � Some individuals may raise discrimination concerns
as to why particular diseases are being targeted for VBID. This must be
addressed on a case by case basis, as well as by education on the VBID
paradigm.
Privacy � . For programs that vary by patient group, identification of members/
employees with specific conditions is required, and Health Insurance Portability
and Accountability Act (HIPAA) privacy regulations will need to be followed.
Value-Based Insurance Designs for Diabetes Drug Therapy
14
Milliman Cl ient Report
Unintended incentives � . If co-pays are lowered on brand-name drugs to the
same level as generics, patients may not have enough incentive to use generics
when there is an option. VBID designs typically reduce co-pays for generics
significantly more than for brand-name drugs.
Adverse selection � . There is some concern that plans offering a VBID may attract a
disproportionate number of patients with chronic conditions, although VBID could
positively impact member/employee retention.

Value-Based Insurance Designs for Diabetes Drug Therapy
15
Milliman Cl ient Report
III. About Diabetes
Why focus on diabetes?
Type 2 diabetes prevalence is increasing at an alarming rate and is thought to be
related to the increased prevalence of obesity. From 1997 to the first half of 2006,
the National Health Interview Survey (NHIS) shows a dramatic increase in diagnosed
diabetes prevalence among adults (aged 18 years and older), from 5.1% to 7.8%.22
Table 4 presents the increase in diabetes prevalence for subjects aged 20 to 69 years
in a 4-year period from our analysis of NHANES data. Although there has been a slight
decline in undiagnosed diabetics, the overall prevalence of diabetes and prediabetes is
on the rise, and it appears related to the increased prevalence of obesity. About 11%
of prediabetics become actual diabetics each year.23 The NHANES prevalence data
include type 1 and type 2 diabetics.
Table 4. Increasing prevalence of diabetes and prediabetes (aged 20 to 69 years)
NhANES 1999-2000*
NhANES 2003-2004*
Prevalence of diagnosed diabetes 4.5% 5.4%
Prevalence of undiagnosed diabetes 2.5% 2.0%
Prevalence of total diabetes 6.9% 7.5%
Prevalence of prediabetes (fasting blood sugar ≥100 and <126 mg/dL)
20.9% 23.7%
Abbreviation: NHANES, National Health and Nutrition Examination Survey.* Data in columns may not add to totals due to rounding.

Value-Based Insurance Designs for Diabetes Drug Therapy
16
Milliman Cl ient Report
The prevalence of type 2 diabetes increases with age. Chart 2 shows the prevalence
of diagnosed and undiagnosed diabetes by sex and 5-year age bands. The average
age of diagnosed diabetics is higher than the average age of undiagnosed diabetics.
Among working-age adults (aged 20 to 69 years), the average age of those with
diagnosed diabetes is 50 years based on a demographically adjusted NHANES
population, versus an average age of 40 years for those without diabetes (Milliman
analysis Appendix A).
Chart 2. Prevalence of diabetes by age and gender
Source: Milliman analysis of NHANES 2001-2004.
Chart 3 provides cost data on diabetics, showing significantly higher costs for
diabetics. Age alone accounts for some of the higher costs of people with diabetes.
Although type 1 diabetics incur the highest cost, only 5% to 10% of Americans
diagnosed with diabetes are considered type 1.24 Therefore, it is the larger population
with type 2 diabetes that drives aggregate cost of the disease.

Value-Based Insurance Designs for Diabetes Drug Therapy
17
Milliman Cl ient Report
Chart 3. Diabetics have much higher costs
Abbreviation: PPPM, per patient per month.Source: Milliman analysis of MedStat Commercial 2006, Milliman Health Cost Guidelines 2008.
Chart 4 shows that adults aged 20 to 69 years with diabetes carry a greater burden
of comorbidities than the nondiabetic population. The prevalence of hypertension,
coronary artery disease (CAD), and congestive heart failure (CHF) are dramatically
higher in diabetics compared to nondiabetics. (Blood pressure ≥130/80 is considered
uncontrolled hypertension for diabetics.) In addition, 54% of diabetics are considered
obese with a BMI ≥30, while the prevalence of obesity drops to 27% for nondiabetics.25
Chart 4. Distribution of prevalence of comorbidities (adults aged 20 to 69 years)
Abbreviations: CAD, coronary artery disease; CHF, congestive heart failure.Source: Milliman analysis of NHANES 2001-2004, Milliman Health Cost Guidelines 2008 Standard Demographics.

Value-Based Insurance Designs for Diabetes Drug Therapy
18
Milliman Cl ient Report
Even when controlling for comorbidities, the cost of covering diabetics is significantly
higher than the cost of covering nondiabetics (Chart 5).
Chart 5. Cost of covering adults with comorbidities
Abbreviations: CAD, coronary artery disease; CHF, congestive heart failure; PMPM, per member per month; PPPM, per patient per month.Source: Milliman analysis of Medstat Commercial 2006, Milliman Health Cost Guidelines 2008.

Value-Based Insurance Designs for Diabetes Drug Therapy
19
Milliman Cl ient Report
Our analysis of 2001-2004 NHANES survey data shows that only 54% of diagnosed
diabetic adults aged 20 to 69 years have their glycemic levels controlled (HbA1c <7 as
recommended by the ADA). Chart 6 displays those findings.
Chart 6. Prevalence of diabetes among adult health plan members
Source: NHANES 2001-2004.
Studies show relatively poor adherence with diabetic drug therapy. In a meta-analysis
of 20 adherence studies with oral hypoglycemic drug therapy, adherence ranged from
36% to 93% in retrospective analyses and 67% to 85% in prospective monitoring
studies.1 Insulin adherence for patients with type 2 diabetes ranged from 62% to 64%.1
In a subsequent study of 11 532 managed care diabetic patients, 79% of patients
were identified as being adherent with their oral hypoglycemic agents or insulin where
adherence was defined as taking drug therapy ≥80% of the year.2 In another study
of 900 managed care type 2 adult diabetics, 71% of patients were reported to be
adherent with oral hypoglycemic drug therapy, where adherence was defined as taking
drug therapy ≥80% of the year.3
Some of the poor adherence is related to co-pay cost burden. Studies consistently
report that, as co-pays for diabetes drug therapy increase, adherence decreases. A
meta-analysis of prescription drug cost sharing impact on adherence cited several
studies reporting a correlation between increasing co-pays for diabetes drugs and
Value-Based Insurance Designs for Diabetes Drug Therapy
20
Milliman Cl ient Report
reduced adherence.4 A study examining pharmacy claims data and health plan benefit
designs from 30 employers and 52 health plans reported that doubling of co-pays for
diabetes drugs reduced the use of antidiabetic drugs by patients with diabetes by 23%.5
The second part of the equation is also well established: namely, that poor adherence
is associated with poor glycemic control. Studies report a strong correlation between
medication adherence and glycemic control.6-10

Value-Based Insurance Designs for Diabetes Drug Therapy
21
Milliman Cl ient Report
IV. Findings: Cost and Adherence Impact of VBID StrategiesThis section contains summary information about diabetics and their use of prescription
drugs. We also present results from our modeling of VBID for diabetes drugs.
utilization of diabetes drugs
Because type 1 and type 2 diabetics have significantly different characteristics, we
report descriptive data separately. The data we show are taken from MedStat 2006, a
large database that includes a wide range of benefit designs and employer-sponsored
health plans. These data indicate current typical practice, but many factors can cause
actual results for any particular group to vary from these data.
Chart 7 shows the portion of type 1 or type 2 diabetics on broad classes of drugs.
All type 1 diabetics take insulin, which reflects both medical sense and the way we
identified type 1 diabetics in the data. A minority of type 2 diabetics use insulin. The
percentages shown reflect one or more prescriptions during the year, not utilization.
Chart 7. Percent of type 1 and type 2 diabetics with one or more scripts for diabetes drugs split by insulin, generic drugs, and brand-name drugs
Source: Milliman analysis of MedStat Commercial 2006. Insulin is not included in generic or brand-name category. Individuals may be on multiple generic or brand-name drugs.

Value-Based Insurance Designs for Diabetes Drug Therapy
22
Milliman Cl ient Report
Chart 8 shows the allowed cost for type 1 and type 2 diabetics by category of drug,
along with total drug cost. Allowed cost includes both the plan-paid amounts and the
member co-pays. For both types of diabetics, generic drugs are the smallest portion
of cost.
Chart 8: Distribution of allowed cost per diabetic patient per month
Abbreviation: PMPM, per member per month. Source: MedStat Commercial 2006, Standard Demographics from Milliman Health Cost Guidelines 2008.Cost trended to 2008.
Contrasting utilization and adherence
Payers traditionally measure prescription use as (aggregate) utilization, typically,
the number of scripts per 1000 members per year. By contrast, clinicians measure
adherence of individual patients, which is the fill rate of the prescriptions the patient
receives from the physician. Adherence (filling the prescription) is associated with
compliance (taking the drug), which is what drives health outcomes. Utilization,
however, is the measure associated with claims and cost.
There is no easy translation between the 2 measures, for the following reasons:
A patient may change therapy during the year. For example, the patient may �
start with 1 prescription, and, through changing health status, end the year with
2 prescriptions. Without chart audits or clinical information, it is impossible to
identify such cases through claims data.

Value-Based Insurance Designs for Diabetes Drug Therapy
23
Milliman Cl ient Report
Physicians may change prescription drugs and/or doses during the year, which �
makes it difficult to determine whether the patient should be compliant with
1 or 2 prescriptions.
Some patients may be prescribed more or less than a year’s worth of drugs. For �
example, it is not unusual for a diabetic to receive prescriptions for both long-
acting and short-acting insulins.
From a practical standpoint, because employers will not be able to measure adherence
directly, a surrogate approach is needed. We believe the nature of prescription changes
and the progressive nature of diabetes mean that simple approaches to tabulating
adherence from utilization data will tend to understate adherence. For VBID to be
measured, standards for “virtual adherence” that translate available utilization into
useful information will need to be developed. We suggest the following methodology:
Distinguish between type 1 and type 2 diabetics �
Identify utilization of multiple pharmacies within broad drug categories �
Make assumptions for changing therapies and doses �
As described in the methodology section, we used this approach to develop our
figures. As interest in VBID grows, the need for such standard methodology will
become more urgent as organizations try to compare results.
Impact of VBID for diabetes drugs
Using the data and methodology described in Appendices A and B, respectively, we
found that reducing the co-pays on a typical prescription drug plan for diabetes drugs
will significantly increase adherence.
Although VBID advocates point to the health-improving consequences of better
adherence, we have not attempted to model any medical cost offsets. It is difficult to
model medical cost offsets, because there is little medical knowledge about the impact
of incremental improvements in adherence on health status. For example, if reducing
co-pays helps someone take their medicine for 9 months out of 12 instead of 8 months,
does their health status improve? If so, by how much? These issues have not been
Value-Based Insurance Designs for Diabetes Drug Therapy
24
Milliman Cl ient Report
resolved in the scientific literature. For individual patients, if adherence rate increases
to 80% MPR or higher, one would expect a reduction in micro- and macrovascular side
effects associated with poor glycemic control.
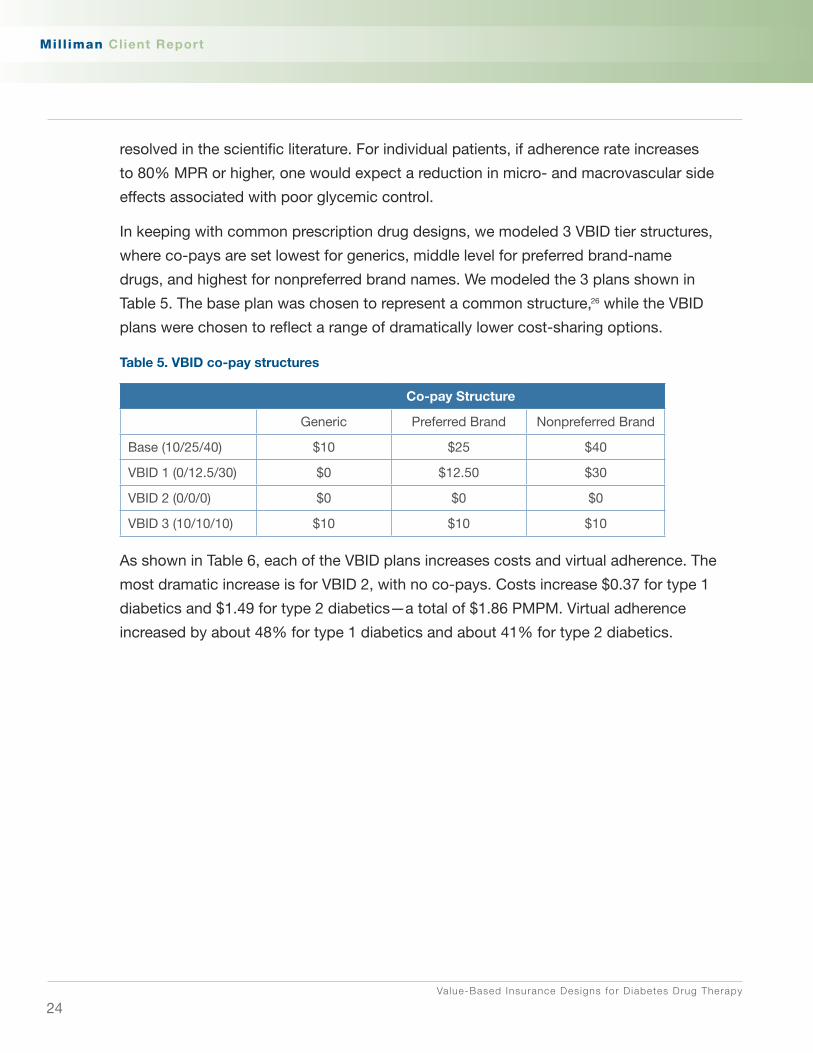
In keeping with common prescription drug designs, we modeled 3 VBID tier structures,
where co-pays are set lowest for generics, middle level for preferred brand-name
drugs, and highest for nonpreferred brand names. We modeled the 3 plans shown in
Table 5. The base plan was chosen to represent a common structure,26 while the VBID
plans were chosen to reflect a range of dramatically lower cost-sharing options.
Table 5. VBID co-pay structures
Co-pay Structure
Generic Preferred Brand Nonpreferred Brand
Base (10/25/40) $10 $25 $40
VBID 1 (0/12.5/30) $0 $12.50 $30
VBID 2 (0/0/0) $0 $0 $0
VBID 3 (10/10/10) $10 $10 $10
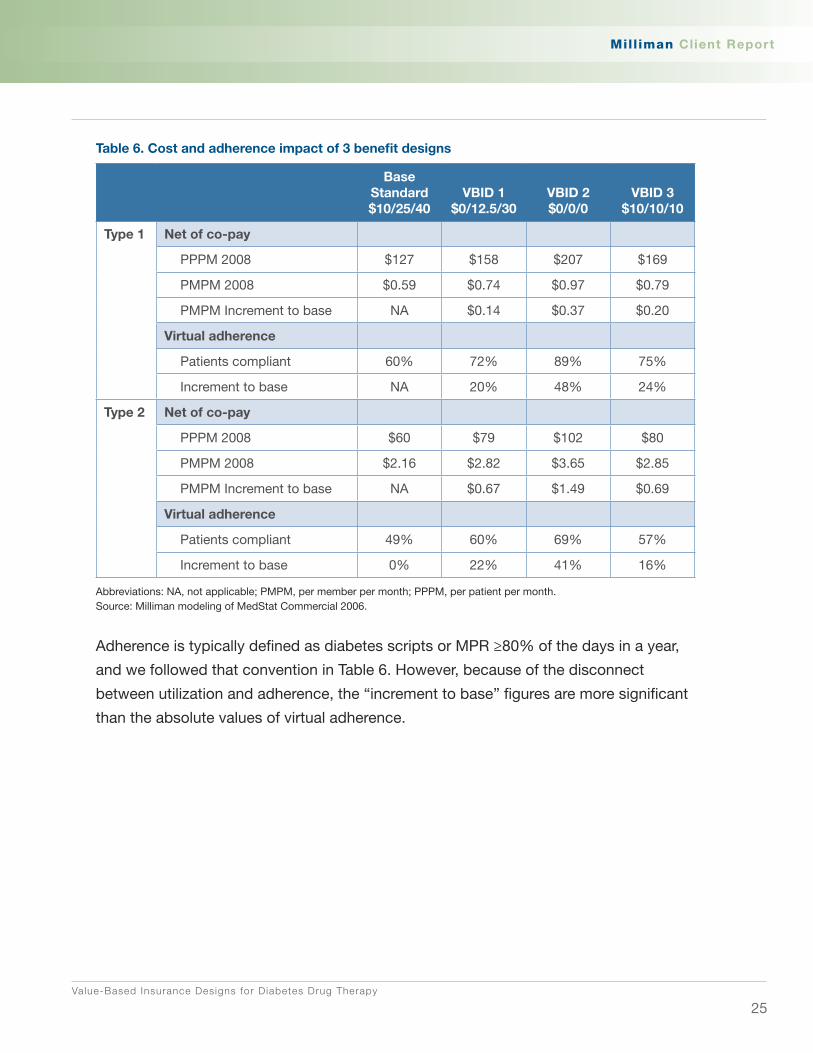
As shown in Table 6, each of the VBID plans increases costs and virtual adherence. The
most dramatic increase is for VBID 2, with no co-pays. Costs increase $0.37 for type 1
diabetics and $1.49 for type 2 diabetics—a total of $1.86 PMPM. Virtual adherence
increased by about 48% for type 1 diabetics and about 41% for type 2 diabetics.
Value-Based Insurance Designs for Diabetes Drug Therapy
25
Milliman Cl ient Report
Table 6. Cost and adherence impact of 3 benefit designs
Base Standard $10/25/40
VBID 1 $0/12.5/30
VBID 2 $0/0/0
VBID 3 $10/10/10
Type 1 Net of co-pay
PPPM 2008 $127 $158 $207 $169
PMPM 2008 $0.59 $0.74 $0.97 $0.79
PMPM Increment to base NA $0.14 $0.37 $0.20
Virtual adherence
Patients compliant 60% 72% 89% 75%
Increment to base NA 20% 48% 24%
Type 2 Net of co-pay
PPPM 2008 $60 $79 $102 $80
PMPM 2008 $2.16 $2.82 $3.65 $2.85
PMPM Increment to base NA $0.67 $1.49 $0.69
Virtual adherence
Patients compliant 49% 60% 69% 57%
Increment to base 0% 22% 41% 16%
Abbreviations: NA, not applicable; PMPM, per member per month; PPPM, per patient per month.Source: Milliman modeling of MedStat Commercial 2006.
Adherence is typically defined as diabetes scripts or MPR ≥80% of the days in a year,
and we followed that convention in Table 6. However, because of the disconnect
between utilization and adherence, the “increment to base” figures are more significant
than the absolute values of virtual adherence.

Value-Based Insurance Designs for Diabetes Drug Therapy
26
Milliman Cl ient Report
Reducing co-pays increases cost for 2 reasons. Our modeling captures both these
dynamics:
Some members who were not filling their prescriptions will now do so, which 1.
increases drug spending.
Members who were filling prescriptions will now have lower co-pays, which 2.
means the payer will incur these additional costs.
It is beyond the scope of this report to determine whether the clinical outcomes of
better adherence can offset additional drug utilization costs associated with lower
co-pays. The next section of this report, however, describes a methodology by which a
plan may measure projected net value from a VBID program of reduced co-pays.

Value-Based Insurance Designs for Diabetes Drug Therapy
27
Milliman Cl ient Report
V. how to Measure Value From VBID Programs
The goal of implementing a VBID diabetes drug program is to improve adherence
to diabetes drug therapy and, in so doing, improve diabetes glycemic control (see
Appendix D). With this in mind, 2 outcomes metrics need to be measured and
monitored:
Diabetes drug adherence rates �
HbA � 1c levels
Although reducing the medical cost trend is an expected outcome of VBID programs,
we caution that diabetes cost trends could easily be overwhelmed by other factors,
including changes in other benefit designs, provider reimbursement, demographics,
and medical management policies, as well as random fluctuations. One approach to
modeling costs savings is to monetize the improved health status associated with
glycemic control that is reported in medical literature, such as reduced amputations,
end-stage renal disease, and retinopathy. Landmark studies report a lower incidence
of micro- and macrovascular adverse events associated with lower HbA1c levels.11,12
Prior to the start of implementing a program, we suggest estimating baseline drug
therapy adherence rates in the plan’s pharmacy claims data. We note that utilization
(scripts/1000) is a standard actuarial measurement, while adherence is difficult to
measure through claims data. In particular, because many diabetics are on more
than 1 diabetes drug, it is difficult to distinguish between changes in multipharmacy,
intended switches in drug therapy, and nonadherence. Consequently, with claims data,
improvements in estimated adherence are generally more meaningful than absolute
adherence rates.
The following is a simplified description of how to create this estimate. Diabetics
on diabetes drug therapy will need to be identified for a baseline period, probably
12 months long. The identified members should be stratified by days of medication
possession, eg, 30 days, 60 days, 90 days, etc. This will allow for measuring the
number of individuals currently adherent, as measured by medication possession
≥80% of the days in the year, and the number who increase adherence to achieve a
rate of possession ≥80%. Change in aggregate utilization of diabetic drugs should also
be measured. Shift of utilization from brand name to generic is another metric to note.
Value-Based Insurance Designs for Diabetes Drug Therapy
28
Milliman Cl ient Report
If utilizing a diabetes disease management program, this analysis should be performed
by the disease management vendor and reported on a quarterly basis. Alternatively, the
contracted pharmacy benefits manager (PBM) can perform these specialized analyses.
Employers buying a disease management program for diabetes should obtain annual
reports on changes in HbA1c levels among enrolled members. Disease management
vendors typically gather baseline HbA1c levels on individuals as they enroll in disease
management programs and additional values periodically thereafter. However, the
vendor may find it hard to obtain follow-up values from many enrollees, and data
on HbA1c changes may be based on a small portion of diabetics. Outside a disease
management program, an employer will find it challenging and cumbersome to
collect HbA1c data. While employers can examine the HbA1c-related scores of health
plans compiled in the Healthcare Effectiveness Data and Information Set (HEDIS),
these figures are generally reported for the whole health plan’s population and not for
members in VBID or for a particular employer.
Employers may wish to consider other impact measures:
Surveying members/employees regarding impact of lower co-pays for diabetes �
drugs on other health behaviors, including impact on medication adherence for
other comorbid conditions
Member/employee satisfaction and retention �
Workplace productivity/absenteeism �
These measurements are also complex and difficult to associate with a particular
benefits program such as VBID.
Value-Based Insurance Designs for Diabetes Drug Therapy
29
Milliman Cl ient Report
VI. Comparing Value to Current Benefits
VBID is intended to apply to all medical benefits and adjust co-pays or benefit
coverage based on value and evidence. We identify several changes in benefit design
or medical care efficiency that employers and health plans can consider to offset the
additional costs associated with increased adherence with VBIDs. Making adjustments
to co-pay designs for some benefits or reconsideration of the value and expense of
particular vendor program purchases could go a long way toward paying for value-
based services such as diabetes drug VBID.
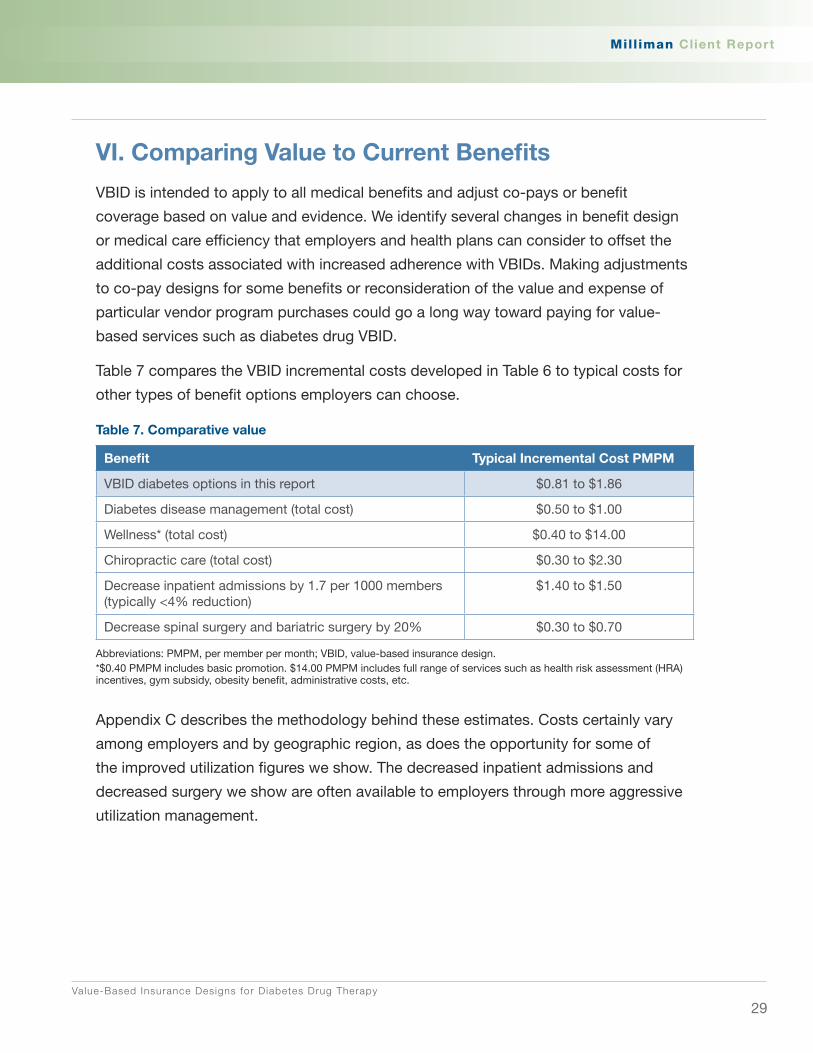
Table 7 compares the VBID incremental costs developed in Table 6 to typical costs for
other types of benefit options employers can choose.
Table 7. Comparative value
Benefit Typical Incremental Cost PMPM
VBID diabetes options in this report $0.81 to $1.86
Diabetes disease management (total cost) $0.50 to $1.00
Wellness* (total cost) $0.40 to $14.00
Chiropractic care (total cost) $0.30 to $2.30
Decrease inpatient admissions by 1.7 per 1000 members (typically <4% reduction)
$1.40 to $1.50
Decrease spinal surgery and bariatric surgery by 20% $0.30 to $0.70
Abbreviations: PMPM, per member per month; VBID, value-based insurance design.*$0.40 PMPM includes basic promotion. $14.00 PMPM includes full range of services such as health risk assessment (HRA) incentives, gym subsidy, obesity benefit, administrative costs, etc.
Appendix C describes the methodology behind these estimates. Costs certainly vary
among employers and by geographic region, as does the opportunity for some of
the improved utilization figures we show. The decreased inpatient admissions and
decreased surgery we show are often available to employers through more aggressive
utilization management.
Value-Based Insurance Designs for Diabetes Drug Therapy
30
Milliman Cl ient Report
VII. Conclusion
Despite well-established treatment targets and the availability of numerous diabetes
drugs, adherence to therapeutic regimens remains poor.1-3 Adherence correlates with
glycemic control—good adherence leads to better control, while poor adherence leads
to poor control.6-9
To encourage adherence with cost-effective therapies, some employers and payers
have experimented with VBID and related concepts. VBID sets cost sharing to support
evidence-based interventions—for example, lower cost sharing for cost-effective
services with a strong evidence base; higher cost sharing or denial of coverage for
interventions with a weak evidence base. While VBID can apply to all medical services,
our focus has been on medication therapy co-pays. For prescription drugs, the
rationale for focusing on co-pays is that adherence is inversely proportional to the level
of co-pay. As shown in Milliman modeling for types 1 and 2 diabetes, adherence is
higher in lower co-pay benefit designs.
When co-pays are reduced under VBID, increasing levels of adherence may be
accompanied by incrementally higher drug costs. Our analysis suggests that reducing
co-pays elevates utilization and drug costs for diabetes drugs, because more members
begin to fill prescriptions for which the payer assumes more of the cost and because
members who were already adherent pay less out-of-pocket.
It is beyond the scope of this report to model cost offsets that might accrue from better
adherence. However, we note that plans can assign reasonable health improvements
and cost reductions associated with better adherence and assumed glycemic control—
reduced amputations, end-stage renal disease, retinopathy, and other complications.
These improvements can then be compared to the costs of VBID or other plan costs.
Plans may also consider effects such as impact on HEDIS measures, member and
physician satisfaction, and disability.
VBID dovetails with current health care trends, such as consumerism, evidence-based
medicine, and concern over the management of chronic disease.
Value-Based Insurance Designs for Diabetes Drug Therapy
31
Milliman Cl ient Report
Appendix A: Description of Key Data Sources and Their Application
MedStat claims data. This dataset contains all paid claims generated by over 4 million
commercially insured lives. Member identification codes are consistent from year to
year and allow for multiyear longitudinal studies. Information includes diagnosis codes,
procedure codes, diagnosis-related group (DRG) codes, and national drug codes
(NDCs), along with site of service information and the amounts paid by commercial
insurers. For this study, we used data for 2006.
NHANES 1999-2000, 2001-2002, 2003-2004 and 2005-2006 datasets. This is from
the series of National Health and Nutrition Examination Surveys. A department within
the Centers for Disease Control (CDC) National Center for Health Statistics (NCHS)
produces NHANES. Each year, the survey contains information from roughly 5000
completed forms plus details of laboratory results and physical examinations. A
representative sample of the noninstitutionalized civilian population aged 12 years and
older is selected by using a stratified, multistage sampling design. The data items list
contains well over 1000 items that measure an individual’s clinical, demographic, and
health status.
Milliman’s 2008 Health Cost Guidelines. The Guidelines provide a flexible but consistent
basis for the determination of health claim costs and premium rates for a wide variety of
health plans. The Guidelines are developed as a result of Milliman’s continuing research
on health care costs. First developed in 1954, the Guidelines have been updated
and expanded annually since that time. The Guidelines are continually monitored to
ensure that they are useful in measuring the experience and evaluating the rates of
health plans. The Guidelines are also compared to other data sources. The standard
demographics in the Guidelines were developed to be representative of the age and
sex distribution for a typical large insured group. The standard demographics were
developed using data from large insurers combined with Department of Labor sources.

Value-Based Insurance Designs for Diabetes Drug Therapy
32
Milliman Cl ient Report
Appendix B: Study Methodology
We used NHANES 2001-2004 to identify the prevalence of diabetes, comorbidities
among diabetics, and the HbA1c levels of diabetics. We applied criteria from the ADA to
the following NHANES fields to identify diabetics:
DIQ010 Doctor told you have diabetes
DIQ050 Now taking insulin
DIQ070 Now taking diabetic pills to lower blood sugar
LBXGLU Fasting blood glucose (we use >125 mg/dL as the criterion for diabetes
and 100 to 125 mg/dL for prediabetes)
We use the following NHANES fields to identify patients on diabetes drug therapy:
Description orals NhCoDE
chlorpromamide phenformin 85200
chlorpromamide 13700
diabetes drug unspecified 87100
glimepiride 27300
glipizide 27400
glucagon hydrochloride 27500
glyburide 27600
glyburide; metformin hydrochloride 90100
metformin hydrochloride 38500
tolazamide 57100
insulin 32800
We use the LBXGH (glycohemoglobin) field in the NHANES lab data file to capture
HbA1c levels and determine diabetes control according to the ADA guidelines:
HbA1c <7% (controlled) or ≥7% (uncontrolled).
We applied the portions of diabetes lives identified in NHANES by quinquennial age
groups and sex to the Guidelines’ standard employee/spouse/dependent population
(10 000 employees, 4721 spouses and 7844 children) covered through a typical
large employer.
Value-Based Insurance Designs for Diabetes Drug Therapy
33
Milliman Cl ient Report
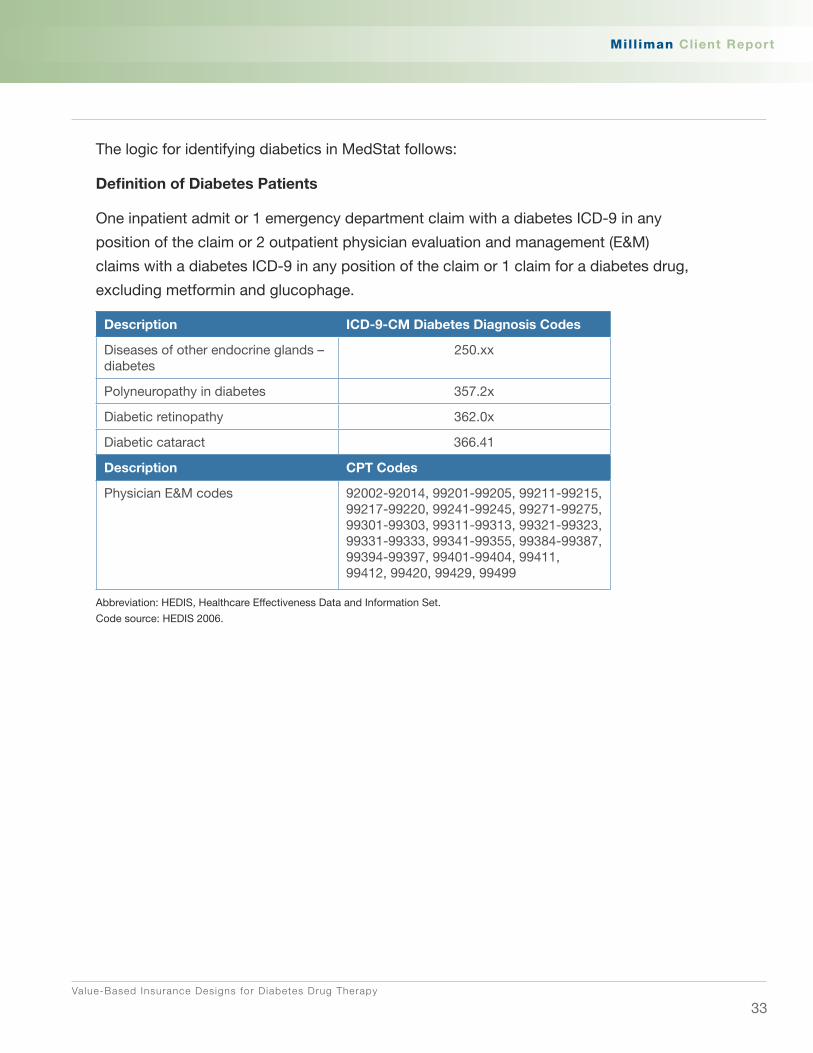
The logic for identifying diabetics in MedStat follows:
Definition of Diabetes Patients
One inpatient admit or 1 emergency department claim with a diabetes ICD-9 in any
position of the claim or 2 outpatient physician evaluation and management (E&M)
claims with a diabetes ICD-9 in any position of the claim or 1 claim for a diabetes drug,
excluding metformin and glucophage.
Description ICD-9-CM Diabetes Diagnosis Codes
Diseases of other endocrine glands – diabetes
250.xx
Polyneuropathy in diabetes 357.2x
Diabetic retinopathy 362.0x
Diabetic cataract 366.41
Description CPT Codes
Physician E&M codes 92002-92014, 99201-99205, 99211-99215, 99217-99220, 99241-99245, 99271-99275, 99301-99303, 99311-99313, 99321-99323, 99331-99333, 99341-99355, 99384-99387, 99394-99397, 99401-99404, 99411, 99412, 99420, 99429, 99499
Abbreviation: HEDIS, Healthcare Effectiveness Data and Information Set.
Code source: HEDIS 2006.

Value-Based Insurance Designs for Diabetes Drug Therapy
34
Milliman Cl ient Report
Appendix C: Description of VBID Modeling
Our approach to modeling the increase in adherence due to reduced co-pays required
several steps, which we describe in this section. We emphasize that we used data
on the actuarial impact of co-pays on aggregate utilization. We used assumptions
to convert utilization into adherence. Benefit pricing rarely, if ever, uses randomized
controlled trials to determine relationships among different benefits—such data are
simply not available. In our approach, we used the methods that actuaries working for
health insurers could use to set rates.
We classified each diabetes drug claim from a large database of prescription claims
paid under a 3-tier benefit structure into tiers (tier 1, tier 2, or tier 3) by linking each
claim to plan descriptions. We also classified each diabetes drug claim into component
class (pen insulin, other insulin, generic, or brand) by NDC and therapeutic class. We
used ICD-9 codes on medical claims to determine whether the patient had type 1 or
type 2 diabetes.
We developed elasticity curves by component class and type of diabetes. The
elasticity curve shows the relationship between co-pay (x-axis) and utilization (y-axis),
as illustrated in Chart 9. Higher co-pay plans have lower utilization, so the curve has
negative slope.
We calculated the total day supply of diabetes prescriptions for patients with full-year
membership by component class, as well as the co-pay for each component class.
After averaging total day supply of patients in the same co-pay, we constructed 8 sets
of data (2 types of diabetes and 4 component classes) for regression analysis. Chart 9
shows the utilization of generic drugs for type 2 diabetics by co-pay level.

Value-Based Insurance Designs for Diabetes Drug Therapy
35
Milliman Cl ient Report
Chart 9. utilization of generic prescriptions for type 2 diabetics by co-pay
To develop mathematical relationships, we assumed a family of curves using a
normative actuarial elasticity curve from the Milliman 2008 Health Cost Guidelines
(HCGs), which were developed for all drug classes and patients. We assumed the
elasticity curves for each of the 8 combinations (2 diabetes types and 4 component
classes) could be represented by the HCGs curve and 2 parameters, θ and ς. We solved for the 2 parameters by the least square method for each type and
component class.
Smoothed Curve = θ (HCGs Curve+(1-HCGs Curve)ς)
Chart 10 shows the elasticity curve for generic drugs used by type 2 diabetics.
Chart 10. Elasticity curve of generic prescriptions for type 2 diabetics

Value-Based Insurance Designs for Diabetes Drug Therapy
36
Milliman Cl ient Report
Chart 11 shows the percentage increase of average total day supply if co-pay goes
down from $10 to $9 calculated by the smoothed elasticity curves.
Chart 11. Increase of utilization if co-pay goes down from $10 to $9
We used the derived least-squares elasticity curves to calculate average days’ supply
of diabetes drugs in 2006 per diabetes patient in different co-pay structures.
This average days’ supply included the days’ supply of second drugs for patients
who used more than 1 prescription. We distinguished patients who take more
than 1 prescription and adjusted their days’ supply by dividing by 2. After making
this adjustment, the aggregate percentage adherence (adjusted days’ supply
divided by 365) was 61% for type 1 diabetics and 43% for type 2 diabetics, across
MedStat 2006 plans.
In developing adherence rates, our model recognizes 2 groups of patients—the
adherent group, and the nonadherent group. We assumed the following:
70% of type 1 diabetes patients and 55% of type 2 diabetes patients �
are compliant
For the compliant group, the adherence rate is 80% �
Using the elasticity curves, we calculated the aggregate adherence rate in each
of the 4 co-pay structures described in Table 5. We calculated the percent of virtual
adherence in each co-pay structure with the above assumptions.

Value-Based Insurance Designs for Diabetes Drug Therapy
37
Milliman Cl ient Report
Comparative benefits
This section describes the cost development of comparative benefits shown in
section VI.
Chiropractic
This benefit provides for visits to a licensed chiropractor’s office including visits
involving manipulations with a $15 co-pay per visit. Radiology services are not included
in the cost. We used 2007 national average Medicare Resource-Based Relative Value
Scale (RBRVS) allowed amounts adjusted to 2008 using trends reported in the Milliman
Medical Index. We used utilization for loosely managed and well-managed health plans
from the Milliman 2008 Health Cost Guidelines.
Reduction of inpatient days through improved medical management
To produce the range shown for reducing 1.7 inpatient admits per 1000, we applied
national average Medicare DRG allowed amounts to commercial inpatient admission
distributions by DRG. We used 2 different distributions of DRGs: loosely managed and
well-managed health plans from the Milliman 2008 Health Cost Guidelines.
Utilization reduction in spinal surgeries
For the utilization reduction in spinal surgeries, we used the weighted average of the
10 DRGs below from Milliman’s 2008 Health Cost Guidelines DRG model, using
admission utilization for loosely managed and well-managed health plans.
496 COMBINED ANTERIOR/POSTERIOR SPINAL FUSION
497 SPINAL FUSION EXCEPT CERVICAL W CC
498 SPINAL FUSION EXCEPT CERVICAL W/O CC
499 BACK & NECK PROCEDURES EXCEPT SPINAL FUSION W CC
500 BACK & NECK PROCEDURES EXCEPT SPINAL FUSION W/O CC
519 CERVICAL SPINAL FUSION W CC
520 CERVICAL SPINAL FUSION W/O CC
531 SPINAL PROCEDURES W CC
532 SPINAL PROCEDURES W/O CC
546 SPINAL FUSION EXC CERV WITH CURVATURE OF THE SPINE OR MALIG

Value-Based Insurance Designs for Diabetes Drug Therapy
38
Milliman Cl ient Report
For the cost per admission, we used national average 2007 Medicare DRG allowed
amounts adjusted to 2008 using trends reported in the Milliman Medical Index and an
estimated surgeon fee.
utilization reduction in bariatric surgeries
For the utilization reduction in bariatric surgeries, we used the admission rates for DRG
288, OR Procedures for Obesity, from the Milliman 2008 Health Cost Guidelines DRG
model, using admission utilization for loosely managed and well-managed health plans.
For the cost per admission, we used national average 2007 Medicare DRG allowed
amounts adjusted to 2008 using trends reported in the Milliman Medical Index and an
estimated surgeon fee.
Value-Based Insurance Designs for Diabetes Drug Therapy
39
Milliman Cl ient Report
Appendix D: glycemic Control and Diabetes Drug Therapy
What is glycemic control and why is it important?
Glycemia is the concentration of glucose in the blood. Glycemic control is the
cornerstone of diabetes management and requires careful short-term and long-term
monitoring. Short-term monitoring involves self-monitoring of blood glucose, which is
recommended several times a day for those on insulin. Long-term monitoring of blood
sugar is recommended through measurement of HbA1c, which reflects the level of
glucose in a patient’s blood for the previous 2 to 3 months. HbA1c is used as a measure
of how well a patient’s blood sugar has been controlled in the recent past and is the
measure evaluated to determine the type of drug therapy needed.
Comprehensive recommendations for management of diabetes come from the ADA27
and the American Association of Clinical Endocrinologists (AACE)/American College of
Endocrinology (ACE).28 The ADA sets a target for HbA1c <7.0% while AACE/ACE sets
an HbA1c target of ≤6.5%. The ADA consensus recommendation is that an HbA1c of
≥7% should be a call to action to initiate or change therapy with the goal of achieving
levels as close to the nondiabetic range as possible (HbA1c <6% without significant
hypoglycemia). This goal may not be appropriate or practical for some patients, and
factors such as life expectancy, comorbidities, and risk for hypoglycemia need to be
considered for every patient before intensifying drug therapy. The ADA recommends
HbA1c testing every 3 months while drug therapy is being adjusted (titration) and then at
least every 6 months when HbA1c is controlled.27
Diabetics, especially poorly treated diabetics, have increased risk of developing a
variety of serious medical conditions. The complications of diabetes include organ
damage and failure, especially involving the heart, eyes, kidneys, nerves, and blood
vessels.27 This is because hyperglycemia narrows the small and large blood vessels.
In the small vessels, sugar-based substances build up on vessel walls. As a result,
less blood can be supplied, especially to the nerves and the skin. In the larger
vessels, plaque builds up on the inner vessel lining, as levels of fatty substances in
the blood rise in the presence of hyperglycemia. This results in atherosclerosis and
decreased blood flow.29 Data consistently associate higher HbA1c levels with higher

Value-Based Insurance Designs for Diabetes Drug Therapy
40
Milliman Cl ient Report
rates of micro- and macrovascular complications, including heart attack, stroke,
heart failure, amputation, retinopathy, end-stage renal disease, and cataracts.11-13 The
converse is also true: lower HbA1c levels are associated with lower rates of micro- and
macrovascular complications.11-13
Diabetes drug therapy
This section gives information on guidelines for diabetic drug therapy and describes
types of drug therapies available. Excellent sources for further information can be
found on the Internet. Patients should follow the advice of their clinician, as we cannot
capture here the significant variations that apply to patients or innovations in this
rapidly evolving field.
Type 1 diabetics typically make up 5% to 10% of the diabetic population. Type 1
diabetes is characterized by the destruction of cells in the pancreas resulting in the
inability to produce insulin and is referred to as insulin-dependent diabetes. In contrast,
type 2 diabetics have inadequate insulin secretion and/or diminished tissue responses
to insulin. Type 1 diabetics are dependent on insulin, and most type 2 diabetics are
unable to achieve adequate glycemic control with lifestyle modifications alone and
require drug therapy, sometimes including insulin therapy.
Several classes of antidiabetes drugs are available, and additional classes are expected
to emerge soon. The choice of therapy will depend on the baseline glycemia, duration
of diabetes, previous therapy, patient characteristics, and other factors, with a goal of
balancing glycemic control with safety and regimen issues (side effects, patient burden,
adherence, expense). According to the ADA, “when levels of glycemia are high
(e.g., A1C >8.5), classes with greater and more rapid glucose lowering effectiveness,
or potentially earlier initiation of combination therapy, are recommended; conversely,
when glycemic levels are closer to the target levels (e.g., A1C <7.5%) medications with
lesser potential to lower glycemia and/or a slower onset of action may be considered.”30
The following drug therapy descriptions are taken from the ADA’s 2006 consensus
statement.30, 31
Biguanides. Biguanides are often the first-line therapy for type 2 diabetes. They
decrease glucose output from the liver and lower fasting blood glucose. The
HbA1c-lowering commonly achieved with use of this drug is 1.5% to 2.0%. As

Value-Based Insurance Designs for Diabetes Drug Therapy
41
Milliman Cl ient Report
monotherapy, biguanides infrequently cause hypoglycemia and have been used to treat
prediabetic hyperglycemia. Side effects may be transient and include metallic taste,
diarrhea, nausea, and anorexia.
Sulfonylureas. Sulfonylureas enhance insulin secretion. The major side effect is
hypoglycemia; severe episodes are infrequent but appear more often in the elderly.
Newer sulfonylureas have lower risk for hypoglycemia. Weight gain of about 2 kg is
another reported side effect.
Glinides. Glinides stimulate and enhance insulin secretion. Since their duration of action
is short, frequent administration is needed. A side effect includes weight gain similar
to the sulfonylureas. Hypoglycemia occurs less often with glinides when compared to
sulfonylureas.
α-Glucosidase inhibitors. The rate of digestion is reduced with α-glucosidase inhibitors,
which lower postmeal glucose levels without causing hypoglycemia or weight gain.
Side effects include increased gas production and other gastrointestinal symptoms;
these effects may contribute to the 25% to 45% rate of treatment discontinuation in
clinical trials of these drugs.
Thiazolidinediones. Thiazolidinediones (TZDs) increase the insulin-sensitivity of the
liver, muscles, and fat through several mechanisms mediated by the nuclear receptor
peroxisome proliferator-activated receptor γ (PPARγ),30 a regulator of glucose and lipid
uptake and metabolism. The net result of TZD stimulation of PPARγ is decreased blood
glucose levels.32 A meta-analysis of 22 publications demonstrated that TZDs modestly
reduced A1c levels from baseline (weighted mean difference -0.80%; 95% CI -1.10 to
-0.50).33 Side effects include weight gain and fluid retention.30
Insulin. Insulin is the most efficacious drug therapy for decreasing hyperglycemia. When
used in sufficient doses, it can lower any elevation of HbA1c to levels at or near the
therapeutic target. Although insulin has beneficial effects on fatty-substance levels in
the blood, it causes weight gain of about 2 to 4 kg. Another side effect is hypoglycemia,
which needs to be carefully monitored. In 2006, an inhaled insulin was approved for
type 2 diabetes.

Value-Based Insurance Designs for Diabetes Drug Therapy
42
Milliman Cl ient Report
Glucagon-like peptide 1 agonists. Glucagon-like peptide 1 agonists stimulate insulin
secretion, suppress glucagon secretion, and slow gastric motility without causing
hypoglycemia. Side effects include nausea, vomiting, diarrhea, and weight loss
(approximately 2 to 3 kg over 6 months). A new compound in this class was approved
in the US in 2005 for use with metformin or sulfonylurea. It is injected subcutaneously
twice per day.
Amylin agonist. Amylin agonist slows gastric emptying, inhibits glucagon production,
and decreases postmeal glucose elevations. Side effects involve the gastrointestinal
tract, with approximately 30% of treated patients experiencing nausea. An additional
side effect is weight loss of approximately 1 to 1.5 kg over 6 months. Amylin agonist is
approved in the US only as adjunctive therapy with insulin. It is injected subcutaneously
before meals.
Dipeptidyl peptidase-4 (DPP-4) inhibitor. This agent prolongs the activity of proteins
that increase the release of insulin after the blood sugar rises. It enhances the body’s
own ability to lower elevated blood sugar. DPP-4 inhibitor should not be prescribed
for type 1 diabetes or to treat diabetic ketoacidosis. It can be taken with or without
food. The most common side effects are upper respiratory tract infection, sore throat,
and headache.

Value-Based Insurance Designs for Diabetes Drug Therapy
43
Milliman Cl ient Report
References1. Cramer JA. A systematic review of adherence with medications for diabetes. Diabetes Care. 2004;27(5):1218-1224.
2. Ho PM, Rumsfeld JS, Masoudi FA, et al. Effect of medication nonadherence on hospitalization and mortality among patients with diabetes mellitus. Arch Intern Med. 2006;166(17):1836-1841.
3. Lau DT, Nau DP. Oral antihyperglycemic medication nonadherence and subsequent hospitalization among individuals with type 2 diabetes. Diabetes Care. 2004;27(9):2149-2153.
4. Goldman DP, Joyce GF, Zheng Y. Prescription drug cost sharing: associations with medication and medical utilization and spending and health. JAMA. 2007;298(1):61-69.
5. Goldman DP, Joyce GF, Escarce JJ, et al. Pharmacy benefits and the use of drugs by the chronically ill. JAMA. 2004;291(19):2344-2350.
6. Rozenfeld Y, Hunt JS, Plauschinat C, Wong KS. Oral antidiabetic medication adherence and glycemic control in managed care. Am J Manag Care. 2008;14(2):71-75.
7. Lawrence DB, Ragucci KR, Long LB, Parris BS, Helfer LA. Relationship of oral antihyperglycemic (sulfonylurea or metformin) medication adherence and hemoglobin A1c goal attainment for HMO patients enrolled in a diabetes disease management program. J Manag Care Pharm. 2006;12(6):466-471.
8. Schectman JM, Nadkarni MM, Voss JD. The association between diabetes metabolic control and drug adherence in an indigent population. Diabetes Care. 2002;25(6):1015-1021.
9. Krapek K, King K, Warren SS, et al. Medication adherence and associated hemoglobin A1c in type 2 diabetes. Ann Pharmacother. 2004;38(9):1357-1362.
10. Pladevall M, Williams LK, Potts LA, Divine G, Xi H, Lafata JE. Clinical outcomes and adherence to medications measured by claims data in patients with diabetes. Diabetes Care. 2004;27(12):2800-2805.
11. Stratton IM, Adler AI, Neil HA, et al. Association of glycaemia with macrovascular and microvascular complications of type 2 diabetes (UKPDS 35): prospective observational study. BMJ. 2000;321(7258):405-412.
12. UK Prospective Diabetes Study (UKPDS) Group. Intensive blood-glucose control with sulphonylureas or insulin compared with conventional treatment and risk of complications in patients with type 2 diabetes (UKPDS 33). Lancet. 1998;352(9131):837-853.
13. Selvin E, Marinopoulos S, Berkenblit G, et al. Meta-analysis: glycosylated hemoglobin and cardiovascular disease in diabetes mellitus. Ann Intern Med. 2004;141(6):421-431.
14. Grosse SD, Teutsch SM, Haddix AC. Lessons from cost-effectiveness research for United States public health policy. Annu Rev Public Health. 2007;28:365-391.
15. Health care quality. National Coalition on Health Care Web site. http://www.nchc.org/facts/quality.shtml. Accessed May 18, 2008.
16. Tracking the care of patients with severe chronic illness. The Dartmouth Atlas of Health Care Web site. http://www.dartmouthatlas.org/atlases/2008_Chronic_Care_Atlas.pdf. Accessed May 18, 2008.
17. Kohn LT, Corrigan JM, Donaldson MS, eds. To Err is Human: Building a Safer Health System. Washington, DC: National Academy Press; 2000.
18. Chernew ME, Rosen AB, Fendrick AM. Value-based insurance design. Health Aff (Millwood). 2007;26(2):w195-w203.
19. Mahoney J. Reducing patient drug acquisition costs can lower diabetes health claims. Am J Manag Care. 2005;2(suppl 5):S170-176.
20. Chernew ME, Shah MR, Wegh A, et al. Impact of decreasing copayments on medication adherence within a disease management environment. Health Aff (Millwood). 2008;27(1):103-112.
21. Cranor CW, Bunting BA, Christensen DB. The Asheville project: long-term clinical and economic outcomes of a community pharmacy diabetes care program. J Am Pharm Assoc (Wash). 2003;43(2):173-184.
22. Barnes P, Schiller JS. Early release of selected estimates based on data from the January–June 2006 National Health Interview Survey. National Center for Health Statistics Web site. http://www.cdc.gov/nchs/data/nhis/earlyrelease/200803_14.pdf. Accessed May 18, 2008.
23. Knowler WC, Barrett-Connor E, Fowler SE, et al. Reduction in the incidence of type 2 diabetes with lifestyle intervention or metformin. N Engl J Med. 2002;346(6):393-403.
24. All about diabetes. American Diabetes Association Web site. http://www.diabetes.org/about-diabetes.jsp. Accessed July 9, 2008.
25. Milliman analysis of NHANES 2001-2004. Authors’ data on file.
26. Prescription Drug Benefit Cost and Plan Design Report, 2007 edition. Takeda Pharmaceuticals North America. http://www.pbmi.com/2007report/pdfs/2007_Cost_and_Plan_Design_Report.pdf. Accessed May 18, 2008.
27. American Diabetes Association. Standards of medical care in diabetes-2008. Diabetes Care. 2008;31(suppl 1):S12-S54.
28. American College of Endocrinology consensus statement on guidelines for glycemic control. Endocr Pract. 2002;8(suppl 1):5-11.
29. Merck Manual of Medical Information. Second Home Edition; 2003.
30. Nathan DM, Buse JB, Davidson MB, et al. Management of hyperglycemia in type 2 diabetes: a consensus algorithm for the initiation and adjustment of therapy. Diabetes Care. 2006;29(8):1963-1972.
31. Institute for Clinical Systems Improvement. Diagnosis of management of type 2 diabetes mellitus in adults. 12th ed. Bloomington, MN: ICSI; 2008.
32. Wilding J. Thiazolidinediones, insulin resistance and obesity: finding a balance. Int J Clin Pract. 2006;60(10):1272-1280.
33. Pinelli NR, Cha R, Brown MB, Jaber LA. Addition of thiazolidinedione or exenatide to oral agents in type 2 diabetes: a meta-analysis. Ann Pharmacother. 2008;42(11):1541-1551.


One Pennsylvania Plaza38th F loorNew York, NY 10119 USA
Tel +1 212 279 7166Fax +1 212 629 5657
mi l l iman.com
XPIO-01280