Embed Size (px)
Citation preview

1
VALUE CHAIN ANALYSIS OF PEACH FRUIT IN
KHYBER PAKHTUNKHWA
BY
ADALAT KHAN
DEPARTMENT OF AGRICULTURAL AND APPLIED ECONOMICS
FACULTY OF RURAL SOCIAL SCIENCES
THE UNIVERSITY OF AGRICULTURE,PESHAWAR
KHYBER PAKHTUNKHWA, PAKISTAN
DECEMBER, 2012

2
VALUE CHAIN ANALYSIS OF PEACH FRUIT IN
KHYBER PAKHTUNKHWA
BY
ADALAT KHAN
A thesis submitted to the Department of Agricultural and Applied Economics, The
University of Agriculture, Peshawar Khyber Pakhtunkhwa Pakistan in partial
fulfillment of the requirements for the degree of
DOCTOR OF PHILOSOPY IN AGRICULTURE (AGRICULTURAL& APPLIED ECONOMICS)
DEPARTMENT OF AGRICULTURAL AND APPLIED ECONOMICS FACULTY OF RURAL SOCIAL SCIENCES
THE UNIVERSITY OF AGRICULTURE,PESHAWAR KHYBER PAKHTUNKHWA, PAKISTAN
DECEMBER, 2012

3
VALUE CHAIN ANALYSIS OF PEACH FRUIT IN
KHYBER PAKHTUNKHWA
BY
ADALAT KHAN
A thesis submitted to the Department of Agricultural and Applied Economics, The
University of Agriculture, Peshawar Khyber Pakhtunkhwa Pakistan in partial
fulfillment of the requirements for the degree of
DOCTOR OF PHILOSOPY IN AGRICULTURE (AGRICULTURAL& APPLIED ECONOMICS)
APPROVED BY:
__________________________ Chairman Supervisory Committee
Prof. Dr. Munir Khan
__________________________ Member Dr. Abbassullah Jan Associate Professor
__________________________ Member
Dr. Yousaf Hayat Associate Professor
__________________________ Chairman, & Convener Board of Studies Dr. Abbassullah Jan
Associate Professor
__________________________ Dean, Faculty of Rural Social Sciences
Prof. Dr. Noor. P. Khan
__________________________ Director Advanced Studies & Research
Prof. Dr. Farhatullah

4
DEPARTMENT OF AGRICULTURAL AND APPLIED ECONOMICS FACULTY OF RURAL SOCIAL SCIENCES
THE UNIVERSITY OF AGRICULTURE,PESHAWAR KHYBER PAKHTUNKHWA, PAKISTAN
DECEMBER, 2012 TABLE OF CONTENTS
Chapter No. Title Page No.
List of Tables ...................................................................................... i
List of Appendices ............................................................................. ii
Abbreviation ....................................................................................... iii
Acknowledgments ............................................................................. v
Abstract ............................................................................................... vi
I. INTRODUCTION .................................................................................. 1
1.1 Background ............................................................................... 1
1.2 Categorization of priority constraints ........................................ 3
1.3 Worldwide Peach Fruit Production Scenario .......................... 3
1.4 National & Provincial Scenario of Peach Fruit Production ...... 4
1.5 Contributions to Diet and Human Health.................................. 7
1.6 Problem Statement ................................................................... 9
1.7 Scope and limitation of the study ............................................. 10
1.8 Significance of the study ........................................................... 11
1.9 Objectives of the Study ............................................................. 12
1.10 Format of Thesis ....................................................................... 12
II. REVIEW OF LITERATURE ................................................................. 13
2.1 Value Chains in Fruits & Vegetables ...................................... 13
2.2 Agricultural Production Theory ................................................. 13
2.3 Marketing Theories and Marketing Concept ............................ 13

5
2.3.1 Marketing and Marketing Concept ........................................... 15
2.3.2 Role and responsibility of Fruits Markets and Marketing ......... 16
2.3.3 Marketing efficiency .................................................................. 17
2.3.4 Marketing Channel .................................................................... 18
2.3.5 Marketing Intelligence ............................................................... 18
2.3.6 Classification of Fruits Markets................................................. 18
2.3.6.1 Assembly market in Fruit Industry ........................................... 19
2.3.6.2 Wholesale Market in Fruit Industry.......................................... 19
2.1.5.3 Terminal markets of fruits in Pakistan ..................................... 20
2.4 Review of Experiential Study .................................................... 20
2.4.1 Value Chain Approach in Fruit Production and Marketing... ... 20
2.4.2 Review of Agricultural Production Studies .............................. 24
2.4.2 Cost of Production Research in Pakistan .................................. 24
2.4.3 Use of Production Function on Fruits Orchards ....................... 24
2.4.4 Review of Marketing Studies and their Findings ...................... 24
III. MATERIALS AND METHODS ............................................................ 52
3.1 Description of the Study Area ................................................... 52
3.2 Survey Structures & Data Collection ........................................ 53
3.2.1 Criteria for Selection of Project Area ........................................ 53
3.2.2 Preliminary Data Collection ...................................................... 54
3.2.3 Peach Producers....................................................................... 54
3.2.4 Sampling Plan ........................................................................... 54
3.2.5 Sample Population .................................................................... 55
3.2.6 Distribution of Sample Size in the Study Area ......................... 56
3.2.7 Interview Schedule Development ............................................. 57

6
3.3 Model Specification and Estimation ......................................... 58
3.3.1 Production Theory ..................................................................... 58
3.3.2 Estimation of Profitability and Investment Return .................... 59
3.3.3 Analytical Frame Work for Production & Marketing Cost ........ 59
3.3.4 The Effect of Quality on Peach Price ....................................... 60
IV. RESULT AND DISCUSSION .............................................................. 62
4. 1 Socio- economic Characteristics of sampled Peach .............. 62
4.1.1 Age and Education level of the Respondents in the study ...... 62
4.1.2 Prominent Peach varieties in the study area ........................... 63
4.1.3 Education level and Peach Production .................................... 64
4.1.4 Land holding and Peach Production ........................................ 65
4.1.5 Peach orchard size, its frequency distribution and mean ........ 66
4.2.1 Average quantity of farm yard manure per acre use in .......... 67
4.2.2 Average number of labour per acre use for farm yard............. 68
4.2.3 Average number of labour per acre use for hoeing ................. 68
4.2.4 Average number of labour per acre use for hoeing ................. 69
4.2.5 Average number of skillful labour use per acre ....................... 69
4.2.6 Use of chemical fertilizers in peach orchards .......................... 70
4.2.7 Labour used for applying chemical fertilizers in peach ............ 70
4.2.8 Use of chemical pesticides in peach orchards in the study ..... 71
4.2.9 Use and number of skillful labours for pesticide spray ............ 71
4.2.10 Use and number of un-skilled Labours for irrigation ................ 72
4.3.1 Average peach variety wise production per acre ..................... 74
4.3.2. Average price of different peach varieties ................................ 75
4.4.1 Average sale price at different national markets...................... 76

7
4.4. 2 Total marketing cost of different peach varieties ..................... 77
4.4.3 Average sale share of peach in different markets ................... 78
4.4.4 Average peach production cost in per acre in study area ....... 79
4.4.5 Average peach marketing cost in per acre in study area ........ 80
4.5.1 Average Revenue per acre from different Peach varieties...... 80
4.6 Value Chain Analysis…………………………………………….82
4.6.1 Value chain map of Peach fruit in Study area…………………82
4.6.2 Actors and their role in the Peach Value Chain………………82
4.6.3 Supporting actors ………………………………..………………87
4.6.4 Marketing Channel in the study area………………………..….87
4.7 Market margins and marketing efficiency ………………………87
4.8 Major constraints in production and marketing ........................ 89
4.9 Quality attributes and price per carton relationship of peach .. 90
4.9.1 Average price of Red, Green, White colour Peaches .............. 90
4.9.2 Average price of Big, Medium and Small sizes Peach ........... 91
4.9.3 Average price of Early, Medium, and Late Peach varieties..... 91
4.9.4 Average price of Sweet, and Sour quality Peaches ................ 91
4.9.5 Average price of Hard, and Soft quality Peaches ................... 92
4.10 Estimation of Econometric Models ........................................... 93
4.10.1 Variables used in Econometrics Model .................................... 93
4.10.2 The effect of quality attributes on Peach Price ........................ 98
4.10.2.1 Dummy Variable Multiple Regression Model ....................... 99
4.11 Different forms of Value Additions ................................................................................................... 104

8
4.12 Strengths, Weaknesses, Opportunities&Threats Analysis ................................................................................................... 10
5
4.13 Peach growers and Buyers Relationship in the Study Area ................................................................................................... 10
6
V. SUMMARY, CONCLUSION AND RECOMMENDATIONS .............................................................................................................. 108
5.1 Summary ................................................................................................... 108
5.2 Conclusion ................................................................................................... 110
5.3 Recommendations
................................................................................................... 111
5.4 Future implication
................................................................................................... 112
LITERATURE CITED ................................................................................................... 11
3
APPENDICES ................................................................................................... 13
9
INTERVIEW SCHEDULE ................................................................................................... 14
7
VALUE CHAIN ANALYSIS OF PEACH FRUIT IN
KHYBER PAKHTUNKHWA
Adalat Khan and Prof. Dr. Munir Khan Department of Agricultural and Applied Economics
Faculty of Rural Social Sciences University of Agriculture
Peshawar Khyber Pakhtunkhwa Pakistan

9
December 2012
ACKNOWLEDGEMENTS
I express my deepest sense of gratitude to Almighty ALLAH who
enabled me to gather all my potentials and abilities for the completion of this
research study, and to contribute to the noble field of knowledge.
I am deeply indebted of Prof. Dr. Munir Khan’s efforts as major
supervisor in my Ph.D study. His continual encouragement, liberality of time
and valuable guidance in completion of this study are gratefully
acknowledged.
Heartful thanks are extended to Prof. Dr. Noor P. Khan Dean, Faculty
of Rural Social Sciences, The University of Agriculture, Peshawar, Associate
Dr. Abbasullah Jan, Chairman Department of Agriculture and Applied
Economics, The University of Agriculture, Peshawar Khyber Pakhtunkhwa for
their sincere cooperation and valuable suggestions during this research
study.
I am extremely appreciative of Dr. Dawood Jan Director IBM, Dr.
Zahoor ul Haq Chairman Management Sciences Abdul Wali Khan University
Mardan, Dr. Yousaf Hayat, Associate Professor, Dr. Ghaffar Ali, Assistant
Prof. Dr. Shahid Ali, Assistant Prof. Dr. Mohammad Fayaz Assistant Prof. Dr.
Khurram Nawaz Sadozai and other faculty members for their timely help,
suggestions and guidance.
Sincere thanks are due to all my Department fellows and Mr. Rizwan
Ahmad Director Planning & Development, The University of Agriculture,
Peshawar Khyber Pakhtunkhwa for their valuable guidance, encouragement
and moral support throughout my research study.

10
I also express my highest regards to my respectable and loving
parents, brothers and my wife and other family members for their prayers,
good wishes and everlasting encouragement and support during my study.
ADALAT KHAN
ABSTRACT
The current research study was conducted to examine the value chain of peach fruit in two districts of Khyber Pakhtunkhwa namely Swat and Buner during 2010-11,which are the leading peach producing areas of the country
supplying seventy (70%) of the total produce to all the major country markets in the country i.e. Peshawar, Rawalpindi, Lahore Gujranwala, Faisal Abad and Karachi. The main objectives of the study were to estimate the production
costs and profitability in Peach Value Chain to point out the key factors affecting peach production, to identify the value chain actors in the study area, to calculate the marketing costs and to identify the efficient marketing channel and to present some recommendations.
The study was confined to six (6) villages from both districts Swat and Buner due to limited resources and time constraint and these were selected due to more peach varieties, sufficient numbers of peach plants, number of actual
farmers and fruit plant owners. The data regarding peach fruit value chain for the year 2010-11 was collected through well-planned questioners from three hundred (300) randomly selected peach growers and local traders in these
two districts of Khyber Pakhtunkhwa. The analytical tools were used like polynomial regression model, production and marketing costs, CBR and SWOT analysis for peach crop.
In value chain study, production and marketing were important stages among
others. The average peach production cost per hectare was Rs. 81,367, where in the factors of production in the chain were green manure, different chemical fertilizers, various pesticides and employing of daily wage labour for
application of FYM, fertilizers, pesticides and irrigation. Another important step of the chain was marketing and its average cost was Rs.228,985 per hectare. Some of the elements of marketing cost were purchase of cartons, labour
charges of picking and packing fruit, decoration materials, transportation, loading, unloading and market charges or commission fee. The average net profit from peach orchard was Rs. 308,406 per hectare during 2010-11 while
the gross income was Rs.618,760 per hectare. There were some early, mid and late season peach varieties, Carmen and
Early grand being the early season peach varieties have fetched highest prices of Rs. 34750and Rs.33750per ton in the value chain. The peach fruit was marketed to major markets namely Peshawar, Rawalpindi, Lahore,
Gujranwala, Faisal Abad and Karachi. The price of the fruit at Gujranwala was Rs. 36500 per ton being the highest of the markets followed by Rs. 35250 per ton at Faisal Abad. The Sohani peach variety got Rs. 835683 per hectare
highest average gross income among all other varieties. The marketing

11
efficiency was calculated 2.7, which is greater than one and showed the marketing efficiency of peach fruit in the value chain.
In the study, some of the important value chain players were identified like agriculture inputs suppliers, peach producers, brokers, wholesalers, retailers,
transporters and exporters.
The study also highlighted the significant relationship between price and quality attributes namely size, colour, varieties, taste and firmness of the fruit.
It was identified in the study that the peaches having red colour, big size and firmness received maximum price. There were some big problems like High costs of Agri. Inputs, Lack of financial resources, Perishable nature of
Product, High transportation cost, Pests and natural calamity attack problem, Price fluctuation in markets and Lack of market information system.
Some of the recommendations and suggestions for the problems faced by the growers in the study area as well as others supply chains in Pakistan were
regulation of agricultural inputs supplier markets for price stabilization, access to loans and market information be supplied, contribution and adoption of technology, post-harvest losses be minimized and crop insurance schemes
may be started, capacity building programs for growers should be enhanced, scaling up of successful value chains, institutional and infrastructural facilities to the development of value chains in agriculture should be assessed,
preparation of comprehensive policy and strategy for the promotion of export and agro based industries for making peach and other fruit more profitable value chain in the project area as well as in Pakistan.

12
I. INTRODUCTION
1.1 Background
The idea of value chain was first suggested by Michal Porter in 1985. A
value chain is series of activities performed by the operating firm in a specific
industry, in order to produce or deliver a valuable product or service for the
consumer market. In the mid-1980s, Porter evolved the idea of the value
chain during his study of competitive advantage (Porter 1985). He explained
his idea about the value chain in analyzing different target activities in some
firms or companies which can create or increase the worth of any product by
arranging their activities or steps into value-added. Porter characterized two
significant activities leading to value-addition of an organization, which were
primary activities (inbound logistics, operations, outbound logistics, marketing,
and sales) and secondary support activities (strategic planning, human
resource management, technology development, and procurement) (Porter
1985). However, the value chain approach of Porter is confined to the firm
level overlooking the investigation of up-or downstream activities beyond the
company.
Most areas of Pakistan are gifted with environmentally suitable for
agricultural activities and have great favorable condition for cultivation of
approximately thirty kinds of various fresh fruits which includes Citrus, Mango,
Apple, Peaches Dates, Melons, Banana and Guava etc. which are relatively
more common.

13
The Peach value chain analysis may be considered is series of actions
during fruit production and marketing, passing through the steps of the chain,
due which the product receive some additional worth.
Peaches are one of the most significant deciduous fruit grown in
Khyber Pakhtunkhwa, considering the total fruit production, fetching income to
the growers, employment creation in the growing area and most importantly
boosting and linkage development with the related agro based industries.
The low level of growth in fruit production in general and peach fruit
production in particular shows that the benefits for the growers to increase
produce which is less. Peach fruit export and processing industries (i.e. fresh
fruit processing and juice making) must to be stimulated addressing this
domestic incentive issue. Second, the fresh peach fruit is available at very
low- prices in Pakistan and this shows a potential for attracting huge
investment in the fruit/ peach export industry. Third, good and efficient
management of the post-harvest losses can also make possible the use of
fruit damaged due to mishandling in picking, packing, and transportation
losses. Hence, there is great opportunity for income and employment
generation both at farm and industry levels as well as for the supply of human
nutrition.
Aggregate exports of agricultural products i.e. fruits, vegetables and
other crops and Pakistan’s agricultural policy has one of the main objectives
to reduce the import bill of agro- based products. There are many openings
and challenges for farmers and farming communities in Pakistan who can
take benefits from World Trade Organization (WTO) and its Agreement on
Agriculture. Quality fruit production and then its marketing under some criteria
and prerequisites have become very difficult in the world trade. Pakistan’s all
stack holder including farmers, traders, exporters and policy makers should
look in to account the conditions and prepare themselves for coming
challenges and competition in world agriculture markets and bring major
changes for developments and enhancement of all relevant agriculture sub
sectors. Therefore serious and doable struggles are required to compete in
world markets by adopting rationalize cost of production of horticultural

14
products and their marketing strategies for achieving the desirable goals and
income.
The Pakistan region varied land structures, climates and soil textures,
which are favorable for the extended list of various fruits and vegetables.
There is a reasonable change noticed in export revenue from fruits and
vegetables in few years. Horticultural sectors have the ability to absorb large
population, improve their income, reduce poverty and stable the economy
condition of the country (Alam and Mujtaba 2002).
The Peach farms need sufficient funds at initial time and up to the last
and well taught considerations may make the business more profitable and
prosperous in the coming days (Marini, 1997).
1.2 Categorization of priority constraints in Peach Value chain
There are many constraints in the peach value chain in the study area, which
are given below.
1. Input supply
2. Production in field
3. Processing
4. Marketing
5. Finance
Among the above, the most important two peach value chain constraints
Production and Marketing were identified and selected for further
investigations in the study area.
1.3 Worldwide Peach Fruit Production Scenario
World Peach and Nectarines production is about 15,561,206 MT or 34
billion pounds. Peaches and nectarines are grown and produced on large
scale in 71 Countries worldwide on about 1.4 million Hectares. China is the
leading Asian country producing 44% of world Peach Fruit Production,
followed by Italy 13%, USA 10%, Spain 8%, and Greece 7%.(Appendix A1).
Fruit production of thousand Fruit plant varieties and species are grown all

15
over the world. Peach and Nectarine are among these most vital fruit group
both area and production wise.
World production has rose sixty percent (60%) for the last ten years. It
is estimated in the year 2011-12 that world peaches and nectarines
production will be more than ten percent as compared to the year 2010-11.
This increase is mainly due to the additional number of peach trees as well as
quality and quantity of peach production. Currently China the leading peach
production followed by European Union and the United States. Russia
Republic is the leading market for peaches and nectarines for the last five
years. (Appendix-8)
1.4 National and Provincial Scenario of Peach Fruit Production
Pakistan has significant benefits for cultivating fruit and vegetable,
being an agrarian country based on purely agriculture and related sectors.
Different kinds of fruits, vegetables, flowers and many ornamental plants are
grown in our country. The horticultural sector has showed outstanding growth
in the last few years (Pakistan Horticultural Export Development Board).
Agriculture plays an important role in Pakistan economy, which may be
measured the second mainstay of the country’s economy, with support of
around 21 percent to GDP. This sector gives employment to nearly 45 percent
labour force. Nearly 62 percent of population is said to be residing in rural
areas and get their livelihood from farming and its linked enterprises. The
information so far collected shows that the agriculture sector was not
exploited up to its maximum level. The agriculture sector in Pakistan is a
major contributor of raw resources to other important sectors of the economy
and hence leading to enhanced exports, foreign exchange. Industrial sector
like manufacturing of pesticides, chemical fertilizers, card boards, agricultural
machinery etc are getting support from agriculture sector.(Economic Survey of
Pakistan, 2010).
Peaches and Nectarines in Pakistan are grown on 15800 Hectares and
the share of provinces is 9500 hectares in Baluchistan, 6200 Hectares in

16
Khyber Pakhtunkhwa and 100 Hectares in Punjab respectively, while the
Peach production in tons is 83700 tons and the share of provinces is 25400
tons, 57800 tons, 500 tons respectively. The yield (9.3 Tons) per Hectare in
Khyber Pakhtunkhwa is the highest among all provinces which is followed by
Punjab (5 Tons) and Baluchistan (2.6 Tons) respectively. (Appendix A-4)
The total fruit production in Pakistan was 6633210 tons in 2004-05. In
Khyber Pakhtunkhwa, it was 509690 tons 2004-05 which made up about 7.68
%of total fruit production in Pakistan. The average yield per hectare of fruits at
National Level in 2004-05 was 8.33 tons/hectare whereas in 2004-5 Khyber
Pakhtunkhwa yield was 11.05 tones /hectare which were the highest among
the provinces. The farmers in Pakistan have the potential for enough
production of all types of fruits and vegetables for their own consumption but
can supply abundant quantity to the local market as well. The Government
may start some sound initiatives for sending abroad these excessive amounts
of horticultural products and get maximum revenue for the country.(Hasan,
1994)
Khyber Pakhtunkhwa has also a unique distinction of highly diversified
agro-climatic zones comprising of plains, hills and mix, capable of producing
varieties of crops, fruit and vegetables, floriculture and medicinal herbs, which
is quite rare in other parts of the country: There is a great scope for value
addition of fruit and vegetables crops and their products i.e. Jams, Marmalade
and Squashes etc., and this may fetch large amount of foreign exchange in
old and new explored international markets compare to the current position of
getting less. This objective may be achieved by adopting best cultural
practices in the orchards/ fields, highlighting of agricultural yields and
byproduct industry through value addition, processing, careful picking,
packing, grading, new and latest packaging and marketing practices.
Khyber Pakhtunkhwa has wide and different agro-climatic conditions
i.e. tropical, subtropical, warm temperate and temperate regions and the
province is famous for different and wide range of fruits. The prominent fruit
crops among all are Apple, Peaches, Apricot, Plum, Persimmon, Pears,
Citrus, Guava and Dates etc. having vast production and local consumption

17
as well as exports. The region has equally geographically and strategically
significant to increase its different fresh fruit produce distributes to old markets
like Gulf states, Afghanistan, Iran, and the new and developing markets like
China, Central Asian states together with the extremely viable but profitable
markets of Europe and Far East. The fruit production’s sector due to its cash
crop nature and value addition with the purpose to produce, improve labour
engagement and enhance earnings level particularly in remote and poor
areas that will ultimately lead to poverty decrease.
There are many fruits produced in Khyber Pakhtunkhwa, peaches are
among the few. It has been observed that the area and production of this fruit
is enhancing for the last some years. The only reason behind its more area
and production is cash crop value, planting of new and best quality peach
varieties, long fruit period, adaptation with the season, sufficient water
available resources, technical manpower and experts etc in the districts. Area
under peach was enhanced from1300 hectares in 1999-2000 to 6200
hectares in 2008-09.
Swat and Buner districts are bestowed with varied natural resource and
have the ability to grow and produce diversely early and perennial fruit crops.
There is one river named river Swat and canal in Buner, besides sufficient
land and water resources which suggest great scope for the construction and
development of irrigation channels etc. in Swat and Buner. Various fruit
production in the study area is mostly for local and national markets. The fruit
production is much split and uncoordinated and large number of producers
have one or similar kind of fruit crop causing surplus supply in harvest time
mainly mid-season peach varieties.
As evident from the statistics of Khyber Pakhtunkhwa Table 1.1, there
are different varieties of Peaches are grown and have 6200 Hectares area
under cultivation. District Swat has 3750hectares area under Peaches
followed by Mardan 374 hectares, Haripur 119 hectares and Buner 110
hectares respectively. Similarly District Swat is the highest leading Peach
producing district in the Province with total production 17625 Tones.

18
Table 1.1Peach Areas and Production in Khyber Pakhtunkhwa
Name of District Area in Hectare Production in Tons
Swat 3750 17625
Mardan 374 3617
Haripur 119 1018
Buner 110 1066
Upper Dir 99 891
Peshawar 81 930
Nowshera 75 750
Charsada 63 679
Government of Khyber Pakhtunkhwa 2009-10
Major Peach orchards are situated in the Northern part of the Province
particularly District Swat, Buner and Malakand etc. The central parts of the
province namely Mardan, Charsadda and Peshawar have also some peach
orchards. There are also some limiting factors in respect to some known fruits
of the province.
The large area spread has made many issues in production,
transportation and post-harvest losses, marketing costs, making many
farmers to sell their orchards prior fruit set to avoid any further loss in case of
some diseases or any natural calamity occurrence.
1.5 Contributions to Diet and human health
The significance of fruits in human diets is famous and needed. They
are giving basic nutrients to the human which are needed for our body. These
crops provide various mineral and vitamins, jobs creations, food insurance to

19
the people of the country. These crops also decorate the table but also enrich
our health. The intake of fruits may help in minimizing nutrient deficiency and
other under nutrient issues like night blindness, anemia, goiter and scabies
etc. of poor and resource less communities. Peaches and Nectarines have
important dietary value per 100 gram of edible portion; the content materials
contain Water 89%, Calories 38%, Protein 0.6%, Carbohydrates 10%, Vitamin
A 27% and Vitamin C 15.6%. (Appendix A-6)
Peaches and Nectarines can be used fresh and in many juices, cakes
etc. They are also for various kinds of jams, jelly, marmalades and with
combination of different fruits. Fresh fruits give sufficient number of vitamins.
Nectarines having double vitamin A, little more vitamin C and high amount of
Potassium as compare to peaches (Gao, 1998).The fruit plants growers
normally think of the prices of initial materials for carrying the successful
cultural practices in the orchard management. The price of these materials
may be divided into varying and fixed costs.
The first category which is variable cost contain of fertilizers,
pesticides, daily wage persons, agricultural equipments, FYM, markup ratio,
card boards, transportation, commission at markets etc. The second category
fixed costs measure markup rate on investment, losses in resources value,
clearing the routine bills, store for stocks and tools, buying and taking care of
farm machinery and other assets including portable and non-portable.
In successful fruit orchard farming, it is believed that the production and
marketing activities need to be performed efficiently. Efficient marketing
satisfies the producers and consumers alike and both the parties fetch a good
deal of income. According to Lashari et.al (1995) production is first half of the
job and marketing is the other half of any economic activity. Often increased
production is upset by poor marketing system i.e., production and marketing
go hand in hand. In addition, farmers always hesitate in spending additional
finances involved in the adoption of modern production technology unless
they are assured of stable market prices.

20
Selling in Pakistan of agricultural yields and fruits changes from time to
time, venue to venue and item to item and these have been categorized by
the availability of large number of middlemen acting at many supply stages,
and in this way increasing selling expenditures and rightly influence the price
obtained by the fruit growers and compensated by the end user. (Hamid and
Walter,1990). A usual marketing chain has different kind contact buyers
(including harvesting contractors in fruits and local traders), commission
agents, wholesalers and retailers. Marketing of peach fruit is carried out
exclusively by farmers themselves, private organizations like commission
agents in various parts of study area and individuals. It is generally fact that
the peach fruit is extremely fragile in its nature. The distinction of peach fruit
starts spoiling at the time of picking to last shifting to markets and selling to
consumers.
The overall supply and marketing process needs to be speed up
towards quickly disposal. Normally, the farmer’s share in consumers’
expenditure is not only low, but also varies according to the product
perishability and the level of middlemen understanding among them.(Iqbal,
1989). In fact, the government is considering the sole responsibility of private
sector supply, distribution and export of horticultural products. The distribution
channel is very much different from straight sale to end-users to difficult
selling place comprising growers, seasonal purchasers, institutional rate at
market, big sellers, small sellers and exporters.
The supply network is often additional complex when the big sellers
sell to second big sellers or a graders and small seller to second small seller
and hence making less competition in the marketing system. In general, a
farmer has either no or very less negotiating powers and thus his part in small
scale price is less as well as changing to the products, their softness and the
level of agreement amongst the middlemen in market.(Khushk and Smith,
1996).
1.6 Problem statement

21
Value Chain of Peach fruit explain the production at farm gate or field
this is distributed in local market and down country markets i.e. Peshawar,
Rawal Pindi, Lahore and Karachi etc. These marketed quantities of various
Peaches are further distributed through commission agent in these markets to
whole sellers and retailers. The retailers are mostly forward major portion of
these quantities to the end users. Some quantities of these fruits are also
exported to Gulf and other countries through either whole sellers or big
commission agents present in central or big markets like Rawalpindi, Lahore
and Peshawar etc. From down country markets, some quantities are going to
the processing plants for Juices, Jams Marmalade etc. in the last these
products from all sources either direct or indirect are marketed to the end
user/ consumer.
Peach producer are suffered due to weak after picking management
practices, exposing to major damages, and loses significant share in coming
income to the producers as well as to other players including exporters in the
markets. Moreover, producers have either no or very capacity of fruit storage
at their field level and area, and in this way they are compelled to sell their
peach fruit directly after harvest. There is no system of jointly bargaining for
price increase, and each producer links himself with the commission agents or
trader and other buyers, and thus often receiving prices very less of the
optimal market prices. Secondly at the marketing stage, there is a main
problem of weakly poorly established carrying arrangements, like bumpy and
weak farm to markets roads serving the fruit orchards growers where more
post-harvest losses occurred and leading to deterioration of quality fruit and
fetching less selling prices.
Peach value chain has some problems which have limited the potential
gains from the current openings. Peach value chain has been not studied in
the study area being an interesting and important process tool. Usually the
producer and seller do not play any collective role in the study. Also there are
no processing activities. Keeping in mind the current scenario, a study which
could focus the production, marketing chain and the responsibilities of

22
important actors and put forward some concrete recommendations for
improvement in current system as well as in future.
1.7 Scope and Limitations of the Study
It is generally believed that researcher starts research or study on
some basic problems which need further exploration. For this purpose all
researcher keep in mind the objectives of the study and starts efforts for the
solution of the problems through framing theory. In the research work, the
scientist explains all those observations, data or information which are left
with no explanation and conclusions. Similarly first the issue or problem in
hand is elaborated and concept about the problem is cleared. This section
starts with the significance of the research issue accordance to the objectives
of the study. It is general concept of the peach farmers that the yield per unit
hectare is comparatively low to the advance, economically sound countries.
Some constraining forces can affect the income generation opportunities of
these orchards growers. These may be the farm produce, income and profits
of the fruit farmers. Similarly some of key indicators like acreage of orchard,
seasonal suitability, and place of marketing can influence the income of
producing peaches. (Khuda Bakhsh, 2006).
Research on studying the production system of the enterprise are very
common and popular while very few studies are under taken to study the
marketing system in Pakistan in general and in Khyber Pakhtunkhwa in
particular. It is now become increasingly accepted that for farmers to enhance
peach production, and to fetch highest returns by the farmers, suitable
attention is needed by the key players. To study the several marketing
functions performed by various agencies regarding selected fruits (citrus,
apple, peaches, persimmon, plum, guava and dates) produce in Khyber
Pakhtunkhwa, the project in hand is developed. Though, the study is
restricted only to two districts mainly to the financial and time constraints.
1.8 Significance of the Study
The current study has produced and highlighted some useful and
important information in order to frame fruit production and marketing

23
development projects and recommendations for future interventions
particularly Peaches and Apple that will improve the socio economic condition
of the orchard growers and efficiency of fruit production and marketing
system. The possible users of the study findings may be orchard growers
(producers), researchers, businessmen, government line departments and
non-government organizations, which might have interest in improving the
fruit production and marketing system. Anyone who wants to explore the fruit
production, marketing, their costs, and key players in value chain can benefit
from the findings of this study.
1.9 Objectives of the Study
1. To calculate the production costs and profitability in Peach Value Chain
2. To estimate the marketing costs and to identify the efficient marketing
channel in Peach Value Chain.
3. To identify important value chain players and their role
4. To identify the strengths, weaknesses, opportunities and threats
(SWOT) for analysis in peach value chain.
5. To present some recommendations for policy makers and others key
players in the value chain.
1.10 Format of the Thesis
The present thesis is further outlined into following five chapters.
Chapter- I is allotted to the basic introduction wherein the significance of the
research work is summarized. Chapter-II handles with the review of literature.
The third Chapter contains universe of the study and research methodology.
The results and discussion of the findings are elaborated in chapter- IV. The
Summary, Conclusions and Recommendations are presented in chapter-V.
Appendices and Interview schedule are annexed at the end.

24
II. REVIEW OF LITERATURE
This chapter has two major portions. First portion presents the basic
theory about the study (i.e. Explanations and ideas used) and second
contains the previous work and studies related to fruit production in general
and Peach fruit in particular and local costs of marketing of all fruit produce.
2.1. Value Chains in Fruits & Vegetables
Fruits and Vegetables production are considered significant sectors and have
gained importance in farming growth in Pakistan. Since ten to fifteen years,
the horticultural part of the agriculture has been continuously gaining
importance mainly due to multidisciplinary activities. This sector is giving
much needed strength to farming part by enhancing the business
opportunities, revenue and job creation etc. The main portions are fruit
production, vegetable cultivation, flowers rising, ornamental plants, spices
cultivation, medicinal and aromatic plants and these are nearly contribute
21per cent to the economy of Pakistan.
Fruits, vegetables, flowers, plantation crops, spice, and medicinal & aromatic
plants contribute over 21. Pakistan is considered among the few leading fruit
and vegetables producing countries, while very meager part (2-3%) of the
produce is converted to quality and preferred shape and the post-harvest
damages of fruit and vegetables may exceed upto (25-30%). There are some
limiting factors like lower production, huge after picking damages, non-

25
availability of cool trucks or transportation facility and ineffective marketing
channel. Sustainable progress of horticultural farming may be obtained by
effective and advance value chain for considerable profit of all key players in
chain.
2.2. Agricultural Production Theory
The production analysis of agriculture is an integral part of agricultural
development policy because it has an important position in many developing
countries (Yotopoulos and Lau, 1979). The policy maker and reviewer require
data about farm production, its responses to raw materials and cultural
practices so as to initiate measures for the achievements of desired short and
long term goals. The purpose of study is to explore how Peach fruit production
is responsive to its inputs and to gain knowledge about magnitude or level.
When it is established, thus effective agricultural inputs usage in horticultural
crops or fruits may be ensured.
Production function in agricultural production concepts is very vital and
primary in nature. This describes the association between agricultural inputs
and produce keeping in mind that highest produce will be obtained from
mixing of these two factors in the presence of available technology, hence
realizing a priori technical efficiency. Mathematically, a production function is
expressed in various ways such as,
),( ZXfY (2.1)
Where (.)f exhibits the form of rules of production technology. In these
equations, XY , and Z are vectors (or matrices) of non-negative output(s),
variable and fixed inputs respectively. The production function or
technology restricts the possibility of negative output or input levels.
The Variable agricultural inputs may be increased or decreased
according to income increase in the short period while the fixed agricultural
inputs may not be adjustable in the long run.

26
In order to it simple, the mathematical expression can be explained as
below.
)(XfY .
There are three approaches to explain the production technology,
which are production function, profit function and cost function. They can
show us how revenue and profit may be maximized and duality concept gives
relationship among the three methods.
The primary method persisted very popular in empirical research until
the 1970s. The most regularly used functional form was Cobb-Douglas,
elasticity of constant Substitution (ECS) and Leontief. When it was first starts
in 1928 to 1950, it was very common condition in both form of analysis. It is
very simple and known for its easy calculations and explanations.
The other functional form is known as flexible functional forms and
generalizations of the Cobb- Douglas were introduced in 1960s and early
1970s.
2.3 Marketing Theories and Basic Concepts
2.3.1 Marketing and Marketing concepts
Market: The place where buying and selling of a product can take place freely
and no internal or external influence is applied. The idea of transfer and
dealings of any good or service may forward the notion of selling and buying
place. This is the combination of current seller and expected buyer of a good.
It can be stated a place where modest activities take place to interchange a
good for other.(Bain and Howells, 1988).The best apparent characters of
selling and buying place are to be price and interchange of products; it may
not be physical venue. There is no requirement for meeting in person in place
where selling and buying take place during the current technological and
informative period.

27
Marketing theory: In economics, Marketing can be defined in different
forms. The Kohls and Uhls (1980) have defined marketing in a very simple
and proper context. According to them marketing means the chain of actions
or activities necessary in the form of goods and services required for the
fulfillment of market needs through good quality production and the pass on of
finished item from its initial place to the consumer’s hand. The agricultural
markets channel usually presents the transfer of farm products from its
original place to the end user or companies.
The given process contain initial product dealing, proper picking and
packing, lowering post-harvest losses, adoption of ideal grading and quality
measures to satisfy the end user needs throughout the seasons and made the
process of transfer easy. Agricultural raw materials can also be marketed in
the said markets
The responsibilities of agricultural markets are very much important for
the steps involved in the betterment of rural and urban economy of any
country whether it is poor or rich (Holton, 1953). Ducker (19580 presented
that development can be achieved through forming criterions and principals
and thus helping business related attitudes. Bartels (1986) reflected the end
user behavior and approaches which are to be transformed through marketing
skill and practices. Some of fresh market knowledge or information about best
produce can be shared with the consumers and thus can increase his
expectation, level of demand through improvement and adoption of quality
packing and packaging materials. The fruit producers are enforced to ready
for the competition in the local as well as in international markets. High
quality products have very positive and incremental on the consumers.
Previously some of the economist have tried their best to aware the producers
and traders about the need of consumers, market mechanism and players
involved in the process. The Adam Smith (1976) known as the founder
development economics and stated in his book named the “Wealth of Nation”
the concept of labour division and taught the ideas of labour competencies
development, the strength of large production, and the capability of
interchange the produce and thus to formulate the importance of wealth for

28
easy transfer. The idea has further expanded the scope of economic events
like product handling, processing, ideal packing, suitable storage, transport
facilities, credits and promotions. Public promotions are the heart of sale and
trading.
2.3.2 Role and Responsibility of fruits Markets and Marketing
Agricultural marketing:
Many economists have explained the meaning of marketing in a very
diverse ways. Various groups of interaction like growers, businessmen and
end users take meaning of agricultural marketing in their own way.(Kohls and
Uhl, 1985).
Agricultural Marketing may be defined as the carrying of different
actions in moving any agriculture product or services from farm to the end
users for consumption purposes.(Kohls and Uhl, 1985; Bain and Howells,
1988). Kotler and Armstrong (2003), explained agricultural marketing actions
through group of people where they desire for production, presenting, selling,
buying and easily interchanging their goods and services to other fellows. It is
combination of various practices like agriculture, industry and infrastructure
etc. (Backman and Davidson, 1962).
Markets and Marketing are very vital parts of financial development to
incorporate, organize and activate financial events (Drucker, 1958). Galbraith
and Holton (1956) have connected some marketing activities with the
development instrument, while Abbott (1968) pointed out that proper
consideration should be given to buying and sales at an earlier point
considering the significance of physical assets in the form of farm machinery,
price of agricultural inputs and market information. Bateman (1976) placed
much stress on examining the type of market mechanism and activities. New
findings have in fruit marketing untied fresh opening mostly for agricultural
oriented companies and sectors and this kind of research is recognized as
“market base investigation”.

29
Bain (1968) devoted greater significance to the market based findings
and evaluation. The organization- behavior- presentation procedures have
been outlined to observe and examine all types of actions linked to market
actions, while Scarborough and Kydd (1992) focused on practical
associations between firms. Moreover they described final work as structure,
conduct and performance in the buying and selling places. There are some
fundamentals in the markets which are place for buying and selling, how free
and independent trading takes place and how price of a product move around
(Bain, 1968). The behavior of any market or firm can be assessed through
finding that how price is fixed or the expenditure made on the product publicity
and the relationship between buyers and sellers. Hence these lead to better
environment in the form of interface and best harmonization among the
people involved in the market.
The governments in the emerging nations and their planners have
realized the importance of agricultural products and their marketing as these
are necessary for the improvement of living standard of the nation (Kanyak,
1986; Kazgan, 1988). Effective and rationalize utilization of rare means is the
leading step towards achievement in holding the local and abroad market
places.
Timmer et al. (1993) has defined three marketing characteristics i.e.
marketing role, markets place and price establishment and recommended that
the appropriate and well time utilization of these would give maximum
outcomes. It is very for any entrepreneur to arrive in a place where buying and
selling take place without knowing the exact knowledge and data.
2.3.3 Marketing efficiency
This may be defined as the effective provision of all assets to acquire
maximum contentment of the end users.(Raymon, 2003).Scarborough and
Kydd (1992) have elaborated the term efficiency of all assets employed in
agricultural marketing in relation to raw materials and final product. Efficiency
of an organization or market can be judged from the more production in
relation to raw material used in a specific place and limitations and
continuously reduces ratio of input to output. The efficiency of any Agricultural

30
marketing can be found out through different procedures, where these are
prominent among others namely operational efficiency and pricing efficiency
(Jesse, 1987).
2.3.4 Marketing Channel
This is an arrangement of linked firms where a good from production
stage flows and reaches to the consumer being the end point. (Kotler and
Armstong, 2003).It is examined to exactly know the moving of products from
the farm location to the end users. The information may be obtained by
investigating the persons involved in the processes who took part in the actual
practices for getting maximum revenue.(Getachew, 2002).The type and
quality of a good which is to sold or bought, the existing facilities in the
market, the current societal and surrounding situation may decide the size of
this marketing network. (Islam et al., 2001).
2.3.5 Marketing Intelligence
Competitiveness of peach fruit may be explained as the competency of
an organization to offer high quality products to its end users and maximum
returns to the players in the value chain. The main reason for continuously
remaining on reasonable stage in production would be the efficiently use of
labour force, assets and natural means. The peach produced in the study
area is known in whole Pakistan due to its quality and attributes. Some of the
quantity is also exported to Middle East and Afghanistan.
2.3.6 Classification of Fruits Markets
Usually Markets are those places where buyers and sellers enter freely
and trade transaction take place and product and services are transferred
from person to another. During the process some activities are varied in
types, degrees resembling time period, site and organization etc. Markets are
divided according to venue and kind of business interventions.
2.3.6.1 Assembly market in fruit industry
Those markets which are located near to farm or field and growers
bring excess part of their produce for selling. Shopkeeper, local middlemen,

31
businessmen and hawkers come to buy the goods in these markets.
Maximum of the dealings take place in meager units of farm products. Usually
business in such kind of market is allowed by the controlling authority,
however trade is carried and some charges are paid by the sellers and
buyers. There is no proper book keeping in organized way. Price fixation is
normally done through face to face contact and talks between farmers and
buyers. The amount of produce is so less, that is why the farmer is not in a
position to influence price. But in case of bigger amount of produce, the
growers would like to go the large markets or will made efforts to sell the
produce not less the bigger market place. Now days the producers are
satisfied and happy to transfer their excess produce to bigger markets by
roads as the conditions of link roads have been improved.
2.3.6.2 Wholesale Market in fruit industry
These markets are mostly positioned in the central place of either
district or tehsil. Excess produce of fruits and vegetables are brought to these
for trade as these markets have well equipped storage facility, good
transportation carriers, ready and all time communications and best
environment than the small and village based markets. There are sitting
rooms for farmers and traders and separate auction place allotted by the local
authorities. All commission agents have enough places for carrying their
marketing activities. Entry and exit from these markets for farmers, business
community and transporters is no problem and they can shift their goods very
easily.
2.3.6.3 Terminal Markets of Fruits in Pakistan
Terminal markets are mostly located in big cities throughout Pakistan.
These include Peshawar, Rawalpindi, Lahore & Karachi which known for its
quality services in the country.
Some quantities are shifted to these markets for onward dispatch to
world markets of fruit and vegetables. Mostly wholesalers are engaged in
these market and deals and forward huge quantities of fruits to the
manufacturing units for preparing by products, retailers in big city and covered

32
and sophisticated markets. Maximum numbers of buyers in these markets are
buying their local workers who interact with other wholesalers. Such markets
are set prepared with businessmen who are trading relying on the goods
provided by farmers of other areas. The managers and workers are enjoying
all kind of latest services for approaching each another and fellows in the
other markets. Some business fellows have established their goods
forwarding companies and all kind of telecommunication services are
available for their work.
2.4 Review of Experiential study
The following part tells us the research and experimental results about
agricultural production and fruit products marketing. The findings are again
divided in the portions mainly focused on emerging nations and Pakistan.
2.4.1Value Chain Approach in Fruit Production and Marketing.
Value chain analysis may be one of the significant methodologies to
examine market varying market structures and to evolve appropriate
approaches for private business development in developing countries.
Sufficient research work has been carried out on Value Chain (VC) theory. In
the 1990s the idea of value added chains developed as methodology to
examine and clarify new and improved practices of worldwide business.
Dolan, Humphrey & Pascal (1999) argue that the requirements of the
UK supermarkets act as an effective barrier to participation of African small
exporters in the chain. The authors argue that, on the one hand, associations
who work in the mandatory Contracting environment are those skillful of
encouraging quality. While Arm’s-length Contracting may be seen as a price
dependent, and quality control initiatives are of no concern. The distinction
between Arm’s length Contractual Relations (ACR) and Obligatory
Contractual Relations (OCR) used in the literature on buyer-supplier relations.
Cook (2000) examined the suggestions of stakeholders in fresh fruit
and vegetables value chain in the US market. She determines that the fruit

33
production sector is visibly leading to its highest level of supporting of fruit and
vegetable marketing sector through supply chain linked models, while the old
retailers are losing huge number of businessmen in the process. The fast
spread of quality center might force the old retailers for changing their
business to the super store format.
Schipmann (2006) analyzed the relationship between the international
and local value chain for maximizing returns to the small land holders and
their current problems in joining in the Chilli farming of Ghana. She concluded
that worldwide value chain will fetch highest returns to the farmers as
compared to the local value chain and hence will get additional income.
Similarly the small land holders have the capacity to increase their production
knowledge and practices and join themselves with the improved value chain
by giving them some support. She further expressed that the joining of value
chain of small scale land holders will help them in reducing the poverty in their
areas.
Ali and Nath (2011) have studied mechanism of postharvest
techniques (PHT) like cleaning & washing, sorting & grading, preserving &
cooling, dehydrating/ drying, packaging, labelling, and storage for value
addition in vegetables value chain in eastern Uttar Pradesh. The acceptance
of cleaning & washing, and sorting & grading was noticed remarkably high
(50%), other actions were in the range of 3 per cent to 25 per cent. Age,
literacy, economic condition, landholding– size, access to loans, and market
linkages were noticed the most significant aspects to motivate the farming
community for acceptance of new and improved practices modern technology,
comprising different after picking actions.
Chandrashekar and Murthy (2011) have studied the functioning of fruit
and vegetable grower’s Cooperative Marketing and Processing Societies
(HOPCOMS) in the Mysore City of Karnataka. The HOPCOMS mainly work
with the fruits and vegetables farmers, and receives from members the fruit
and vegetables in good shape, colour and size on receipt/ voucher basis. The
organization assembled the fruit and vegetables and trades in the most
important three markets namely retail market, processors, and society outlets.

34
Generally, the farming community has obtained 80 per cent of the price given
by the end users. The efforts of HOPCOMS have been appreciated by
maximum numbers of growers (71%) and end users (69%).
Hatai and Raju (2011) have investigated the supply chain of pineapple
in West Garo Hills of Meghalaya using both production and marketing data.
The maximum number of pineapple farmers was of small (50%) and medium
(33%) farm–size categories. The less land holder category was willing to sell
their harvest to the retailers and the second category medium sold their
produce to the end users. The amount obtained by the pineapple growers in
the extended market was maximum s compare to end user amount. The
research findings have recommended farmers associations, availability of
agricultural loans, access to market knowledge and crop insurance for
enhancing fruit production and maximum returns to the pineapple growers in
the study area,
Jadhav et al. (2011) studied on supply chain investigation in raisin
making in western Maharashtra, and expressed approximately that 3-4 per
cent of grape produce was sold for making raisins while nearly 96 per cent of
grape production was traded in the market. Large number of raisin making
persons (94%) traded the product in the well-established market like market
chain: producer––wholesaler/commission agent––retailer–– consumer. The
net revenue per kg of raisin (15.92) was more than double than of grapes
(7.19). The grape growers got (64%) in trading raisin while (50%) of grapes in
end user buying price. Due to restricted trading chances, grape growers are
compelled to sell their grapes in the markets.
Kale et al. (2011) have reported the value chain management of
Abhinav Drakash Utpadak Sahakari Sanstha Maryadit, Agar in export of
grapes from western (Ahmednagar district) Maharashtra. Approximately 66
per cent produce of grapes was sent to foreign countries by the Abhinav. 87
per cent of the total export was sent to Arab Countries by Abhinav, while the
rest quantity 13 per cent was imported by the Holland and Great Britain. The
large quantity of export to Arab countries was mostly due to by the non-
availability of residual measurement facilities. The research showed that the

35
exported may be doubled to the profitable markets like Holland and Great
Britain by producing the demanded varieties, improving the quality, minimizing
the residual traces and making the grape fruit safe for the consumers. The
grape producers should know the varying policies of the government, prices
and market information.
Prasad and Hanumanthaiah (2011) analyzed supply chain in marketing
of sweet orange in the Nalgonda district of Andhra Pradesh and shown that
the pre picking middlemen might be an important player in the production and
marketing of sweet orange. The selling of sweet orange between growers and
end users or growers-wholesaler and end user was nominal. It was noticed
that the marketing efficiency in the small market chain was greater. Due to
greater threats both in production and marketing, the growers were willing to
sell their produce to the pre contractor in pre harvest season. Thus the
producers were getting less return by averting risks.
Reddy et al. (2011) have explored the emerging retail chains in
horticultural crops in Andhra Pradesh. The research has explored that besides
the old retail chains, there were some new well planned organized and
improved retail chains like Food World, Spencer, Food Bazaar, ITC Choupal,
Reliance Fresh, Heritage Fresh, Subhiksha, etc. have been developed near
the Hyderabad city. The new well-structured retail chains seems to be smaller
than the old chains and producers having contact with the well-structured and
planned retail chain received maximum returns for their product. These were
all about due to the reasons skillful knowledge, timely provision of agriculture
inputs, decrease in marketing expenses and threat in returns and production.
The research findings have reported that establishment of new and lates t
retail chains have appealed the end users attraction simply because of more
profit/ return and increasing knowledge of the end user about the best
product.
Siddayya and Atteri (2011) have observed the marketing of outside
country challenges of new fruits like (mango, grapes and banana) and
vegetables (potato, onion and tomato) from India to the old traditional trade in
countries. According to the figures of NPC, EPC, ESC and DRC, the

36
researchers have established that India is suitable and has edge over other
countries in growing horticultural crops.
2.4.2 Review of Agricultural Production studies
It reflects that part of studies which are related or based on production
cost and function etc. Estimating the incurring expenditures on production is
very much vital and all governmental & development players should sit
together and make harmony on this needed problem. Presently some
departments at federal and provincial level make the assessments about
incurring expenditures on producing goods of main agricultural crops. No valid
data or detail about fruit crops & orchards is available.
2.4.3 Use of Production function on Fruits orchards
The use of production function method on fruits orchards was highly
revealing one. Khushk and Smith (1999) adopted this function for examining
the causes affecting mango cultivation in Sindh. Variables used in the study
were mango, number of plants per ha, quantity of Farm yard manure
extended and dummies for pesticides spraying, inter culturing and hiring of
labour for management practices. They established the orchard acreage,
number of chemical fertilizer bags & Farm yard manure used two or above
pesticides sprays and number of hoeing carried & number of labourers
engaged have prominent impact on mango produce (cartons per hectare).
Most of agricultural inputs noticed unattractive to the growers. Chemical
pesticides were used very rarely.
2.4.4 Review of marketing studies and their findings
This portion contains review about horticultural crops marketing in
emerging nations and Pakistan. No or very rare data and studies have been
found on marketing of horticultural crop and orchards in domestic or abroad
markets, which needs exploration.
Herregods(1976) studied that price is reliant on the availability and
claim of a product at a time its selling and buying but sometimes may consider
the inner and outer characteristics of the product. All horticultural products
37
may have some known characteristics standards much desired by the
consumer. For apples there exists yet more complete depiction with respect to
the optimum characteristics standards. To obtain maximum characteristics
standards, selection of cultivar, harvesting in different intervals, setting of
refrigerating and more sophisticated controlled atmosphere, situations, wet
forced air pre-cooling and refrigerated shifting would be approaches with
maximum costs, but also with more returns, to obtain lucrative feature.
Applied experiences and models with costs and benefits are narrated.
Timothy (1983) analyzed that interest in producing muscadine grapes
(Vitisrotundifolia Michk.) has enhanced in Florida among the actual and
developing growers for growing economical crops in their fields. Muscadine
grapes are grown on large areas of Florida where suitable environment has
enhanced the production and projecting their best attributes of grapes.
Sufficient costs would be needed for initiating and developing a muscadine
grape plantation. The potential markets must be surveyed before planting in
order for the grower to select cultivars best suited for the correct markets and
the particular market suited for the location of the orchard. Potential markets
for muscadine grapes are direct marketing, processed market, and the
commercial fresh market. In this paper enterprise budgets are established,
potential markets are discussed, and potential returns are explored to aid the
potential producers in their decision making.
Jennie (1990) stated that the peach farmers should look into the most
important aspects of farming in their planning, first projected peach produce,
second price of the produce and third preliminary cost incurred on inputs
purchased. All practices during the production are usually kept in mind for the
planning duration of the orchard. Usually life of an orchard varies from first
year to the point where maximum yield is obtained. Profit and loss may be
considered at the initial of each season
Jennie and Westberry (1990) explained that mean yearly utilization of
peach production for Alabama, Arkansas, Georgia, Oklahoma, and South
Carolina are averaged 260 million pounds. Average estimates of production in
above mentioned areas were more than $79 million. Peach production has

38
proved to be an economical sound business. Although the approximate gains
may be find out prior going to invest in the business. Many factors like various
numbers of varieties, size and number various cultural practices and prices for
agriculture inputs and received from fruits may suffer the proposed allocation
of resources for the orchards. The profit from the orchard may be estimated
seeing the expected physical life or maximum fruit production from the plants.
The life of peach orchard starts from first year planting to the maximum yield
production. Usually an orchard may be established in three years and some
costs are involved in the form of varying and fixed in nature.
Russell et al. (1992) analyzed that marketing theories associated with
quality, location, and time are integrated into a complete model, illuminating
the linkages between market window approaches and hedonic analysis. An
integrated hedonic price model for the U.S. apple industry was appraised.
Results of the study suggest that size, storage method, grade, and
seasonality are the most important factors on the price of apples. Area of
apple origin and variety were the least important influences on apple prices,
with the exclusion of the Granny Smith variety.
Jayson and George (1993) reflected that quantifies the discounts and
premiums connected with various quality factors for processing apples
(Malusdomestica Borkh.). Discounts and premiums were assessed using a
hedonic price model and quality data from a total of 137 samples representing
three processing apple cultivars (45 ‘York Imperial’, 43 ‘Rome Beauty’, and49
‘Golden Delicious’). Price discounts in the sample were statistically significant
for fruit size, bruising, bitter pit, decay, misshapen apples, and internal
breakdown. Usually cited defects, such as insect damage and apple scab, did
not cause significant price discounts.
Shank and Govindarajan (1993) elaborated that an organization should
recognize product delivery mechanism in whole value chain for achieving and
retaining economic benefit. Sellers and end users have received returns
which is significant in knowing an organization expenses and profit margins
that are important to identify in understanding a firm’s cost/distinction level as
consumer has to pay for maximum returns in the whole value chain.

39
Bruce (1994) elaborated that the grapes farm orchards can be
arranged with less operation cost mainly because of less cost for land, farm
equipments including machinery while the running expenditures like site
preparation, grapes varieties, tree spacing, training of the plants, pest control
and any relevant management operations. Some expenditure may increase
the cost of new establishment like fencing to the field, installation of improved
irrigation system, land leveling, and making drainage system. Growing vine
tree cost is also vital and may change relatively to varieties selection, training
system of workers, quantity produced. The optimum income may be
calculated which is indirect relation to prices and yield. Vine rate is directly
related to present market and farmer’s capacity to sell their vine at proper
markets. Grape’s farmers should work hard for fetching highest return.
Ali and Laurence (1996) elaborated that Fruits production is one of the
significant part of agricultural sector of Pakistan. The study explained the
organization and process of the marketing channels and how giving shape to
marketing margins of the growers and further trading players or firms. The
study further showed that above 90 per cent of the fruit growers have sold
their fruit orchards to the contractors. It was revealed that growers got 25
percent as his part in retail price. Among the other players present in the
market received 43 percent by contractor, 6 percent by the commission
agents,5 percent by the wholesalers and 21 percent by the retailers. Some of
the points indicated in the study were net profit margins, period and kind of
agreement, procedure of agreement price calculation, procedure of
disbursement, and way of public sale.
Zaheer (1997) studied that spray of unselective chemical insecticides
has been practiced so many times in current duration. The enormous usage
of these pesticides has endangered the environment, human life, biodiversity
and various fruit and vegetable intake. There may be possibilities of cancer
and low fertility and slow mental level in human beings by the risk of
pesticides use. There were major sprays of these chemicals on vegetables
and cotton without any sound knowledge or advice from any expert. There is
no instrument which can tell us about the application measurement and the

40
effects of these on surroundings. Although few research works has reported
hazardous quantity of chemical insecticides remains in farmer’s blood,
cottonseed and various sold vegetables. Hence growers may be informed of
the hazardous nature of chemical insecticides and convince them of rational
use of pesticides in the country.
Jeffrey and Michael (1999) reviewed the best entrance and departure
limits for Georgia commercial peach production is calculated when both cost
and production follow a Brownian motion method. These limits were noticed
on no return sunk- cost venture, there by the time of starting peach production
can influence the income. The study showed that farmers in Georgia were
producing the peaches with greater determination and remained the
production process while capable peach producers have delayed their
investment in production till they may be able to fetch highest income.
Joyce (2001) examined that in Taiwan, most fruit growers are small-
scale, usually not knowing market information and marketing capital, so
shippers in the traditional marketing channel normally dominate the terms of
the marketing trade. In order to increase produce marketing, the government
helped and lead grower’s associations, to run collective marketing programs
for forwarding fruits and vegetables to the big markets in major consumption
areas after 1973. Therefore, collective marketing was broadly accepted and
maintained by the farmer all over the crop areas. The township farmers’
associations, the agricultural producer cooperatives and the Taiwan Fruit
Marketing Cooperative are the three main organizations handling fruits
cooperative marketing. The three together consist of more than 300 fruit
cooperative units. In 1998, the total volume of cooperative fruits marketing
was 157,143 M.T., out of 75% was shipped to the Taipei market and 23.5%
the Sanchung market. The fruits market share of cooperative marketing in
Taipei and Sanchung was 53% and 24%, respectively. The traditional
approach to asses these issues are to decompose marketing margins into
costs, transportation losses, and gross return based on survey data. Then the
retailers’ average net returns are measured in order to determine whether
they receive normal or excessive returns.

41
Gandhi and Namboodiri (2002) indicated that end user price change
shows as profit change in Ahmadabad India and the profits are approximately
69 to 94%. And Kolkata this may go to 46 to 73. It is very much needed to
improve the selling buying process for fruit and vegetables. The
representative of market committee must bring other markets according to the
rules and supervision. There is need of another action by the market
committee to promote an open auction system. The necessary buildings for
market promotion must be upgraded like storage houses, loading, unloading
and weigh machines, cool trucks or carrier and farm to market road etc.
maximum sharing and involving of all through monitoring lead to best actions
or tasks. Market Intelligence, best communication facilities and combination
are also helpful in making markets more efficient.
Prakash and Singh (2002) analyzed that the farmer’s contribution in
marketing cost and profit would be more or less if middlemen from the
markets were increased or decreased. It was observed that there some
organized markets in Rajasthan where kinnow is mostly produced. The study
and Cost-Benefit ratio showed if sufficient amount of investment on cultural
practices, post-harvest operation ideal marketing is not made, and the best
result could not be achieved (Ali, 2004).
Gandhi et al. (2002) reported that the inefficiency in the in the
marketing networks and weak marketing substructure are the main reason for
varying end user prices. It was noticed that the farmers are also getting less
share in consumer rupees. The study evaluated the planned big trading place
of horticultural crops in Ahmedabad being big city of India. Marketing
efficiency was enhanced by enabling the farmers in these organized formed
trading places. The researcher indicated the structure, process mechanism
and position, and the value chain - from producer to wholesaler to retailer to
end user. Large numbers of conveniences were given to the farmers in these
three organized big markets. Rankings by producers, commission agents and
retailers expressed that market place was the major significant important,
second by storage capacity, open place, measurement tools, price
presentation, and banking services. The information collected about sale

42
showed that sale operation in front of all players was reasonably small being
necessary for trading deals and maximum transaction took place in hidden
order or easy exchange. Important damages in marketing competence were
noticed. The data further showed the marketing cost floats nearly 8 per cent of
the end user price for vegetables and approximately 11 to 15 per cent for
fruits. Carriage cost and commission are the most significant of all costs.
Investigation of prices at diverse staged reported that generally the average
part of the producer in the end user price was only nearly 48 per cent for
vegetables and 37 per cent for fruits. The research indicated the profit
margins after calculating the marketing cost which was regularly greater as80
to 90 percent as percentage of the grower-end user price change.
Bashir et al. (2003) applied Cobb- Douglas production method to check
the role of numerous parameters in the growing of bitter gourd. Those
parameters were soil preparation by applying tractors services duration,
amount of seed, amount of Farm yard manure and chemical fertilizers given,
irrigation time, number of pesticides spray, weeding removal time and dummy
for disease attack. It was observed that soil preparation, irrigation, pesticide
spray and diseases have added negative effect on the cultivation of bitter
gourd while the left over parameters added positive effect on the crop. Only
weeds among the parameters were significant on 10% significance level.
Bashir et al. (2003) calculated different Douglas production method for
implying numerous parameters in the cultivation of muskmelon. All those
varying factors were tractor applying time, amount of seed and chemical
fertilizers, water application time, pesticide spray amount, farmers involved,
varieties and districts. Besides these, varietal response with water
application, fertilizer and pesticides were also found out. Those factors who
have positively added to production are cultivars, involvement of farmer
number, chemical fertilizers applied and the response to pesticides.
Bashir et al. (2003) measured Quadratic production procedure in order
to calculate parameter’s response in the cultivation sponge gourd. Those raw
material which were taken for analysis, were an amount of seed, farm yard
manure, chemical fertilizers used, water application numbers, pesticides price

43
and dummy for disease spread. Those parameters who have surely added to
the yield were amount of seed, fertilizer application, and water applicat ion
number while at some point the coefficients were not positive. It implies that
after a certain point the repeated usage would affect production. Farm yard
manure along with pesticides has not positive effect on the production, while
their coefficients were not negative.
Carlo et al. (2003) studied price and return investigation with respect to
organic and integrated fruit production in Italy. Both cultural practices were
noted relation in the farm activities. The prices and returns of production were
evaluated in two research studies, the first one is about apple production and
the second one belongs to the peach and nectarine production. The current
study is mainly related to prices and returns and hence gives guidelines for
the investment chances to producers and other players involved in production,
in relation to the natural fruit production. This input which has attracted the
most is published in Italian (Canavari et al., 2004). This study was conducted
in Northeast Italy in relation to the natural and integrated apple and peach
production in 2002–2003. The main purpose of was to investigate the returns
in natural production except the EU benefits and support, which would not be
admissible in fruit production in Italy.
Timothy and Wojciech (2003) stated that timely acceptance of
improved cultivars may lead to more economical peach produce, and peach
characteristics are prime reasons for fully acceptance. An applicable
technique for peach varieties is projected, incorporating grower evaluations of
peach quality. The model recognizes the impact of farm characteristics such
as the farmer's quality preferences, on-farm agronomic and orchard
conditions, as well as geographic effects in Georgia peach growing regions.
The relative impact of the key external and internal peach quality attributes on
adoption is considered. Decisions making on new varieties are influenced by
the age distribution of the orchard, information about new varieties to growers.
Bakhsh et al. (2004) explained that the standards of mango may be
affected by the deteriorating conditions and buying and selling place
characteristics and thus fetch less income and resultantly the mango farmers

44
experience great loss of their hard earned money (Sabir, 2003). Sufficient
numbers of actions influence the profitability of cultivation of mango, which are
farm produce, income and profit of cultivation. The noted parameters like farm
produce and profit may also be affected the land utilized, environment the
location of buying and selling. Prices may be divided in three different parts.
That is why the revenue and prices are calculated through discounting favour
and prices and they are defined simultaneously discounted favour and
discounted prices. Economical calculations were applied to depict the profits
of growing mango plants. Two important profitability measuring procedures
namely NPV and are taken in to account and also mentioned by Gupta and
George (1974), Vaidya et al. (1991) and Ahmad et al. (1993). NPV may be
regarded is the discounted number spending incurred on incoming and
outgoing amount. It is usually considered that any organization want to
increase its income, the NPV may be the most suitable tool to calculate
spending preferences (Tauer, 2002). NPV May be the total of present value of
future revenue and cost of any activity (Castle et al., 1987). Furthermore NPV
shows the calculation of actions value along spending and revenue in the
proposed time (Swinton et al., 1997).
Jane and Joyce (2004) explained that Taiwan market is more
competitive for American fruit products ac compare to Taiwanese products in
the local markets as reflected by the response of end users and businessmen.
Local traders prefer to sell the American fruit products due their good quality
attributes. End users have no concern with the important quality as relative to
businessmen. Planning may be made to educate both for the reinforcement of
American fruits. Organized publicity may change the profit of local traders by
selling more fruits while the end users may be influenced through giving them
know how about the cost and quality of American fruit.
Sait et al. (2004) have elaborated the cultural and financial constraints
of farmers in getting best condition peaches. The peach farmer can manage
their orchard well in time for successful achievements. The farmers have the
power to keep in mind some important parameters to gain profit from their
produce. Sometimes peaches and their farmers face high risk in production

45
and selling. Farmers should surely observe whether they are gaining
something from the selling of their produce or not. It was noted that peach
cultivation or farming lead to profit but must gathered prior information about
selling and buying conditions. The farmers must explore the means that how it
could be made more economical. Peach farming proved very common in
areas where farmers are small particularly farmers have scarce resources.
Farmers usually face so many issues in production and marketing. There
should be need of specific studies to resolve the issues in cultural practices.
Dejong et al. (2005) addressed the cost of hired labor for pruning,
thinning and harvesting trees is mostly relying on the expenditure on growing
fruit tree of peaches and these costs may be reduced if farmers select dwarf
varieties for cultivation. The result shows that two scions on five improved
rootstocks give promising outcomes. They attained less size in 8 years and
can be equated with best rootstock. As dwarf varieties are sown dense in
population that is, why three new cultivars have been introduced for profitable
fruit production in California. The one dwarf rootstock has been ready in the
big fruit nurseries while the rest have been given permission for commercial
use.
Yasar and Meral (2005) stated that the fruit plants needs more money
for longer time from starts to the fruit maturity as compared to other crops.
Wise and timely thinking are prerequisite to fetch high returns. (Marini, 1997).
The current study was carried to find out to investigate the peach and cherry
fruit cultivation and see how this business is profitable, economically feasible
and have further expansion opportunities in Turkey. The economic
parameters like NPV and Benefit Cost Ratio (BCR) and Rate of Internal
Return (RIR) were elaborated for capital spending analysis. Varied discount
rates of (10%, 8%, and 5%) were applied to obtain NPV and BCR for two
fruits. NPVs for Peach fruit was received (573.0 $/da, 793.47 $/da, and
1248.6 $/da) while the second NPVs were again obtained convincing. Along
with this the BCRs for peach and cherry fruits came higher than 1(1.18, 1.21,
and 1.27)&(1.81, 1.87, and 1.94) respectively. There were RIRs for both fruits
19.81%&45.31% respectively. It was assessed that money spending in fruit

46
production and attached practices is highly profitable and particularly cherry
production is the best livelihood source of the area growers in Turkey.
Hakeem et. al. (2005) revealed in his findings that ninety percent of
Mandarin farmers sell their citrus orchards to intermediaries in the growing
areas. Estimates from markets have shown that local market dealers have
received three times more than the farmers where is the cash difference
depicted that middlemen got 89% of profit and have met the maximum
marketing cost as compared to big dealers. The study indicated that by
market analysis based on price information on weekly basis Sargodha proved
more combined than Faisalabad.
Burma and Saranark (2006) explained the necessary precautionary
steps in food for nearby market and formulation best quality standards for
international markets, there is a TOP local firm having 50 big marker places in
Bankok and Caiangmai. They started to present their firm certified one in food
safety measures so that no one could come for competition due to their selling
in standard food products. This motivated other food chain suppliers also and
they have to get certificate from the concerned authority. Thus the number of
un-certified food chain reduced reasonably due to the in the project time.
There is a firm who is sending the fresh vegetables from Thailand to Europe
with high standard. The firm started a combination of standard food chains to
meet the growing demands of the Europe and Japan. Similarly the business
expanded due to high demands for organic vegetables in European countries
and export and number of small farmers were increased with great speed.
Cadilhon et al. (2006) described the expansion of different vegetable
marketing in Vietnam, and in these big markets the old businessmen are
attracting the big seller and small buyers. The researcher has gathered this
information through interview schedule from different supply chain players.
The researcher has applied different techniques to investigate the two types
of system. The findings were part of that market, supply in quantity and place,
preferences of end users, prices of products at various points for calculating
the benefit to the growers and marketing people, labour index (ratio between
person hired for working in the supply chain to the number of goods sold)and

47
price consistency through evaluating the competency of supply chain,
responsiveness in elasticity of the end user’ demand, handing time and
characteristics practices.
Dahiya et al. (2006) explored an attempt to make analysis orange
marketing in uttarrakand India. There were six marketing channels identified
and approximately 57% of the product was offered for sale in these to the
local businessmen. It was observed that cost of marketing varied from 278 per
quintal to 894.16 per quintal in channel second and farmers gained 100
percent more profit in second and third channel. The farmers got only 9.38 %
and 8.60 % in second and first simultaneously. It was also observed that
farmers received 1.27in the fourth and considered to be the highest efficient
among all while the sixth proved less effective (1.00) for the orange farmers.
Farmers got only 9 % of end user price. The difference between nearby and
faraway markets was observed above 2000 per quintal. It is also cleared that
farmers major share in cost are hiring usual labour and shifting produce from
one place to another. The farmers must be linked to the best and suitable
markets by better roads farmer’s organizations.
Engindeniz et al. (2006) stated the profitability of peach farming in
Kemalpasa, Izmir and to find out it’s profitable for small farms. Data were
collected by survey from 63 farmers by using random sampling. In profit and
loss examination, prices and profit of peach production were examined. As
reported in this research, average size of the peach orchards was 1.09 ha.
Average peach production ha-1
and tree-1
were calculated, 16,848 kg & 37.7
kg. 63 % of sum peach fruit production was marketed in big markets place.
Though, 17 % & 2 % of peaches was disposed up as straight on trees and in
local market places. The remaining of peach produce was sold to commission
agents (8 %), local dealers (8 %), fresh fruit juice preparation plants (1 %),
and exporters (1 %). Average peach price that obtained by farmers being
determined to be 0.25 $ kg-1
. Aggregate cost ha-1
of peach production was
calculated to be $ 3,373. Net profit obtained ha-1
and tree-1
from peaches were
examined to be $ 839 and $ 1.88, respectively.

48
John Humphrey (2006) analyzed that increased in productivity may
reduce poverty reduction in remote areas and this can be achieved through
exporting the farm products from less developed countries to developed
countries. Worldwide agricultural markets are becoming very difficult as
attention at maximum spot in the value chain is done, the growing opportunity
and difficulty of foodstuff principles, especially those linking to food safety.
Hence recognizing the importance of farm products export in reducing the
poverty, careful evaluation of the worldwide markets may be done for
reaching economic goals and stability. The researcher has investigated the
policies for the reducing economic in stability in worldwide by enhancing the
export of farm products through applying global value chain viewpoint. The
stand point expresses relationship between organizations in worldwide
agriculture related business, keeping farm production and processing in third
world countries in the situation of the dynamics of the wider world wide
agriculture related business and agriculture food structures. The value chain
may explain the categorization of information, trader ability, the prices of
authority and awareness.
Katica (2006) examined the business of farm fresh fruit and frozen
seem complicated and patchy. Currently the farmers are working I different
markets. It is important to for make coordination among the players like
farmers, factory owners, big businessmen, and local traders for the promotion
and enhancing produce, profits and exports. Some markets need direct
relationship between farmers and end users and there is no need of
middlemen. The joint efforts can make play the role in good quality, more farm
produce and healthy competition among the stockholders. Orchard produce
are mainly rely on land types, growing seasons, irrigation, insects, diseases
and natural calamities while the fresh fruit quality are very easily and instantly
deteriorated.
Sarfaraz et al. (2006) explained that the current study was carried out
in Multan District to find the profitability of the cultivating date trees. Financial
analysis was carried out for this purpose. Results showed that the total
revenue per may be Rs. 74788 for five to ten years & Rs. 57766 for eleven to

49
fifteen years, while the costs for the corresponding would be Rs. 24823 and
12196. The study shows that revenue of the date growers in Pakistan is high
and could get increase their earnings, if they start work on economically
sound steps and also could boost the country economy through earnings from
abroad. NPV for 15 years date plants would be considered very economical
and it may be Rs. 50527, and this expresses that date production is giving
high income. BCR is more than one and more profitable to make spending in
date farming.
Uzunoz and Akcay (2006) examined the income viability of fruit orchard
by economic analysis in Tokat Turkey. Economic analysis was done through
NPV, CBR techniques and IRR. Various discount rates were considered to
calculate NPV, CBR for peach and apple. NPV for peach (1113.6 $/da;
1454.7 $/da; and 2156.2 $/da) and apple (574.2 $/da; 805.4 $/da; and 1342.9
$/da) were estimated and remained non negative. Besides these CBR for
peach and apple were greater than one. It was observed that fruits orchards
are economical and proved main source of livelihood of growers in Turkey.
Khalid et al. (2007) expressed major difficulties which have delayed the
optimum fruit production and their export to the potential markets. The
research was confined to investigate the developments in fruit production,
their consumption and marketing and find out the present fruit selling
mechanism, investigate the major constraints in selling mechanism,
enhancing the exports and give recommendations in procedures and
methods for increasing the global export to other countries. Knowledge from
market obtained by the grower’s was constantly incomplete and vague. The
growers are always using less quantity of various agricultural inputs like
chemical pesticides and fertilizers, which results in less production and
weaker quality products. Pre-season selling of fruit orchards is one the main
reason of the grower’s weak financial position. The nominal facilities in the
form of cold storages and weak farm to roads are causing 25-40 percent
damages to the fruits and hence reduce the stock and increase the
prices.Increasing the fruit exports and making competition in global markets,
these damages could be reduced. The fruit orchard growers are getting one-

50
fourth of end users’ price, while major part is taken by the businessmen in the
markets. The part of intermediaries in end user’s price may be reduced by
awareness about the agricultural loans and market information, lowering the
post-harvest losses, making ideal and suitable conditions of the market
structures, provision of transportation facilities in peak time on reasonable rate
and ideal packaging material. It was also noticed that the fruit selling places
were not open for all sellers and buyers.
Linus et al. (2007) examined that knowing consumer observations and
approaches may lead to vital standards conditions for buying and selling and
also give fruitful guidance for studying further improving features and steps
about post picking operation of fruits. It is evident from the research the intake
of fresh fruit is more among than the men and people with more money.
People eat banana and dates more than the apple as because of its dominant
characteristics like colour, flavor and sweetness. Mango, Apple and orange
are also liked due to the flavour, sweetness, and firmness of these fruits. The
well-known fruit attributes which are not liked in the markets by end user may
be full ripening in banana, staining and yellowing in apple and deterioration in
mango and ill flavour in date. Maximum numbers of end users are willing to
give 25 percent extra on unit price for best quality orchards produce but 94
percent end users refused to pay to 50 percent for fresh fruits
Lusine et al. (2007) applied the Dutch-German tomato supply chain in
their research work. .The intensive lead dialogues were carried out with chain
executive of a breeding company, framers of tomato producing firms,
wholesalers, leader of a distribution center, and leaders of supermarkets.
Therefore, the current research work analyzed the chain from field to the
consumers as related to Pakistan research studies mainly concentrated on
marketing sides. Different Vegetable seed were brought in by the breeding
company and certification mechanisms of the best quality these seed were
made. The researchers questioned seven out of 12 tomato producers. Big
sellers handed fifty percent of their products to delicate markets in Germany.
The Big sellers applied the world wide (International) food Standard (IFS)
certification. The retail distribution used HACCP for food quality control.

51
Snelder et al. (2007) reviewed the causes of why farmers preferred the
income of fruits production in relation to other cash crops for the last 10 years.
Fruit have common markets situated nearly and supermarkets while are there
are numerous issues and unforeseen risks attached to the fruit orchards.
Usually growers think fruit orchards have low income as compare to other
cash crops against the studies conducted for the last year on fruit crop
cultivation. It was noticed that the NPV for Citrus group is double the NPV of
irrigated paddy crop and four timed the maize crop. Grower’s knowledge for
fruit orchards and cultivar selection was wrong, which resulted less fruit yield
and less income. Markets were also not explored up to its maximum for
selling of their produce, less knowledge in selling and having no idea about
the markets requirements, place etc.
Sreenivasa et al. (2007) examined for clear assessment of the post-
harvest losses at diverse points of marketing and the effects of net price,
marketing costs; margins and efficiency on producers were forwarded. It was
revealed that the current procedures may incline the exaggeration of
producer’s net price and marketing margins of middlemen. It was reported
that the margins of retailers was negative while considering the actual
damage, while this may be positive in the old calculation method. Likewise,
the grower’ net part and wholesalers’ margins also were decreasing largely. It
was noticed that marketing efficiency was inversely proportional to the
marketing losses. The joint selling and buying was observed extra efficient
mechanism in terms of both operations and price. The marketing cost was
observed to be the main problem in the wholesale marketing channel and
lowering these mostly the commission charges as established in the joint
marketing channel, would assist in decreasing the growers’ margin. It was
emphasized that particular carriage transport would be beneficial for highly
perishable fruits.
Gangwar et al. (2008) examined the growing problems and profitability
of peach crop in Punjab and uttarakhand. It was notice that there are great
chances for investment in peach crop cultivation being the most gainful and
feasible enterprise. It was further noticed that internal rate of return (IRR) has

52
been increased based on the number of peach fruit plants. The net present
value, benefit-cost ratio and IRR at 12per cent discount rate have been
reported as Rs 44,807, 1.681 and 22.20, correspondingly for each and every
type of fruit orchards. It is proved in study that the average and economically
viable life of peach fruit orchards reaches up to 24 years. The recommended
orchard size should be more than 2 hectares. The peach orchard can be
retained whenever it amount gives excess of Rs 5,713 above the yearly
running costs. The exportable peach fruit production can be achieved if apply
accurate post-harvest management practices, establish mechanized grading,
packing and plant processing, suitable storage facilities and facilitation in
export markets.
Mukhtar and Javed (2008) studied four local markets in Pakistan
through two step mechanisms which have been presented by price set for
market integration. The information collected from 1995-2005 about maize
crop price in local market being utilized. The collected prices were combined
in order one.
Frederico et al. (2008) stated that production costs and fruit yield
profitability in the initial harvests of custard apple trees The aim of this study
was to guess the production cost and economic gauges associated with the
production and sales of fruits from 20 custard apple progenies during the
initial five harvests, in order to recognize the harvest season from which
custard apple utilization becomes profitable, as well as the most promising
progenies from an economic point of view. The fruit yield data upon which the
present work was based were obtained during the period from 2001 to 2005,
in an experiment that calculated 20custard apple half-sibling progenies, under
sprinkler irrigation. The progenies were assessed in a random block design
with five replicates and plots consisting of four plants each. The exploitation of
custard apple progenies only showed to be a profit able agribusiness after the
fourth year. Before that, only A3 and A4 progenies in the second year, and P3
and P11 in the third year provided profitable incomes. Since the
methodological rules imposed concerning the time period analysis and the
prices as of July 2007, the most important profitability indicators (operating

53
profit, return index and equilibrium price) showed that the A4progeny is the
most acclaimed, although other progenies are also highlighted, such as FJ1
and FJ2. As already argued, the progenies showing the highest average
yields of five harvests are not always the most economically recommendable
ones.
Laajimi et al. (2008) reported that peach fruit is one the important of all
kind of fresh fruits. It is noticed that the orchards are increasing for the last
few years mainly due to the water availability, better application techniques,
and high yield cultivars introduction. Therefore it is notice that the yield and
export of peach fruit have been increased. Supply of fruit due its limited
duration may cause fluctuation in big markets as well as on consumer’s side.
Econometric procedures were applied to study the peach production. There
were two parts of the model, first expressed the change in new plants and
removal in peach area while the second approach targeted the features and
requirement of the peach crop. Poor supply response to prices were obtained.
Supply price elasticity was reported about 0.13 proposing a high degree of
inelasticity.
Bertazzoli et al. (2009) analyzed the forms of value system distribution
along food chains, in order to search agro-food business capability to be open
for all and maintainable. The writer has expressed his three food chain
namely potato, fruit, and Grana cheese of Emilia Romagna region. The
research was focused on the value system approach. The approach was
designed to join the financial statement for each food chain in order to find out
the working income and calculate how this was distributed among the different
food chain steps. The calculation was done for 189 businesses for the potato
chain, 187 for the fruit chain and 203 for the cheese chain. Businesses in
number were changing for five years since 2003-2007reference to 2900
monetary record which were analyzed. Some variation was also witnessed
during analysis. There was approximately thirty five percent worth generated
of Potato and fruit in chains while cheese got exactly thirteen and half percent.
In last 5 years, there was five percent reduction in potato & fruit and nine
percent in cheese. Due to the absence of proper planned food chain

54
collaboration, the small scale buying has got control of entire chain at the cost
of main part causing reduction in continuity for all chain players.
Blandon et al. (2009) studied the importance of dealing costs and joint
steps needed for the involvement of small level growers in horticultural supply
chain in Honduras. The researcher has noted in old fixed selling and buying
place, where growers are selling their products without the help for internal or
external support of buyers while with divergence to big posh markets supply
chain, organized actions were visible and superiority of the product, care and
transportation were organized and done. Here the dealing cost of the product
may be enhanced. The information was collected from 325 low level farmers
for the research.
Blandon et al. (2009) elaborated the involvement and non-involvement
of low level producers in big posh markets supply chain for analyzing the
comparative relationship between prices and dealing costs. The result
obtained was extremely important for low level producer’ involvement for
comparative price in big posh market against the small scale market. Same
price obtained in the major market in relation to other markets may minimize
the revenue by the involvement in the supply chain to big posh market. The
study indicated that producer’s involvement in the supply chain of big posh
market may have maximum confidence in their clients than the producers
carrying to the fixed venue market.
Loannis et al. (2009) suggested that the peaches obtained under ICM
having 23 commonly applied pesticides’ residue may be checked and
analyzed by applying watching mode GC/MS. Protection related research
have been carried out for various deliberations for different kind of peaches
which are change in attributes like look, form, taste etc. It was noticed in the
study that various peaches have not been affected by the products. In order to
examine the procedure to calculate the MRL in peaches, the international
procedure was effectively applied for analysis in fruit sample obtained in
production time. Residues noticed in sample were less than the accepted

55
levels of legislation for the chemical, excluding diazinon for one sample
positive result.
Narrod et al. (2009) explained the value chain of Kenyan green beans
and Indian grapes exports. The green beans were sent to abroad markets by
farmer own and managed cooperatives and grapes by grower cooperatives
while both the products were grown by the farmers. The big posh markets are
mainly responsible for the export of Kenyan beans to England and local
markets. Marketing opportunities are defined for optimum food care measures
and any symptom of chemicals. The England main posh market may need
the neutral forum certification like Eurep GAP, British Retail Consortium
(BRC) and in major instances, small scale seller’ s own food security
measures. The responsible people delivered a phyto sanitary authority which
is to be supplemented with the beans. That is why the beans value chain
adopts the best featured raw materials in the growing of beans and there
should not be any chemical residuals. The small farmers use the chemicals
and they are mostly providing the foreign big markets and local end user
comprising of hotels, restaurant etc. The standard of beans are checked
through screening before sending abroad in order to meet the criteria of other
consumers. Only few growers are producing the beans for selling in the
Cannes and the quality of the product is checked for the chemical residual
level. Mostly of the people who were involved in the sending of this product to
abroad be analyzing the product themselves for confirming the traceability.
Stephen and Jeff (2009) presented the economics of apple supply
response which can be recognized for adopting plantings of the trees,
eliminations of old, and produce. The vital parameters are revenue for apple,
cherry, climate and spending on the orchards. These factors seem very
important under consideration of new sowing choices while the replacement
have estimated income in short duration for apples and peaches. The frit
produce is directly dependent on cost and climate of the area.
Clare et al. (2009) explained that how the rich countries regulate their
food markets places. Food businessmen take care of the chemicals residues
in the field as well in packing. To safe guard and make the small farmers

56
present in the markets, latest and necessary arrangement should be made.
Here the public and private association can bring the change by playing its
part in forming relationships among players for the promotion and demand of
the consumers in the supply line. Moreover, the big farmers can make their
association to follow the food safety standards through collectively and
making the fruits product attractive for the consumers and making the costs
and residue less. Here comparison has been made between Kenyan and
Indian farmers of fruits and vegetables who have responded positively with
more demand for their produce in the international markets. The current
research relates methods where low level farmers of horticultural products in
Kenya and India have managed with enhanced needs for product care in their
major export markets.
De Felipe et al. (2010) expressed a comparative analysis of how to
supply domestic fruit and vegetables to resorts tourist areas in Cuba and
Dominican Republic. As Caribbean developing countries they have a dynamic
tourist attraction. Although they have the possibility to produce tropical
products, the tourist consumption is covered by imports with high quality
standards. The challenge is how to organize an efficient supply network. Due
to political differences with State planed and market economies, the solution
has to be customized, although there are some points in common. Empirical
analysis within the framework of two research project gave the basic data for
the studies with face to face interviews to the key economic players. SWOT
matrix and proposal are included in both cases, with incentives for rural
development, consumer satisfaction and efficient food supply.
Edward et al. (2010) elaborated the expected price of starting Pitaya
fruit farm to be approximately $37386 per hectare. Starting year for orchards
require greater costs and which is to be $73307 per hectare, for carrying
operation like soil preparation, raising fencing around the farm and other
management operations. Income can be obtained in the second year after
harvesting of Pitaya for markets. The operational costs are decreasing from
$73307.13 to $63447 and then $37386 per hectare in the starting, second and
then third year. Cacti cultivar needs three years for gain full size tree.

57
Therefore 2.5Hectares farm of Pitaya may require an amount of approximate
$75,680 which would not contained the purchase of any principal things by
the farmer.
Sabir and Zakir (2010) pointed out in his that our country Pakistan has
been included in list of first ten world countries that have the maximum
acreage under citrus plants. There was good quality citrus mandarin produced
in Punjab Pakistan, while district Sargodha having more area and kinnow
production. Basic information was gathered from these two districts and value
chain was analyzed for market in efficiency of kinnow business. The study
revealed that by minimizing the number of middlemen, the farmers have high
income and end users have less expenditure
Ascard et al. (2010) stated that the growers estimated the cost benefit
of apple cultivation. Cost of production was estimated for organic and
traditional farms having sixes of 5 & 20 hectares. Four new and latest farms
with promising yields were tested. It was reported that the estimated price of 5
hectares organic apple was €1.14 per kg that might be the double of
traditional orchard mainly due to less production inorganic orchards. The
orchard growing cost for 20 hectares orchards is 20 percent less than the 5
hectares. Minor unit handling 200 tons annually will receive €0.38 per kg for
keeping the produce in storage, packing and shifting to other markets.
Organic apple production expenditures in the form of production, storing,
packing are more than the 60 percent and less than85 percent for organic
orchards.
Reddy et al. (2010) studied retailing has been carried out to examine
expansion and activities of latest retailing and its effect on old retail markets.
This research shows that there are more small businessmen in latest
marketing as compare to old marketing. Vertical supply study showed that
both chains have equal outcomes. The growers have more share than the
intermediaries and big shopkeepers, while the supermarkets got 38% of all
produce. It is revealed in research that there are demand and supply factors
in old and new retailing. Therefore, operational value chain operators would
definitely increase the importance to push to market. This study expressed

58
that both supply and demand have significantly contributed to the traditional
and new retailing markets. Effective value chains would increase profit and
help to the growers to shift their produce to the potential markets.
Wang Chuan (2010) described the price instability and threat to the
farm goods which has made the farmers more on risks. The idea of applying
market threat dealing may be to assess and find the level and extent of
threats to the agriculture producers. The current study examines and
calculates price risk involved in different fruit categories like Fuji apple,
orange, banana, pear, grape, watermelon and strawberry by apply the VaR
method. The statistical calculations reflect that standard distribution may not
be ideal procedure which can be useful in judging the fruit market threats. It is
mainly due to various fruits have other levels of market threat (i.e.,
strawberries and watermelons were fruits with maximum threat stages while
apples, bananas and pears were comparatively having small threat stages;
and grapes and oranges were having middle threat stages). Agreeing to the
findings, those fruit are belonging to the identical market place may have
same appearances. Whenever the threat linked to the market is calculated, all
fruits may be considered is one category by arranging them in order.It
guarantees competence, precision and decreases considerably the expense
of market threats practices.
Saleem et al. (2010) explained that various fruits are known to be the
crucial source of food for human being and fruit gardening can play an
important role in the economic development of any country. The actual yield
of mango fruit in Pakistan produced at the farmers’ fields is considerably less
than its potential yields. One of the major factors causing this massive yield
gap is the lack of awareness of fruit growers regarding the modern production
technology. This deficiency on the part of the mango growers can be
overcome by comprehensive training and extension program for farmers
concerning modern mango production techniques. It was establish that the
most crucial experiences where farmers need training are intercropping in
Kharif and in Rabi season in selected mango fruit gardens, insect/pests and
diseases and their control measures, time of fertilizer application to mango

59
fruit plants and application of irrigation water in summer and in winter to
mango fruit plants, pollination of mango fruit plants, marketing of mango fruits
and adoption of recent improved varieties of mango fruits need more training.
The Chi square values for association between age groups, education level,
tenancy status, size of land holding and knowledge level, skill, attitude,
adoption level presented highly significant positive relationship between the
age group, education level, tenancy status, size of land holding of mango
growers and knowledge, skill, attitude and adoption level of recommended
practices regarding mango production, protection and marketing.
Adejo et al. (2011) studied examined the marketing channel and pricing
system of cashew nut in the eastern part of Kogi state. A total of 180
respondents were randomly selected from 3 market zones of the area. Data
collected were analyzed using descriptive statistics. The result from the study
indicated a unidirectional movement of cashew nut from the producers to the
final consumers. 14.67% of the marketers were involved in retailing and small
scale business, 38.33% were bulk assemblers and 20.00% of them engaged
in wholesales. This signifies the dominance of the middlemen in the marketing
activities of the study area. An average peak price of N60000.00k/ton was
recorded in the months of September-October, while the least prices were
recorded before and at the beginning of cashew nut production period. The
marketing of cashew nut is mostly affected by price instability due to
seasonality nature of its production and lack of storage and processing
facilities. However, a controllable pricing system for efficient and effective
marketing can be ensured by proper storage and consistent supply of cashew
nut in order to keep the market active all through the year.
Amao et al. (2011) investigated that pineapple, the third most important
tropical fruit in the world after banana and citrus is a delicious fruit with fine
flavour and high nutritive value. Its marketing is as essential as its production
because increases in production without a well-developed marketing system
lead to postharvest losses of all possible gains. The study analyzed marketing
channels and efficiency of the marketing system for pineapples in Edo and
Delta States. A multistage sampling technique was used in selecting

60
respondents within the study area. Data were analyzed using descriptive
statistics and gini coefficient. The major market channel for pineapple was
from the farmers to wholesalers to retailers. Market margin obtained per week
in October, 2010 was N47, 491.30 with marketing efficiency value of 1.33. A
major constraint to pineapple marketing is the perishable nature of the fruit.
The study suggests that the constraint of perishability can be controlled if the
marketers have access to storage facilities such as plastic trays. This will go a
long way in reducing the problem of damage during transportation of the
fruits.
Subodh et al. (2011) illustrated that India may be considered the
second highest fresh fruits provider among the rest of countries and its
contribution to the international market is around 9 percent. It is observed that
damages during picking, packing, grading etc. are around 19.32%, 14.48%
and 26% of the peach, ear and plum correspondingly. It is also noticed that
the cost of marketing activities is high as compared to the farmer’s return
obtained. The farmer got relatively less in end user ‘share in comparison with
market price and middlemen. The pear got more income as compare to peach
& plum as the efficiency ratio 1.31was higher and less shifting etc. cost. This
study show more efforts should be made to reduce the losses in fruits,
operational cost and enhancing the steps for suitable picking, watchful
packing, appropriate storage, best marketing,
Divya et al. (2011) carried study about the sweet orange market in
uttarakhand India and gathered information from numerous players like
farmers, market middlemen working in different location. Among many six
marketing channels were noted and approximately 57% of the product was
offered for sale in these to the local businessmen. It was observed that cost of
marketing varied from 278 per quintal to 894.16 per quintal in channel second
and farmers gained 100 percent more profit in second and third channel. The
farmers got only 9.38 % and 8.60 % in second and first simultaneously. It was
also observed that farmers received 1.27in the fourth and considered to be
the highest efficient among all while the sixth proved less effective (1.00) for
the orange farmers. Farmers got only 9 % of end user price. The difference

61
between nearby and faraway markets was observed above 2000 per quintal.
It is also cleared that farmers major share in cost are hiring usual labour and
shifting produce from one place to another. The farmers must be linked to the
best and suitable markets by better roads farmer’s organizations.
Samina et al. (2012) elaborated that young 'Kinnow' mandarin (Citrus
nobilis Lour × C. deliciosa Tenora) trees often create inferior quality fruit with
less juice and more rind and rag contents. However, less is known about the
role of PGRs on the fruit quality of young 'Kinnow' mandarin trees. Therefore
in the present investigation PGRs vizbenzyl adenine (BA) and kinetin (20 mg
L-1) were used at flowering (FL) stage and, BA, kinetin (10, 20 & 30 mg L-1)
and gibberellic acid (GA3) 10 mg L-1 were applied at fruit setting (FS) stage to
citrus plants and their role on fruit attributes were assessed and nearly after
picking (D1) and after 7 days of shelf (D7) at ambient status (20±2ºC; 60-65%
RH). The PGRs alone had significant impact on juice mass (%), rag mass
(%),ascorbic acid (AA mg 100 mL-1) and decreasing sugars (%) whereas,
rind mass (%), TSS, titrat able acidity (TA), TSS:TA and total sugars (%) were
not affected by PGRs applications. Regardless of storage life of the product
picked from earlier plants treated with 10 mg L-1 GA3, 30 mg L-1 BA and
kinetin at FS presented importantly maximum juice ingredients (50.53%,
49.8% &51.64%) and lower raw ingredients (26.5, 26.6 & 25.83%),
correspondingly in relation with untreated. Extreme less sugars (1.62%) was
obtained with 20 mg L-1 kinetin at bloom and extreme AA contents (58.45 mg
100 mL-1) of juice were recorded with un-treated. Maximum fruit attributes
excluding non-decreasing sugars (%) may be important during storage life. It
is noted that the citrus attributes except AA may be improved through using
kinetin.
Aparna (2012) studied on modern retail marketing of high-value
agricultural commodities is of inevitable importance in the developing
countries like India. The supply of vegetables by farmers to modern retail
outlets has brought in a new form of organized marketing based on consumer
demand. The study has assessed the marketing system by comparing
marketing cost, marketing margins, price spread, producer’s share

62
inconsumer’s rupee, marketing efficiency and marketing constraints of
supermarket channels and two traditional marketing channels in the
Rangareddy district of Andhra Pradesh. Two vegetables, viz. brinjal and
bhendi, have been selected for the study. It has been revealed that the net
price received by the farmers and producer’s share in consumer’s rupee are
higher in supermarket channel than in traditional channels. The supermarket
channel has been found more efficient than the traditional channels.
Rejections of low grade produce, procurement according to indent and lack of
knowledge of grading have been identified as the major constraints of
supermarket supply farmers. The major constraints expressed by the
traditional market supply farmers include middlemen menace, higher distance
to the market and high market charges. The study has observed that
government intervention is required to create a policy environment that may
ensure a mutually beneficial relationship between the farmers and the
organized sector. Investment in infrastructure, development of extension
activities and linkages with farmers is the important areas where government
should give due attention to strengthen vegetable supply channels in the
state.

63
III.MATERIALS AND METHODS
The methodology followed in this study consists of the initial
information gathering, both formal and informal with the main objective to
indicate the mechanism of the study and to produce both valid and reliable
information from the data. In particular this chapter is comprised of the
information about research area, data collection procedure, data source,
determination of sample size and analysis of the data. The main purpose of
this research is value chain analysis of Peach Fruit in Khyber Pakhtunkhwa.
3.1 Description of the Study Area
Swat District Lies towards the north of Khyber Pakhtunkhwa having
high mountain ranges, steep valleys and plains of fertile land. The total
population is 1.743 million people with 174705 numbers farm families. The
District is inhabited by poor and small scale farmers with average land holding
below one hectare per farm family. The total geographical Area is 506528
hectares, with 98054 hectares (Approximately 19%) cultivated .The irrigated
area is 92285 hectares (Kharif 56436 & Rabi 35840), while the rest of the
area is subject to the provision of rainfall. The altitude range is from 800 to
2500 meters above sea level with the main agro-ecological zones from warm
humid to dry cold. The annual precipitation is from 1000 to 1200 mm per
Annum and the temperature range is variable in different agro- ecological
zones with highest maximum 40C (Barikot, Mingora) and lowest minimum
1C to -10C (Kalam) of the District. In the north there are vallies where the
climatic conditions are conducive for growing off-season vegetables thus
fetching high prices to the growers.
The major cereal crops grown are maize, wheat and paddy followed by
Kharif, Rabi and other vegetables, oil seed and pulses as minor crops. The
favorable climatic conditions and availability of wide range of agro-ecological
pocket permits the production of different kinds of fruits and vegetables. The
major fruits grown are apples, peaches, persimmon followed by citrus’s,
plums, apricots, pears and nuts while major vegetables are onion and
tomatoes followed by potato, okra, turnip, cabbage, radish and cauliflower.
64
The total area under fruits is 12830 hectares with a production of 138836 tons
whereas the total area under vegetable (excluding onion and potato) stands at
8507 hectares with a production of 96708 tons respectively. 60% of the
Provincial production of major fruits and vegetables is produced in the district.
Fruits and vegetables are significant source of cash income derived
mainly from apples, peaches, persimmon, onion and tomato, maximum
quantity of which is marketed in down country markets with the main market in
Lahore, Rawalpindi and Peshawar. The total volume of fruits exported to the
above national markets, annually is aprox.113000 tons with a revenue of 1430
million rupees whereas the total export of vegetables including onion and
potato stand at 200000 tons with a revenue of 1385 million rupees
respectively.
3.2 Survey structures & data collection
The noted section depicts information about how the project villages
and union councils were selected, the conduction of preliminary data
collection in the selected area, design for sampling, target group numbers,
interview schedule formation and ensuring how best result or work can be
carried out in the study area. This section includes the information on the
selection of study area, informal survey, sampling design, sample size,
interview schedule development and quality control of field work.
3.2.1 Criteria for Selection of project area
In order to collect information/data about Peaches, Districts Swat and
Buner are intentionally selected as these are the most populous growing
areas/ districts of Khyber Pakhtunkhwa. (Government of Khyber Pakhtunkhwa
2007-08). According to Statistics in Khyber Pakhtunkhwa, there are different
varieties of Peaches which are grown and have 5047 Hectares area under
cultivation. District Swat has 3750 Hectares area under Peaches followed by
Buner 110 Hectares respectively. Similarly District Swat and Buner are the
leading peach producing districts in Khyber Pakhtunkhwa with production
42997 and 739 Tonnes respectively. Both these Districts are known for Peach

65
cultivation of different varieties due their climatic and favourable conditions
that is why these have been selected for the research/ study.
3.2.2 Preliminary data collection
In order to collect data from the target group peach farmers, seven
days were given for trial and preliminary data collection in the project area so
that the interviewer may go through the process and get sufficient experience
in filling the questioners in the coming days and also remove the deficiencies
if any in the questioners. This information proved very fruitful in finalizing of
the questioner. The assigned task was done in few villages of peach growers.
Going through the collected data, the interview schedule was designed and
modified for detail formal survey.
3.2.3 Peach Producers in the study area
Large number Peach farmers in the study area have mostly small
holdings, while very few farmers have big peach fruit orchards and they all
have some basic know how about the cultural practices as pit preparation
time, varieties selection, all costs involved in activities, peach bearing period,
ideal picking and packing, storing, transportation and marketing to the
potential markets. There are also some peach growers who sell their
orchards at the time either flowering and or late to the middlemen and reduce
their efforts but also get less income. Besides their own land, some peach
growers have rented in land for fifteen years lease. Only those peach farmers
were consulted for data collections who were fully involved in management of
their orchards through the year so that no basic information is missed.
3.2.4. Sampling plan
Every study has some pre-determined objectives and to achieve these,
well planned and well-designed actions are needed keeping in mind the time
period for survey, how many trained technical staff is required along with other
resources provided to them for dealing with diversified group of farmers and
area. It is also very much important to draw statistically representative
sample, so that the data could represent the entire group equally. The

66
researcher should also note that this data is convenient in mathematical
handling and calculation. The plan and researcher who make the sample data
collection successful and according to the objectives set prior. Random
sampling method for collection of data from peach growers in the study is
applied.
Among the Peach growing districts in Khyber Pakhtunkhwa, Swat and
Buner are the largest who were selected for the study and data collection.
(Government of Khyber Pakhtunkhwa, 2009-10). Following the same criteria,
Kabal, Barikot, Charbagh, Khwaza Khela and Matta union councils/ villages in
Swat were further chosen for formal survey while Pacha Kalay union council
was selected from Buner district. Table 1.1 shows that Swat having 3750
hectares and Buner have110 hectares area under peach respectively during
2009-10. Similarly, these districts produced 17626 tons and 410 tons of peach
respectively during 2009-10.
In the second stage, six union council/ villages namely Kabal, Barikot,
Charbagh, Khwaza Khela, Matta from Swat and Pacha Kalay Buner were
randomly selected from both districts keeping in the peach plant population
and farmer involvement.
3.2.5 Sample Population
The main purpose of the research was to assess the current peach fruit
production in the study area and how effectively local and national markets
play their contribution in our country. Two lists are used for determining the
sample size of the target group. A pilot survey was carried out for collection of
data on produce of Peach (Kilogram per hectare) from 60 respondents from
each village. Then the sample size for this study was estimated by using the
formula as follows (Cochran, 1977).
2
2/
e
Sn ----------------------------------------- 3.1

67
Where
n = Total sample size
S =443 Standard deviation of Peach yield (kilograms per hectare)
Z (α/2) =1.96; the value of standard normal variate at 95% confidence level
e = 50 Error (sampling error)
n = (443* 1.96/50)2
n = 300 number of peach respondents in the area.
Out of this estimated 300 sample size, 272 respondents from Swat and
28 from Buner are selected through proportional sampling technique.
Preliminary Primary data about the target group i.e. peach farmers was
obtained from the local revenue offices and was then verified from Agriculture
Extension Departments Swat & Buner. From this list of Peach growers sample
size in each village was selected as follows (Cochran, 1977).
NiN
nni --------------------------------------------------3.2
where
ni = Number of sample respondents in ith village of each district
n = Total sample size
Ni =Total number of Peach growers in ith village
N =Total number of Peach growers in both District
3.2.6 Distribution of Sample size in the study area
The following distribution of sample size was made according to the
Cochran formula in both district i.e. Swat and Buner. The selected villages/
union councils are having greater number of peach farmers as well as peach
orchards.

68
Table 3.1 Sample size and number of villages in study area.
District Name of Villages Total No in each
village per district
Respondents per
Village
Swat Kabal 1750/9500 55
Matta 2075/9500 65
Charbagh 1408/9500 44
Khwaza Khela 1520/9500 48
Barikot 1910/9500 60
Buner Pacha Kalay 130/1400 28
Total 300 Nos
3.2.7 Interview Schedule Development
Collection of information through interview schedule has great benefits
as quickly followed, well organized, can be kept for long time, cost effective
and trustworthy and also be verified after some time or mistakes. It has only
one short coming that it is pre fixed and other data or information may not be
recorded on the time of interaction or discussion (Lipton and Moore, 1972).
Hagues (1992) has mentioned four (4) characteristics of ideal questioner:
1. This gives the exact data which was asked by the interviewer.
2. Questions can be arranged in reasonable order for efficiently time
management and avoiding repetition and confusion.
3. It provides very less changes in quality responses.
4. These can be handled very conveniently during data calculation.
The above mentioned features have been noted when the data
structure was in planning form. Primary data for the current study was
collected through well-structured questionnaire while secondary data was
taken from various published and un- published sources. Interview schedule
was prepared in the light of study objectives. The primary data regarding
Peach produce, agriculture inputs used in the production process, prices of
Peach output, and other factors involved in the production and similarly all

69
cost of marketing including picking, packing empty carton and transportation
etc. were collected from the Peach growers. The survey was pertained to the
Peach production period 2010-11. The Interview Schedule so designed was
pre tested before finalization.
3.3 Model Specification and Estimation:
3.3.1 Production Theory:
The production methodology is the core idea in the principle of
economics. This describes that how physically agriculture inputs and their
yield relate one another. Inputs and outputs are always assumed to be
homogenous so that no quality differentials for different levels of a particulars
input or output exist) expecting highest yield may be obtained from the
association of all these agriculture inputs in the presence of available skill,
know-how and machinery.
Polynomial regression model was used in the analysis of data. The collected
data was analyzed by regressing the value added on the Peach fruit
production for each stage against the value of investment in the value chain.
The model used for the analysis is written explicitly, is as stated below:
Yi = b0+b1xi1+b2xi
2+b3xi3+-------+bkxi
k+ei
Where,
Yi = value added on the peach fruit production
Xi = value of investment in stage (t = 1, 2…..k stage i.e. investment/cost of the
stages of value addition).
b0 = Constant term
bi= Investment coefficients
e= Error term.
Generally, the objective of using a polynomial model is, to construct
composite variables, which are linear combination of exogenous variables to
capture the effect of each stage of the value chain on the value been added.
This model is regarded as a fairly sophisticated model, which has been widely
used in the estimation of polynomial relationships.

70
In order to estimate the determinants of participation in the value chain, the
following probit regression
The model is implicitly stated as
Y*i= (x1,x2,x3,x4,x5)+ei
Y*i= 1 if y*i>0, 0 if Y*I = 0
The explicit form of the model is stated as
Y*i= b0+b1x1+b2x2+b3x3+b4x4+b5x5 +ei----------------------------------4.1
Where
Y*i = probability to participate (participating=1, non-participating=0)
X1 = per hectare use of farm yard manure
X2 = per hectare use of labour for fym application
X3 = per hectare use of labour for hoeing in the peach orchards
X4 = per hectare use of labour for pruning in the peach orchards
X5 = per hectare quantity of fertilizers used in peach orchards
X6 = per hectare use of labour for fertilizers application
X7 = number of pesticides sprays per hectare
X8 = per hectare use of labours for pesticide sprays
X9 = per hectare use of labours for irrigations
Bi is the parameter
Ei is the error term
3.3.2 Estimation of Profitability and Investment Return
Cost Benefit Ratio can be estimated if current sum of value is divided
by the current sum of prices (Gittinger, 1982) and this can be mathematically
expressed as given (Erku & Rehber, 1998):
t
t
C
RCBR …….…………………….…………3.2
Here R means sum of return, C means sum of cost, i means interest
rate, and n is period and qt = (1+i) t. When the CBR is greater than 1, the

71
sum of return is > the sum of cost; when the CBR is equal to 1, then the sum
of return = the sum of cost; and when the CBR is less than the sum of cost,
then the return < the sum of cost.
3.3.3 Analytical Frame work for Production and Marketing Cost
(i). Production Cost:
Cicn
i
1
-------------------------------------3.3
Here,
Pc = Sum of Peach Production Costs of the different activities.
Ci = Prices of the activities carried out in peach fruit orchards including farm
yard manure, labour used for application of FYM, hoeing, pruning,
pesticides sprays, labour used for pesticides application, fertilizers, labour
used for fertilizer application and labour charges for irrigation .
(ii). Marketing Cost:
Cicn
i
1
-------------------------------------3.4
Here,
C = Sum Cost of shifting of the peach produce.
Ci = Price of the commodities given by peach growers during the marketing of
peach product up to the end user which are costs of empty cartons,
picking & grading, decoration materials, transportation, loading & un
loading and market charges .
3.3.4 Strengths, Weaknesses, Opportunities and Threats Analysis
The SWOT analysis is required to identify the potential and weak
points of peach fruit value chain in the study area as a base for future
planning based on strength, opportunities and overcoming the weaknesses.

72
3.3.5 The Effect of Quality on Peach Price.
The parameters can be estimated through regression where the Peach
price is a function of attributes of the product (be it Colour, Sizes, Varieties,
Taste or Firmness characteristics). A simple model of the following form can
then be estimated:
4.33210 WcGcRci
5.33210 SsMsBsi
6.3varvarvar 3210 LEi
7.3210 SrtSwti
8.3210 fSofHai
Where Pi is the price of the peach product i and
β0,β1,β2,β3 are the parameters.
Rc, Gc, Wc represent red, green and white colours of peach fruit.
Bs, Ms, Ss are big, medium and small sizes of the peach fruit.
Evar, Mvar, Lvar are early, medium and late peach varieties.
Swt and Srt stand for sweet and sour tastes while fHa and fSo mean firmness
in shape of hardness and softness of the peach fruit. Error term is explained
by ei.

73
IV. RESULTS AND DISCUSSION
This chapter contains results of the study, explains these results and
gives interpretation of these research findings. The chapter is divided into
seven sections. First section gives description of the socio economic
characteristics of the samples Peach growers, second section elaborates
significance of agricultural inputs in the peach production, third section Peach
production by different varieties, fourth section marketing cost and efficient
markets, fifth section profitability of the peach growers in the study area, the
six section the relationship between quality attributes, prices and seventh
section interprets econometric models.
4. 1 Socio- economic Characteristics of sampled Peach growers
In this section different characteristics of target group farmers are
presented like age, education, tenure status, no of family’s members involved
in agriculture, size of land holdings.
4.1.1 Age and Education level of the Respondents in the study area
As reflected in Table 4.1, total sample of respondents in both districts
was 300, where minimum age was 22 years and maximum 85 years with
mean 53 years. This means that the respondents group has young and old
peach growers having rich experienced in peach farming. Education in
particular plays an important role in behavior building, enhancing specific skill,
techniques, there by developing attitude which is required for profitable fruit
production. The results depicted that the literacy rate is (87%) among the
sampled respondents in the study area. It is evident from the result that
primary level, Middle , SSC, HSC, Graduate and Post graduate were 15%,
12%, 22%, 20%, 11, and 7% respectively while there was 13% illiterate in the
sampled farmers in the area.

74
Table 4.1 Distribution of the respondents based on the Literacy level.
Education level
No of Respondents
Percentage (%) of the
Total
Age of Respondents
Minimum Maximum
Primary
Middle
SSC
HSC
Graduate
Post Graduate
Illiterate
Total
45
36
67
60
34
19
39
300
15
12
22
20
11
7
13
100
22
85
Source: Field survey by author in 2010-11
4.1.2 Prominent Peach varieties in the study area
There are various peach varieties grown in the study areas, which are
given below. They have divided in three main categories depending upon their
characteristics, response to the climate and fruit maturity duration. Early
varieties are those whose fruit are ready earlier for sale and include Spring
Crest, Early Grand and Carmen. The middle varieties those whose fruits are
ready in the middle of the season and comprising of NJC-84, Elberta and
Sohanee while the late varieties are those whose fruit are available in the
market in late day of the season and are included Maria Delezia and Indian
Blood.
Table 4.2 List of prominent Peach growing varieties in the study area
Early Varieties Mid Varieties Late Varieties
Spring Crest NJC 84 (No 5) Maria Delezia (No 7)
Early Grand Elberta (No 6) Indian Blood (No 8)
Carmen (No 4) Sohani -

75
4.1.3 The effect of education level on peach productivity per hectare in
value chain during 2010-11
H10: Education has statistically significant effect on productivity and income
H11: Education has no effect on productivity and income
Education plays an important role in farming and specially fruit orchard
growing. The study was tested for the above hypothesis using F-statistics and
conclusions were drawn and explained as follow. As evident from the table
4.3, the peach productivity of post graduate, primary level and illiterate peach
orchard growers are21.104Tons, 19.513Tons and 18.631Tons per hectare
respectively. This clearly shows positive correlation between education and
productivity. It is concluded from the study that there is statistically significant
effect of education level on peach production and the hypothesis is accepted
on the basis of F. statistics 2.04 (0.02).
The study examined the hypothesis for orchard income and showed in the
Table 4.3 that the highest return per hectare of Rs.649,761 has been obtained
by the primary level peach grower, followed by post graduate and illiterate
peach orchard growers with the average income per hectare of Rs. 649,178
and Rs.618,671 respectively. The F- statistics 0.183 (0.981) showed that the
null hypothesis is rejected for income based on the values obtained and
verified that there is no effect of higher education level on the peach orchard
income.

76
Table4.3 The effect of education level on average productivity per
hectare by in the study area during 2010-11
Education Level Number of
Respondents
Mean Production
in (Tons)
Gross Income
(Rs)
Primary* 45 19.513 649,761
Middle 36 17.465 610,381
SSC 67 17.932 606,763
HSC 60 15.904 606,911
Graduate 34 17.621 614,242
Post Graduate* 19 21.104 649,178
Illiterate 39 18.631 618,671
Total 300 17.964 618,760
F- value 2.04 (0.02) 0.183 (0.981)
Source: Field survey by author in 2010-11
4.1.4 The effect of land holdings on average peach productivity per
hectare in the study area
H20: Medium peach growers have more productivity than small or big
peach orchard growers.
H21: Medium peach growers have not more productivity than small or
big peach orchard growers.
The study showed that how many peach varieties have been planted
by respondents in the study area. 131 numbers of peach growers have
established single peach variety orchard with 44 percent major share of the
total numbers. 73 numbers of farmers have grown 2 different types of peach
varieties with 25 percent share of total numbers while 96 numbers of farmers
have planted 3 different types of peach varieties in the study area with 31
percent shares of the total numbers of respondents.
It is depicted in Table 4.4 that big peach orchard owners having three number
of fruit peach orchards have got only 18.95 tons per hectare which is less than
the growers having one or two peach orchards and their mean productions

77
are 16.61tons and 19.10 tons respectively, so the hypothesis is rejected on
the basis of F- statistics 3.158 (.044) values and is concluded that the medium
peach orchard growers have more production per hectare than small or big
peach orchard growers in the area.
Table 4.4 peach productions per hectare in Tons of different levels of
growers in the study area during 2010-11
Categories of
Farmers
Number of
Peach varieties
sown
Number of
Peach
growers
Mean
Production
in Tons
Percentage
of the Peach
growers
Small growers 1 131 16.61 44
Medium
growers*
2 76 19.10 25
Big growers 3 93 18.95 31
Total 300 17.96 100
F-Statistics3.158 (.044)
Source: Field survey by the author 2010-11
4.1.5 Peach orchard size, its frequency distribution and mean
productivity per hectare in peach value chain in the study area
H30: Orchard size in hectare has statistically significant effect on
peach productivity
H31: Orchard size in hectare has no statistically significant effect on
peach productivity
The given table 4.5 depicts peach orchard size in hectare, its distribution and
mean peach production of the respondents in the study. It is generally known
that big orchard growers, who have more orchards area or land holding in
hectares will be having more production. But the F- Statistics 1.009 (.449)
after testing the hypothesis revealed that the orchard size in hectare has no
effect on the per hectare peach production as the farmer having 4.4 hectare
has produced 23.35tons per hectare more than the farmers of 11.2 hectares
of peach orchard growers who has got 17.64 tons. There is no correlation

78
between more orchard size in hectare and peach production per hectare.
Thus the hypothesis is rejected on the basis of peach orchard area in hectare
will give more production per hectare.
Table 4.5 Peach orchard sizes, its frequency and mean production per
hectare of Peach growers
Land holdings of
Peach growers
No of
Respondents
Mean Peach Production
per hectare in Tons
Standard
Deviation
0.40Hectares 50 22.81 2837.15
0.80Hectares 102 17.07 3192.42
1.2 Hectares 26 18.29 3157.42
1.6 Hectares 31 15.33 4254.02
2 Hectares 25 18.46 2773.72
2.4 Hectares 20 18.68 4237.86
2.8 Hectares 10 18.45 2540.13
3.2 Hectares 14 17.56 4634.33
3.6 Hectares 3 18.29 4384.78
4.0 Hectares 7 18.97 4166.14
4.4 Hectares 1 23.35 4537.86
4.8 Hectares 4 20.58 4698.30
5.2 Hectares 2 20.52 4346.66
6.4 Hectares 2 18.52 2121.32
6.8 Hectares 1 11.51 2575.55
9.2 Hectares 1 12.88 3673.75
11.2 Hectares 1 17.64 3164.37
Total 300 Nos 17.97 3371.15
F- Statistic1.009 (.449)
Source: Field survey by author in 2010-11

79
4.3.1 Variety wise average peach production per hectare in the study area
H40: Late peach varieties have statistically significant relationship
with peach production
H41: Late peach varieties have no statistically significant
relationship with peach production
It is generally understood that late peach varieties namely Maria
Delezia and Indian Blood gave more fruit production as compare to early and
mid-season peach varieties due to long season and more cultural practices.
This hypothesis was tested in the study and some conclusion was drawn from
the table 4.7.It is evident from the table that the mean fruit production 23.05
tons of Sohani variety per hectare is the highest of all, followed by20.12 tons
of Elberta and 18.50 tons of Spring crest being the high yielding peach
varieties which are mid and early season peach varieties while the average
fruit production of Maria Delezia and Indian Blood being late varieties are
16.82tons and 16.64 tons respectively. The f- statistics .556(.792) shows that
the late peach varieties have no statistically significance relationship with
peach fruit production and thus the hypothesis is rejected on the basis of f-
statistics.

80
Table 4.7 Variety wise average peach production per hectare in the study area during 2010-11
Name of Peach
Variety sown
Number of
Respondents
Production per
hectare in Tons
Std. deviation
Early Grand
Spring Crest
Carmen
NJC 84
Elberta
Maria Delezia
Indian Blood
Sohani
Total
F- Statistics
67 Nos
28 Nos
05 Nos
103 Nos
24 Nos
27 Nos
34 Nos
02 Nos
300 Nos
17.75
18.50
17.35
18.11
20.12
16.82
16.64
23.05
17.97
.556 (.792)
39661.497
52567.282
9666.288
28987.507
22309.91
16154.967
15363.845
11313.708
32555.923
Source: Field survey by author in 2010-11
Table 4.8 Comparison between Pakistan and World Peach
production in 2001-2010 (Metric Ton)
Countries 2001 2002 2003 2004 2005 2006 2007 2008 2009 2010
China 4596157 5259806 6179 365 7040472 7649678 8243298 9080215 9563679 10170038 10718048
Italy 1679100 1586590 1175860 1710010 1693150 1664810 1630440 1589120 1691790 1590660
USA 1341640 1422020 1341000 1429810 1301900 1132 530 1279 310 1304350 1197670 1044440
Spain 1082290 1275830 1270820 987574 1260880 1245530 1222070 1244290 1191300 1134750
Greece 943336 68 7000 228000 875544 864406 767938 816009 734100 749000 639400
Turkey 460000 455000 470000 372000 510000 552775 539435 551906 547219 534903
Iran 380000 385000 390000 400770 439770 371000 421304 574858 496130 500000
France 438784 445675 338800 386511 390554 384166 352030 292490 341715 314721
Egypt 247300 339266 30 2667 360397 360000 427639 452273 399416 363209 273256
Chile 290000 293000 304000 311000 311000 345000 370000 372000 388000 357000
Argentina 257768 211922 255785 272442 272500 260000 270000 308731 290774 318000
Brazil 222616 218292 220364 235720 235471 199719 185959 239149 216236 220739
Mexico 175752 197946 223883 201957 208185 220063 192261 202066 198085 227401
Pakistan 33000 33000 37600 76300 76300 69500 70300 71200 82300 83700
Source: FAO 2011
The comparison of different peach producing countries with Pakistan is under
scored from 2001 to 2010 in the Table 4.8. The comparison has been given
among the top fourteen peach production countries globally.As indicated in

81
the Table 4.8, Pakistan was the lowest in peach production in 2001, and the
same decreasing trend for peach production was observed for the onward
period upto 2010. The top producing countries have worked very hard on their
peach production processes in the production chain for getting maximum
production while Pakistan has still to do more for reaching the optimum
production capacity. This means that there is high potential for increasing the
fruit production and dire needs for continuous efforts by all the stakeholders in
the production chain. Studies about peach or other fruits have been
conducted like other regional countries where peach is growing in abundance.
The previous research studies Clare et al. (2009) had also illustrated such
comparison between Indian and Kenyan fruit production to encourage the
policy and value chain players to overhaul and improve the value chain
strategies.
4.3.2. Relationship between average price per ton and peach late
varieties in the marketing value chain
H50: Late peach varieties fetch highest price and have statistically
significant on effect peach marketing
H51: Late peach varieties fetch no highest price and have no
statistically significant on effect peach marketing
It is farmer’s perception that late peach varieties namely Maria Delezia
and Indian Blood fetch highest price per carton as compare to early and mid-
season peach varieties due to prolong marketing season. This hypothesis
was tested in the study and conclusion was drawn from the table 4.8. It is
reflected from the table 4.9 that the average price Rs. 34750 per ton of
Carmen peach variety is the highest of all, followed by Rs. 33750 per ton of
Early grand which are early season peach varieties while the average price
per carton of Maria Delezia and Indian Blood being late varieties are Rs.
33625 and Rs. 31635 respectively, while the peach price per ton was R 7503
in South Africa. The f- statistics 1.770 (.093) shows that the late peach
varieties fetch no highest price and have no statistically significance effect on

82
peach fruit in marketing chain and thus the hypothesis is rejected on the
basis of f- statistics. It has revealed from the studies that In Turkey and India,
late peach varieties are fetching maximum returns to the producer.
Table 4.9 Average peach price per ton and peach late varieties in the
marketing value chain during 2010-11
Name of Peach Variety No of
Respondents
Mean Price per Ton Standard
Deviation
Early Grand* 67 Rs. 33750 53.06
Spring Crest 28 Rs. 30500 30.824
Carmen* 05 Rs. 34750 54.498
NJC 84 113 Rs. 33000 48.361
Elberta 24 Rs. 30875 39.727
Maria Delezia* 27 Rs. 33625 44.154
Indian Blood 34 Rs. 31625 43.309
F- statistics 1.770 (.093) Source: Field survey by author in 2010-11
4.4.1 Average sale price of peach per ton at different national level
markets in marketing chain
H60: High sale price per ton has statistically significant relationship
with big fruit markets in marketing chain.
H61: High sale price per ton has no statistically significant relationship
with big fruit markets in marketing chain.
It was pointed out in the study of Mango marketing in Sindh by Khuskh
and Smith (1999) that major markets at national level play an important role in
the marketing of mango and these big and vital markets give maximum
income to the producers due to more demand and supply to all over the
country. Similarly it is usually believed that big fruit markets like Rawalpindi,
Lahore and Peshawar have high prices per ton for all varieties of the peach or
other fruit. This hypothesis was tested in the study and it was concluded from
the table 4.10 that average price of ton for peach fruit at Gujranwala was Rs.

83
36625 and was followed by Faisal Abad Rs. 35375 per ton. These are two
small national level fruit markets as compare to Rawalpindi, Lahore Peshawar
and Karachi. The f- statistics 1.169(.320) shows that sale price has no
statistically significant in relationship with big fruit markets in marketing chain
and even small scale fruit markets can fetch high price and thus the
hypothesis is rejected on the basis of f- statistics. It is confirmed in the study
that some timed the relatively small scale market can give highest returns to
the producers due to various factors like timely supply and more demands etc.
Table 4.10 Average sale price of peach per ton at different national
level markets in marketing chain
Name of National Market
No of Respondents
Mean Price per Ton
Standard Deviation
Rawal Pindi* 114 Rs. 35000 46.544
Lahore 102 Rs. 29625 39.787
Peshawar 42 Rs. 31875 43.124
Mingora 02 Rs. 32500 1
Faisal Abad* 35 Rs. 35375 40.737
Gujranwala* 04 Rs. 36625 28.723
Karachi 01 Rs. 35000 -
Total 300 Rs. 32750 47.111
F- statistics 1.169(.320) Source: Field survey by author in 2010-11
4.4. 2 Relationship between marketing cost per hectare and late peach
varieties in marketing chain in the study
H70: Late peach varieties have statistically significant effect on
marketing costs in the value chain.
H71: Late peach varieties have no statistically significant effect on
marketing costs in the value chain.

84
It is evident from studies in the peach growing countries like Turkey
and India that marketing costs of late peach varieties are more than the other
varieties and thus have less income and economically viable. Peach growers
in the study area have general idea that late peach varieties have more
marketing cost per hectare as compared to early and mid-season varieties
and relatively less income. There might be more number of empty cartons,
number of picking, grading, transportation cost and Maundi commission
based on long and late season. The hypothesis was tested in the study and it
was concluded from the table 4.11 that the highest marketing cost Rs.
321101per hectare was noticed of Sohani peach variety, followed by Carmen
of Rs. 248269 which is mid-season peach varieties. Spring crest has also high
marketing cost Rs. 95284.29 per hectare among the all other varieties. The f-
statistics .586 (.767) shows that late peach varieties have no statistically
significant on the marketing cost and early and mid-season peach varieties
have more marketing costs per hectare in the study area and thus the
hypothesis is rejected on the basis of f- statistics.
Table 4.11Relationship between marketing cost per hectare and late
peach varieties in marketing chain in the study
Name of Peach
Varieties sown
No of
Respondents
Mean Marketing
Cost per hectare
Standard
Deviation
Early Grand 67 Rs. 227411 39175
Spring Crest* 28 Rs. 235352 37730.54
Carmen 05 Rs. 248269 44505.04
NJC 84 113 Rs. 226309 41983.79
Elberta* 24 Rs. 245449 37072.63
Maria Delezia 27 Rs. 211037 32434.37
Indian Blood 34 Rs. 223655 28221.19
Sohani* 02 Rs. 321101 22627.41
Total 300 Rs. 228253 38224.7
F-statistics .586 (.767)
Source: Field survey by author in 2010-11

85
4.4.3 Average sale share of peach fruit in different national level
markets in the marketing chain during 2010-11
Various studies of fruit and vegetables have described that there are
some major and important fruit and vegetable markets in the country namely
Rawalpindi, Lahore, Peshawar, Karachi, Faisal Abad in Pakistan etc. Large
quantity of various fruit and vegetable are coming to these markets and which
are further supplied to other markets and parts of the country while some part
is also exported to Gulf and other countries. The table 4.12 represents that
how much of the peach fruit was sold to each national level market by the
respondents during 2010-11. It was showed that out of three hundred (300)
respondents, 102, 90, 42, 35, 10, 7, 5, and 9 numbers have sold their produce
to Rawal Pindi, Lahore, Peshawar, Faisal Abad, Mingora, Gujranwala ,
Karachi and others national level markets at different times with 36, 41, 9, 6,3,
1,1 and 3 percent respectively. It was revealed from the table 4.11 that there
were three main peach fruit markets namely Rawal Pindi, Lahore and
Peshawar where maximum numbers of respondents have sold their peach
fruit 2864 tons, 3261 tons and 716 tons respectively in the marketing chain
with highest percentage of the total fruit produce during 2010-11
Table 4.12Average sale share in tons of peach fruit in different national level markets in the marketing chain during 2010-11
Name of national
markets
Number of
Respondents
Average market
Sale share in tons
Percentage (%)
of the total sale
Rawal Pindi 102 2864 36
Lahore 90 3261 41
Peshawar 42 716 9
Faisal Abad 35 477 6
Mingora 10 239 3
Gujranwala 7 80 1
Karachi 5 80 1
Others 9 239 3
Total 300 7955 100
Source: Field survey by author in 2010-11

86
4.4.4 Average total costs of Peach Production per hectare in the study
area during 2010-11
Hewitt 2000 has mentioned various factors of production and their
costs in his study of costs of peach production in Florida. He has estimated
the cost of cultural practices like pruning, Chemical sprays, Fertilizer
application, irrigation application and other costs per hectare which were
more than the costs in the study area. The low cost of peach production in
the study area was mainly due to the cheap labour and less investment on
the orchards. Similarly different farming practices were taken place in peach
production chain and Table4.13 showed peach cultivation management
practices and the expenses made on these practices mainly were purchase
of chemical application, daily wage labor for the application of chemicals,
purchase of green manure, hiring of daily wage labor for the application of
manure, hiring of labor for hoeing, pruning, purchase of different fertilizers,
hiring of labor for application of these fertilizers and labor for irrigation
application
The average total costs per hectare of these practices were Rs.19905;
Rs.5411, Rs.12919, Rs.3036, Rs. Rs.4454, Rs.3458, Rs.27208, Rs.1938
and Rs.3040 respectively were spent. In the management practices, large
amount of Rs. 27208 per hectare was spent on fertilizers followed by
pesticides spray cost of Rs. 19905. The total average peach production cost
per hectare was Rs. 81369

87
Table 4.13Average total costs per hectare of Peach in Production chain
in the study area during 2010-11
Name of Activities Per hectare
Pre harvest farmers
Mean Cost in Rs.
Std. Deviation
Cost of Pesticides 300 19905 4120.80
Labour Cost for Pesticides
application
300 5411
893.97
Cost of FYM 300 12919 3073.94
Labour Cost for FYM application
300 3036 880.85
Labour Cost for hoeing 300 4454 861.85
Labour Cost for pruning 300 3458 493.92
Cost of different Fertilizers 300 27208 3389.99
Labour Cost for Fertilizer
application
300 1938 430.18
Labour Cost for Irrigation 300 3040 631.01
Total 81369 Source: Field survey by author in 2010-11
4.4.5Total average marketing costs per hectare of Peach in the study
area during 2010-11
Ghandi et al (2002),Prakash and Singh (2002) have studied marketing
channel, farmer’s share in consumer price and various factors involved in the
marketing of fruits in India. They pointed out the exploitative role of middle
men, commission agents and transporters in shifting the fruits from farm to
markets. They further showed that the marketing cost floats nearly eight per
cent of the end user price for vegetables and approximately 11 to 15 per cent
for fruits. Carriage cost and commission are the most significant of all costs.
Here may be few significant after harvesting and marketing practices in
the value chain and were reflected in Table 4.14. Among the main marketing
practices of peach fruit in the value chain, some were buying of carton for
packing, expenses on hiring labour for picking, making grading, expenses
incurred on the purchase of various decoration items, shifting of fruit from
farm to down country markets and charges in the main markets.

88
The marketing costs per hectare of these activities were Rs. 71848,
Rs. 21898, Rs. 25785, Rs. 59417, Rs. 6746 and Rs. 43291 respectively. The
maximum expenses per hectare among the marketing practices was Rs.
71848 of buying of cartons for packing and next by Rs. 59417 of shifting
expenses of various peach cultivars to several down country markets. The
total average peach marketing cost per hectare was Rs, 228985 for all the
marketing interventions. Hence the increased costs of carriage of peach fruit
and commission agents’ charges were more due to the exploitative role of
these in the markets.
Table 4.14 Total average costs per hectare of Peach in marketing value
chain in the study area during 2010-11
Name of Activities/items Per hectare
Producers Mean Cost in Rs
Std. Deviation
Cost of Empty cartons 300 71848 12571.15
Labour of picking/ grading 300 21898 5342.01
Cost of decoration materials 300 25785 6209.38
Cost of transportation 300 59417 12911.29
Cost of loading & un loading 300 6746 2268.76
Commission agents charges 300 43291 7831.50
Total 228985 Source: Field survey by author in 2010-11
4.5.1 Relationship between averages Revenue per hectare and different
Peach varieties in the value chain in the study area
H80: Late Peach varieties fetch more revenue than the early and mid-
season varieties in the value chain.
H81: Late Peach varieties do not fetch more revenue than the early
and mid-season varieties in the value chain.
Stephen and Jeff (2009) presented the economics of apple supply
response which can be recognized for adopting plantings of the different
trees, eliminations of old. The vital parameters are revenue for apple, cherry,
climate and spending on the orchards. These factors seem very important
under consideration of new sowing choices of different varieties while the

89
replacement have estimated income in short duration for apples and peaches.
The fruit produce is directly dependent on cost and climate of the area. They
have concluded that arte of investment and type of fruit varieties would fetch
maximum returns to the producers of an orchard. It has noticed that Peach
orchards were increased in the research districts as economical and well
learned farmers have brought more land under cash crops like orchards.
Different Peach varieties are growing on commercial level in the research
area and peaches with good attributes are produced due to favourable
environment in the area. Sufficient amount may be needed for planting new
orchards, and carrying management activities in the established orchards.
The research tested the above hypothesis for relationship between
revenue and different early, mid and late season peach varieties. It was
noticed in table 4.15that the total average income per hectare of mid-season
peach cultivar (Sohani) was the maximum Rs. 835,683, next by early season
peach varieties Carmen and Early grand with Rs. 658,288 and Rs. 657,290
correspondingly. The F- statistics .525 (.816) reject the hypothesis and
shows that the late peach varieties do not fetch highest revenue per hectare.
Table 4.15 Relationship between average Revenue per hectare and different Peach varieties in the value chain in the study area
Name of Peach
Varieties sown
No of
Respondents
Mean Revenue
per hectare in Rs.
Standard
Deviation
Early Grand* 67 657,290 134556.03.
Spring Crest 28 591,297 101245.37
Carmen* 05 658,288 115769.19
NJC 84 113 614,793 111480.74
Elberta 24 601,222 90707.32
Sohani* 02 835,683 124922.19
Maria Delezia 27 588,988 87693.37
Indian Blood 34 596,080 85582.30
Total 300 618,760 109857.21
F-statistic .525 (.816) Source: Field survey by author in 2010-11

90
4.6 Value Chain Analysis
4.6.1 Value chain map of Peach fruit in Study area According to McCormick and Schmitz (2002), value chain mapping enables to
visualize the flow of the product from conception to end consumer through
various actors. It also helps to identify the different actors involved in the
peach value chain, and to understand their roles and linkages. Consequently,
the current value chain map of peach fruit in the study area is shown in Figure
1.
Figure1. Current Peach Value Chain Map in the Study Area.
Source: Own sketch from survey result, 2010
4.6.2 Key Players and their role in the Peach Value Chain
Various key players in the figure were presented who were involved
directly or indirectly in the value chain. According to KIT et al. (2006), those
who are directly participating in the value chain may be also profitable
practices like (raw material suppliers. orchard growers, businessmen and end
users etc) and indirect players are those who provide monetary or non-
monetary linked facilities, like banks, entrepreneurs, government, Non-

91
governmental organizations, cooperatives, research experts and agriculture
extension workers.
Primary actors
The key players in peach value chain in study area were pesticides,
various fertilizers, cartons and decoration materials etc. suppliers, peach
producer, businessmen and end users. Every player makes some value
addition while the product moves further. There are different players who have
their own work and they perform either one or more in the value chain.
Input Suppliers
There are several key players who are supplying raw material directly
or indirectly in the chain in the research districts. Presently the raw material
supplies are made by the individual trader and they have working throughout
the study area. All such actors are responsible to supply agricultural inputs
like fertilizers, herbicides, pesticides, empty carton, decoration materials and
other farm implements which are essential inputs at the production and
marketing stages. (Table 4.6 & 4.13).Regarding fertilizers, some farmers used
both inorganic (chemical fertilizers) and organic fertilizers (manure and
compost) while some farmers used only inorganic fertilizer depending on the
land size, resource allocation to, peach varieties and the soil fertility status as
perceived by the farmers. It was revealed in the study that all agriculture
inputs including pesticides, fertilizers, FYM, empty cartons, farm machinery
and other necessary items are 100 % supplied by private vendors in the study
area.
Peach Producers
Different Peaches varieties are generally produced by small, medium
and big farmers in the study area who grow peach as major fruit orchards.
Peach orchards growers usually sell their orchards to those traders who have
best price for the orchards. Orchard farmers may rely on the businessmen for
shifting their products to down country markets and some times selling rate
may be fixed by the commission agents or businessmen. (Koenig,
2008).Peach growers are mostly not aware of the markets price on the daily

92
basis, therefore have no or vey less negotiating authority in the markets. As
the peach fruit can be stored for longer period and that is why the farmers are
compelled to sell their fruit immediately. Similarly the growers have also not
too much information about the end users choices and best quality grading
procedures of known and posh markets. The low graded fruit are mostly used
by either the farmers themselves or sell to the nearby markets(Mingora and
Swari etc.). In such way the growers who have no or very weak linkages with
the commission agents and are remote from the markets are mostly suffered.
Broker
Broker is a man who is neither middleman nor big seller but he is also
not owner of the products any stage of the value chain.(Koenig et al. 2008).
He is only the mediator between the farmer and buyer and fixes the rate of
product for one of the side. They are rewarded for their services rendered to
either side for making the deal among them. They are making connection
between farmers and middlemen at field stage and middlemen to big seller at
buying selling place. Large quantity of peach fruit is bought and sold by these
brokers who are also called intermediary. Rate of peach fruit is largely
influenced by them.
Traders
Various entrepreneurs are participating in different part of the value
chain, which may include middleman businessman, brokers and big sel lers.
The fruit mostly reaches the end user after passing many entrepreneurs but
sometimes the peach fruit is sold directly to the end uses and small seller.
The retailer is not a businessman, rather transfer the products to the end
users and receive the payment. The horticulture sector mainly production and
marketing thus provide job chances and the young generation can take
benefit of it. The study showed that usually the routine trade facilities are not
very public and there are also less numbers of support and relation in their
organizations. It was realized that there are businesses for a long period with
less routine office buildings which shows the mode of work and their non-
formal associations.The middleman usually buys some products from one or
few growers sort them and then sell the whole quantity to big seller who then

93
sells the products in a big market. The middleman largely buys fruit products
from farmers, other middleman or small scale seller at collection point and
then sells to large scale seller or sometimes to organizational end users but
mostly sells to the best known wholesaler.
Wholesaler
A wholesaler is one trades of peach other fruit in entirely in an
organized big market. Mostly he is buying from middleman or producers and
sells to small scale seller or another bid seller. Opening and setting and
controlling the price of a particular fruit category in big market are usually
done by him. He is in regular touch with the middlemen so that to regularize
the inflow of products and ask for additional quantity if needed or avoid extra
supplies. Due to the lack of funds, storing area for fruits and cold storages, the
wholesaler is compelled to sell out whole quantity of peach and other fruits
bought on the same day leading to the uncertainty of rates in the markets.
Mostly the cold storages are considered greater problem in developing
countries by the producers and specially value chain players. Peaches are not
stored for long period but can be stored for shorter period. Businessmen who
have their cold storage installations may be able to gain maximum benefits at
the time of larger fruit supplies. Maximum numbers of farmers brings peach
product to the buying and selling place by trucks early in the morning and
expects to trade all the produce on the same daytime.
Market entry can be difficult for wholesalers because business
relationships are so informal. Interviews with key informants indicate that to
successfully enter into the market, a wholesaler must purchase goods at a
loss until he builds trust with intermediaries and/or brokers along the supply
chain. Thus, a trader must have the capacity to invest a considerable amount
of capital upfront to successfully enter the market as he will likely suffer losses
for several weeks before he will successfully find produce at realistic, market
prices. According to the study the main whole sale markets namely Lahore,
Rawalpindi, Peshawar and Faisalabad marketed the 407684 Nos, 357967
Nos, 89492 Nos and 59661 Nos cartons respectively.
94
Retailers
Retailers purchase produce from wholesalers or other retailers and sell
to consumers. Many retailers operate in the same wholesale markets from
which they purchase the fruit. The retailer are mostly shop keepers and hut
owners. According to the study, the most significant constraints faced by
retailers were included: poor market infrastructure, seasonality of fruit supply,
highly perishability and wholesale price fluctuation / volatility.
Transporters
Many transporters and few traders have their own trucks, which are
usually rented from transporters, which are available during the marketing
time of peach fruit from the study area to the down country markets like
Peshawar, Rawal Pindi, Lahore and Karachi etc. The rate varies during the
peak time subject to the diesel prices and distances. The main constraints
expressed by transporters interviewed were: the excessive number of police
checkpoints and road blocks along trade routes, and inadequate parking
space and congestion in wholesale markets.
Cooperation
Cooperation between all actors along the value chain is low. Most
operate individually without the support of farmer or business organizations or
contractual agreements (Koenig, 2008). Farmers association or groups are
uncommon in the Study area. Agreements and informal contracts between
market participants are characterized and even dependent upon, very high
levels of trust (Koenig, 2008). Retailers often pay the wholesaler progressively
throughout the day as they sell goods to consumers. Wholesalers generally
set buying prices with retailers but retailers are in a strong bargaining position
when setting price to sell to consumers. The bargaining power of retailers,
however, differs considerably between high and low seasons as peach supply
fluctuates.
Exporters
Different exporters of peach fruits are identified in main wholesale
markets and they are exporting their peach fruit to Gulf, China and
Afghanistan etc. Almost all peach varieties were exported to these markets.

95
Due to its highly perishable nature of peach fruit, very little quantity of peach
fruit was exported during the study year.
4.6.3 Supporting actors
Such actors are those who provide supportive services including
training, extension, information, financial and research services. According to
Martin et al. (2007), access to information or knowledge, technology and
finance determines the state of success of value chain actors. Agriculture
Extension Department, Agriculture Research system, Commercial banks and
micro finance, local and INGOs and private sector were main supporting
actors who play a central role in the provision of such services.
4.6.4 Marketing Channel in the study area:
Farmers→Middlemen→Wholesalers→Retailers/Supermarkets→ Consumers
This is the main marketing channel, peach farmers send their produce
to aggregator/ local area or village commission agent, who is in touch with
wholesalers at major national markets like Peshawar, Rawal Pindi, Lahore,
Gujranwala and Karachi etc. and sends the produce to them. The peach fruit
is then sold and transported to retailers/ other wholesale markets near the
wholesale markets and finally to consumers throughout the country.
4.7 Market Margins and Marketing efficiency
Prasad and Hanumanthaiah(2011) analyzed supply chain in marketing
of sweet orange in the Nalgonda district of Andhra Pradesh India. It was
noticed that the marketing efficiency in the small market chain was greater
than 1. Due to greater threats both in production and marketing, the growers
were willing to sell their produce to the pre- contractor in pre- harvest season.
Thus the producers were getting less return by averting risks.

96
Amao et al. (2011) investigated marketing channels and efficiency of
the marketing system for pineapples in Edo and Delta States. The major
market channel for pineapple was from the farmers to wholesalers to retailers.
Market margin obtained per week in October, 2010 was N47, 491.30 with
marketing efficiency value of 1.33. A major constraint to pineapple marketing
is the perishable nature of the fruit. The study suggests that the constraint of
perishability can be controlled if the marketers have access to storage
facilities such as plastic trays. This will go a long way in reducing the problem
of damage during transportation of the fruits.
There are two ways to estimate marketing performances which are
marketing margins and marketing efficiency. Marketing margin is generally stated
the difference between producer and consumer prices of an equivalent quantity
and quality of a peach fruit while marketing efficiency means the degree of
market performance.
Marketing margin was calculated as follows:
TMCTRMM
Where;
TR = Total revenue
TMC = Total Marketing Cost(Costs of empty carton, picking,
packing, loading, un- loading, transportation and market
charges)
MM = Marketing Margin
Marketing efficiency was calculated as below;
TMC
TRME
Where;
ME = Marketing efficiency

97
In Table 4.16, the marketing margin received for Peach marketing in
the study area is Rs. 389775 for 7.274Tons per hectare Peaches marketed
during the season while the efficiency of Peach marketing was 2.70. The
marketing efficiency obtained in this study is greater than one (1). Despite the
fact that the marketing efficiency of Peach from the study was efficient (as
reflected in the table 4.16, the efficiency value was greater than 1). This can
be further improved and can bring more margins to the Peach producers in
the study area. The major constraint to peach marketing is the perishable
nature of the fruit. The study suggests that the constraint of perishability can
be controlled if the marketers have access to refrigerated trucks or vans for
shifting the fruit in sound condition to the national level markets. This will go a
long way in reducing the problem of damage during transportation and timely
supply of the fruits in the markets.
Table 4.16 Average Marketing Cost and Marketing Efficiency of Peach
fruit in the study area during 2010-11.
Name of Costs Quantity/Value in Pak Rs.
Quantity of Peach fruit marketed 7.274Tons
Average Total Marketing Cost (ATMC) 228,985
Average Total Revenue (ATR) 618,760
Marketing Margin (ATR- ATMC) 389775
Marketing margin Percentage (%) 62.99%
Marketing efficiency (ATR/ATMC) 2.70
Source: Field survey by author in 2010-11
4.8 Constraints in Peach Production and Marketing
Sait et al. (2004) have elaborated the cultural and financial constraints
of farmers in getting best condition peaches in Turkey. Sometimes peaches
and their farmers face high risk in production and selling. It was noted that
peach cultivation or farming lead to profit but must gathered prior information
about selling and buying conditions. Peach farming proved very common in
areas where farmers are small particularly farmers have scarce resources.
Farmers usually face so many issues in production and marketing.

98
Khalid et al. (2007) expressed major difficulties which have delayed the
optimum fruit production in Pakistan and their export to the potential markets.
The research was confined to investigate the major constraints in selling
mechanism and give recommendations in procedures and methods for
increasing the global export to other countries. Pre-season selling of fruit
orchards is one the main reason of the grower’s weak financial position. The
nominal facilities in the form of cold storages and weak farm to roads are
causing 25-40 percent damages to the fruits and hence reduce the stock and
increase the prices. The fruit orchard growers are getting one-fourth of end
users’ price, while major part is taken by the businessmen in the markets. The
part of intermediaries in end user’s price may be reduced by awareness about
the agricultural loans and market information, lowering the post-harvest
losses, making ideal and suitable conditions of the market structures,
provision of transportation facilities in peak time on reasonable rate and ideal
packaging material. It was also noticed that the fruit selling places were not
open for all sellers and buyers.
Aparna (2012) studied marketing constraints of supermarket channels
and two traditional marketing channels in the Rangareddy district of Andhra
Pradesh in India. Rejections of low grade produce, procurement according to
indent and lack of knowledge of grading have been identified as the major
constraints of supermarket supply farmers. The major constraints expressed
by the traditional market supply farmers include middlemen menace, higher
distance to the market and high market charges.
There were several major constraints in peach production and
marketing which were reported by the respondents in the study area during
2010-11 and were shown in the table 4.17. These constraints have made
peach production and revenue less of the growers. Comparing with other
peach growing areas, the nature of our farmers constraints were similar to
those areas which were reflected by other researchers. It was noticed in the
research as reflected in table 4.17 that forty five percent farmers have said
that they have less of resources for carrying management practices and
hence borrow money market commission agents.50% respondents in the

99
research districts have pointed out the soaring expenses of all types of
farming raw materials like chemical fertilizers, chemical pesticides, cartons
and other decoration items needed for marketing of the product. Thirty three
percent farmers have pointed out main issues in cultural practices which are
insects, diseases and hailstorm, torrential rains and sometimes wind etc and
these are mostly due to the favourable climatic condition of the area. Twenty
five percent farmers have shown ignorance of the buying, selling and market
intelligence, rates of the fruit per carton and supply sources etc and mostly
got information from the market person in the whole sale markets. Forty
percent of the respondents in the research districts were of the opinion that
major expense are incurred on the shifting of fruit from farm to down country
markets mainly Peshawar, Rawalpindi and Lahore. Forty five percent of
respondents have noted that softness characteristics of the peach were huge
constraint and could not be kept for extended time in cold store. Similarly
thirty percent farmers were also of the opinion that major rate fluctuation of
their produce in all down country main markets was changing very frequently.
Table 4.17KeyProblems in Peach Production and Marketing chains
Name of Problem No of Farmers Percentage
(%)
Increasing rates of Agriculture raw
materials
150 50
Lack of financial resources 135 45
Perishable nature of Product 135 45
Highestshifting expenses 120 40
Insect, Diseases occurrence and
hailstorm, torrential rains etc attack
issues
99 33
Frequent changing of rates of final
product in markets
90 30
No or less knowledge about market
intelligence
75 25

100
4.9 Relationship between fruit quality attributes and price
The findings of some renowned researchers have been elaborated
about quality of fruit and its relation to price and acceptance in the markets.
Herregods (1976) studied that Price level is dependent on the external
and internal quality of the product. Each and every commodity of fruits and
vegetables has specific quality criteria much desired by the consumer. For
apples there exists yet more complete depiction with respect to the optimum
quality aspects. To reach the optimum quality the choice of the variety, picking
in different time, Setter refrigerating and more sophisticated C.A.
circumstances, wet forced air pre-cooling and refrigerated transport are
strategies with higher costs, but also with higher benefits, to arrive at a
profitable quality.
Timothy (1983) analyzed muscadine grapes that were grown on
greater area of Florida mainly due to the climatic favourable condition needed
for greater quality grapes production. Potential markets for muscadine grapes
are direct marketing, processed market, and the commercial fresh market. In
this paper enterprise budgets are established, potential markets are
discussed, and potential returns are explored to aid the potential producers in
their decision making.
Russell et al. (1992) analyzed that marketing theories associated with
quality, location, and time for the U.S. apple industry. Results of the study
suggest that size, storage method, grade, and seasonality are the most
important factors on the price of apples. Area of apple origin and variety were
the least important influences on apple prices.
Dolan, Humphrey & Pascal (1999) argue that the requirements of the
UK supermarkets on the one hand, associations who work in the mandatory
Contracting environment are those skillful of encouraging quality.
Cook (2000) examined the suggestions of stake holders in fresh fruit
and vegetables value chain in the US market. The fast spread of quality

101
center might force the old retailers for changing their business to the super
store format.
Timothy and Wojciech (2003) stated that timely acceptance of new
varieties is critical to profitable peach production, and peach quality is a
primary factor driving adoption in Georgia peach growing regions. The relative
impact of the key external and internal peach quality attributes on adoption is
considered. Decisions making on new varieties are influenced by the age
distribution of the orchard, information about new varieties to growers.
Linus et al. (2007) examined that knowing consumer observations and
approaches may lead to vital standards conditions for buying and selling.
People eat banana and dates more than the apple as because of its dominant
characteristics like colour, flavor and sweetness. Mango, Apple and orange
are also liked due to the flavour, sweetness, and firmness of these fruits.
Maximum numbers of end users are willing to give 25 percent extra on unit
price for best quality orchards produce but 94 percent end users refused to
pay to 50 percent for fresh fruits
Sabir and Zakir (2010) pointed out good quality citrus mandarin
produced in Punjab Pakistan, while district Sargodha having more area and
kinnow production. The study revealed that by enhancing the quality fruit, the
farmers have high income while the end users have best quality fruit.
Samina et al. (2012) elaborated that young 'Kinnow' mandarin trees
often create inferior quality fruit with less juice and more rind and rag
contents. However, less is known about the role of PGRs on the fruit quality of
young 'Kinnow' mandarin trees. Maximum fruit attributes excluding non-
decreasing sugars (%) may be important during storage life. It is noted that
the citrus attributes except AA may be improved through using kinetin.

102
Relationship between fruit quality attributes and price per in the study
area during 2010-11
Quality attributes and price have close relationship. Consumer
perception and attitude towards fruit quality is important in setting quality
specification for marketing as well as providing a useful guide for post-harvest
research aimed at quality improvement of fresh produce. Fruit quality has
several interpretations and perception among producers, marketers and
consumers. Quality is often defined from the product or consumer orientation
and that the combinations of product attributes constitute quality while the
consumer’s perception and response to those attributes be referred to as
acceptability.
4.9.1 Average price of Red, Green, White colour Peaches
The relationship between the price and quality of red, green, white
peaches was tested in this study and it was concluded from table 4.18 that
the consumer has highest preferences for red peaches and pay average price
of Rs. 337.55 per carton and red quality has statistically significant effect on
the price as evident from the f- statistics 2.83 (.007).The average price of
green quality peach was Rs. 214. 98 per carton and it shows that consumers
were willing to pay less prices for this category of peaches than the red and
as revealed in the table 4.18 from f- value 2.45 (.018), the green quality
peaches have statistically significant effect on the price while there is less
preference for white quality of peach and have average price of Rs. 146.70
per carton and as shown by f- statistics 1.61 (.131) in table 4.17, there was no
statistically significant effect of white quality on price.
4.9.2 Average price of Big, Medium and Small sizes Peach
The relationship between the price and different sizes of peaches was
tested in this study and it was concluded that the consumers were highly
sensitive to the prices of big and small sizes peaches and paid average
maximum price of Rs. 356.20 per carton for big and minimum for small sizes
of Rs. 174.82 per carton as compare to medium sizes as evident from the f-
statistics 2.765 (009) and 3.070 (.004) respectively for both categories.

103
Hence these two sizes of peaches have also statistically significant effect on
prices. Medium sizes peaches have price of Rs. 256.50 per carton and f-
statistics shows that there was no statistically significant effect on price of
medium sizes.
4.9.3 Average price of Early, Medium, and Late Peach varieties
The relationship between the price and different peaches varieties
based on growing season namely early, mid and late season varieties was
tested in this study and it was concluded that the average price of early peach
varieties have average price of Rs.363.55 per carton and according to the f-
value2.542 (.015) in table 4.18, there is statistically significant effect on the
price of early peach variety. The mid and late season peach varieties have
average prices of Rs.255.76and Rs. 265.95per carton and their f- statistics
1.074 (.380) and 1.517 (.161)depict that there were no significant effect of mid
and late season peach varieties have on their prices.
4.9.4 Average price of Sweet, and Sour quality Peaches
In this study, the prices were tested against sweet and sour quality of
peaches and results showed that the average price of sweet quality peaches
received Rs. 319.52 per carton and f-value 2.006 (.054)in table 4.18 shows
that the sweet quality has no statistically significant effect on price as the
consumer will pay whatever the price of sweet quality peaches have. The sour
quality peaches have mean price of Rs.162.57 per carton with f-
statistics4.430 (.000), which shows that there is significant effect of sour
quality on prices.
4.9.5 Average price of Hard, and Soft quality Peaches
The relationship between the price and hard, soft quality peaches have
been tested in the study and it was concluded that the average price of hard
quality peach have average price of Rs. 301.23 per carton and according to
the f-value 2.958 (.005) in table 4.18, there is statistically significant effect on
the price of hard quality peaches. The soft quality peach has average price of

104
Rs. 142.32 per carton and its f- statistics .379 (.914) shows that there was no
significant effect of soft quality peach on the price.
Table 4.18 Quality attributes and price per carton relationship of peach fruit in the study area during 2010-11
Quality Attributes
Average Price
per carton Rs.
Std.
Deviation F- statistics
Red colour peach 337.55 68.462 2.833 (.007)
Green colour peach 214.98 53.560 2.455 (.018)
White colour peach 146.70 38.284 1.619 (.130)
Big size peach 356.20 63.932 2.765 (009)
Medium size peach 256.50 49.441 1.582 (.140)
Small size peach 174.82 42.326 3.070 (.004)
Early peach variety 363.55 83.574 2.542 (.015)
Medium peach variety 255.76 55.013 1.074 (.380)
Late peach variety 265.95 64.353 1.517 (.161)
Sweet peach 319.52 60.008 2.006 (.054)
Sour peach 162.57 37.502 4.430 (.000)
Hard peach 301.23 60.153 2.958 (.005)
Soft peach 142.32 28.220 .379 (.914)
Source: Field survey by author in 2010-11
4.10 Estimation of Econometric Models
To analyze the effect of independent variables on dependent variable,
to study the relative share of independent variables in the dependent
variables and to make predictions, econometric models are used. The
theoretical view of various development economists about fruit production and
their marketing has been expressed in the review of literature chapter.

105
4.10.1 Variables used in Econometrics Model
Based upon the review of literature and preliminary group discussion
with peach growers in the study area, major factors of peach productions are
farm yard manure, various chemical fertilizers, number of pesticides sprays,
number of skilled and un-skilled labours for farm yard manure application,
hoeing, pruning, chemical fertilizers applications, application of pesticides
spray and irrigation.
Polynomial regression model was used in the analysis of data. The
collected data was analyzed by regressing the value added on the Peach fruit
production for each stage against the value of investment in the value chain.
The model used for the analysis is written explicitly, is as stated below:
Yi = b0+b1xi1+b2xi
2+b3xi3+-------+bkxi
k+ei
Where,
Yi = value added on the peach fruit production
Xi = value of investment in stage (t = 1, 2…..k stage i.e. investment/cost of the
stages of value addition).
b0 = Constant term
bi= Investment coefficients
e= Error term.
Generally, the objective of using a polynomial model is, to construct
composite variables, which are linear combination of exogenous variables to
capture the effect of each stage of the value chain on the value been added.
This model is regarded as a fairly sophisticated model, which has been widely
used in the estimation of polynomial relationships.
In order to estimate the determinants of participation in the value chain, the
following probit regression
The model is implicitly stated as
Y*i= (x1,x2,x3,x4,x5)+ei
106
Y*i= 1 if y*i>0, 0 if Y*I = 0
The explicit form of the model is stated as
Y*i= b0+b1x1+b2x2+b3x3+b4x4+b5x5 +ei----------------------------------4.1
Where
Y*i = probability to participate (participating=1, non-participating=0)
X1 = per hectare use of farm yard manure
X2 = per hectare use of labour for fym application
X3 = per hectare use of labour for hoeing in the peach orchards
X4 = per hectare use of labour for pruning in the peach orchards
X5 = per hectare quantity of fertilizers used in peach orchards
X6 = per hectare use of labour for fertilizers application
X7 = number of pesticides sprays per hectare
X8 = per hectare use of labours for pesticide sprays
X9 = per hectare use of labours for irrigations
Bi is the parameter
Ei is the error term
Farm Yard Manure (FYM): Farm yard manure is an important
agricultural input in peach fruit production and orchards and farmers apply it
regularly for soil condition, moisture retention and microbial activities etc. in
their orchards.
Chemical Fertilizers (CF): Various chemical fertilizers are very
regularly used in all kind of fruit orchards especially peach for quality and
quantity of this fruit throughout the growing season despite of their high
prices. It directly affects the quantity and quality of fruit in form of size, colour
taste and shape etc.
Chemical Pesticides Sprays (PS): Chemical pesticides and their
timely sprays have an important role in the control of insects and diseases
which can directly affect the fruit quality and quantity. If the pests are not
controlled on proper time, they can give maximum losses to the growers in
the form of less and low quality peach fruit.

107
Skilled and unskilled labours (L): various types of labour are used
in fruit orchards throughout the growing season for different activities which
include labour timely and proper application of farm yard manure, hoeing,
suitable pruning, efficient and proper application of chemical fertilizers, ideally
pesticides spray application and timely provision of irrigation to the fruit
orchards.
Table 4.19 Estimates of Peach Production in cartons per hectare
Variables Coefficients St. Error t-statistics P-value
Constant 1024.170 110.549 9.264 0.00
FYM* 0.099 25.314 1.464 0.014
FYML 0.048 13.447 0.680 0.49
HL 0.031 15.364 0.410 0.68
PL 0.036 34.473 0.379 0.70
FT* 0.204 26.400 2.173 0.03
FTL 0.120 35.669 1.1388 0.25
PS* 0.67 28.466 0.5892 0.045
PSL 0.64 18.331 0.689 0.49
IRRIL 0.22 18.086 0.275 0.78
Durbin- Watson = 1.67, R2=0.67, F- statistics = 1.248, *Significant (p<0.05)
FYM= Number trollies of farm yard manure
FYML= Number of labour used for farm yard manure application
HL= Number of labour used for hoeing in the peach orchards
PL=Number of labour used for pruning in the peach orchards
FT= Number of bags of fertilizers used in peach orchards
FTL= Number of labour used for fertilizers application
PS= per use and number of pesticides sprays
PSL= Number of labour used for pesticide sprays
IRRIL= Number of labour used for irrigations in peach orchards

108
Table 4.19shows estimates of peach production in the study area for
the year 2010-11. The R2value of 0.67 can be regarded as quite good fit in
view of the cross sectional data involved in this data. This reflects that 67%
variation in the peach production is explained by the independent variables
included in the model.
Farm Yard Manure (FYM):
The results showed that the coefficient of FYM was positive and
statistically significant at 5% as evident from the p- value 0.014. These results
indicated that one trolley of FYM per hectare could increase 24 numbers of
cartons of peach production per hectare in the area. Hence the FYM and
Peach production has positive correlation in the study area.
Labour used for Farm Yard Manure hectare application
The result showed in table 4.19that the coefficient (0.048) was positive
and non-significant at 5% probability level as the p- value was 0.49. It
expressed that one labour hiring per hectare for FYM application would
increase 12 numbers of cartons per hectare in the area.
Labour used for Hoeing
The table 4.19 showed that the coefficient (0.031) of labour for hoeing
was positive and non-significant (p-value 0.68) at 5% probability level. The
coefficient reflected that by hiring one labour for doing hoeing in peach
orchard could give 8 cartons per hectare.
Labour used for timely and proper Pruning in Peach orchards
The results revealed in table 4.19 that the coefficient (0.036) of labour
for doing pruning in peach fruit orchard was positive and non-significant (p-
value 0.70) at 5% probability level. The coefficient showed that by hiring one
labour for doing pruning in peach fruit orchards could give 9 cartons per
hectare in the study area.

109
Use of various Chemical Fertilizers in Peach fruit orchards
It is evident from the table 4.19that the coefficient (0.204) of using
various chemical fertilizers in peach fruit orchard was positive and statistically
significant (p-value 0.03) at 5% probability level. The coefficient pointed out
that the use of one bag of chemical fertilizer in peach fruit orchards would
give 50 cartons per hectare in the study area.
Labour used for efficiently applying Chemical fertilizers in Peach
orchards
The results in table 4.19 pointed out that the coefficient (0.120) of
labour for efficiently applying various chemical fertilizers in peach fruit orchard
was positive and non-significant (p-value 0.25) at 5% probability level. The
coefficient showed that by hiring one labour for applying chemical fertilizers in
peach fruit orchards could give 30 cartons per hectare in the study area.
Spray of Chemical Pesticides in Peach orchards
The results in table 4.19 pointed out that the coefficient (0.120) of
labour for efficiently applying various chemical fertilizers in peach fruit orchard
was positive and non-significant (p-value 0.25) at 5% probability level. The
coefficient showed that by hiring one labour for applying chemical fertilizers in
peach fruit orchards could give 30 cartons per hectare in the study area.
Labour used for efficiently spraying Chemical pesticides in Peach
orchards
The results in table 4.19 revealed that the coefficient (0.64) of labour
for efficiently spraying chemical pesticides in peach fruit orchard was positive
and non-significant (p-value 0.49) at 5% probability level. The coefficient
showed that by hiring one labour for spraying chemical pesticides in peach
fruit orchards could give 16 cartons per hectare in the study area.

110
Labour used for applying irrigation in Peach orchards
The results in table 4.19 revealed that the coefficient (0.64) of labour
for efficiently spraying chemical pesticides in peach fruit orchard was positive
and non-significant (p-value 0.49) at 5% probability level. The coefficient
showed that by hiring one labour for spraying chemical pesticides in peach
fruit orchards could give 16 cartons per hectare in the study area.
4.10.2 The effect of quality attributes on Peach Price through Dummy
Variable Multiple Regression Model
In regression analysis, the dependent variable is mostly influenced not
only by quantitative variables but also by variables that are qualitative in
nature. Since such variables usually present the presence and absence of an
attribute. One way to quantify such attribute is by constructing artificial
variables that take on values of 1 and 0 indicating presence and absence of
that attribute. Variables that assume such o and 1 values are called dummy
variables. Dummy variables can be incorporated in regression models as
quantitative variables. Such models are called analysis of variance (ANOVA)
models. Analysis of variance models are used to assess the statistical
significance of the relationship between quantitative regressand qualitative or
dummy repressors. They are often used to compare the differences in the
mean values of two or more groups or categories (Gujarati, 2004). To
compare the price of peach fruit across quality attributes, dummy variables
multiple regression models were used in which dummy repressors taking the
value of 1 if the observation belongs to a particular quality attribute group and
0 if it does not belong to that group. The results of dummy variables multiple
regression models to compare the peach price and various groups of quality
attributes namely, colour, sizes, varieties, taste and firmness are as follow.
4.10.2.1 Dummy Variable Multiple Regression Model Estimates
according to different categories
To compare the quality attributes and price of peach fruit, dummy
variable multiple regression models was used in which dummy regressors
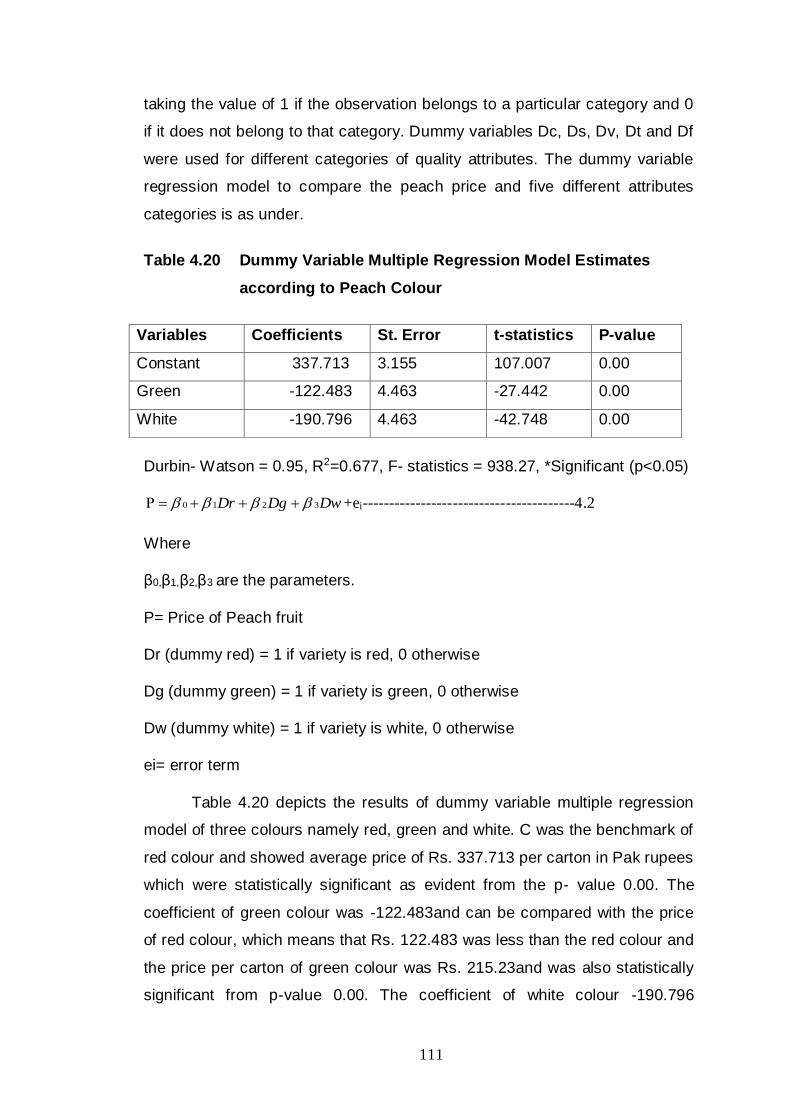
111
taking the value of 1 if the observation belongs to a particular category and 0
if it does not belong to that category. Dummy variables Dc, Ds, Dv, Dt and Df
were used for different categories of quality attributes. The dummy variable
regression model to compare the peach price and five different attributes
categories is as under.
Table 4.20 Dummy Variable Multiple Regression Model Estimates
according to Peach Colour
Variables Coefficients St. Error t-statistics P-value
Constant 337.713 3.155 107.007 0.00
Green -122.483 4.463 -27.442 0.00
White -190.796 4.463 -42.748 0.00
Durbin- Watson = 0.95, R2=0.677, F- statistics = 938.27, *Significant (p<0.05)
DwDgDr 3210 +ei----------------------------------------4.2
Where
β0,β1,β2,β3 are the parameters.
P= Price of Peach fruit
Dr (dummy red) = 1 if variety is red, 0 otherwise
Dg (dummy green) = 1 if variety is green, 0 otherwise
Dw (dummy white) = 1 if variety is white, 0 otherwise
ei= error term
Table 4.20 depicts the results of dummy variable multiple regression
model of three colours namely red, green and white. C was the benchmark of
red colour and showed average price of Rs. 337.713 per carton in Pak rupees
which were statistically significant as evident from the p- value 0.00. The
coefficient of green colour was -122.483and can be compared with the price
of red colour, which means that Rs. 122.483 was less than the red colour and
the price per carton of green colour was Rs. 215.23and was also statistically
significant from p-value 0.00. The coefficient of white colour -190.796

112
indicated that the price per carton of white colour peach was Rs. 190.796 less
than the price of red colour and its original price was Rs. 146.917 white the
green colour was also statistically significant as reflected by p-value 0.00. The
R- square showed that 67% variation in peach price was explained by the
different colours i.e. red, white and green attributes.
Table 4.21 Dummy Variable Multiple Regression Model Estimates
according to Peach Sizes
Variables Coefficients St. Error t-statistics P-value
Constant 355.53 3.0412 116.902 0.00
Medium -99.03 4.3010 -23.025 0.00
Small -180.71 4.3010 -42.017 0.00
Durbin-Watson=1.001, R2=0.663, F- statistics = 885.43, *Significant (p<0.05)
3.43210 eiDssDsmDsl
Where
β0, β1, β2 andβ3, are the parameters.
P= Price of Peach fruit
Dsl (dummy size large) = 1 if size is large, 0 otherwise
Dsm (dummy size medium) = 1 if size is medium, 0 otherwise
Dss (dummy size size) = 1 if size is small, 0 otherwise
ei=error term
Table 4.21 shows the results of dummy variable multiple regression
model of three sizes namely large, medium and small. C was the benchmark
of large size and showed average price of Rs. 355.53 per carton in Pak
rupees, which was statistically significant as evident from the p- value 0.00.
The coefficient of medium size was -99.03 and can be compared with the price
of large size, which means that the medium size peach received Rs. 99.033
less than the large size peach and its exact price per carton was Rs. 256.49
and was also statistically significant as verified from p-value 0.00. The

113
coefficient of small size was -180.71 which indicated that Rs. 180.71 was
received by small size less than the price of large and thus small size peaches
fetched Rs. 174.82 per carton and was also statistically significant as
expressed from p-value 0.00. The R-square value explained 66.3% changes in
peach price due to the different sizes (large, medium and small) attributes of
peach fruit.
Table 4.22 Dummy Variable Multiple Regression Model Estimates
according to Peach Varieties
Variables Coefficients St. Error t-statistics P-value
Constant 363.91 3.93 92.54 0.00
Medium -107.53 5.56 -19.33 0.00
Late -97.93 5.56 -17.609 0.00
Durbin-Watson=1.41, R2=0.338, F- statistics = 228.98, *Significant (p<0.05)
4.43210 eiDlvDmvDev
Where
β0,β1,β2andβ3, are the parameters.
P= Price of Peach fruit
Dev (dummy early variety) = 1 if variety is early, 0 otherwise
Dem (dummy medium variety) = 1 if variety is medium, 0 otherwise
Del (dummy late variety) = 1 if variety is late, 0 otherwise
ei= error term
Table 4.22 pointed out the results of dummy variable multiple
regression models of types of peach varieties based on three seasons namely
early, medium and late. C was the benchmark of early peach variety and
showed average price of Rs. 363.91 per carton in Pak rupees, which was
statistically significant as evident from the p- value 0.00. The coefficient of
medium peach variety was -107.53and can be compared with the price of
early peach variety, which means that the medium peach variety received Rs.

114
256.38 and medium variety was also statistically significant from p-value 0.00.
The coefficient of late peach variety was -97.93which indicated that the late
peach variety fetched Rs. 265.98as compared to early variety and thus late
variety was also statistically significant from p-value 0.00.The R-square value
explained 33.8% changes in peach price mainly due to the different seasonal
varieties attributes of peach fruit.
Table 4.23 Dummy Variable Multiple Regression Model Estimates
according to Peach Taste
Variables Coefficients St. Error t-statistics
P-value
Constant 320.10 2.807 114.027 0.00
Sour -147.96 3.970 -37.269 0.00
Durbin-Watson=1.324, R2=0.699, F- statistics = 1388.99, *Significant (p<0.05)
eiDsrDsw 210 ---------------------------------------------------4.5
Where
β0, β1 andβ2 are the parameters.
P= Price of Peach fruit
Dsw (dummy sweet) = 1 if taste is sweet, 0 otherwise
Dsr (dummy sour) = 1 if taste is sour, 0 otherwise
ei=error term
Table 4.23 reflected the results of dummy variable multiple regression
models of two taste types of peach varieties namely sweet and sour. C was
the benchmark of sweet peach variety and showed average price of Rs.
320.10 per carton in Pak rupees received for the sweet taste attribute, which
was statistically significant as evident from the p- value 0.00. The coefficient of
sour peach variety was -147.96, and can be compared with the price of sweet
taste of peach variety, which means that the sour peach variety received Rs.
147.96 less than the sweet peach variety and its exact price per carton was

115
Rs. 172.14 and sour variety was also statistically significant from p-value 0.00.
The R-square value explained that 69.9% changes in peach price were mainly
due to different tastes (sweet and sour) of varieties attributes of peach fruit.
Table 4.24 Dummy Variable Multiple Regression Model Estimates
according to Peach Firmness
Variables Coefficients St. Error t-statistics P-value
Constant 301.23 2.666 112.949 0.00
Soft -154.12 3.771 -40.862 0.00
Durbin-Watson=1.62, R2=0.736, F- statistics = 1669.74, *Significant (p<0.05)
eiDsoDha 210 ------------------------------------------------------4.6
Where
β0,β1andβ2 are the parameters.
P= Price of Peach fruit
Dha (dummy hard) = 1 if firmness is hard, 0 otherwise
Dso (dummy soft) = 1 if firmness is soft, 0 otherwise
ei=error term
Table 4.24 depicted the results of dummy variable multiple regression
models of two firmness types of peach fruit namely hard and soft. Constant
was the benchmark of hard peach fruit and reflected average price of Rs.
301.23 per carton in Pak rupees received for the hard attribute of fruit, and has
statistically significant as evident from the p- value 0.00. The coefficient of soft
peach fruit was -154.120, and can be compared with the price of hard peach
fruit, which means that the soft peach fruit received Rs. 147.11per carton and
soft fruit was also statistically significant from p-value 0.00. The R-square
value explains 73.6% changes in peach price due to the firmness (hard and
soft) attributes of peach fruit.

116
4.11 Different forms of Value Additions
1. Differentiate the products on the basis of quality or size, and sell the
same at different prices to appropriate customers.
2. Minimally process items to a form and shape which is closer to the final
consumer product.
3. Process the whole item or its functional components, or lower grade,
waste or by-products by converting the short shelf-life product to a
storable form (e.g. making of juices, squashes and canned peach fruit).
Modern retailers offer value-added, processed fruit products, spend time on
processing activities rather than on produce sourcing and storage, add
complementary products and services related to healthy eating and living, and
try to understand better and attempt to respond efficiently to wants and needs
of its local customer. Certain fruits could be especially promoted due to their
health proprieties. In addition, health-related information in the form of books,
booklets or leaflets could be distributed, free or at price. Offering of some
fresh preparations in the shop such as juices, marmalade and canned peach
fruit may result in the impulse purchases. A category may be created after
fruit based health link and could even include complementary products which
are usually sold (without prescription) in drug stores. Small exclusive retail
chain operators would be more agile and responsive in fulfilling these low cost
wants and latent needs of their customers than supermarkets. The transaction
costs may be reduced to control high fluctuations in the market price. The
food chains in Pakistan in general and study area are in full of inefficiencies —
a result of inadequate infrastructure, too many middlemen and wholesalers,
no proper law and an indifferent attitude of the involved partners.
4.12 Strengths, Weaknesses, Opportunities and Threats Analysis
The SWOT analysis is required to identify the potential and weak
points of peach fruit value chain in the study area as a base for future
planning based on strength, opportunities and overcoming the weaknesses.

117
The following strengths, weaknesses, threats and opportunities of the
peach value chain in the project area are presented as below.
Strengths Weaknesses
The study area is known for best
quality and highest peach production.
Known peach varieties are
grown.
The peach produce is marketed/
exported to leading national, Afghanistan and gulf counties.
Well trained and experienced human resource in pre and post-harvest management are
available.
Huge investment is made in fruit
nurseries, agriculture inputs, packaging materials etc.
Climatic advantage in the study
area.
Market access to the national
markets has been improved
Quality peach production is
mainly dependent on climate.
Low production due to
inadequate agri. practices.
Illiterate peach growers
cannot apply the improved agriculture practices.
Saturation of few down country markets.
No exploration of new local
and export markets.
Cannot be stored for longer
period due to highly perishable in nature.
Longer supply period for about 4-5 months.
Relatively high agricultural
inputs and capital costs.
No proper support in
infrastructure within supply chain.
Weak farm to markets roads.
Lack of industry control on efficiency and peach production in supply chain
beyond farm gate.
Opportunities Threats
Peach fruit export to Afghanistan, China and central Asia may fetch
foreign exchange.
Increasing demand through
major markets of the country.
Initiative of canned peach fruit marketing locally and export.
Investment in peach fruit processing and refrigerated vans.
Boost for agro based industry in the country.
Employment opportunities for skilled and un- skilled labour.
Increased competition from Other fruits during the season.
Impact of climate change on peach production.
Occurrence of consistent number of diseases and insects attack.
Increased number of pesticide sprays.
Large quantity of fruit loss due to post harvest losses.
Prolong peach marketing season.

118
Initiation of agro based industries
in the study area.
Starting of cooperative marketing
and price stabilization.
Inflation rate with reference
to costs of agricultural inputs.
Loan availability on highest markup.
Continuous peach planting without proper planning.
4.13 Peach growers and Buyers Relationship in the Study Area
There are different marketing chains for peach and other fruits which
differ among regions, crops and farmers. An important stage to understand is
the first link in the production or marketing chain between the peach farmers
and the buyers. According to FAO (1989), some actors who can form this link
are shown in Table 4.25.
Table 4.25 Relationship between peach farmers and buyers in the
marketing chain
Type of buyers Characteristics of the buyer
Contractors
Agents, collectors wholesalers
Secondary wholesalers
Semi-wholesalers
Commission agents Retailers
Buy crops in the field and undertake the harvesting.
Buy the harvested crop at the farm. Buy produce from farmers at firm prices and sell at the wholesale market for Wholesalers their own account.
Buy at the wholesale market and transport the produce either to sell to retailers or at another wholesale market where prices are higher.
Are located near the wholesale market and sell produce by the box either to small retail businesses or directly to consumers.
Auction produce in a wholesale market on a commission basis. Sell to the final consumer such as street hawkers, stall
holders, retailers, greengrocers or supermarkets Source: Own compilation

119
V. SUMMARY, CONCLUSION AND RECOMMENDATIONS
5.1 Summary
This study was conducted to carry value chain analysis of peach fruit to
determine important players in the chain, peach production Costs, profitability
of established Peach Orchard, the marketing costs, to identify the efficient
marketing channel in Peach Value Chain, to do SWOT analysis of the peach
value chain, and to put forward some recommendation to the stakeholders in
the value chain in the study area.
The data was gathered through pretested questioners from 300 peach
orchard farmers in six villages having large number of peach trees available,
practically involvement of the farmers in the management practices in the
study area villages of two districts namely Swat and Buner of Khyber
Pakhtunkhwa during 2010-11 through random sample procedure. The data
was also supported by the secondary data of the districts in the province. As
District Swat was the largest peach growing area among all the twenty five
districts, therefore 272numbers of respondents from Swat and 28 numbers
from Buner were selected and interviewed about peach crop practices
involved, their costs, agricultural inputs used in peach production and
marketing, profitability from peach fruit, factors affecting peach fruit, efficient
marketing channel, opportunities, weaknesses and problems in the chain etc.
Data about price and quality relationship have also been collected in the
study. The data was further analyzed and processed for deriving results and
conclusions.
In this study, the effect of literacy, level of education, land holding,
orchard size, Peach variety wise production was also assessed. The average
cost per hectare of peach production was Rs. 81,367, where in the cost of
production include purchase of green natural manure, different chemical
fertilizers, various chemical pesticides and involving daily wage labor for
application of Farm yard manure, different fertilizers, chemical pesticides
sprays and irrigation application during 2010-11. The average cost per
hectare of peach marketing was Rs. 228,985 and this cost comprised of

120
purchase of empty cartons, picking charges, packing and grading charges,
paper and items necessary for beautification of product, shifting of fruit to
down country markets, loading, un-loading of fruit at local and in the markets
and rates charged as service at the main fruit markets. The mean total net
profit per hectare from peach orchard was Rs. 308,408.
The mean total marketing cost of peach per hectare was Rs. 228,985
during 2010-11 and maximum quantity of the produce was marketed to
Lahore and Rawalpindi with 41and 36 percent of the total quantity of the
respondents marketing efficiency was 2.7 for these markets, which showed
that these were most efficient markets as the value was greater than one.
Some of the strengths of value chain were identified in study area. The study
area is known for best quality and highest peach production. Known peach
varieties are grown. The peach produce is marketed/ exported to leading
national, Afghanistan and gulf counties. Well trained and experienced human
resource in pre and post-harvest management are available. Huge investment
is made in fruit nurseries, agriculture inputs, packaging materials etc.
Favourable Climatic is advantage for peach fruit production in the study area.
Market access to the national markets has been improved
Important primary value chains players were peach producers,
middlemen, wholesalers, retailers, transporters and exporter at national level
markets. Besides these, banks for loan disbursement, agriculture
departments, research system, agriculture inputs supplier were also identified
as secondary players.
Key problems highlighted during the study were shortage of non-
availability of fund for fruit orchards management, extreme rates of agricultural
raw materials, softness characteristic of the fruit, regular Insects and diseases
attack occurrence, no pre market intelligence, frequent changing in rates of
final fruit and maximum shifting charges.
There is need of potential yield and pest resistance peach cultivars
may be presented in the research district. The study also highlighted the
significant relationship between price and quality attributes namely sizes,
colours, varieties, taste and firmness of the fruit. After picking to market

121
damages should be minimized by making new products and new, viable
foreign markets may be found out for getting maximum revenue to the orchard
farmers.
There was an important relationship between price and quality
attributes of the peach fruit namely colours, different sizes, and seasonal
availability of varieties, taste and firmness of the fruit. The quality attributes
namely three different colours (red, green and white), three different sizes
(large, medium and small), seasonal availability of varieties (early, medium
and late), taste (sweet and sour) and firmness (hard and soft) had statistically
significant effect on the price of peach fruit in the market
5.2 Conclusion
It was observed from the data that there was mix of farmers in the area
having age from 22 years to 85 years and education constitute 61 percent of
all level staring from primary to post graduate. 31 percent farmers were
illiterate. It was also noted that education has significant effect on the peach
production and educated farmers have more production as compare to
illiterate. Medium size land holding peach growers have more production than
the small and big peach growers.
It was also revealed from the results that average market prices per
carton were highest (Rs. 292&Rs. 282) in small markets like Gujranwala and
Faisalabad and was followed by largest national level Rawalpindi fruit market
with low price of Rs. 280 in comparison.
It has been noticed from the study that there were three major fruit
markets in the country namely Rawalpindi, Lahore and Peshawar. Out of
three hundred numbers (300 Nos) of respondents, 102 Nos, 92 Nos and 42
Nos of peach growers have sold their produce to these markets with average
mean quantity of 357,967 cartons (36%), 407,684 cartons ( 41%) and 89,492
(9%) cartons respectively.

122
The study also revealed that the average gross revenue per hectare of Rs.
618,760 with production cost of Rs. 81,367 and marketing cost of Rs.
228,985respectivelywas received by the farmers in the study area while
average net profit per hectare was Rs. 308,408.
Quality attributes and price of peach fruit have an important
relationship. The price has significant effect on red, green colour peaches,
big, small size of peaches, early peach variety, sour taste and hard in
firmness peaches while there was no significant effect of price on white
colour, medium size mid, late season varieties, sweet taste and soft peaches
quality attributes.
5.3 Implications/Recommendations of the research to other Peach
growing regions and similar supply chains in Pakistan
1. There is a strong need to undertake different capacity building
programmes like organization of trainings, demonstrations, awareness
generation, exposure visits and farmer-scientist interactions on
different aspects of fruit value chains in the study area as well in other
regions.
2. The contribution of technology, policy, institutional and infrastructural
facilities to the development of value chains in agriculture should be
assessed and applied.
3. The substantial linkages development should be established between
peach growers and agricultural based developmental organizations.
4. Agriculture inputs markets may be regularized for price stability and
timely availability of inputs.
5. Farmer-friendly communication networks like Market information
System (MIS) should be established to disseminate timely market and
export related information to the growers for knowing the market
dynamics in neighboring countries.
6. Currently very meager quantity of peach is exported to Middle East
countries, Afghanistan and central Asia. There is great potential for the
exports opportunities to these countries, which needs to be explored.
123
7. Maximum quantities up to 30% are lost due to the mis- management of
post-harvest and perishable nature of peach fruit. To overcome these
losses and convert these to profit, necessary trainings in post-harvest
management of peach fruit growers may be imparted in the peach
growing regions.
8. The hilly tracts are very prone to natural calamities like hail storm,
drought, floods and disease outbreak, therefore fruit orchards need
crop insurance.
9. Peach growers essentially need help and supports from various
government departments like Agriculture Extension, Research system
and other organizations to prepare a comprehensive strategy of
particularly cultivated area, varieties and farm investment.
10. New ways for enhancing of fruitful peach value chain may be find out
and implemented as well in the peach growing regions.
11. Strengthening of peach growers linkages with local and foreign buying
and selling place may be given top significance by the government and
other organizations in the study area as well as in the region.
5.4 Future implication
This study was limited to peach growers of two districts of Khyber
Pakhtunkhwa namely Swat and Buner due to financial and time constraints.
The value chain study for any fruit category was not carried out neither in the
study area nor in Khyber Pakhtunkhwa. Therefore, there is dire need to
cascade further research in this area to address the value chain approach of
fruits in broader spectrum. In future, more modern and advanced techniques
can be used for estimating the peach value chain in particular and other fruits
in general. The determined efforts to expand such research at national level
will demonstrate the overall impact of value chain on each crop, including
fruits, vegetables, inputs supplier and market men. This will provide a paved
way to policy makers to assess the policies and constraints about fruit
production, marketing, their input supplies, exports and other issue in the
value chain fruit in the country.

124
LITERATURE CITED
Abbott, J. A. 1999. Quality measurement of fruits and vegetables. Post-
harvest Biology and Technology15: 207-225.
Abid, M. and S. Khan.1980.Marketing Infra-structure, Margins and Seasonal
Price Variation of Selected Agricultural Commodities in Sindh Province of
Pakistan. Tando Jam: Department of Agricultural Economics and Rural
Sociology, Sindh Agriculture University.
Abid, M. 2004. Studies on low productivity of mango orchards: its causes and
possible remedies. National program for universities. University College
of Agriculture, BahauddinZakariya University Bosan Road, Multan,
NRPU Proposal Summary No. 243.
Adejo.P.E., J.O. Otitolaye& U. Onuche, (2011).Analysis of Marketing Channel
and Pricing System of Cashew nuts in the North Central of Nigeria.
Journal of Agricultural Science Vol. 3, No. 3;
Agarwal.S., S.K.Goyal and A. Dhingra. 2011. Marketing and post-harvest
management of fruits in Himachal Pradesh. Volume 2, Issue 2 IJMMR
ISSN 2229-6883
Ahmad, B., M.A. Chaudhry, and S. Hassan . 1992. Cost of producing major
crops in Pakistan. Deptt. Farm Management, University of Agriculture,
Faisalabad, Pakistan.
Ahmad, B., M.A. Chaudhry, and S. Hassan, 1994. Cost of producing major
crops in Punjab. Deptt. Farm Management, University of Agriculture,
Faisalabad, Pakistan.
Ahmad, B., K. Bakhsh., S. Hassan, and S.B. Khokhar, 2003.Economics of
growing muskmelon. Faculty of Agricultural Economics and Rural
Sociology, University of Agriculture, Faisalabad, Pakistan.
Ahmad, B., K. Bakhsh, and S. Hassan. 2004. Economics of growing potato.
Faculty of Agricultural Economics and Rural Sociology, University of
Agriculture, Faisalabad, Pakistan.

125
Ahmad, B., Z. Hussain, and L. Longmire. 1993. Farm Management
Handbook. Faculty of Agricultural Economics and Rural Sociology,
University of Agriculture, Faisalabad, Pakistan.
Akcay, Y. and U. Meral.1999. Investment Analysis in the Fruit Plantations: A
Case Study of Central District of Tokat Peach Orchards, Journal of
Agricultural Faculty of Gaziosmanpaşa University 16 (1): 99-117.
Akçay, Y. and U. Meral. 2005.An Investment Analysis of Peach and Cherry
Growing in the Middle Black Sea Region of Turkey', Journal of
Agricultural & Food Information, 7(1): 57-65
Akiyama, T. and P.K. Trivedi 1987. Vintage Production Approach to Perennial
Crop Supply: An Application to Tea in Major Producing Countries.
Journal of Econometrics, 36: 133-161.
Alavoine.F., M. Crochon and C. Bouillon. 1990. Practical methods to estimate
taste quality of fruit: how to tell it to the consumer. Acta Horticulturae
259:61-68.
Ali.2000.Requirements and conditions for Perishable Products for Domestic
and Export Markets: View of a Trader”, Universal Traders (Importers and
exporters), Quetta, Baluchistan, Pakistan.
Ali, T. 2004. Marketing of Citrus Fruit in Pakistan unpublished PhD thesis,
University of Karachi Department of Commerce Pakistan.
Al-Marshudi.A. 2002. Omani palm dates sector: production, marketing and
processing. Al Ta'awon Al Sina'e,Issue No. 88. Pp. 13-26.
Amao. I.O., O. Adebisi-Adelani, F.B. Olajide-Taiwo, I.B. Adeoye, K.M.
Bamimore and I. Olabode 2011. Economic Analysis of Pineapple
Marketing in Edo and Delta States Nigeria. Libyan Agriculture Research
Center Journal International 2 (5): 205-208, 2011
Anderson, B. L. "Strategic Alternatives for the New York Apple Industry."
Agriculture Economics. Res. Pub. No. A.E. Res.89-15, Cornell
University.

126
Aparna.B. and C.V. Hanumanthaiah2012.Are Supermarket Supply Channels
More Efficient than Traditional Market Channels ? Agricultural
Economics Research Review Vol. 25(No.2) pp. 309-316
APCom. (Different issues) Cost of production of major crops. Agricultural
Price Commission, Islamabad, Pakistan.
Ashturker B.M and C.D. Deole. 1985. Producers’ Share in Consumers Rupee:
A Case Study of Fruit marketing in Marathwada, Indian Journal of
Agricultural Economics, 40,3,.
Aujla, K.M. and A. W. Jagirani.2002. Production and Marketing of Potatoes in
Pakistan: Opportunities and Constraints” Socioeconomics Research
Studies 2001-02, Social Sciences Division, Pakistan Agricultural
Research Council, Islamabad.
Avermaete, U., M. Herregods, and P. Vanhouche. 1976. Comparative
analysis of apples (Golden Delicious) at consumer level. ClEO-shriften
no 15, Catholic University of Leuven.
Avermaete, U. 1978. Analysis of price movements on the Belgium apple
market. ActaHorticulturae, 77: 1991 -198;
Bahn, H.M. and G. Morin. 1980. Causes of defects on McIntosh apples at
packing sheds and their impacts on returns. Mass. Fruit Notes 45(5):10-
14.
Bakhsh, R. Chand. et al.1994. Economics of perennial crops. Some
methodological issues. Indian J. Agric. Econ., 49: 1420–30.
Bakhsh, B., I. Hassan and S. Akhter, 2006. Profitability and cost in growing
mango orchards. J. Agric. Soc. Sci., 2: 46–50
Bateman Jr., M., 1965. Aggregate and regional supply functions for Ghanaian
cocoa, 1946–1963. Journal of Farm Economics 47, 384–401.
Baugher, T.A., H.W. Hogmire, Jr., G.W. Lightner,S.I. Walter, and D.W. Leach.
1989. Determining apple pack out losses and impact on profitability.
West Virginia Univ. Ext. Serv. OM-105.

127
Bechtel, L.,B. H. Barritt.,M. A. Dilley and H. R.Hinman. 1995. Economic
Analysis of Apple Orchard Management Systems with Three Varieties in
Central Washington, Research Bulletin XB1032, Washington State
University, USA.
Berman. B.2004.Marketing Channels, John Wiley & Sons, Inc., New York
Botes, A. and A. Zaid, 2002.Date Production Support Program. FAO plant
production and protection paper 156, Rev. 1. Food and Agriculture
Organization of the United Nations, Rome, Italy.
Brorsen, W. B., W. R. Grant, and M. E. Rister.1984.A Hedonic Price Model for
Rice Bid/Acceptance Markets. American Journal Agricultural
Economics.66:156-63.
Brunke, H. 2003. Peach Profile. University of California, Ag Marketing
Resource Center.
Carman, H.F and D.E. Kenyon. 1969.Economic aspects of producing and
marketing California Apples. University of California, Giannini Foundation
Research Report 301.
Carvalho.J.R and C. Mario. 1986. Exports of fresh fruit: major opportunities in
the world market.Revista Brasileira de Comercio Exterior, No. 6, August.
Chalmers, D.J. 1989. An Analysis of Growth and Productivity of Peach Trees,
ISHS Acta Horticulturae, v. 254, p. 91-102.
Chand, R. 1994. Economics of Perennial Crops. Some methodological issues.
Indian J. Agric. Econ., 49: 1420–30
Chaudhry, A.J.1988. An econometric analysis of the U.S. apple industry.
Dissertation, Washington State University, USA.
Celebi, O. 1996.Econometric Analysis of Peach Production in Bursa Province.
M.S. Thesis Uludag University, 121 p.
Cinemre, H.A. and C. O.Killic.1999. A Research on Input Use, Economic
Costs and Marketing of Peach Production in Carsamba District of
Samsun Province, Journal of Agricultural Faculty of Ondokuz Mayıs
University, 14 (1): 117-132.

128
Crocker, T., W.B. Sherman, T.D. Hewitt, J. Gordon and K. Ruppert. 1997.
Alternative Opportunities for Small Farms: Peach and Nectarine
Production Review. Cooperative Extension Service, Institute of Food and
Agricultural Sciences University of Florida, 4 p.
Cross, T. and T. Casteel. 1992. Vineyard Economics: The costs of
establishing and producing wine grapes in the Willamette Valley. In
Oregon Wine Grape Grower's Guide. T. Casteel, Ed. Oregon
Winegrower's Assoc.
Crosson, P. and J.R. Anderson. 1994. Demand and supply: Trends in global
agriculture. Food Policy 19:105-119.
Dattatreyulu, M. 1997. Export Potential of Fruits, Vegetables and Flowers
from India, National Bank for Agriculture and Rural Development,
Mumbai.
Dave, V.J.1998. Economics of Export Oriented Horticultural Crops in Chiku
(Sapota) in Gujarat, Agro-Economic Research Centre, Vallabh
Vidyanagar, Gujarat.
Davis, S. B., T. J. Price., M. E. Wetzstein and M. W. Riger. 1997. Reducing
Yield Variation in Peach Orchards by Geographic Scattering. Amer. J.
Agr. Econ.79:1119-26.
Day, K. R., H. L. Andris., K. M. Klonsky and R. L. DeMoura.2004.Sample
Costs to Produce Fresh Market Peaches, July-August harvested, San
Joaquin Valley - South, University of California Cooperative Extension,
PH-VS-04.
Dhar, M.K. and B.A.Baig.1985. Price Structure of Kashmir Apples, Indian
Journal of Agricultural Economics, 40, 3.
De Jong, T.M., W. Tsuji and H.F. Doyle et al. 1999.Comparative economic
efficiency of four peach production systems in California. Hort. Sci
34(1):73–8.
DeJong, T.M. and J. Goudriaan.1989.Modeling the Carbohydrate Economy of
Peach Fruit Growth and Crop Production. ISHS Acta Horticulturae, v.
254, p.103-108.
129
DeJong, T. M., R. Johnson., J.F. Doyle., and R. David. 2005. Labor costs may
be reduced. Research yields size-controlling rootstocks for peach.
California Agriculture, 59(2)
Dellal, I and A.A. Koç.2003.An econometric analysis of apricot supply and
export demand in Turkey. Turk Journal of Agriculture, 27: 313-321.
Dever, D. (2007). Small-farm access to high-value horticultural markets in
Kenya (Case Study No. 6-4 of the program: "Food Policy for Developing
Countries: the role of government in the global food system). Cornell
University.
Dimitri, C. and C. Greene.2002. Recent Growth Patterns in the U.S. Organic
Foods Market. Washington, DC: Economic Research Service/ United
States Department of Agriculture, Pub. No. AIB-777.
Dizdaroglu, T. 1985. Economic Evaluation of Peach, Apricot and Plum
Production in Menemen, Izmir, the Journal of Agricultural Faculty of Ege
University, 22(3):107-116.
Donelan J.G., Kaplan E.A. (1998), “Value Chain Analysis: A Strategic
Approach to Cost Management”, Journal of Cost Management
(March/April): 7-15.
Dorfman, J.H., Heien, D., 1989. The effects of uncertainty and adjustment
costs on investment in the almond industry. The Review of Economics
and Statistics 71 (2), 263–274.
Dunn, J.W. and L.A.Garafola. 1986. Changes in transportation costs and inter
regional competition in the U.S. apple industry. North eastern Journal of
Agricultural Resource Economics, 15, 37–44.
Economic Survey of Pakistan.2004-05, Finance Division, Islamabad.
Elnagheeb, A.H. and W.J. Florkowski.1993.Modeling perennial crop supply:
an illustration from the pecan industry. Journal of Agricultural and
Applied Economics 25(1):187–196.
Engindeniz, S., F. Cukur and D. Y. Engindeniz.2006.Factors affecting the
profitability of peach growing in Turkey.Agricultura tropica et subtropica
vol. 39(4).

130
Engindeniz, S., F. Cukur and D. Y. Engindeniz.2004. Alternative Opportunities
for Small Farms: A Case Study on Technical and Economic Analysis of
Peach Growing in Turkey, Journal of Agricultural & Food Information, 5:
4, 47 — 58.
Ergun, E., M. BurakandA. Safak. 1992. Economic Evaluation of Peach
Production in Bursa, Izmir and Samsun Provinces, Garden, 21(1-2):21-
30.
Esendugue, G. F., C. K.Taylor and F.Funderburk.2007. Peach Enterprise
Cost Analysis for Middle Georgia Peach Production. AGECON-06-118
Revised December.
Espinosa, J.A. and B.K. Goodwin. 1991. Hedonic price estimation for Kansas
wheat quality characteristics. Western J. Agr.Econ. 16(1):72–85.
Ethridge, D.E. and B. Davis. 1982. Hedonic price estimation for commodities:
An application to cotton. Western J. Agr. Econ. 7(2):293–300.
FAO.2008. Agriculture Year Book. Food and Agriculture Organization, Rome,
Italy.
FAO “Food and Agriculture Food Balance Sheet”, Rome, Italy.1999-2001.
FAO Yearbook Trade.Roma, v. 49, 1996.
FAO Yearbook Production.Roma, v. 50, 1997.
FAO Production Yearbook (2006), Food and Agriculture Organization, Rome,
Italy.
Ferree, M.E. and G.W.Krewer.1996. Peaches and Nectarines, Cooperative
Extension Service, College of Agricultural and Environmental Sciences,
The University of Georgia, 15 p.
Firth, C. 2005.Economics of organic top fruit production.Garden Organic
(HDRA), Coventry, UK. http://orgprints.org/10775/
Fonsah, E. G.,G. Krewer., K. Harrison and M. Bruorton.2007a. Risk Rated
Economic Returns Analysis for Southern Highbush Blueberries in Soil in
Georgia. Journal of American Society for Horticultural Science,
HortTechnology 17:571-579.
131
Fonsah, E.G., G.W. Krewer, K. Harrison, and M. Bruorton. 2006.Economic
Analysis of Producing Southern Highbush Blueberries in Georgia.
University of Georgia, Technical Bulletin No. 1303, March.
Frederico, S. et al. 2008.Production costs and fruit yield profitability in the
initial harvests of custard apple trees. Rev. Bras. Frutic, Jaboticabal - sp,
v. 30, n. 4, p. 931-939.
French, B.C. 1956.The long-term price and production outlook for apples in
the United States and Michigan. Michigan Agricultural Experiment
Station, Technical Bulletin225.
Gadre, V., J. M. Talathi and S. S. Wadkar.2002. Price Spread in Marketing of
WhiteOnion in Raigad District of Maharashtra State. A National Level
Quarterly Journal on Agricultural Marketing, 45, 423-429.
Gandhi, V. P. and N. V. Namboodiri.2002. Marketing of Fruits and Vegetables
in India: A Study of the Wholesale Markets in Ahmedabad Area, Centre
for Management in Agriculture, Indian Institute of Management,
Ahmedabad.
Gangwar, L.S. and S.Shyam. 1998. Economic evaluation of Nagpur mandarin
cultivation in Vidarbha region of Maharashtra. Indian Journal of
Agricultural Economics, 53(4): 648-653.
Gangwar, L.S., S.M.Ilyas., S. Dinesh and K. Sandeep 2005.An economic
evaluation of kinnow mandarin cultivation in Punjab. Agricultural
Economics Research Review, 18(1): 71-80.
Gangwar.L.S; S. Dineshand G. Mandal. 2008. Economic Evaluation of Peach
Cultivation in North Indian Plains. Agricultural Economics Research
Review Vol. 21 January-June 2008 pp 123-129.
Gao, G. 1998. Growing Peaches and Nectarines in the Home Landscape,
Ohio State University Extension Fact Sheet, HYG-1406-98, Columbus,
Ohio, p. 5. Agrigento-Italy (www.unipa.it/medpeach/proceedings).
Garg, J. S. and J. P.Misra.1976. Costs and Margins in the Marketing of
Vegetables in Kanpur, Agricultural Marketing, 8, 2.

132
Gercekcioglu, R.and K. Esengun. 1991. A Study on Peach Production Inputs
and Its Cost in Tokat Province, Journal of Agricultural Faculty of
Cumhuriyet University, 8 (2): 143-148.
Government of Pakistan.2006-2007. Pakistan Economic Survey, Finance
Division, Economic Adviser’s Wing, Islamabad.
Government of Pakistan.1994-1995. Pakistan’s Exports of Principal
Commodities, Export Promotion Bureau, Islamabad.
Government of Pakistan.1980-2006. Agricultural Statistics of Pakistan
(various issues).Economic Wing, Ministry of Food, Agriculture and
Livestock, Islamabad.
Government of Pakistan, Agricultural Statistics of Pakistan. 2006. Ministry of
Food, Agriculture and Livestock (MINFAL), Fruits and Vegetables
Content, Islamabad.
Government of Pakistan.2006.Pre-Feasibility Study for Fruits and Vegetable
Zones in Karachi, Multan, Faisalabad, Swat and Quetta. National
Management Consultants, Study Commissioned by Employment and
research section, Planning and Development Division, Government of
Pakistan.
Government of Pakistan, Agricultural Statistics of Pakistan.2006.Ministry of
Food, Agriculture and Livestock (MINFAL), Fruits and Vegetables
Content, Islamabad.
Greene, G.M., II. 1982. Economic incentives resulting from a higher grade
standard for no.1processing apples. Proc. 58th Cumberland-
Shenandoah Fruit Workers Conf., Nov. 1982,Harpers Ferry, W.Va.
Gulati, A., Minot, N., Delgado, C. and Bora, S. (2007) Growth in high-value
agriculture in Asia and the emergence of vertical links with farmers. In:
Global Supply Chains, Standards and the Poor: How the Globalization of
Food Systems and Standards Affects Rural Development and Poverty,
Ed: J.F.M. Swinnen. pp. 91 108.CABI, Oxford, England.

133
Gulcan, R. et al. 1995. Production Target and Consumption Projection of
Pome and Stone Fruits, Fourth Technical Congress of Turkey
Agricultural Engineering, 9-13 January 1995, Ankara, pp:629-654
Gupta, G.S. and P.S. George, 1974.Profitability of Nagpur Sangtra
cultivation.Indian J.Agric. Econ., 29: 150–60
Haiyan, Tu. (2008). A Reconnaissance Study of the Citrus Value Chains in
Tanga Region, Tanzania. Larenstein University of Applied Science.
Wageningen, The Netherlands.
Hakan, E. 2003.The Peach Industry in Turkey: State of Art, Research and
Development, Mediterranean Peach Symposium, September 10th–
Agrigento, Italy.
Haleem, U., K. Mushtaq., A. Abbas. and A. D. Sheikh. 2005.Estimation of
Export Supply Function for Citrus Fruit in Pakistan. Pakistan
Development Review, 44(40), 659-672.
Hanif, T. 2003. Economics of growing mango in Khanewal district.
Unpublished. M.Sc. Thesis, Department of Agricultural Economics,
University of Agriculture, Faisalabad, Pakistan.
Harker, F.R.F.A. Gunsonand S.R. Jaeger. 2003a. The case for fruit quality: an
interpretive review of consumer attitudes, and preferences for apples.
Post-harvest Biology and Technology 28: 333-347.
Harker, R. 2002a. Improve fruit quality to increase demand. Good Fruit
Grower 53(3): 27.
Harker, R 2002b. Consumers like apples for health, taste, texture. Good Fruit
Grower 53(6): 16-17.
Harper, J.K. and G.B. White. Managing Risk in Fruit and Vegetable
Production.National Crop Insurance Services.
Harrison, D. S., A. G. Smajstrla, and F. S. Zazueta.1983.An Economic
Analysis of Irrigation Systems for Production of Citrus in Florida.
Proceedings of the Florida State Horticultural Society 96:7-11.

134
Hartwich, F.; I.From; G.F. Romero.2010. Innovation trajectories in Honduras
coffee value chain. Public and Private influence on the use of new
knowledge and technology among coffee growers. International Journal
on food systems dynamics. Vol 1,nº 3 pages 224-236.
Hassan, S. 2003. Citrus Fruit Crop in Punjab: Production Methods, Prices and
Management Practices.
Hazoor, M. S. and Z. Hussain. 2010. Marketing Margin of Mandarin: A Case
Study of Sargodha Region, Pakistan. Pakistan Journal of Social
Sciences (PJSS) Vol. 30, No. 2 (December 2010), pp. 275-291
Hewitt, T. 2000a. Estimated development costs per acre for peaches, North
Florida. University of Florida, Department of Food and Resource
Economics, NFREC, Marianna, FL.
Hewitt, T. 2000b.Estimated per acre annual costs for producing peaches,
North Florida (pick your own). University of Florida, Department of Food
and Resource Economics, NFREC, Marianna, FL.
Hewitt, T. 2000c.Estimated production costs for peaches, North Florida (fresh
market). University of Florida, Department of Food and Resource
Economics, NFREC, Marianna, FL.
Hewitt, T. D. 1982. An enterprise cost analysis of peach production in Florida.
Proc. Fla. State Hort. Soc. 95:98-101.
Hinman H., P. Tverguak., B. Peterson., M. Clements. 1992. Estimated cost of
producing red delicious apples in Central Washington. Cooperative
Extension, Washington State University, EB1720E.
Hoque Z. 2005. Value chain analysis and accounting, Handbook of Cost and
Management Accounting, Spiramus Press, London
Houthakker, H. 1951-52. Compensated Changes in Quantities and Qualities
Consumed. Rev. Econ. Stud. 19: 155-64.
Hubbard, E. E., W. J. Florkowski., T. A. Park, and H. J. Witt. 1998.Commercial
Peach Tree Inventory and Prospectus. Experiment Station Res. Rep. No.
650, University of Georgia, College of Agricultural and Environmental
Sciences.

135
Jaeger, S.R., K.L. Rossiter and K. Lau. 2005. Consumer perceptions of novel
fruit and familiar fruit: are pertory grid application. Journal of the
Scienceof Food and Agriculture 85(3): 480-488
Jan, B. and J. Saranark. 2006. Supply-chain development for fresh fruits and
vegetables in Thailand. Agro-food chains and networks for development,
119-127.
Jane,L. H. and J. J.Wann. 2004. Competitiveness and Consumer Preferences
of U.S. Fruits in Taiwan. Agribusiness, Vol. 20 (4) 433–448.
Janine, H. et al.1998. Sac/San Joaquin Valley Cling Peaches Cost and Return
Study University of California - Cooperative Extension.
Jayson, K. H. and G. M. Greene.1993. Fruit Quality Characteristics Influence
Prices Received for Processing Apples. Hort science 28(11):1125–1128.
Jha, U.M. 1997. Economics of Export Oriented Horticultural Crop(Litchi) Bihar,
Agro-Economic Research Centre, Bihar.
Jeff, W., T. Crocker., W. Sherman and T. Hewitt.2004. Alternative
Opportunities for Small Farms: Peach and Nectarine Production Review
Florida Cooperative Extension Service, Institute of Food and Agricultural
Sciences, University of Florida.
Johnson, J.M., C.B. Wood, and G.E. Mattus. 1977. Grade standards for
apples for processing. Virginia Polytechnic Inst. and State Univ., Ext.Div.
Publ. 759.
Joyce, J. W.2001.Fruit Marketing System in Taiwan Agribusiness Research
on Marketing and Trade Multiple Cropping Center, Chiang Mai University
National Chung Hsing University The Ministry of Agriculture and
Cooperatives Taiwan.
Kader, A. A. 2001. Quality assurance of harvestedhorticultural
perishables.ActaHorticulturae 553:51-55.
Kadian, K.S. 1999. Factors influencing the adoption of improved horticultural
practices in Kangra valley. Agri. Sci. Digest. Kernal. 19(1):35-38.

136
Kalaitzandonakes, N. and J.S.Shonkwiler.1992.A state-space approach to
perennial crop supply analysis. American Journal of Agricultural
Economics74, 343–352.
Kaufman, P.R., C.R. Handy., E.W. McLaughlin.,K. Park and G.M. Green.
2000. Understandingthe dynamics of produce markets: Consumption
and consolidation grow. Economic Research Service Agriculture
Information Bulletin No. 758. Washington, DC: U.S. Department of
Agriculture.
Kaul, G.L. 1997. Horticulture in India: Production, Marketing and Processing,
Indian Journal of Agricultural Economics, 52,3.
Kamas, J., G.R.McEachern., L. Stein, and N. Roe.1998.Peach Production in
Texas, Texas A&M University, Cooperative Extension Service, 10 p.
Kareemulla, K.,R.K.Tewari.,B. Singh, and K. Kumar.2007. Production and
marketing of Indian gooseberry- aonla (Emblicaofficinalis) in Pratapgarh
district of Uttar Pradesh. Indian Journal of Agricultural Marketing.21(2):
412.
Kelsey, M.P., T.M. Thomas, W.C. Search, and U. Kniese. 1989. Cost of
producing Concord grapes in southwestern Michigan. Mich. State. Univ.
Ext. Bull. E-2189.
Kevin. R. D., H. L. Andris., K. M. Klonsky, and R. L. De Moura. 2004. Sample
Costs to Establish and Produce Peaches. Southern San Joaquin
Valley.UC Cooperative Extension, University of California, Department of
Agricultural and Resource Economics, Davis, CA.
Kevin R. D, K. M. Klonsky and R. L. De Moura.2009. Sample Costs to
Establish And Produce Fresh Market Peaches. San Joaquin Valley –
South.University of California Cooperative Extension.
Khalid. M. A. 2007. Marketing System of Fruits, Margins and Export Potential
in Pakistan Pak. j. life soc. sci. 5(1-2): 34-39
Khan, A. M. S. 1980.Marketing Infrastructure, Margins and Seasonal Price
Variation of Selected Agricultural Commodities in Sindh Province of

137
Pakistan”, Tandojam: Department of Agricultural Economics and Rural
Sociology, Sindh Agriculture University.
Khan, D. A. 1994.Problems and Prospects of Horticulture in Pakistan.
Proceedings of the First International Horticulture Seminar. Islamabad:
Pakistan Agriculture Research Council.
Khan, S.R.A. 2005.Mismanagement in mango production. The Daily Dawn-
Economic and Business Review, Karachi, Pakistan.
Khuda, B., I. Hassan and M. S. Akhter. 2006. Profitability and Cost in Growing
Mango Orchards. Journal of Agriculture & Social Sciences 1813–
2235/2006/02–1–46–50.
Khushk, A.M., A. Memon, and M. I. Lashari. 2006. Marketing System of
Selected Fruits in Pakistan. Bangladesh Journal of Agricultural
Research, 31(1):39-68.
Khushk, A. M. and L. E.D.Smith.1996.A Preliminary Analysis of the Marketing
of Mango in Sindh Province, Pakistan. The Pakistan Development
Review: 35:3, 241-255.
Kimenye, L.N. 1993. Economics of Smallholder French bean Production and
Marketing in Kenya.PhD Dissertation, Michigan State University.
Kleinwechter, U, and H.Grethe. 2005. The Significance of Food Quality and
Safety Standards in Developing Countries – A Case Study for the Eurep
GAP Standard in the Mango Export Sector in Piura, Peru. Poster at the
Deutscher Tropentag 2005, Hohenheim.
Koenig, T., Blatt, J., Brakel, K., Kloss, K., Nilges, T., & Woellert, F. (2008).
Market-driven development and poverty reduction: A value chain
analysis of fresh vegetables in Kenya and Tanzania (SLE Series).
Humboldt UniversitatZu Berlin, Center for Advanced Training in Rural
Development.
Kogut B. (1985), “Designing Global Strategies: Comparative and Competitive
Value-Added Chains”, Sloan Management Review, 26, 4, Summer, 15-
28

138
Kohls, R. and Uhl, J. 1985.Marketing of Agricultural Products, 6th Edition,
New York: MacMillan.
Krewer, G.W. and R. Walker.2006.Suggestions for Organic Blueberry
Production in Georgia. University of Georgia Extension Fruit Publication
00-1, Revised December.
Kumar, P. and Mruthyunjaya.1995. Demand for Fruits and Vegetables,
Agricultural Economics Research Review, 8, 2, 64
Laajimi, A., A. Guesmi, and B. Dhehibi.2007. Supply response analysis of
apples in Tunisia: an econometric approach. Proceedings of the 103rd
EAAE Seminar‘Adding Value to the Agro-Food Supply Chain in the
Future Euro mediterranean Space, 23–25 April, Barcelona, Spain.
Laajimi, A. Guesmi, A. Mahfoudhi and B. Dhehibi 2008. Analyzing supply
response of fruit tree products in Tunisia: The case of peaches.
Agricultural Economics Review. Vol 9, No1:24-25
Lamy, J. L. 1995.Relating grape prices to wine prices: the Bottle Price
Multiplier. Vineyard & Winery Management, November/December 1995.
pg. 20-25.
LaRue, J. H. and R. S. Johnson.1989.Peaches, Plums, and Nectarines:
Growing and Handling for Fresh Market. Pub. No. 3331, Coop. Ext. Ser.,
Div. of Agri.and Natural Resources, University of California, Oakland.
Lee, S.K, A.A. Kader. 2000. Pre-harvest and post-harvest factors influencing
vitamin C content of horticultural crops. Post-harvest Biology and
Technology 20:207-230.
Linus, U. O., F. A. Al-Said, and A. Al-Abri. 2007. Assessment of what the
consumer values in fresh fruit quality: Case study of Oman, New Zealand
Journal of Crop and Horticultural Science, 2007, Vol. 35: 235-243.
Loannis, V. Z., et al.2009. Assessment of pesticide residues in fresh peach
samples produced under integrated crop management in an agricultural
region of northern Greece Department of Chemistry, University of
Ioannina, Ioannina 45110, Greece; 2009 Food Additives and
Contaminants Vol. 26, No. 9, September, 1256–1264

139
Lockshin, L.S.W.T. Rhodus. 1991. Consumer perceptions of quality: key
issues for horticultural research. Horti. Science 26(7): 823-825.
Lovreta,S., J.Koncar. and G. Petkovic. 2005.Marketing Channels, Faculty of
Economics, Belgrade
Lovreta, S., G.Petkovic, and N.Janicijevic.2001.Sales and Sales
Management, Savremena administracija, Belgrade
Lucas, R. E. 1975. Hedonic Price Functions. Econ. Inquiry 13:157-78.
Mahmood, K., S. M. Khan and M. Afzal.1989. Production and Marketing of
Potatoes in Upland Balochistan: A Preliminary Survey. MART/AZR
Research Report 45, ICARDA – Pak.
Malik, M. N. 1994.Challenges for the Year 2000 in the Field of Horticulture.
Proceedings of the First International Horticulture Seminar. Islamabad:
Pakistan Agriculture Research Council. Mangoes of Pakistan. All about
orchards magnificent mangoes of Pakistan.
Manalo, A.B. 1990. Assessing the importance ofapple attributes: An
agricultural example of co joint analysis. Northeastern J. Agr. Resources
Econ. 19(2):118-124.
Marini, R. P. 1997.Growing Peaches & Nectarines in Virginia, Virginia
Cooperative Extension, Horticulture Publication 422-019, USA.
Marshall, E. H. 2004.Technology Management Handbook.Chap.8-12, page
8/59-63, 1999.Sharp, R.; Cooley, W. The Cost of Growing Peaches in
Western Colorado, Colorado State University, USA.
McCollum, S.M., C. Price and J.R. Morris. 1995. Cost of producing grapes for
wine and juice processing in Arkansas. Special Report 173 Arkansas
Agricultural Experiment Station. Fayetteville, Arkansas.
Memon, R. A. 1978.Marketing Infra-structure, Margins and Seasonal Price
Variation of Selected Agricultural Commodities in Sindh Province of
Pakistan.Tando Jam: Department of Agricultural Economics and Rural
Sociology, Sindh Agriculture University.

140
Micke W, A. A. Hewitt, and J.K. Clark.et al. 1980.Pruning Fruit and Nut
Trees.UC Div of Agric Sci Leaflet 21171.
Mohy-ud-din, Q. 1991. Improving Marketing System of Citrus Fruit in the
Punjab Province Pakistan Agricultural Development Review 1:2 35–44.
Muhammad, S., T. Ali and M. Ahmad. 2010. Identification and prioritization of
Competencies possessed by Mango Growers in District Faisalabad
Pakistan. Pak. J. Agri. Sci., Vol. 47(4), 421-424; 2010
Mukhtar, T. and Javed, M. T. 2008. Price Integration in Wholesale Maize
Markets in Pakistan The 23rd Annual General Meeting and Conference
12-14, Pakistan Institute of Development Economics, 1075-1084.
Naik, D.1985.Marketing Costs and Margins under Different Marketing
Channels of Potato Trade in Cuttack District of Orissa, Indian Journal of
Agricultural Economics, 40, 3.
Nerlove, M. 1956. Estimates of the elasticities of supply of selected
agricultural commodities. Journal of Farm Economics 38(2): 496-509.
Nerlove, M. 1979. The dynamic of supply: retrospect and prospect. American
journal of agri-cultural economics 61 (5): 874-888.
OECD.1996.Export fruit boom from the South - a threat for the North? Paris.
OECD.1997b.Vertical coordination in the fruit and vegetable sector:
implications for existing market institutions and policy instruments.
Ohio State University. 2000. Peach Production Budgets-2000 (for Non-Fruit
and Fruit Bearing Trees), Cooperative Extension Service, 4 p.
Okie, W. R. 1998.Handbook of peach and Nectarine Varieties: Performance in
the Southeastern United States and Index of Names. Agriculture
Handbook No. 714, U.S. Department of Agriculture, Byron GA.
Omezzine, A. M. 1997. An assessment of the fresh fruit and vegetable
production and marketing systems inthe Sultanate of Oman. Sultan
Qaboos University Journal of Scientific Research (Agricultural
Sciences) 2: 13-20.

141
Opara, L.U. 2000. Fresh fruit quality. New market-pull factors influencing
perceptions of quality in agribusiness marketing (or quality assurance
for whom?). In: High leyet al. ed. Australian Center for International
Agricultural Research (ACIAR) Publication No.100: 244-252.
Opara, L.U. 2005a. Post-harvest horticulture in the Sultanate of Oman.
Proceedings of the APEC Symposium on Quality Management in Post-
harvest Systems. Pp. 339-347.
Opara, L.U. 2005b. Evidence of pre- and post-harvest innovation and possible
effects on prices of fresh produce at supermarket level in Australasia
and the Arabian Gulf. Proceedings of the APEC Symposium on Quality
Management in Post-harvest Systems. Pp. 435-443.
Ozcelik, A. and M.Sayili.1998.A Research on the Determination of the Cost of
Peach Production in the Centre Country of Tokat Province. Third Sector
Cooperation, v. 121, p. 5-21.
Pardue, M., C. Price., J. R. Clark., C. R. Rom., P. Fenn, and C. R. Garner.
1996. Economics analysis of commercial, fresh market irrigated peach
production in Arkansas. Arkansas Agricultural Experiment Station
Pawar, N.D., B.R.Pawar, and B.R.Pawar.2003. Marketing of Kesar mango in
Marathwada region of Maharashtra. National Seminar on Mango: G.A.U.
Junagadh, 14-15 June 2003
Peteraf M.A. 1993. The cornerstones of competitive advantage: A resource-
based view, Strategic Management Journal, Vol.14, 170-181.
Petkovic G. and Z. Bogetic.1996. Innovation in Performing Wholesale
Function in Trade with Daily Consumption of Food and Complementary
Products, Nova trgovina, No. 11-12, Belgrade
Pollack, S. and A. Perez. 2007. Fruit and Tree Nuts Situation and Outlook
Yearbook. Market and Trade Economics Division, Economic Research
Service, United States Department of Agriculture, October, FTS-2007
Porter M.E. 1980. Competitive strategy, The Free Press, New York
Porter M.E. 1985. Competitive advantage: creating and Sustaining Superior
Performance, the Free Press, New York
142
Porter M.E. 1990. The Competitive Advantage of Nations, The Free Press,
New York, NY
Prakash, S. and V. K.Singh. 2002. Marketing of Kinnow in Rajasthan. A
NationalLevel Quarterly Journal on Agricultural Marketing, 45, 556-563.
Rabo bank International. The world of fresh fruit trade. Utrecht, 1997.
Rae, A.N, and H.F.Carman.1975.A model of New Zealand apple supply
response to technology. Australian Journal of Agricultural Economics,
39–51.
Rader, J.S.,R.H. Walser., C.F. Williams, andT.D.Davis.1985. Organic and
Conventional Peach Production and Economics, Biological Agriculture
and Horticulture, 2(1985): 215-222
Rahim.,M.B. Kazi, and D. Sarkar.1998.Economics of Export Oriented
Horticultural Crops in Sikkim, Agro-Economic Research Centre, Visva-
Bharati, Santiniketan.
Rahn, D. 1997. The Dawning of the Perfect Peach. Research Reporter
[University of Georgia] 26:4-9.
Rajagopal.1995. Marketing of Fruits and Vegetables in Cooperative Sector,
Institute of Rural Management, Anand.
Randev, A.K. 2005.Marketing of Apple in Shimla district of Himachal Pradesh-
India. Indian Journal of Agriculture Marketing.19(3): 13-16.
Rao A N.1997. Higher Employment and Income Potential of Horticultural
Crops, Indian Journal of Agricultural Economics, 52, 3.
Reardon, T. (2005) Retail Companies as Integrators of Value Chains in
Developing Countries: Diffusion, Procurement System Change, and
Trade and Development Effects. GTZ, Eschborn, Germany.
Reddy, G.P. and M.R.K.Murthy. 2009. Food Supply Chain: Food Retail
Management, NAARM Annual Research Report 2009-10, National
Academy of Agricultural Research Management, Hyderabad.

143
Reddy. G.P.,M.R.K. Murthy. And P.C. Meena. 2010. Value Chains and
Retailing of Fresh Vegetables and Fruits, Andhra Pradesh. Agricultural
Economics Research Review Vol. 23 (Conference Number) pp 455-460.
RenquistA. R. and J.B. Reid. 1998. Quality of processing
tomato(Lycoperscionesculentum) fruit from four bloom dates in relation
to optimal harvest timing. New Zealand Journal of Crop and Horticultural
Science26: 161-168.
Richards, T. J., A. P. Kagan., P. Mischen, and R.Abu-Asamoah. 1996.
Marketing Order Suspensions and Fresh Lemon Retail-FOB Margins.
Journal of Agricultural and Applied Economies, 28(2), 263-277.
Rich, K.M. and C. Narrod. 2005. Perspectives on supply chain management
of high value agriculture: the role of public–private partnerships in
promoting smallholder
Roosen, J. 1999. A regional econometric model of U.S. apple supply and
demand.Iowa State University, Staff Paper Series # 317.
Rosen, S. 1974. Hedonic Prices and Implicit Markets: Product Differentiation
in Pure Competition." J. Polit. Econ. 82:34-55.
Russell, T., L. S.Huthoefer and E.Monke. 1992. Market Windows and Hedonic
Price Analyses: An Application to the Apple Industry. Journal of
Agricultural and Resource Economics, 17(2): 314-322
Russo, J.M. and E.G. Rajotte. 1983. A theoretical grading scheme for
production decision making: An application to fresh market apples.
Pennsylvania Agr. Expt. Sta. Bul. 844.
Sabir, I. 2003. Prospects of mango export. Business and finance review. The
News, Pak. June 09. Sauco, V.G., 1993. The situation of mango culture
in the world. Proc. 4th Int. Mango Symp., Miami, 341: 31–41
Sabir.H, M and Z. Hussain. 2010. Marketing Margin of Mandarin: A Case
Study of Sargodha Region, Pakistan Pakistan Journal of Social Sciences
Vol. 30, No. 2 (December 2010), pp. 275-291

144
Salunkhe DK., S.J. Jadhav. And M.H. Yu. 1974. Quality and nutritional
composition of tomato fruit as influenced by certain biochemical and
physiological changes. Qualitas plantarum 24: 85-113
Saraswat, S.P., P.S.Dahiya, and P.Singh.2006. Production and marketing of
peach fruit: a case study of Rajgarh area of district Sirmour in Himachal
Pradesh. Indian Journal of Agricultural Marketing.20(2): 87-88
Scarborough, V., and J. Kydd 1992.Economic Analysis of Agricultural
Marketing: A Manual. Chatham, U.K: Natural Resources Institute.
Marketing of Mango in Sindh 255
Schatzer, J., M. Smith, and D. McGraw.1997a.Peaches, pre plant year.
Oklahoma State University, Department of Agricultural Economics,
Stillwater, OK.
Schatzer, J., M. Smith, and D. McGraw.1997b. Peaches, establishment
year.Oklahoma State University, Department of Agricultural Economics,
Stillwater, OK.
Schatzer, J., M. Smith, and D. McGraw. 1997c.Peaches, year 2. Oklahoma
State University, Department of Agricultural Economics, Stillwater, OK.
Schatzer, J., M. Smith, and D. McGraw. 1997d.Peaches, year 3. Oklahoma
State University, Department of Agricultural Economics, Stillwater, OK.
Schatzer, J., M. Smith, and D. McGraw. 1997e.Peaches, year 4 to 15.
Oklahoma State University, Department of Agricultural Economics,
Stillwater, OK.
Scherm, H., and G. Krewer.2003.Blueberry Production in Georgia: Historical
Overview and Recent Trends. Small Fruits Review Vol. 2:83-91.
Sharif, M., U.Farooq, and W. Malik. 2005. Citrus Marketing in Punjab:
Constraints and Potential for Improvement. The Pakistan Development
Review, 44(4), 673- 694.
Sharif, M. and B. Ahmed.2005. Marketing of Fruits Under WTO Regime.
Pakistan Agricultural Research Council. Daily The News,
Rawalpindi/Islamabad, Lahore and Karachi on August 29, 2005.

145
Shakoor, A., 2001. Economics of growing kinnow in Toba Tek Singh district of
Punjab Province. Un-published M. Sc. Thesis, Department of Agricultural
Economics, University of Agriculture, Faisalabad, Pakistan
Shank J.K. 1989. Strategic cost management: New Wine, or Just New
Bottles. Journal of Management Accounting Research, 1, 47-65
Sharp, R. and W. Cooley, 2004.The cost of growing peaches in Western
Colorado, Colorado State University, USA.
Shewfelt, R.L. 1999. What is quality? Post-harvest Biology and Technology
15: 197-200.
Siddiqui, S. A. 1979.Marketing of Agricultural Products in Sindh. Tando Jam:
Department of Agricultural Economics and Rural Sociology, Sindh
Agriculture University.
Singh, B. 1985.Price Structure and Price Spread in Potato in Punjab, Indian
Journal of Agricultural Economics, 40, 3.
Singh, M. et al. 1985. Price Spread of Vegetables Marketing, Indian Journal of
Agricultural Economics, 40, 3.
Sirajul, H. 2011.Export of fruits and vegetables. Economic Review.
FindArticles.com. 18 Mar,
Sreenivasa M. D., T.M. Gajanana, M. Sudha and V. Dakshinamoorthy, 2007.
Marketing Losses and Their Impact on Marketing Margins: A Case Study
of Banana in Karnataka. Agricultural Economics Research Review Vol.
20 pp 47-60
Stegelin, F. E. 1980. Comparison of potential returns from grapes,
blueberries, and strawberries for north-central Florida. Proc. Fla. State
Hort. Soc. 93:155-159.
Stegelin, F. E. 1982. Marketing Florida grapes: Which way? Univ.of Florida,
Coop. Exten. Serv. Mimeo.
Stephen, D. and J.Luckstead.2009. An analysis of apple supply response,
International Journal of Production Economics.

146
Subodh, A., S.K.Goyal and A.Dhingra.2011. Marketing and Post-Harvest
Management of Fruits in Himachal Pradesh IJMMR Volume 2, Issue 2
(February, 2011).
Subrahmanyam, K.V. and V. Mohandas. 1982. Economic evaluation of co org
mandarin orange in Karnataka. Indian Journal of Agricultural Economics,
37(1): 70- 76.
Suryanata, K.1994. Fruit trees under contract: tenure and land use change in
upland Java, Indonesia. World Dev 22(10):1567–1578
Swarup, et al. 1985. Price Spread and Marketing Margins for Himachal
Apples: Temporal and Spatial Analysis. Indian Journal of Agricultural
Economics 11:3433–446.
Swinton, S. M., S. A. Brempong, and G. R. Van Ee.1997. Investment Analysis
of Alternative Fruit Tree Sprayers in Michigan Orchards, Michigan State
University, Department of Agricultural Economics, East Lansing, MI
48824, USA.
Tauer, L. W. 2000.Investment Analysis in Agriculture, SP 2000-03, Dept. of
Agric., Resource and Managerial Economics, Cornell University, Ithaca,
New York, 14853-7801, USA.
Tejo, P. 1997.Technology standards in Chilean fruit and vegetable production.
Desarrollo Productivo, Santiago de Chile, Cepal, n. 48.
The Ohio State University (OSU).2000. Peach Production Budgets-2000 (for
Non-Fruit and Fruit Bearing Trees), Cooperative Extension Service, 4 p.
Theil, H. 1951-52. Qualities, Prices, and Budget Enquiries. Rev. Econ.
Stud.:129-47.
Tijskens, L.M.M. and J.J.Polderdijk. 1996. A generic model for keeping quality
of vegetable produce during storage and distribution. Agricultural
Systems, 51 (4), 431-452.
Tilekar,S.N.1985. An Analysis of Net Prices received by Alphonso Mango
Growers ofRatnagiri District, Indian Journal of Agricultural Economics,
40,3.

147
Timothy, D. H.1983. An analysis of Profit potential of Muscadine Grape
Production in Florida. Food and Resource Economics Department,
Agricultural Research Center, Marianna, FL 32446 Proc. Fla. State Hort.
Soc. 96: 209-212.
Timothy A. P. and W. J. Florkowski.2003. Selection of Peach Varieties and
the Role of Quality Attributes” Journal of Agricultural and Resource
Economics 28(1): 138-151 2003.
Trienekens, J.H., et al. 2004. Dynamics in chains and networks: proceedings
of the sixth international conference on chain and network management
in agribusiness and the food industry (Ede, 27-28 May). Wageningen
Academic Press, Wageningen, 568-582.
Tronstad, R., L.S. Huthoefer, and E. Monke. 1992.Market windows and
hedonic price analyses: An application to the apple industry. J. Agr.
Resources Econ. 17(2):314-322.
Tschirley, David and M. Ayieko. 2008. Assessment of Kenya’s Domestic
Horticultural Production and Marketing Systems and Lessons Learned
for the Future. Tegemeo Working Paper 32.Nairobi; Tegemeo Institute of
Agriculture Policy and Development, Egerton University.
Tschirley, D., Ayieko, M., Hichaambwa, M., Goeb, J., & Loescher, W. 2010.
Modernizing africa's fresh produce supply chains without rapid
supermarket takeover: towards a definition of research and investment
priorities (MSU International Development Working Paper No. 106).
Michigan State University, Department of Agricultural, Food, and
Resource Economics.
Tu, H. 2008. A reconnaissance study of the citrus value chains in Tanga
region, Tanzania.Larenstein University, Wageningen, The Netherlands.
University of Balochistan 1988.A Study of Channels and Margins in the
Marketingof Apple in Balochistan. Quetta: Economic Research Unit.
U.S. Department of Agriculture, Agriculture Marketing Service. Marketing
Michigan Apples, Peaches, and Plums, various issues, 1982-89.
Washington DC: Government Printing Office.

148
Uzunoz.M and Y. Akcay.2006. A Profitability Analysis of Investment of Peach
and Apple Growing in Turkey. Journal of Agriculture and Rural
Development in the Tropics and Subtropics Volume 107, No. 1, 2006,
pages 11–18.
Vaden, D.H. and T.K. Wolf. 1994. The cost of growing wine grapes in Virginia.
Virginia Cooperative Extension Publication 463-006. Walker, Larry. 1995.
Vineyard Development: What’s the Cost? Wines and Vines, June, 1995.
pg. 22-27.
Vaidya, M.K., S.C. Tewari and K.K. Raina, 1991.An economic analysis of
apple plantation in Shimla district of Himachal Pardesh.J. Agric. Develop.
Policy, 2: 31–9
Wang, C., Z. Junye and H. Min. 2010. Measurement of the Fluctuation Risk of
the China Fruit Market Price based on VaR* International Conference on
Agricultural Risk and Food Security 2010.
Warmund, M.R. 2000.Home Fruit Production: Peach and Nectarine Culture,
Department of Horticulture, University of Missouri-Columbia, 6 p.
Waugh, F. V. 1928. Quality Factors Influencing Vegetable Prices. J. Farm
Econ. 10: 185-96.
Weibel A., R.S. Johnson, and T.M. DeJong. 2002. Comparative vegetative
growth responses of two peach cultivars grown on size-controlling vs.
standard rootstocks. Amer SocHort Sci 128:463–71.
Westberry, G. and M. Collier. 1998. Mid-season peach production budget.
University of Georgia, Department of Agricultural and Applied
Economics, Tifton, GA.
White, G.B. and J.S. Kamas. 1990. The economics of Concord and Niagara
production in the great lakes region of New York. 1989. Dept. Ag.
Econ.Cornell Univ. Bull.A.E. Ext. 90-3.
Wickens, M.R. and J.N.Greenfield. 1973.The economics of agricultural
supply: an application to the world coffee market. Review of Economics
and Statistics 55, 433–440.
149
Williamson, J., T. Crocker., W. Sherman, and T. Hewitt.2004. Alternative
Opportunities for Small Farms: Peach and Nectarine Production Review.
Extension Administration Office, Florida Cooperative Extension Service,
Institute of Food and Agricultural Sciences, University of Florida.RF-
AC018.First Published: June 1987.Revised: June.
Williamson, J. and P. Lyrene.1995.Commercial Blueberry Production in
Florida. Gainesville, FL: Institute of Food and Agricultural Sciences,
University of Florida. SP, 197.
Willet, L.S. 1993.The U.S. apple industry: econometric model and projections.
Agricultural Resources Economic Review 22(2), 138–149.
World Bank, 2006. China’s Compliance with Food Safety Requirements for
Fruits and Vegetables: Promoting Food Safety, Competitiveness and
Poverty Reduction. World Bank, Beijing/Washington, DC.
Zaheer, l. K. Z. and A. Ahmad. 1997. Pesticide abuse in Pakistan and
environment associated human health mental risks. Pak. J. Agri. Sci.
Vol. 34 (1-4).

150
APPENDICES
A.1 Top 10 countries producing peaches and nectarines (% of World Production)
S.NO Name of Countries Percent World Production
1 China 44%
2 Italy 13%
3 USA 10%
4 Spain 8%
5 Greece 7%
6 France 3%
7 Turkey 3%
8 Iran 3%
9 Chile 2%
10 Argentina 2%
Source: FAO 2004
A. 2 Total peach area in provinces and Pakistan
Area in "000" Hectares
Year K. Pakhtunkhwa Punjab Baluchistan Pakistan
1999-00 1.3 0.2 3.3 4.8
2000-01 1.3 0.2 4 5.5
2001-02 1.9 0.2 3.7 5.8
2002-03 5.4 0.2 3.6 9.2
2003-04 5.2 0.1 9.4 14.7
2004-05 5.5 0.1 9.5 15.1
2005-0 5.6 0.1 9.5 15.2
2006-07 5.7 0.1 9.6 15.4
2007-08 6 0.1 9.5 15.6
2008-09 6.2 0.1 9.5 15.8
Source: Government of Pakistan 2010

151
A.3 Total peach production in provinces and Pakistan
Production in "000" Tonnes
Year K. Pakhtunkhwa Punjab Baluchistan Pakistan
1999-00 14.5 1.2 17.3 33
2000-01 14.8 1.3 16.9 33
2001-02 21 1.2 15.4 37.6
2002-03 60.2 1.1 15 76.3
2003-04 56.8 0.9 18.7 76.3
2004-05 50.9 0.5 18.1 69.5
2005-06 51.6 0.5 18.2 70.3
2006-07 53.1 0.4 17.7 71.2
2007-08 56.6 0.4 25.3 82.3
2008-09 57.8 0.5 25.4 83.7
Source: Government of Pakistan 2010
A.4 Peach production per hectare in provinces and Pakistan
Yield Per Hectare in Tons
Year K. Pakhtunkhwa Punjab Baluchistan Pakistan
1999-00 11.154 6.000 5.242 6.875
2000-01 11.385 6.500 4.225 6.000
2001-02 11.053 6.000 4.162 6.483
2002-03 11.148 5.500 4.167 8.293
2003-04 10.923 9.000 1.989 5.190
2004-05 9.255 5.000 1.905 4.603
2005-06 9.214 5.000 1.916 4.625
2006-07 9.316 4.000 1.844 4.623
2007-08 9.433 4.000 2.663 5.276
2008-09 9.323 5.000 2.674 5.297
Source: Government of Pakistan 2010

152
A.5 World major fruit production (2000, Million Tons)
S.NO Name of Fruit 2000, Million Tons
1 Citrus 100
2 Banana 64
3 Grapes 68
4 Apple 59
5 Mango 25
6 Pear 13
7 Pineapple 17
8 Peach & Nectarine 13
9 Plum 9
10 Papaya 5
11 Date 5
12 Strawberry 3
13 Apricot 3
14 Avocado 2
15 Others 79
Total 466
Source: FAO 2000

153
A.6 Percent dietary value of peaches and nectarines
S.NO CONTENTS PERCENTAGE (%) IN 100 GRAM
1 Water (%) 89
2 Calories 38
3 Protein (%) 0.6
4 Fat (%) 0.1
5 Carbohydrates (%) 10
6 Crude Fiber (%) 0.6
7 Vitamin A 27
8 Thiamin, B1 1.4
9 Riboflavin, B2 3.1
10 Niacin 5.6
11 Vitamin C 15.6
12 Calcium 1.1
13 Phosphorus 2.4
14 Iron 5.0
15 Sodium ---
16 Potassium 4.3
Source: US department of Agriculture

154
A. 7 Age-wise cost and returns of peach in different sizes of
orchards (Rs / ha) during 2008 in India
Age
Years
Below 1Ha 1-2 Ha Above 2 Ha Overall
Cost Returns Cost Returns Cost Returns Cost Returns
1 15431 0 6543 0 16880 0 16285 0
2 10297 0 0297 0 11188 0 10705 0
3 12704 0 12704 0 13631 0 12936 0
4 12873 0 2873 0 13098 0 12891 0
5 13094 21579 13371 22651 14636 24551 13700 22927
6 13468 22758 13744 24901 14356 28763 13856 25474
7 4247 26862 14521 25324 14368 31982 14379 28056
8 14284 28766 14997 29779 15393 36825 14891 31790
9 15249 32061 15624 34688 16381 40882 15751 35877
10 15667 36548 15943 38406 16409 44649 16006 39868
11 16077 38754 16342 41099 17355 48662 16591 42838
12 15375 38844 16053 43872 17015 46047 16148 42921
13 15662 37655 14629 41883 16042 42577 15444 40705
14 15872 39253 13720 40673 14354 38061 14649 39329
15 14115 39564 14722 39449 13162 39542 14000 39518
16 14022 38751 14433 41772 13465 32701 13973 37741
17 13741 32836 14071 37240 14509 30658 14107 33578
18 13394 29735 13667 34662 12965 30981 13342 31793
19 12878 29706 13209 32763 11350 29874 12479 30781
20 11387 28618 12081 26884 12763 27554 12077 27685
21 12077 27642 11541 25339 12357 25984 11658 26322
22 11352 21567 10774 20839 10734 21865 10620 21443
23 10044 18278 10497 17774 10030 21087 10190 19046
24 9864 14569 10164 16271 9732 16645 9920 15828
25 8753 12497 9459 14559 9135 13842 9116 13633

155
A. 8 World peach &nectarine production in 2001-2010 (Metric Ton)
Countries 2001 2002 2003 2004 2005 2006 2007 2008 2009 2010
China 4596157 5259806 6179 365 7040472 7649678 8243298 9080215 9563679 10170038 10718048
Italy 1679100 1586590 1175860 1710010 1693150 1664810 1630440 1589120 1691790 1590660
Usa 1341640 1422020 1341000 1429810 1301900 1132 530 1279 310 1304350 1197670 1044440
Spain 1082290 1275830 1270820 987574 1260880 1245530 1222070 1244290 1191300 1134750
Greec 943336 68 7000 228000 875544 864406 767938 816009 734100 749000 639400
Turkey 460000 455000 470000 372000 510000 552775 539435 551906 547219 534903
Iran 380000 385000 390000 400770 439770 371000 421304 574858 496130 500000
France 438784 445675 338800 386511 390554 384166 352030 292490 341715 314721
Egypt 247300 339266 30 2667 360397 360000 427639 452273 399416 363209 273256
Chile 290000 293000 304000 311000 311000 345000 370000 372000 388000 357000
Argentina 257768 211922 255785 272442 272500 260000 270000 308731 290774 318000
Brazil 222616 218292 220364 235720 235471 199719 185959 239149 216236 220739
Mexico 175752 197946 223883 201957 208185 220063 192261 202066 198085 227401
Source: FAO 2011

156
A.9 Agriculture activities in peach production and marketing in peach orchards in study area
Detail of Activities
Early
Varieties
Mid
Varieties
Late All
Farm Yard Manure used in trollies 1.70 1.54 1.97 1.70
No of labour used for FYM
application
2.88 3.00 4.50 3.08
No of labour used for hoeing 4.13 4.93 6.22 4.50
No of labour used for pruning 3.35 3.76 3.94 3.49
No of Fertilizers used in Bags 4.70 5.14 5.70 4.89
No of labour used for Fertilizer
application
1.84 1.99 2.61 1.96
No of pesticide sprays 1.99 2.92 3.49 2.32
No of labour used for pesticide
spray
14.22 5.94 6.46 11.93
No of labour used for irrigation 2.95 3.44 3.90 3.14
Cost of empty Carton Rs. 29220.06 28800.00 28687.50 29088.29
Cost of picking and grading Rs. 8107.88 11009.47 10439.60 8865.41
Cost of decoration materials Rs. 10847.85 10061.83 8423.08 10439.42
Cost of transportation Rs. 24724.37 22675.49 21896.32 24055.54
Cost of loading & un loading Rs. 2780.98 2575.16 2650.73 2731.23
Cost of Maundi Commission Rs. 17105.24 16874.25 18451.46 17218.54
Total Marketing Cost in Rs. 92802.68 91996.21 90548.70 92410.13
Total Revenue in Rs. 254268.33 240787.5 241327.9 250510.0
Household Consumption in
Carton
17.05 14.59 14.09 16.30
Total Production in Tons 7.319 7.439 6.740 7.274
Area under Peach in Hectares 1.76 1.056 0.972 1.552
No of Peach Production in
cartons
914.75 929.87 824.5 909.20
Peach Carton Size in Kg 8.00 8.00 8.00 8.00
Average Price per Carton Rs. 264.44 258.98 252.59 262.17

157
A.10 Average peach production per hectare in carton by different varieties in the study area during 2010-11
Name of Peach Varieties sown
Average production in Cartons per He
No of Respondents Std. Deviation
Early Grand 19864 67 458.79979
Spring Crest 19280 28 413.96189
Carmen 22704 5 543.80807
NJC- 84 18880 113 457.72771
Elberta 20128 24 434.26961
Maria Delezia 17936 27 347.50448
Indian Blood 18896 34 261.80047
Sohani 23056 2 235.70226
Total 19248 300 422.88794
A.11 Average marketing cost per hectare of different peach varieties in the study area during 2010-11
Name of Peach Varieties
Cost of Packing Rs.
Cost of picking & grading Rs.
Cost of decoration Rs.
Transportation Cost Rs.
Loading & un loading Rs.
Commission fee Rs.
Early Grand 73032 17684 27641 62347 2678 39964 Spring Crest 72299 24445 30239 56836 7690 43843 Carmen 85141 20287 23975 61165 7631 50069 NJC- 84 70807 20299 25527 60688 6744 42243 Elberta 75484 28589 31705 61079 7635 40956 Maria Delezia
67271 25953 18762 51501 5228 42322
Indian Blood
70858 25786 20805 54084 6547 45575
Sohani 86450 20583 28817 98800 9057 77393 Total 71848 21898 25785 59417 6746 42530

158
QUESTIONNAIRE/ INTERVIEW SCHEDULE
VALUE CHAIN ANALYSIS OF PEACH FRUIT INKHYBER PAKHTUNKHWA
District: ------------------------------ Cell #-----------------------------------
A. Social Information:
1. Name of Interviewer: ---------------------------.Date of interview: -------------------
2. Name of Respondent: --------------------------.Village:---------------------------------
3. Age of Respondent: -----------------------------.Education:----------------------------
4. No of Male Family members involved in Agriculture: ------------------------------
B. Land Ownership, Tenancy or Lessee:
5. What is your total cultivated land? -------------------6. Rented from others: -----------
7. Rented to others: -----------------------------------------8.Culturable waste: ---------------
C. Cropping Pattern & Farm Income:
RABI SEASON
S# Name of Crop Area Sown Total Production Price per Unit Household Consumption
1 Wheat
2 Onion
3 Pea
4 Others
KHARIF SEASON
1 Maize
2 Rice
3 Tomato
4 Others
FRUIT CROPS
1 Apple
2 Peach
3 Apricot
4 Plum
5 Persimmon
6 Others
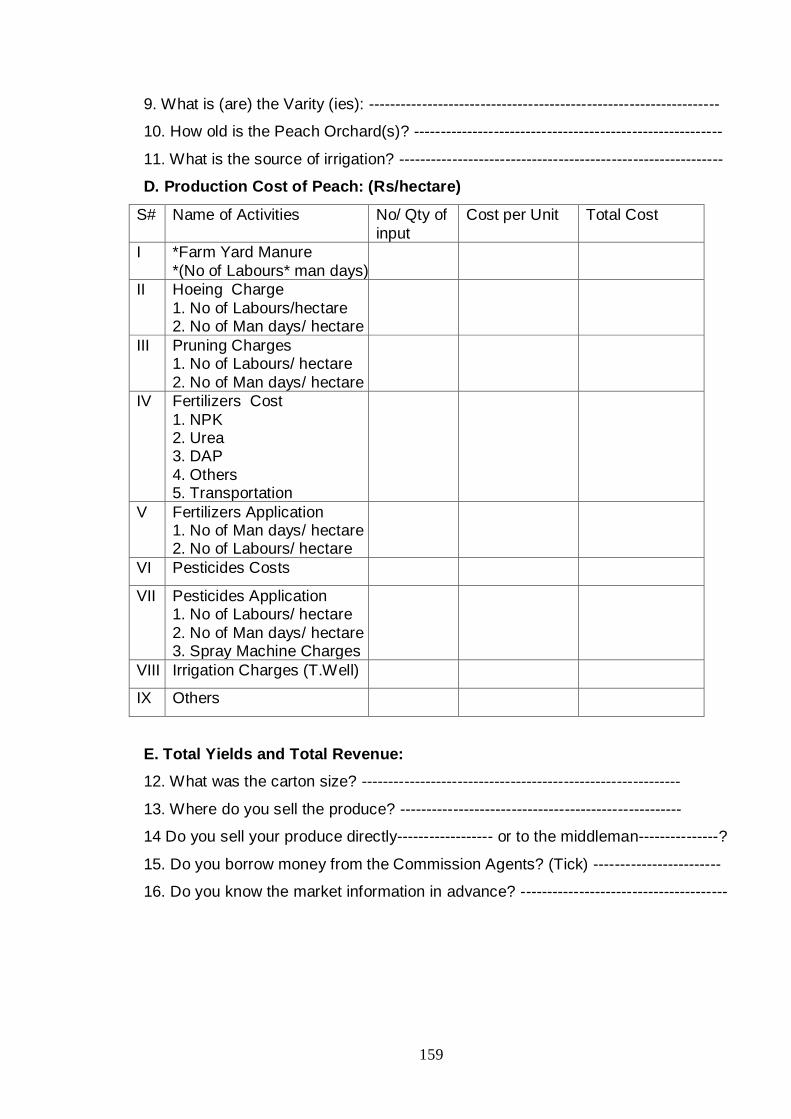
159
9. What is (are) the Varity (ies): ------------------------------------------------------------------
10. How old is the Peach Orchard(s)? ----------------------------------------------------------
11. What is the source of irrigation? -------------------------------------------------------------
D. Production Cost of Peach: (Rs/hectare)
S# Name of Activities No/ Qty of
input
Cost per Unit Total Cost
I *Farm Yard Manure
*(No of Labours* man days)
II Hoeing Charge
1. No of Labours/hectare 2. No of Man days/ hectare
III Pruning Charges 1. No of Labours/ hectare
2. No of Man days/ hectare
IV Fertilizers Cost
1. NPK 2. Urea 3. DAP
4. Others 5. Transportation
V Fertilizers Application 1. No of Man days/ hectare 2. No of Labours/ hectare
VI Pesticides Costs
VII Pesticides Application 1. No of Labours/ hectare
2. No of Man days/ hectare 3. Spray Machine Charges
VIII Irrigation Charges (T.Well)
IX Others
E. Total Yields and Total Revenue:
12. What was the carton size? ------------------------------------------------------------
13. Where do you sell the produce? -----------------------------------------------------
14 Do you sell your produce directly------------------ or to the middleman---------------?
15. Do you borrow money from the Commission Agents? (Tick) ------------------------
16. Do you know the market information in advance? ---------------------------------------