Embed Size (px)
Citation preview


Contents
Chapter 1: Introduction 1Project Background 2objectives 2scope of Work 2Approach and Methodology 3Significance of Value Chain Analysis Study 5
Chapter 2: The North East Region: An Overview 7strategic Location 7topography and Agro-Climatic Characteristics 7Connectivity/Logistics 7Demographic and socioeconomic Characteristics 8Agriculture 10swot Analysis of Agribusiness scenario in north east Region 11
Chapter 3: Horticulture Scenario in North East Region 13State-wise Profile 15
Arunachal Pradesh 15Assam 19Manipur 23Meghalaya 26Mizoram 30nagaland 33sikkim 37tripura 41
Chapter 4: Identification of Focus Crop Groups 45Product-wise Contribution of states in neR Production Basket (2010-11) 46Product-wise Contribution of states in neR Production Value (2010-11) 47Identified Focus Crop Groups Based on the Parameters Identified for selection Criteria 49Identified Production Clusters of FCGs 50Seasonality of Selected FCGs 51
Chapter 5: Value Chain Analysis 53Pineapple 53
Assam 54Tripura 56Meghalaya 59nagaland 60
Citrus 64Assam 64Manipur 69Meghalaya 71sikkim 73

iv Value Chain Analysis of Select Crops in North Eastern States
Ginger 75Assam 75Meghalaya 77sikkim 79
turmeric 81Assam 81Meghalaya 82Mizoram 84
Naga Chilli 86nagaland 86
Passion Fruit 87nagaland 88
Kiwi Fruit 89Arunachal Pradesh 90
Large Cardamom 92sikkim 92
Vegetables 93Assam 94Meghalaya 103
Conclusion 107
Chapter 6: Benchmarking with Existing Best Practices 109Pineapple 109Mandarin 110Ginger 111turmeric 111
Chapter 7: Conclusion & Recommendations 113Land tenure and ownership system 113Poor Cultivation Practices and Low Productivity 113Poor and Weak extension system 114Poor Logistics and Connectivity 114Poor Marketing and Post-Harvest Infrastructure 115Lack of Processing Industries 115Recommendations 116
Pineapple 116Citrus 118Ginger 120turmeric 122Vegetables 123naga Chilli 124Passion Fruit 124Kiwi Fruit 125Large Cardamom 125
Annexure 1 126
Annexure 2 133
Literature Reviewed 163

LIST OF ABBREVIATIONS
AGMARKNET Agricultural Marketing Information Network
APMC Agricultural Produce Marketing Committee
FCGs Focus Crop Groups
FGDs Focussed Group Discussions
GDP Gross Domestic Product
ha Hectares
IsAP Indian society of Agribusiness Professionals
KVK Krishi Vigyan Kendra
MAPs Medicinal & Aromatic Plants
MoDoneR Ministry of Development of north eastern Region
MsL Mean sea Level
Mt Metric tonnes
ne north east
neC north eastern Council
NEDFi North Eastern Development Finance Corporation Ltd.
neR north eastern Region
neRAMAC north eastern Regional Agricultural Marketing Corporation Limited
nHB national Horticulture Board
SFAC Small Farmers’ Agribusiness Consortium
VCA Value Chain Analysis


PREFACE
the north east region of India, comprising of the state Assam, Arunachal Pradesh, Manipur, Meghalaya, Mizoram, Nagaland, Tripura and Sikkim, is a reservoir of rich natural resources. All the north-eastern states have distinct advantages, and provide immense economic and trade opportunities to domestic and international players. The NE region shares borders with China in the north, Bangladesh in the south-West, Bhutan in the north-West and Myanmar in the East. This makes the North-East a prospective hub of international trade and commerce.
Unlike the rest of India, north east India has an added demographic advantage, in the sense that it occupies 7.8 percent of the country’s total land space but has a population of only 44 million, which makes it approximately 3.80 percent of the country’s population.
Blessed with rich biodiversity, conducive agro climatic conditions, forest wealth, fruits and vegetables, flowers, herbs and aromatic plants, rare and rich flora and fauna, NE India has all the potential to transform into a commercial horticulture hub.
the area is a vibrant source of varied horticultural crops, which can be linked to distant markets within the country as well as for export. Horticultural crops in the NE region cover 857 thousand ha, constituting 2.34% of the total horticulture area in the country. From the production point of view, NE region produces about 7815 thousand MT of horticulture produce and contributes 6.79% to the total production basket of the country.
Major horticultural crops grown in the ne region include citrus, pineapple, kiwi, mango, guava, litchi, banana among fruits, potato, onion, tomato, cauliflower, cabbage, brinjal, beans among vegetables, chrysanthemum, rose, orchids etc. in flowers, ginger, turmeric large cardamom, coriander, cumin among spices and cashew nut, arecanut and tea among plantation crops. The productivity of many of the horticultural crops in entire NE region is much below the National level. This weakness of the region can be converted into an opportunity, and productivity and production levels can be increased significantly to enhance the total production at national level, to meet the ever-growing demand for horticulture produce. since horticulture provides higher return per unit of land and generates higher employment, development of horticulture also helps in alleviating the economic condition of people below the poverty line.
However, despite these distinct advantages, north-east horticulture has not grown at par with the rest of the country, and the region’s horticulture potential has not been tapped, mainly due to lack of market led production practices, poor commercial understanding of farmers, insufficient infrastructure at the farm level, poor transportation system, inadequate road network, lack of post harvest infrastructure like dedicated markets, pack houses, cold storages, sorting grading lines, processing industries etc. Due to the lack of adequate post harvest infrastructure in the region, not only are post harvest losses high, but dependency of farmers on intermediaries for marketing is very high.

viii Value Chain Analysis of Select Crops in North Eastern States
With significant initiatives taken by the Government of India to promote horticulture development in the north-east region, appropriate strategies like adoption of market-driven production system, enhancement of productivity, appropriate post-harvest handling through proper packaging, loading/unloading of commodities and promotion of pack house concept including collection centre in the production clusters, cold storage, processing and value addition, creation of adequate transportation infrastructure and organised marketing system are necessary additions to current interventions to provide remunerative prices to farmers.
With necessary infrastructure development within the region, and the building of connecting links between north-east and the rest of India, and north-east and south-east Asia, the horticulture potential of the region can be suitably exploited. Time-bound implementation of projects, monitoring of fund–flows and necessary marketing and branding of the region can truly transform this goldmine region into a vibrant hub of horticulture business and trade.
This value chain study by Small Farmers’ Agribusiness Consortium is an initiative to understand the working of the production and supply chain of major high value works in the ne region and recommend or strategy to achieve the goal of making the north-eastern region a true horticulture hub, not only of India but of the entire South-East Asian region.
C H A P t e R
IntRoDUCtIon
1
the north eastern Region (neR) of India includes the states of Arunachal Pradesh, Assam, Manipur, Meghalaya, Mizoram, Nagaland, Sikkim and Tripura. The eight states share a number of attributes such as frontier locations, rich natural resources, variety in agro-climatic conditions and inherited potential of growing various types of crops. Out of a total geographical area of the region, 65% is under undulating tracks and hills and remaining 35% is plain.
the north eastern Region falls under the high rainfall zone and the climate ranges from tropical to alpine. The region is physiographically characterised by difficult terrain, wide variations in slopes and altitudes and traditionally indigenous cultivation practices.
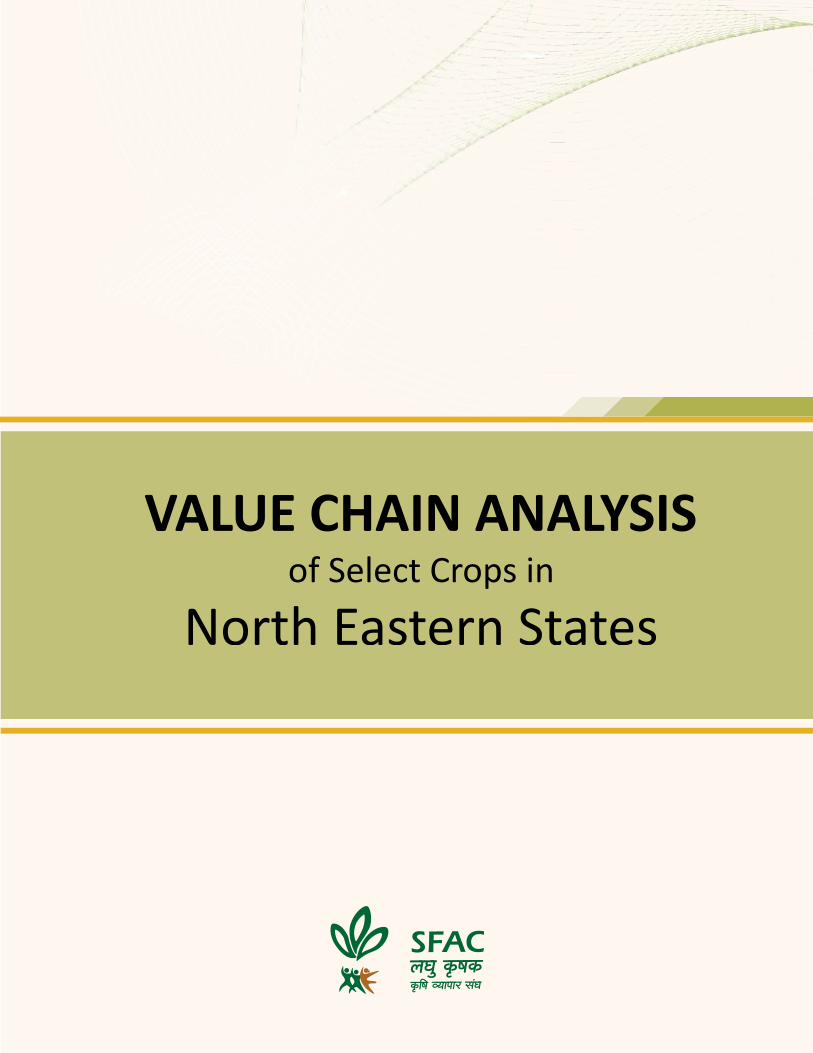
Agriculture constitutes of 26% of the total GDP of NER and is one of the major contributors to the economy of north eastern states, engaging one-third of the total work force in the region. The eight contiguous states of undulating terrains cover a total geographical area of 2.62 lakh Sq Km, out of which the gross cultivable area is 65,500 Sq Km. Paddy and maize dominate the rain-fed hill ecosystem, however, in selected areas, horticulture is emerging as a primary source of income for the farmers due to conducive physiographic conditions of the region. Assam and Tripura are the major states producing fruits and vegetables, with Assam leading with a contribution of 60 percent to the total horticulture produce of NER.
state-wise share of horticulture in neR is as follows:
Assam 60%Arunachal Pradesh 4%
Manipur 7%
Meghalaya 9%Mizoram 1%
Nagaland 2%
Tripura 15%Sikkim 2%
Figure 1: State-wise Contribution to Horticulture in NER
Source: ISAP Analysis & NHB Data, 2011

2 Value Chain Analysis of Select Crops in North Eastern States
Project Backgroundnorth east Region is endowed with diverse agro-climatic conditions which are conducive for cultivation/production of varied horticultural crops. Though NER has the potential to achieve maximum productivity, but it has not been capitalised so far because of various factors In order to evolve a strategic module for the wholesome development of horticulture, there is a need to identify gaps, efficiency levels, inherited advantages across value chain of potential horticultural crops of the North Eastern region.
With this background, Small Farmers’ Agribusiness Consortium (SFAC) has decided to conduct a detailed value chain study of Focussed Crop Groups (FCGs) of North Eastern Region and has engaged the Indian Society of Agribusiness Professionals (ISAP) for this purpose. The study comprises of mapping of main and supporting activities of production, post-harvest operations, logistics, marketing and services etc.
ObjectivesThe specific objectives of the Value Chain Analysis were as follows:
to map the movement of price and journey of the raw materials from farmers to ��
commission agent, traders, processors, wholesalers, retail chains and ultimately to the end consumer;to track the food miles;��
to identify the location of the proposed collection centres in terms of the sustainable ��
supply and profitability;to locate and pin point possible collection centres for the above mentioned crop ��
groups;to develop the proposed crop calendar: Activity calendar from sowing to harvesting ��
across various months;to calculate the number of man-days utilised for various crop groups in the district;��
To separate peak and off season of focus crop groups;��
to study particular crops from the view point of various stakeholders such as farmers, ��
traders, consumers etc.
Scope of WorkThe following six focus crop groups have been identified for detailed value chain mapping and analysis:
Root spices – Ginger/turmeric1. Citrus – Mandarin/oranges and lemon2. Pineapple3. naga Chilli4. Vegetables – Legumes, solanaceous, cruciferous, cucurbitaceous and others5. Others – location-specific crop groups6.
the project entailed studying the primary and supporting value chain activities for each of the six focus crop groups. The following activities were mapped under the project:

3Chapter 1 | Introduction
Primary Value Chain ActivitiesInbound logistics��
operations��
outbound logistics��
Marketing and sales��
service��
Supporting Value Chain ActivitiesProcurement��
HRM��
technology development��
Infrastructure��
Approach and MethodologyApproachAs the scope of study required in-depth understanding of the product flow, its treatment at each level, price markup, roles being played by each value chain player as well as factors affecting the value chain, ISAP has adopted a combination of research tools including secondary and primary research followed by quantitative and qualitative assessment for comprehensive analysis to achieve the desired results and objective of the study.
Methodologysecondary Research
This step served as a prefix of study, providing basic understanding of regions and helped in developing the approach for the next stage of the study. Secondary information helped in understanding the crop profile of catchment areas, existing levels of production, marketing infrastructure available for focus crops groups as well as infrastructure facilities for logistics, storage and marketing.
the following data sources were targeted for collecting various data and information:Data gathering from NHB, AGMARKNET, NEDFi, NERAMAC, State Horticulture Deptt. ��
and other database to ascertain:Current production, surplus, domestic & international trade �Information on current status of the infrastructure & basic facilities �
Literature study on current supply & value chains��
Primary Research and Qualitative Assessment
An interaction was held with all the stakeholders in the identified belts and region and focus group discussions helped to gather information on the situation of horticulture across the value chain. This has lead to finding out the gaps and suggestions provided by all the stakeholders.
4 Value Chain Analysis of Select Crops in North Eastern States
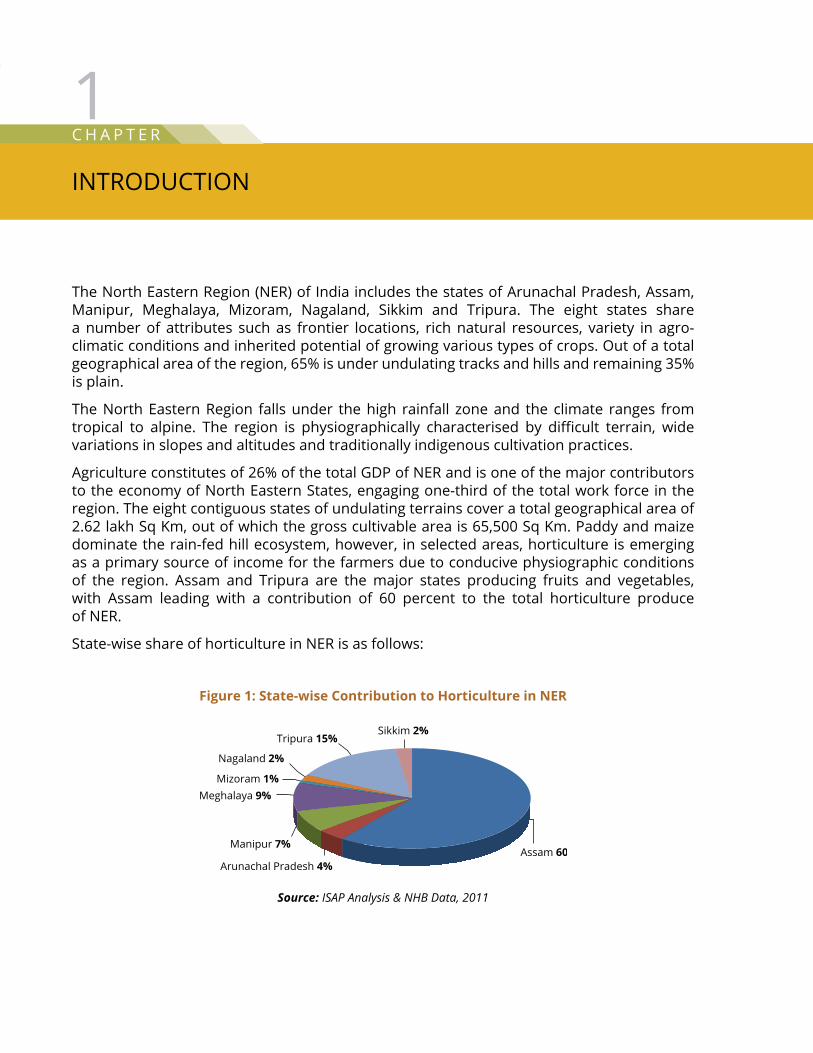
the following stakeholders across the value chain of horticulture produce were targeted in the identified clusters:
Farmers��
Intermediaries��
Commission agents, wholesalers and retailers��
service providers (logistics, storage, pack houses)��
Govt. officials including horticulture department, KVKs, APMCs, research stations, ��
academic institutes etc.
the stakeholders were selected on the basis of secondary information on area and production, as well as by interacting with the state government officials. Interactions were either facilitated by the government officials at the local level or were introduced for getting desired information and inputs. In addition to the line department of the state governments, meetings were held with other concerned agencies/organisations/institutions involved directly or indirectly in the production and marketing of selected crops.
Focus Group Discussions (FGDs)
Two to three FGDs in each identified cluster of focus crop groups was conducted in each state. A focus group comprised of 8-10 people, in some cases it was a homogenous group comprising of crop producers, while in some cases, it was a heterogenous group and comprised of prominent stakeholders. In each focus group there were 4-5 focus crop growers, 1-2 grower/s willing to grow in future and 2-3 extension worker/marketing service providers. FGDs were conducted to understand the value chain – production practices, technology adoption, cultivation costs, movement of product and price markup from farm gate to the local and distant markets.
• Identification of area/ region of study for each focus crop groups
• Literature Study on current supply & value chains
• Focussed Group Discussions (FGDs) with farmers
• Focussed Group Discussions (FGDs) with Traders
• Validation of data by means of in-depth interviews with all value chain actors
• Analysis of Secondary & Primary Data
• Draft Report Submission
• Feedback incorporation
• Finalisation of report
Compilation & Final Report Submission
Analysis & Report Writing
Validation of Data
Primary Research
Secondary Research
Week 0-6 Week 6-8 Week 8-10
Week 6-14
Week 14-16
Figure 2: Approach & Methodology
5Chapter 1 | Introduction
In-depth Interviews
Discussion and in-depth interviews were held with state government officials, experts and policy makers.
Analysis, Compilation and Report Writing
the following steps were followed for report writing:
secondary data analysis��
Analysis of in-depth interviews and FGDs��
Compilation of data and analysis��
Draft report writing��
Significance of Value Chain Analysis StudyValue Chain Analysis Study helps to map the value chain of a specific product involving various value chain actors, which may use qualitative or quantitative approach. While the produce moves from one chain actor to another chain actor, it gains value in the form of price markup. the chain actors who actually transact a particular product as it moves through the value chain, include input dealers (e.g., seed suppliers), farmers, traders, processors, transporters, wholesalers, retailers and final consumer.
the value chain framework has been used as a powerful analysis tool for strategic planning and is useful in identifying and understanding crucial aspects to achieve competitive strengths and core competencies in the marketplace. The model also reveals how the value chain activities are tied together to ultimately create value for the consumer.
In order to conduct the value chain analysis, the activities are split into primary and support activities (Figure VCA Framework). Primary activities are those that are related with production, while support activities are those that provide the background necessary for the effectiveness and efficiency, such as human resource management.
the primary and secondary activities are discussed in detail below:
Primary activities the primary activities include the following:
Inbound logistics: �� the activities concerned with receiving the material and handling them.Operations:�� The activities related to quality checks, processing, packaging, labelling of products etc.Outbound logistics: �� All the activities concerned with distributing the final product to the consumers. Marketing and sales:�� this functional area essentially analyses the needs and wants of consumers and is responsible for creating awareness among the consumers about the products and attract consumers to their products.

6 Value Chain Analysis of Select Crops in North Eastern States
Support activitiesthe support activities include the following:
Procurement:�� this function is responsible for purchasing the materials that are necessary for the operations. An efficient procurement department should be able to obtain the highest quality goods at the lowest prices.Human Resource Management:�� this is a function concerned with recruiting, training, motivating and rewarding the workforce. Human resources are increasingly becoming an important way of attaining sustainable competitive advantage.Technology Development:�� this is an area that is concerned with technological innovation, training and knowledge that is crucial today in order to survive.Infrastructure: �� This includes planning and control systems, such as finance, accounting and corporate strategy etc.
It is important to analyse the value chain with the core competence at its very heart. The nature of value chain activities differs greatly in accordance with the types of industries.
The five primary activities and four support activities form an interdependent system that is connected by linkages. The first step in conducting the value chain analysis is to break down the key activities according to the activities entailed in the framework. The next step is to assess the potential for adding value, through the means of cost advantage or differentiation. Finally, it is imperative for the analyst to determine strategies that focus on activities that would enable to attain sustainable competitive advantage.
Value chain analysis, specifically in case of studying various horticultural products of North Eastern region has specific relevance. The markets for most of the crops being produced or targeted for production are distant domestic markets and export markets. For a product of NER to be competitive, it is necessary to achieve price parity in these markets. Value chain, in this regard helps in defining the benchmarks for selected crops to compete in the market and therefore in the identification of key strengths, weaknesses, comparative advantages or disadvantages and analysing the efficacy and efficiency of the entire value chain as well as in finding solutions, interventions and identified challenges.
With this background and adopting this approach and methodology to achieve the objective of the study, we need to study in detail the horticulture scenario of the entire NER.
• Inbound Logistics• Operations• Outbound Logistics• Marketing and Sales
• Procurement• Technology Development• Human Resource Management• Infrastructure
The difference between the total value and the cost of performing the value activities
Added Value or
Prices
Support Activities
Primary Activities
Figure 3: VCA Framework

C H A P t e R
THE NORTH EAST REGION: AN OVERVIEW
2
the region falls in the foothills of the Himalayas in the eastern range and is surrounded by Bangladesh, Bhutan, China, Nepal and Myanmar. It includes the seven states - Arunachal Pradesh, Assam, Manipur, Meghalaya, Mizoram, nagaland and tripura, along with a smaller state in the Himalayan fringes, namely, Sikkim.
Strategic Location the location of the region is geo-politically important as it shares international boundaries with China and Bhutan in the north, Myanmar in the east, nepal in the west and Bangladesh in the south and west. This strategic location of NER makes it the potential hub for export of horticultural produce to neighbouring countries in order to cater to their growing need. It also aids the supply of produce to distant markets in India.
Topography and Agro-Climatic CharacteristicsThe entire NE Region is located between 22°1’ and 29°31’ North latitude and 89°47’ and 98°55’ East longitude. The region is traversed by the Brahmaputra-Barak river systems and their tributaries.
the topography of the area varies from mountainous to plateaus, foothills to riverine plains with altitudes ranging between 100 m to 8400 m from MSL. Being predominantly hilly terrain, altitudinal variation within limited geographical area is the characteristic feature of this region. the region is endowed with all types of climatic conditions ranging from tropical to alpine and it receives rainfall ranging from 150-250 cm.
Connectivity/LogisticsAir ConnectivityAll the states in the region are connected by air, expect Arunachal Pradesh and Meghalaya. NE Region has 10 airports, however 3 state capitals lack airport facility (Itanagar, Gangtok & Shillong).
Looking at the development in the region and potential for international trade with south East Asia, upgradation and improvement of air connectivity is vital.

8 Value Chain Analysis of Select Crops in North Eastern States
Rail and Road ConnectivityPoor infrastructure development in terms of roads, railways, waterways, power and water is the main constraint in the development of NE Region. From the trade point of view, existing rail infrastructure is mainly limited to Assam (broad gauge track). However, improvement of road infrastructure work is under progress in some states of the NE Region. The entire NE Region shares three important border roads i.e. Stilwell road or the Ledo road (connects Assam to China), the numaligarh-Mreh road (connects Assam, nagaland & Manipur to Myanmar) and the Aizawl-Champhai-Zowkathar road (connects Mizoram to Myanmar). These border roads are crucial for the development of the NE Region. Of the three border roads, two are operational at present from the point of border trade. Proper infrastructure needs to be developed at these border points to boost trade between the countries. This in turn will benefit the entire NE Region. Discussions are in progress with the Bangladesh government to give road access for transportation of goods of Indian origin from West Bengal to tripura through transit corridors. If such a proposal goes through, the transit time to the NE Region from other parts of the country will reduce substantially.
Inland Waterwaysopening of inland water route and access to the Chittagong port is important as it serves as a trade gateway for India to East Asian countries. This could provide a business basket to entire NE Region.
Demographic and Socioeconomic Characteristics The eight states constitute 7.9 percent of the country’s total geographical area, but have only approximately 4% of the total population of the country. Over 68 percent of the population of the region lives in the state of Assam alone. The density of population varies from 16 per sq km in Arunachal Pradesh to 396 per sq km in Assam.
State AirportsAssam Guwahati, Dibrugarh, Tejpur, Jorhat, Silcharnagaland DimapurManipur Imphaltripura AgartalaMizoram AizawlW. Bengal Bagdogra
Table 1: Existing Airport Facilities in NER

9Chapter 2 | the north east Region: An overview
Stat
eA
runa
chal
Pr
ades
hA
ssam
Man
ipur
Meg
hala
yaM
izor
amN
agal
and
Sikk
imTr
ipur
a
Geo
grap
hica
l Lo
catio
n27
.06°
N a
nd
93.3
7° E
. s
hare
s its
na
tiona
l bo
rder
with
n
agal
and
and
Assa
m
tow
ards
so
uth
and
inte
rnat
iona
l bo
rder
with
Ch
ina
tow
ards
no
rth,
Bhu
tan
tow
ards
wes
t an
d Bu
rma
tow
ards
eas
t
26.1
4° N
and
91
.77°
E, t
he
nort
h ea
ster
n st
ate
of A
ssam
lie
s in
the
rive
r va
lleys
of
Bar
ak a
nd
Brah
map
utra
. As
sam
is
bord
ered
by
Wes
t Ben
gal a
nd
the
othe
r st
ates
of
the
seve
n si
ster
s al
ong
with
cou
ntri
es
like
Bhut
an a
nd
Bang
lade
sh
24.8
17°
N
and
93.9
5° E
, M
anip
ur h
as
got t
he s
tate
of
nag
alan
d to
its
nort
h, A
ssam
to
its
wes
t an
d M
izor
am
to it
s so
uth.
th
e st
ate
has
even
got
in
tern
atio
nal
bord
ers
by
Burm
a to
its
east
25.5
7° N
and
91
.88°
E,
Meg
hala
ya is
su
rrou
nded
by
the
stat
e of
Ass
am in
no
rth
and
the
coun
try
of
Bang
lade
sh in
so
uth
23.3
6° N
and
92
.0°
E. T
his
nort
h ea
ster
n st
ate
shar
es it
s na
tiona
l bor
der
with
Ass
am,
Man
ipur
and
tr
ipur
a an
d in
tern
atio
nal
bord
er w
ith
Burm
a an
d Ba
ngla
desh
25.6
7° N
and
94
.12°
E,
the
stat
e is
en
circ
led
by
Assa
m a
nd
Arun
acha
l Pr
ades
h in
the
nort
h, M
anip
ur
in th
e so
uth
and
Burm
a in
th
e ea
st
27.3
3° N
and
88
.62°
E, t
his
land
lock
ed
stat
e of
Indi
a lie
s in
the
Him
alay
an
rang
e. S
ikki
m
shar
es it
s bo
rder
with
ti
bet t
owar
ds
nort
h an
d ea
st,
nep
al to
war
ds
wes
t, Bh
utan
to
war
ds s
outh
-ea
st a
nd W
est
Beng
al to
war
ds
sout
h
23.8
4° N
and
91
.28°
E. T
his
thir
d sm
alle
st
Indi
an s
tate
is
bor
dere
d by
Miz
oram
an
d As
sam
to
war
ds e
ast.
Its p
ositi
on
mak
es it
sha
re
mos
t of i
ts
boun
dary
with
Ba
ngla
desh
on
all t
he o
ther
th
ree
side
s
No.
of D
istr
icts
1627
97
811
44
Geo
grap
hica
l Ar
ea (s
q km
)83
,743
78
,550
22
,347
22
,720
21
,081
16
,579
7,09
6 10
,491
,369
Popu
latio
n1,
382,
611
31,1
69,2
722,
721,
756
2,96
4,00
71,
091,
014
1,98
0,60
26,
07,6
883,
671,
032
Den
sity
of
Popu
latio
n (p
er s
q km
)
16.5
396.
812
1.8
130.
551
.811
985
.634
9.9
Lite
racy
Rat
e66
.95%
76.3
0%79
.85%
72.1
0%89
.90%
63.7
0%76
.60%
87.7
5%
net
Are
a so
wn
per
thou
sand
ha
211
2753
236
284
9531
610
728
0
tota
l Cro
pped
Ar
ea p
er
thou
sand
ha
276
3984
236
337
9540
211
829
5
Sour
ce: S
tate
Dep
artm
ents
’ web
site
s, N
EDFi
Dat
a
Tabl
e 2:
Com
para
tive
Soci
oeco
nom
ic P
rofil
e of
NE
Stat
es
10 Value Chain Analysis of Select Crops in North Eastern States
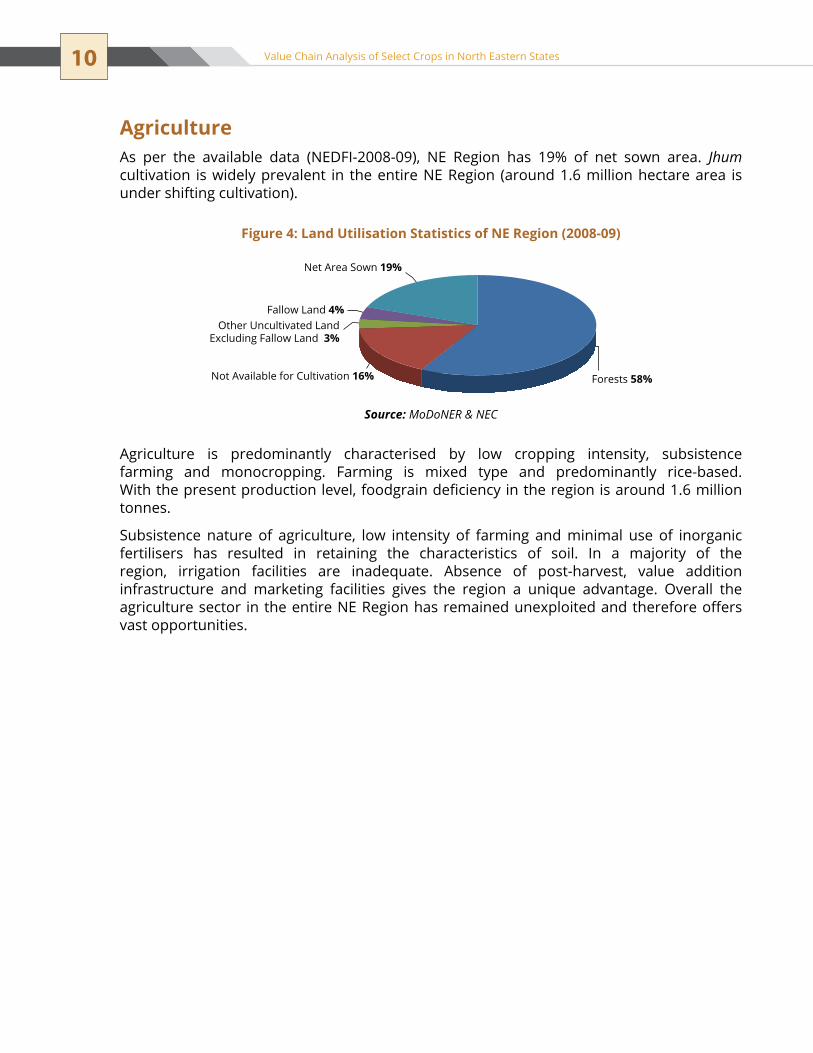
AgricultureAs per the available data (NEDFI-2008-09), NE Region has 19% of net sown area. Jhum cultivation is widely prevalent in the entire NE Region (around 1.6 million hectare area is under shifting cultivation).
Agriculture is predominantly characterised by low cropping intensity, subsistence farming and monocropping. Farming is mixed type and predominantly rice-based. With the present production level, foodgrain deficiency in the region is around 1.6 million tonnes.
subsistence nature of agriculture, low intensity of farming and minimal use of inorganic fertilisers has resulted in retaining the characteristics of soil. In a majority of the region, irrigation facilities are inadequate. Absence of post-harvest, value addition infrastructure and marketing facilities gives the region a unique advantage. Overall the agriculture sector in the entire NE Region has remained unexploited and therefore offers vast opportunities.
Forests 58%Not Available for Cultivation 16%
Other Uncultivated LandExcluding Fallow Land 3%
Fallow Land 4%
Net Area Sown 19%
Figure 4: Land Utilisation Statistics of NE Region (2008-09)
Source: MoDoNER & NEC

11Chapter 2 | the north east Region: An overview
SWOT Analysis of Agribusiness Scenario in North East Region the chapter above has covered an overview and a brief glimpse of the ne Region, however, in the following chapters, a detailed description of the horticultural scenario and its potential has been included.
Strengths
− Agro climatic diversity ranging from tropical to alpine making it possible to grow a wide variety of crops− Rich biodiversity− Rich surface water resources through perennial rivers and its tributaries− Proximity to export destinations such as Bangladesh and Myanmar− Soil is rich in organic matter− Potential to commercialise products such as kiwi and passionfruit
Opportunities
− Organic farming− Infrastructural facilities can be created with the participation of private sector− The number of government policies available for the NER can serve as a boosting factor for agricultural development− International markets can be targeted due to geographical location and availability of produce− Huge scope for value addition of surplus produce
Weaknesses
− Lack of infrastructural facilities along the food value chain− Lack of market access - domestic & international− Limited flow of men and material due to hilly terrain− Jhum cultivation and subsistence farming is leading to deterioration of available resources− Non-availability of skilled manpower− Lack of business acumen
Threats
− Slow growth of infrastrucutre links− Uncertainty in external trade scenario
SWOT
Figure 5: SWOT Analysis of Agribusiness Scenario in NE Region

C H A P t e R
HORTICuLTuRE SCENARIO IN NORTH EAST REGION
3
Different sources have been analysed to compile the data of area and production of different horticultural crops in the North Eastern Region, such as National Horticulture Board, NEDFi and State Horticulture Department. However, the data of area and production of crops in NER available with different sources vary widely. Availability of systematic and accurate estimate of area and production of different horticultural crops is limited.
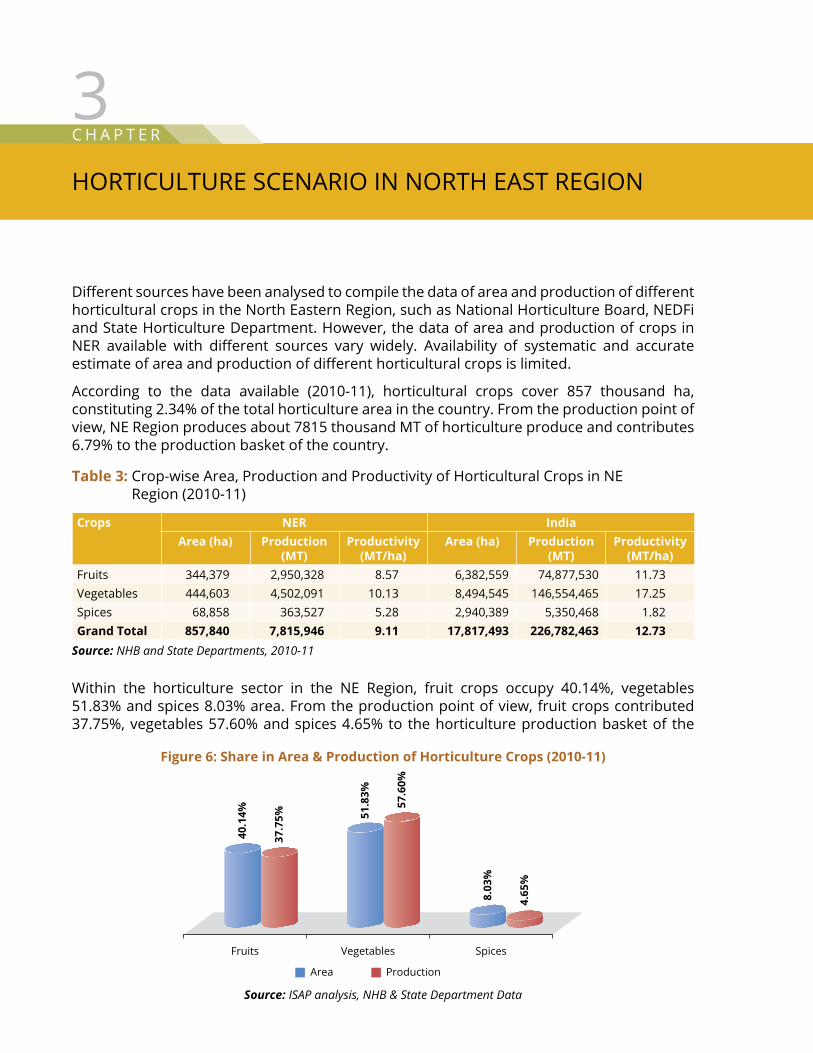
According to the data available (2010-11), horticultural crops cover 857 thousand ha, constituting 2.34% of the total horticulture area in the country. From the production point of view, NE Region produces about 7815 thousand MT of horticulture produce and contributes 6.79% to the production basket of the country.
Within the horticulture sector in the NE Region, fruit crops occupy 40.14%, vegetables 51.83% and spices 8.03% area. From the production point of view, fruit crops contributed 37.75%, vegetables 57.60% and spices 4.65% to the horticulture production basket of the
Source: NHB and State Departments, 2010-11
Crops NER IndiaArea (ha) Production
(MT)Productivity
(MT/ha)Area (ha) Production
(MT)Productivity
(MT/ha)Fruits 344,379 2,950,328 8.57 6,382,559 74,877,530 11.73Vegetables 444,603 4,502,091 10.13 8,494,545 146,554,465 17.25spices 68,858 363,527 5.28 2,940,389 5,350,468 1.82Grand Total 857,840 7,815,946 9.11 17,817,493 226,782,463 12.73
Table 3: Crop-wise Area, Production and Productivity of Horticultural Crops in ne Region (2010-11)
Fruits
40.1
4%
37.7
5% 51.8
3%
57.6
0%
8.03
%
4.65
%
Vegetables Spices
Area Production
Figure 6: Share in Area & Production of Horticulture Crops (2010-11)
Source: ISAP analysis, NHB & State Department Data
14 Value Chain Analysis of Select Crops in North Eastern States
NE Region. Considering the excellent climatic conditions, abundant rainfall and fertile soil (high organic content) of the region, the productivity of different horticultural crops is quite low as compared to national productivity.
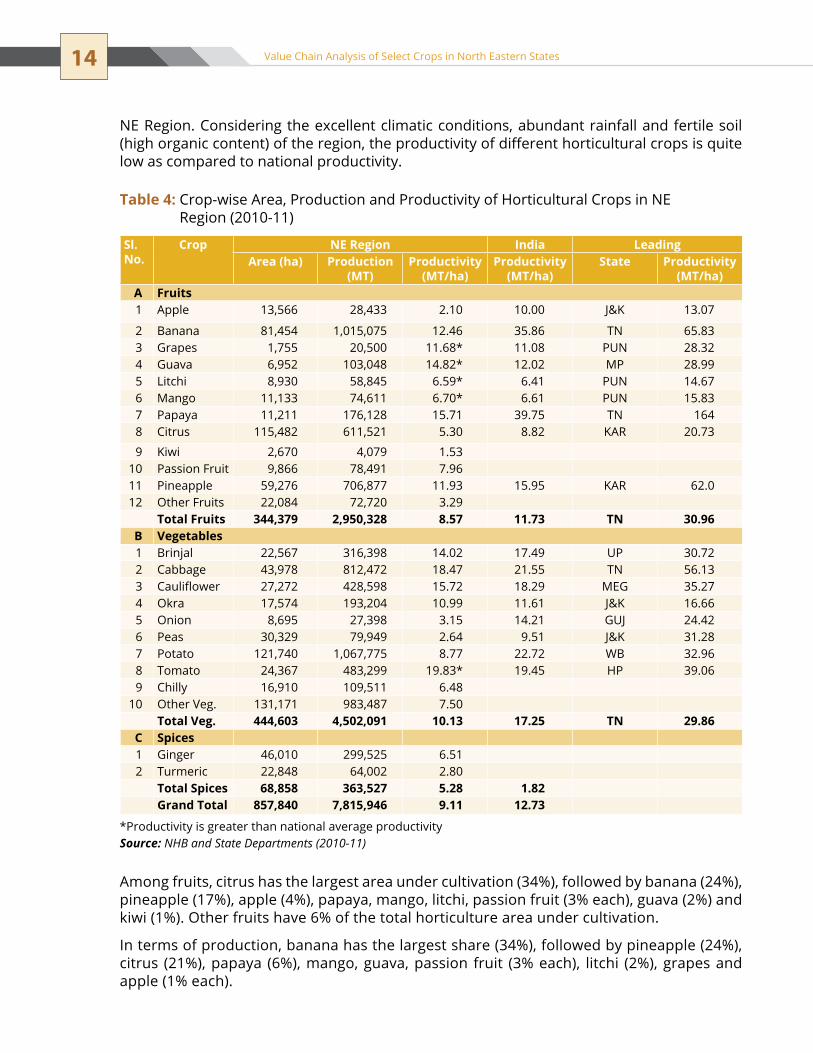
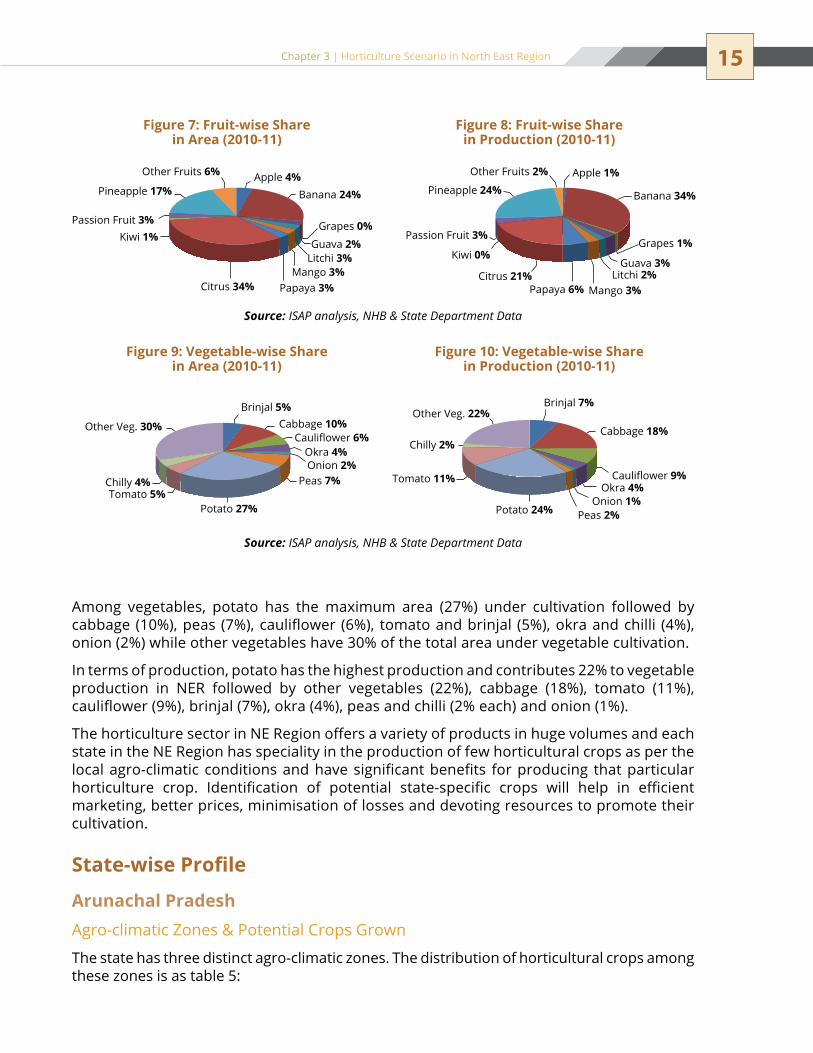
Among fruits, citrus has the largest area under cultivation (34%), followed by banana (24%), pineapple (17%), apple (4%), papaya, mango, litchi, passion fruit (3% each), guava (2%) and kiwi (1%). Other fruits have 6% of the total horticulture area under cultivation.
In terms of production, banana has the largest share (34%), followed by pineapple (24%), citrus (21%), papaya (6%), mango, guava, passion fruit (3% each), litchi (2%), grapes and apple (1% each).
*Productivity is greater than national average productivitySource: NHB and State Departments (2010-11)
Table 4: Crop-wise Area, Production and Productivity of Horticultural Crops in ne Region (2010-11)
Sl. No.
Crop NE Region India Leading Area (ha) Production
(MT)Productivity
(MT/ha)Productivity
(MT/ha)State Productivity
(MT/ha)A Fruits1 Apple 13,566 28,433 2.10 10.00 J&K 13.07
2 Banana 81,454 1,015,075 12.46 35.86 tn 65.833 Grapes 1,755 20,500 11.68* 11.08 PUn 28.324 Guava 6,952 103,048 14.82* 12.02 MP 28.995 Litchi 8,930 58,845 6.59* 6.41 PUn 14.676 Mango 11,133 74,611 6.70* 6.61 PUn 15.837 Papaya 11,211 176,128 15.71 39.75 tn 1648 Citrus 115,482 611,521 5.30 8.82 KAR 20.73
9 Kiwi 2,670 4,079 1.5310 Passion Fruit 9,866 78,491 7.9611 Pineapple 59,276 706,877 11.93 15.95 KAR 62.012 Other Fruits 22,084 72,720 3.29
Total Fruits 344,379 2,950,328 8.57 11.73 TN 30.96B Vegetables1 Brinjal 22,567 316,398 14.02 17.49 UP 30.722 Cabbage 43,978 812,472 18.47 21.55 tn 56.133 Cauliflower 27,272 428,598 15.72 18.29 MEG 35.274 okra 17,574 193,204 10.99 11.61 J&K 16.665 onion 8,695 27,398 3.15 14.21 GuJ 24.426 Peas 30,329 79,949 2.64 9.51 J&K 31.287 Potato 121,740 1,067,775 8.77 22.72 WB 32.968 tomato 24,367 483,299 19.83* 19.45 HP 39.069 Chilly 16,910 109,511 6.48
10 Other Veg. 131,171 983,487 7.50Total Veg. 444,603 4,502,091 10.13 17.25 TN 29.86
C Spices1 Ginger 46,010 299,525 6.512 turmeric 22,848 64,002 2.80
Total Spices 68,858 363,527 5.28 1.82Grand Total 857,840 7,815,946 9.11 12.73
15Chapter 3 | Horticulture scenario in north east Region
Among vegetables, potato has the maximum area (27%) under cultivation followed by cabbage (10%), peas (7%), cauliflower (6%), tomato and brinjal (5%), okra and chilli (4%), onion (2%) while other vegetables have 30% of the total area under vegetable cultivation.
In terms of production, potato has the highest production and contributes 22% to vegetable production in NER followed by other vegetables (22%), cabbage (18%), tomato (11%), cauliflower (9%), brinjal (7%), okra (4%), peas and chilli (2% each) and onion (1%).
The horticulture sector in NE Region offers a variety of products in huge volumes and each state in the ne Region has speciality in the production of few horticultural crops as per the local agro-climatic conditions and have significant benefits for producing that particular horticulture crop. Identification of potential state-specific crops will help in efficient marketing, better prices, minimisation of losses and devoting resources to promote their cultivation.
State-wise Profile
Arunachal PradeshAgro-climatic Zones & Potential Crops Grown
The state has three distinct agro-climatic zones. The distribution of horticultural crops among these zones is as table 5:
Figure 7: Fruit-wise Share in Area (2010-11)
Figure 9: Vegetable-wise Share in Area (2010-11)
Figure 8: Fruit-wise Share in Production (2010-11)
Figure 10: Vegetable-wise Share in Production (2010-11)
Brinjal 7%
Cabbage 18%
Cauliflower 9%Okra 4%
Onion 1%Peas 2%Potato 24%
Tomato 11%
Chilly 2%
Other Veg. 22%
Apple 4%Banana 24%
Grapes 0%Guava 2%
Litchi 3%Mango 3%
Papaya 3%Citrus 34%
Kiwi 1%Passion Fruit 3%
Pineapple 17%
Other Fruits 6% Apple 1%
Banana 34%
Grapes 1%
Guava 3%Litchi 2%
Mango 3%Papaya 6%Citrus 21%
Kiwi 0%
Passion Fruit 3%
Pineapple 24%
Other Fruits 2%
Brinjal 5%Cabbage 10%
Cauliflower 6%Okra 4%Onion 2%
Peas 7%
Potato 27%Tomato 5%
Chilly 4%
Other Veg. 30%
Source: ISAP analysis, NHB & State Department Data
Source: ISAP analysis, NHB & State Department Data
16 Value Chain Analysis of Select Crops in North Eastern States
Horticulture scenario
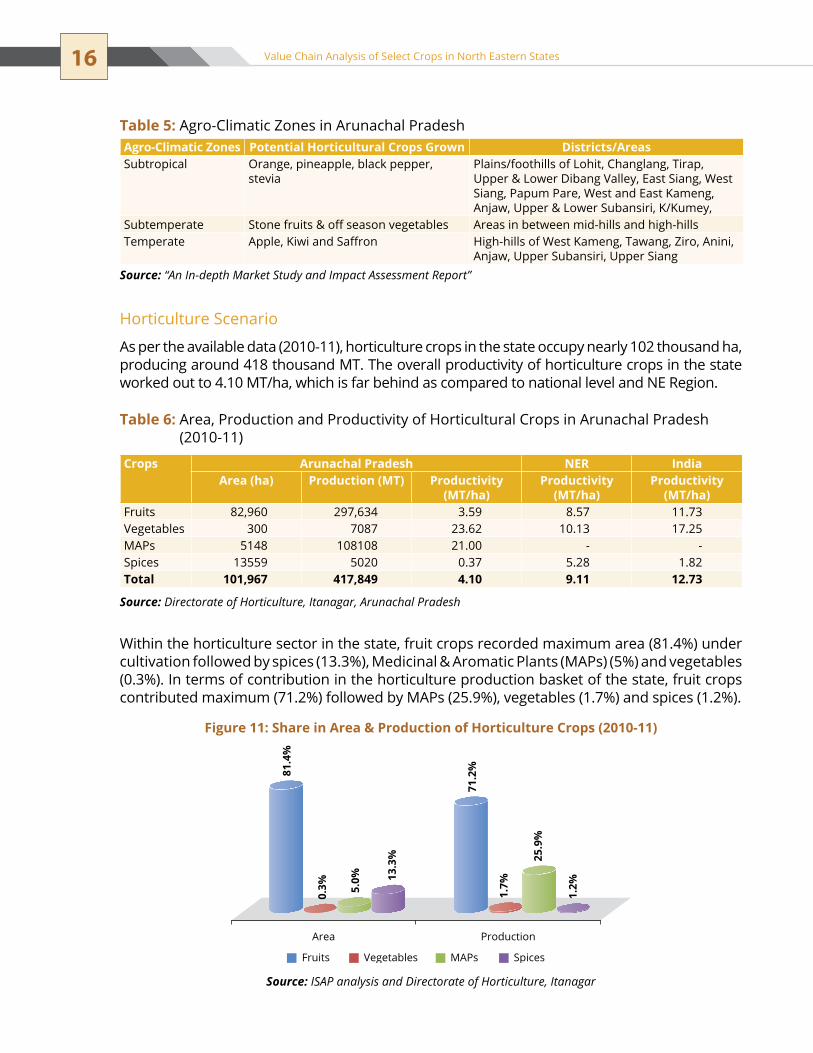
As per the available data (2010-11), horticulture crops in the state occupy nearly 102 thousand ha, producing around 418 thousand MT. The overall productivity of horticulture crops in the state worked out to 4.10 MT/ha, which is far behind as compared to national level and NE Region.
Within the horticulture sector in the state, fruit crops recorded maximum area (81.4%) under cultivation followed by spices (13.3%), Medicinal & Aromatic Plants (MAPs) (5%) and vegetables (0.3%). In terms of contribution in the horticulture production basket of the state, fruit crops contributed maximum (71.2%) followed by MAPs (25.9%), vegetables (1.7%) and spices (1.2%).
Figure 11: Share in Area & Production of Horticulture Crops (2010-11)
Area
81.4
%
0.3% 5.
0% 13.3
%
71.2
%
1.7%
25.9
%
1.2%
Production
Fruits Vegetables MAPs Spices
Table 6: Area, Production and Productivity of Horticultural Crops in Arunachal Pradesh (2010-11)
Crops Arunachal Pradesh NER IndiaArea (ha) Production (MT) Productivity
(MT/ha)Productivity
(MT/ha)Productivity
(MT/ha)Fruits 82,960 297,634 3.59 8.57 11.73Vegetables 300 7087 23.62 10.13 17.25MAPs 5148 108108 21.00 - -spices 13559 5020 0.37 5.28 1.82Total 101,967 417,849 4.10 9.11 12.73
Source: Directorate of Horticulture, Itanagar, Arunachal Pradesh
Table 5: Agro-Climatic Zones in Arunachal PradeshAgro-Climatic Zones Potential Horticultural Crops Grown Districts/Areassubtropical orange, pineapple, black pepper,
steviaPlains/foothills of Lohit, Changlang, tirap, upper & Lower Dibang Valley, East Siang, West siang, Papum Pare, West and east Kameng, Anjaw, Upper & Lower subansiri, K/Kumey,
subtemperate Stone fruits & off season vegetables Areas in between mid-hills and high-hillstemperate Apple, Kiwi and Saffron High-hills of West Kameng, tawang, Ziro, Anini,
Anjaw, Upper subansiri, Upper siangSource: “An In-depth Market Study and Impact Assessment Report”
Source: ISAP analysis and Directorate of Horticulture, Itanagar
17Chapter 3 | Horticulture scenario in north east Region
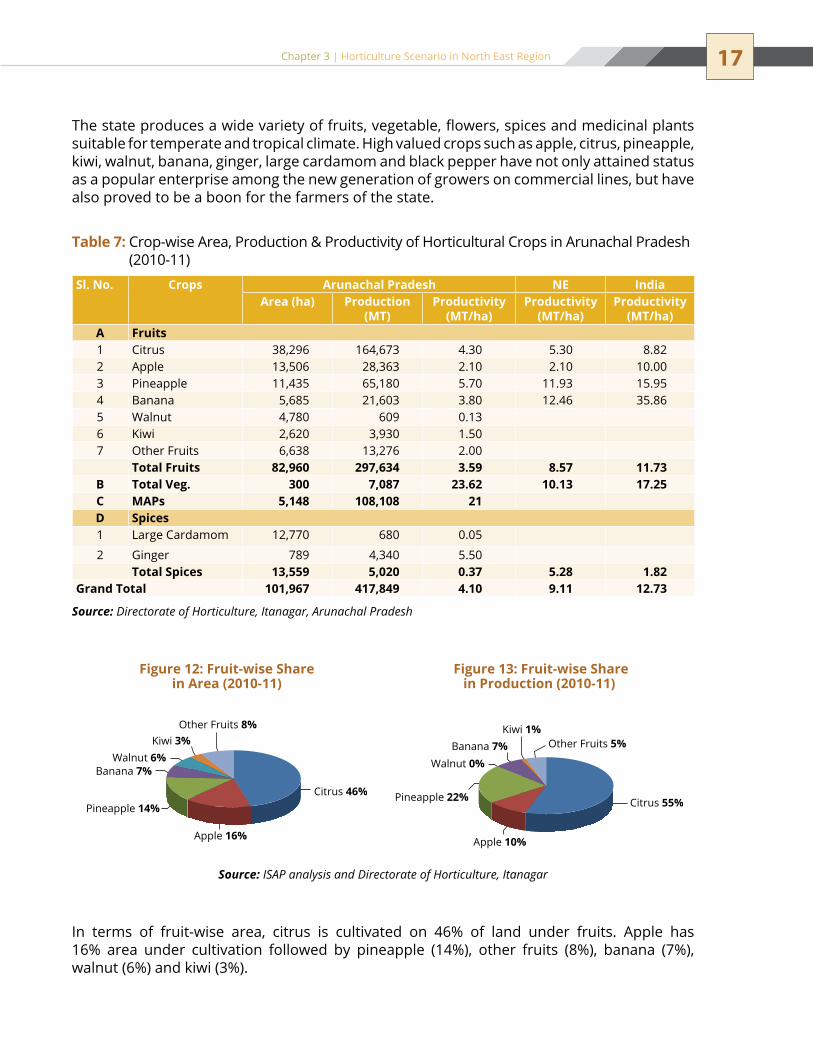
In terms of fruit-wise area, citrus is cultivated on 46% of land under fruits. Apple has 16% area under cultivation followed by pineapple (14%), other fruits (8%), banana (7%), walnut (6%) and kiwi (3%).
Table 7: Crop-wise Area, Production & Productivity of Horticultural Crops in Arunachal Pradesh (2010-11)
Sl. No. Crops Arunachal Pradesh NE IndiaArea (ha) Production
(MT)Productivity
(MT/ha)Productivity
(MT/ha)Productivity
(MT/ha)A Fruits1 Citrus 38,296 164,673 4.30 5.30 8.822 Apple 13,506 28,363 2.10 2.10 10.003 Pineapple 11,435 65,180 5.70 11.93 15.954 Banana 5,685 21,603 3.80 12.46 35.865 Walnut 4,780 609 0.136 Kiwi 2,620 3,930 1.507 Other Fruits 6,638 13,276 2.00
Total Fruits 82,960 297,634 3.59 8.57 11.73B Total Veg. 300 7,087 23.62 10.13 17.25C MAPs 5,148 108,108 21D Spices1 Large Cardamom 12,770 680 0.05
2 Ginger 789 4,340 5.50Total Spices 13,559 5,020 0.37 5.28 1.82
Grand Total 101,967 417,849 4.10 9.11 12.73
Source: Directorate of Horticulture, Itanagar, Arunachal Pradesh
The state produces a wide variety of fruits, vegetable, flowers, spices and medicinal plants suitable for temperate and tropical climate. High valued crops such as apple, citrus, pineapple, kiwi, walnut, banana, ginger, large cardamom and black pepper have not only attained status as a popular enterprise among the new generation of growers on commercial lines, but have also proved to be a boon for the farmers of the state.
Figure 12: Fruit-wise Share in Area (2010-11)
Figure 13: Fruit-wise Share in Production (2010-11)
Source: ISAP analysis and Directorate of Horticulture, Itanagar
Citrus 46%
Apple 16%
Pineapple 14%
Banana 7%Walnut 6%
Kiwi 3%Other Fruits 8%
Citrus 55%
Apple 10%
Pineapple 22%
Banana 7%Walnut 0%
Kiwi 1%Other Fruits 5%

18 Value Chain Analysis of Select Crops in North Eastern States
Citrus is the leading crop in terms of production also and it contributes 55% of total fruit production. Pineapple is the second largest produced fruit (22%) followed by apple (10%), banana (7%), other fruits (5%) and kiwi (1%).
Total area under vegetables is only 300 ha with a production of 7,087 MT of vegetables.
the productivity of crops in the state, is observed to be lagging behind as compared to other states in the country due to old and senile orchards, use of own cultivars, insect/pest/disease, rain-fed farming, negligible use of inputs by the farmers to increase the fertility of soil.
The state has unique distinction of having a vertical profile ranging from subtropical ��
to temperate.though inaccessible but able to produce economically important crops such as ��
apple and kiwi along with off season vegetables. Area of cultivation is too low to be eligible for the economic scale of activity;��
Apart from interstate connectivity, intra state connectivity is also a major issue;��
Cultivation practices are traditional and subsistence.��
If developed commercially, kiwi has the potential to compete with the imported ones ��
being sold in the metros.The citrus plantations are as old as 50 years. ��
Supportive infrastructure for any kind of value addition is almost absent.��
Poor understanding of state level agencies/institutions involved in uplifting ��
horticulture and horticultural markets.
Salient Features of Horticulture in Arunachal Pradesh
Crops Jan Feb Mar Apr May Jun Jul Aug Sep Oct Nov DecApple Walnut Kiwi Citrus Pineapple Banana L. Cardamom
Black Pepper Ginger Potato tomato Cabbage
Beginning Peak Lean
Figure 14: Seasonality of Crops in Arunachal Pradesh
Source: “An In-depth Market Study and Impact Assessment Report”

19Chapter 3 | Horticulture scenario in north east Region
the diverse agro-climatic conditions make Arunachal Pradesh suitable for cultivation of varied varieties of fruits, vegetables, spices, medicinal and aromatic crops. Apple, mandarin, pineapple, ginger, large cardamom, besides off season vegetables have big opportunity in the domestic markets. Kiwi, though grown in a small area, has good potential to scale it up to the commercial level.
Productivity of vegetables in the state of Arunachal is found to be higher (23.62 MT/ha) as compared to national (17.25 MT/ha) and NE Region (10.13 MT/ha) vegetables productivity. Due to the favourable climatic conditions, vegetables can be grown round the year and can be supplied to the plains or distant markets in the off season, when there is little production of vegetables in the plains or less supply of products in the distant market and can fetch good returns.
ASSAMAgro-Climatic Zones & Potential Crops Grown
The state has five distinct agro-climatic zones. The distribution of horticultural crops among these zones is as follows:
Horticulture scenario
Assam is the largest producer of fruits and vegetables in the northeast region and contributes 60% to the total horticulture production in the north east region. It is the gateway for the marketing of horticulture produce from the northeast to the rest of the country.
Horticultural crops in the state occupy nearly 15% of the gross cultivated area and the state produces more than 15.0 lakh MT of fruits, 29.0 lakh MT of vegetables and 1.0 lakh MT of spices besides nut crops, flowers and medicinal & aromatic plants annually. In spite of having such inherent potential, commercialisation of horticulture sector in Assam has not yet happened. From the productivity point of view, productivity of fruits in the state is more (13.50 MT/ha) as compared to national level (11.73 MT/ha) and NE Region (8.57 MT/ha). Productivity of vegetables in the state is found to be less (11.25 MT/ha) in comparison to national level (17.25 MT/ha) but more than NE Region (10.13 MT/ha). This situation leads to the opportunity of productivity enhancement.
Agro-Climatic Zones Potential Horticultural Crops Grown Districts/AreasNorth Bank Plain Zone
Banana, Potato, Vegetables, Lemon, Orange Darrang, sonitpur, Dhemaji, Lakhimpur
Upper Brahamputra
Banana, Potato, Vegetables, Lemon, Orange, Areca nut, Jackfruit, Pineapple, Guava, Litchi, Mango
sibsagar, tinsukia, Dibrugarh, Jorhat, Golaghat.
Central Brahamputra
Banana, Potato, Vegetables, Lemon, Orange, Areca nut, Jackfruit, Pineapple, Guava, Litchi, Mango
nogaon, Morigaon, Kamrup
Lower Brahamputra
Banana, Potato, Vegetables, Lemon, Orange, Areca nut, Jackfruit, Pineapple, Guava, Litchi, Mango
nalbari, Barpeta, Bongaigaon, Kokrajhar, Goalpara, Dhubri,
Barak Valley Banana, Potato, Vegetables, Lemon, Orange, Areca nut, Jackfruit, Pineapple, Guava, Litchi, Mango
Cachar, Karinganj, Hailakandi
Source: “An In-depth Market Study and Impact Assessment Report”
Table 8: Agro-Climatic Zones of Assam

20 Value Chain Analysis of Select Crops in North Eastern States
In the state, vegetable crops recorded maximum area (64.87%) under cultivation followed by fruits (27.75%) and spices (7.37%). In terms of contribution in the horticulture production basket of the state, vegetable crops contribute maximum (64.36%), followed by fruits (33.05%) and spices (2.59%).
Crops Assam NER IndiaArea (ha) Production (MT) Productivity
(MT/ha)Productivity
(MT/ha)Productivity
(MT/ha)Fruits 111,300 1,502,200 13.50* 8.57 11.73Vegetables 260,136 2,925,476 11.25 10.13 17.25spices 29,573 117,612 3.98 5.28 1.82Grand Total 401,009 4,545,288 11.33 9.11 12.73
Table 9: Area, Production and Productivity of Horticultural Crops in Assam (2010-11)
* Fruits productivity in Assam is greater than NER and national average productivitySource: NHB
Figure 15: Share in Area & Production of Horticulture Crops (2010-11)
Area
27.7
5%
64.8
7%
7.37
%
33.0
5%
64.3
6%
2.59
%
Production
Fruits Vegetables Spices
Source: ISAP analysis and NHB
Figure 16: Fruit-wise Share in Area (2010-11)
Figure 17: Fruit-wise Share in Production (2010-11)
Source: ISAP analysis and NHB
Banana 43%
Guava 4%Litchi 5%Mango 4%
Papaya 7%
Citrus 25%
Pineapple 12%
Banana 48%
Guava 6%Litchi 3%
Papaya 9%Mango 3%
Citrus 16%
Pineapple 15%
21Chapter 3 | Horticulture scenario in north east Region
Table 10: Crop-wise Area, Production and Productivity of Horticultural Crops in Assam (2010-11)Sl. No.
Crops Assam NER IndiaArea (ha) Production
(MT)Productivity
(MT/ha)Productivity
(MT/ha)Productivity
(MT/ha)A Fruits1 Banana 47,600 723,600 15.20 12.46 35.862 Guava 4,900 97,300 19.86* 14.82 12.023 Litchi 5,200 40,500 7.79* 6.59 6.414 Mango 4,800 47,500 9.90* 6.70 6.615 Papaya 7,400 134,400 18.16 15.71 39.756 Citrus 27,400 238,200 8.69 5.30 8.827 Pineapple 14,000 220,700 15.76 11.93 15.95
Total Fruits 111,300 1,502,200 13.50* 8.57 11.73B Vegetables1 Brinjal 16,150 244,188 15.12 14.02 17.492 Cabbage 30,666 629,732 20.54 18.47 21.553 Cauliflower 20,879 328,844 15.75 15.72 18.294 okra 11,068 147,758 13.35* 10.99 11.615 onion 7,960 22,070 2.77 3.15 14.216 Peas 22,401 18,077 0.81 2.64 9.517 Potato 86,700 737,590 8.51 8.77 22.728 tomato 16,634 387,239 23.28* 19.83 19.459 Other Veg. 47,678 409,978 8.60 7.50
Total Veg. 260,136 2,925,476 11.25 10.13 17.25C Spices1 Ginger 15,690 107,893 6.882 turmeric 13,883 9,719 0.70
Total Spices 29,573 117,612 3.98 5.28 1.82Grand Total 401,009 4,545,288 11.33 9.11 12.73
* Productivity is greater than NER and national average productivitySource: NHB
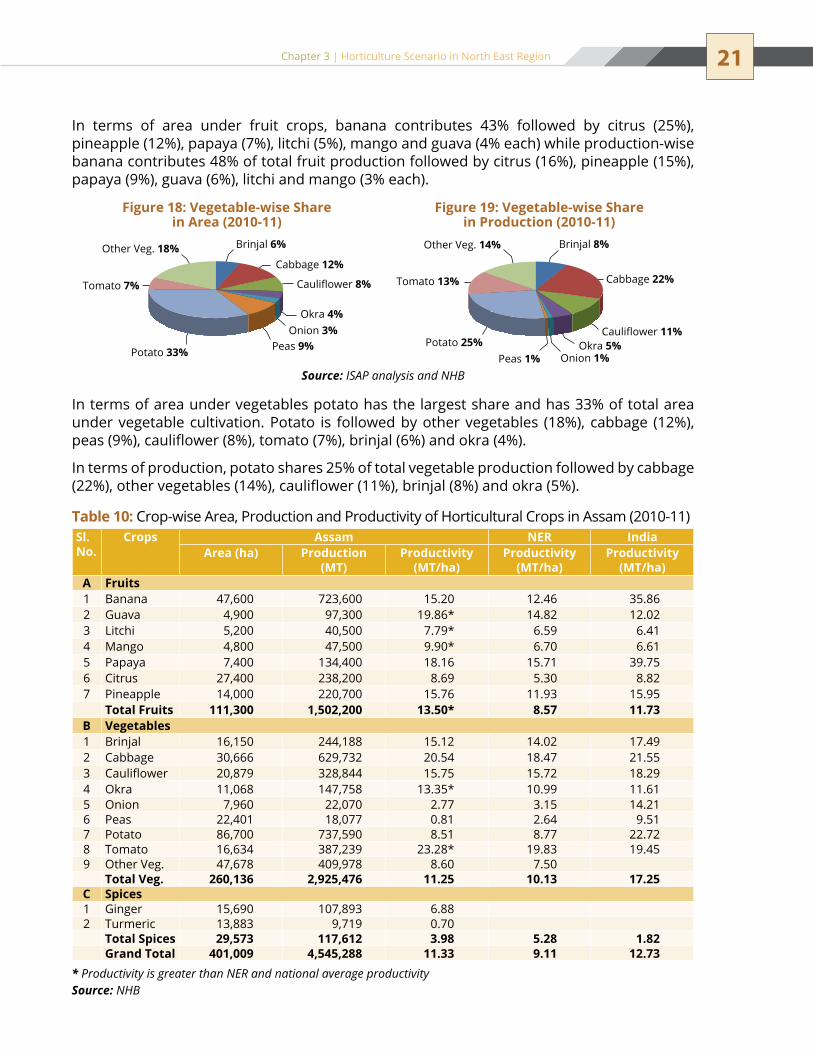
In terms of area under fruit crops, banana contributes 43% followed by citrus (25%), pineapple (12%), papaya (7%), litchi (5%), mango and guava (4% each) while production-wise banana contributes 48% of total fruit production followed by citrus (16%), pineapple (15%), papaya (9%), guava (6%), litchi and mango (3% each).
In terms of area under vegetables potato has the largest share and has 33% of total area under vegetable cultivation. Potato is followed by other vegetables (18%), cabbage (12%), peas (9%), cauliflower (8%), tomato (7%), brinjal (6%) and okra (4%).
In terms of production, potato shares 25% of total vegetable production followed by cabbage (22%), other vegetables (14%), cauliflower (11%), brinjal (8%) and okra (5%).
Figure 18: Vegetable-wise Share in Area (2010-11)
Figure 19: Vegetable-wise Share in Production (2010-11)
Source: ISAP analysis and NHB
Brinjal 6%
Cabbage 12%
Cauliflower 8%
Okra 4%Onion 3%
Peas 9%Potato 33%
Other Veg. 18%
Tomato 7%
Cauliflower 11%
Brinjal 8%
Cabbage 22%
Okra 5%Onion 1%Peas 1%
Tomato 13%
Potato 25%
Other Veg. 14%
22 Value Chain Analysis of Select Crops in North Eastern States
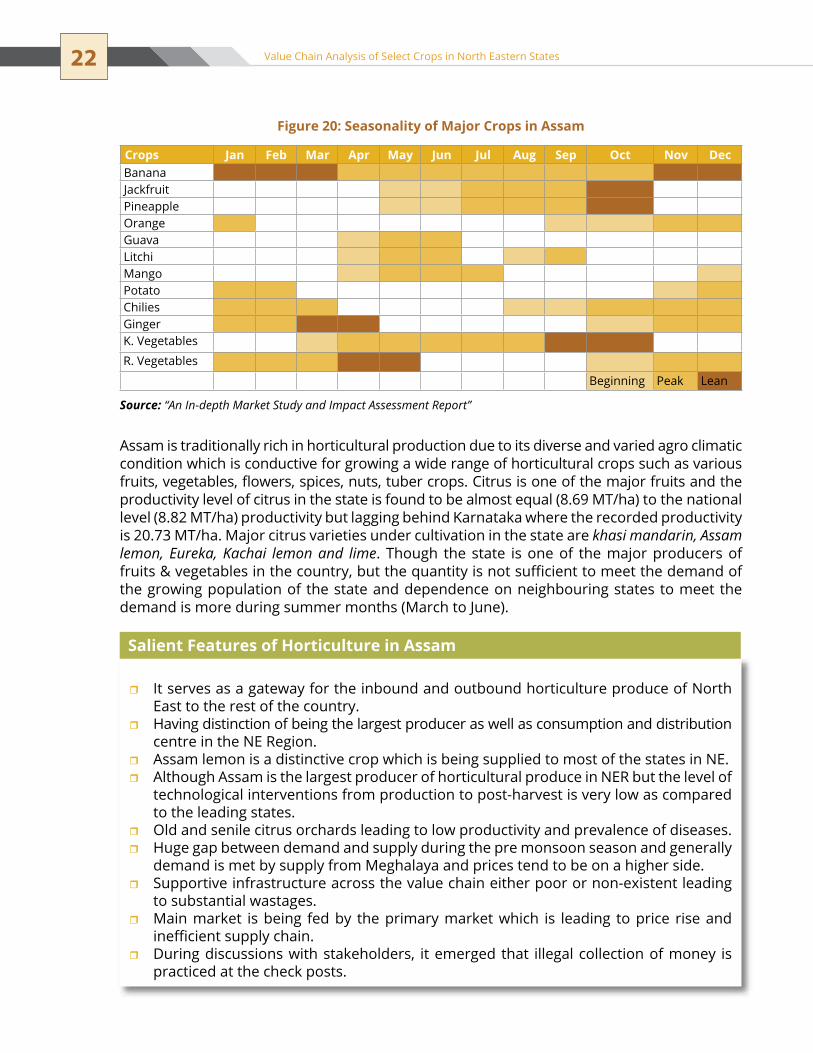
Assam is traditionally rich in horticultural production due to its diverse and varied agro climatic condition which is conductive for growing a wide range of horticultural crops such as various fruits, vegetables, flowers, spices, nuts, tuber crops. Citrus is one of the major fruits and the productivity level of citrus in the state is found to be almost equal (8.69 MT/ha) to the national level (8.82 MT/ha) productivity but lagging behind Karnataka where the recorded productivity is 20.73 MT/ha. Major citrus varieties under cultivation in the state are khasi mandarin, Assam lemon, Eureka, Kachai lemon and lime. Though the state is one of the major producers of fruits & vegetables in the country, but the quantity is not sufficient to meet the demand of the growing population of the state and dependence on neighbouring states to meet the demand is more during summer months (March to June).
It serves as a gateway for the inbound and outbound horticulture produce of north ��
East to the rest of the country.Having distinction of being the largest producer as well as consumption and distribution ��
centre in the NE Region.Assam lemon is a distinctive crop which is being supplied to most of the states in NE. ��
Although Assam is the largest producer of horticultural produce in neR but the level of ��
technological interventions from production to post-harvest is very low as compared to the leading states.Old and senile citrus orchards leading to low productivity and prevalence of diseases.��
Huge gap between demand and supply during the pre monsoon season and generally ��
demand is met by supply from Meghalaya and prices tend to be on a higher side.supportive infrastructure across the value chain either poor or non-existent leading ��
to substantial wastages.Main market is being fed by the primary market which is leading to price rise and ��
inefficient supply chain.During discussions with stakeholders, it emerged that illegal collection of money is ��
practiced at the check posts.
Salient Features of Horticulture in Assam
Crops Jan Feb Mar Apr May Jun Jul Aug Sep Oct Nov DecBanana Jackfruit Pineapple orange Guava Litchi Mango Potato Chilies Ginger K. Vegetables
R. Vegetables
Beginning Peak Lean
Figure 20: Seasonality of Major Crops in Assam
Source: “An In-depth Market Study and Impact Assessment Report”

23Chapter 3 | Horticulture scenario in north east Region
ManipurAgro-Climatic Zones & Potential Crops Grown
The state has three distinct agro-climatic zones. The distribution of horticultural crops among these zones is as follows:
Horticulture scenario
Diverse agro-climatic conditions and abundant rainfall provide immense opportunity for horticulture crops in the state of Manipur. As per the available data (2010-11), the state has 78 thousand ha of area under various horticulture crops, producing nearly 671 thousand Mt with overall productivity level of 8.58 (MT/ha) which is lower in comparison to the national and NER productivity levels.
Horticulture area in the state constitutes of fruits (58.17%), vegetables (25.76%) and spices (16.07%). From the production point of view, fruits contribute nearly 55.31% to the production basket of the state followed by vegetables (28.72%) and spices (15.97%). The major horticultural crops in the state are passion fruit, banana, citrus, pineapple, ginger, turmeric, tomato, cabbage, pea and potato. It has good potential to export these crops to Myanmar (Burma). Cabbage, tomato and pea are the major vegetables which can cater to neighbouring states.
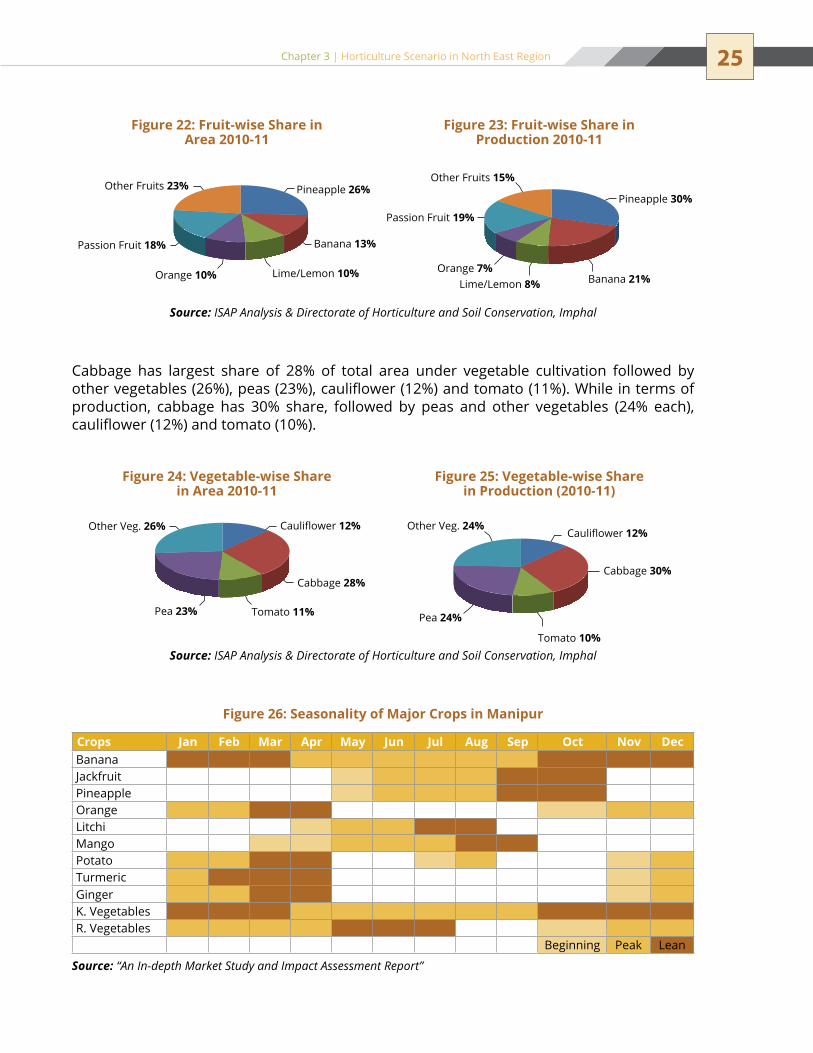
In terms of area under fruits in Manipur, the largest area is under pineapple (26%), followed by other fruits (23%), passion fruit (18%), banana (13%), orange and lime/lemon (10%) while in terms of production, pineapple share 30% of total fruits production followed by banana (21%), passion fruit (19%), other fruits (15%), lime/lemon (8%) and orange (7%).
Agro-Climatic Zones Potential Horticultural Crops Grown Districts/Areastemperate subalpine Zone Passion Fruit, Plum, Peach, Pear,
Vegetables, Pineapple, Lime, Orangesenapati, Ukhrul
Mild tropical Hill Zone Banana, Papaya, Jackfruit, Orange, Pineapple
thoubal, tamenglong, Chandal, Churchandpur
Mild tropical Plain Zone Pineapple, Banana, Papaya, Mango, Guava, Jackfruit, Vegetables, Lemon
Imphal east, Imphal West, Bishnupur
Source: “An In-depth Market Study and Impact Assessment Report”
Table 11: Agro-Climatic Zones in Manipur
Crops Manipur NER IndiaArea (ha) Production (MT) Productivity
(MT/ha)Productivity
(MT/ha)Productivity
(MT/ha)Fruits 45,574 371,601 8.15 8.57 11.73Vegetables 20,185 192,955 9.56 10.13 17.25spices 12,590 107,298 8.52 5.28 1.82Grand Total 78,349 671,854 8.58 9.11 12.73
Source: Directorate of Horticulture and Soil Conservation, Imphal
Table 12: Area, Production and Productivity of Horticultural Crops in Manipur (2010-11)
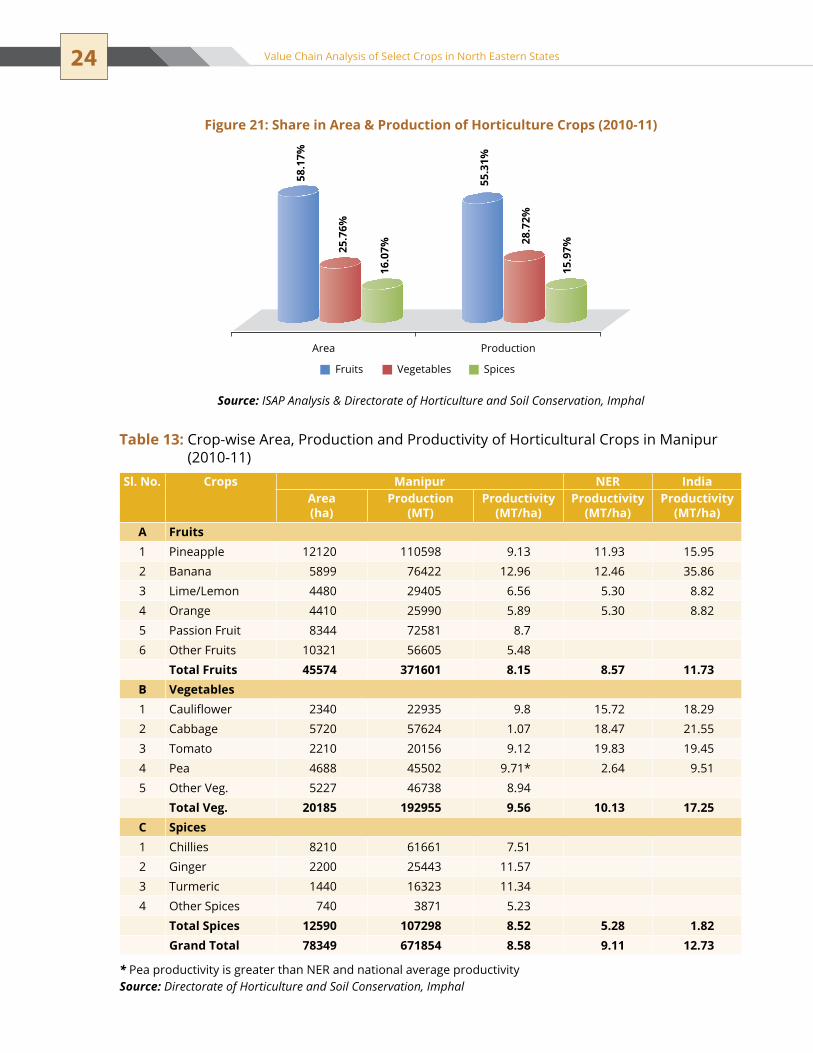
24 Value Chain Analysis of Select Crops in North Eastern States
Figure 21: Share in Area & Production of Horticulture Crops (2010-11)
Area
58.1
7%
25.7
6%
16.0
7%
55.3
1%
28.7
2%
15.9
7%
Production
Fruits Vegetables Spices
Source: ISAP Analysis & Directorate of Horticulture and Soil Conservation, Imphal
Table 13: Crop-wise Area, Production and Productivity of Horticultural Crops in Manipur (2010-11)
Sl. No. Crops Manipur NER IndiaArea (ha)
Production (MT)
Productivity (MT/ha)
Productivity (MT/ha)
Productivity (MT/ha)
A Fruits1 Pineapple 12120 110598 9.13 11.93 15.952 Banana 5899 76422 12.96 12.46 35.863 Lime/Lemon 4480 29405 6.56 5.30 8.824 orange 4410 25990 5.89 5.30 8.825 Passion Fruit 8344 72581 8.76 Other Fruits 10321 56605 5.48
Total Fruits 45574 371601 8.15 8.57 11.73B Vegetables1 Cauliflower 2340 22935 9.8 15.72 18.292 Cabbage 5720 57624 1.07 18.47 21.553 tomato 2210 20156 9.12 19.83 19.454 Pea 4688 45502 9.71* 2.64 9.515 Other Veg. 5227 46738 8.94
Total Veg. 20185 192955 9.56 10.13 17.25C Spices1 Chillies 8210 61661 7.512 Ginger 2200 25443 11.573 turmeric 1440 16323 11.344 other spices 740 3871 5.23
Total Spices 12590 107298 8.52 5.28 1.82Grand Total 78349 671854 8.58 9.11 12.73
* Pea productivity is greater than neR and national average productivitySource: Directorate of Horticulture and Soil Conservation, Imphal
25Chapter 3 | Horticulture scenario in north east Region
Cabbage has largest share of 28% of total area under vegetable cultivation followed by other vegetables (26%), peas (23%), cauliflower (12%) and tomato (11%). While in terms of production, cabbage has 30% share, followed by peas and other vegetables (24% each), cauliflower (12%) and tomato (10%).
Figure 22: Fruit-wise Share in Area 2010-11
Figure 23: Fruit-wise Share in Production 2010-11
Source: ISAP Analysis & Directorate of Horticulture and Soil Conservation, Imphal
Pineapple 26%
Banana 13%
Lime/Lemon 10%Orange 10%
Other Fruits 23%
Passion Fruit 18%
Banana 21%
Pineapple 30%
Lime/Lemon 8%
Passion Fruit 19%
Orange 7%
Other Fruits 15%
Figure 24: Vegetable-wise Share in Area 2010-11
Figure 25: Vegetable-wise Share in Production (2010-11)
Source: ISAP Analysis & Directorate of Horticulture and Soil Conservation, Imphal
Cauliflower 12%
Cabbage 28%
Tomato 11%Pea 23%
Other Veg. 26%
Cabbage 30%
Cauliflower 12%
Tomato 10%
Pea 24%
Other Veg. 24%
Crops Jan Feb Mar Apr May Jun Jul Aug Sep Oct Nov DecBananaJackfruitPineappleorangeLitchiMangoPotatoturmericGingerK. VegetablesR. Vegetables
Beginning Peak Lean
Figure 26: Seasonality of Major Crops in Manipur
Source: “An In-depth Market Study and Impact Assessment Report”

26 Value Chain Analysis of Select Crops in North Eastern States
In the state, pineapple is mostly grown on hill slopes as a rain-fed crop. Giant Kew and Queen are the two leading varieties being grown. Kew is suitable for processing whereas Queen is grown for table purposes. In citrus, Khasi mandarin and orange are popular, besides Assam, Eureka and Kachai lemon. Remarkable area of hatkora (citrus) used as a spice is recorded in the warm and humid areas of Chandel and Jiribam.
Due to favourable climate, Manipur has a good potential for the production of off season vegetables. Current off season vegetables grown in the state are cabbage, tomato, peas and beans. However, large scale production and optimum yield are yet to be achieved.
the state is characterised by three distinct agro climatic zones, but it is ��
net importer of horticulture produce from the other neighbouring states as well as Burma.
Khasi mandarin is being grown in tamenglong district but the orchards are old and ��
senile and easily qualify as wild produce.
Fruits occupy more than 50 percent of total horticulture produce but forced to consume ��
locally due to exceptionally very high logistic cost.
It has emerged during discussions with the stakeholders that there is a good ��
potential for exporting some horticultural crops like Pineapple, citrus, subject to the supportive environment in term of logistics, law and order and infrastructural support.
Salient Features of Horticulture in Manipur
MeghalayaAgro-Climatic Zones & Potential Crops Grown
The state has two distinct agro-climatic zones. The distribution of horticultural crops among these zones is as follows:
Horticulture scenario
As per the available data during the period (2010-11), horticulture crops occupy nearly 73 thousand ha in the state. Among various horticulture crops, vegetable crops occupied maximum area (57.20%), followed by fruit crops (27.37%) and spices (15.43%).
Agro-Climatic Zones Potential Horticultural Crops Grown Districts/AreasMild tropical Hill zone Pineapple, Pear, Peach, Plum, Potato,
Vegetables, Passion Fruit, Strawberry, Mandarin, Black Pepper
Ri-Bhoi, east Khasi Hills, West Khasi Hills, Jaintia Hills, Part of Garo Hills
Mild tropical Plain Zone Pineapple, Mandarin, Potato, Vegetables, Cashewnut, Black Pepper
East Garo Hills, West Garo Hills
Source: “An In-depth Market Study and Impact Assessment Report”
Table 14: Agro-climatic zones in Meghalaya
27Chapter 3 | Horticulture scenario in north east Region
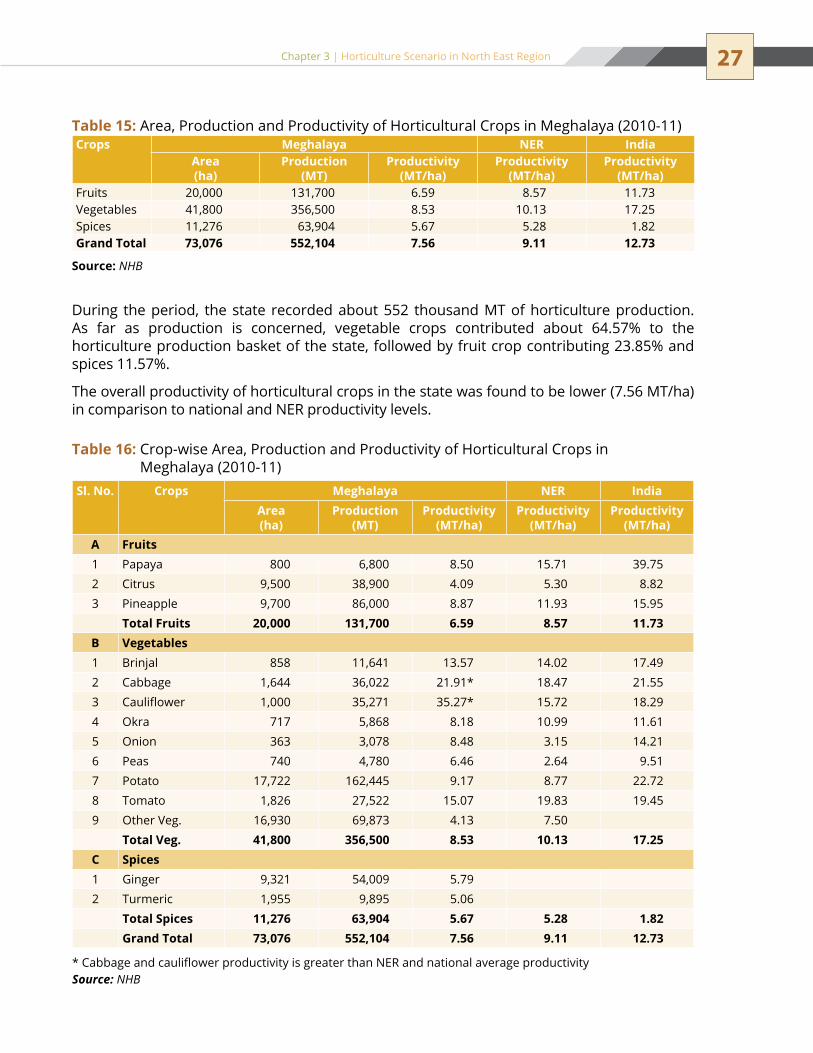
During the period, the state recorded about 552 thousand MT of horticulture production. As far as production is concerned, vegetable crops contributed about 64.57% to the horticulture production basket of the state, followed by fruit crop contributing 23.85% and spices 11.57%.
The overall productivity of horticultural crops in the state was found to be lower (7.56 MT/ha) in comparison to national and NER productivity levels.
Crops Meghalaya NER IndiaArea (ha)
Production (MT)
Productivity (MT/ha)
Productivity (MT/ha)
Productivity (MT/ha)
Fruits 20,000 131,700 6.59 8.57 11.73Vegetables 41,800 356,500 8.53 10.13 17.25spices 11,276 63,904 5.67 5.28 1.82Grand Total 73,076 552,104 7.56 9.11 12.73
Source: NHB
Table 15: Area, Production and Productivity of Horticultural Crops in Meghalaya (2010-11)
Table 16: Crop-wise Area, Production and Productivity of Horticultural Crops in Meghalaya (2010-11)
Sl. No. Crops Meghalaya NER IndiaArea (ha)
Production (MT)
Productivity (MT/ha)
Productivity (MT/ha)
Productivity (MT/ha)
A Fruits1 Papaya 800 6,800 8.50 15.71 39.752 Citrus 9,500 38,900 4.09 5.30 8.823 Pineapple 9,700 86,000 8.87 11.93 15.95
Total Fruits 20,000 131,700 6.59 8.57 11.73B Vegetables1 Brinjal 858 11,641 13.57 14.02 17.492 Cabbage 1,644 36,022 21.91* 18.47 21.553 Cauliflower 1,000 35,271 35.27* 15.72 18.294 okra 717 5,868 8.18 10.99 11.615 onion 363 3,078 8.48 3.15 14.216 Peas 740 4,780 6.46 2.64 9.517 Potato 17,722 162,445 9.17 8.77 22.728 tomato 1,826 27,522 15.07 19.83 19.459 Other Veg. 16,930 69,873 4.13 7.50
Total Veg. 41,800 356,500 8.53 10.13 17.25C Spices1 Ginger 9,321 54,009 5.792 turmeric 1,955 9,895 5.06
Total Spices 11,276 63,904 5.67 5.28 1.82Grand Total 73,076 552,104 7.56 9.11 12.73
* Cabbage and cauliflower productivity is greater than NER and national average productivitySource: NHB
28 Value Chain Analysis of Select Crops in North Eastern States
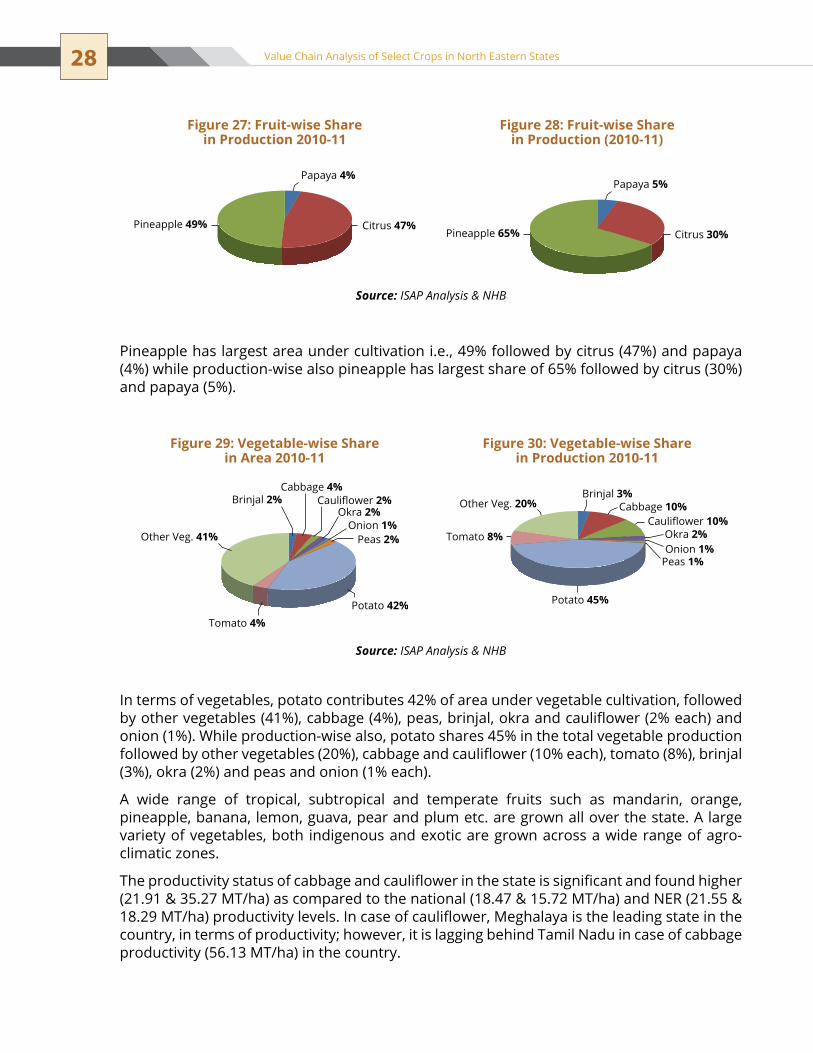
Figure 27: Fruit-wise Share in Production 2010-11
Figure 28: Fruit-wise Share in Production (2010-11)
Source: ISAP Analysis & NHB
Papaya 4%
Citrus 47%Pineapple 49%
Papaya 5%
Citrus 30%Pineapple 65%
Figure 29: Vegetable-wise Share in Area 2010-11
Figure 30: Vegetable-wise Share in Production 2010-11
Source: ISAP Analysis & NHB
Brinjal 2%Cabbage 4%
Cauliflower 2%Okra 2%
Onion 1%Peas 2%
Potato 42%Tomato 4%
Other Veg. 41%
Brinjal 3%Cabbage 10%
Cauliflower 10%Okra 2%Onion 1%
Peas 1%
Potato 45%
Tomato 8%
Other Veg. 20%
Pineapple has largest area under cultivation i.e., 49% followed by citrus (47%) and papaya (4%) while production-wise also pineapple has largest share of 65% followed by citrus (30%) and papaya (5%).
In terms of vegetables, potato contributes 42% of area under vegetable cultivation, followed by other vegetables (41%), cabbage (4%), peas, brinjal, okra and cauliflower (2% each) and onion (1%). While production-wise also, potato shares 45% in the total vegetable production followed by other vegetables (20%), cabbage and cauliflower (10% each), tomato (8%), brinjal (3%), okra (2%) and peas and onion (1% each).
A wide range of tropical, subtropical and temperate fruits such as mandarin, orange, pineapple, banana, lemon, guava, pear and plum etc. are grown all over the state. A large variety of vegetables, both indigenous and exotic are grown across a wide range of agro-climatic zones.
The productivity status of cabbage and cauliflower in the state is significant and found higher (21.91 & 35.27 MT/ha) as compared to the national (18.47 & 15.72 MT/ha) and NER (21.55 & 18.29 MT/ha) productivity levels. In case of cauliflower, Meghalaya is the leading state in the country, in terms of productivity; however, it is lagging behind tamil nadu in case of cabbage productivity (56.13 MT/ha) in the country.

29Chapter 3 | Horticulture scenario in north east Region
the higher altitudes provide a conducive ecosystem to grow traditional vegetables such as potato and cole crops during the rainy season. Tuber and root crops such as sweet potato and tapioca, spices such as turmeric, ginger, chillies, etc. also grow abundantly. Vegetables such as tomato, cabbage and chayote are the major off season vegetables which are supplied to other neighbouring states.
over a period of time, Meghalaya has postioned itself not only as a major supplier of vegetables to the neighbouring states but also as an off season vegetable producer and supplier for the distant market.
two distinct agro climatic zones which make it conducive to produce a wide range of ��
vegetable crops and these vegetable crops qualify for off season vegetables.Production belts happen to be close to the consumption market as well as exit points/��
distribution transit points.More than half of the horticulture produce is contributed by vegetable production, ��
but the productivity of vegetable crops is half of the national average productivity and even less than the neR vegetable productivity, however, paradoxically cole crops recorded the highest productivity. A substantial quantity of vegetable finds its way to Bangladesh through unofficial ��
channels. over a period of time, due to the climate and its strategic location, Meghalaya has ��
emerged as an off season vegetable production hub, not only for NER, but also for the neighbouring countries of Bangladesh along with the distant Kolkata market. However, during discussions with stakeholders, it has emerged that climatic changes have started making a detrimental impact on the seasonality and productivity which can lead to its losing the competitive advantage of off season vegetables.Lack of post-harvest infrastructure, specifically modern vegetable packing houses ��
is a major impediment in maintaining the comparative advantage in the changing market scenario.
Salient Features of Horticulture in Meghalaya
Figure 31: Seasonality of Major Crops in Meghalaya (2010-11)
Crops Jan Feb Mar Apr May Jun Jul Aug Sep Oct Nov DecBananaJackfruitPineappleMandarinChillies
Black PepperMangoPotatoturmericGingerK. VegetablesR. Vegetables
Beginning Peak Lean
Source: “An In-depth Market Study and Impact Assessment Report”
30 Value Chain Analysis of Select Crops in North Eastern States
MizoramAgro-Climatic Zones & Potential Crops Grown
The state has three distinct agro-climatic zones. The distribution of horticultural crops among these zones is as follows:
Horticulture scenario
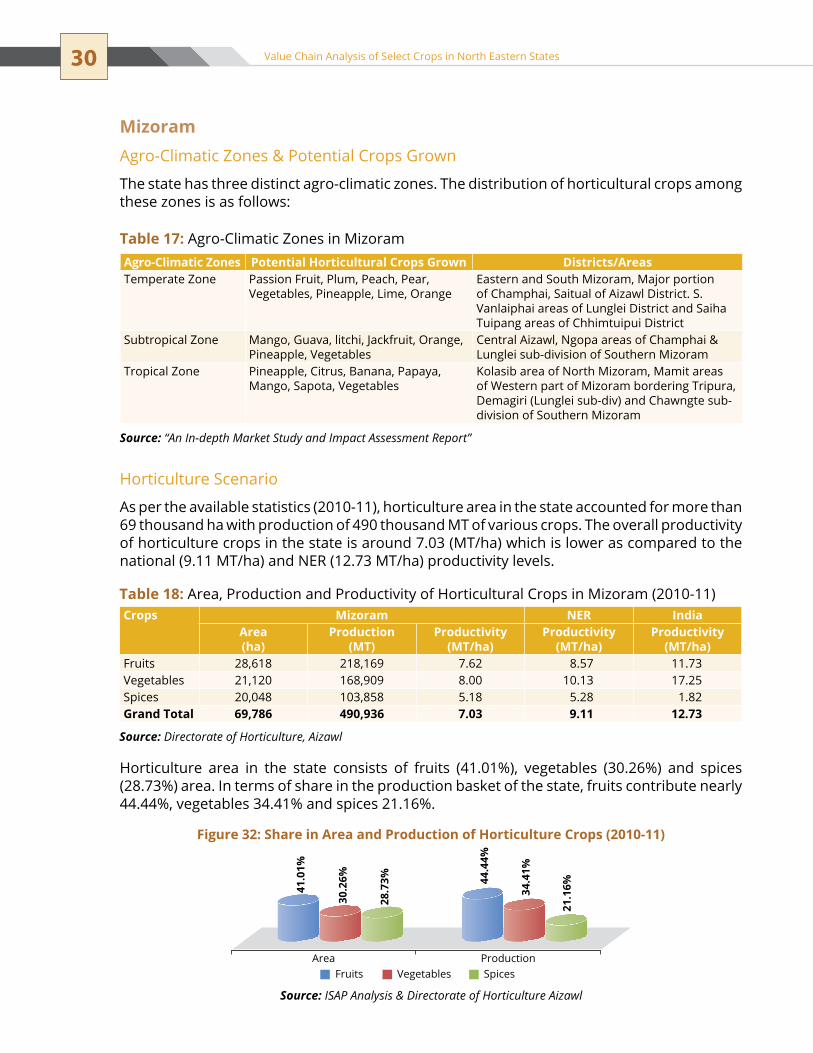
As per the available statistics (2010-11), horticulture area in the state accounted for more than 69 thousand ha with production of 490 thousand MT of various crops. The overall productivity of horticulture crops in the state is around 7.03 (MT/ha) which is lower as compared to the national (9.11 MT/ha) and NER (12.73 MT/ha) productivity levels.
Horticulture area in the state consists of fruits (41.01%), vegetables (30.26%) and spices (28.73%) area. In terms of share in the production basket of the state, fruits contribute nearly 44.44%, vegetables 34.41% and spices 21.16%.
Agro-Climatic Zones Potential Horticultural Crops Grown Districts/Areastemperate Zone Passion Fruit, Plum, Peach, Pear,
Vegetables, Pineapple, Lime, Orangeeastern and south Mizoram, Major portion of Champhai, Saitual of Aizawl District. S. Vanlaiphai areas of Lunglei District and Saiha tuipang areas of Chhimtuipui District
subtropical Zone Mango, Guava, litchi, Jackfruit, Orange, Pineapple, Vegetables
Central Aizawl, ngopa areas of Champhai & Lunglei sub-division of southern Mizoram
tropical Zone Pineapple, Citrus, Banana, Papaya, Mango, Sapota, Vegetables
Kolasib area of north Mizoram, Mamit areas of Western part of Mizoram bordering tripura, Demagiri (Lunglei sub-div) and Chawngte sub-division of southern Mizoram
Source: “An In-depth Market Study and Impact Assessment Report”
Table 17: Agro-Climatic Zones in Mizoram
Table 18: Area, Production and Productivity of Horticultural Crops in Mizoram (2010-11)Crops Mizoram NER India
Area (ha)
Production (MT)
Productivity (MT/ha)
Productivity (MT/ha)
Productivity (MT/ha)
Fruits 28,618 218,169 7.62 8.57 11.73Vegetables 21,120 168,909 8.00 10.13 17.25spices 20,048 103,858 5.18 5.28 1.82Grand Total 69,786 490,936 7.03 9.11 12.73
Source: Directorate of Horticulture, Aizawl
Figure 32: Share in Area and Production of Horticulture Crops (2010-11)
Area
41.0
1%
30.2
6%
28.7
3% 44.4
4%
34.4
1%
21.1
6%
ProductionFruits Vegetables Spices
Source: ISAP Analysis & Directorate of Horticulture Aizawl

31Chapter 3 | Horticulture scenario in north east Region
Table 19: Crop-wise Area, Production and Productivity of Horticultural Crops in Mizoram (2010-11)
Sl. No. Crops Mizoram NER IndiaArea (ha)
Production (MT)
Productivity (MT/ha)
Productivity (MT/ha)
Productivity (MT/ha)
A Fruits1 Mandarin 6515 19700 3.02 5.30 8.822 Banana 10040 118600 11.81 12.46 35.863 Lime/Lemon 4823 24150 5.00 5.30 8.824 Pineapple 1532 13590 8.87 11.93 15.955 Grape 1575 20400 12.95* 11.68 11.086 Passion Fruit 1522 5910 3.887 Papaya 800 6750 8.43 15.71 39.758 Mango 645 2850 4.42 6.70 6.619 Other Fruits 1166 6219 5.33
Total Fruits 28618 218169 7.62 8.57 11.73B Vegetables1 Brinjal 2010 12,108 6.02 14.02 17.492 Bitter Gourd 3715 16,889 4.553 Cabbage 2600 33,569 12.91 18.47 21.554 Chayote 3500 56,849 16.245 Bean 2290 4,956 2.166 okra 2800 18,710 6.68 10.99 11.617 Cucumber 775 3,651 4.718 tomato 675 6,180 9.16 19.83 19.459 Peas 450 1,933 4.30 2.64 9.51
10 Other Veg. 2305 14,064 6.10Total Veg. 21120 68,909 8.00 10.13 17.25
C Spices1 Black Pepper 68 88 1.292 Ginger 6500 31,950 4.923 turmeric 4780 23,970 5.014 Bird’s Eye Chilli 8700 47,850 5.50
Total Spices 20048 103858 5.18 5.28 1.82Grand Total 69786 90,936 7.03 9.11 12.73
* Grape productivity is greater than NER and national average productivitySource: Directorate of Horticulture, Aizawl
Figure 33: Fruit-wise Share in Area (2010-11)
Figure 34: Fruit-wise Share in Production (2010-11)
Source: ISAP Analysis & Directorate of Horticulture, Aizawl
Other Fruits 4%Mango 2%Papaya 3%
Passion Fruit 5%Mandarin 23%
Banana 35%
Grape 6%Pineapple 5%
Lime/Lemon 17%
Mandarin 9%
Banana 55%
Grape 9%
Pineapple 6%
Lime/Lemon 11%
Other Fruits 3%Mango 1%Papaya 3%
Passion Fruit 3%
32 Value Chain Analysis of Select Crops in North Eastern States
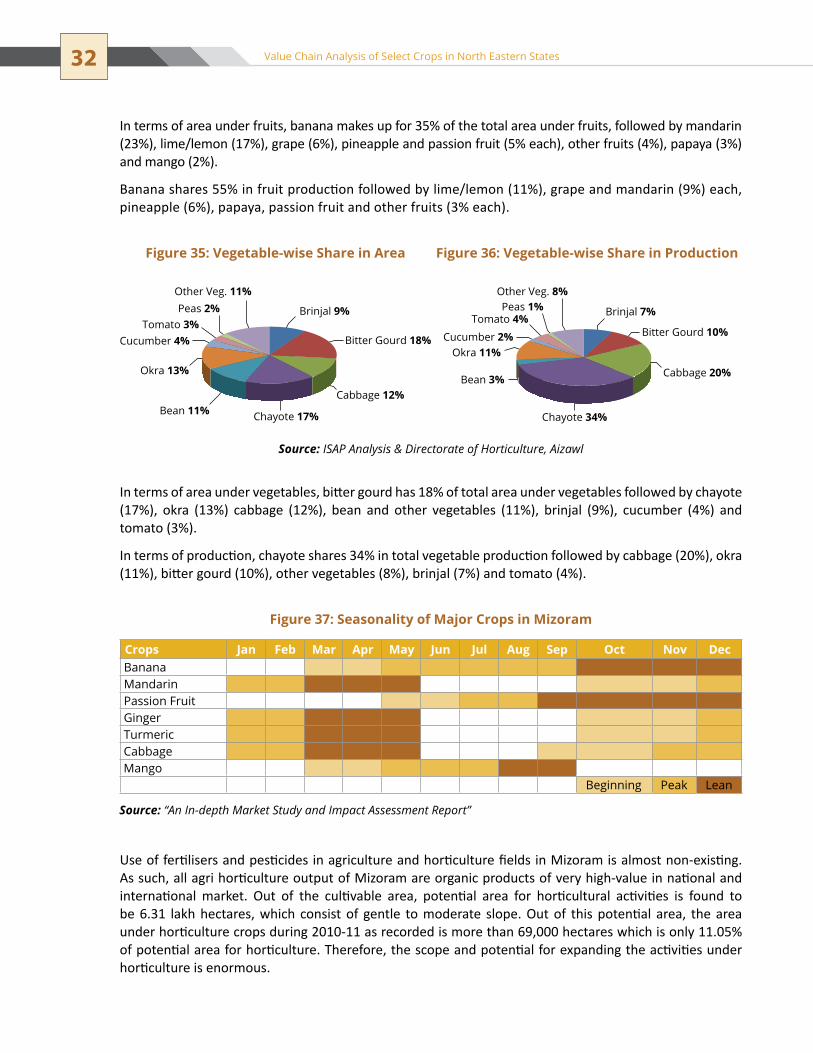
In terms of area under fruits, banana makes up for 35% of the total area under fruits, followed by mandarin (23%), lime/lemon (17%), grape (6%), pineapple and passion fruit (5% each), other fruits (4%), papaya (3%) and mango (2%).
Banana shares 55% in fruit production followed by lime/lemon (11%), grape and mandarin (9%) each, pineapple (6%), papaya, passion fruit and other fruits (3% each).
Figure 35: Vegetable-wise Share in Area Figure 36: Vegetable-wise Share in Production
Source: ISAP Analysis & Directorate of Horticulture, Aizawl
Bitter Gourd 18%
Other Veg. 11%Peas 2%
Tomato 3%Brinjal 9%
Cabbage 12%
Chayote 17%
Okra 13%
Cucumber 4%
Bean 11%
Bitter Gourd 10%
Cabbage 20%
Cucumber 2%Okra 11%
Bean 3%
Chayote 34%
Brinjal 7%
Other Veg. 8%Peas 1%
Tomato 4%
In terms of area under vegetables, bitter gourd has 18% of total area under vegetables followed by chayote (17%), okra (13%) cabbage (12%), bean and other vegetables (11%), brinjal (9%), cucumber (4%) and tomato (3%).
In terms of production, chayote shares 34% in total vegetable production followed by cabbage (20%), okra (11%), bitter gourd (10%), other vegetables (8%), brinjal (7%) and tomato (4%).
Figure 37: Seasonality of Major Crops in Mizoram
Crops Jan Feb Mar Apr May Jun Jul Aug Sep Oct Nov DecBanana Mandarin Passion Fruit Ginger turmeric Cabbage Mango Beginning Peak Lean
Source: “An In-depth Market Study and Impact Assessment Report”
Use of fertilisers and pesticides in agriculture and horticulture fields in Mizoram is almost non-existing. As such, all agri horticulture output of Mizoram are organic products of very high-value in national and international market. Out of the cultivable area, potential area for horticultural activities is found to be 6.31 lakh hectares, which consist of gentle to moderate slope. Out of this potential area, the area under horticulture crops during 2010-11 as recorded is more than 69,000 hectares which is only 11.05% of potential area for horticulture. Therefore, the scope and potential for expanding the activities under horticulture is enormous.
33Chapter 3 | Horticulture scenario in north east Region
Mizoram state produces grapes mainly in the off season and productivity of grapes in the state is found higher (12.95 MT/ha) as compared to national (11.08 MT/ha) and NER (11.68 MT/ha) productivity level. Productivity of grapes in Maharashtra which is the main production cluster of grapes in the country is also found lower (9 MT/ha) as compared to Mizoram. Besides grapes, crops like mandarin orange, passion fruit, pineapple, papaya, tomato, brinjal, bird’s eye chillies, ginger, turmeric are also grown and have tremendous potential for marketing outside the State. Most of the vegetables produced in the state are off season vegetables and hence will fetch a higher price if dispatched to the main land markets.
Mizoram is characterised by mountainous and hilly track, divided into three agro-climatic ��
zones and has the potential to become next major hub for off season vegetables.Major fruit crops are Khasi mandarin, grapes, passion fruit and lime lemon.��
Major consolidation point for Mizo products are Silchar and Karimganj.��
unique system of direct marketing is practiced in Mizoram that farmers sell their ��
produce directly to the consumers in the weekly market, having dual benefit – remunerative price to the farmers and low cost of produce to the consumer.Good quantity of turmeric is produced in the region which is being procured by the state ��
government as seed for the distribution in the whole state through the government channel. Marketing infrastructure is poor and underutilised.��
existing fruits and vegetable processing units are running far below their capacity, no ��
strong tie-ups to market the product even in NER resulting in heavy loss.Huge opportunity of trade with Bangladesh and Myanmar is still untapped due to law ��
and order situation.
Salient Features of Horticulture in Mizoram
NagalandAgro-Climatic Zones & Potential Crops Grown
The state has two distinct agro-climatic zones. The distribution of horticultural crops among these zones is as follows:
Agro-Climatic Zones Potential Horticultural Crops Grown Districts/Areassubtropical Hill Zone Orange, Pineapple, Passion Fruit,
Vegetables, Potato, Chow ChowDimapur, Kohima, Mokok Chong, Mon, tuenchang, Phek
Mild tropical Hill Zone
Pineapple, Citrus, Banana, Papaya, Pear, Peach Vegetables (Ginger)
Kohima, Zunheboto
Source: “An In-depth Market Study and Impact Assessment Report”
Table 20: Agro-Climatic Zones in nagaland
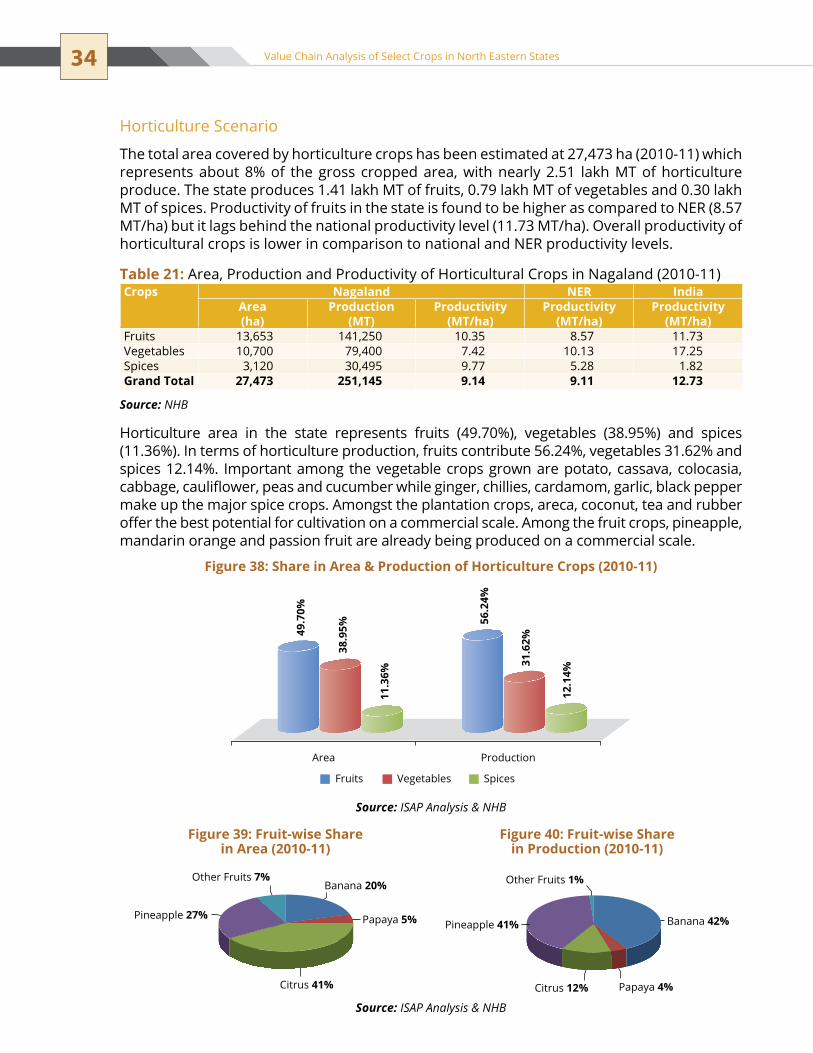
34 Value Chain Analysis of Select Crops in North Eastern States
Horticulture scenario
the total area covered by horticulture crops has been estimated at 27,473 ha (2010-11) which represents about 8% of the gross cropped area, with nearly 2.51 lakh MT of horticulture produce. The state produces 1.41 lakh MT of fruits, 0.79 lakh MT of vegetables and 0.30 lakh MT of spices. Productivity of fruits in the state is found to be higher as compared to NER (8.57 MT/ha) but it lags behind the national productivity level (11.73 MT/ha). Overall productivity of horticultural crops is lower in comparison to national and NER productivity levels.
Horticulture area in the state represents fruits (49.70%), vegetables (38.95%) and spices (11.36%). In terms of horticulture production, fruits contribute 56.24%, vegetables 31.62% and spices 12.14%. Important among the vegetable crops grown are potato, cassava, colocasia, cabbage, cauliflower, peas and cucumber while ginger, chillies, cardamom, garlic, black pepper make up the major spice crops. Amongst the plantation crops, areca, coconut, tea and rubber offer the best potential for cultivation on a commercial scale. Among the fruit crops, pineapple, mandarin orange and passion fruit are already being produced on a commercial scale.
Table 21: Area, Production and Productivity of Horticultural Crops in nagaland (2010-11)Crops Nagaland NER India
Area (ha)
Production (MT)
Productivity (MT/ha)
Productivity (MT/ha)
Productivity (MT/ha)
Fruits 13,653 141,250 10.35 8.57 11.73Vegetables 10,700 79,400 7.42 10.13 17.25spices 3,120 30,495 9.77 5.28 1.82Grand Total 27,473 251,145 9.14 9.11 12.73
Source: NHB
Figure 38: Share in Area & Production of Horticulture Crops (2010-11)
Area
49.7
0%
38.9
5%
11.3
6%
56.2
4%
31.6
2%
12.1
4%
Production
Fruits Vegetables Spices
Source: ISAP Analysis & NHB
Figure 39: Fruit-wise Share in Area (2010-11)
Figure 40: Fruit-wise Share in Production (2010-11)
Source: ISAP Analysis & NHB
Banana 20%Other Fruits 7%
Papaya 5%
Citrus 41%
Pineapple 27% Banana 42%
Citrus 12% Papaya 4%
Pineapple 41%
Other Fruits 1%
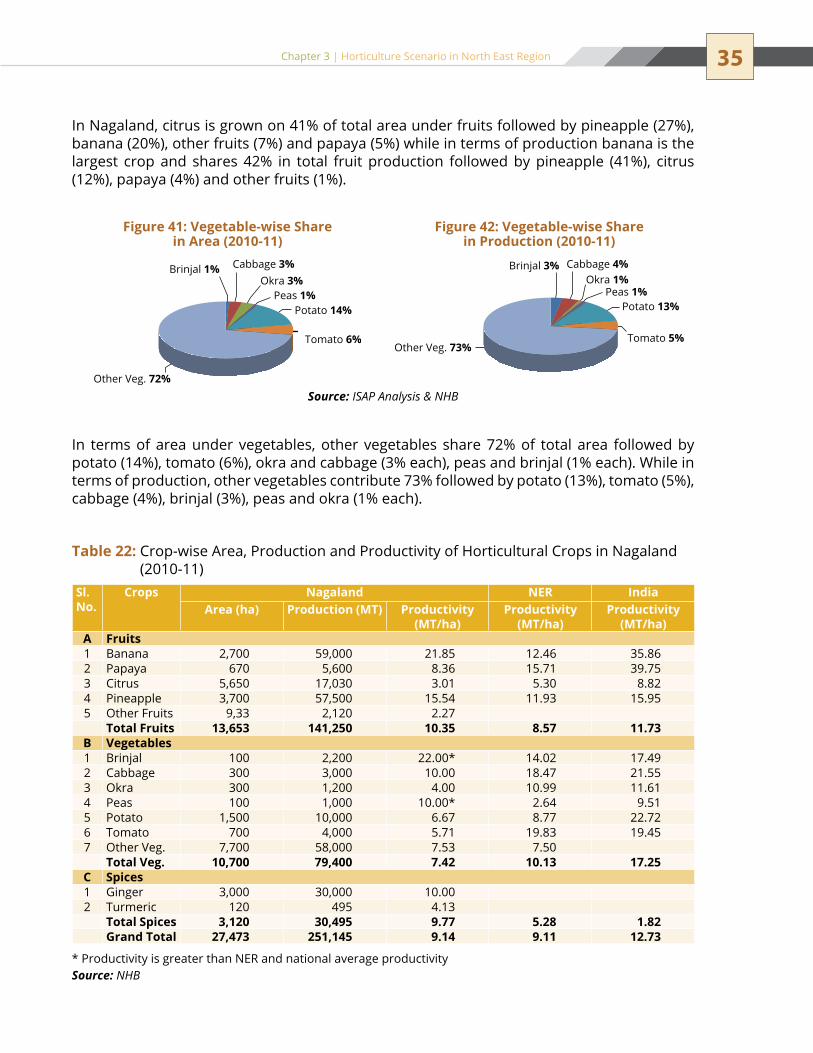
35Chapter 3 | Horticulture scenario in north east Region
Table 22: Crop-wise Area, Production and Productivity of Horticultural Crops in nagaland (2010-11)
Sl. No.
Crops Nagaland NER IndiaArea (ha) Production (MT) Productivity
(MT/ha)Productivity
(MT/ha)Productivity
(MT/ha)A Fruits1 Banana 2,700 59,000 21.85 12.46 35.862 Papaya 670 5,600 8.36 15.71 39.753 Citrus 5,650 17,030 3.01 5.30 8.824 Pineapple 3,700 57,500 15.54 11.93 15.955 Other Fruits 9,33 2,120 2.27
Total Fruits 13,653 141,250 10.35 8.57 11.73B Vegetables1 Brinjal 100 2,200 22.00* 14.02 17.492 Cabbage 300 3,000 10.00 18.47 21.553 okra 300 1,200 4.00 10.99 11.614 Peas 100 1,000 10.00* 2.64 9.515 Potato 1,500 10,000 6.67 8.77 22.726 tomato 700 4,000 5.71 19.83 19.457 Other Veg. 7,700 58,000 7.53 7.50
Total Veg. 10,700 79,400 7.42 10.13 17.25C Spices1 Ginger 3,000 30,000 10.002 turmeric 120 495 4.13
Total Spices 3,120 30,495 9.77 5.28 1.82Grand Total 27,473 251,145 9.14 9.11 12.73
* Productivity is greater than neR and national average productivitySource: NHB
In Nagaland, citrus is grown on 41% of total area under fruits followed by pineapple (27%), banana (20%), other fruits (7%) and papaya (5%) while in terms of production banana is the largest crop and shares 42% in total fruit production followed by pineapple (41%), citrus (12%), papaya (4%) and other fruits (1%).
Figure 41: Vegetable-wise Share in Area (2010-11)
Figure 42: Vegetable-wise Share in Production (2010-11)
Source: ISAP Analysis & NHB
Peas 1%
Brinjal 1% Cabbage 3%Okra 3%
Potato 14%
Tomato 6%
Other Veg. 72%
Okra 1%Peas 1%
Tomato 5%
Potato 13%
Other Veg. 73%
Cabbage 4%Brinjal 3%
In terms of area under vegetables, other vegetables share 72% of total area followed by potato (14%), tomato (6%), okra and cabbage (3% each), peas and brinjal (1% each). While in terms of production, other vegetables contribute 73% followed by potato (13%), tomato (5%), cabbage (4%), brinjal (3%), peas and okra (1% each).

36 Value Chain Analysis of Select Crops in North Eastern States
The state is divided into two agro-climatic zones – subtropical hilly and mild tropical hilly.��
Fruit production contributes more than 50 percent of total horticulture production, ��
major fruits being pineapple and banana. Initiative taken by nHB and local institute Central Institute of Horticulture (CIH) to ��
market the nagaland pineapple to distant markets of Delhi and Bangalore has opened new vistas of organised distant markets. The ginger produced in Nagaland is one of the best quality, the productivity is relatively ��
higher; five-fingered with low fibre content which makes it suitable for processing. General apprehension of law and order to outside traders who are interested in ��
purchasing products like pineapple, ginger etc.naga chilli is an ethnic product of nagaland which sells at a premium, although the ��
volumes are low. Charges levied by various insurgent groups on transportation and trade are not only ��
restricting the trade but also adding to the cost.
Salient Features of Horticulture in Nagaland
Figure 43: Seasonality of Major Crops in Nagaland
Crops Jan Feb Mar Apr May Jun Jul Aug Sep Oct Nov DecBanana Jackfruit Pineapple Mandarin Chillies Litchi Mango Potato turmeric Ginger K. Vegetables R. Vegetables Beginning Peak Lean
Source: “An In-depth Market Study and Impact Assessment Report”
Based on the elevation, both subtropical fruits such as pineapple, banana, citrus, guava, etc. and temperate fruits such as plum, peach, pear, passion fruit and various nuts have potential for exploitation. In case of pineapple, productivity status of state (15.54 MT/ha) is almost equivalent to national level (15.956 MT/ha) and more as compared to NER (11.93 MT/ha). Productivity of banana in the state is also more than NER.
In case of vegetables, the productivity of brinjal and peas in the state is higher (22 & 10 Mt/ha) as compared to national (17.49 & 9.51 MT/ha) and NER (14.02 & 2.64 MT/ha) productivity levels. However, the requirement of crops such as potato, leafy vegetables, peas, brinjal, okra, apple, papaya and several other fruits and vegetables for domestic consumption, exceeds the existing production and to meet the consumption demand leads to increased dependence on other states.

37Chapter 3 | Horticulture scenario in north east Region
SikkimAgro-Climatic Zones & Potential Crops Grown
the distribution of horticultural crops among zones based on rainfall is as follows:
Horticulture scenario
the state is endowed with varied agro-climatic conditions suitable for the cultivation of large number of subtropical and temperate horticultural crops but mainly due economic viability, mandarin and passion fruit are being commercially cultivated. In the state, the vegetables are grown mainly in three seasons viz. kharif, rabi and off season. Ginger, large cardamom, turmeric, off season vegetables, floriculture etc. can be commercially cultivated to enhance income per unit area. The small size holdings of the farmers could be utilised efficiently with family labour thereby generating both employment and additional income.
Rainfall Potential Horticulture Crops Air temperature Altitude> 300 cm
Very heavy rainfall zone
Ginger, Vegetables, Potatoes, Large Cardamom
12-16°C in the southern parts of north District and 15-18°C whole of East District from north-western parts to south-eastern parts
1000-2000
300 to 200 cm
Heavy rainfall zone
Ginger, Vegetables, Potatoes, Large Cardamom, oranges, Citrus, Banana, Papaya
13-17°C in the northern parts of south and West Districts; 16-19°C in the central parts of south & West Districts and over the valleys between east and south Districts and south and West Districts; and >20°C in the southern most parts of east, south and West Districts and over the valleys between east and south Districts and South and West Districts.
Less than 1000 m to 2000 m
200 to 100 cm
Moderate rainfall zone
seed-Potato, Cabbage, Peas, Radish, other winter vegetables, Off season cabbage
7-9°C 2000-3000 m
< 100 cm
Low rainfall zone
Cultivable land is not available above 4000 m. Vegetation is mainly herbs or medicinal herbs.
6.5°C Above 3000 m
Source: “An In-depth Market Study and Impact Assessment Report”
Table 23: Agro-Climatic Regions in sikkim
Crops Sikkim NER IndiaArea (ha) Production (MT) Productivity
(MT/ha)Productivity
(MT/ha)Productivity
(MT/ha)Fruits 11,340 17,900 1.58 8.57 11.73Vegetables 23,855 120,900 5.07 10.13 17.25spices 9,180 49,490 5.39 5.28 1.82Grand Total 44,375 188,290 4.24 9.11 12.73
Source: NHB
Table 24: Area, Production and Productivity of Horticultural Crops in sikkim (2010-11)
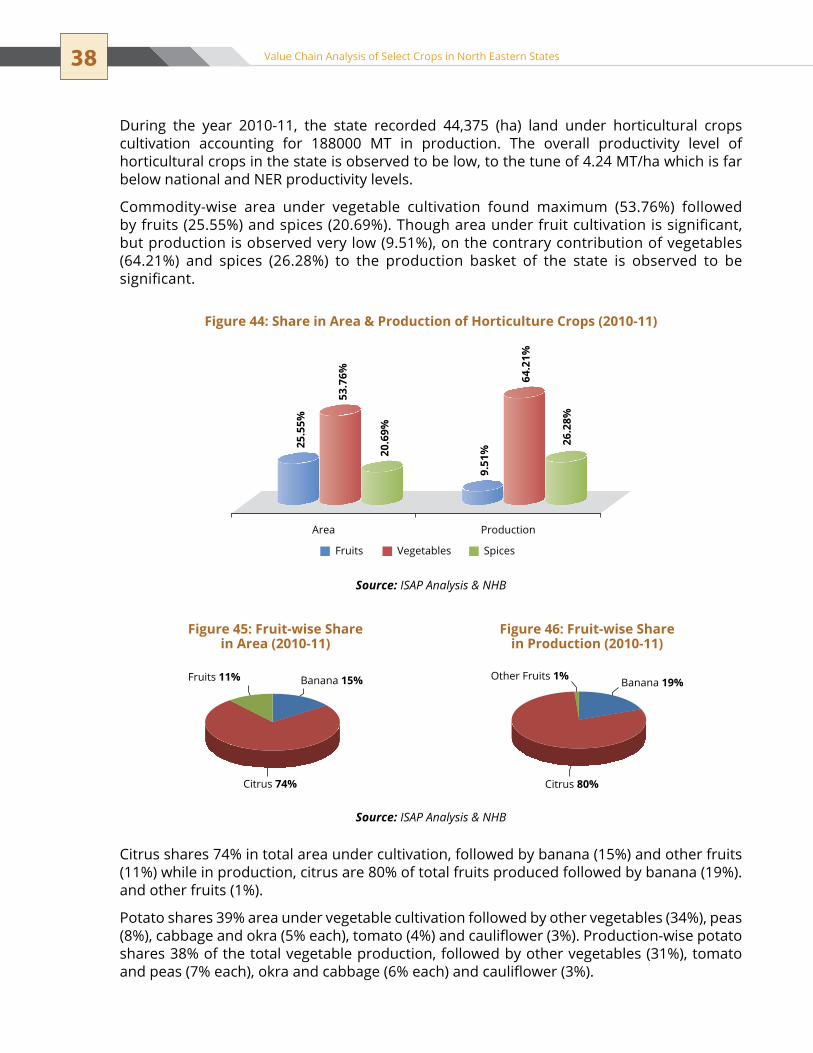
38 Value Chain Analysis of Select Crops in North Eastern States
During the year 2010-11, the state recorded 44,375 (ha) land under horticultural crops cultivation accounting for 188000 MT in production. The overall productivity level of horticultural crops in the state is observed to be low, to the tune of 4.24 MT/ha which is far below national and NER productivity levels.
Commodity-wise area under vegetable cultivation found maximum (53.76%) followed by fruits (25.55%) and spices (20.69%). Though area under fruit cultivation is significant, but production is observed very low (9.51%), on the contrary contribution of vegetables (64.21%) and spices (26.28%) to the production basket of the state is observed to be significant.
Citrus shares 74% in total area under cultivation, followed by banana (15%) and other fruits (11%) while in production, citrus are 80% of total fruits produced followed by banana (19%). and other fruits (1%).
Potato shares 39% area under vegetable cultivation followed by other vegetables (34%), peas (8%), cabbage and okra (5% each), tomato (4%) and cauliflower (3%). Production-wise potato shares 38% of the total vegetable production, followed by other vegetables (31%), tomato and peas (7% each), okra and cabbage (6% each) and cauliflower (3%).
Figure 44: Share in Area & Production of Horticulture Crops (2010-11)
Area
25.5
5%
53.7
6%
20.6
9%
9.51
%
64.2
1%
26.2
8%
Production
Fruits Vegetables Spices
Source: ISAP Analysis & NHB
Figure 45: Fruit-wise Share in Area (2010-11)
Figure 46: Fruit-wise Share in Production (2010-11)
Source: ISAP Analysis & NHB
Banana 15%Fruits 11%
Citrus 74%
Banana 19%
Citrus 80%
Other Fruits 1%

39Chapter 3 | Horticulture scenario in north east Region
Table 25: Crop-wise Area, Production and Productivity of Horticultural Crops in sikkim (2010-11)
Sl. No.
Crop Sikkim NER IndiaArea (ha)
Production (MT)
Productivity (MT/ha)
Productivity (MT/ha)
Productivity (MT/ha)
A Fruits1 Banana 1,730 3,350 1.94 12.46 35.862 Citrus 8,330 14,420 1.73 5.30 8.823 Other Fruits 1,280 130 0.10
Total Fruits 11,340 17,900 1.58 8.57 11.73B Vegetables1 Brinjal 250 1,590 6.36 14.02 17.492 Cabbage 1,180 6,900 5.85 18.47 21.553 Cauliflower 740 3,900 5.27 15.72 18.294 okra 1,100 7,170 6.52 10.99 11.615 onion 300 1,600 5.33 3.15 14.216 Peas 1,950 8,550 4.38 2.64 9.517 Potato 9,400 45,700 4.86 8.77 22.728 tomato 940 8,050 8.56 19.83 19.459 Other Veg. 7,995 37,440 4.68 7.50
Total Vegetables 23,855 120,900 5.07 10.13 17.25C Spices1 Ginger 8,510 45,890 5.392 turmeric 670 3,600 5.37
Total Spices 9,180 49,490 5.39 5.28 1.82Grand Total 44,375 188,290 4.24 9.11 12.73
Source: NHB
Figure 47: Vegetable-wise Share in Area (2010-11)
Figure 48: Vegetable-wise Share in Production (2010-11)
Source: ISAP Analysis & NHB
Cabbage 5%Cauliflower 3%
Okra 5%Onion 1%
Peas 8%
Potato 39%Tomato 4%
Other Veg. 34%
Brinjal 1%Cabbage 6%
Cauliflower 3%Okra 6%Onion 1%
Peas 7%
Potato 38%Tomato 7%
Other Veg. 31%
Brinjal 1%

40 Value Chain Analysis of Select Crops in North Eastern States
Sikkim has four agro-climatic zones based on the altitude and rainfall.��
Horticultural scenario is characterised by very low productivity. Two-third of horticulture ��
production comprises of vegetables, while fruits contribute less than 10 percent to the total horticultural production.seasonality of mandarin is same as the Bhutan mandarin but it is unable to compete ��
with the Bhutanese mandarin at the market because of high per unit logistic cost, thus slowly sikkim mandarin is being replaced by Bhutan mandarin for export to Bangladesh.sikkim ginger is one of the major crops and contributes one-fourth to the total ��
horticultural production. During season, there is a situation of glut in the market. Government agencies such as SIMFED & NERAMAC are procuring ginger and transporting it to Gangtok and Siliguri market. However, these two agencies are profit making bodies and do not support farmers in case of glut.sikkim produces more than 90 percent of the total large cardamom produced in India, ��
various market-led interventions such as auctioning system have led to high price realisation by the farmers.
Salient Features of Horticulture in Sikkim
Crops Jan Feb Mar Apr May Jun Jul Aug Sep Oct Nov DecBanana Passion Fruit Mandarin Cabbage Cauliflower Peas Potato L. Cardamom Ginger Off Season Vegetables Beginning Peak Lean
Figure 49: Seasonality of Major Crops in Sikkim
Source: “An In-depth Market Study and Impact Assessment Report”
the horticultural crops of sikkim such as mandarin and passion fruit are commercially cultivated and can be processed and marketed to distant markets, profitably. The state has made considerable improvement in vegetable production, but certain vegetables of subtropical and tropical region are being imported from other states. However, the off season vegetables grown in the high altitude areas are being exported to other states. In case of spices, the state is the largest producer of large cardamom. Also, floriculture has immense potential due to favourable climate and altitude.
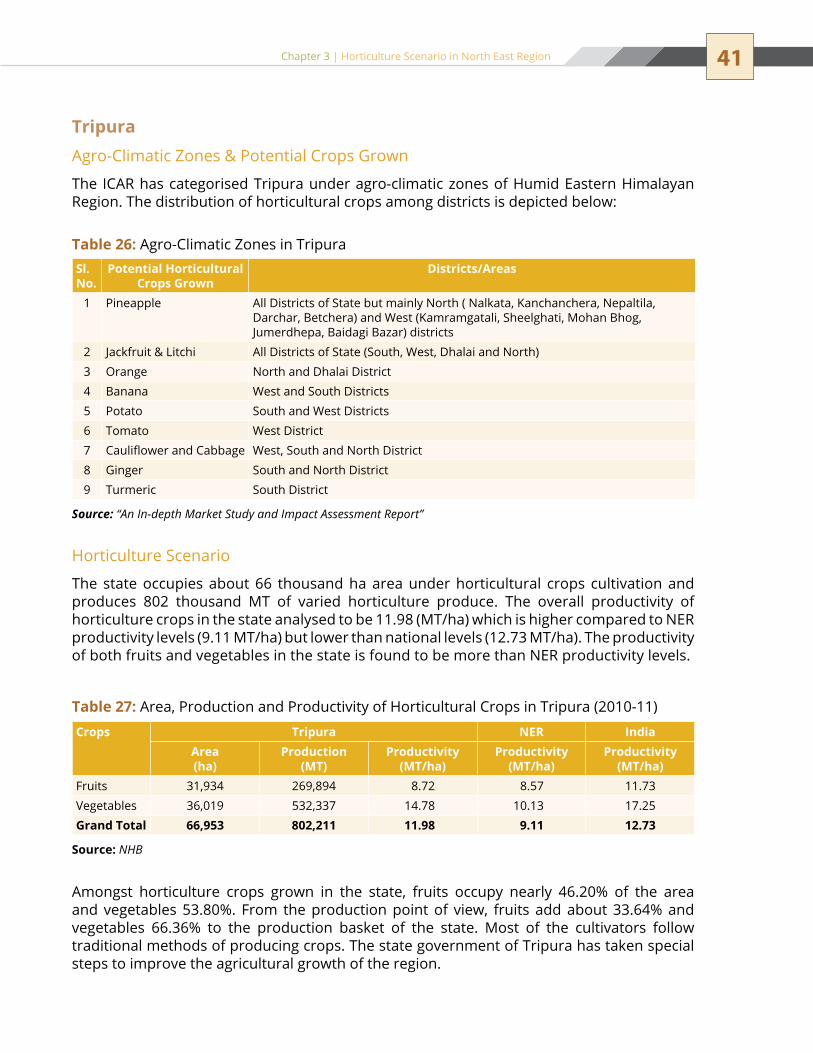
41Chapter 3 | Horticulture scenario in north east Region
TripuraAgro-Climatic Zones & Potential Crops Grown
the ICAR has categorised tripura under agro-climatic zones of Humid eastern Himalayan Region. The distribution of horticultural crops among districts is depicted below:
Horticulture scenario
the state occupies about 66 thousand ha area under horticultural crops cultivation and produces 802 thousand MT of varied horticulture produce. The overall productivity of horticulture crops in the state analysed to be 11.98 (MT/ha) which is higher compared to NER productivity levels (9.11 MT/ha) but lower than national levels (12.73 MT/ha). The productivity of both fruits and vegetables in the state is found to be more than NER productivity levels.
Sl. No.
Potential Horticultural Crops Grown
Districts/Areas
1 Pineapple All Districts of state but mainly north ( nalkata, Kanchanchera, nepaltila, Darchar, Betchera) and West (Kamramgatali, sheelghati, Mohan Bhog, Jumerdhepa, Baidagi Bazar) districts
2 Jackfruit & Litchi All Districts of state (south, West, Dhalai and north)3 orange north and Dhalai District4 Banana West and south Districts5 Potato south and West Districts6 tomato West District7 Cauliflower and Cabbage West, south and north District8 Ginger south and north District9 turmeric south District
Source: “An In-depth Market Study and Impact Assessment Report”
Table 26: Agro-Climatic Zones in tripura
Table 27: Area, Production and Productivity of Horticultural Crops in tripura (2010-11)
Crops Tripura NER IndiaArea (ha)
Production (MT)
Productivity (MT/ha)
Productivity (MT/ha)
Productivity (MT/ha)
Fruits 31,934 269,894 8.72 8.57 11.73Vegetables 36,019 532,337 14.78 10.13 17.25Grand Total 66,953 802,211 11.98 9.11 12.73
Source: NHB
Amongst horticulture crops grown in the state, fruits occupy nearly 46.20% of the area and vegetables 53.80%. From the production point of view, fruits add about 33.64% and vegetables 66.36% to the production basket of the state. Most of the cultivators follow traditional methods of producing crops. The state government of Tripura has taken special steps to improve the agricultural growth of the region.
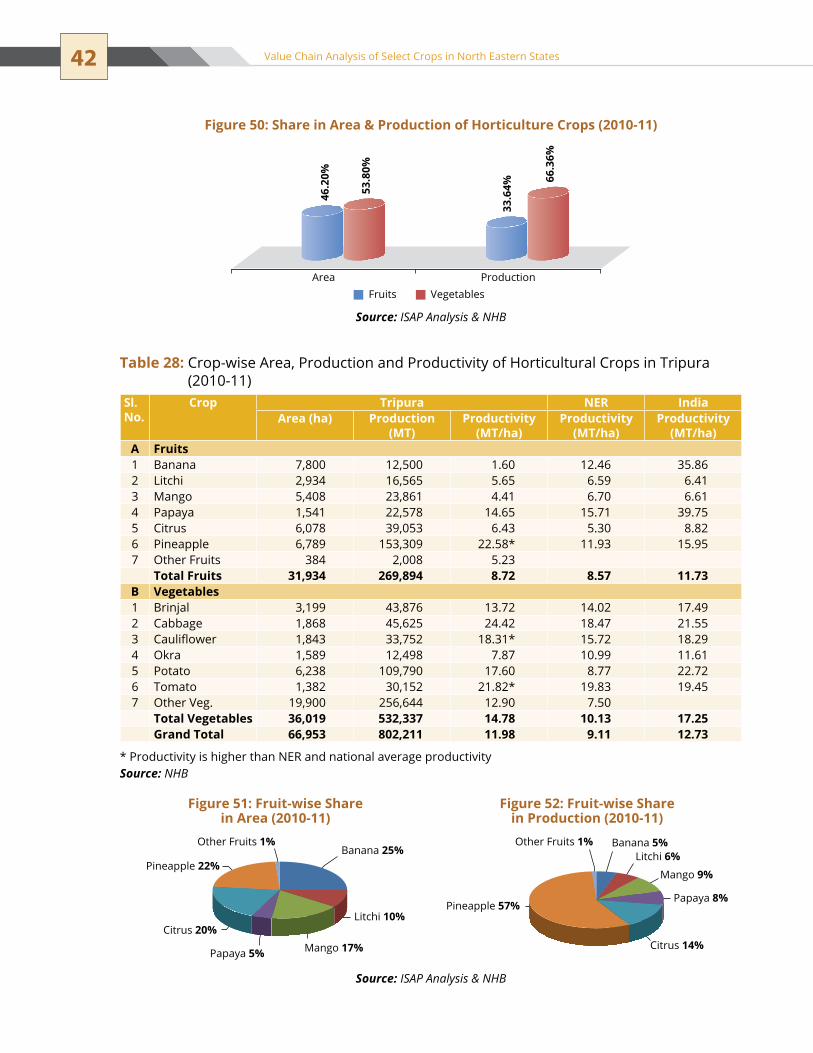
42 Value Chain Analysis of Select Crops in North Eastern States
Figure 50: Share in Area & Production of Horticulture Crops (2010-11)
Area
46.2
0%
53.8
0%
33.6
4%
66.3
6%
ProductionFruits Vegetables
Source: ISAP Analysis & NHB
Table 28: Crop-wise Area, Production and Productivity of Horticultural Crops in tripura (2010-11)
Sl. No.
Crop Tripura NER IndiaArea (ha) Production
(MT)Productivity
(MT/ha)Productivity
(MT/ha)Productivity
(MT/ha)A Fruits1 Banana 7,800 12,500 1.60 12.46 35.862 Litchi 2,934 16,565 5.65 6.59 6.413 Mango 5,408 23,861 4.41 6.70 6.614 Papaya 1,541 22,578 14.65 15.71 39.755 Citrus 6,078 39,053 6.43 5.30 8.826 Pineapple 6,789 153,309 22.58* 11.93 15.957 Other Fruits 384 2,008 5.23
Total Fruits 31,934 269,894 8.72 8.57 11.73B Vegetables1 Brinjal 3,199 43,876 13.72 14.02 17.492 Cabbage 1,868 45,625 24.42 18.47 21.553 Cauliflower 1,843 33,752 18.31* 15.72 18.294 okra 1,589 12,498 7.87 10.99 11.615 Potato 6,238 109,790 17.60 8.77 22.726 tomato 1,382 30,152 21.82* 19.83 19.457 Other Veg. 19,900 256,644 12.90 7.50
Total Vegetables 36,019 532,337 14.78 10.13 17.25Grand Total 66,953 802,211 11.98 9.11 12.73
* Productivity is higher than neR and national average productivitySource: NHB
Figure 51: Fruit-wise Share in Area (2010-11)
Figure 52: Fruit-wise Share in Production (2010-11)
Source: ISAP Analysis & NHB
Banana 25%
Litchi 10%
Mango 17%Citrus 20%
Papaya 5%
Pineapple 22%
Other Fruits 1% Banana 5%Litchi 6%
Mango 9%
Papaya 8%
Citrus 14%
Pineapple 57%
Other Fruits 1%
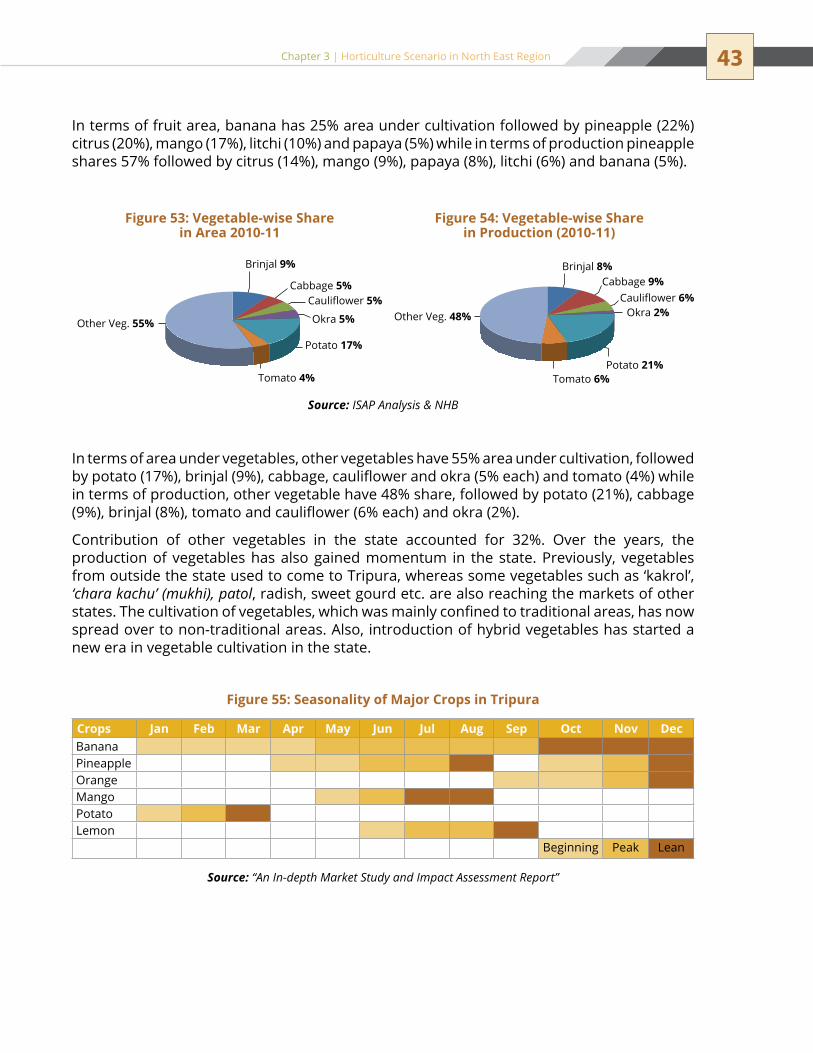
43Chapter 3 | Horticulture scenario in north east Region
In terms of fruit area, banana has 25% area under cultivation followed by pineapple (22%) citrus (20%), mango (17%), litchi (10%) and papaya (5%) while in terms of production pineapple shares 57% followed by citrus (14%), mango (9%), papaya (8%), litchi (6%) and banana (5%).
Figure 53: Vegetable-wise Share in Area 2010-11
Figure 54: Vegetable-wise Share in Production (2010-11)
Source: ISAP Analysis & NHB
Brinjal 9%
Potato 17%
Okra 5%
Cabbage 5%Cauliflower 5%
Tomato 4%
Other Veg. 55%
Brinjal 8%Cabbage 9%
Cauliflower 6%Okra 2%
Potato 21%Tomato 6%
Other Veg. 48%
In terms of area under vegetables, other vegetables have 55% area under cultivation, followed by potato (17%), brinjal (9%), cabbage, cauliflower and okra (5% each) and tomato (4%) while in terms of production, other vegetable have 48% share, followed by potato (21%), cabbage (9%), brinjal (8%), tomato and cauliflower (6% each) and okra (2%).
Contribution of other vegetables in the state accounted for 32%. Over the years, the production of vegetables has also gained momentum in the state. Previously, vegetables from outside the state used to come to Tripura, whereas some vegetables such as ‘kakrol’, ‘chara kachu’ (mukhi), patol, radish, sweet gourd etc. are also reaching the markets of other states. The cultivation of vegetables, which was mainly confined to traditional areas, has now spread over to non-traditional areas. Also, introduction of hybrid vegetables has started a new era in vegetable cultivation in the state.
Crops Jan Feb Mar Apr May Jun Jul Aug Sep Oct Nov DecBanana Pineapple orange Mango Potato Lemon Beginning Peak Lean
Figure 55: Seasonality of Major Crops in Tripura
Source: “An In-depth Market Study and Impact Assessment Report”

44 Value Chain Analysis of Select Crops in North Eastern States
Tripura has favourable climatic conditions which offer immense scope for cultivation of various kinds of horticultural crops including fruits, vegetables, spices, nuts and flowers. Agriculture is the backbone of the economy of Tripura. Most of the indigenous local inhabitants of the state are engaged in the traditional occupation of cultivating fruits and vegetables. Some of the important agricultural products of the state of tripura are jackfruit, orange, pineapple, banana, mango, litchi, lemon, kharif vegetables, potato, rabi vegetables, cashewnut, coconut, areca nut, turmeric, ginger and chilly. The farmers of the state practice organic cultivation of fruits, vegetables and spices.
tripura has a distinctive advantage and potential in some of the horticulture commodities such as pineapple (22.58 MT/ha), cabbage (24.42 MT/ha), cauliflower (18.31 MT/ha) and tomato (21.82 MT/ha). The productivity levels of these crops in the state are found to be higher, compared to national and NER productivity levels.
Based on the above discussion, it has emerged that there is a wide variety of horticulture produce/crops available in all the states of NER. However, all these crops do not qualify to meet the parameter of commercial threshold level to be projected as a potential crop; therefore an exercise is being carried out to select the potential crops for undertaking detailed value chain study.
Vegetable produced constitute 2-3rd of the total horticulture crops, although fruits ��
are only 1/3rd of the total crops. Pineapple is produced in large area, but there is a problem of abundance.Productivity of horticulture crops is better than or at par with entire NE Region.��
Major chunk of pineapple, jackfruit and vegetables are sent to Bangladesh through ��
unofficial channels.Tripura has been notified as an AEZ for pineapple.��
the only conduit for pineapple is biweekly markets which present daily harvesting of ��
produce hence quality degradation of the fields.Government initiatives have made farmers adopt staggering plants to extend the ��
availability of the produce.
Salient Features of Horticulture in Tripura

C H A P t e R
IDENTIFICATION OF FOCuS CROP GROuPS
4
With a view to identify the commercially potential crops, various crops have been rated on the basis of certain parameters, which have been devised keeping various production and market-related factors in mind. These parameters have helped in selecting the crops in a particular state as well as crop production clusters within a state, so that the crops for detailed value chain analysis may be decided.
the key parameters adopted for the selection of focus crop groups and their production clusters are detailed below:
Contribution of crops in the NER:�� to assess the importance of each crop in the total crop basket of horticultural crops, percentage contribution has been calculated on the basis of volume and value, as these crops, due to high value or volume have the potential to achieve economy of scale and can make space in distant markets. Crops contributing significantly to this basket have been selected for the detailed value chain study. Economically important crops:�� there are few high value crops in the region which can absorb the cost of logistics to compete in the distant markets with products arriving from various other production belts either domestically or internationally. Exclusive window of production:�� Certain horticulture crops are produced only in some states of neR during times when there is no production in other parts of the country; such crops are transported to the other states during the times when there is no production and qualify for off season crops. Demand in distant market:�� Certain crops which are produced in abundant quantity or such products which are ethnic in nature in neR and have a good demand in the distant markets have also been included in the list of Focussed Crop Groups for the purpose of study. Inherited advantage: �� the agro-climatic conditions prevalent in a particular region are suitable for the production of certain crops. Such regions/states possess inherited advantage in the production of these crops. Contiguity of potential area:�� the production clusters of a crop in a state are either contiguous or non-contiguous which determines the feasibility of consolidation of produce and its further movement to the markets. On the basis of the contiguity of production areas and taking into account the potential production areas, crops have been selected. Integration of activities for commercial uptake:�� the availability of post-harvest, marketing and logistics infrastructure, processing and value addition facilities have been taken into account to arrive at the commercial viability of different crops.
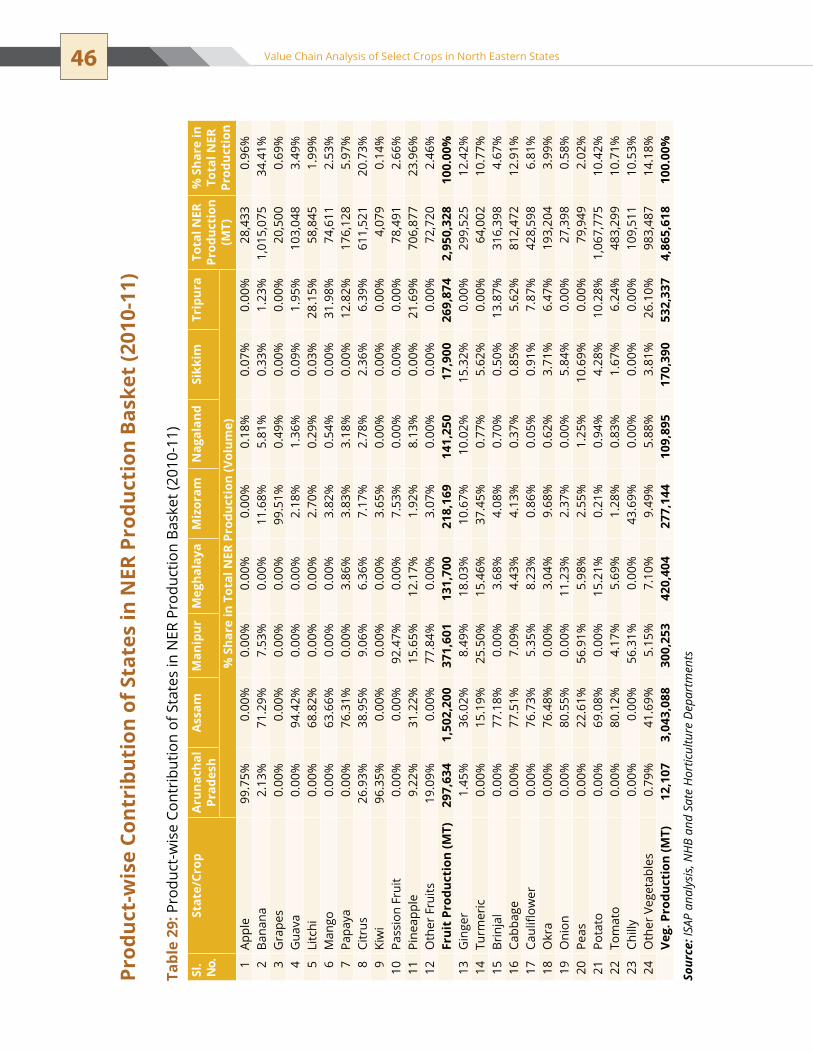
46 Value Chain Analysis of Select Crops in North Eastern States
Prod
uct-
wis
e Co
ntri
buti
on o
f Sta
tes
in N
ER P
rodu
ctio
n Ba
sket
(201
0-11
)
Sl.
No.
Stat
e/Cr
opA
runa
chal
Pr
ades
hA
ssam
Man
ipur
Meg
hala
yaM
izor
amN
agal
and
Sikk
imTr
ipur
aTo
tal N
ER
Prod
ucti
on
(MT)
% S
hare
in
Tota
l NER
Pr
oduc
tion
% S
hare
in T
otal
NER
Pro
duct
ion
(Vol
ume)
1Ap
ple
99.7
5%0.
00%
0.00
%0.
00%
0.00
%0.
18%
0.07
%0.
00%
28,4
330.
96%
2Ba
nana
2.13
%71
.29%
7.53
%0.
00%
11.6
8%5.
81%
0.33
%1.
23%
1,01
5,07
534
.41%
3G
rape
s0.
00%
0.00
%0.
00%
0.00
%99
.51%
0.49
%0.
00%
0.00
%20
,500
0.69
%4
Gua
va0.
00%
94.4
2%0.
00%
0.00
%2.
18%
1.36
%0.
09%
1.95
%10
3,04
83.
49%
5Li
tchi
0.00
%68
.82%
0.00
%0.
00%
2.70
%0.
29%
0.03
%28
.15%
58,8
451.
99%
6M
ango
0.00
%63
.66%
0.00
%0.
00%
3.82
%0.
54%
0.00
%31
.98%
74,6
112.
53%
7Pa
paya
0.00
%76
.31%
0.00
%3.
86%
3.83
%3.
18%
0.00
%12
.82%
176,
128
5.97
%8
Citr
us26
.93%
38.9
5%9.
06%
6.36
%7.
17%
2.78
%2.
36%
6.39
%61
1,52
120
.73%
9Ki
wi
96.3
5%0.
00%
0.00
%0.
00%
3.65
%0.
00%
0.00
%0.
00%
4,07
90.
14%
10Pa
ssio
n Fr
uit
0.00
%0.
00%
92.4
7%0.
00%
7.53
%0.
00%
0.00
%0.
00%
78,4
912.
66%
11Pi
neap
ple
9.22
%31
.22%
15.6
5%12
.17%
1.92
%8.
13%
0.00
%21
.69%
706,
877
23.9
6%12
Oth
er F
ruits
19.0
9%0.
00%
77.8
4%0.
00%
3.07
%0.
00%
0.00
%0.
00%
72,7
202.
46%
Frui
t Pr
oduc
tion
(MT)
297,
634
1,50
2,20
037
1,60
113
1,70
021
8,16
914
1,25
017
,900
269,
874
2,95
0,32
810
0.00
%13
Gin
ger
1.45
%36
.02%
8.49
%18
.03%
10.6
7%10
.02%
15.3
2%0.
00%
299,
525
12.4
2%14
turm
eric
0.00
%15
.19%
25.5
0%15
.46%
37.4
5%0.
77%
5.62
%0.
00%
64,0
0210
.77%
15Br
inja
l0.
00%
77.1
8%0.
00%
3.68
%4.
08%
0.70
%0.
50%
13.8
7%31
6,39
84.
67%
16Ca
bbag
e0.
00%
77.5
1%7.
09%
4.43
%4.
13%
0.37
%0.
85%
5.62
%81
2,47
212
.91%
17Ca
ulifl
ower
0.00
%76
.73%
5.35
%8.
23%
0.86
%0.
05%
0.91
%7.
87%
428,
598
6.81
%18
okr
a0.
00%
76.4
8%0.
00%
3.04
%9.
68%
0.62
%3.
71%
6.47
%19
3,20
43.
99%
19o
nion
0.00
%80
.55%
0.00
%11
.23%
2.37
%0.
00%
5.84
%0.
00%
27,3
980.
58%
20Pe
as0.
00%
22.6
1%56
.91%
5.98
%2.
55%
1.25
%10
.69%
0.00
%79
,949
2.02
%21
Pota
to0.
00%
69.0
8%0.
00%
15.2
1%0.
21%
0.94
%4.
28%
10.2
8%1,
067,
775
10.4
2%22
tom
ato
0.00
%80
.12%
4.17
%5.
69%
1.28
%0.
83%
1.67
%6.
24%
483,
299
10.7
1%23
Chill
y0.
00%
0.00
%56
.31%
0.00
%43
.69%
0.00
%0.
00%
0.00
%10
9,51
110
.53%
24O
ther
Veg
etab
les
0.79
%41
.69%
5.15
%7.
10%
9.49
%5.
88%
3.81
%26
.10%
983,
487
14.1
8%Ve
g. P
rodu
ctio
n (M
T)12
,107
3,04
3,08
830
0,25
342
0,40
427
7,14
410
9,89
517
0,39
053
2,33
74,
865,
618
100.
00%
Sour
ce: I
SAP
anal
ysis
, NH
B an
d Sa
te H
ortic
ultu
re D
epar
tmen
ts
Tabl
e 29
: Pro
duct
-wis
e Co
ntri
butio
n of
sta
tes
in n
eR P
rodu
ctio
n Ba
sket
(201
0-11
)

47Chapter 4 | Identification of Focus Crop Groups
Prod
uct-
wis
e Co
ntri
buti
on o
f Sta
tes
in N
ER P
rodu
ctio
n Va
lue
(201
0-11
)
Sl.
No.
Stat
e/Cr
opA
runa
chal
Pr
ades
hA
ssam
Man
ipur
Meg
hala
yaM
izor
amN
agal
and
Sikk
imTr
ipur
aTo
tal N
ER
Prod
ucti
on
(Val
ue in
Cr
)
% S
hare
in
Tota
l NER
Pr
oduc
tion
(V
alue
)%
Sha
re in
Tot
al N
ER P
rodu
ctio
n (V
alue
)
1Ap
ple
28.6
9%0.
00%
0.00
%0.
00%
0.00
%0.
12%
0.37
%0.
00%
271.
453.
10%
2Ba
nana
7.93
%55
.06%
26.2
2%0.
00%
51.8
0%53
.18%
22.6
5%5.
92%
3,51
6.94
40.1
5%3
Gra
pes
0.00
%0.
00%
0.00
%0.
00%
21.1
5%0.
21%
0.00
%0.
00%
168.
611.
92%
4G
uava
0.00
%2.
14%
0.00
%0.
00%
0.28
%0.
36%
0.18
%0.
27%
103.
051.
18%
5Li
tchi
0.00
%5.
58%
0.00
%0.
00%
1.26
%0.
28%
0.24
%14
.21%
369.
404.
22%
6M
ango
0.00
%4.
93%
0.00
%0.
00%
1.70
%0.
49%
0.00
%15
.41%
352.
754.
03%
7Pa
paya
0.00
%8.
64%
0.00
%6.
80%
2.49
%4.
26%
0.00
%9.
03%
515.
585.
89%
8Ci
trus
47.4
8%14
.24%
14.9
3%36
.17%
15.0
4%12
.06%
76.5
6%14
.52%
1,66
3.90
18.9
9%9
Kiw
i2.
50%
0.00
%0.
00%
0.00
%0.
11%
0.00
%0.
00%
0.00
%24
.47
0.28
%10
Pass
ion
Frui
t0.
00%
0.00
%17
.97%
0.00
%1.
86%
0.00
%0.
00%
0.00
%19
6.23
2.24
%11
Pine
appl
e13
.40%
9.40
%21
.25%
57.0
2%3.
32%
29.0
2%0.
00%
40.6
4%1,
371.
4615
.66%
12Fr
uit (
valu
e)5.
15%
0.00
%19
.62%
0.00
%0.
98%
0.00
%0.
00%
0.00
%25
4.52
2.91
%To
tal F
ruit
s94
3.73
4,55
2.93
1,00
9.65
292.
6079
3.32
384.
3751
.25
731.
928,
759.
7710
0.00
%13
Gin
ger
61.6
4%8.
84%
7.91
%25
.69%
10.4
4%50
.16%
44.6
1%0.
00%
1,29
2.19
12.4
2%14
turm
eric
0.00
%3.
23%
20.5
9%19
.09%
31.7
6%3.
36%
14.2
0%0.
00%
1,12
0.04
10.7
7%15
Brin
jal
0.00
%7.
12%
0.00
%1.
97%
1.50
%1.
31%
0.55
%8.
51%
485.
614.
67%
16Ca
bbag
e0.
00%
19.7
7%6.
87%
6.56
%4.
20%
1.92
%2.
57%
9.53
%1,
342.
9112
.91%
17Ca
ulifl
ower
0.00
%10
.32%
2.73
%6.
43%
0.46
%0.
13%
1.45
%7.
05%
708.
426.
81%
18o
kra
0.00
%6.
04%
0.00
%1.
39%
3.05
%1.
00%
3.48
%3.
40%
415.
623.
99%
19o
nion
0.00
%0.
92%
0.00
%0.
75%
0.11
%0.
00%
0.79
%0.
00%
60.2
20.
58%
20Pe
as0.
00%
0.90
%8.
62%
1.38
%0.
41%
1.02
%5.
06%
0.00
%21
0.08
2.02
%21
Pota
to0.
00%
14.2
2%0.
00%
18.1
8%0.
17%
3.93
%10
.46%
14.0
9%1,
084.
1410
.42%
22to
mat
o0.
00%
16.9
5%3.
35%
6.99
%1.
08%
3.57
%4.
18%
8.78
%1,
113.
9310
.71%
23Ch
illy
0.00
%0.
00%
44.4
5%0.
00%
36.2
3%0.
00%
0.00
%0.
00%
1,09
5.11
10.5
3%24
Oth
er V
eg.
38.3
6%11
.68%
5.47
%11
.56%
10.6
0%33
.60%
12.6
5%48
.65%
1,47
5.23
14.1
8%Ve
g. (v
alue
)30
.37
5,26
4.98
1,38
7.12
907.
001,
320.
8425
8.03
443.
7979
1.36
10,4
03.4
910
0.00
%
Sour
ce: I
SAP
anal
ysis
, NH
B an
d Sa
te H
ortic
ultu
re D
epar
tmen
ts
Tabl
e 30
: Pro
duct
-wis
e Co
ntri
butio
n of
Sta
tes
in N
ER P
rodu
ctio
n Va
lue
(201
0-11
)
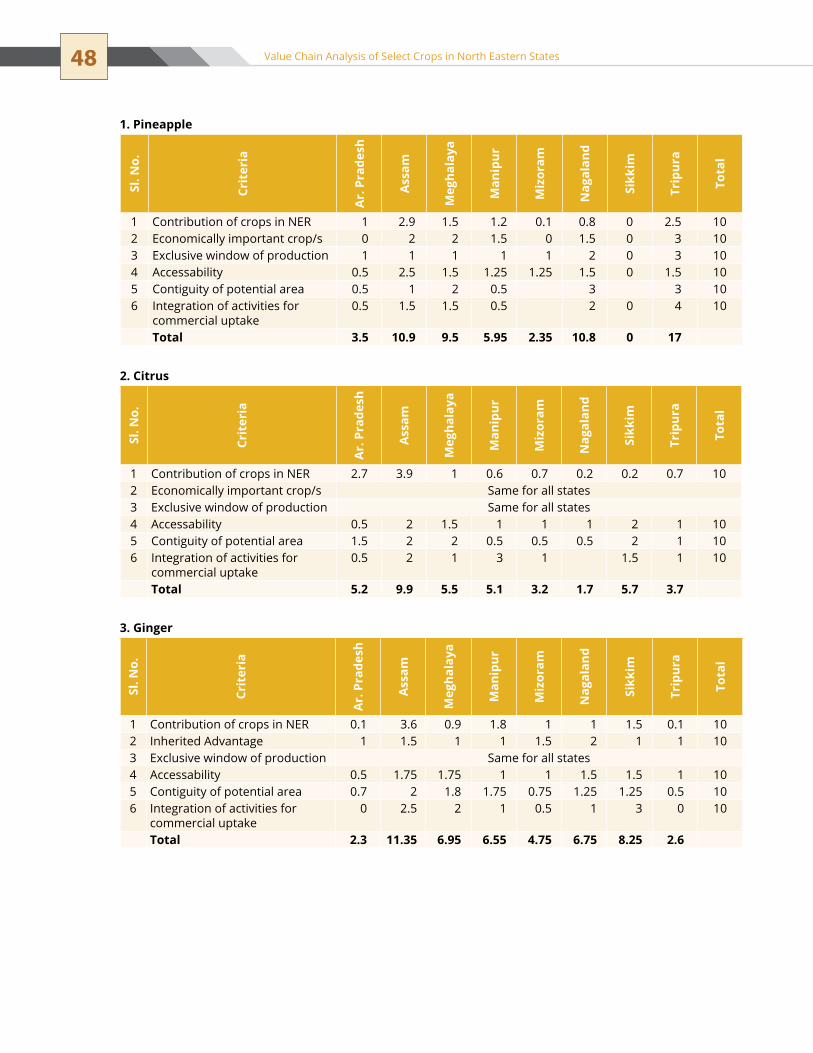
48 Value Chain Analysis of Select Crops in North Eastern States
1. PineappleSl
. No.
Crit
eria
Ar.
Pra
desh
Ass
am
Meg
hala
ya
Man
ipur
Miz
oram
Nag
alan
d
Sikk
im
Trip
ura
Tota
l
1 Contribution of crops in neR 1 2.9 1.5 1.2 0.1 0.8 0 2.5 102 economically important crop/s 0 2 2 1.5 0 1.5 0 3 103 exclusive window of production 1 1 1 1 1 2 0 3 104 Accessability 0.5 2.5 1.5 1.25 1.25 1.5 0 1.5 105 Contiguity of potential area 0.5 1 2 0.5 3 3 106 Integration of activities for
commercial uptake0.5 1.5 1.5 0.5 2 0 4 10
Total 3.5 10.9 9.5 5.95 2.35 10.8 0 17
2. Citrus
Sl. N
o.
Crit
eria
Ar.
Pra
desh
Ass
am
Meg
hala
ya
Man
ipur
Miz
oram
Nag
alan
d
Sikk
im
Trip
ura
Tota
l
1 Contribution of crops in neR 2.7 3.9 1 0.6 0.7 0.2 0.2 0.7 102 economically important crop/s same for all states3 exclusive window of production same for all states4 Accessability 0.5 2 1.5 1 1 1 2 1 105 Contiguity of potential area 1.5 2 2 0.5 0.5 0.5 2 1 106 Integration of activities for
commercial uptake0.5 2 1 3 1 1.5 1 10
Total 5.2 9.9 5.5 5.1 3.2 1.7 5.7 3.7
3. Ginger
Sl. N
o.
Crit
eria
Ar.
Pra
desh
Ass
am
Meg
hala
ya
Man
ipur
Miz
oram
Nag
alan
d
Sikk
im
Trip
ura
Tota
l1 Contribution of crops in neR 0.1 3.6 0.9 1.8 1 1 1.5 0.1 102 Inherited Advantage 1 1.5 1 1 1.5 2 1 1 103 exclusive window of production same for all states4 Accessability 0.5 1.75 1.75 1 1 1.5 1.5 1 105 Contiguity of potential area 0.7 2 1.8 1.75 0.75 1.25 1.25 0.5 106 Integration of activities for
commercial uptake0 2.5 2 1 0.5 1 3 0 10
Total 2.3 11.35 6.95 6.55 4.75 6.75 8.25 2.6

49Chapter 4 | Identification of Focus Crop Groups
4. Turmeric
Sl. N
o.
Crit
eria
Ar.
Pra
desh
Ass
am
Meg
hala
ya
Man
ipur
Miz
oram
Nag
alan
d
Sikk
im
Trip
ura
Tota
l
1 Contribution of crops in neR 0 1.5 2.5 1.5 3.7 0.1 0.6 0.1 102 Inherited Advantage same for all states3 exclusive window of production same for all states4 Accessability 0.5 1.75 1.75 1 1 1.5 1.5 1 105 Contiguity of potential area 0.5 2.5 1 1.5 2 1 1 0.5 106 Integration of activities for
commercial uptake0.5 2.5 1 2 2 1 0.5 0.5 10
Total 1.5 8.25 6.25 6 8.7 3.6 3.6 2.1
Source: ISAP Analysis
Identified Focus Crop Groups Based on the Parameters Identified for Selection Criteria
Focus Crop Group
Arunachal Pradesh
Assam Manipur Meghalaya Mizoram Nagaland Sikkim Tripura
Pineapple √ √ √ √
Citrus √ √ √ √
Ginger √ √ √
turmeric √ √ √
Passion Fruit
√
Kiwi Fruit √
naga Chilli √
Large Cardamom
√
Vegetables √ √
Source: ISAP Analysis
Table 31: Identified Focus Crop Groups
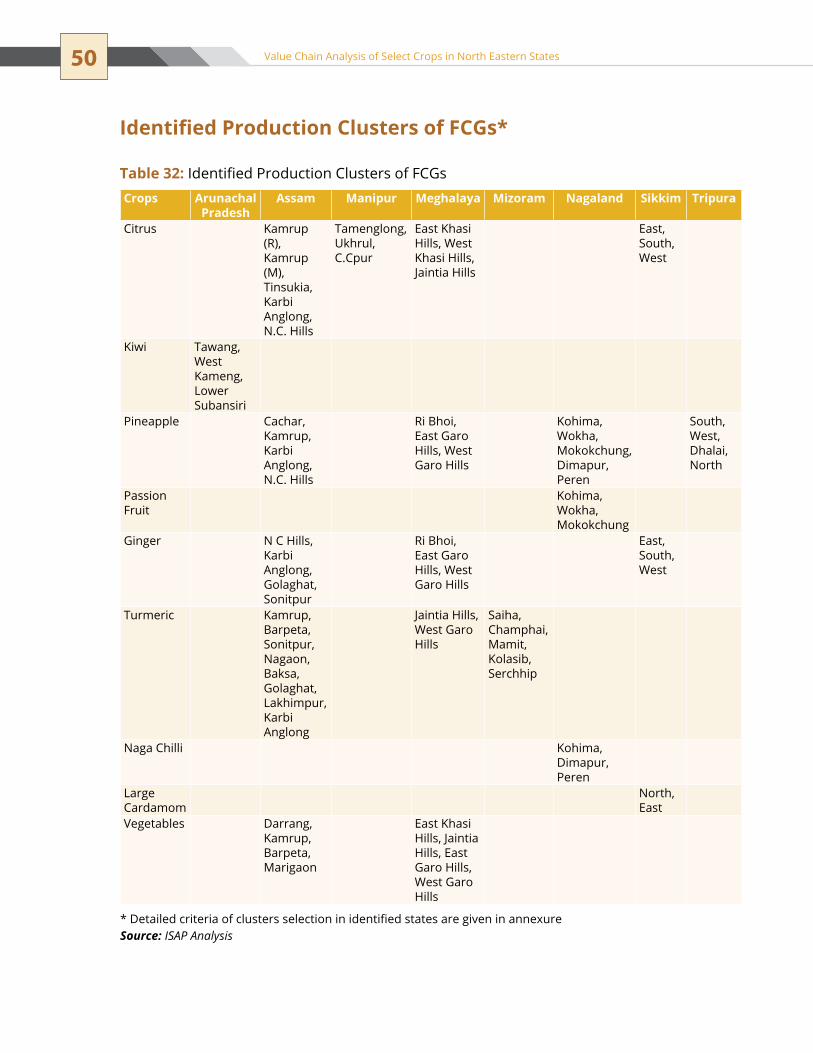
50 Value Chain Analysis of Select Crops in North Eastern States
Identified Production Clusters of FCGs*
Crops Arunachal Pradesh
Assam Manipur Meghalaya Mizoram Nagaland Sikkim Tripura
Citrus Kamrup (R), Kamrup (M), tinsukia, Karbi Anglong, N.C. Hills
tamenglong, Ukhrul, C.Cpur
east Khasi Hills, West Khasi Hills, Jaintia Hills
east, south, West
Kiwi tawang, West Kameng, Lower subansiri
Pineapple Cachar, Kamrup, Karbi Anglong, N.C. Hills
Ri Bhoi, East Garo Hills, West Garo Hills
Kohima, Wokha, Mokokchung, Dimapur, Peren
south, West, Dhalai, north
Passion Fruit
Kohima, Wokha, Mokokchung
Ginger n C Hills, Karbi Anglong, Golaghat, sonitpur
Ri Bhoi, East Garo Hills, West Garo Hills
east, south, West
turmeric Kamrup, Barpeta, sonitpur, nagaon, Baksa, Golaghat, Lakhimpur, Karbi Anglong
Jaintia Hills, West Garo Hills
saiha, Champhai, Mamit, Kolasib, serchhip
naga Chilli Kohima, Dimapur, Peren
Large Cardamom
north, east
Vegetables Darrang, Kamrup, Barpeta, Marigaon
east Khasi Hills, Jaintia Hills, east Garo Hills, West Garo Hills
* Detailed criteria of clusters selection in identified states are given in annexureSource: ISAP Analysis
Table 32: Identified Production Clusters of FCGs

51Chapter 4 | Identification of Focus Crop Groups
A complex matrix of criteria described above was prepared for all the eight states of neR based on field experience and inputs from experts, which has led to shortlisting the focus crop groups which will be studied for a specific state. Weighted average method was adopted to select the state and for identification of cluster for study, major production cluster was taken into account. The score cards for each crop have been depicted below. As these score cards have been based on field observation and perception of experts, there are chances that opinion of people may differ from each other; however, an exercise has been done to compile these tables as practically as possible.
Seasonality of Selected FCGs In case of perishable produce, it is important to know the availability of the produce for marketing and getting better prices. In NE Region, vegetables & banana are available throughout the year. Ginger is available mainly in the months of February and May. Pineapple is harvested twice in a year i.e. May to August and December to January. Mandarin is available from November to January. Turmeric is harvested from December to January. Passion fruit is harvested in the months between September and December. Cardamom is harvested twice in a year i.e. July–August and November–January. Therefore, it is important to understand that one or the other horticultural crops are available throughout the year from neR and due to varying altitude, the availability of each crop is possible for extended duration from different production clusters.
On the basis of parameters followed for the selection of Focus Crop Groups, the major crops, seasonality and their production clusters have been mapped. A detailed product rank matrix has been developed to filter out the crops, which have potential and have been selected for detailed value chain mapping.
Crops Jan Feb Mar Apr May Jun Jul Aug Sep Oct Nov DecKiwi
Pineapple
Mandarin
Large Cardamom
turmeric
Passion Fruit
Ginger
Vegetables
naga Chilli
Beginning Lean Peak
Figure 56: Availability of Horticultural Produce in NE Region
Source: “An In-depth Market Study and Impact Assessment Report”


C H A P t e R
VALuE CHAIN ANALySIS
5
An extensive study of the production region of the crops was undertaken during the field visits to map the detailed value chain from production to post-harvest management and marketing. The stages covered during value chain study are production, pre-harvest, post-harvest and marketing. During the survey and analysis, various aspects of production such as sources of input material supply, production practices, level of input application, crop varieties, labour requirement, technology adoption, intercultural operations, harvesting time and methods, seasonality, logistics and marketing were covered. Detailed value chains of the following crops have been mapped:
Pineapple – Assam, Meghalaya, tripura, nagaland��
Citrus – Assam, Manipur, Meghalaya, sikkim��
Ginger – Assam, Meghalaya, Sikkim��
turmeric – Assam, Meghalaya, Mizoram��
Kiwi – Arunachal Pradesh��
Passion Fruit – Nagaland��
Vegetables – Assam, Meghalaya��
naga Chilli – nagaland��
Large Cardamom – sikkim��
PineappleAll the eight North Eastern states produce pineapple. The advantageous position of NER in terms of fertile and organically rich soils, abundant rainfall, water resources and great agro-climatic diversity supports the cultivation of best quality pineapple in the region. The region produces more than 40 percent of pineapple produced in the country and almost 90-95 percent of the produce is organic. Pineapple produced in the region is qualitatively different and is said to be among the best in the world as they are sweet (high TSS) with less fibre.
Pineapple is a perennial crop with an economic life of 5-7 years, however, in the North Eastern region; the farmers cultivate it beyond 12-15 years through crop manipulation and traditional agronomic practices. In many parts of North Tripura and in the Barak valley of Assam, even 20-25 year old plantations can be seen.
Assam, Tripura, Meghalaya and Nagaland are major pineapple producing states.
there are two popular varieties of pineapple cultivated in north east:Kew (also known as smooth Cayenne) – suitable for canning with an average fruit 1. weight of 2-3 kg. Queen – Table fruit variety with an average fruit weight of 1-2 kg. 2.
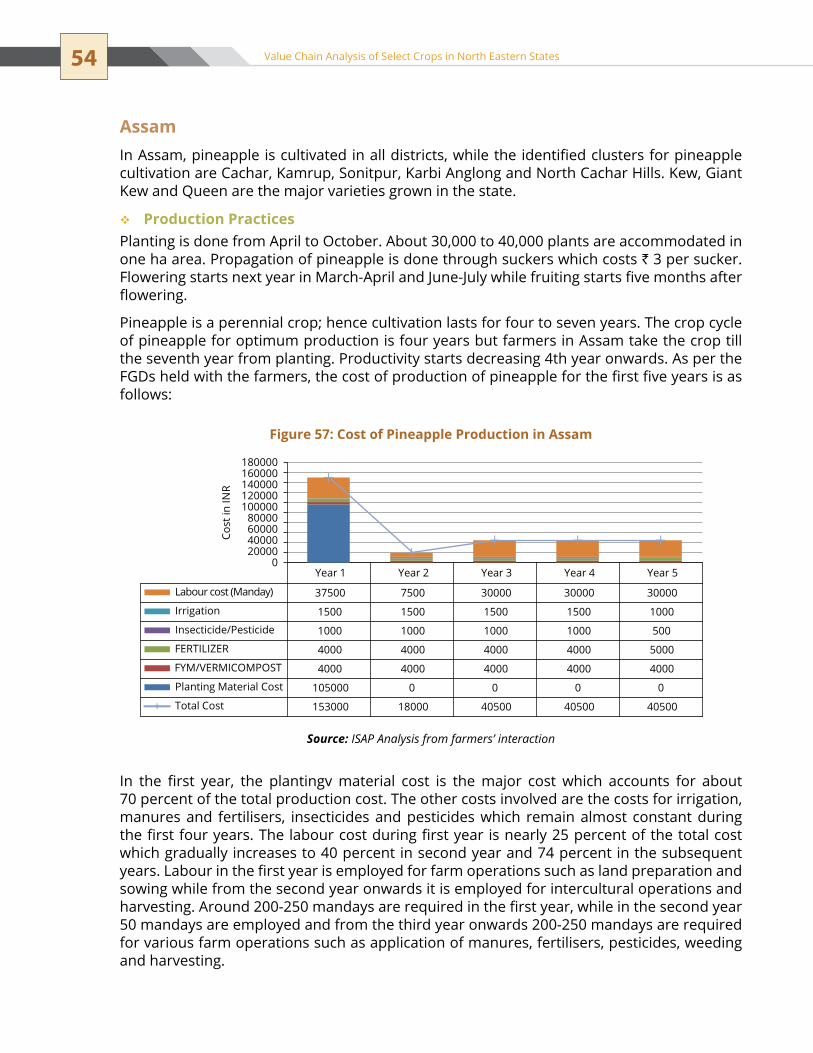
54 Value Chain Analysis of Select Crops in North Eastern States
AssamIn Assam, pineapple is cultivated in all districts, while the identified clusters for pineapple cultivation are Cachar, Kamrup, Sonitpur, Karbi Anglong and North Cachar Hills. Kew, Giant Kew and Queen are the major varieties grown in the state.
Production Practices��
Planting is done from April to October. About 30,000 to 40,000 plants are accommodated in one ha area. Propagation of pineapple is done through suckers which costs ` 3 per sucker. Flowering starts next year in March-April and June-July while fruiting starts five months after flowering.
Pineapple is a perennial crop; hence cultivation lasts for four to seven years. The crop cycle of pineapple for optimum production is four years but farmers in Assam take the crop till the seventh year from planting. Productivity starts decreasing 4th year onwards. As per the FGDs held with the farmers, the cost of production of pineapple for the first five years is as follows:
In the first year, the plantingv material cost is the major cost which accounts for about 70 percent of the total production cost. The other costs involved are the costs for irrigation, manures and fertilisers, insecticides and pesticides which remain almost constant during the first four years. The labour cost during first year is nearly 25 percent of the total cost which gradually increases to 40 percent in second year and 74 percent in the subsequent years. Labour in the first year is employed for farm operations such as land preparation and sowing while from the second year onwards it is employed for intercultural operations and harvesting. Around 200-250 mandays are required in the first year, while in the second year 50 mandays are employed and from the third year onwards 200-250 mandays are required for various farm operations such as application of manures, fertilisers, pesticides, weeding and harvesting.
Year 1 Year 2 Year 3 Year 4 Year 5
Labour cost (Manday) 37500 7500 30000 30000 30000
Irrigation 1500 1500 1500 1500 1000
Insecticide/Pesticide 1000 1000 1000 1000 500
FERTILIZER 4000 4000 4000 4000 5000
FYM/VERMICOMPOST 4000 4000 4000 4000 4000
Planting Material Cost 105000 0 0 0 0
Total Cost 153000 18000 40500 40500 40500
020000400006000080000
100000120000140000160000180000
Cost
in IN
R
Figure 57: Cost of Pineapple Production in Assam
Source: ISAP Analysis from farmers’ interaction
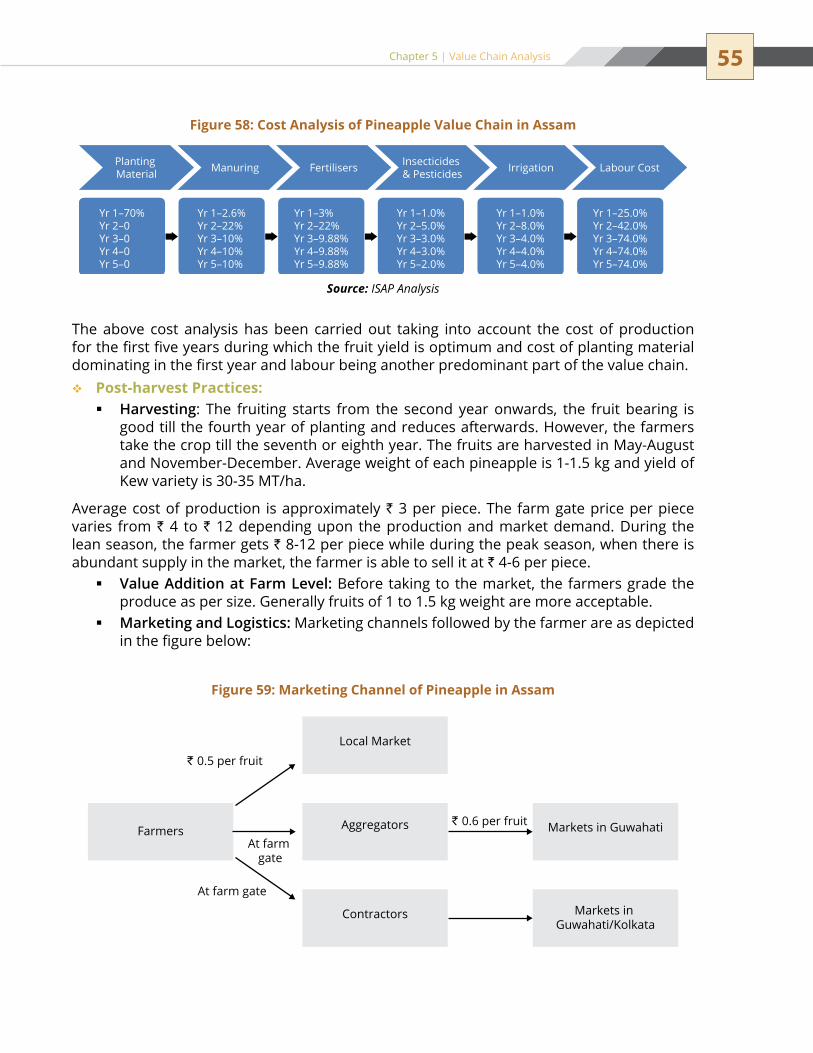
55Chapter 5 | Value Chain Analysis
the above cost analysis has been carried out taking into account the cost of production for the first five years during which the fruit yield is optimum and cost of planting material dominating in the first year and labour being another predominant part of the value chain.
Post-harvest Practices:��
Harvesting � : the fruiting starts from the second year onwards, the fruit bearing is good till the fourth year of planting and reduces afterwards. However, the farmers take the crop till the seventh or eighth year. The fruits are harvested in May-August and November-December. Average weight of each pineapple is 1-1.5 kg and yield of Kew variety is 30-35 MT/ha.
Average cost of production is approximately ` 3 per piece. The farm gate price per piece varies from ` 4 to ` 12 depending upon the production and market demand. During the lean season, the farmer gets ` 8-12 per piece while during the peak season, when there is abundant supply in the market, the farmer is able to sell it at ` 4-6 per piece.
Value Addition at Farm Level: � Before taking to the market, the farmers grade the produce as per size. Generally fruits of 1 to 1.5 kg weight are more acceptable. Marketing and Logistics: � Marketing channels followed by the farmer are as depicted in the figure below:
Farmers
` 0.5 per fruit
` 0.6 per fruit
Local Market
Aggregators Markets in Guwahati
Markets in Guwahati/Kolkata
At farm gate
At farm gate
Contractors
Manuring Fertilisers Insecticides & Pesticides Irrigation Labour CostPlanting
Material
Yr 1–70%Yr 2–0Yr 3–0Yr 4–0Yr 5–0
Yr 1–2.6%Yr 2–22%Yr 3–10%Yr 4–10%Yr 5–10%
Yr 1–3%Yr 2–22%Yr 3–9.88%Yr 4–9.88%Yr 5–9.88%
Yr 1–1.0%Yr 2–5.0%Yr 3–3.0%Yr 4–3.0%Yr 5–2.0%
Yr 1–1.0%Yr 2–8.0%Yr 3–4.0%Yr 4–4.0%Yr 5–4.0%
Yr 1–25.0%Yr 2–42.0%Yr 3–74.0%Yr 4–74.0%Yr 5–74.0%
Figure 58: Cost Analysis of Pineapple Value Chain in Assam
Source: ISAP Analysis
Figure 59: Marketing Channel of Pineapple in Assam
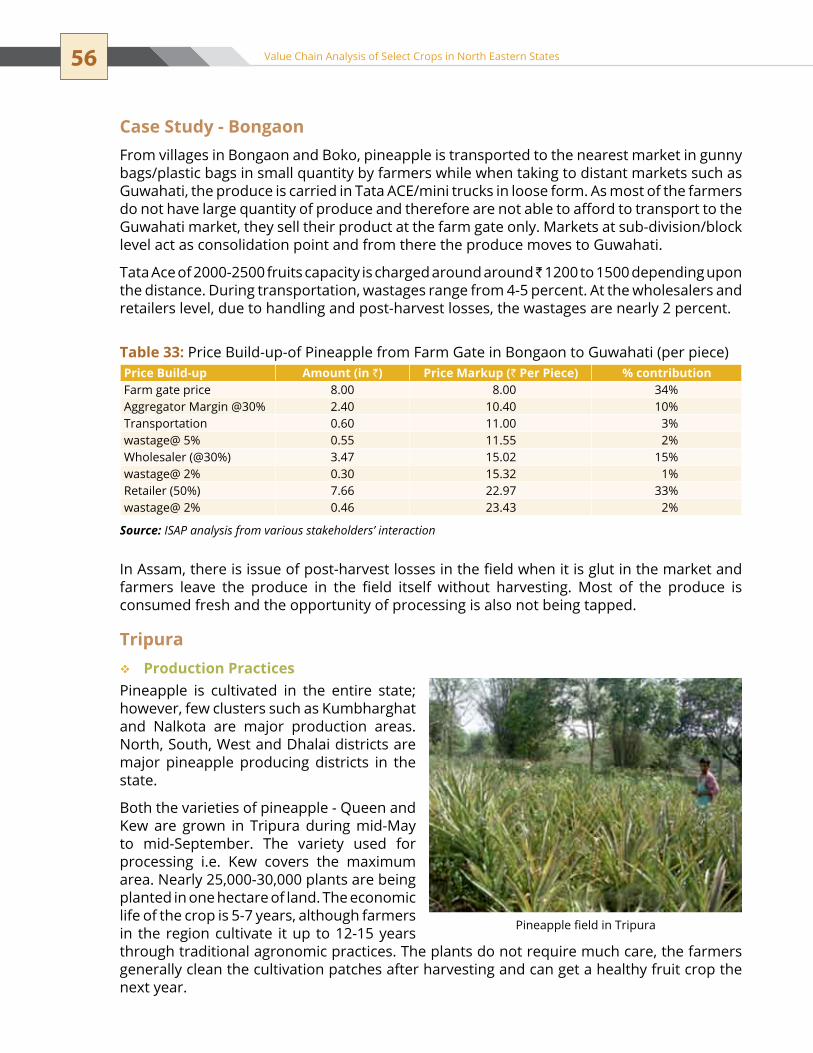
56 Value Chain Analysis of Select Crops in North Eastern States
Case Study - BongaonFrom villages in Bongaon and Boko, pineapple is transported to the nearest market in gunny bags/plastic bags in small quantity by farmers while when taking to distant markets such as Guwahati, the produce is carried in Tata ACE/mini trucks in loose form. As most of the farmers do not have large quantity of produce and therefore are not able to afford to transport to the Guwahati market, they sell their product at the farm gate only. Markets at sub-division/block level act as consolidation point and from there the produce moves to Guwahati.
Tata Ace of 2000-2500 fruits capacity is charged around around ̀ 1200 to 1500 depending upon the distance. During transportation, wastages range from 4-5 percent. At the wholesalers and retailers level, due to handling and post-harvest losses, the wastages are nearly 2 percent.
In Assam, there is issue of post-harvest losses in the field when it is glut in the market and farmers leave the produce in the field itself without harvesting. Most of the produce is consumed fresh and the opportunity of processing is also not being tapped.
TripuraProduction Practices��
Pineapple is cultivated in the entire state; however, few clusters such as Kumbharghat and Nalkota are major production areas. north, south, West and Dhalai districts are major pineapple producing districts in the state.
Both the varieties of pineapple - Queen and Kew are grown in tripura during mid-May to mid-September. The variety used for processing i.e. Kew covers the maximum area. Nearly 25,000-30,000 plants are being planted in one hectare of land. The economic life of the crop is 5-7 years, although farmers in the region cultivate it up to 12-15 years through traditional agronomic practices. The plants do not require much care, the farmers generally clean the cultivation patches after harvesting and can get a healthy fruit crop the next year.
Pineapple field in Tripura
Price Build-up Amount (in `) Price Markup (` Per Piece) % contributionFarm gate price 8.00 8.00 34%Aggregator Margin @30% 2.40 10.40 10%transportation 0.60 11.00 3%wastage@ 5% 0.55 11.55 2%Wholesaler (@30%) 3.47 15.02 15%wastage@ 2% 0.30 15.32 1%Retailer (50%) 7.66 22.97 33%wastage@ 2% 0.46 23.43 2%
Source: ISAP analysis from various stakeholders’ interaction
Table 33: Price Build-up-of Pineapple from Farm Gate in Bongaon to Guwahati (per piece)

57Chapter 5 | Value Chain Analysis
Case Study - BishramganjIn the district of sipahijila (Bishramganj), the average land holding of farmers under pineapple cultivation is 0.5 to 1 hectare (3-6 kenis – local unit).
since 80 percent of the crop becomes ready for harvest within a short period of 2-3 months (May-June-July), there is a situation of glut in the market which forces the farmers to sell the produce at low prices. In order to overcome this problem, ICAR Research Centre at Agartala, Tripura has come up with the following solutions to produce the fruit for more than five months in a year:
use of different planting material1.
Staggered planting & chemical induction of flowering2.
Genotypic diversification3.
Various farmers have adopted these techniques due to which they are able to get regular yield of pineapple for more than five months in a year.
Post-harvest Practices��
Harvesting: � The peak season for pineapple harvesting in the region is May to July. The yield is around 20,000 to 25,000 fruits per ha per season. Fruit size varies from 0.5 to 2 kg (average 1 kg/piece). Thus, the production is 20 to 25 MT per ha per season.
Individual farmers are able to harvest around 300-500 fruits on a daily basis to be taken to the market, however, due to non-availability of regular markets, around 20 percent of the fruits are wasted at the field level itself.
Value Addition at Farm Level: � Farmers, generally do not carry out any kind of grading at the field level and all sizes of fruits are sold as one lot. However, some progressive farmers have started grading as per size.Marketing & Logistics � : The fruits are carried from the field (from Batsuli village) to the nearby market (Bishramganj market) in a jeep or auto. At Bishramganj, the trade of pineapple takes place during two days of the week only (Sunday & Thursday). Transportation cost is approximately ` 30 per 100 fruits, which comes to approximately ` 0.30 per kg/per piece. There is no wastage during the transit.
In the Bishramganj market, the fruit is generally procured by traders from sonamara who then export it to Bangladesh through unofficial trade channels. Some produce is procured by traders from Agartala also. During early season, the wholesale price of the fruit remains at ` 10 per piece, however, during peak season, the rates drop to as low as ` 2 per piece. At times, when there is no market demand, the prices drop even further. The rate mainly depends upon the size of the fruit; large and same size fruits get better price in the market.
the traders from Agartala transport the produce to Agartala market in vehicles such as Bolero, Commander etc. The transportation distance is around 60 km and the cost varies from ` 0.40-0.50 per piece. The price in Agartala market varies from ` 20-40 per fruit-based on the demand and supply.
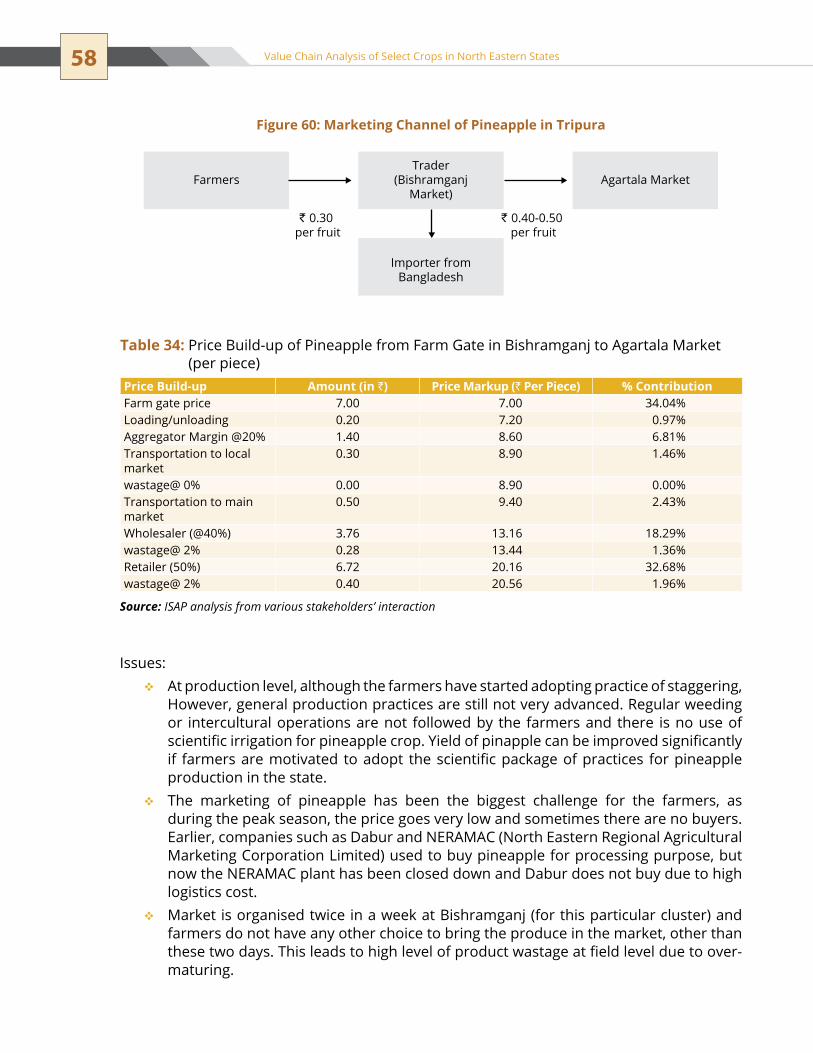
58 Value Chain Analysis of Select Crops in North Eastern States
Issues:At production level, although the farmers have started adopting practice of staggering, ��
However, general production practices are still not very advanced. Regular weeding or intercultural operations are not followed by the farmers and there is no use of scientific irrigation for pineapple crop. yield of pinapple can be improved significantly if farmers are motivated to adopt the scientific package of practices for pineapple production in the state.the marketing of pineapple has been the biggest challenge for the farmers, as ��
during the peak season, the price goes very low and sometimes there are no buyers. earlier, companies such as Dabur and neRAMAC (north eastern Regional Agricultural Marketing Corporation Limited) used to buy pineapple for processing purpose, but now the neRAMAC plant has been closed down and Dabur does not buy due to high logistics cost. Market is organised twice in a week at Bishramganj (for this particular cluster) and ��
farmers do not have any other choice to bring the produce in the market, other than these two days. This leads to high level of product wastage at field level due to over-maturing.
Farmers
` 0.30 per fruit
` 0.40-0.50 per fruit
Trader(Bishramganj
Market)Agartala Market
Importer fromBangladesh
Figure 60: Marketing Channel of Pineapple in Tripura
Price Build-up Amount (in `) Price Markup (` Per Piece) % ContributionFarm gate price 7.00 7.00 34.04%Loading/unloading 0.20 7.20 0.97%Aggregator Margin @20% 1.40 8.60 6.81%transportation to local market
0.30 8.90 1.46%
wastage@ 0% 0.00 8.90 0.00%transportation to main market
0.50 9.40 2.43%
Wholesaler (@40%) 3.76 13.16 18.29%wastage@ 2% 0.28 13.44 1.36%Retailer (50%) 6.72 20.16 32.68%wastage@ 2% 0.40 20.56 1.96%
Source: ISAP analysis from various stakeholders’ interaction
Table 34: Price Build-up of Pineapple from Farm Gate in Bishramganj to Agartala Market (per piece)
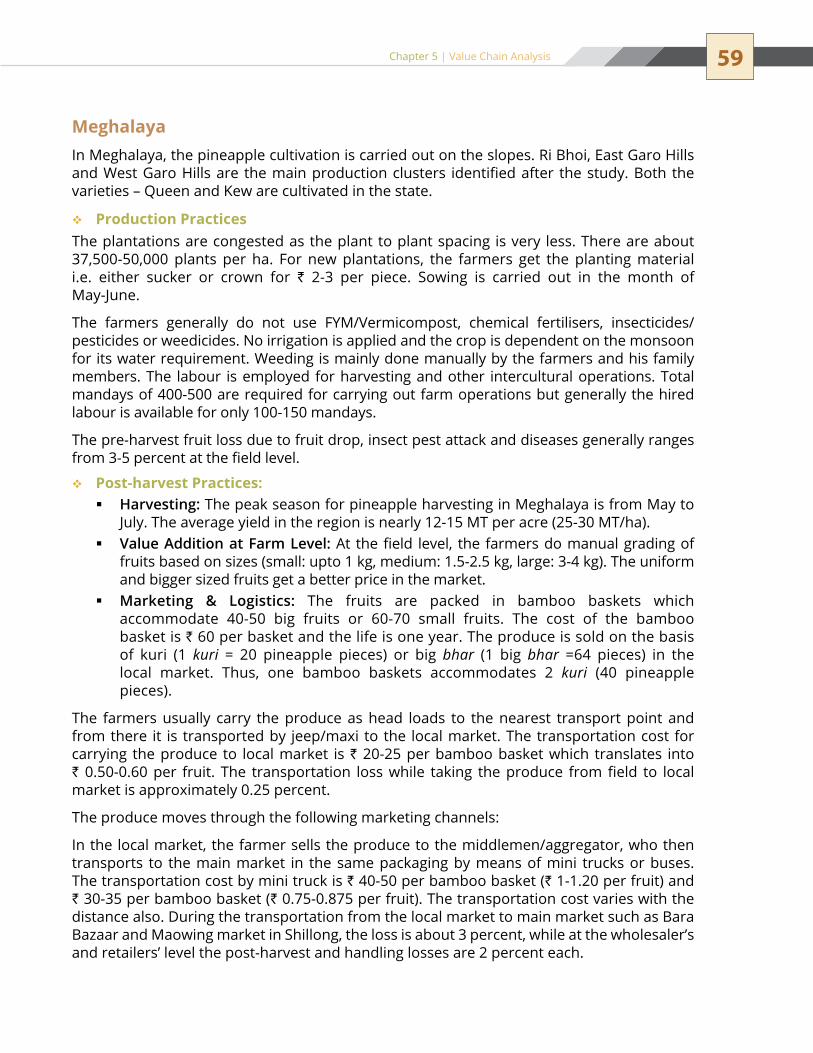
59Chapter 5 | Value Chain Analysis
MeghalayaIn Meghalaya, the pineapple cultivation is carried out on the slopes. Ri Bhoi, East Garo Hills and West Garo Hills are the main production clusters identified after the study. Both the varieties – Queen and Kew are cultivated in the state.
Production Practices��
The plantations are congested as the plant to plant spacing is very less. There are about 37,500-50,000 plants per ha. For new plantations, the farmers get the planting material i.e. either sucker or crown for ` 2-3 per piece. Sowing is carried out in the month of May-June.
The farmers generally do not use FyM/Vermicompost, chemical fertilisers, insecticides/pesticides or weedicides. No irrigation is applied and the crop is dependent on the monsoon for its water requirement. Weeding is mainly done manually by the farmers and his family members. The labour is employed for harvesting and other intercultural operations. Total mandays of 400-500 are required for carrying out farm operations but generally the hired labour is available for only 100-150 mandays.
the pre-harvest fruit loss due to fruit drop, insect pest attack and diseases generally ranges from 3-5 percent at the field level.
Post-harvest Practices:��
Harvesting: � the peak season for pineapple harvesting in Meghalaya is from May to July. The average yield in the region is nearly 12-15 MT per acre (25-30 MT/ha). Value Addition at Farm Level: � At the field level, the farmers do manual grading of fruits based on sizes (small: upto 1 kg, medium: 1.5-2.5 kg, large: 3-4 kg). The uniform and bigger sized fruits get a better price in the market. Marketing & Logistics: � the fruits are packed in bamboo baskets which accommodate 40-50 big fruits or 60-70 small fruits. The cost of the bamboo basket is ` 60 per basket and the life is one year. The produce is sold on the basis of kuri (1 kuri = 20 pineapple pieces) or big bhar (1 big bhar =64 pieces) in the local market. Thus, one bamboo baskets accommodates 2 kuri (40 pineapple pieces).
the farmers usually carry the produce as head loads to the nearest transport point and from there it is transported by jeep/maxi to the local market. The transportation cost for carrying the produce to local market is ` 20-25 per bamboo basket which translates into ` 0.50-0.60 per fruit. The transportation loss while taking the produce from field to local market is approximately 0.25 percent.
the produce moves through the following marketing channels:
In the local market, the farmer sells the produce to the middlemen/aggregator, who then transports to the main market in the same packaging by means of mini trucks or buses. the transportation cost by mini truck is ` 40-50 per bamboo basket (` 1-1.20 per fruit) and ` 30-35 per bamboo basket (` 0.75-0.875 per fruit). The transportation cost varies with the distance also. During the transportation from the local market to main market such as Bara Bazaar and Maowing market in Shillong, the loss is about 3 percent, while at the wholesaler’s and retailers’ level the post-harvest and handling losses are 2 percent each.

60 Value Chain Analysis of Select Crops in North Eastern States
NagalandIn nagaland, major production clusters are Dimapur, Peren, Kohima, Mokokchung and Wokha. Molvom (Jharnapani) is the pioneer village in pineapple cultivation in the state, where every farmer family in the village is growing pineapple. Almost 90 percent of the fields in the villages are covered with pineapple. In the entire state, pineapple variety Giant Kew is the most popular variety cultivated. It is larger than the normal variety and average weight of a single fruit is 1.5-2 kg.
Production Practices��
The planting of pineapple is carried out in the months of March-April. Earlier the farmers were carrying out single row planting due to which the fruits used to be oversized, which are less acceptable in the market and used to fetch lower price. However, now the Government is providing training and encouraging the farmers to plant in double rows. Double row planting leads to a smaller fruit size of 1 to 1.15 kg.
Farmers
` 0.50-0.60per fruit
` 1.50-1.80 per fruit
` 1-1.20 per fruit
Local Market
Main Market-Shillong
Markets inGuwahati/Kolhata/Silchar
Main Market-Shillong
Markets in Guwahati/Kolhata/SilcharContractors
Figure 61: Marketing Channel of Pineapple in Meghalaya
Particular Amount (in `)
Price Markup (` Per Piece)
% contribution
Average Selling of Farmers 15 15 41.73%Loading/Unloading 0.2 15.2 0.56%transportation to Local Market 0.5 15.7 1.39%Cost of wastage (@ 0.25% till local market) 0.04 15.74 0.11%Aggregator charges (20%) 3.14 18.88 8.76%transport to Main Market 1 19.88 2.78%Cost of wastage (@ 3% till Main Market) 0.59 20.47 1.64%Wholesaler's margin (@25%) 5.11 25.59 14.24%Cost of wastage (@ 2% wholesale) 0.51 26.10 1.42%Retailer's Margin (@35%) 9.13 35.24 25.42%Cost of wastage (@ 2% Retail level) 0.7 35.94 1.95%
Source: ISAP analysis from various stakeholders’ interaction
Table 35: Price Build-up of Pineapple from Farm Gate to Shillong

61Chapter 5 | Value Chain Analysis
The average number of plants per ha is 30,000 to 35,000. up to the fourth year of harvest, the fruit size and weight is uniform and fruit is of good quality but after the fourth year, the fruit weight and size starts declining. But the farmers usually take the crop till seventh year.
Farmers do not apply any farm input like chemicals, pesticides etc. A limited number of farmers are applying vermicompost. The grass near the fields is cut and spread in the field which after decomposing provides the nutrition to the plants. No outside labour is hired by the farmers for carrying out farm operations. They work in each other’s field and carry out all the necessary farm operations. Average number of mandays required for carrying out field operation in a season varies from 250-300 per ha. The wastages during production and harvesting due to rodents and heart rot account for a loss of 8 to 10 percent.
Post Harvest Practices��
Harvesting �
the fruits are harvested twice a year in summer and winter as below:
The average yield per ha is 30-35 MT per ha which includes both summer and winter harvest. During the first year, the production is nearly 40 percent of the total yield (optimum yield), which goes up to 80 percent and 90 percent during the second and third years of harvest respectively.
Value Addition at Farm Level �
Farmers do not carry out any kind of value addition at the farm level except size grading. The produce moves through the following marketing channels:
Farmers
` 0.8-1.0 per fruit` 0.6-0.8 per fruit
` 2-2.25 per fruit
Aggregators
Local Markets inDimapur/Kohima
Markets in Guwahati
At farm gate
At farm gate
Contractors
Figure 62: Marketing Channel of Pineapple in Nagaland
Crop Flowering Harvestingsummer March-April July-AugustWinter July-September November-January
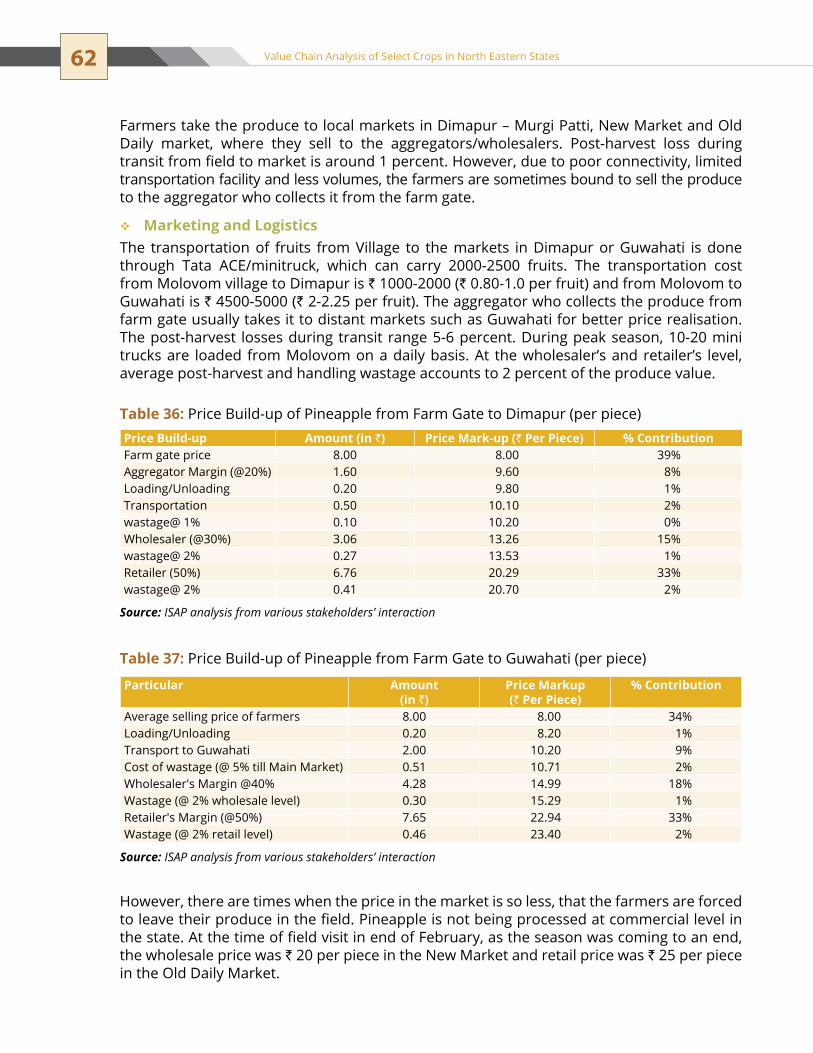
62 Value Chain Analysis of Select Crops in North Eastern States
Farmers take the produce to local markets in Dimapur – Murgi Patti, New Market and Old Daily market, where they sell to the aggregators/wholesalers. Post-harvest loss during transit from field to market is around 1 percent. However, due to poor connectivity, limited transportation facility and less volumes, the farmers are sometimes bound to sell the produce to the aggregator who collects it from the farm gate.
Marketing and Logistics��
The transportation of fruits from Village to the markets in Dimapur or Guwahati is done through Tata ACE/minitruck, which can carry 2000-2500 fruits. The transportation cost from Molovom village to Dimapur is ` 1000-2000 (` 0.80-1.0 per fruit) and from Molovom to Guwahati is ` 4500-5000 (` 2-2.25 per fruit). The aggregator who collects the produce from farm gate usually takes it to distant markets such as Guwahati for better price realisation. The post-harvest losses during transit range 5-6 percent. During peak season, 10-20 mini trucks are loaded from Molovom on a daily basis. At the wholesaler’s and retailer’s level, average post-harvest and handling wastage accounts to 2 percent of the produce value.
Price Build-up Amount (in `) Price Mark-up (` Per Piece) % ContributionFarm gate price 8.00 8.00 39%Aggregator Margin (@20%) 1.60 9.60 8%Loading/Unloading 0.20 9.80 1%transportation 0.50 10.10 2%wastage@ 1% 0.10 10.20 0%Wholesaler (@30%) 3.06 13.26 15%wastage@ 2% 0.27 13.53 1%Retailer (50%) 6.76 20.29 33%wastage@ 2% 0.41 20.70 2%
Source: ISAP analysis from various stakeholders’ interaction
Table 36: Price Build-up of Pineapple from Farm Gate to Dimapur (per piece)
Particular Amount (in `)
Price Markup (` Per Piece)
% Contribution
Average selling price of farmers 8.00 8.00 34%Loading/Unloading 0.20 8.20 1%Transport to Guwahati 2.00 10.20 9%Cost of wastage (@ 5% till Main Market) 0.51 10.71 2%Wholesaler's Margin @40% 4.28 14.99 18%Wastage (@ 2% wholesale level) 0.30 15.29 1%Retailer's Margin (@50%) 7.65 22.94 33%Wastage (@ 2% retail level) 0.46 23.40 2%
Source: ISAP analysis from various stakeholders’ interaction
Table 37: Price Build-up of Pineapple from Farm Gate to Guwahati (per piece)
However, there are times when the price in the market is so less, that the farmers are forced to leave their produce in the field. Pineapple is not being processed at commercial level in the state. At the time of field visit in end of February, as the season was coming to an end, the wholesale price was ` 20 per piece in the new Market and retail price was ` 25 per piece in the Old Daily Market.
63Chapter 5 | Value Chain Analysis
Conclusion
Pineapple which is a very significant crop of the North East is also one of the traditional crops of the region and has abundant potential in terms of production and productivity. The key points which have emerged out of discussions with various value chain actors and field visits are as follows:
Key observations: ��
In most of the states, the farmers do not apply any farm inputs, so the produce �is organic by default and can be positioned as a premium product. However, in Assam, where the pineapple cultivation is carried out on plain area, the farmers are well-versed with the cultivation practices. They are applying fertilisers, insecticides, pesticides and irrigation as per their affordability.
Farmers in Tripura have started adopting staggered planting which is leading to �the availability of pineapple for 5-6 months of the year.
strengths/UsP:��
In all the states and regions visited, except Assam, there are no expenses on �fertilisers and chemicals, making the produce largely organic. the cultivation practices are labour-intensive with labour employed for almost all �the activities from land preparation to harvesting.
During the visit to Nagaland, a meeting was held with officials from ICCOA. ICCOA is directly procuring pineapple from the farmers as per the client’s demand for which they pay a premium of 20-30 percent above the market price. The produce is picked from the farmers’ field, packaged in CFB boxes by labourers and then transported to the railway station by means of a mini carrier of 2.5 MT capacities. This carriage costs around ` 1500 from farm gate to Dimapur railway station (30-35 km), thus the transportation cost comes to around ̀ 0.60 per kg (` 0.90 per fruit). From Dimapur to Kolkata, the produce is shipped via a goods train, which costs around ` 3.5 to 4 per kg. The wastages during rail transport range from 2-3 percent.
During summer season last year (2011), ICCoA procured approximatelly 6 Mt of pineapple from the farmers directly. ICCOA is implementing Organic Cluster Project (OCP) in Molvom (Dimapur) and Gaili (Peren) for pineapple.
ICCoA is involved in training of farmers on organic farming of pineapple, ginger, turmeric, passion fruit and Naga chilli. It becomes easy to procure by making farmers’ group for a particular crop in a cluster. They are working to make farmers’ groups in the production cluster villages for potential crops. Along with government bodies they are working to improve the post-harvest practices and certification of organic farming.
their model of procurement of pineapple can be implemented in other places also by improving the cultivation, post-harvest and linkage practices. This will be helpful to directly procure from farmers and reduce the transaction cost and wastage.
ICCOA - Direct Procurement from Farmers – A Case Study

64 Value Chain Analysis of Select Crops in North Eastern States
Issues in Pineapple Cultivation: ��
the plantations are very congested and the plant to plant spacing is very less, �which leads to low productivity. no technological intervention is carried out and the crop is cultivated in a �traditional method which costs a huge amount of labour and time. Mechanisation of cultivation practices, especially harvesting would save on the time and resources.
Issues in Pineapple Marketing:��
During the peak season, the markets are covered with big heaps of pineapple, �which leads to a glut in the market. Of the total production, barely 67 percent of the fruit is processed, the rest being consumed in the fresh form, which leads to a very low price. There is no regular market in most of the production zones and a large quantity �of pineapple gets wasted in the field itself.No value addition is being undertaken by the farmers at the field level. The fruit �being perishable has a short shelf life. The absence of any kind of cold chain adds to the post-harvest wastages.
Citrusthe north eastern Region where citrus is cultivated in valleys, sub-mountane areas and in low hills, has been identified as one of the major centres of diversity for citrus. The Khasi Mandarin is the most important commercial citrus crop being grown in the hilly regions of NER. Another important citrus crop is Assam lemon, which is a seedless variety of lemon and is under cultivation to a considerable extent in the region.
Khasi mandarin is well-known for its quality, colour development, unique sugar acid blend and shelf life which makes it the most sought after and popular citrus cultivar in the North Eastern Region of the country. It covers the largest area in the region due to its commercial value. Assam and Meghalaya have the maximum area and production of Khasi mandarin.
Assam lemon, developed from a chance seedling, is quite popular and is grown on a commercial scale in Assam and other states. In the state of Manipur, Kachai lemon – a very high yielding variety of rough lemon mainly cultivated in Kachai village of Ukhrul district is a popular variety.
the value chain of lemon has been studied in detail in Assam while that of Khasi mandarin has been detailed in Assam, Arunachal Pradesh, Manipur, Meghalaya, Mizoram and Sikkim.
AssamKhasi mandarin and Assam lemon are the major focus citrus crop groups identified in Assam.
Kamrup, tinsukia, Karbi Anglong and north Cachar Hills are leading production clusters of Khasi mandarin while Barpeta, Nalbari, Darrang, Kamrup have been identified as the major production clusters of Assam lemon.

65Chapter 5 | Value Chain Analysis
Khasi Mandarin
Production Practices��
The Khasi mandarin orchards are nearly 50-100 years old, which has led to low productivity of the fruits. One hectare orchard accommodates 300-400 trees. The fruit bearing per tree is nearly 300-400 fruits. The government is encouraging the farmers to use budded plants for planting new orchards and the rejuvenation of old orchards. However, the farmers are less interested in carrying out the rejuvenation of the orchards because they are getting produce from old orchards effortlessly while the new plantation will take time in fruiting. There is very limited input used in the orchards. Only few farmers who receive fertilisers and micronutrients from government department apply it to their fields.
the planting of budded plants is carried out before the monsoons between May and August.
As per the discussions held with the farmers, the cost of cultivation of Khasi mandarin was calculated as follows:
1 2 3 4 5 6 7 8 9 10 11 12 13 14 15
Labour cost (Rs./Manday) 4500 1200 1200 1200 1200 1200 1200 1200 1200 2250 2625 3000 3375 3750 4500
Irrigation 500 500 500 800 800 1000 1000 1000 1000 1200 1500 1500 1500 1500 1500
Staking 3000
Insecticide/Pesticide 200 300 300 300 300 300 300 300 300 450 450 450 600 600 600
FERTILIZER 400 800 1200 1600 2000 2400 2800 3200 3600 4000 4400 4800 5200 5600 6000
FYM/VERMICOMPOST 2000 4000 6000 8000 1000 1200 1400 1600 1800 2000 2200 2400 2600 2800 3000
0100002000030000400005000060000700008000090000
Cost
in IN
R
Figure 63: Cost of Khasi Mandarin Production in Assam
Source: ISAP analysis from farmers’ interaction
Cultivation cost is worked out from planting till 15th year when the yield reaches its optimum level. Labour cost is the major cost in the first year of cultivation as labour is employed for land preparation, cleaning, planting and other farm operations. During the later years, the labour cost increases with the years as labour is generally employed for various intercultural operations and harvesting. The mandays requirement is 250-300 mandays per ha for fully grown orchard.
The planting material cost in the first year is nearly 15 percent of the total cost, 5 percent during second year and 2 percent in the fifth year, which is mainly the cost of filling the gaps and replacing the mortal plants.

66 Value Chain Analysis of Select Crops in North Eastern States
thus, the cost of cultivation of per kg is estimated at ` 8.6, which has been calculated taking into consideration the fact that the trees start bearing fruits in the sixth year and optimum yield is obtained till the eleventh year of bearing.
Post-harvest Practices:��
Harvesting �The orchard starts bearing in the sixth year from planting, fruit bearing is around 50 fruits per tree in the sixth year which goes up to 150 fruits in the seventh year and 200-400 fruits in the subsequent years; per kg cost of production comes to around ` 8-9. However, at the production level, about 5-6 percent of the fruit is lost due to fruit drop and citrus decline. Harvesting starts in the month of November which extends up to February. The big farmers with 100 or more than 100 trees sell the fruit to the contractor before harvesting, at a pre-fixed price; the contractor does the harvesting to sell the fruit to the wholesaler in the main market.
Value Addition at Farm Level �
Farmers do the manual grading of fruits in orchards only. They separate the damaged fruits and grade the fruits in three different sizes and pack them in gunny/plastic bag. When the orchard is sold to traders then all these activities are done by hired labour.
Marketing and Logistics �
Following channels for the marketing of the produce are adopted in Assam:
the farmers take the produce to the nearest market in plastic/gunny bags of capacity 30-35 kg. The produce is carried on the rooftop of a bus/jeep etc. which costs ` 10 per gunny bag. The farm gate price varies from ` 2-5 per piece (` 20 per kg). Per kg transportation cost is approximately ` 0.60. During transportation, the losses are up to 5 percent when transported from the village to Main market in Guwahati. At the wholesaler and retailer level, the losses are approximately 2 percent.
Farmers
` 0.5 per fruit
` 0.6-0.10 per fruit
Local Market
Aggregators Markets in Guwahati
Markets in Guwahati/Kolkata
At farm gate
At farm gate
Contractors
Figure 64: Marketing Channel of Khasi Mandarin in Assam
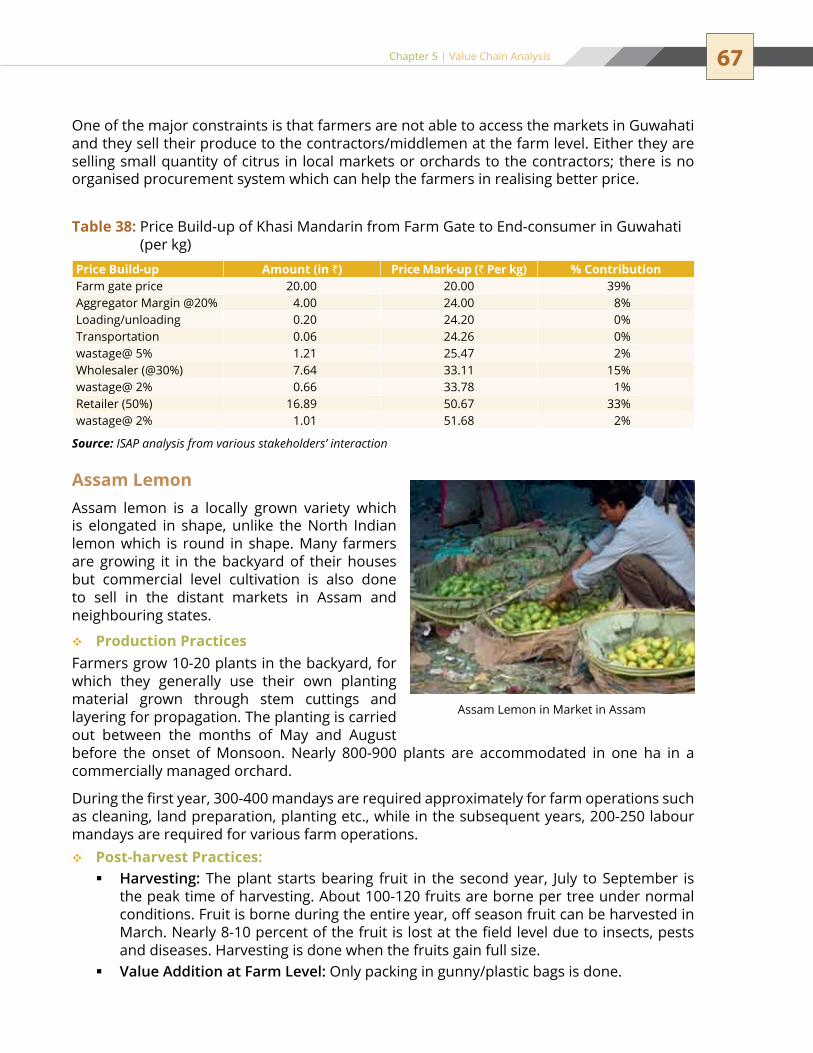
67Chapter 5 | Value Chain Analysis
One of the major constraints is that farmers are not able to access the markets in Guwahati and they sell their produce to the contractors/middlemen at the farm level. Either they are selling small quantity of citrus in local markets or orchards to the contractors; there is no organised procurement system which can help the farmers in realising better price.
Price Build-up Amount (in `) Price Mark-up (` Per kg) % ContributionFarm gate price 20.00 20.00 39%Aggregator Margin @20% 4.00 24.00 8%Loading/unloading 0.20 24.20 0%transportation 0.06 24.26 0%wastage@ 5% 1.21 25.47 2%Wholesaler (@30%) 7.64 33.11 15%wastage@ 2% 0.66 33.78 1%Retailer (50%) 16.89 50.67 33%wastage@ 2% 1.01 51.68 2%
Source: ISAP analysis from various stakeholders’ interaction
Table 38: Price Build-up of Khasi Mandarin from Farm Gate to End-consumer in Guwahati (per kg)
Assam LemonAssam lemon is a locally grown variety which is elongated in shape, unlike the north Indian lemon which is round in shape. Many farmers are growing it in the backyard of their houses but commercial level cultivation is also done to sell in the distant markets in Assam and neighbouring states.
Production Practices��
Farmers grow 10-20 plants in the backyard, for which they generally use their own planting material grown through stem cuttings and layering for propagation. The planting is carried out between the months of May and August before the onset of Monsoon. Nearly 800-900 plants are accommodated in one ha in a commercially managed orchard.
During the first year, 300-400 mandays are required approximately for farm operations such as cleaning, land preparation, planting etc., while in the subsequent years, 200-250 labour mandays are required for various farm operations.
Post-harvest Practices:��
Harvesting: � The plant starts bearing fruit in the second year, July to September is the peak time of harvesting. About 100-120 fruits are borne per tree under normal conditions. Fruit is borne during the entire year, off season fruit can be harvested in March. Nearly 8-10 percent of the fruit is lost at the field level due to insects, pests and diseases. Harvesting is done when the fruits gain full size.Value Addition at Farm Level: � Only packing in gunny/plastic bags is done.
Assam Lemon in Market in Assam
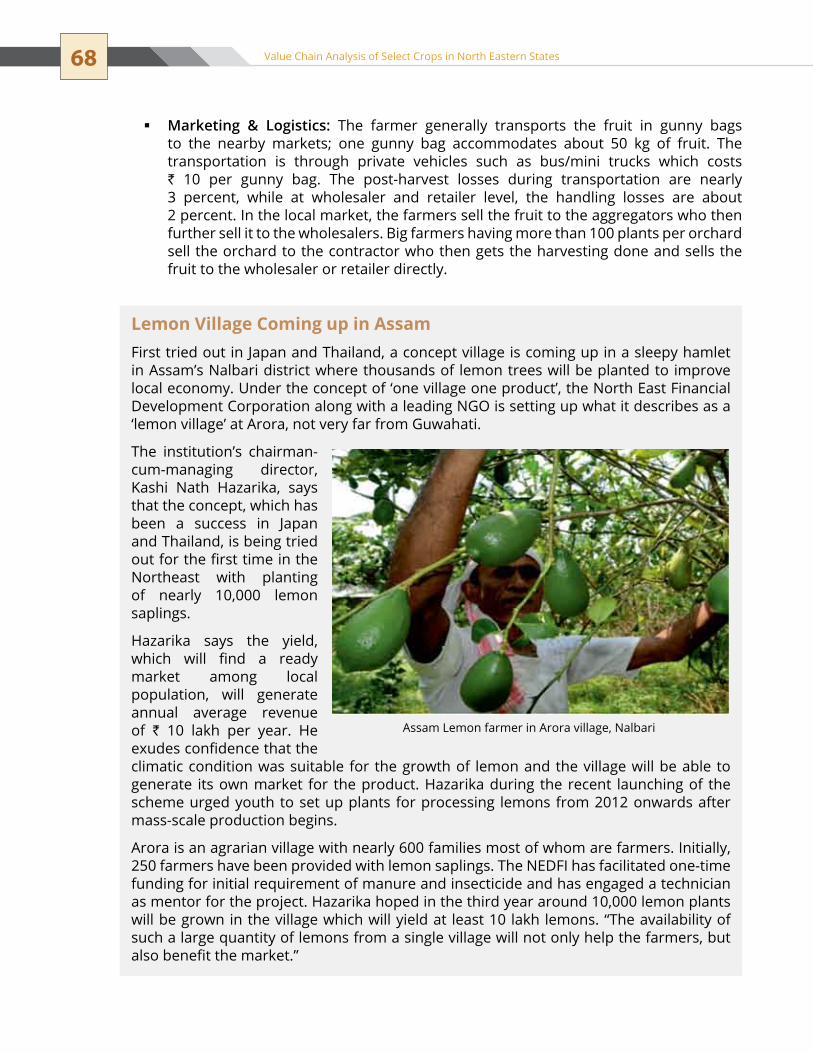
68 Value Chain Analysis of Select Crops in North Eastern States
Lemon Village Coming up in AssamFirst tried out in Japan and Thailand, a concept village is coming up in a sleepy hamlet in Assam’s Nalbari district where thousands of lemon trees will be planted to improve local economy. under the concept of ‘one village one product’, the North East Financial Development Corporation along with a leading NGO is setting up what it describes as a ‘lemon village’ at Arora, not very far from Guwahati.
The institution’s chairman-cum-managing director, Kashi nath Hazarika, says that the concept, which has been a success in Japan and thailand, is being tried out for the first time in the northeast with planting of nearly 10,000 lemon saplings.
Hazarika says the yield, which will find a ready market among local population, will generate annual average revenue of ` 10 lakh per year. He exudes confidence that the climatic condition was suitable for the growth of lemon and the village will be able to generate its own market for the product. Hazarika during the recent launching of the scheme urged youth to set up plants for processing lemons from 2012 onwards after mass-scale production begins.
Arora is an agrarian village with nearly 600 families most of whom are farmers. Initially, 250 farmers have been provided with lemon saplings. The NEDFI has facilitated one-time funding for initial requirement of manure and insecticide and has engaged a technician as mentor for the project. Hazarika hoped in the third year around 10,000 lemon plants will be grown in the village which will yield at least 10 lakh lemons. “The availability of such a large quantity of lemons from a single village will not only help the farmers, but also benefit the market.”
Assam Lemon farmer in Arora village, nalbari
Marketing & Logistics: � the farmer generally transports the fruit in gunny bags to the nearby markets; one gunny bag accommodates about 50 kg of fruit. The transportation is through private vehicles such as bus/mini trucks which costs ` 10 per gunny bag. The post-harvest losses during transportation are nearly 3 percent, while at wholesaler and retailer level, the handling losses are about 2 percent. In the local market, the farmers sell the fruit to the aggregators who then further sell it to the wholesalers. Big farmers having more than 100 plants per orchard sell the orchard to the contractor who then gets the harvesting done and sells the fruit to the wholesaler or retailer directly.

69Chapter 5 | Value Chain Analysis
Manipurtamenglong, Ukhrul and Chudachandpur are the major districts of citrus production in Manipur. Khasi Mandarin is the most important commercial citrus species grown up to an altitude of 1000 m above mean sea level and is the most popular cultivar in the region.
Production Practices��
on an average, there are 100-200 trees per family, out of which 60-70 percent are fruit-bearing trees. ICAR Research Centre at Imphal and KVKs are providing technical support for citrus cultivation in the state. The farmers buy the planting material (budded seedlings) from nurseries, the cost of which is around ` 10 per seedling. Approximately 300 seedlings of citrus are required for planting in one ha, planting is done at a distance of 5.5 X 5.5 m. Labour is employed for clearance of jungle and land development. After clearing the land, land preparation is done and digging and filling up of pits is carried out. All these operations are carried out by hired labour. After the filling up of the pits, the transplanting is carried out. For land preparation and planting operations, approximately 100-110 labourers are employed. The labour rates are ` 120 to ` 130 per manday.
During the subsequent years, the farmers do not employ much labour and farm operations like weeding etc are done manually by family members only. The application of manures, fertilisers and pesticides is negligible. However, nowadays some farmers have started applying lime in the fields. The orchards are rain-fed with no irrigation facitilities during the growth years.
Although, the package of practices has been developed by the research centre, farmers in the field are following traditional practices. Most of the citrus orchards in the state are very old and senile. yield of existing orchards can be improved significantly by rejuvenation. The state government has received a huge fund from Central government for citrus rejuvenation; however, a very limited difference is being seen on ground.
Post-harvest Practices:��
Harvesting: � A good bearing tree of 20 years can produce around 400-500 fruits (60-70 kg) per year. However, at the field level, due to not harvesting the fruit on time, the losses range from 10-20 percent.
Price Build-up Amount (in `) Price Markup (` Per 80 Piece) % contributionFarm gate price 80.00 80.00 40%Aggregator Margin @20% 16.00 96.00 8%Loading/unloading 1.00 97.00 1%transportation 5.00 102.00 3%wastage@ 3% 3.06 105.06 2%Wholesaler (@30%) 31.52 136.58 16%wastage@ 2% 2.73 139.31 1%Retailer (40%) 55.72 195.03 28%wastage@ 2% 3.90 198.93 2%
Source: ISAP analysis from various stakeholders’ interaction
Table 39: Price build-up of Assam lemon from Farm-gate in Boko to Guwahati (per 80 piece)

70 Value Chain Analysis of Select Crops in North Eastern States
Marketing & Logistics: � the harvested fruit is generally packed in jute bags at the farm level for transportation; one bag accommodates on an average 200 pieces (30-35 kg). The farmers take the produce to the markets in Imphal or tamenglong by jeep, depending upon the nearness to the market and sell it to the wholesalers. The transportation cost to Imphal (70-80 km) is ` 50 per bag of 200 pieces (30-35 kg), thus the per kg logistics cost is ` 1.50-1.80 per kg (` 0.25 per fruit).
occasionally the wholesalers buy the fruits from the farm gate itself and transport it to the market. In such cases, the transportation cost is borne by the wholesaler. upto the point the produce reaches the retailers, the wastages during handling range from 4-5 percent, while at the retailers end, due to rejection by customers, the losses vary from 5 to 8 percent.
the wholesale selling price of the fruit in Imphal is ` 250 per 100 pieces (15-17 kg) for good quality fruits, ` 120-150 per 100 pieces for average quality fruits and ` 70 per 100 pieces for poor quality fruits. The price also depends on seasonality and demand supply scenario. The retail price in the Imphal market is around ` 60-80 per kg (5-8 pieces).
Financial Assistance:Manipur has got special financial package of �� ` 218 crore from Prime Minister’s office for next five year for revival of citrus orchards in the state. In addition to the above, �� ` 1.5 cr has been approved for setting-up of pack-houses and ` 21 crore for processing unit (from DoNER, SFAC & MoFPI).
Farmers` 0.25 per fruit
` 0.25 per fruit
Markets in Imphal/Tamenglong
At farm gate
Contractors
Figure 66: Marketing Channel of Khasi Mandarin in Manipur
Price Build-up Amount (in `) Price Markup (` Per kg) % ContributionFarm gate price 16.00 16.00 39%Aggregator Margin @20% 3.20 19.20 8%Loading/unloading 0.20 19.40 0%transportation 0.06 19.46 0%wastage@ 5% 0.97 20.43 2%Wholesaler (@30%) 6.13 26.56 15%wastage@ 2% 0.53 27.09 1%Retailer (50%) 13.55 40.64 33%wastage@ 2% 0.81 41.45 2%
Source: ISAP analysis from various stakeholders’ interaction
Table 40: Price Build-up of Khasi Mandarin from Farm Gate to Imphal Market
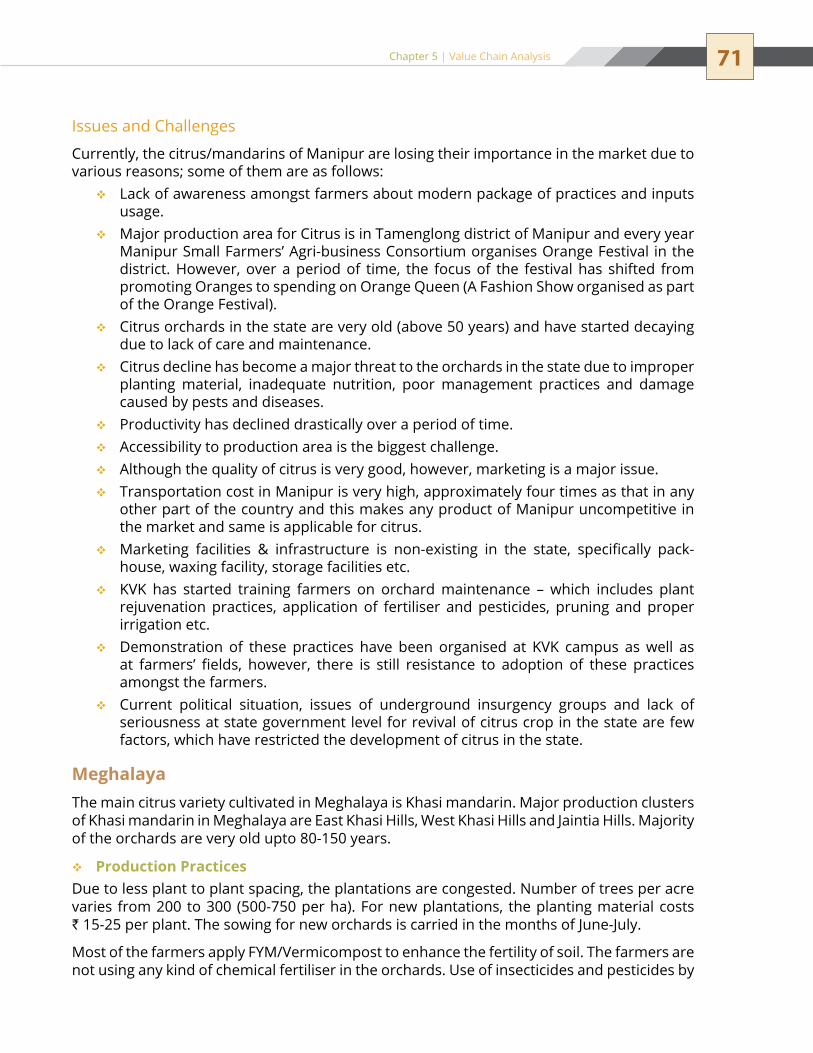
71Chapter 5 | Value Chain Analysis
Issues and Challenges
Currently, the citrus/mandarins of Manipur are losing their importance in the market due to various reasons; some of them are as follows:
Lack of awareness amongst farmers about modern package of practices and inputs ��
usage. Major production area for Citrus is in tamenglong district of Manipur and every year ��
Manipur Small Farmers’ Agri-business Consortium organises Orange Festival in the district. However, over a period of time, the focus of the festival has shifted from promoting Oranges to spending on Orange Queen (A Fashion Show organised as part of the Orange Festival).Citrus orchards in the state are very old (above 50 years) and have started decaying ��
due to lack of care and maintenance.Citrus decline has become a major threat to the orchards in the state due to improper ��
planting material, inadequate nutrition, poor management practices and damage caused by pests and diseases.Productivity has declined drastically over a period of time. ��
Accessibility to production area is the biggest challenge.��
Although the quality of citrus is very good, however, marketing is a major issue.��
transportation cost in Manipur is very high, approximately four times as that in any ��
other part of the country and this makes any product of Manipur uncompetitive in the market and same is applicable for citrus.Marketing facilities & infrastructure is non-existing in the state, specifically pack-��
house, waxing facility, storage facilities etc.KVK has started training farmers on orchard maintenance – which includes plant ��
rejuvenation practices, application of fertiliser and pesticides, pruning and proper irrigation etc.Demonstration of these practices have been organised at KVK campus as well as ��
at farmers’ fields, however, there is still resistance to adoption of these practices amongst the farmers.Current political situation, issues of underground insurgency groups and lack of ��
seriousness at state government level for revival of citrus crop in the state are few factors, which have restricted the development of citrus in the state.
MeghalayaThe main citrus variety cultivated in Meghalaya is Khasi mandarin. Major production clusters of Khasi mandarin in Meghalaya are East Khasi Hills, West Khasi Hills and Jaintia Hills. Majority of the orchards are very old upto 80-150 years.
Production Practices��
Due to less plant to plant spacing, the plantations are congested. Number of trees per acre varies from 200 to 300 (500-750 per ha). For new plantations, the planting material costs ` 15-25 per plant. The sowing for new orchards is carried in the months of June-July.
Most of the farmers apply FyM/Vermicompost to enhance the fertility of soil. The farmers are not using any kind of chemical fertiliser in the orchards. use of insecticides and pesticides by
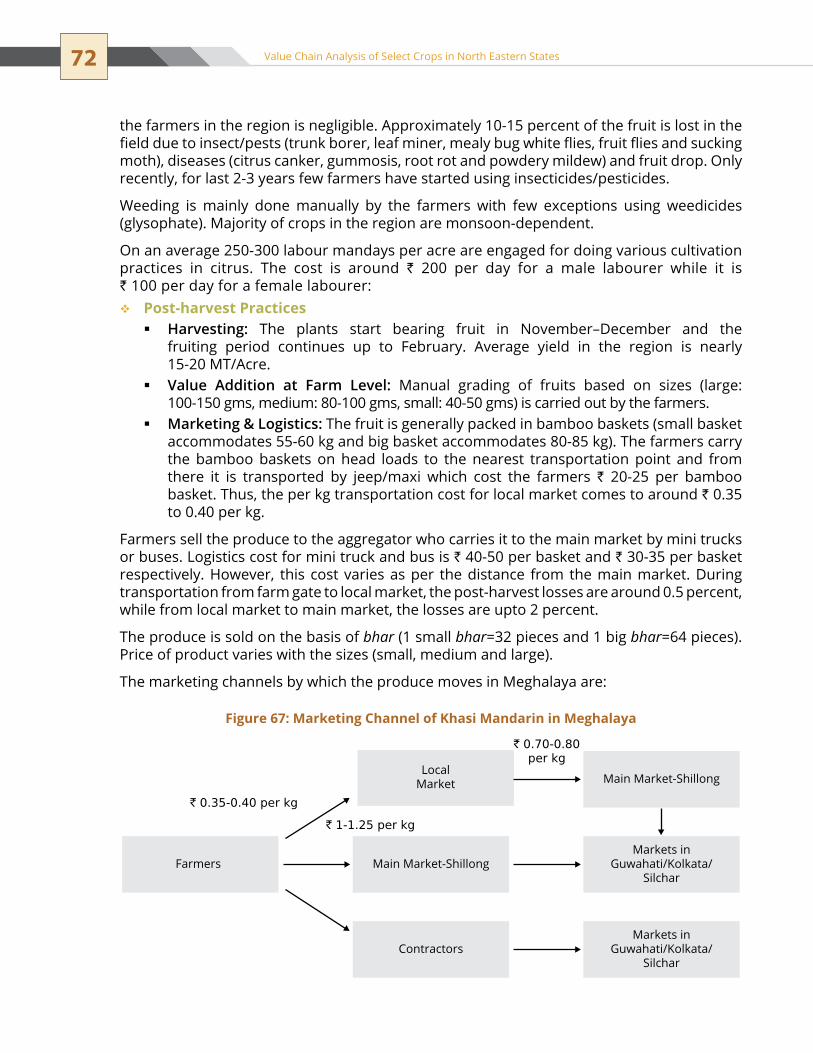
72 Value Chain Analysis of Select Crops in North Eastern States
the farmers in the region is negligible. Approximately 10-15 percent of the fruit is lost in the field due to insect/pests (trunk borer, leaf miner, mealy bug white flies, fruit flies and sucking moth), diseases (citrus canker, gummosis, root rot and powdery mildew) and fruit drop. Only recently, for last 2-3 years few farmers have started using insecticides/pesticides.
Weeding is mainly done manually by the farmers with few exceptions using weedicides (glysophate). Majority of crops in the region are monsoon-dependent.
On an average 250-300 labour mandays per acre are engaged for doing various cultivation practices in citrus. The cost is around ` 200 per day for a male labourer while it is ` 100 per day for a female labourer:
Post-harvest Practices��
Harvesting: � the plants start bearing fruit in november–December and the fruiting period continues up to February. Average yield in the region is nearly 15-20 MT/Acre. Value Addition at Farm Level: � Manual grading of fruits based on sizes (large: 100-150 gms, medium: 80-100 gms, small: 40-50 gms) is carried out by the farmers. Marketing & Logistics: � the fruit is generally packed in bamboo baskets (small basket accommodates 55-60 kg and big basket accommodates 80-85 kg). The farmers carry the bamboo baskets on head loads to the nearest transportation point and from there it is transported by jeep/maxi which cost the farmers ` 20-25 per bamboo basket. Thus, the per kg transportation cost for local market comes to around ` 0.35 to 0.40 per kg.
Farmers sell the produce to the aggregator who carries it to the main market by mini trucks or buses. Logistics cost for mini truck and bus is ` 40-50 per basket and ` 30-35 per basket respectively. However, this cost varies as per the distance from the main market. During transportation from farm gate to local market, the post-harvest losses are around 0.5 percent, while from local market to main market, the losses are upto 2 percent.
the produce is sold on the basis of bhar (1 small bhar=32 pieces and 1 big bhar=64 pieces). Price of product varies with the sizes (small, medium and large).
the marketing channels by which the produce moves in Meghalaya are:
Farmers
` 0.35-0.40 per kg
` 1-1.25 per kg
` 0.70-0.80per kg
LocalMarket
Contractors
Main Market-Shillong
Main Market-Shillong
Markets inGuwahati/Kolkata/
Silchar
Markets inGuwahati/Kolkata/
Silchar
Figure 67: Marketing Channel of Khasi Mandarin in Meghalaya
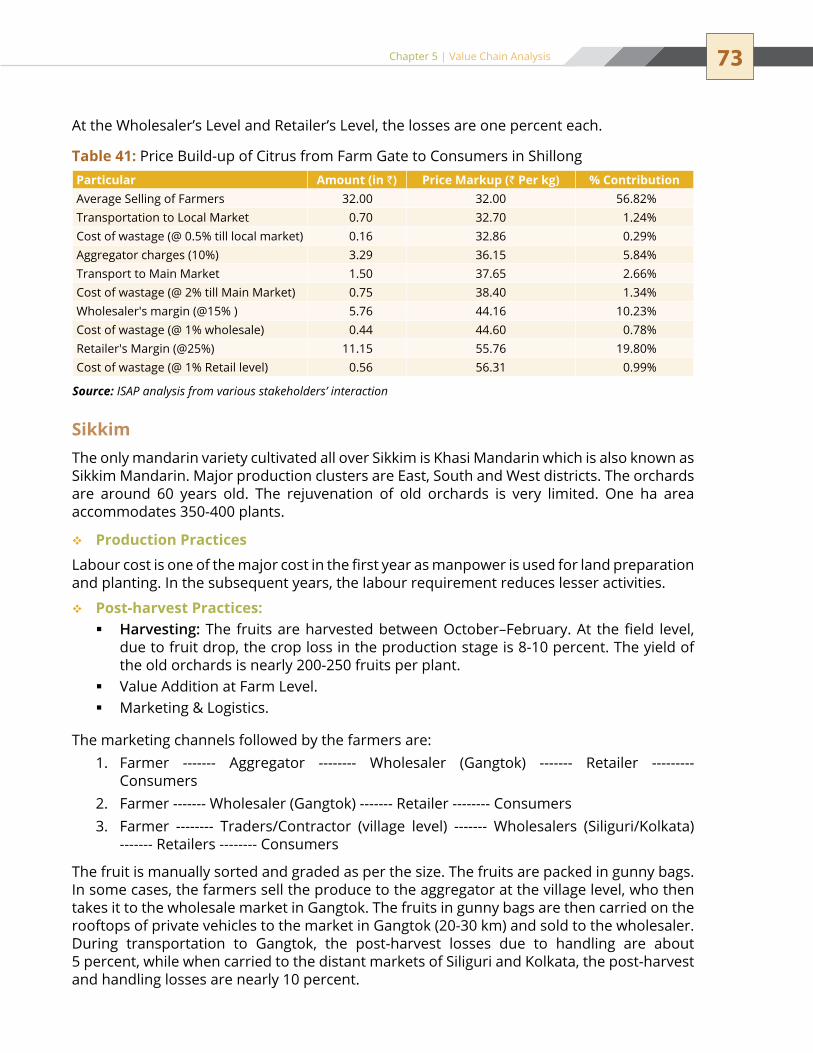
73Chapter 5 | Value Chain Analysis
At the Wholesaler’s Level and Retailer’s Level, the losses are one percent each.
Sikkimthe only mandarin variety cultivated all over sikkim is Khasi Mandarin which is also known as Sikkim Mandarin. Major production clusters are East, South and West districts. The orchards are around 60 years old. The rejuvenation of old orchards is very limited. One ha area accommodates 350-400 plants.
Production Practices��
Labour cost is one of the major cost in the first year as manpower is used for land preparation and planting. In the subsequent years, the labour requirement reduces lesser activities.
Post-harvest Practices:��
Harvesting: � The fruits are harvested between October–February. At the field level, due to fruit drop, the crop loss in the production stage is 8-10 percent. The yield of the old orchards is nearly 200-250 fruits per plant. Value Addition at Farm Level. �Marketing & Logistics. �
the marketing channels followed by the farmers are:Farmer ------- Aggregator -------- Wholesaler (Gangtok) ------- Retailer --------- 1. ConsumersFarmer ------- Wholesaler (Gangtok) ------- Retailer -------- Consumers2. Farmer -------- Traders/Contractor (village level) ------- Wholesalers (Siliguri/Kolkata) 3. ------- Retailers -------- Consumers
The fruit is manually sorted and graded as per the size. The fruits are packed in gunny bags. In some cases, the farmers sell the produce to the aggregator at the village level, who then takes it to the wholesale market in Gangtok. The fruits in gunny bags are then carried on the rooftops of private vehicles to the market in Gangtok (20-30 km) and sold to the wholesaler. During transportation to Gangtok, the post-harvest losses due to handling are about 5 percent, while when carried to the distant markets of Siliguri and Kolkata, the post-harvest and handling losses are nearly 10 percent.
Particular Amount (in `) Price Markup (` Per kg) % ContributionAverage Selling of Farmers 32.00 32.00 56.82%transportation to Local Market 0.70 32.70 1.24%Cost of wastage (@ 0.5% till local market) 0.16 32.86 0.29%Aggregator charges (10%) 3.29 36.15 5.84%transport to Main Market 1.50 37.65 2.66%Cost of wastage (@ 2% till Main Market) 0.75 38.40 1.34%Wholesaler's margin (@15% ) 5.76 44.16 10.23%Cost of wastage (@ 1% wholesale) 0.44 44.60 0.78%Retailer's Margin (@25%) 11.15 55.76 19.80%Cost of wastage (@ 1% Retail level) 0.56 56.31 0.99%
Source: ISAP analysis from various stakeholders’ interaction
Table 41: Price Build-up of Citrus from Farm Gate to Consumers in Shillong
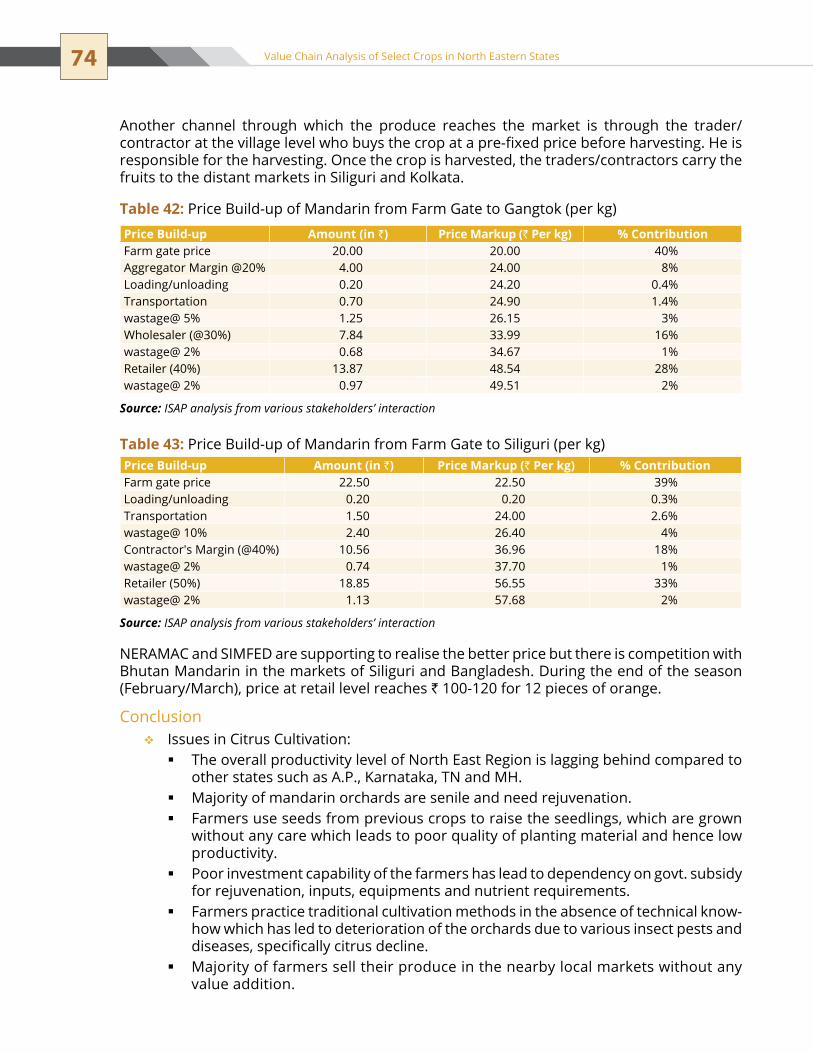
74 Value Chain Analysis of Select Crops in North Eastern States
Another channel through which the produce reaches the market is through the trader/contractor at the village level who buys the crop at a pre-fixed price before harvesting. He is responsible for the harvesting. Once the crop is harvested, the traders/contractors carry the fruits to the distant markets in Siliguri and Kolkata.
NERAMAC and SIMFED are supporting to realise the better price but there is competition with Bhutan Mandarin in the markets of Siliguri and Bangladesh. During the end of the season (February/March), price at retail level reaches ` 100-120 for 12 pieces of orange.
ConclusionIssues in Citrus Cultivation:��
the overall productivity level of north east Region is lagging behind compared to �other states such as A.P., Karnataka, TN and MH.Majority of mandarin orchards are senile and need rejuvenation. �Farmers use seeds from previous crops to raise the seedlings, which are grown �without any care which leads to poor quality of planting material and hence low productivity.Poor investment capability of the farmers has lead to dependency on govt. subsidy �for rejuvenation, inputs, equipments and nutrient requirements.Farmers practice traditional cultivation methods in the absence of technical know- �how which has led to deterioration of the orchards due to various insect pests and diseases, specifically citrus decline. Majority of farmers sell their produce in the nearby local markets without any �value addition.
Price Build-up Amount (in `) Price Markup (` Per kg) % ContributionFarm gate price 20.00 20.00 40%Aggregator Margin @20% 4.00 24.00 8%Loading/unloading 0.20 24.20 0.4%transportation 0.70 24.90 1.4%wastage@ 5% 1.25 26.15 3%Wholesaler (@30%) 7.84 33.99 16%wastage@ 2% 0.68 34.67 1%Retailer (40%) 13.87 48.54 28%wastage@ 2% 0.97 49.51 2%
Source: ISAP analysis from various stakeholders’ interaction
Table 42: Price Build-up of Mandarin from Farm Gate to Gangtok (per kg)
Price Build-up Amount (in `) Price Markup (` Per kg) % ContributionFarm gate price 22.50 22.50 39%Loading/unloading 0.20 0.20 0.3%transportation 1.50 24.00 2.6%wastage@ 10% 2.40 26.40 4%Contractor's Margin (@40%) 10.56 36.96 18%wastage@ 2% 0.74 37.70 1%Retailer (50%) 18.85 56.55 33%wastage@ 2% 1.13 57.68 2%
Source: ISAP analysis from various stakeholders’ interaction
Table 43: Price Build-up of Mandarin from Farm Gate to Siliguri (per kg)
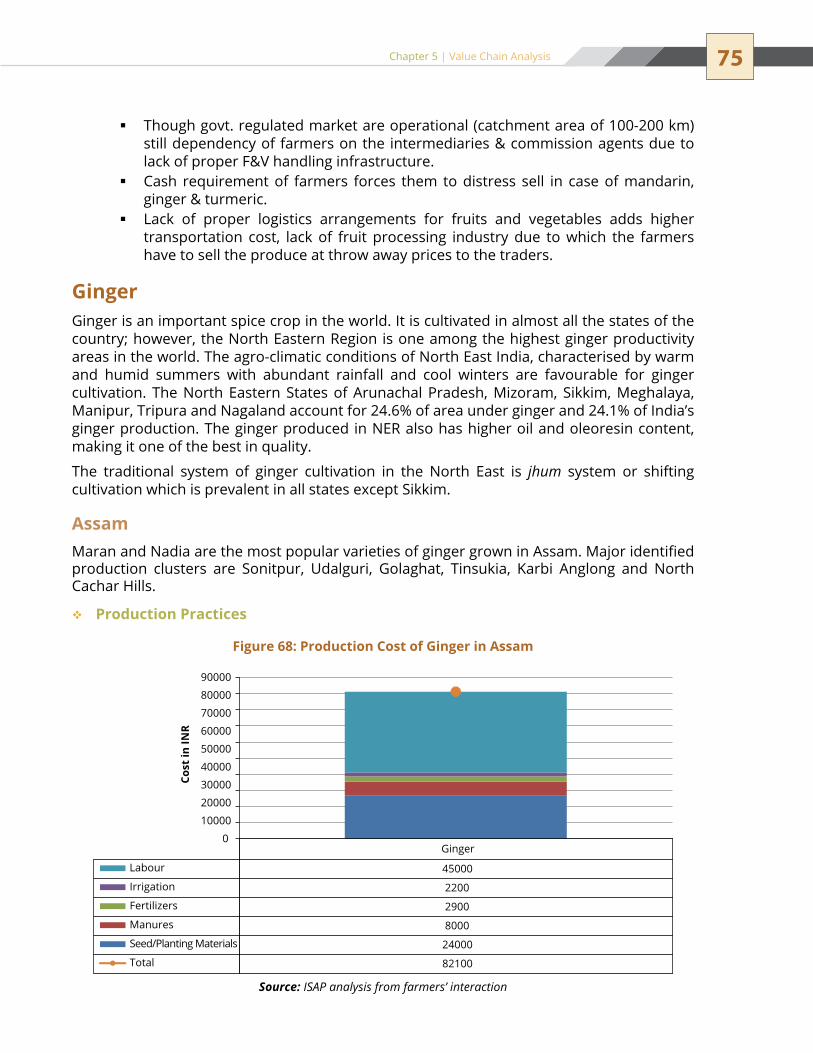
75Chapter 5 | Value Chain Analysis
Though govt. regulated market are operational (catchment area of 100-200 km) �still dependency of farmers on the intermediaries & commission agents due to lack of proper F&V handling infrastructure. Cash requirement of farmers forces them to distress sell in case of mandarin, �ginger & turmeric.Lack of proper logistics arrangements for fruits and vegetables adds higher �transportation cost, lack of fruit processing industry due to which the farmers have to sell the produce at throw away prices to the traders.
GingerGinger is an important spice crop in the world. It is cultivated in almost all the states of the country; however, the north eastern Region is one among the highest ginger productivity areas in the world. The agro-climatic conditions of North East India, characterised by warm and humid summers with abundant rainfall and cool winters are favourable for ginger cultivation. The North Eastern States of Arunachal Pradesh, Mizoram, Sikkim, Meghalaya, Manipur, Tripura and Nagaland account for 24.6% of area under ginger and 24.1% of India’s ginger production. The ginger produced in NER also has higher oil and oleoresin content, making it one of the best in quality.
the traditional system of ginger cultivation in the north east is jhum system or shifting cultivation which is prevalent in all states except Sikkim.
AssamMaran and Nadia are the most popular varieties of ginger grown in Assam. Major identified production clusters are Sonitpur, udalguri, Golaghat, Tinsukia, Karbi Anglong and North Cachar Hills.
Production Practices��
Figure 68: Production Cost of Ginger in Assam
Source: ISAP analysis from farmers’ interaction
Ginger
Labour 45000
Irrigation 2200
Fertilizers 2900
Manures 8000
Seed/Planting Materials 24000
Total 82100
0
10000
20000
30000
40000
50000
60000
70000
80000
90000
Cost
in IN
R

76 Value Chain Analysis of Select Crops in North Eastern States
Approximately 1 to 1.2 MT seed ginger is used for planting one ha area. Planting is carried out in month of March-April. The farmers generally do not use much fertiliser; those who can afford the fertilisers do apply it in small quantity. Nearly 300 labour mandays are required for various farm operations such as land preparation, weeding and harvesting. At the field level, the losses are nearly 8-10 percent of the crop value due to pests and diseases.
Post-harvest Practices:��
Harvesting: � Harvesting of the rhizomes starts in october which continues till January. Value Addition at Farm Level: � the farmers do the cleaning, washing and packing of the rhizomes before taking it to the markets. The rhizomes are packed in gunny bags which accommodates 50 kg each. Marketing & Logistics: � the farmer usually sells the rhizome to the aggregator at the village level, who then takes it to the main market where it is sold to the wholesaler. The post-harvest and handling loss during transportation and at wholesaler’s and retailer’s level is about 2 percent each.
The yield comes to 8-10 MT per ha. Thus, the production cost per kg comes to be ` 10 per kg. the average selling price of the farmer is ̀ 12-15, thus the farmer earns about ̀ 14000 per ha. Excluding the cost of family labour add to more profit.
Most prevailing marketing channel of ginger in the region is as below:
In most ginger growing districts except Karbi Anglong, farmers are not realising better price due to involvement of aggregators and farmers’ inability to sell the produce directly in the markets. Established ginger pack house is yet to be utilised so that farmers can supply directly to pack house.
Farmers Aggregators
At farm gate ` 0.8 per/kg
Market in Guwahati
Figure 69: Marketing Channel of Ginger in Assam
Table 44: Price Build-up of Ginger from Farm Gate in Boko to Guwahati (per kg)Price Build-up Amount (in `) Price Markup (` Per kg) % ContributionFarm gate price 10.00 10.00 34%Aggregator Margin @30% 3.00 13.00 10%Loading/unloading 0.40 13.40 1%transportation 0.80 14.20 3%wastage@ 2% 0.28 14.48 1%Wholesaler (@30%) 4.35 18.83 15%wastage@ 2% 0.38 19.21 1%Retailer (50%) 9.60 28.81 33%wastage@ 2% 0.58 29.38 2%
Source: ISAP analysis from various stakeholders’ interaction

77Chapter 5 | Value Chain Analysis
MeghalayaIn Meghalaya, ginger is cultivated on slopes. The most popular varieties under cultivation are Nadia and Vara in the identified major cluster of Ri Bhoi, East Garo Hills and West Garo Hills. Nadia is popular due to its low fibre content.
Production Practices��
Farmers generally use their own seeds (rhizomes) for cultivation purpose. The seed rate varies from 1 MT to 1.5 MT per ha. Sowing is mainly carried out in the month of April-May in the region and harvesting starts from November and goes on up to January. Farmers apply FyM/Vermicompost at the rate of 5-6 MT per ha. use of chemical fertilisers, insecticides/pesticides or weedicides is not practiced by the farmers in the region.
the farmers usually spread the straw, grasses and other plant residues on the ginger beds immediately after planting. This acts as mulch which protects the seedlings from rain, prevents weed growth, keeps the soil moist and soft and accelerates plant growth.
The crop is monsoon-dependent. Weeding is mainly done manually by the farmers. During the entire season from May to January, labour is employed for land preparation, intercultural operations and harvesting. The labour mandays used for ginger cultivation in 1 ha area range from 200 to 250. The rate of a male labour is ̀ 200 per day, while a female labourer charges ̀ 100 per day. In the field, the losses due to insects, pests and diseases range from 1-2 percent.
Post-harvest Practices:��
Harvesting: � Ginger attains harvest maturity in 8-9 months. Hence, the peak harvest starts from November and extends till January. On an average, 8-10 MT of ginger is harvested from a hectare. Value Addition at Farm Level: � Farmers carry out the manual grading of rhizomes based on size (small, medium and large). Price of rhizomes varies with size. Most of the farmers sell the produce to the middlemen or aggregator or the trader from the distant market in the village itself. The rhizomes are packed in gunny bags of size 50 kg which costs the farmers ` 15-20 per gunny bag. Marketing & Logistics: � the marketing channels followed by the farmers are as follows:
Farmers
` 0.60/kg
Aggregators Market in Shillong
Contractor/Trader
Markets in Guwahati,Kolkata, Silchar
etc.
Figure 70: Marketing Channel of Ginger in Meghalaya

78 Value Chain Analysis of Select Crops in North Eastern States
the farmers sell the ginger on the basis of rhizome size; small sized rhizomes for ` 5-6 per kg, medium sized for ` 8-10 per kg and large sized rhizomes for 12-15 per kg.
the aggregator/middlemen then carry the produce to the main market where it is sold to the wholesaler who sells it further to the retailer. The traders from other states i.e, Guwahati, Kolkata and Silchar, who come to the farm gate to collect the produce, carry the ginger to their respective markets in the state to sell it to the wholesalers and retailers. The transportation cost of one gunny bag from the village to the main market by jeep/bus varies between ` 30-40 depending on the distance. At the wholesaler’s level and retailers’ level, the post-harvest losses vary from 0.5 to 1 percent due to handling.
the table above shows net loss of ` 11,000-29,000 per hectare, this loss is mainly due to consideration of high labour cost, which is in most of the cases, farmer’s own family working
Sl. No. Particular Amount (in `) 1 Planting Material (1-1.5 MT/ha) 60,0002 Manures (5-6 MT/ha) 9,0003 Fertilizers & Pesticides 04 Irrigation 05 Labour (including family labour) 50,0006 total Production cost 1,19,0007 Average production cost (` Per kg) 13.58 yield (in MT/ha) 99 Average selling price (` Per kg) 10-12
10 Total income per ha. (in `) 90,000-108,000 11 net loss (` per ha.) 11, 000-29,000
Source: ISAP analysis from farmers’ interaction
Table 45: Cost Economics of Ginger Cultivation in Meghalaya
Particulars Amount (in `) Price Markup (` Per kg)
% Contribution
Production Cost 13.5 13.5*Average Selling price of Farmers 12 12 44.64%Loading/unloading 0.4 12.4 1.49%Carriage Cost (Gunny Bags ` 20 per 50 kg bag) 0.4 12.8 1.49%Middlemen/Aggregator charges (10-15%) 1.86 14.66 6.92%transport to Main Market (` 30-40 per 50 kg gunny bag)
0.6 15.26 2.23%
Wholesaler's margin (25-30%) 4.46 19.72 16.59%Cost of wastage (@ 0.5% wholesale) 0.1 19.82 0.37%Retailer's Margin (30-35%) 6.8 26.62 25.30%Cost of wastage (@ 1% Retail level) 0.26 26.88 0.97%
* After reducing the family labour cost, cost of production comes below the farm gate price.Source: ISAP analysis from various stakeholders’ interaction
Table 46: Cost Build-up of Ginger from Farm Gate to Consumers

79Chapter 5 | Value Chain Analysis
in the field. If own labour is deducted, cultivation of ginger turns profitable. Similarly, manure used by the farmers is also not purchased from the market, it is mainly dung collected from domestic animals.
SikkimMajor production belts in all four districts of sikkim are as below:
North Sikkim: Lower Rongong, Lingdok, Nampatam, Nadey, Passingdong, Lum, Gor, Sangtok
East Sikkim: Whole area
South Sikkim: Poklok, Kamrang, namchi, singithang, namthang, Rateypani, Melli, Barfung, Rangyang, ynagyang, Temi, Namphing
West Sikkim: tikjyek, Lungik, Rathang, tikpur, Ambotey, Lower Buriokhop
Ginger is grown in all four districts upto 6000 mt. altitude hence production is less in North District which has higher altitudes. It is one of the major spice crops in the region which contributes 14 percent to the total ginger production on the North Eastern Region.
Production Practices��
Local varieties Bhaisey, Majaole and Gurubathaney etc. are used for cultivation. Farmers use the seed rhizomes preserved in the last season for the sowing purpose. The horticulture department also distributes seeds free of cost to the farmers but only a few farmers get the free seeds. In case, the farmer needs to buy the seed from the market, in the peak season, the cost reaches ` 1000 per 25 kg bag (` 40 per kg). The sowing of the seed rhizome is carried out in the February-end which extends up to April-end.
Farmers do apply FyM in the fields. Some farmers who have their own vermicompost units built with the subsidy from the Government Department use vermicompost as per the availability.
sikkim has been declared as an organic state, hence the use of chemicals and fertilisers is not allowed. A limited quantity of biofertilisers and biopesticides supplied by the govt. department are used, however, the farmers are reluctant to buy the organic fertilisers from the market. The crop is mainly rain-fed as irrigation facilities are limited in the state. Availability of labour for agriculture purpose is also a constraint. The labour requirement is 350-400 mandays which includes family labour. The manday cost is ` 150 per day plus one time food. No major insects, pests or diseases have been noticed in the area. However, sometimes there is damage due to soft rot. The losses during the production at the field level are about 5-6 percent.
the Horticulture Department is now supplying seed rhizomes of improved varieties which have minimised the occurrence of the diseases and insects and pests.
Post Harvest Practices:��
Harvesting: � the harvesting of rhizomes is carried out in october and continues up to January. The yield in one ha area is 5-6 MT of ginger rhizomes. Value Addition at Farm Level: � the farmer carries out the cleaning and washing of the rhizomes at the field level which are then packed in gunny bags. A small gunny bag which accommodates 25 kg costs ` 10.
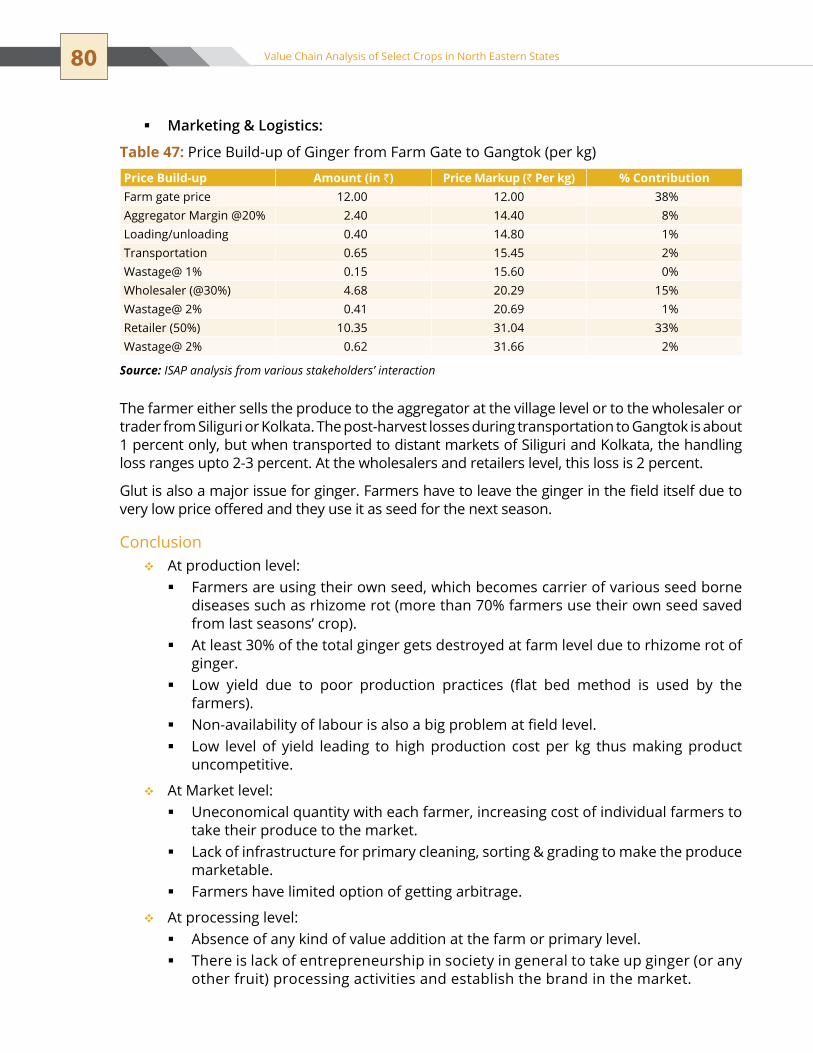
80 Value Chain Analysis of Select Crops in North Eastern States
Marketing & Logistics: �
the farmer either sells the produce to the aggregator at the village level or to the wholesaler or trader from Siliguri or Kolkata. The post-harvest losses during transportation to Gangtok is about 1 percent only, but when transported to distant markets of siliguri and Kolkata, the handling loss ranges upto 2-3 percent. At the wholesalers and retailers level, this loss is 2 percent.
Glut is also a major issue for ginger. Farmers have to leave the ginger in the field itself due to very low price offered and they use it as seed for the next season.
ConclusionAt production level:��
Farmers are using their own seed, which becomes carrier of various seed borne �diseases such as rhizome rot (more than 70% farmers use their own seed saved from last seasons’ crop).At least 30% of the total ginger gets destroyed at farm level due to rhizome rot of �ginger.Low yield due to poor production practices (flat bed method is used by the �farmers).Non-availability of labour is also a big problem at field level. �Low level of yield leading to high production cost per kg thus making product �uncompetitive.
At Market level:��
uneconomical quantity with each farmer, increasing cost of individual farmers to �take their produce to the market.Lack of infrastructure for primary cleaning, sorting & grading to make the produce �marketable.Farmers have limited option of getting arbitrage. �
At processing level:��
Absence of any kind of value addition at the farm or primary level. �there is lack of entrepreneurship in society in general to take up ginger (or any �other fruit) processing activities and establish the brand in the market.
Price Build-up Amount (in `) Price Markup (` Per kg) % ContributionFarm gate price 12.00 12.00 38%Aggregator Margin @20% 2.40 14.40 8%Loading/unloading 0.40 14.80 1%transportation 0.65 15.45 2%Wastage@ 1% 0.15 15.60 0%Wholesaler (@30%) 4.68 20.29 15%Wastage@ 2% 0.41 20.69 1%Retailer (50%) 10.35 31.04 33%Wastage@ 2% 0.62 31.66 2%
Source: ISAP analysis from various stakeholders’ interaction
Table 47: Price Build-up of Ginger from Farm Gate to Gangtok (per kg)

81Chapter 5 | Value Chain Analysis
Turmericturmeric is the dried rhizome of Curcuma Longa L. which is used as a condiment, flavouring and colouring agent, is a principal ingredient in the Indian kitchens as curry powder. The turmeric derives its taste, aroma and colour from its active ingredient ‘curcumin’ which is the principal phenol responsible for the yellow colour and medicinal characteristics of turmeric. The higher the curcumin content, the better the turmeric variety.
AssamKamrup, Barpeta, Sonitpur, Nagaon, Baksa, Golaghat, Lakhimpur and Karbi Anglong are major identified production clusters for Assam. Most of the farmers use locally grown varieties which are not recommended by the Agriculture Department but give good yield.
Production Practices��
Aamda and Lakadang are the identified varieties grown by the farmers. A seed rate of 12 quintals per ha is used for planting which costs the farmers ` 25 per kg seed. The sowing of the seeds is carried out in the months of March-April. Farmers either use their own seed preserved during the last season or buy the seed rhizome from the market. About 300 labour mandays are required for carrying out various farm operations.
As per the discussions with the farmers during FGDs, the following cost of production has been estimated:
Post-harvest Practices:��
Harvesting: � the harvesting begins in the month of november, which extends till January. The yield is 6 -7 MT of rhizome per ha.
Figure 71: Production Cost of Turmeric in Assam
Source: ISAP analysis from farmers’ interaction
Turmeric
Labour 45000
Irrigation 2200
Fertilizers 3700
Manures 6000
Seed/Planting Materials 30000
Total 86900
0100002000030000400005000060000700008000090000
100000
Cost
in IN
R

82 Value Chain Analysis of Select Crops in North Eastern States
Value Addition at Farm Level: � Few farmers sell rhizomes after curing it. Marketing & Logistics. �
The farmers generally sell the rhizomes to the aggregator at the village level. The marketing channel followed by the farmers is:
Farmers -------- Aggregators ---------- Wholesalers --------- Retailers -------- Consumers1.
At the production level, due to insect pests and diseases, the crop loss is nearly 5 -6 percent while during transportation, the loss is 1-2 percent.
Farmers sell the turmeric at field level to aggregators who further carry it to Guwahati market by mini trucks and sell to wholesalers. It is supplied to other markets in Assam also from Guwahati.
MeghalayaThe major production clusters that have been identified in Meghalaya are Jaintia Hills and West Garo Hills. Lakadang is main popular variety, which is a much sought after variety by the extraction industry due to its high curcumin content (<5.5%).
Production Practices��
The sowing of turmeric is carried out on beds on slopes. usually farmers use their own seeds (rhizomes) preserved from the previous season’s crop for cultivation purpose. The seed rate varies from 0.8 to 1 MT per ha. For sowing, both the mother rhizomes and fingers are used. Sowing in the region is carried out in the month of April-May. Farmers apply only FyM/Vermicompost @5-8 MT per ha during the entire cropping season. No chemical fertilisers, insecticides/pesticides or weedicides are applied by the farmers in the region. The crop is monsoon-dependent. Weeding is mainly done manually by the farmers.
Figure 72: Marketing Channel of Turmeric in Assam
Farmers Aggregators
At farm gate ` 0.8/kg
Market in Guwahati
Price Build-up Amount (in `) Price Markup (` Per kg) % ContributionFarm gate price 20.00 20.00 41%Aggregator Margin @25% 5.00 25.00 10%Loading/unloading 0.40 25.40 1%transportation 0.80 26.20 2%Wastage@ 2% 0.52 26.72 1%Wholesaler (@30%) 8.02 34.74 16%Retailer (40%) 13.90 48.64 29%
Source: ISAP analysis from various stakeholders’ interaction
Table 48: Price Build-up from Farm Gate Boko to Guwahati
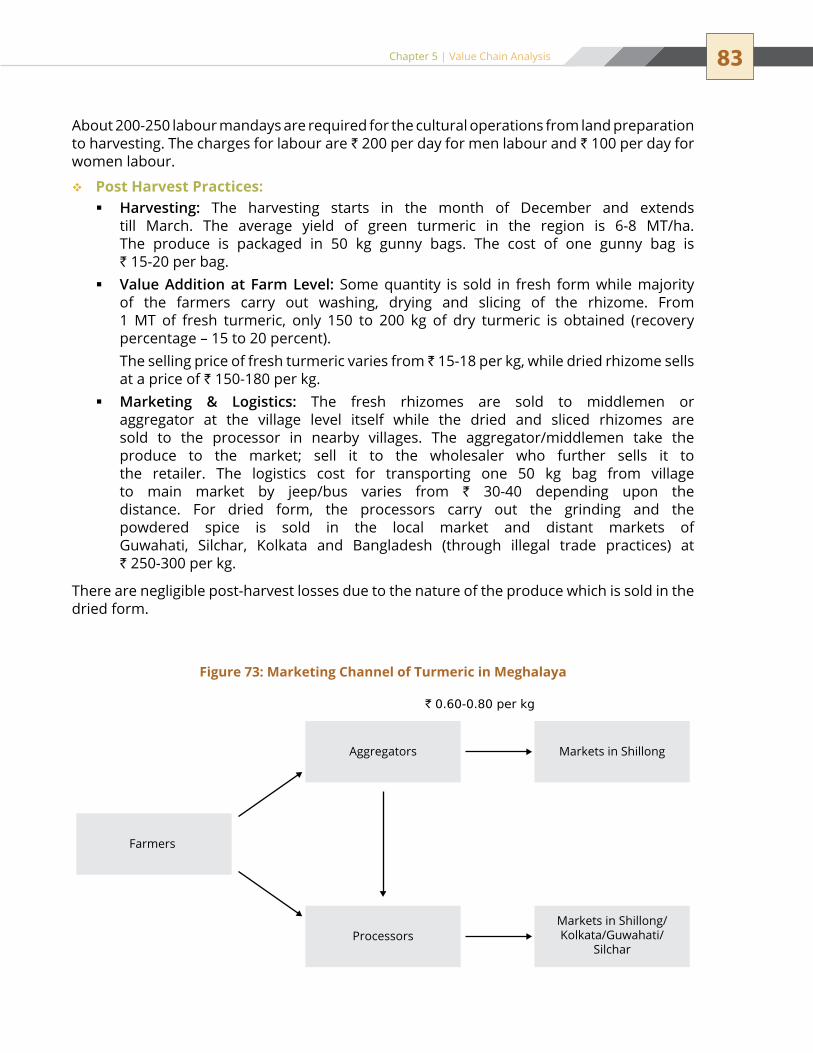
83Chapter 5 | Value Chain Analysis
About 200-250 labour mandays are required for the cultural operations from land preparation to harvesting. The charges for labour are ` 200 per day for men labour and ` 100 per day for women labour.
Post Harvest Practices:��
Harvesting: � the harvesting starts in the month of December and extends till March. The average yield of green turmeric in the region is 6-8 MT/ha. The produce is packaged in 50 kg gunny bags. The cost of one gunny bag is ` 15-20 per bag. Value Addition at Farm Level: � Some quantity is sold in fresh form while majority of the farmers carry out washing, drying and slicing of the rhizome. From 1 MT of fresh turmeric, only 150 to 200 kg of dry turmeric is obtained (recovery percentage – 15 to 20 percent).
the selling price of fresh turmeric varies from ̀ 15-18 per kg, while dried rhizome sells at a price of ` 150-180 per kg. Marketing & Logistics: � the fresh rhizomes are sold to middlemen or aggregator at the village level itself while the dried and sliced rhizomes are sold to the processor in nearby villages. The aggregator/middlemen take the produce to the market; sell it to the wholesaler who further sells it to the retailer. The logistics cost for transporting one 50 kg bag from village to main market by jeep/bus varies from ` 30-40 depending upon the distance. For dried form, the processors carry out the grinding and the powdered spice is sold in the local market and distant markets of Guwahati, Silchar, Kolkata and Bangladesh (through illegal trade practices) at ` 250-300 per kg.
there are negligible post-harvest losses due to the nature of the produce which is sold in the dried form.
Farmers
` 0.60-0.80 per kg
Aggregators Markets in Shillong
ProcessorsMarkets in Shillong/Kolkata/Guwahati/
Silchar
Figure 73: Marketing Channel of Turmeric in Meghalaya

84 Value Chain Analysis of Select Crops in North Eastern States
Sl. No. Particular Amount (in `) 1 Planting Material (0.8-1 MT/ha) 40,0002 Manures (5-8 MT/ha) 12,0003 Fertilisers & Pesticides 04 Irrigation 05 Labour (including family labour) 50,0006 total Production cost 102,0007 Average production cost (` Per kg) 12.758 yield (in MT/ha) 89 Average selling price (` Per kg) 15 -18
10 total income per ha (in `) 120,000-144,000 11 net gain (` per ha) 18, 000-42,000
Source: ISAP analysis from farmers’ interaction
Table 49: Cost-economics of turmeric Cultivation in Meghalaya
Particular Amount (in `)
Price Markup (` Per kg)
% Contribution
Production Cost 12.75 12.75Average Selling of Farmers 18.00 18.00 45.45%Carriage Cost (Gunny Bags ` 20 per 50 kg bag) 0.40 18.40 1.01%Middlemen/Aggregator charges (10-15%) 2.76 21.16 6.97%transport to Main Market (` 30-40 per 50 kg gunny bag)
0.60 21.76 1.52%
Wholesaler's margin (30% ) 6.53 28.29 16.48%Retailer's Margin (40%) 11.32 39.60 28.57%
Source: ISAP analysis from various stakeholders’ interaction
Table 50: Cost Build-up of Turmeric (1 kg) from Farm Gate to Consumers
MizoramIn Mizoram, Reiek village in Mamit district is very famous for turmeric cultivation. Mamit is the largest turmeric producing district in Mizoram. Other identified clusters are Saiha, Champhai, Kolasib and Serchhip.
Production Practices��
The varieties used are Lakadong and RCT-I. The Horticulture Department is supplying the RCT-I planting material (rhizomes) to few selected farmers. The seed rate used is 6-8 quintals per ha which yields around 4-5 MT of finished product.
Sowing is done in the month of February and March. No fertiliser and other chemical use have been noticed. Labourers are mainly family members. About 150-200 mandays per ha are required for farm operations from field preparation to harvesting. The labour charges are ` 200/manday for hired labour.
Post-harvest Practices:��
Harvesting: � The crop is harvested from December to April; December and January are the peak harvesting months. During the crop production and harvesting, the losses due to shoot borer are nearly 10 percent. The selling price of the fresh rhizomes is ` 15 per kg.

85Chapter 5 | Value Chain Analysis
Value Addition at Farm Level: � Farmers do the cleaning, washing, curing and drying after harvesting and then pack the rhizomes in plastic bags. The plastic bags with small quantities of produce are carried on the roof of the passenger vehicles by the farmers to the nearby city or town. Marketing & Logistics: � the transportation cost for transporting to a distance of 3-40 km is ` 30 per 30-40 kg plastic bag. Aggregators and traders carry full truck loads of the cured and dried turmeric in Tata 407 which accommodates 2.5-3 MT, to Aizawl market and other neighbouring markets in Assam. The logistics cost till Aizawl market is ` 2500-3000 per truck load and up to Silchar it is ` 8000 per truck load. The losses during transit range from 1-2 percent when carrying to Aizawl market and 3-4 percent when carrying to Silchar market. The handling losses at the wholesaler’s and retailers’ level are approximately 1 percent.
Marketing channels: Farmers-Middleman (village level)-Local wholesale markets in Mizoram-retailers-1. consumersFarmers-Local wholesale markets in Mizoram-retailers-consumers2. Farmers-Traders/contractors (from neighbouring districts of Assam, Silchar, Karimganj 3. etc.)-wholesale markets-retailers-consumers
Farmers
` 0.80-1.0 per kg
` 1 per kg
` 2.50-3 per kg
Aggregators
Local markets in Aizawl
Contractors Markets in Silchar, Cachar etc.
Figure 74: Marketing Channel of Turmeric in Mizoram
Particular Amount (in `) Price Mark-up (` Per Piece)
% Contribution
Average selling price of farmers 15.00 15.00 42%Aggregator Margin (@20%) 3.00 18.00 8%transport to Aizawl 1.00 19.00 3%Cost of wastage (@ 1% till Main Market) 0.19 19.19 1%Wholesaler's Margin @ 30% 5.76 24.95 16%Wastage (@ 1% wholesale level) 0.25 25.20 1%Retailer's Margin (@40%) 10.08 35.28 28%Wastage (@ 1% retail level) 0.35 35.63 1%
Source: ISAP analysis from various stakeholders’ interaction
Table 51: Price Build-up of Turmeric from Farm Gate to Aizawl Market (per piece)
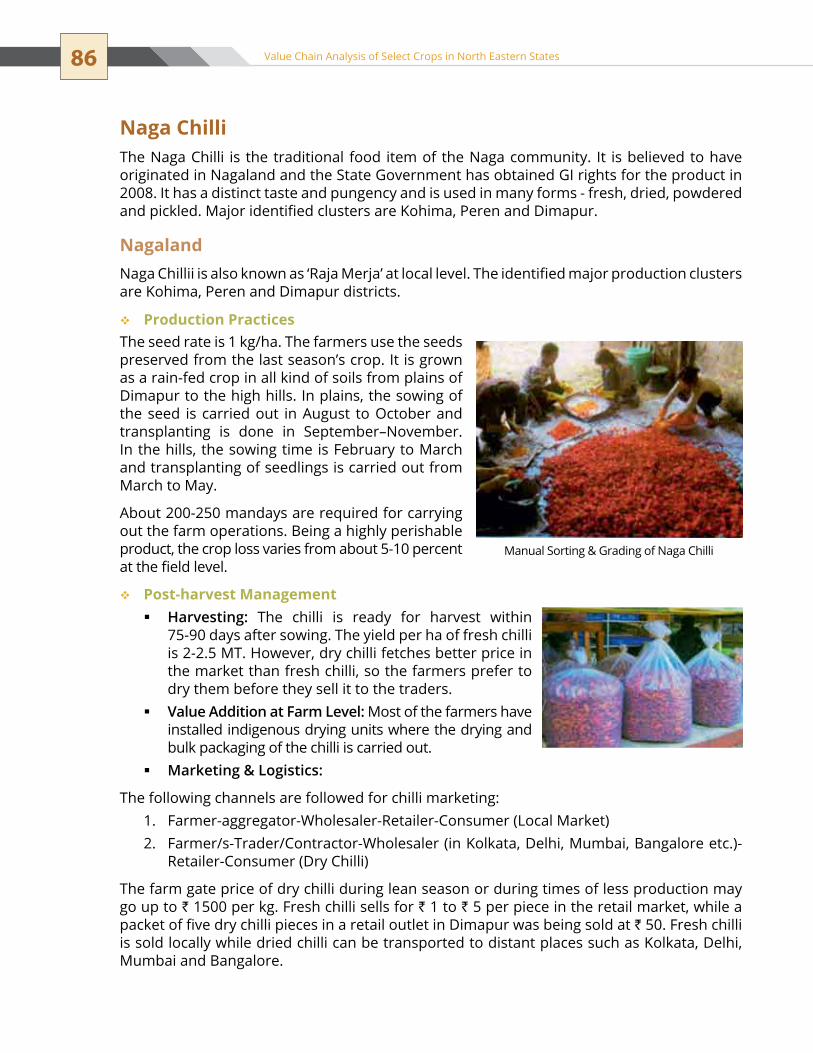
86 Value Chain Analysis of Select Crops in North Eastern States
Naga ChilliThe Naga Chilli is the traditional food item of the Naga community. It is believed to have originated in Nagaland and the State Government has obtained GI rights for the product in 2008. It has a distinct taste and pungency and is used in many forms - fresh, dried, powdered and pickled. Major identified clusters are Kohima, Peren and Dimapur.
NagalandNaga Chillii is also known as ‘Raja Merja’ at local level. The identified major production clusters are Kohima, Peren and Dimapur districts.
Production Practices��
The seed rate is 1 kg/ha. The farmers use the seeds preserved from the last season’s crop. It is grown as a rain-fed crop in all kind of soils from plains of Dimapur to the high hills. In plains, the sowing of the seed is carried out in August to october and transplanting is done in September–November. In the hills, the sowing time is February to March and transplanting of seedlings is carried out from March to May.
About 200-250 mandays are required for carrying out the farm operations. Being a highly perishable product, the crop loss varies from about 5-10 percent at the field level.
Post-harvest Management��
Harvesting: � the chilli is ready for harvest within 75-90 days after sowing. The yield per ha of fresh chilli is 2-2.5 MT. However, dry chilli fetches better price in the market than fresh chilli, so the farmers prefer to dry them before they sell it to the traders. Value Addition at Farm Level: � Most of the farmers have installed indigenous drying units where the drying and bulk packaging of the chilli is carried out.Marketing & Logistics: �
the following channels are followed for chilli marketing: Farmer-aggregator-Wholesaler-Retailer-Consumer (Local Market)1. Farmer/s-Trader/Contractor-Wholesaler (in Kolkata, Delhi, Mumbai, Bangalore etc.)-2. Retailer-Consumer (Dry Chilli)
the farm gate price of dry chilli during lean season or during times of less production may go up to ` 1500 per kg. Fresh chilli sells for ` 1 to ` 5 per piece in the retail market, while a packet of five dry chilli pieces in a retail outlet in Dimapur was being sold at ` 50. Fresh chilli is sold locally while dried chilli can be transported to distant places such as Kolkata, Delhi, Mumbai and Bangalore.
Manual Sorting & Grading of Naga Chilli
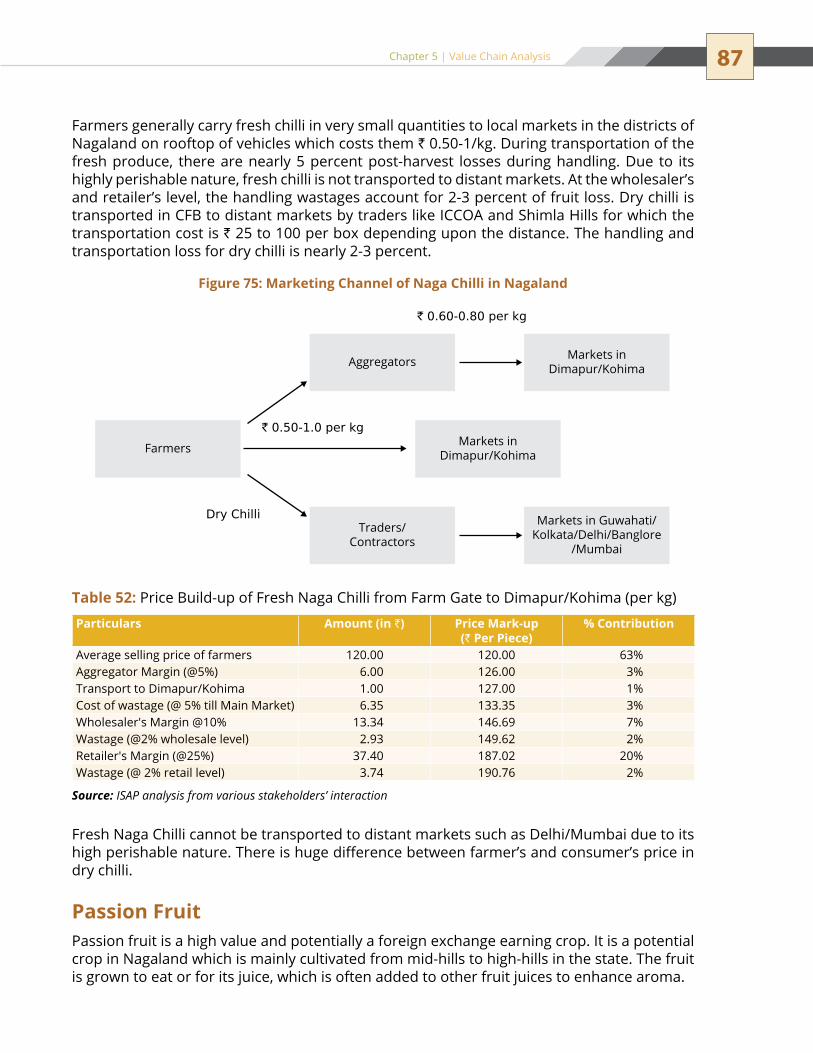
87Chapter 5 | Value Chain Analysis
Farmers generally carry fresh chilli in very small quantities to local markets in the districts of nagaland on rooftop of vehicles which costs them ` 0.50-1/kg. During transportation of the fresh produce, there are nearly 5 percent post-harvest losses during handling. Due to its highly perishable nature, fresh chilli is not transported to distant markets. At the wholesaler’s and retailer’s level, the handling wastages account for 2-3 percent of fruit loss. Dry chilli is transported in CFB to distant markets by traders like ICCOA and Shimla Hills for which the transportation cost is ` 25 to 100 per box depending upon the distance. The handling and transportation loss for dry chilli is nearly 2-3 percent.
Farmers
` 0.60-0.80 per kg
` 0.50-1.0 per kg
Dry Chilli
Aggregators
Markets inDimapur/Kohima
Traders/Contractors
Markets inDimapur/Kohima
Markets in Guwahati/Kolkata/Delhi/Banglore
/Mumbai
Figure 75: Marketing Channel of Naga Chilli in Nagaland
Particulars Amount (in `) Price Mark-up (` Per Piece)
% Contribution
Average selling price of farmers 120.00 120.00 63%Aggregator Margin (@5%) 6.00 126.00 3%transport to Dimapur/Kohima 1.00 127.00 1%Cost of wastage (@ 5% till Main Market) 6.35 133.35 3%Wholesaler's Margin @10% 13.34 146.69 7%Wastage (@2% wholesale level) 2.93 149.62 2%Retailer's Margin (@25%) 37.40 187.02 20%Wastage (@ 2% retail level) 3.74 190.76 2%
Source: ISAP analysis from various stakeholders’ interaction
Table 52: Price Build-up of Fresh Naga Chilli from Farm Gate to Dimapur/Kohima (per kg)
Fresh Naga Chilli cannot be transported to distant markets such as Delhi/Mumbai due to its high perishable nature. There is huge difference between farmer’s and consumer’s price in dry chilli.
Passion FruitPassion fruit is a high value and potentially a foreign exchange earning crop. It is a potential crop in Nagaland which is mainly cultivated from mid-hills to high-hills in the state. The fruit is grown to eat or for its juice, which is often added to other fruit juices to enhance aroma.

88 Value Chain Analysis of Select Crops in North Eastern States
the fruit can be grown in all kinds of soils; however, soils rich in organic matter are most suitable for its cultivation. A temperature range of 16°C to 30°C is most suitable for its cultivation. There are two varieties - the purple passion fruit and yellow passion fruit. Both the varieties are cultivated in the region.
NagalandKohima, Wokha and Mokokchung are major production clusters of passion fruit in Nagaland.
Production Practices��
the seed sowing for primary nursery is carried out during the month of september which is then transplanted in the secondary nursery after 30-45 days (October–November). The 8-10 month old seedlings are transplanted in the field in the months of May–June. 1600 to 1700 plants are grown in one ha area.
Post Harvest Practices:��
Harvesting: � The harvesting starts 2 years after the transplanting in the main field. The fruit ripens in the months between August and December and March and May. At the farmers’ level, losses up to 5-6 percent are reported due to powdery mildew. The yield is around 10 MT/ha per year. Value Addition at Farm Level: � Farmers do not carry any kind of value addition at their end.Marketing & Logistics: � Farmers generally carry the passion fruit on the rooftop of private vehicles to nearby markets, the transportation costs for which comes to ` 0.5 to 1 per kg. Average farmers’ selling price ranges from ` 10-15 per kg. However, in cases where processors directly procure from the farmers groups, the farmers get ` 10-12 per kg. For distant markets such as Guwahati and Kolkata, the cost is ` 2-2.50 and ̀ 3.5 to 4 per kg, respectively. During transportation, post-harvest losses range from to 2-5 percent, while at the retailer’s level, the handling losses are nearly 2 percent.
Particular Amount (in `) Price Mark-up (` Per kg)
% Contribution
Average selling price of farmers 600.00 600.00 40%Packaging 10 610.00 1%transportation to Dimapur 10 620.00 1%Wastage till Dimapur @ 1% 6.2 626.20 0%transportation from Dimapur to Bangalore 100 726.20 7%Wastage till Bangalore @2% 14.52 740.72 1%traders, Margin 250 990.72 17%Wholesalers, Margin 200 1190.72 13%Retailers, Margin 300 1490.72 20%
Source: ISAP analysis from various stakeholders’ interaction
Table 53: Price Build-up of Dry Naga Chilli from Farm Gate to Bangalore (per kg)

89Chapter 5 | Value Chain Analysis
Commercial level cultivation is not taking up further due to poor condition of processing plants, their linkages further with major processed product marketing organisations. Due to lesser demand sometime fruits go wasted at farm level so farmers are discouraged sometime to take the crop in future.
Kiwi FruitKiwi fruit or Chinese gooseberry is one of the best known nutritious fruit among the soft fruits. It is being cultivated in some sizeable area in Arunachal Pradesh in North East, although the other NE states too have a vast potential for the cultivation of Kiwi fruit. the fruit is mainly consumed as a fresh fruit or combined with other fruits, in salads and desserts. The nutritive value and flavour are retained when the fruit is processed to jam, jelly or preserves.
Farmers
` 1 per kg
Aggregators
Processors
Markets inDimapur/Kohima
Processed products inmarkets
Figure 76: Marketing Channel of Passion Fruit in Nagaland
Particular Amount (in `) Price Mark-up (` Per Piece) % ContributionAverage selling price of farmers 10.00 10.00 39%Aggregator Margin (@20%) 2.00 12.00 8%Loading/Unloading 0.40 12.40 2%transport to Dimapur/Kohima 1.00 13.40 4%Cost of wastage (@ 2%) 0.27 13.67 1%Wholesaler's Margin @ 30% 4.10 17.77 16%Wastage (@2% wholesale level) 0.36 18.12 1%Retailer's Margin (@40%) 7.25 25.37 28%Wastage (@ 2% retail level) 0.51 25.88 2%
Source: ISAP analysis from various stakeholders’ interaction
Table 54: Price Build-up of Passion Fruit from Farm Gate to Dimapur/Kohima (per kg)

90 Value Chain Analysis of Select Crops in North Eastern States
the plant needs a long growing season (at least 240 frost-free days), which will not be hampered by late winter or early autumn freeze. For high yield and quality fruits, it requires 700-800 chilling hours below 7°C to break dormancy period. It prefers somewhat acidic (pH 5 -6.5), well-drained soils that are rich in organic matter.
The fruit grows on vines which require vigorous pruning. Fruit is borne on one-year old and older canes, but production declines with the ageing of the canes.
Arunachal PradeshIn Arunachal Pradesh, the crop is grown on the sharp hilly terrains, with plantation carried out on slopes. Major growing districts are Tawang, West Kameng and Lower Subansiri.
Production Practices��
The most popular varieties grown are Alison and Harvard. The orchards are mixed with old plantations (which are almost 15-20 years old) and new plantations. However, the plantations are generally congested with less plant to plant spacing.
During the crop cycle, the farmers do not apply any kind of chemical fertilisers, insecticides, pesticides and weedicides. Only FyM/Vermicompost are applied at the rate of 5-7 kg per plant. The weeding is carried out manually by the farmers. During discussions with farmers, it emerged that there are losses up to 5-10 percent due to insects and pests such as beetles etc. The orchards are mainly rain-fed; however, few progressive farmers have started using drip irrigation and water tankers also. Nearly 1200 to 1500 labour mandays are required for various farm operations; the farmers usually hires outside labour for the field operations. At the field level, due to fruit drop and insects, pests and diseases, the fruit loss is nearly 5-10 percent.
Post-harvest Practices:��
Harvesting: � The fruiting period is two months i.e. October and November. The yield in the region is nearly 3-4 MT/ha. Value Addition at Farm Level: � the farmers carry out the manual sorting and grading of the fresh produce on the basis of weight as follows:
Marketing & Logistics: � the fruits are transported in mini trucks without any kind of packaging, or packed in gunny bags. The farmers either sell the fresh fruit directly to consumers at the local or main market, in case main market is situated close to the production area. The farmers carry the fruit on head loads to the nearest transport point and from there it is transported by jeep/maxi to the local market. the transportation cost per gunny bag comes to ` 20-50 depending upon the distance. During the transit from field to local market, the post-harvest losses during transportation are 0.5 percent.
Grade Weight MarketA Grade 90 gm and Above exportsB Grade 60-90 gm Domestic/LocalC Grade 50-60 gm Domestic/LocalD Grade 40-50 gm Processing

91Chapter 5 | Value Chain Analysis
From the local market, the produce moves through mini trucks which accommodates 5 MT due to modified body of the mini truck (the original capacity of the mini truck is 2-3 MT) and buses (bamboo baskets on the rooftop of the bus) to the main market. The logistics cost for transportation to the main market is around ` 3500-7000 per mini truck and ` 75-100 per bamboo basket. The post-harvest losses during transportation from local market to main market are nearly 8-10 percent due to the perishable nature of the fruit.
The fruit is sold on the basis of grades.
In most of the cases, the farmers sell the whole orchard to the contractor before harvesting at a pre-fixed price. However, some farmers do sell the produce to the middlemen/aggregators/traders from outside places such as Guwahati, Silchar, Kolkata and Delhi.
At the wholesaler and retailer’s level, the post-harvest losses are to the tune of 3-5 percent due to handling losses.
Grade Weight Farmers Selling Price Market Market PriceA Grade 90 gms and Above ` 100/kg exports ` 150-200/kgB Grade 60-90 gms ` 65/kg Domestic ` 100-125/kgC Grade 50-60 gms ` 50/kg Local ` 75-100/kgD Grade 40-50 gms ` 35/kg Processing
Farmers
At farm gate
Contractor/Aggregator
Markets inGuwahati/Silchar/Kolkata/
Delhi
Export
Figure 77: Marketing Channel of Kiwi Fruit in Arunachal Pradesh
Particular Amount (in `) Price Markup (` Per kg) % ContributionAverage Selling of Farmers 65.00 65.00 52.11%Aggregator charges (15-20%) 13.00 78.00 10.42%transport to Main Market including loading and unloading
2.00 80.00 1.60%
Cost of wastage (8-10% till Main Market) 8.00 88.00 6.41%Wholesaler's/Retailer's margin (30-35%) 30.80 118.80 24.69%Cost of wastage (3-5%) 5.94 124.74 4.76%
Source: ISAP analysis from various stakeholders’ interaction
Table 55: Price Build-up of Kiwi (per kg) from Farm Gate to Consumers in Itanagar
92 Value Chain Analysis of Select Crops in North Eastern States
Large CardamomLarge cardamom is a perennial herbaceous plant with subterranean rhizomes that give rise to leafy shoot and panicles. It is believed to be the native crop of Sikkim. The cardamom capsules are categorised as high value spice crops in the country and have multiple domestic uses. India is the largest producer of large cardamom with almost 54 percent share in world production and out of this Sikkim contributes up to 88 percent of India’s production.
Large cardamom grows well under the shade of forest trees at altitudes ranging from 1000-2000 metres with rainfall ranging from 3000-3500 mm per annum.
SikkimLarge cardamom is the main cash crop of Sikkim, being cultivated in an area of 15,020 ha (Directorate of Horticulture, 2010-11) in all the four districts of the state. Two major producing clusters are North and East Sikkim.
Production Practices��
There are five popular cultivars being grown in Sikkim i.e, Ramsey, Sawney, Golsey, Varlangey and Seremna. The propagation of large cardamom is through seeds and suckers. Seeds are generally sown in September-October.
However, the existing cardamom orchards in the state are very old thus affecting the yield of the capsules. Viral diseases such as chirkey and foorkey are very common in the old plantations which destroy large number of fields in the region and cause heavy losses to the farmers.
the state Horticulture Department is preparing tissue cultured plants to be supplied to the farmers. These plants would be resistant to viral and bacterial diseases.
The fully grown cardamom plantations require 150-200 mandays per ha for various farm operations such as intercultural operations and harvesting.
Post Harvest Practices:��
Harvesting: � The yield of the plants is approximately 1.5 to 2.5 MT per ha. Value Addition at Farm level. �Marketing & Logistics. �
the main marketing channel being followed by the farmers is as follows:
Farmers ----- Aggregators ------- Wholesalers ------- Retailers ------- Consumers1.
Farmers ------ Contractors ------- Wholesalers ------- Retailers ------- Consumers2.
Farmers ------- Bidders ------ Wholesalers ------ Retailers ------- Consumers3.
The losses in the field vary from 5 to 10 percent which may go up to 80 percent in case of viral diseases.
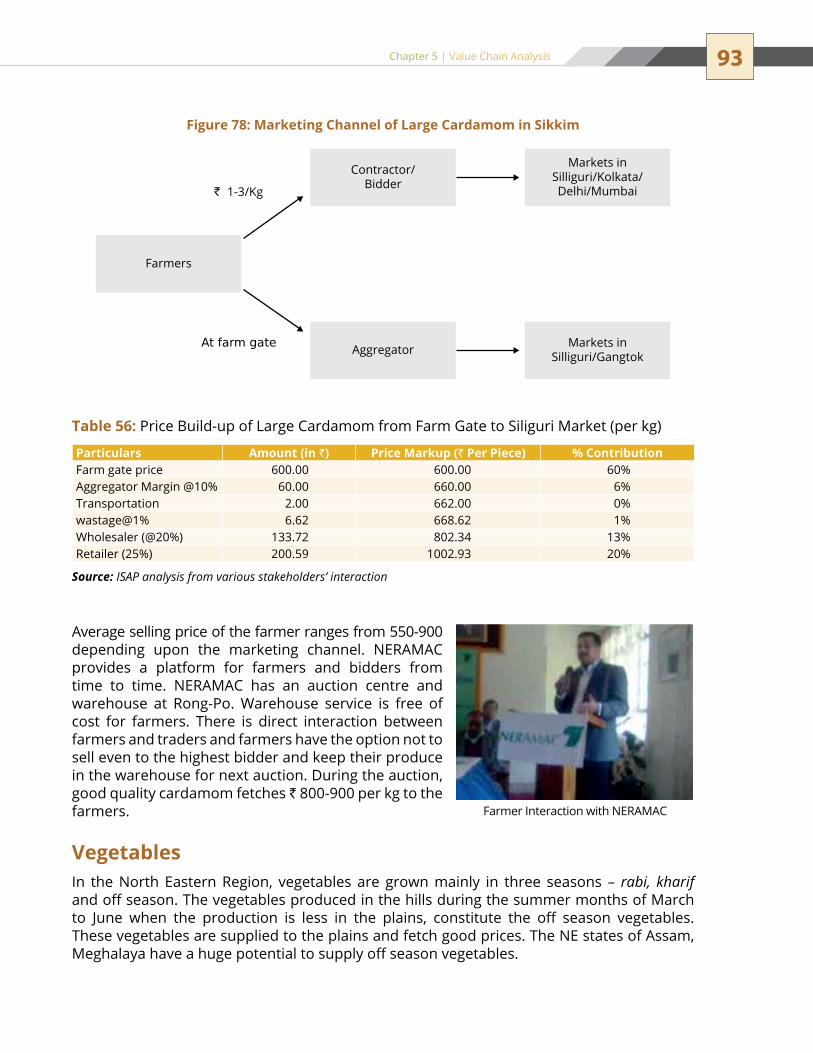
93Chapter 5 | Value Chain Analysis
Average selling price of the farmer ranges from 550-900 depending upon the marketing channel. NERAMAC provides a platform for farmers and bidders from time to time. NERAMAC has an auction centre and warehouse at Rong-Po. Warehouse service is free of cost for farmers. There is direct interaction between farmers and traders and farmers have the option not to sell even to the highest bidder and keep their produce in the warehouse for next auction. During the auction, good quality cardamom fetches ` 800-900 per kg to the farmers.
VegetablesIn the north eastern Region, vegetables are grown mainly in three seasons – rabi, kharif and off season. The vegetables produced in the hills during the summer months of March to June when the production is less in the plains, constitute the off season vegetables. These vegetables are supplied to the plains and fetch good prices. The NE states of Assam, Meghalaya have a huge potential to supply off season vegetables.
Farmers
` 1-3/Kg
At farm gate
Contractor/Bidder
Aggregator
Markets inSilliguri/Kolkata/Delhi/Mumbai
Markets inSilliguri/Gangtok
Figure 78: Marketing Channel of Large Cardamom in Sikkim
Particulars Amount (in `) Price Markup (` Per Piece) % ContributionFarm gate price 600.00 600.00 60%Aggregator Margin @10% 60.00 660.00 6%transportation 2.00 662.00 0%wastage@1% 6.62 668.62 1%Wholesaler (@20%) 133.72 802.34 13%Retailer (25%) 200.59 1002.93 20%
Source: ISAP analysis from various stakeholders’ interaction
Table 56: Price Build-up of Large Cardamom from Farm Gate to Siliguri Market (per kg)
Farmer Interaction with NERAMAC
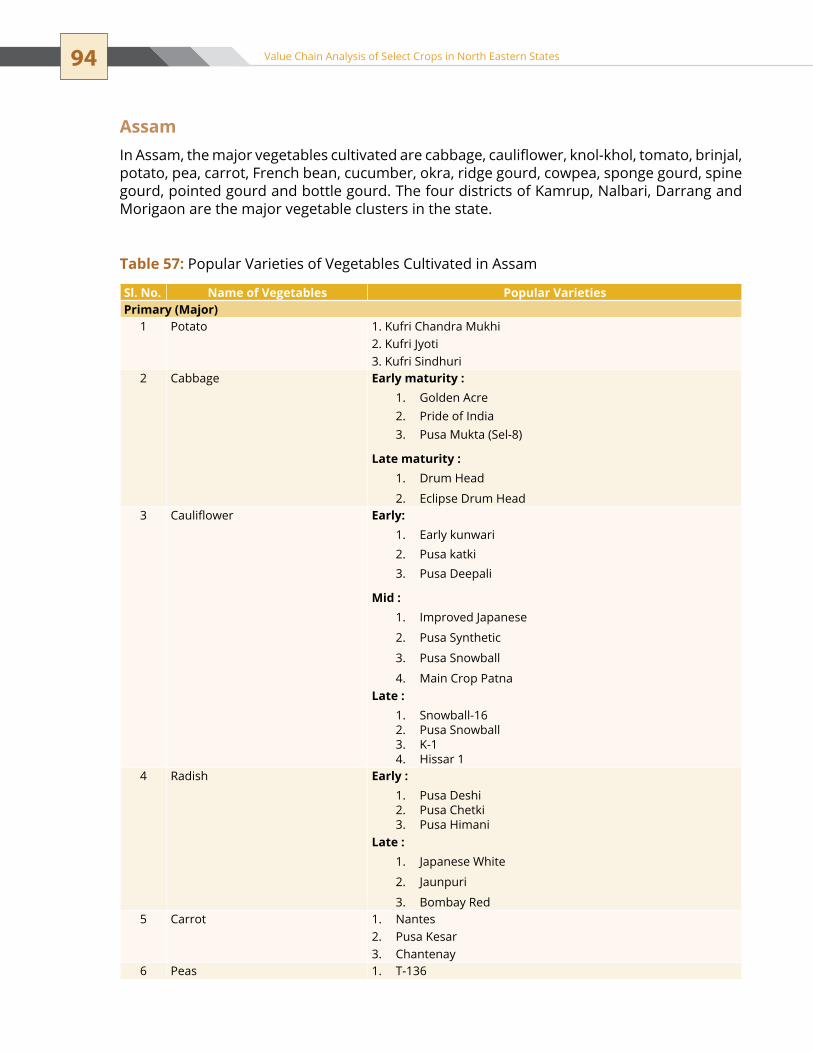
94 Value Chain Analysis of Select Crops in North Eastern States
AssamIn Assam, the major vegetables cultivated are cabbage, cauliflower, knol-khol, tomato, brinjal, potato, pea, carrot, French bean, cucumber, okra, ridge gourd, cowpea, sponge gourd, spine gourd, pointed gourd and bottle gourd. The four districts of Kamrup, Nalbari, Darrang and Morigaon are the major vegetable clusters in the state.
Sl. No. Name of Vegetables Popular VarietiesPrimary (Major)
1 Potato 1. Kufri Chandra Mukhi2. Kufri Jyoti3. Kufri Sindhuri
2 Cabbage Early maturity :Golden Acre1. Pride of India2. Pusa Mukta (sel-8)3.
Late maturity :Drum Head1.
eclipse Drum Head2. 3 Cauliflower Early:
early kunwari1. Pusa katki2. Pusa Deepali3.
Mid :Improved Japanese1.
Pusa synthetic2.
Pusa snowball3.
Main Crop Patna4. Late :
snowball-161. Pusa snowball2. K-13. Hissar 14.
4 Radish Early :Pusa Deshi1. Pusa Chetki2. Pusa Himani3.
Late :Japanese White1.
Jaunpuri2.
Bombay Red3. 5 Carrot nantes1.
Pusa Kesar2. Chantenay3.
6 Peas t-1361.
Table 57: Popular Varieties of Vegetables Cultivated in Assam

95Chapter 5 | Value Chain Analysis
Sl. No. Name of Vegetables Popular Varieties7 French Beans Pusa Parvaty1.
Contender2. uPF-2033. uPF-1914.
8 tomato Punjab Chhuhara1. s-122. Punjab Kesri3. Pusa early Dwarf4. sioux5. Pusa Ruby6. VC-48-17. Arka Abha (BWR-1)8. Arka Alok (BWR-5)9. Bt-110. Bilahi-111. Bilahi-212.
9 Ash Gourd selected local varieties10 Lettuce Great Lakes1.
Chinese yellow2. slow Bolt3.
Secondary (Minor)11 Capsicum (Green) California Wonder1.
elephant trunkm2. Arka Mohini3. Arka Gaurav4. selection 165.
12 Broccoli Early :Early Danish Giant1. De Cicco Green Bud2. sparton ealy3. Coastal4. Atlantic5.
Mid :Green sprouting medium1.
Late:Waltham 291. Green Mountain2. Coastal3. Atlantic4.
Hybrid :southern Comet1. Premium Crop2. Clipper3. Laser (extra early and early)4.
13 Coriander Bold seeded :UD 211. GAuI2. CsI3. CIMPo 334.
Small seeded :UP 411. Pusa 3602. Local selection3.

96 Value Chain Analysis of Select Crops in North Eastern States
Sl. No. Name of Vegetables Popular Varieties14 Pumpkin Arka suryamukhi1.
Arka Chandan2. selected Local cultivar3.
15 Cucumber Chinese Green1. Pusa sanyog2. Poinsette3. AAUC-14. AAUC-25. AAUC-36. AAUC-47.
16 Knol Khol Early maturity:White Vienna1.
Late maturity :Purple Vienna1.
17 Brinjal Long:Cluster1. Borbengena2. JC-13. Kuchia4. BWR-345. Pusa Kranti6. Pusa Purple Long7. Pusa Purple8.
Round :Pusa Purple Round1. Pusa Vairab2. JC-23. BWR-124.
Oblong :BB-71. Pant samrat2.
18 Ladies Finger Pusa sawani1. Arka Anamika2. Parbhdani Kranti3. Red Wonder (Hill Zone)4. Panchasira (North Brahmaputra Valley Zone)5.
19 Bottle Gourd Pusa Summer Prolific1. Pusa Summer Prolific Round2. Pusa Meghdoot3. Pusa Manjiri4. Keyari Lsao5.
20 Onion (Green Leaf) Pusa Red1. Pusa Ratnar2. Pusa White (Round)3. Pusa White (Flat)4. N-535. Agrifound Light Red6. Punjab Red Round7. Pusa Madhuri8. Arka niketan9.

97Chapter 5 | Value Chain Analysis
Sl. No. Name of Vegetables Popular Varieties24 Bitter Gourd For spring season :
earliest of All1. Long Green2. extra Long3. Pusa Do Mausmi4.
For summer season :
Monsoon Monarch1. Long Green Monsoon2. Coimbatore Long3.
25 Ridge Gourd Pusa nasdar1. AAuJ-12. AAuJ-23. AAuJ-34.
Source: Discussion with stakeholders, KVKs, District Agriculture Offices
Farmers in most of the vegetable production clusters around Guwahati use hybrid/HyV seeds and also use other inputs for increasing yield and production. However, the production practices for vegetable are non-scientific and therefore there is a huge scope for intensification of vegetable production.
Table 58: Cost of Production of Selected Vegetables in Assam
Cost of Production of Selected Vegetable Crops (in `) Total costSl.
No.Crop
NameSeed Cost Pesticide
CostFertilizer
CostIrrigation
CostLabour
Cost (During Season)
Any Other Cost
1 Ash Gourd 4500 900 5328 2000 3000 1000 16728
2 Brinjal 4800 3750 3300 2000 3000 1000 17850
3 Cabbage 10000 3750 5000 2000 2500 1000 24250
4 Carrot 500 500 2000 2500 3000 1000 9500
5 Cauliflower 10000 3750 5000 2000 2500 1000 24250
6 Cowpea 5000 400 2432 2000 3000 1000 13832
7 Cucumber 3000 2000 3000 3500 2000 1000 14500
8 French-bean
8400 0 15000 1200 6000 2000 32600
9 Knol –Khol 1500 1500 4220 2000 3000 1000 13220
10 okra 4500 3000 15000 2500 2000 1000 28000
11 Potato 25000 2500 5270 2000 3000 1000 38770
12 Pumpkin 10000 3500 4000 3000 3000 2000 25500
13 Radish 3000 1000 4800 2000 3000 1000 14800
14 Ridge Gourd
10000 4500 2295 2000 3000 1000 22795
15 tomato 20000 1000 7000 2000 3000 1000 34000
Source: Primary Survey by ISAP
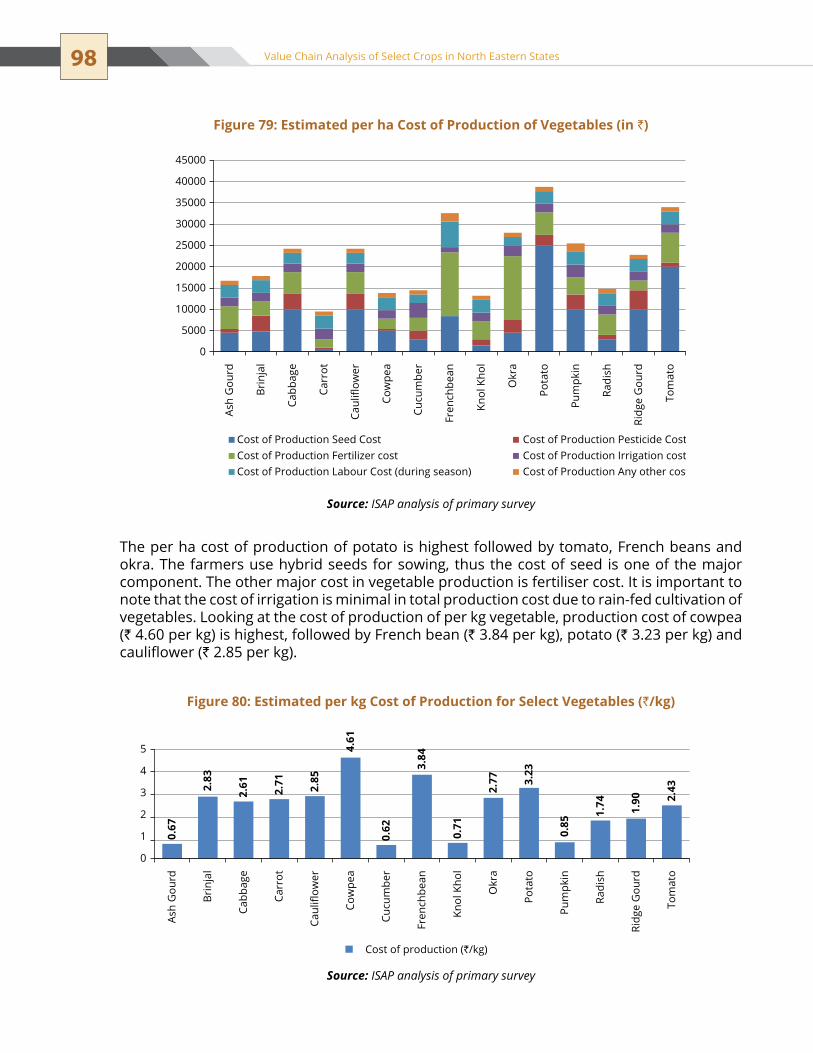
98 Value Chain Analysis of Select Crops in North Eastern States
The per ha cost of production of potato is highest followed by tomato, French beans and okra. The farmers use hybrid seeds for sowing, thus the cost of seed is one of the major component. The other major cost in vegetable production is fertiliser cost. It is important to note that the cost of irrigation is minimal in total production cost due to rain-fed cultivation of vegetables. Looking at the cost of production of per kg vegetable, production cost of cowpea (` 4.60 per kg) is highest, followed by French bean (` 3.84 per kg), potato (` 3.23 per kg) and cauliflower (` 2.85 per kg).
Figure 79: Estimated per ha Cost of Production of Vegetables (in `)
0
5000
10000
15000
20000
25000
30000
35000
40000
45000
Ash
Gou
rd
Brin
jal
Cabb
age
Carr
ot
Caul
iflow
er
Cow
pea
Cucu
mbe
r
Fren
chbe
an
Knol
Kho
l
Okr
a
Pota
to
Pum
pkin
Radi
sh
Ridg
e G
ourd
Tom
ato
Cost of Production Seed Cost Cost of Production Pesticide CostCost of Production Fertilizer cost Cost of Production Irrigation costCost of Production Labour Cost (during season) Cost of Production Any other cost
Source: ISAP analysis of primary survey
Figure 80: Estimated per kg Cost of Production for Select Vegetables (`/kg)
0.67
2.83
2.61 2.71 2.85
4.61
0.62
3.84
0.71
2.77 3.
23
0.85
1.74 1.90 2.
43
0
1
2
3
4
5
Cost of production (`/kg)
Ash
Gou
rd
Brin
jal
Cabb
age
Carr
ot
Caul
iflow
er
Cow
pea
Cucu
mbe
r
Fren
chbe
an
Knol
Kho
l
Okr
a
Pota
to
Pum
pkin
Radi
sh
Ridg
e G
ourd
Tom
ato
Source: ISAP analysis of primary survey

99Chapter 5 | Value Chain Analysis
Farmers harvest the vegetables in the evening of the first day so that they can reach the market early morning the next day. Farmers either sell their products to local consolidators or take it to the nearest market. In case farmers are taking their products to the market, transportation cost is being paid by the farmers themselves. Mostly vegetables are packed in gunny bags (jute and plastic bags, empty bags of cement, fertiliser, wheat, sugar etc.) and in baskets. Bags are chosen for relatively longer distance and baskets for local selling of products.
Farmers carry their vegetables to the markets in bullock carts, autos, small trucks and matadors etc. Means of transport depends on distance and quantity of vegetables to be carried to the market. Farmers also hire transport vehicles on sharing basis, specifically in production areas such as Kharupetia.
there are various channels by which vegetables are being brought from farm gate to the markets in Guwahati. Some of these channels, as identified during the primary survey are described as below:
Farmers – Consumers1.
Farmers – Commission Agents - Wholesalers (Machkhowa market) – Retailers - 2. Consumers
Farmers – Aggregators/consolidators/local traders – Commission Agents - Wholesalers 3. (Machkhowa market) – Retailers - Consumers
Farmers – Aggregators/consolidators/local traders – Wholesalers at Transit markets – 4. Commission Agents (Machkhowa market) – Wholesalers (Machkhowa market) – Retailers - Consumers
Channels 2 & 3 contribute approximately 80-85% of total vegetables’ arrival in the Machkhowa market of Guwahati. Almost 95% of the total vegetables that arrive in Guwahati, comes through organised channel of consolidating, wholesaling and retailing and only 5% of vegetables are being brought directly by the farmers. Though the distances of production centre and market is not much, there are multiple players involved in the supply chain and that adds to the cost of vegetables to consumers.
Cost components in the supply chain, at the market level, includes margin of local consolidators:
Market fee at primary market level��
Margin of wholesaler in primary market/commission of commission agent at primary ��
market
transportation cost to secondary market��
Market fee at secondary market level��
Commission of commission agents��
Margin of wholesalers��
Local transportation cost for transporting it to retail store��
Margin of retailers��
Wastage at various levels��
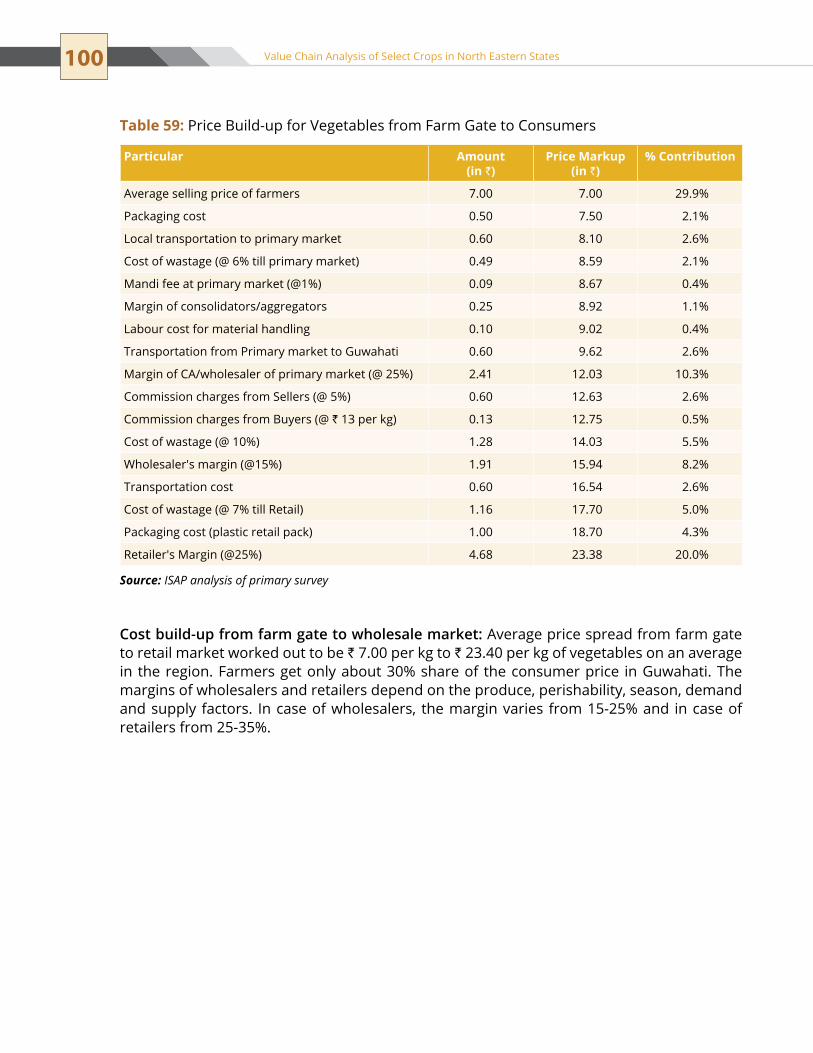
100 Value Chain Analysis of Select Crops in North Eastern States
Table 59: Price Build-up for Vegetables from Farm Gate to Consumers
Particular Amount(in `)
Price Markup(in `)
% Contribution
Average selling price of farmers 7.00 7.00 29.9%
Packaging cost 0.50 7.50 2.1%
Local transportation to primary market 0.60 8.10 2.6%
Cost of wastage (@ 6% till primary market) 0.49 8.59 2.1%
Mandi fee at primary market (@1%) 0.09 8.67 0.4%
Margin of consolidators/aggregators 0.25 8.92 1.1%
Labour cost for material handling 0.10 9.02 0.4%
Transportation from Primary market to Guwahati 0.60 9.62 2.6%
Margin of CA/wholesaler of primary market (@ 25%) 2.41 12.03 10.3%
Commission charges from Sellers (@ 5%) 0.60 12.63 2.6%
Commission charges from Buyers (@ ` 13 per kg) 0.13 12.75 0.5%
Cost of wastage (@ 10%) 1.28 14.03 5.5%
Wholesaler's margin (@15%) 1.91 15.94 8.2%
transportation cost 0.60 16.54 2.6%
Cost of wastage (@ 7% till Retail) 1.16 17.70 5.0%
Packaging cost (plastic retail pack) 1.00 18.70 4.3%
Retailer's Margin (@25%) 4.68 23.38 20.0%
Source: ISAP analysis of primary survey
Cost build-up from farm gate to wholesale market: Average price spread from farm gate to retail market worked out to be ` 7.00 per kg to ` 23.40 per kg of vegetables on an average in the region. Farmers get only about 30% share of the consumer price in Guwahati. The margins of wholesalers and retailers depend on the produce, perishability, season, demand and supply factors. In case of wholesalers, the margin varies from 15-25% and in case of retailers from 25-35%.
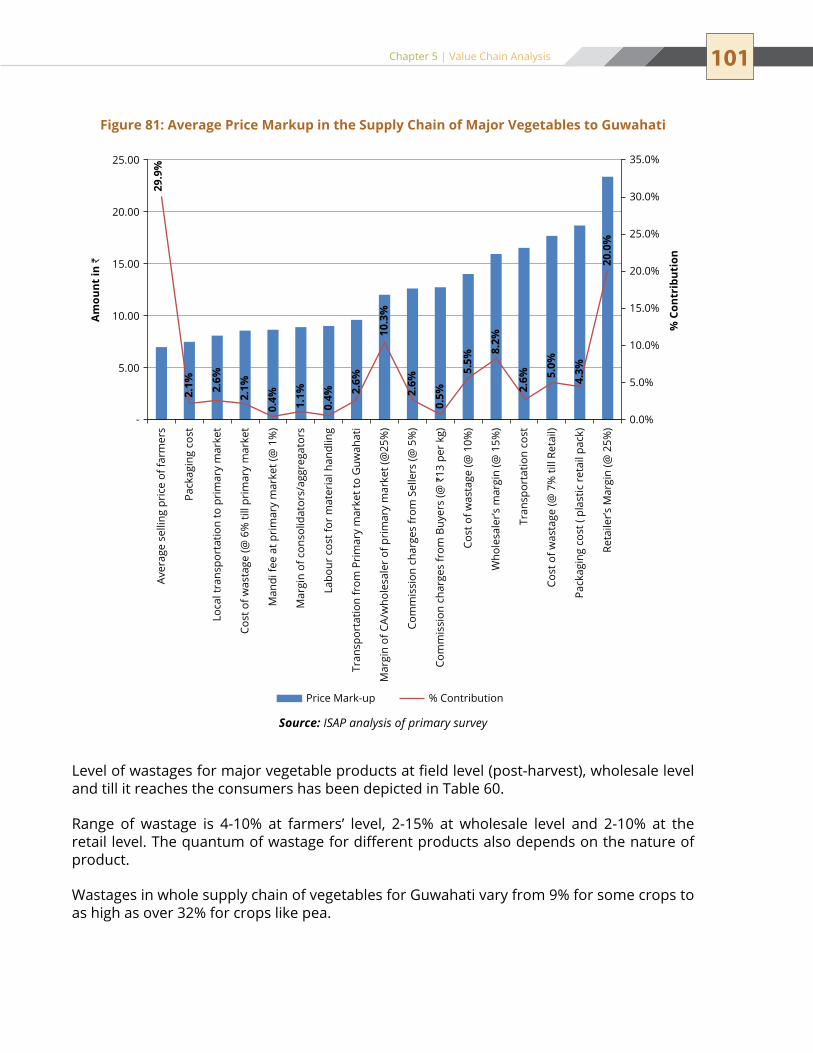
101Chapter 5 | Value Chain Analysis
Figure 81: Average Price Markup in the Supply Chain of Major Vegetables to Guwahati
29.9
%
2.1% 2.6%
2.1%
0.4% 1.1%
0.4% 2.
6%
10.3
%
2.6%
0.5%
5.5%
8.2%
2.6% 5.
0%
4.3%
20.0
%
0.0%
5.0%
10.0%
15.0%
20.0%
25.0%
30.0%
35.0%
-
5.00
10.00
15.00
20.00
25.00
% C
ontr
ibut
ion
Am
ount
in `
Price Mark-up % Contribution
Aver
age
selli
ng p
rice
of f
arm
ers
Pack
agin
g co
st
Loca
l tra
nspo
rtat
ion
to p
rim
ary
mar
ket
Cost
of w
asta
ge (@
6%
till
prim
ary
mar
ket
Man
di fe
e at
pri
mar
y m
arke
t (@
1%
)
Mar
gin
of c
onso
lidat
ors/
aggr
egat
ors
Labo
ur c
ost f
or m
ater
ial h
andl
ing
Tran
spor
tatio
n fr
om P
rim
ary
mar
ket t
o G
uwah
ati
Mar
gin
of C
A/w
hole
sale
r of
pri
mar
y m
arke
t (@
25%
)
Com
mis
sion
cha
rges
from
Sel
lers
(@ 5
%)
Com
mis
sion
cha
rges
from
Buy
ers
(@ `
13 p
er k
g)
Cost
of w
asta
ge (@
10%
)
Who
lesa
ler’s
mar
gin
(@ 1
5%)
Tran
spor
tatio
n co
st
Cost
of w
asta
ge (@
7%
till
Reta
il)
Pack
agin
g co
st (
plas
tic r
etai
l pac
k)
Reta
iler’s
Mar
gin
(@ 2
5%)
Source: ISAP analysis of primary survey
Level of wastages for major vegetable products at field level (post-harvest), wholesale level and till it reaches the consumers has been depicted in Table 60.
Range of wastage is 4-10% at farmers’ level, 2-15% at wholesale level and 2-10% at the retail level. The quantum of wastage for different products also depends on the nature of product.
Wastages in whole supply chain of vegetables for Guwahati vary from 9% for some crops to as high as over 32% for crops like pea.
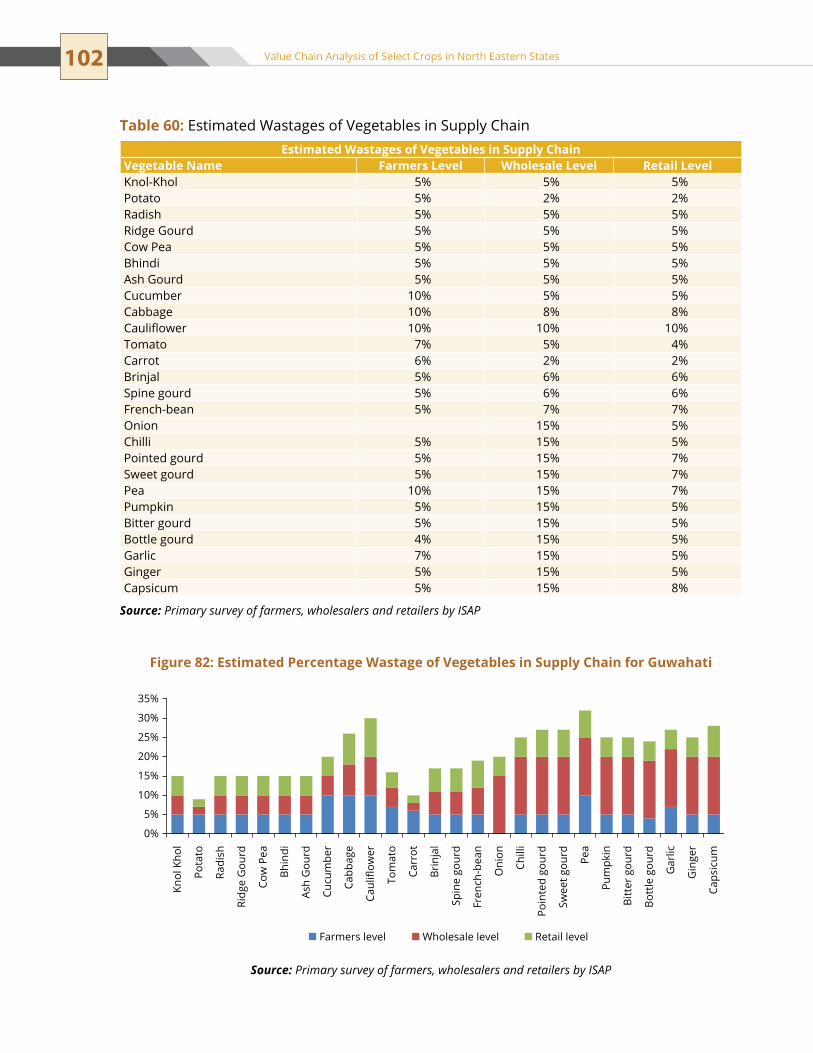
102 Value Chain Analysis of Select Crops in North Eastern States
Estimated Wastages of Vegetables in Supply ChainVegetable Name Farmers Level Wholesale Level Retail LevelKnol-Khol 5% 5% 5%Potato 5% 2% 2%Radish 5% 5% 5%Ridge Gourd 5% 5% 5%Cow Pea 5% 5% 5%Bhindi 5% 5% 5%Ash Gourd 5% 5% 5%Cucumber 10% 5% 5%Cabbage 10% 8% 8%Cauliflower 10% 10% 10%tomato 7% 5% 4%Carrot 6% 2% 2%Brinjal 5% 6% 6%spine gourd 5% 6% 6%French-bean 5% 7% 7%onion 15% 5%Chilli 5% 15% 5%Pointed gourd 5% 15% 7%sweet gourd 5% 15% 7%Pea 10% 15% 7%Pumpkin 5% 15% 5%Bitter gourd 5% 15% 5%Bottle gourd 4% 15% 5%Garlic 7% 15% 5%Ginger 5% 15% 5%Capsicum 5% 15% 8%
Source: Primary survey of farmers, wholesalers and retailers by ISAP
Table 60: Estimated Wastages of Vegetables in Supply Chain
Figure 82: Estimated Percentage Wastage of Vegetables in Supply Chain for Guwahati
0%
5%
10%
15%
20%
25%
30%
35%
Knol
Kho
l
Pota
to
Radi
sh
Ridg
e G
ourd
Cow
Pea
Bhin
di
Ash
Gou
rd
Cucu
mbe
r
Cabb
age
Caul
iflow
er
Tom
ato
Carr
ot
Brin
jal
Spin
e go
urd
Fren
ch-b
ean
Oni
on
Chill
i
Poin
ted
gour
d
Swee
t gou
rd
Pea
Pum
pkin
Bitt
er g
ourd
Bott
le g
ourd
Gar
lic
Gin
ger
Caps
icum
Farmers level Wholesale level Retail level
Source: Primary survey of farmers, wholesalers and retailers by ISAP

103Chapter 5 | Value Chain Analysis
Issues Related to Vegetable MarketingVegetable marketing in the Kamrup region is not organised due to lack of adequate infrastructure and basic facilities. Farmers don’t have any alternate channel than to sell the fresh produce through intermediaries. Two major and adjacent wholesale-cum-retail markets, Machkhowa and Fancy Bazaar have the following situation and concerns:
Machkhowa Market:1. Located 9 kms from the national Highway and 3 kms from the railway station, it is the largest vegetable market in the region but it doesn’t have the basic facilities to handle the produce and quality management. Market is in an open area, operates in a congested area and unhygienic conditions and there is no shed for protection from sun and rain. This market is under the administration of Guwahati Municipal Corporation (GMC). Fancy Bazaar Vegetable Market:2. one of the oldest fresh produce markets in Kamrup it is less than 500 mts. from Machkhowa market and 9 kms from NH-37 and 2 kms from Guwahati railway station. Fancy Bazaar also deals in other commodities such as fruits, betel nut and flowers etc. It is also under the administration of GMC and traders pay the rent.
Both of the markets are lacking the following basic infrastructure, which is required for fresh fruits and vegetable market:
Cold store ��
sorting/grading machines ��
Auction platforms��
electronic display��
Weigh bridges��
Garbage disposal system��
Water and sewerage system, etc.��
Other vegetable markets in Guwahati city are Paltan Bazaar, Ganeshguri Subzi Bazaar and Basistha Chariali vegetable market. All of these markets are lacking basic infrastructure.
Rural 3. Haats and Mandis: At block level, small towns and rural markets, vegetable mandis and haats are operational. Most of the vegetable markets at block and village level are under gram panchayats or are private. Rural markets are very much preferred by the farmers due to proximity to production cluster, less transportation cost and absence of trader’s cartel. Rural markets also lack infrastructure such as covered sheds, platforms, plastic crates, sorting/grading machines etc., which are imperative to handle fresh produce.
MeghalayaEast Khasi hills are the major vegetable production cluster identified in Meghalaya. The major vegetables cultivated in this region are potato, cabbage, cauliflower, radish, carrot, peas, French beans, tomato, squash, lettuce and mustard (leaf). However, apart from these, farmers cultivate other minor vegetables such as capsicum, broccoli, coriander, beet root, pumpkin, cucumber, turnip, knol khol, brinjal, okra, onion (green) bitter gourd, bottle gourd and ridge gourd. The protected cultivation of the following crops is undertaken: capsicum, tomato, broccoli, pea, cucumber and mustard leaves.
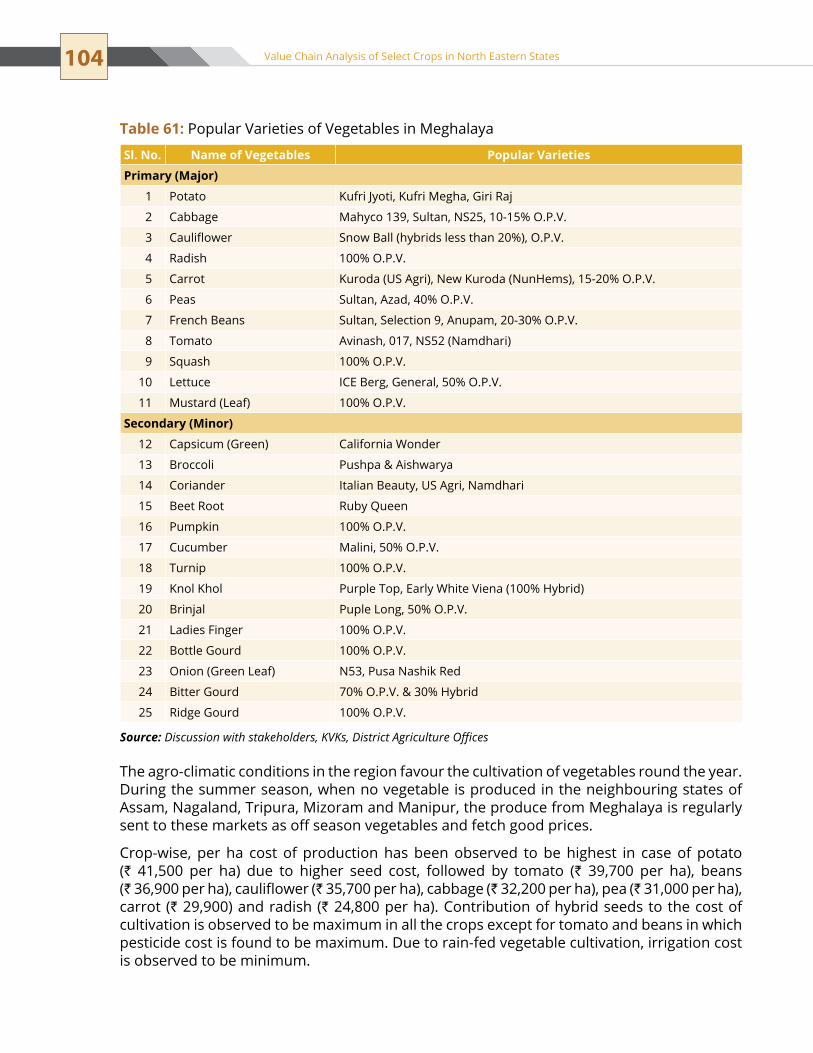
104 Value Chain Analysis of Select Crops in North Eastern States
The agro-climatic conditions in the region favour the cultivation of vegetables round the year. During the summer season, when no vegetable is produced in the neighbouring states of Assam, nagaland, tripura, Mizoram and Manipur, the produce from Meghalaya is regularly sent to these markets as off season vegetables and fetch good prices.
Crop-wise, per ha cost of production has been observed to be highest in case of potato (` 41,500 per ha) due to higher seed cost, followed by tomato (` 39,700 per ha), beans (` 36,900 per ha), cauliflower (` 35,700 per ha), cabbage (` 32,200 per ha), pea (` 31,000 per ha), carrot (` 29,900) and radish (` 24,800 per ha). Contribution of hybrid seeds to the cost of cultivation is observed to be maximum in all the crops except for tomato and beans in which pesticide cost is found to be maximum. Due to rain-fed vegetable cultivation, irrigation cost is observed to be minimum.
Sl. No. Name of Vegetables Popular Varieties
Primary (Major)
1 Potato Kufri Jyoti, Kufri Megha, Giri Raj
2 Cabbage Mahyco 139, Sultan, NS25, 10-15% O.P.V.
3 Cauliflower Snow Ball (hybrids less than 20%), O.P.V.
4 Radish 100% O.P.V.
5 Carrot Kuroda (uS Agri), New Kuroda (NunHems), 15-20% O.P.V.
6 Peas Sultan, Azad, 40% O.P.V.
7 French Beans Sultan, Selection 9, Anupam, 20-30% O.P.V.
8 tomato Avinash, 017, NS52 (Namdhari)
9 Squash 100% O.P.V.
10 Lettuce ICE Berg, General, 50% O.P.V.
11 Mustard (Leaf) 100% O.P.V.
Secondary (Minor)
12 Capsicum (Green) California Wonder
13 Broccoli Pushpa & Aishwarya
14 Coriander Italian Beauty, Us Agri, namdhari
15 Beet Root Ruby Queen
16 Pumpkin 100% O.P.V.
17 Cucumber Malini, 50% O.P.V.
18 turnip 100% O.P.V.
19 Knol Khol Purple Top, Early White Viena (100% Hybrid)
20 Brinjal Puple Long, 50% O.P.V.
21 Ladies Finger 100% O.P.V.
22 Bottle Gourd 100% O.P.V.
23 Onion (Green Leaf) N53, Pusa Nashik Red
24 Bitter Gourd 70% O.P.V. & 30% Hybrid
25 Ridge Gourd 100% O.P.V.
Source: Discussion with stakeholders, KVKs, District Agriculture Offices
Table 61: Popular Varieties of Vegetables in Meghalaya

105Chapter 5 | Value Chain Analysis
Mostly traditional practices are followed for post-harvest handling of vegetables and only washing is carried out by few farmers in case of potato, radish. Few farmers also revealed adoption of sorting activity in case of potato, cabbage, cauliflower, tomato. The farmers generally harvest the produce in the evening of the previous day to be taken to the market the next day. After harvesting, the vegetables are kept in gunny/jute bags (potato/radish) and bamboo baskets (cabbage, cauliflower, tomato, French beans etc. ), which are carried to the market the next day. There are no separate storage facilities for vegetables at the field level.
The movement of produce to urban markets is through bus/mini trucks/jeeps in the region. The head loads are carried to a distance of 1-5 kilometres on an average, to reach the rural market or a point from where motor transport is available for transporting the produce to Shillong markets. Farmers travel upto 50-60 kms to Shillong to dispose off their produce. The cost of transportation varies for:
tata 407/truck �� ` 0.50 to ` 1 per kg.Bus: �� ` 1 to ` 1.20 per kg.
Figure 83: Estimated per ha Cost of Production of Vegetables in Meghalaya
0
5000
10000
15000
20000
25000
30000
35000
40000
45000
Potato Cabbage Tomato Beans Carrot Pea Cauliflower Radish
Seed Cost Pesticides Cost Fertilizer Cost Irrigation Cost Labour Cost Total Cost
Source: Primary survey of farmers by ISAP
Vegetable Market in Meghalaya
106 Value Chain Analysis of Select Crops in North Eastern States
The packaging of the vegetable crops at the farm level is conventional and suffers from quality deterioration and transit loss. Mostly vegetables are packed in gunny/jute bags (potato/radish) and bamboo baskets (cabbage, cauliflower, tomato, French beans etc.) for transporting to the market. The cost of packaging varies for:
Gunny bag - �� ` 20-30 per bag, jute bag Jute bag - �� ` 10-20 per bagBamboo basket - �� ` 40-60 per basket.
Average post-harvest loss at the farm gate is estimated around 5%. Farmers revealed higher post-harvest losses in case of tomato, beans, leafy vegetables, brinjal, carrot and gourds.
transportation of their produce to the nearest urban markets for sale at remunerative prices is a major problem faced by farmers. Harvested vegetables are transported to markets either manually, by bus or autos as per convenience and distance. The following marketing channels are followed by the farmers:
Farmers – Consumers:1. Most of the farmers prefer to sell their produce in the rural market (held periodically) or nearest urban market which are largely unorganised directly to consumers or agents of traders. The farmers also feel convenient to dispose off their produce at the village as it saves their time and energy in transporting the produce to the urban markets.Farmers – Village level aggregators (agents/big farmers/SHG/farmer Club/producer 2. organisation) or Agents of traders – Consumers: It is also observed that a large number of farmers sell their vegetable produce to the village level aggregators or agents of the traders who collect it either from their conventional storage at home or from the field and sell produce to consumers.Farmers – Wholesalers – Retailers – Consumers:3. Farmers of nearby production clusters visit the nearest market and sell their produce to the wholesaler who offers maximum price for it. Wholesaler in turn sells the produce to retailers as well as consumers.Farmers – Agents/Traders/wholesalers (from Assam, Tripura, Mizoram, Manipur, 4. Nagaland) – Traders at respective local markets – Wholesalers – Retailers – Consumers: It has also been found agents of traders from nearby states (Assam, Tripura, Mizoram, Manipur and Nagaland) procure the vegetables at the village.
the farmers sell their produce to the available channels in the village (farm gate) at comparatively lower prices than the urban markets in order to avoid the problems of transport. Secondly, in case of urban market, trading cost of transportation is higher and the farmer is more dependent on the wholesaler. Wholesalers adopt unfair trade practices in the procurement and raise issues on quality to pay less to the farmers. Thirdly, in few cases, the wholesalers/traders purchase vegetable produce against the money advanced to the farmer for operations. under such circumstances, the farmer is at a disadvantage as he has to compromise for the lower pre-harvest price and adjust more volume of the produce towards the interest of the debt availed.
107Chapter 5 | Value Chain Analysis
Post-harvest losses of fresh vegetables in the region at wholesalers’ level are estimated to range from 3% for peas to 15% in tomato crop, with an overall average loss of 8% at wholesaler’s level. Losses at the retail levels are estimated to be 4% in the region, as volumes handled by retailers are small for day to day consumer demand. Majority of this wastage is due to sorting and daily surplus, which needs to be discarded at the end of day.
ConclusionThe above discussed value chains are truncated value chains. ��
Around 20–30% of the produce gets wasted at field level.��
Entire produce is not sold at market level.��
Due to low volume, farmers sell directly to consumers also at village level or at nearby ��
markets.Marketing and post-harvest infrastructure is yet to be scaled-up to improve the overall ��
value chain.existing markets are not very supportive to the farmers due to traditional system of ��
procurement.Markets are found to be lacking in basic facilities.��
In most of the states either there is no regulated market or most of the trade is being ��
practiced in non-regulated/traditional markets.
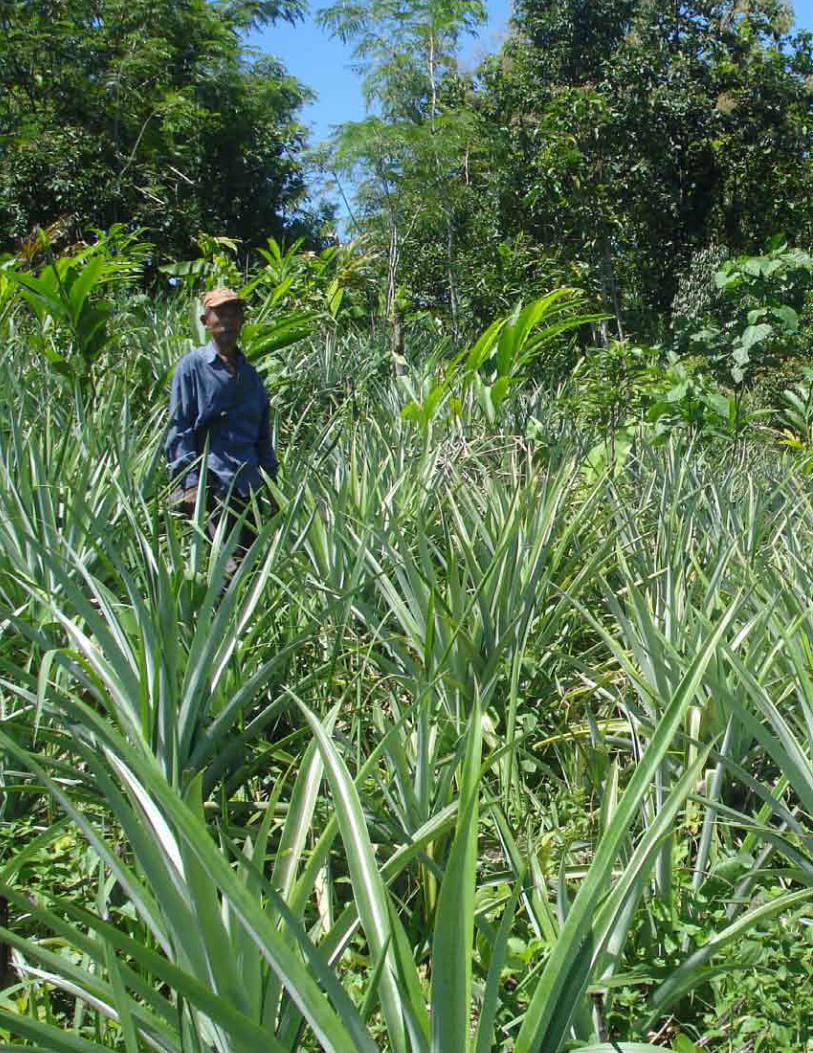

BENCHMARKING WITH EXISTING BEST PRACTICES
C H A P t e R6
to improve the cultivation practices, technological interventions, supply chain and marketing, it is essential to map out the best practices in the region and disseminate the same in identified clusters. There are locations in the North East itself which have success stories of higher production, better marketing linkages and good income from the venture. These success stories would be helpful to improve the value chain of potential horticulture in the clusters as well as in other production areas. Benchmarking study of the identified crops is as below:
PineappleProductivity of pineapple in the identified states for study
State Productivity (MT/ha)Arunachal Pradesh 5.7Assam 15.8Meghalaya 8.9nagaland 15.5tripura 22.6
Source: NHB and State Horticulture Departments
From the productivity point of view, Tripura, Assam and Nagaland are the top three states. Average farm gate prices are also lesser in Tripura (` 7), Assam (` 10) and nagaland (` 8) than Arunachal Pradesh (` 15) and Meghalaya (` 15). For a pineapple of 1-1.5 kg, ` 8 is modal price for the farmers. When the farm gate price goes down below ` 8, it creates stress among the farmers.
Molvom in Dimapur (Nagaland) will be an ideal village for benchmarking study. Average yield is 30-35 MT per hectare. Farmers have started applying improved production technologies after training from Horticulture Department and Central Institute of Horticulture (CIH). Cost of production is low due to group farming where farmers work in one another’s field and they don’t have to pay for labour.
Farmers have good income from pineapple fields due to direct linkages with traders. Guwahati is the nearest main market for the pineapple produced in Molvom. Traders from Guwahati contacts directly to the farmers groups and visit the farms for procurement and transports the produce to Guwahati. Most of the crop is sold at farm gate only so farmers don’t have any burden of loading, packaging, transportation and logistics etc. Farmers’ group use the collection centre constructed in the village when there is big order either from Guwahati traders or when they have to supply to Delhi, Bangalore etc. Harvesting of pineapple is done at different stages of green colour based on the distance of markets and farm gate. Farmers in Molvom are well aware about the harvesting stages.
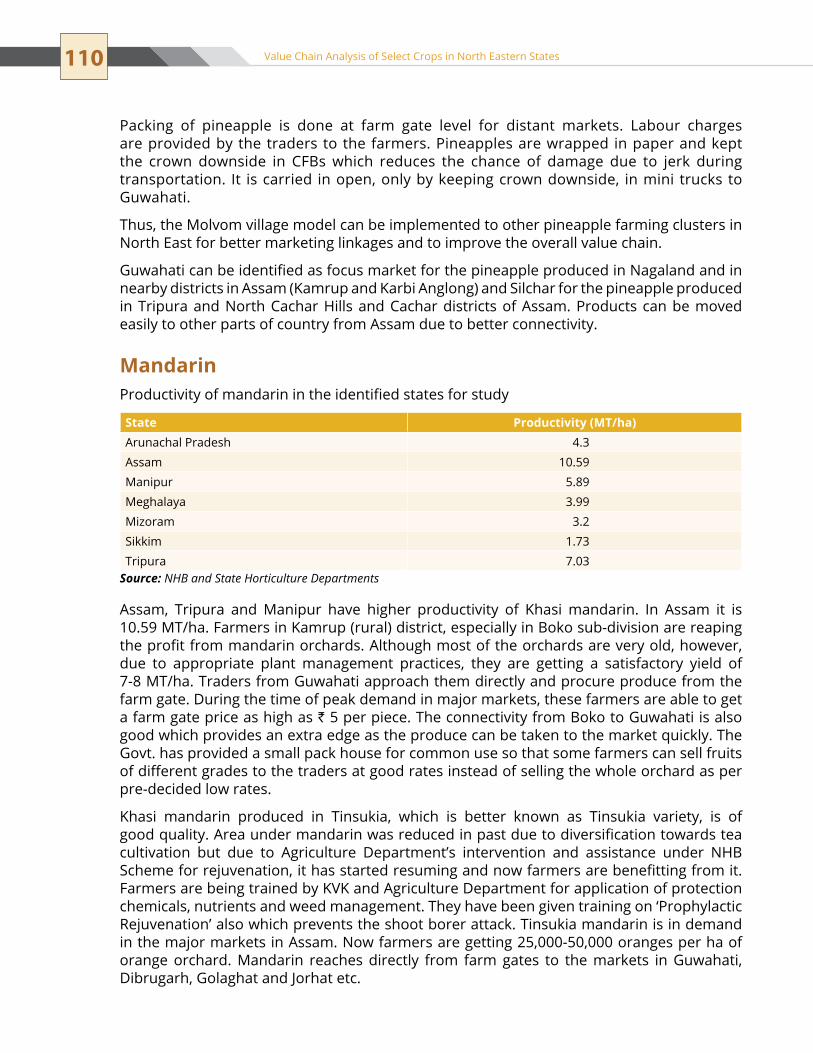
110 Value Chain Analysis of Select Crops in North Eastern States
Packing of pineapple is done at farm gate level for distant markets. Labour charges are provided by the traders to the farmers. Pineapples are wrapped in paper and kept the crown downside in CFBs which reduces the chance of damage due to jerk during transportation. It is carried in open, only by keeping crown downside, in mini trucks to Guwahati.
thus, the Molvom village model can be implemented to other pineapple farming clusters in North East for better marketing linkages and to improve the overall value chain.
Guwahati can be identified as focus market for the pineapple produced in Nagaland and in nearby districts in Assam (Kamrup and Karbi Anglong) and silchar for the pineapple produced in Tripura and North Cachar Hills and Cachar districts of Assam. Products can be moved easily to other parts of country from Assam due to better connectivity.
MandarinProductivity of mandarin in the identified states for study
State Productivity (MT/ha)Arunachal Pradesh 4.3
Assam 10.59
Manipur 5.89
Meghalaya 3.99
Mizoram 3.2
sikkim 1.73
tripura 7.03Source: NHB and State Horticulture Departments
Assam, Tripura and Manipur have higher productivity of Khasi mandarin. In Assam it is 10.59 MT/ha. Farmers in Kamrup (rural) district, especially in Boko sub-division are reaping the profit from mandarin orchards. Although most of the orchards are very old, however, due to appropriate plant management practices, they are getting a satisfactory yield of 7-8 MT/ha. Traders from Guwahati approach them directly and procure produce from the farm gate. During the time of peak demand in major markets, these farmers are able to get a farm gate price as high as ` 5 per piece. The connectivity from Boko to Guwahati is also good which provides an extra edge as the produce can be taken to the market quickly. The Govt. has provided a small pack house for common use so that some farmers can sell fruits of different grades to the traders at good rates instead of selling the whole orchard as per pre-decided low rates.
Khasi mandarin produced in tinsukia, which is better known as tinsukia variety, is of good quality. Area under mandarin was reduced in past due to diversification towards tea cultivation but due to Agriculture Department’s intervention and assistance under NHB Scheme for rejuvenation, it has started resuming and now farmers are benefitting from it. Farmers are being trained by KVK and Agriculture Department for application of protection chemicals, nutrients and weed management. They have been given training on ‘Prophylactic Rejuvenation’ also which prevents the shoot borer attack. Tinsukia mandarin is in demand in the major markets in Assam. Now farmers are getting 25,000-50,000 oranges per ha of orange orchard. Mandarin reaches directly from farm gates to the markets in Guwahati, Dibrugarh, Golaghat and Jorhat etc.

111Chapter 6 | Benchmarking with existing Best Practices
Farmers in the other North Eastern region can also get the good returns by direct contact with traders, availability of market at farm gate and by establishing the common facility centre for sorting and grading.
GingerProductivity of ginger in the identified states for study
State Productivity (MT/ha)Arunachal Pradesh 5.5Assam 6.88Manipur 11.57Meghalaya 5.79Mizoram 4.92nagaland 6.9sikkim 5.39
Source: NHB and State Horticulture Departments
Ginger is widely grown spice all over North Eastern Region and supplied to other major markets in the country. Assam is the largest producer and trader of ginger from NER. Ginger productivity in Assam is better than other states also. One of the two hill districts of Assam, Karbi Anglong has set new dimensions in ginger production and trading. A group of more than 1500 small and marginal tribal farmers are the part of Ginger Growers’ Co-operative Marketing Federation (Gin-Fed), an initiative of Rashtriya Sam Vikas yojana. Gin-Fed supplies directly to Azadpur Mandi, New Delhi. Farmers through middlemen were getting as low as ` 3-4 per kg but Gin-Fed minimised the distress selling and facilitated fair price. Farmer price ranges from ` 6-35/kg comparable to National mandis. It also arranges the procurement, primary processing, marketing information, obtaining order and shipment.
Farmers under Gin-Fed have been provided ‘G-card’ who doesn’t sell the produce anywhere else except Gin-Fed (but they are not bound to sell only to Gin-Fed). G-card assists in credit facility from public sector banks. Gin-Fed charges only for handling at ` 1.50 per kg and administrative cost at ` 0.30-1.00 per kg. Whatever extra profit is earned from the business goes to the shareholders’ (farmers) pocket. Gin-Fed has tie-ups with major traders in India such as ITC, Sresta Bio Products, NAFED, Stacon, RayFarm and Ace Agro. They are approached by leading firms in Japan and South Korea for organic ginger export as it has more oil content. Though ginger is grown in naturally organic condition but Gin-Fed is in the process of certification of the fields to facilitate direct export to European countries.
Railway has provided one parcel van facility to Gin-Fed to transport directly to New Delhi with charges as low as 50 paisa per kg. While transporting a 20 MT load by truck, costs ` 4-5 per kg (` 45,000-50,000 transportation cost plus other illegal taxes).
TurmericProductivity of turmeric in the identified states for study
State Productivity (MT/ha)Assam 0.7Manipur 11.34Meghalaya 5.06Mizoram 5.1sikkim 5.37
Source: NHB and State Horticulture Departments

112 Value Chain Analysis of Select Crops in North Eastern States
Turmeric is the second major spice crop in NER which is also grown in all eight NE States. In Mizoram, Mamit District is largest turmeric producer. Area under turmeric is more than any other spice crop. Reiek village in Reiek block of Mamit (12 km from Aizawl) is famous for turmeric cultivation. In Reiek, they have ‘Turmeric growing farmers’ society’ which sells turmeric rhizome to state Horticulture Department and the Department further supplies the rhizome all over state as seed material to farmers. Farmers generally grow Megha and Lakadong varieties. Local turmeric rhizome productivity is 10 MT/ha. Turmeric grown here is organic by nature as farmers don’t use any chemical input. Farmers are very laborious and cultivate as per training provided by the District Horticulture Department. Farmers in the Reiek village sell rhizomes, cured ginger and ginger powder as well. Traders from Aizawl and outside Mizoram visit the village for procurement of spices such as ginger, turmeric and Bird’s Eye chilli. There is small scale grinding machine where a group of farmers do the grinding. By forming the growers’ society, farmers of the village have acquired the ability to negotiate the price with traders. Turmeric rhizome is procured by Horticulture Department at ` 20-25 per kg, while cured turmeric is sold by the farmers at ` 60-80 per kg and powder at ` 100-150 per kg.
traders from Assam (mainly from Cachar and Karimganj) buy from here and sell to markets in Assam. But more than 50% of produced turmeric is procured by the Horticulture Department.

C H A P t e R
ConCLUsIon & ReCoMMenDAtIons
7
the value chain study has been carried out to examine the supply and demand dimensions of identified FCGs from North East Region, which can be sold in raw or processed form along with certain specialty crops such as passion fruit, kiwi, naga chilli, large cardamom etc. which are grown only in this region of the country have considerable domestic and international market potential which is yet to be exploited.
The value chain study has analysed the stages that these crops pass through, (FCGs) from production to end-consumer, identify the gaps and devise strategies to overcome these shortcomings. It has also been observed that the average productivity, production, technology, logistics, post-harvest and marketing infrastructure need to be upgraded for identified FCGs so that the potential of the region can be fully realised.
the major concerns that have emerged of the value chain study are:
Land Tenure and Ownership SystemLand ownership and laws are uneven and unclear in the entire NE Region. The entire system falls under the following three broad categories:
Land owned collectively by the villagers ��
Land owned by the tribal chiefs, who allot land among the individual households for ��
shifting cultivation purposes, andIndividually-owned land.��
Most of the horticultural crops have elongated conception periods and preliminary cost of establishment of orchard or plantation is high, which makes it almost impractical for the small and marginal farmers to go for such propositions without taking long-term credits from financial institutions such as banks. However, banks do not find it a very encouraging venture and are not sure about the recovery of loans because of the peculiar land tenure system, particularly in the tribal belts. Apart from this, the small farmers are not tuned to the idea of commercial horticulture cultivation and are not familiar with the formalities of acquiring bank loans.
Poor Cultivation Practices and Low Productivitysmall land holdings, poor investment capacity, general neglect and non-adoption of scientific cultivation practices are the major constraints for poor return from most of the horticultural crops in the ne Region and despite the favourable agro-climatic conditions, the rate of production and growth of all horticultural crops is far below the all India average.
114 Value Chain Analysis of Select Crops in North Eastern States
In most of the cases, the fruit orchards are very old and senile and the yields are very low. The high capital cost involved in establishing orchard/plantation and setting up of required infrastructure is a serious constraint in the expansion of area under fruit crops in the ne Region. Due to high altitudes, water runoff is rapid and therefore the region lacks water during the winter season despite having abundant rainfall in summer. Therefore, lack of irrigation facilities and the absence of water retention practices severely limits possibilities of multiple cropping, resulting in low land productivity.
In case of vegetables, by planting HyVs which take nearly 3.5 to 4 months from sowing to harvesting, instead of the traditional crops, which take nearly 5 to 6 months, it is possible to increase crop intensity without changing the irrigation facilities. However, these crops require large investments in terms of fertilisers, seeds and pesticides, which poor farmers (due to the small land holdings) are not able to afford.
shifting cultivation (jhum) is widely prevalent in NE Region of India. Though the cycle has now been shortened to 2-3 years because of increased population pressure on land and decrease in productivity, leading to utilisation of more area under jhuming. This system has caused large-scale deforestation, soil degradation/erosion (it removes nutrient-rich top soil) and depletion of resource base.
Poor and Weak Extension SystemDespite high potential, difficult terrain with poor connectivity, lack of trained & dedicated human resources and poor coordination among departments are some of the key factors responsible for ineffective and poor extension programme in the NE Region as compared to other states of India where the extension services are very efficient. However, the NE Region is lagging far behind in this aspect. Due to an inadequacy in the extension support staff and information dissemination system at the grass root level, farmers remained unaware of the latest technologies, govt. schemes and programmes pertaining to horticulture cultivation and promotion.
Poor Logistics and Connectivity Poor infrastructure in terms of roads and railways are the main constraints in the development of NE Region. From the trade point of view, existing rail infrastructure is mainly limited to Assam (broad gauge track). Due to hilly terrain, most of the farmers transport their saleables on head loads (in case of periodic markets), as the public transport in the region is expensive and mostly inaccessible from the production zones or villages. The head loads are carried to a distance of 1-5 kilometres on an average to reach the primary or rural markets or a point from where the motor transport is available for transporting the produce to the main markets. The movement of produce to main (urban) markets is through buses/mini trucks/jeeps that add up transportation costs. The estimated transportation loss from production zone to distant markets is approximately 15-20 percent and the farmer is able to get the price only for better quality produce. transportation of perishable produce is perhaps the most serious constraint in the development of horticulture in this region.

115Chapter 7 | Conclusion & Recommendations
Poor Marketing and Post-harvest Infrastructure Due to lack of organised and alternative marketing structure in the region, farmers are getting low return compared to the other parts of India, whereas the middlemen get the profit at their expense. Farmers in the existing market are cheated by middlemen (wholesalers/retailers) and the share (margin) which the farmers should be getting ends up with these middlemen. Except the organised tea industry, producers of almost all the commodities including specialised products such as kiwi and passion fruit, face considerable marketing problems. Due to poor markets and the perishable nature of the products the farmers sell their produce at a throwaway prices to the middlemen without even getting the opportunity to display them in the open market. Rural markets are much preferred by the farmers due to proximity to production cluster, less transportation cost and absence of trader’s cartel. However, rural markets lack the infrastructure such as covered sheds, platforms, plastic crates, sorting/grading machines etc., which is crucial to handle fresh produce.
Lack of primary processing, logistics, marketing and post-harvest infrastructure across various levels of the value chain, are the major factors for quality detoriation and value loss of the perishable produce in the region. For e.g., in case of pineapple, due to lack of assured market in neR, about 20-30 percent of the produce gets wasted and during the period of glut, when abundant produce is being taken to the markets, the farmers are not even able to recover the logistics cost and are forced to distress sell as they do not have any other option.
In the absence of plastic crates, farmers use gunny/jute bags, bamboo baskets for packaging of fresh produce which leads to post-harvest losses due to physical injury to the vegetables. Also, the shelf life of packaging material is very less and farmers need to spend frequently to purchase packaging material.
Lack of Processing IndustriesFor NE Region, the success of growing perishables is closely linked to the success of fruit processing units. The processing industry can help in sorting out the problem of proper disposal of perishable commodities. To date, there are hardly any cold storage facilities available; few processing units exist and those too are not functioning up to the desired capacity. use of appropriate pre and post-harvest practices is vital for the success of the crops and to provide good return to the growers. unfortunately, this is a major lacuna in the entire region. Value addition should be given top priority for crops such as pineapple, citrus, chilli, ginger and turmeric.
From the value chain analysis, it seems that the farmers are getting around 50 percent of the consumers’ price but in reality they get this price only for the high quality produce which fetches premium price in the market and the produce which reaches the market; so although farmers are getting good returns per unit produce, but the actual returns per unit area are very low. About 20-30 percent of the produce gets wasted at the farm level for which the farmers get nothing.
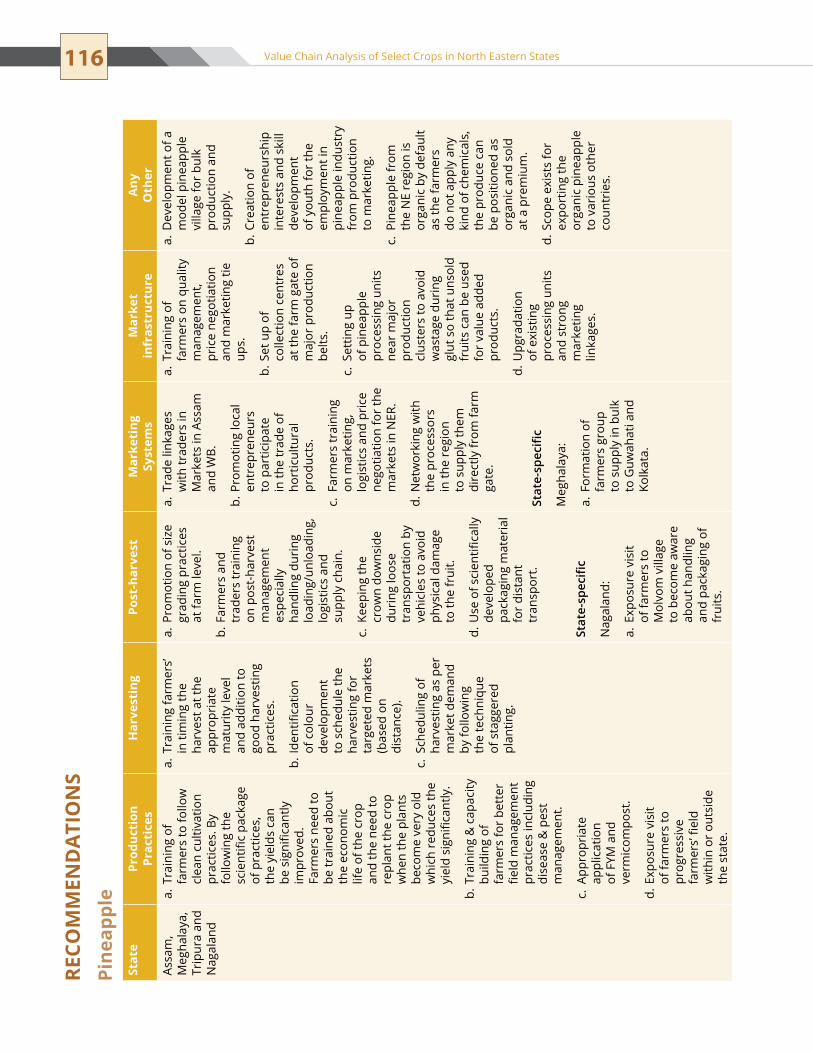
116 Value Chain Analysis of Select Crops in North Eastern States
RECO
MM
END
ATI
ON
SPi
neap
ple
Stat
ePr
oduc
tion
Pr
acti
ces
Har
vest
ing
Post
-har
vest
Mar
keti
ng
Syst
ems
Mar
ket
infr
astr
uctu
reA
ny
Oth
erAs
sam
, M
egha
laya
, tr
ipur
a an
d n
agal
and
trai
ning
of
a. fa
rmer
s to
follo
w
clea
n cu
ltiva
tion
prac
tices
. By
follo
win
g th
e sc
ient
ific
pack
age
of p
ract
ices
, th
e yi
elds
can
be
sig
nific
antly
im
prov
ed.
Farm
ers
need
to
be tr
aine
d ab
out
the
econ
omic
lif
e of
the
crop
an
d th
e ne
ed to
re
plan
t the
cro
p w
hen
the
plan
ts
beco
me
very
old
w
hich
red
uces
the
yiel
d si
gnifi
cant
ly.
trai
ning
& c
apac
ity
b. bu
ildin
g of
fa
rmer
s fo
r be
tter
fie
ld m
anag
emen
t pr
actic
es in
clud
ing
dise
ase
& p
est
man
agem
ent.
Appr
opri
ate
c. ap
plic
atio
n of
FyM
and
ve
rmic
ompo
st.
expo
sure
vis
it d.
of fa
rmer
s to
pr
ogre
ssiv
e fa
rmer
s’ fie
ld
with
in o
r ou
tsid
e th
e st
ate.
Trai
ning
farm
ers’
a. in
tim
ing
the
harv
est a
t the
ap
prop
riat
e m
atur
ity le
vel
and
addi
tion
to
good
har
vest
ing
prac
tices
.
Iden
tifica
tion
b. of
col
our
deve
lopm
ent
to s
ched
ule
the
harv
estin
g fo
r ta
rget
ed m
arke
ts
(bas
ed o
n di
stan
ce).
sche
dulin
g of
c.
harv
estin
g as
per
m
arke
t dem
and
by fo
llow
ing
the
tech
niqu
e of
sta
gger
ed
plan
ting.
Prom
otio
n of
siz
e a.
grad
ing
prac
tices
at
farm
leve
l.
Farm
ers
and
b. tr
ader
s tr
aini
ng
on p
ost-
harv
est
man
agem
ent
espe
cial
ly
hand
ling
duri
ng
load
ing/
unlo
adin
g,
logi
stic
s an
d su
pply
cha
in.
Keep
ing
the
c. cr
own
dow
nsid
e du
ring
loos
e tr
ansp
orta
tion
by
vehi
cles
to a
void
ph
ysic
al d
amag
e to
the
frui
t.
use
of s
cien
tifica
lly
d. de
velo
ped
pack
agin
g m
ater
ial
for
dist
ant
tran
spor
t.
Stat
e-sp
ecifi
c
nag
alan
d:
expo
sure
vis
it a.
of fa
rmer
s to
M
olvo
m v
illag
e to
bec
ome
awar
e ab
out h
andl
ing
and
pack
agin
g of
fr
uits
.
trad
e lin
kage
s a.
with
trad
ers
in
Mar
kets
in A
ssam
an
d W
B.
Prom
otin
g lo
cal
b. en
trep
rene
urs
to p
artic
ipat
e in
the
trad
e of
ho
rtic
ultu
ral
prod
ucts
.
Farm
ers
trai
ning
c.
on m
arke
ting,
lo
gist
ics
and
pric
e ne
gotia
tion
for
the
mar
kets
in N
ER.
net
wor
king
with
d.
the
proc
esso
rs
in th
e re
gion
to
sup
ply
them
di
rect
ly fr
om fa
rm
gate
.
Stat
e-sp
ecifi
c
Meg
hala
ya:
Form
atio
n of
a.
farm
ers
grou
p to
sup
ply
in b
ulk
to G
uwah
ati a
nd
Kolk
ata.
trai
ning
of
a. fa
rmer
s on
qua
lity
man
agem
ent,
pric
e ne
gotia
tion
and
mar
ketin
g tie
up
s.
set u
p of
b.
colle
ctio
n ce
ntre
s at
the
farm
gat
e of
m
ajor
pro
duct
ion
belts
.
sett
ing
up
c. of
pin
eapp
le
proc
essi
ng u
nits
ne
ar m
ajor
pr
oduc
tion
clus
ters
to a
void
w
asta
ge d
urin
g gl
ut s
o th
at u
nsol
d fr
uits
can
be
used
fo
r va
lue
adde
d pr
oduc
ts.
Upg
rada
tion
d. of
exi
stin
g pr
oces
sing
uni
ts
and
stro
ng
mar
ketin
g lin
kage
s.
Dev
elop
men
t of a
a.
mod
el p
inea
pple
vi
llage
for
bulk
pr
oduc
tion
and
supp
ly.
Crea
tion
of
b. en
trep
rene
ursh
ip
inte
rest
s an
d sk
ill
deve
lopm
ent
of y
outh
for
the
empl
oym
ent i
n pi
neap
ple
indu
stry
fr
om p
rodu
ctio
n to
mar
ketin
g.
Pine
appl
e fr
om
c. th
e n
e re
gion
is
orga
nic
by d
efau
lt as
the
farm
ers
do n
ot a
pply
any
ki
nd o
f che
mic
als,
th
e pr
oduc
e ca
n be
pos
ition
ed a
s or
gani
c an
d so
ld
at a
pre
miu
m.
scop
e ex
ists
for
d. ex
port
ing
the
orga
nic
pine
appl
e to
var
ious
oth
er
coun
trie
s.
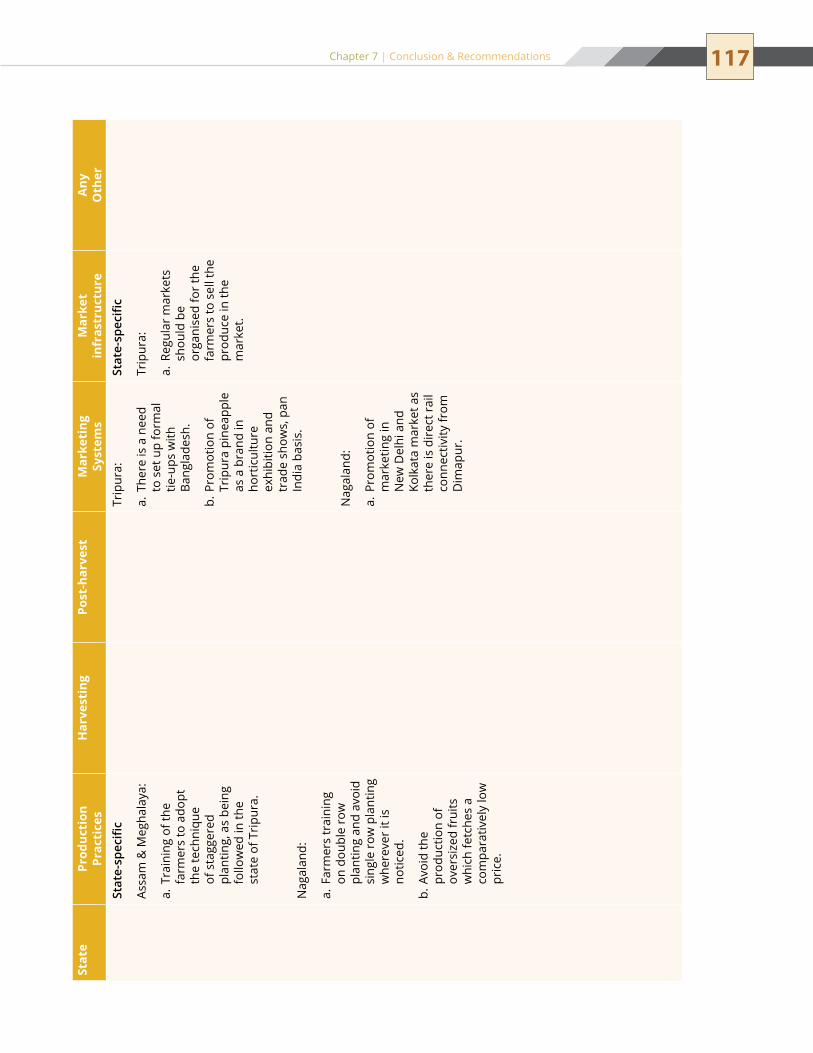
117Chapter 7 | Conclusion & Recommendations
Stat
ePr
oduc
tion
Pr
acti
ces
Har
vest
ing
Post
-har
vest
Mar
keti
ng
Syst
ems
Mar
ket
infr
astr
uctu
reA
ny
Oth
erSt
ate-
spec
ific
Assa
m &
Meg
hala
ya:
trai
ning
of t
he
a. fa
rmer
s to
ado
pt
the
tech
niqu
e of
sta
gger
ed
plan
ting,
as
bein
g fo
llow
ed in
the
stat
e of
Tri
pura
.
nag
alan
d:
Farm
ers
trai
ning
a.
on d
oubl
e ro
w
plan
ting
and
avoi
d si
ngle
row
pla
ntin
g w
here
ver
it is
no
ticed
.
Avoi
d th
e b.
prod
uctio
n of
ov
ersi
zed
frui
ts
whi
ch fe
tche
s a
com
para
tivel
y lo
w
pric
e.
trip
ura:
ther
e is
a n
eed
a. to
set
up
form
al
tie-u
ps w
ith
Bang
lade
sh.
Prom
otio
n of
b.
trip
ura
pine
appl
e as
a b
rand
in
hort
icul
ture
ex
hibi
tion
and
trad
e sh
ows,
pan
In
dia
basi
s.
nag
alan
d:
Prom
otio
n of
a.
mar
ketin
g in
n
ew D
elhi
and
Ko
lkat
a m
arke
t as
ther
e is
dir
ect r
ail
conn
ectiv
ity fr
om
Dim
apur
.
Stat
e-sp
ecifi
c
trip
ura:
Regu
lar
mar
kets
a.
shou
ld b
e or
gani
sed
for
the
farm
ers
to s
ell t
he
prod
uce
in th
e m
arke
t.
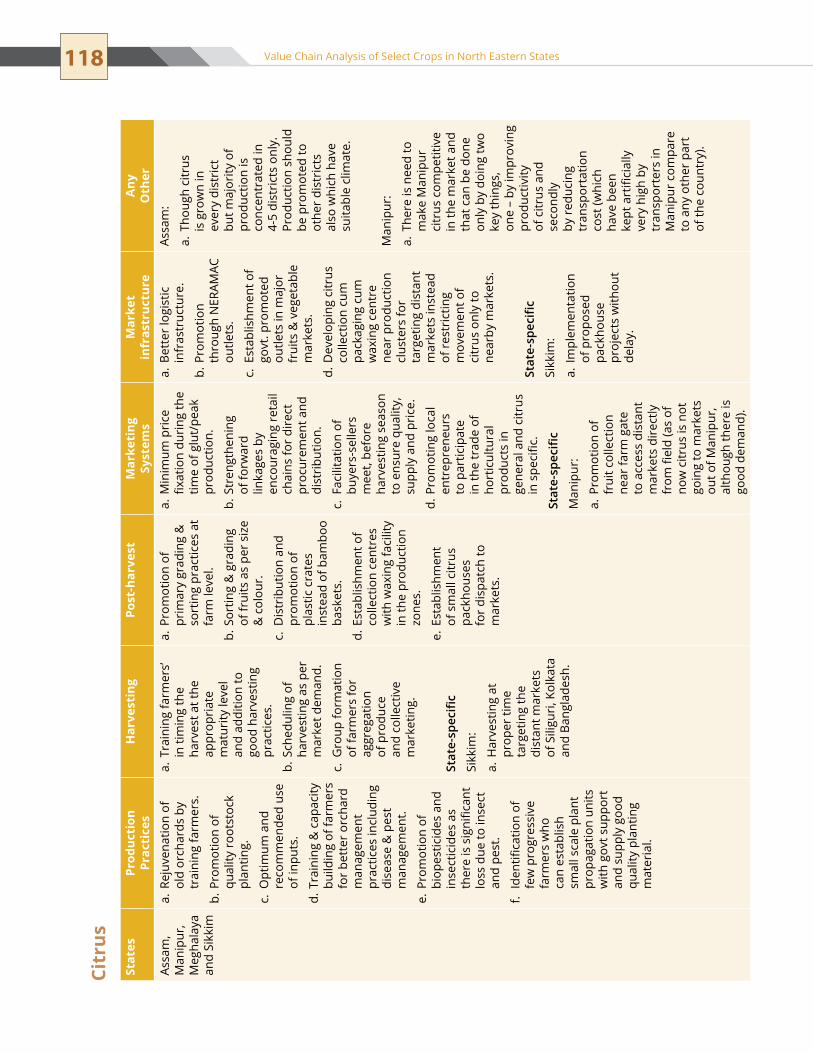
118 Value Chain Analysis of Select Crops in North Eastern States
Stat
esPr
oduc
tion
Pr
acti
ces
Har
vest
ing
Post
-har
vest
Mar
keti
ng
Syst
ems
Mar
ket
infr
astr
uctu
reA
ny
Oth
erAs
sam
, M
anip
ur,
Meg
hala
ya
and
sikk
im
Reju
vena
tion
of
a. ol
d or
char
ds b
y tr
aini
ng fa
rmer
s.
Prom
otio
n of
b.
qual
ity r
oots
tock
pl
antin
g.
opt
imum
and
c.
reco
mm
ende
d us
e of
inpu
ts.
trai
ning
& c
apac
ity
d. bu
ildin
g of
farm
ers
for
bett
er o
rcha
rd
man
agem
ent
prac
tices
incl
udin
g di
seas
e &
pes
t m
anag
emen
t.
Prom
otio
n of
e.
biop
estic
ides
and
in
sect
icid
es a
s th
ere
is s
igni
fican
t lo
ss d
ue to
inse
ct
and
pest
.
Iden
tifica
tion
of
f. fe
w p
rogr
essi
ve
farm
ers
who
ca
n es
tabl
ish
smal
l sca
le p
lant
pr
opag
atio
n un
its
with
gov
t sup
port
an
d su
pply
goo
d qu
ality
pla
ntin
g m
ater
ial.
Trai
ning
farm
ers’
a. in
tim
ing
the
harv
est a
t the
ap
prop
riat
e m
atur
ity le
vel
and
addi
tion
to
good
har
vest
ing
prac
tices
.
sche
dulin
g of
b.
harv
estin
g as
per
m
arke
t dem
and.
Gro
up fo
rmat
ion
c. of
farm
ers
for
aggr
egat
ion
of p
rodu
ce
and
colle
ctiv
e m
arke
ting.
Stat
e-sp
ecifi
c
sikk
im:
Har
vest
ing
at
a. pr
oper
tim
e ta
rget
ing
the
dist
ant m
arke
ts
of s
iligu
ri, K
olka
ta
and
Bang
lade
sh.
Prom
otio
n of
a.
prim
ary
grad
ing
&
sort
ing
prac
tices
at
farm
leve
l.
sort
ing
& g
radi
ng
b. of
frui
ts a
s pe
r si
ze
& c
olou
r.
Dis
trib
utio
n an
d c.
prom
otio
n of
pl
astic
cra
tes
inst
ead
of b
ambo
o ba
sket
s.
esta
blis
hmen
t of
d. co
llect
ion
cent
res
with
wax
ing
faci
lity
in th
e pr
oduc
tion
zone
s.
esta
blis
hmen
t e.
of s
mal
l citr
us
pack
hous
es
for
disp
atch
to
mar
kets
.
Min
imum
pri
ce
a. fix
atio
n du
ring
the
time
of g
lut/
peak
pr
oduc
tion.
stre
ngth
enin
g b.
of fo
rwar
d lin
kage
s by
en
cour
agin
g re
tail
chai
ns fo
r di
rect
pr
ocur
emen
t and
di
stri
butio
n.
Faci
litat
ion
of
c. bu
yers
-sel
lers
m
eet,
befo
re
harv
estin
g se
ason
to
ens
ure
qual
ity,
supp
ly a
nd p
rice
.
Prom
otin
g lo
cal
d. en
trep
rene
urs
to p
artic
ipat
e in
the
trad
e of
ho
rtic
ultu
ral
prod
ucts
in
gene
ral a
nd c
itrus
in
spe
cific
.
Stat
e-sp
ecifi
c
Man
ipur
:
Prom
otio
n of
a.
frui
t col
lect
ion
near
farm
gat
e to
acc
ess
dist
ant
mar
kets
dir
ectly
fr
om fi
eld
(as
of
now
citr
us is
not
go
ing
to m
arke
ts
out o
f Man
ipur
, al
thou
gh th
ere
is
good
dem
and)
.
Bett
er lo
gist
ic
a. in
fras
truc
ture
.
Prom
otio
n b.
thro
ugh
neR
AMAC
ou
tlets
.
esta
blis
hmen
t of
c. go
vt. p
rom
oted
ou
tlets
in m
ajor
fr
uits
& v
eget
able
m
arke
ts.
Dev
elop
ing
citr
us
d. co
llect
ion
cum
pa
ckag
ing
cum
w
axin
g ce
ntre
ne
ar p
rodu
ctio
n cl
uste
rs fo
r ta
rget
ing
dist
ant
mar
kets
inst
ead
of r
estr
ictin
g m
ovem
ent o
f ci
trus
onl
y to
ne
arby
mar
kets
.
Stat
e-sp
ecifi
c
sikk
im:
Impl
emen
tatio
n a.
of p
ropo
sed
pack
hous
e pr
ojec
ts w
ithou
t de
lay.
Assa
m:
thou
gh c
itrus
a.
is g
row
n in
ev
ery
dist
rict
bu
t maj
ority
of
prod
uctio
n is
co
ncen
trat
ed in
4-
5 di
stri
cts
only
. Pr
oduc
tion
shou
ld
be p
rom
oted
to
othe
r di
stri
cts
also
whi
ch h
ave
suita
ble
clim
ate.
Man
ipur
:
ther
e is
nee
d to
a.
mak
e M
anip
ur
citr
us c
ompe
titiv
e in
the
mar
ket a
nd
that
can
be
done
on
ly b
y do
ing
two
key
thin
gs,
one
– by
impr
ovin
g pr
oduc
tivity
of
citr
us a
nd
seco
ndly
by
red
ucin
g tr
ansp
orta
tion
cost
(whi
ch
have
bee
n ke
pt a
rtifi
cial
ly
very
hig
h by
tr
ansp
orte
rs in
M
anip
ur c
ompa
re
to a
ny o
ther
par
t of
the
coun
try)
.
Citr
us

119Chapter 7 | Conclusion & Recommendations
Stat
esPr
oduc
tion
Pr
acti
ces
Har
vest
ing
Post
-har
vest
Mar
keti
ng
Syst
ems
Mar
ket
infr
astr
uctu
reA
ny
Oth
er Fi
eld
g. de
mon
stra
tion
of in
tegr
ated
cu
ltiva
tion
pack
age
incl
udin
g nu
trie
nt
man
agem
ent b
y ex
tens
ion
wor
kers
in
the
farm
ers
orch
ard.
Faci
litat
ing
trad
e b.
with
trad
ers
from
di
stan
t mar
kets
su
ch a
s G
uwah
ati,
Kolk
ata
and
from
M
yanm
ar b
y in
trod
uctio
n to
pr
oduc
ers
and
orga
nisi
ng b
uyer
-se
ller
mee
ts.
Meg
hala
ya:
Form
atio
n of
a.
farm
ers’
grou
ps
and
tie-u
ps w
ith
trad
ers
in m
arke
ts
of s
hillo
ng a
nd
Guw
ahat
i.
sikk
im:
Bett
er p
olic
ies
a. to
pro
mot
e ex
port
trad
e w
ith
Bang
lade
sh a
nd
to p
lace
pro
duce
co
mpe
titiv
ely
agai
nst B
huta
n M
anda
rin
pr
ice-
wis
e.
Intr
oduc
tion
of
b. a
wid
e nu
mbe
r of
farm
ers
with
SI
MFE
D a
nd
neR
AMAC
for
dire
ct s
ellin
g an
d be
tter
pri
ce
real
isat
ion.
stre
ngth
en th
e b.
mar
ketin
g di
visi
on
of D
irec
tora
te
of H
ortic
ultu
re
and
Cash
Cro
p D
evel
opm
ent
depa
rtm
ent t
o im
prov
e th
e ho
rtic
ultu
re
mar
ketin
g fr
om
farm
gat
e to
m
arke
ts.
Invo
lvin
g lo
cal
b. yo
uth
and
entr
epre
neur
s in
bus
ines
s of
ho
rtic
ultu
ral
trad
e, a
s ou
tsid
ers
have
a lo
t of
appr
ehen
sion
in
doin
g bu
sine
ss
in M
anip
ur d
ue
to la
w a
nd o
rder
si
tuat
ion.
Meg
hala
ya:
set u
p of
farm
gat
e a.
logi
stic
ser
vice
s w
ill b
e he
lpfu
l to
colle
ct th
e fr
uits
fr
om s
catt
ered
or
char
ds a
s it
is
time
cons
umin
g to
car
ry th
e he
ad
load
s fr
om fi
eld
to
conn
ectin
g ro
ad
and
then
to lo
cal
mar
kets
and
fina
lly
mai
n m
arke
ts.
sikk
im:
Form
atio
n of
mor
e a.
farm
ers
grou
ps to
av
ail t
he e
xist
ing
subs
idy
prov
ided
by
sta
te g
ovt.
to tr
ansp
ort i
n si
ligur
i/Kol
kata
m
arke
ts.

120 Value Chain Analysis of Select Crops in North Eastern States
Stat
ePr
oduc
tion
Pr
acti
ces
Har
vest
ing
Post
Har
vest
Mar
keti
ng
Syst
ems
Mar
ket
infr
astr
uctu
reA
ny
Oth
erAs
sam
, M
egha
laya
an
d si
kkim
KVK
a. re
com
men
ded
pack
age
of
prac
tices
sho
uld
be fo
llow
ed
espe
cial
ly fo
r se
ed
rate
and
nut
rien
t re
quir
emen
t.
Impr
oved
see
d b.
vari
etie
s to
be
used
.
Cert
ifica
tion
of
c. pu
rely
org
anic
fie
lds.
Stat
e-sp
ecifi
c
sikk
im:
sele
ctio
n of
a.
farm
ers
for
seed
di
stri
butio
n sh
ould
no
t be
polit
ical
ly
influ
ence
d.
Wee
d b.
man
agem
ent
shou
ld b
e do
ne
duri
ng th
e cr
itica
l st
ages
.
Gin
ger
shou
ld
a. be
har
vest
ed a
s pe
r re
quir
emen
t/ta
rget
of f
resh
and
dr
y gi
nger
and
ha
rves
ting
shou
ld
not b
e de
laye
d.
Prop
er c
lean
ing
a. an
d w
ashi
ng.
Dry
ing
in h
ygie
nic
b. co
nditi
on.
trai
ning
on
post
-c.
harv
est h
andl
ing
and
pack
agin
g.
Use
of c
old
d. st
ores
whe
reve
r av
aila
ble.
Inte
rven
tion
of
a. go
vt. a
genc
ies
is n
eces
sary
to
min
imis
e th
e in
volv
emen
t of
var
ious
st
akeh
olde
r by
dir
ect
proc
urem
ent f
rom
fa
rmer
s/fa
rmer
s’ gr
oups
.
Effor
t sho
uld
be
b. m
ade
so th
at
farm
ers
can
get
a gr
eate
r pi
e of
pr
ofit c
ompa
red
to v
ario
us
stak
ehol
ders
in
volv
ed in
gin
ger
trad
ing.
ensu
re th
e c.
avai
labi
lity
of
logi
stic
ser
vice
s at
fa
rm g
ate
so th
at
farm
ers
can
com
e di
rect
ly to
mai
n m
arke
ts.
expo
sure
of
d. fa
rmer
s to
GIN
-FE
D in
Kar
bi
Angl
ong
for
impr
ovem
ent
in tr
adin
g &
m
arke
ting.
Gin
ger
farm
ers
e. sh
ould
be
supp
orte
d du
ring
st
eep
fall
of
pric
e by
gov
t. In
terf
eren
ce.
Indi
geno
us
a. cl
eani
ng a
nd
was
hing
faci
litie
s at
the
prod
uctio
n cl
uste
rs.
Co-o
pera
tive
b. m
odel
like
GIN
-FE
D s
houl
d be
im
plem
ente
d in
ot
her
clus
ters
al
so fo
r be
tter
m
arke
ting
linka
ges.
Stat
e-sp
ecifi
c
Assa
m:
Alre
ady
a. es
tabl
ishe
d in
tegr
ated
gin
ger
pack
hou
se in
Ka
mru
p sh
ould
ru
n sm
ooth
ly.
Meg
hala
ya:
Effici
ent u
tilis
atio
n a.
of e
xist
ing
proc
essi
ng u
nits
.
sett
ing
up o
f b.
proc
urem
ent
cent
res
in th
e cl
uste
rs d
urin
g ha
rves
ting
seas
on.
GIN
-FED
mod
el
a. sh
ould
be
stud
ied
as th
ey a
re
supp
lyin
g di
rect
ly
to A
zadp
ur m
andi
in
New
Del
hi.
Prom
otio
n of
b.
ging
er-b
ased
ba
kery
pro
duct
s ca
n be
don
e by
us
e of
org
anic
gi
nger
and
the
prod
ucts
can
be
sold
with
org
anic
br
andi
ng in
maj
or
citie
s.
Stat
e-sp
ecifi
c
sikk
im:
Gin
ger
grow
ing
a. fa
rmer
s w
ho
are
not r
ealis
ing
satis
fact
ory
profi
t fr
om th
e ve
ntur
e m
ay b
e tr
aine
d in
flo
ricu
lture
whi
ch
is v
ery
prom
isin
g in
Sik
kim
cur
rent
ly.
Gin
ger
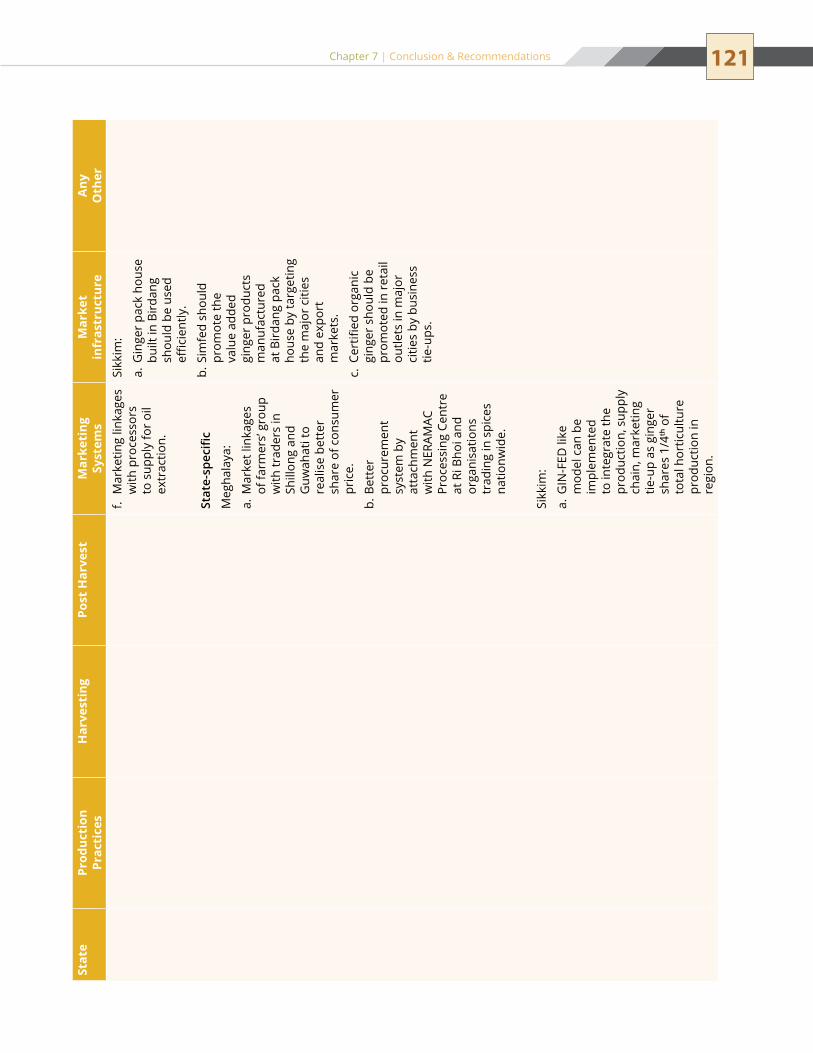
121Chapter 7 | Conclusion & Recommendations
Stat
ePr
oduc
tion
Pr
acti
ces
Har
vest
ing
Post
Har
vest
Mar
keti
ng
Syst
ems
Mar
ket
infr
astr
uctu
reA
ny
Oth
er M
arke
ting
linka
ges
f. w
ith p
roce
ssor
s to
sup
ply
for
oil
extr
actio
n.
Stat
e-sp
ecifi
c
Meg
hala
ya:
Mar
ket l
inka
ges
a. of
farm
ers’
grou
p w
ith tr
ader
s in
sh
illon
g an
d G
uwah
ati t
o re
alis
e be
tter
sh
are
of c
onsu
mer
pr
ice.
Bett
er
b. pr
ocur
emen
t sy
stem
by
atta
chm
ent
with
neR
AMAC
Pr
oces
sing
Cen
tre
at R
i Bho
i and
or
gani
satio
ns
trad
ing
in s
pice
s na
tionw
ide.
sikk
im:
GIN
-FED
like
a.
mod
el c
an b
e im
plem
ente
d to
inte
grat
e th
e pr
oduc
tion,
sup
ply
chai
n, m
arke
ting
tie-u
p as
gin
ger
shar
es 1
/4th
of
tota
l hor
ticul
ture
pr
oduc
tion
in
regi
on.
sikk
im:
Gin
ger
pack
hou
se
a. bu
ilt in
Bir
dang
sh
ould
be
used
effi
cien
tly.
sim
fed
shou
ld
b. pr
omot
e th
e va
lue
adde
d gi
nger
pro
duct
s m
anuf
actu
red
at B
irda
ng p
ack
hous
e by
targ
etin
g th
e m
ajor
citi
es
and
expo
rt
mar
kets
.
Cert
ified
org
anic
c.
ging
er s
houl
d be
pr
omot
ed in
ret
ail
outle
ts in
maj
or
citie
s by
bus
ines
s tie
-ups
.

122 Value Chain Analysis of Select Crops in North Eastern States
Stat
ePr
oduc
tion
Pr
acti
ces
Har
vest
ing
Post
-har
vest
Mar
keti
ng
Syst
ems
Mar
ket
infr
astr
uctu
reA
ny
Oth
erAs
sam
, M
egha
laya
an
d M
izor
am
Prop
er a
pplic
atio
n a.
of p
acka
ge o
f pr
actic
es to
im
prov
e th
e ov
eral
l yie
ld in
the
stat
e. tr
eatm
ent o
f b.
rhiz
omes
bef
ore
sow
ing
to a
void
rh
izom
e-bo
rne
dise
ases
.
Stat
e-sp
ecifi
cAs
sam
: Im
prov
e th
e se
ed
a. ra
te u
pto
2 M
t/ha
expo
sure
vis
it of
b.
turm
eric
farm
ers
to le
adin
g be
lts
in s
outh
Indi
a/M
izor
am.
Meg
hala
ya:
Use
of h
ealth
y a.
rhiz
omes
of
Laka
dong
var
iety
as
pla
ntin
g m
ater
ial.
Miz
oram
: In
crea
se th
e a.
prod
uctio
n ar
ea in
Ai
zaw
l dis
tric
t. Im
plem
enta
tion
b. of
Rei
ek m
odel
of
farm
ers
grou
p in
ot
her
prod
ucin
g be
lts.
turm
eric
sho
uld
a. no
t be
left
in
the
field
for
a lo
ng ti
me
afte
r m
atur
ity a
s it
affec
ts th
e qu
ality
. H
ence
, it s
houl
d be
don
e at
pro
per
time
of m
atur
ity.
Prop
er tr
aini
ng
a. sh
ould
be
impa
rted
in
was
hing
, gra
ding
, sl
icin
g an
d dr
ying
to
mat
ch th
e qu
ality
in n
atio
nal
mar
kets
. La
rge
leve
l cur
ing
b. at
the
farm
ers
plac
e sh
ould
be
pro
mot
ed
for
bett
er p
rice
re
alis
atio
n of
fin
ishe
d pr
oduc
t. Va
lue
addi
tion
c. ac
tiviti
es s
uch
as
pow
der-
mak
ing
and
curc
umin
ex
trac
tion
shou
ld
be p
rom
oted
un
der
agro
-bas
ed
indu
stry
.
Farm
ers
shou
ld
a. be
enc
oura
ged
to s
ell fi
nish
ed
turm
eric
. D
irec
t b.
proc
urem
ent
syst
em s
houl
d be
impl
emen
ted
thro
ugh
neR
AMAC
and
re
now
ned
priv
ate
orga
nisa
tions
. Li
nkag
e of
c.
farm
ers
grou
ps
with
trad
ers
in th
e ci
ties.
St
ate-
spec
ific
Meg
hala
ya:
Mar
ketin
g a.
linka
ge w
ith
natio
nal a
s w
ell
as in
tern
atio
nal
proc
esso
rs w
here
La
kado
ng v
arie
ty
is in
dem
and
due
to h
igh
curc
umin
co
nten
t. Br
andi
ng o
f b.
Laka
dong
tu
rmer
ic s
uch
as
Erod
e.
Miz
oram
: M
arke
ting
a. lin
kage
s w
ith s
pice
in
dust
ry in
stea
d of
mid
dlem
en
for
bett
er p
rice
re
alis
atio
n.
set u
p of
a.
scie
ntifi
c/in
dige
nous
sl
icin
g, d
ryin
g an
d gr
indi
ng u
nit a
t m
ajor
pro
duct
ion
belts
. se
t up
of v
alue
b.
addi
tion
&
proc
essi
ng u
nit t
o pr
ocur
e di
rect
ly
from
farm
ers
and
mar
ket f
urth
er to
m
ajor
loca
tions
. Co
mm
on
c. pr
ocur
emen
t in
fras
truc
ture
to
sell
in th
e m
arke
ts
outs
ide
the
stat
e.
Form
atio
n of
a.
turm
eric
vill
age
in
maj
or p
rodu
ctio
n di
stri
cts
and
trai
ning
on
scie
ntifi
c cu
ltiva
tion
to
impr
ove
the
prod
uctiv
ity.
Dir
ect l
inka
ge
b. w
ith r
egio
nal a
nd
dist
ant m
arke
ts.
Stat
e Sp
ecifi
cM
egha
laya
: G
.I. r
egis
trat
ion
of
a. La
kado
ng v
arie
ty.
Miz
oram
: ex
posu
re v
isit
of
a. lo
w p
rodu
ctio
n di
stri
cts
to M
amit
to a
dopt
bet
ter
prod
uctio
n an
d m
arke
ting
prac
tices
.
Turm
eric

123Chapter 7 | Conclusion & Recommendations
Vege
tabl
esSt
ate
Prod
ucti
on
Prac
tice
sH
arve
stin
gPo
st-h
arve
stM
arke
ting
Sy
stem
sM
arke
t in
fras
truc
ture
Assa
m a
nd
Meg
hala
ya Ve
geta
ble
farm
ers
shou
ld
a. be
trai
ned
prop
erly
for
syst
emat
ic c
ultiv
atio
n te
chni
ques
.
Avai
la b
ility
of g
ood
b. qu
ality
see
ds s
houl
d be
en
sure
d.
seed
s an
d ot
her
inpu
t c.
mat
eria
l sho
uld
be
proc
ured
eas
ily b
y fa
rmer
s.
Visi
t of V
LEW
s to
d.
vege
tabl
e fa
rmer
s at
re
gula
r in
terv
als.
Stat
e-sp
ecifi
c
Meg
hala
ya:
Prom
otio
n of
exo
tic
a. ve
geta
bles
can
be
done
at
com
mer
cial
leve
l as
the
agro
-clim
atic
co
nditi
on is
favo
urab
le.
org
anis
ed c
ultiv
atio
n of
b.
off s
easo
n ve
geta
bles
.
trai
ning
of
a. fa
rmer
s on
ha
rves
ting
prac
tices
, sea
sons
an
d as
per
m
arke
t dem
and
is
esse
ntia
l.
Stat
e-sp
ecifi
c
Meg
hala
ya:
Har
vest
ing
a. of
off
sea
son
vege
tabl
es s
houl
d be
man
aged
as
per
the
dem
and
in o
ther
sta
tes
whe
re it
is to
be
supp
lied.
Prop
er h
andl
ing
a. of
veg
etab
les
afte
r ha
rves
ting
and
duri
ng
load
ing
and
unlo
adin
g is
nec
essa
ry.
Use
of c
rate
s du
ring
b.
long
dis
tanc
e tr
ansp
orta
tion
to a
void
phy
sica
l da
mag
e.
Pack
agin
g of
c.
vege
tabl
es a
s pe
r m
arke
t req
uire
men
t an
d to
avo
id d
amag
e du
ring
tran
spor
tatio
n sh
ould
be
follo
wed
.
Use
of e
xist
ing
cold
d.
stor
es fo
r ve
geta
ble
stor
age
can
be
prom
oted
to a
void
w
asta
ge a
nd to
fa
cilit
ate
effici
ent
utili
satio
n of
col
d st
ores
.
trai
ning
of f
arm
ers
a. on
mar
ketin
g of
ve
geta
bles
is n
eces
sary
as
they
are
not
abl
e to
neg
otia
te w
ith
the
aggr
egat
ors/
cons
olid
ator
s.
Invo
lvem
ent o
f var
ious
b.
stak
ehol
ders
sho
uld
be m
inim
ised
by
esta
blis
hing
org
anis
ed
proc
urem
ent s
yste
m.
Gro
up o
f far
mer
s c.
can
be in
trod
uced
to
who
lesa
lers
in th
e m
ain
mar
kets
for
dire
ct
supp
ly.
Stat
e-sp
ecifi
c
Meg
hala
ya:
net
wor
king
of f
arm
ers
a. gr
oups
dir
ectly
with
th
e tr
ader
s in
dis
tant
m
arke
t to
impr
ove
the
shar
e of
pro
fit s
houl
d be
enc
oura
ged.
Vege
tabl
es s
houl
d b.
be n
otifi
ed in
the
regu
late
d m
arke
ts fo
r or
gani
sed
trad
ing.
esta
blis
hmen
t of v
eget
able
a.
pack
hous
e is
don
e on
ur
gent
bas
is.
Infr
astr
uctu
re in
the
b. re
gula
ted
mar
kets
sho
uld
be u
pgra
ded.
Form
atio
n of
col
lect
ion
c. ce
ntre
s at
maj
or
prod
uctio
n be
lts is
ne
cess
ary.
Logi
stic
sys
tem
from
farm
d.
gate
to c
onsu
mer
mar
kets
sh
ould
be
stre
ngth
en.
Basi
c fa
cilit
ies
such
as
e. offi
ce, s
heds
, hyg
ieni
city
, to
ilets
, wei
ghin
g fa
cilit
ies,
gr
adin
g an
d co
ld s
tore
s sh
ould
be
prov
ided
in th
e w
hole
sale
mar
kets
.
Was
tage
sho
uld
be
f. m
inim
ized
by
use
of
prop
er m
etho
ds, t
ools
and
fa
cilit
ies
from
pro
duct
ion
till e
nd c
onsu
mer
s.
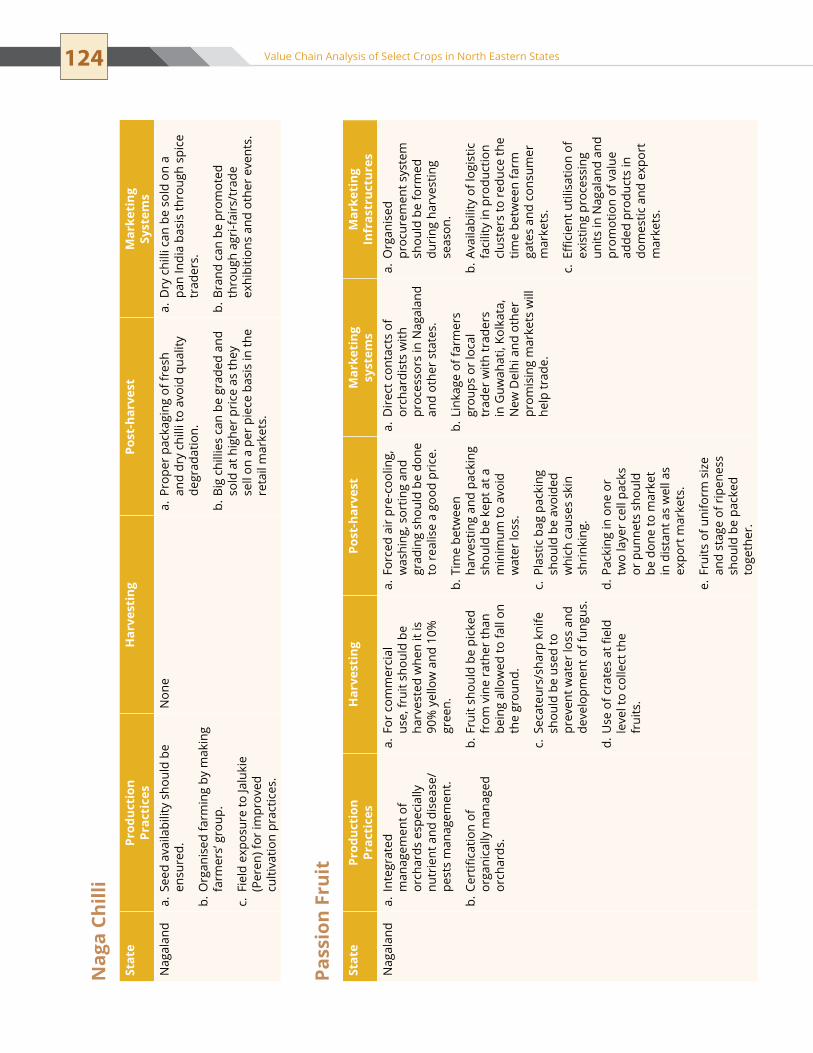
124 Value Chain Analysis of Select Crops in North Eastern States
Stat
ePr
oduc
tion
Pr
acti
ces
Har
vest
ing
Post
-har
vest
Mar
keti
ng
Syst
ems
nag
alan
d se
ed a
vaila
bilit
y sh
ould
be
a. en
sure
d.
org
anis
ed fa
rmin
g by
mak
ing
b. fa
rmer
s’ gr
oup.
Fiel
d ex
posu
re to
Jalu
kie
c. (P
eren
) for
impr
oved
cu
ltiva
tion
prac
tices
.
non
e Pr
oper
pac
kagi
ng o
f fre
sh
a. an
d dr
y ch
illi t
o av
oid
qual
ity
degr
adat
ion.
Big
chill
ies
can
be g
rade
d an
d b.
sold
at h
ighe
r pr
ice
as th
ey
sell
on a
per
pie
ce b
asis
in th
e re
tail
mar
kets
.
Dry
chi
lli c
an b
e so
ld o
n a
a. pa
n In
dia
basi
s th
roug
h sp
ice
trad
ers.
Bran
d ca
n be
pro
mot
ed
b. th
roug
h ag
ri-f
airs
/tra
de
exhi
bitio
ns a
nd o
ther
eve
nts.
Stat
ePr
oduc
tion
Pr
acti
ces
Har
vest
ing
Post
-har
vest
Mar
keti
ng
syst
ems
Mar
keti
ng
Infr
astr
uctu
res
nag
alan
d In
tegr
ated
a.
man
agem
ent o
f or
char
ds e
spec
ially
nu
trie
nt a
nd d
isea
se/
pest
s m
anag
emen
t.
Cert
ifica
tion
of
b. or
gani
cally
man
aged
or
char
ds.
For
com
mer
cial
a.
use,
frui
t sho
uld
be
harv
este
d w
hen
it is
90
% y
ello
w a
nd 1
0%
gree
n.
Frui
t sho
uld
be p
icke
d b.
from
vin
e ra
ther
than
be
ing
allo
wed
to fa
ll on
th
e gr
ound
.
seca
teur
s/sh
arp
knife
c.
shou
ld b
e us
ed to
pr
even
t wat
er lo
ss a
nd
deve
lopm
ent o
f fun
gus.
use
of c
rate
s at
fiel
d d.
leve
l to
colle
ct th
e fr
uits
.
Forc
ed a
ir p
re-c
oolin
g,
a. w
ashi
ng, s
ortin
g an
d gr
adin
g sh
ould
be
done
to
rea
lise
a go
od p
rice
.
tim
e be
twee
n b.
harv
estin
g an
d pa
ckin
g sh
ould
be
kept
at a
m
inim
um to
avo
id
wat
er lo
ss.
Plas
tic b
ag p
acki
ng
c. sh
ould
be
avoi
ded
whi
ch c
ause
s sk
in
shri
nkin
g.
Pack
ing
in o
ne o
r d.
two
laye
r ce
ll pa
cks
or p
unne
ts s
houl
d be
don
e to
mar
ket
in d
ista
nt a
s w
ell a
s ex
port
mar
kets
.
Frui
ts o
f uni
form
siz
e e.
and
stag
e of
rip
enes
s sh
ould
be
pack
ed
toge
ther
.
Dir
ect c
onta
cts
of
a. or
char
dist
s w
ith
proc
esso
rs in
nag
alan
d an
d ot
her
stat
es.
Link
age
of fa
rmer
s b.
grou
ps o
r lo
cal
trad
er w
ith tr
ader
s in
Guw
ahat
i, Ko
lkat
a,
new
Del
hi a
nd o
ther
pr
omis
ing
mar
kets
will
he
lp tr
ade.
org
anis
ed
a. pr
ocur
emen
t sys
tem
sh
ould
be
form
ed
duri
ng h
arve
stin
g se
ason
.
Avai
labi
lity
of lo
gist
ic
b. fa
cilit
y in
pro
duct
ion
clus
ters
to r
educ
e th
e tim
e be
twee
n fa
rm
gate
s an
d co
nsum
er
mar
kets
.
Effici
ent u
tilis
atio
n of
c.
exis
ting
proc
essi
ng
units
in n
agal
and
and
prom
otio
n of
val
ue
adde
d pr
oduc
ts in
do
mes
tic a
nd e
xpor
t m
arke
ts.
Nag
a Ch
illi
Pass
ion
Frui
t

125Chapter 7 | Conclusion & Recommendations
Kiw
i Fru
it
Larg
e Ca
rdam
om
Stat
ePr
oduc
tion
Pr
acti
ces
Har
vest
ing
Post
-har
vest
Mar
keti
ng
Syst
ems
Mar
keti
ng
Infr
astr
uctu
reAr
unac
hal
Prad
esh
Inte
grat
ed d
isea
se
a. an
d pe
st m
anag
emen
t es
peci
ally
pas
sion
vin
e ho
pper
.
Prun
ing
shou
ld
b. be
don
e at
pro
per
inte
rval
s.
Very
den
se p
lant
ing
c. sh
ould
be
avoi
ded
(6
X 6
sq
ft is
ac
cept
able
).
old
tree
s sh
ould
be
d. re
plac
ed w
ith n
ew
plan
ts.
Cert
ifica
tion
of
e. or
gani
cally
man
aged
or
char
ds.
Har
d be
rrie
s sh
ould
be
a. ha
rves
ted
for
targ
eted
di
stan
t mar
kets
.
seca
teur
s/sh
arp
knife
b.
shou
ld b
e us
ed fo
r ha
rves
ting.
use
of c
rate
s at
fiel
d c.
leve
l to
colle
ct th
e fr
uits
.
the
frui
ts c
an b
e st
ored
a.
for
abou
t one
mon
th
at r
oom
tem
pera
ture
an
d 4-
5 m
onth
s in
the
cold
sto
rage
at 1
0°C
to
exte
nd th
e m
arke
ting
peri
od.
Glu
t can
be
avoi
ded
by
b. ke
epin
g in
col
d st
orag
e fo
r th
e tim
e-be
ing.
Attr
activ
e pa
ckag
ing
c. to
fetc
h be
tter
pri
ce in
pr
ime
mar
kets
of m
ajor
ci
ties
of In
dia
as w
ell a
s ex
port
mar
kets
.
Crat
es s
houl
d be
use
d d.
for
tran
spor
tatio
n in
stea
d of
loos
e or
gu
nny
bag
pack
agin
g to
av
oid
phys
ical
dam
age.
Form
atio
n of
kiw
i a.
farm
ers’
grou
ps fo
r effi
cien
t mar
ketin
g pr
actic
es a
nd p
rice
ne
gotia
tion.
Mar
ketin
g th
roug
h b.
orga
nise
d ch
anne
l by
dire
ct p
rocu
rem
ent
from
farm
gat
e by
n
eRAM
AC a
nd o
ther
co
rpor
ate
grou
ps
invo
lved
in fr
uits
and
ve
geta
ble
vent
ures
.
Logi
stic
sys
tem
sho
uld
a. be
upg
rade
d to
acc
ess
the
maj
or m
arke
ts in
In
dia
as it
is s
een
that
ki
wi f
rom
new
Zea
land
ca
n ac
cess
the
Indi
an
mar
kets
eas
ily b
ut k
iwi
prod
uced
in A
runa
chal
Pr
ades
h is
faci
ng
diffi
culti
es in
rea
chin
g th
e m
arke
ts.
Inte
grat
ed p
ack
hous
e b.
shou
ld b
e in
stal
led
to
grad
e hi
gh q
ualit
y ki
wi
to ta
rget
the
expo
rt
mar
kets
and
pri
me
Indi
an m
arke
ts.
Stat
ePr
oduc
tion
Pr
acti
ces
Har
vest
Post
-har
vest
Mar
keti
ng
syst
ems
Mar
keti
ng
Infr
astr
uctu
res
sikk
im U
se o
f hea
lthy
and
a. m
icro
-pro
paga
ted
plan
ting
mat
eria
ls.
Repl
acem
ent o
f old
b.
plan
ts w
ith n
ew
ones
to in
crea
se th
e pr
oduc
tivity
.
Prop
er w
eed
c. m
anag
emen
t in
the
field
s.
Fiel
ds s
houl
d be
a.
clea
ned
of d
ried
pla
nts,
le
aves
and
stu
bble
s.
Har
vest
ing
is d
one
b. w
hen
top
caps
ules
of
the
spik
e at
tain
dar
k gr
ey c
olou
r.
Pseu
dost
ems
shou
ld
c. be
rem
oved
dur
ing
harv
estin
g.
Har
vest
ed s
pike
s a.
shou
ld n
ot b
e le
ft
for
long
er d
urat
ion
beca
use
it is
hig
hly
peri
shab
le.
Fuel
pip
e sy
stem
b.
shou
ld b
e ad
opte
d in
stea
d of
ope
n BH
AttI
to
mai
ntai
n th
e co
lour
an
d fla
vour
and
av
oid
the
burn
ing
of
caps
ules
.
A w
ide
num
ber
a. of
farm
ers
can
be
enco
urag
ed to
sel
l th
roug
h n
eRAM
AC-
orga
nise
d au
ctio
ning
sy
stem
.
Logi
stic
sup
port
sho
uld
a. be
pro
vide
d to
farm
ers
livin
g at
dis
tanc
e pl
aces
to
rea
ch th
e au
ctio
n ce
ntre
at R
ong
Po.
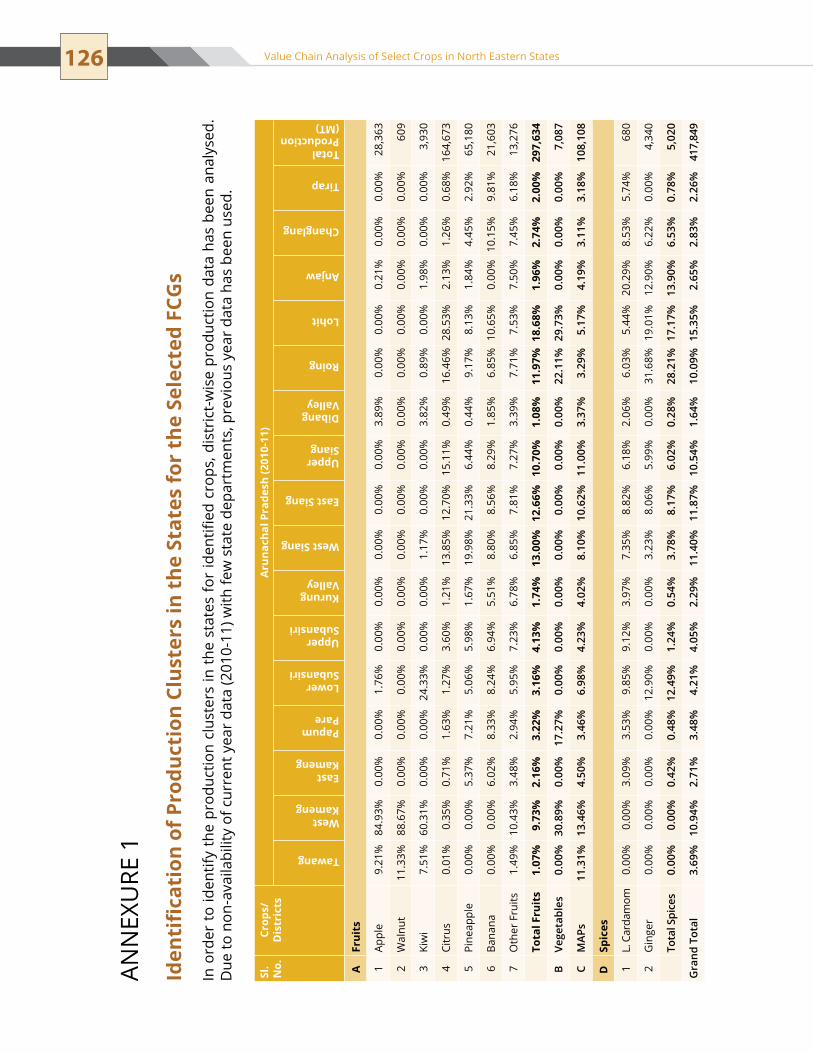
126 Value Chain Analysis of Select Crops in North Eastern States
ANN
EXu
RE 1
Iden
tifi
cati
on o
f Pro
duct
ion
Clus
ters
in t
he S
tate
s fo
r th
e Se
lect
ed F
CGs
In o
rder
to
iden
tify
the
prod
uctio
n cl
uste
rs in
the
sta
tes
for
iden
tified
cro
ps, d
istr
ict-
wis
e pr
oduc
tion
data
has
bee
n an
alys
ed.
Due
to n
on-a
vaila
bilit
y of
cur
rent
yea
r da
ta (2
010-
11) w
ith fe
w s
tate
dep
artm
ents
, pre
viou
s ye
ar d
ata
has
been
use
d.
Sl.
No.
Crop
s/D
istr
icts
Aru
nach
al P
rade
sh (2
010-
11)
Tawang
West Kameng
East Kameng
Papum Pare
Lower Subansiri
Upper Subansiri
Kurung Valley
West Siang
East Siang
Upper Siang
Dibang Valley
Roing
Lohit
Anjaw
Changlang
Tirap
Total Production (MT)
AFr
uits
1Ap
ple
9.21
%84
.93%
0.00
%0.
00%
1.76
%0.
00%
0.00
%0.
00%
0.00
%0.
00%
3.89
%0.
00%
0.00
%0.
21%
0.00
%0.
00%
28,3
63
2W
alnu
t11
.33%
88.6
7%0.
00%
0.00
%0.
00%
0.00
%0.
00%
0.00
%0.
00%
0.00
%0.
00%
0.00
%0.
00%
0.00
%0.
00%
0.00
%60
9
3Ki
wi
7.51
%60
.31%
0.00
%0.
00%
24.3
3%0.
00%
0.00
%1.
17%
0.00
%0.
00%
3.82
%0.
89%
0.00
%1.
98%
0.00
%0.
00%
3,93
0
4Ci
trus
0.01
%0.
35%
0.71
%1.
63%
1.27
%3.
60%
1.21
%13
.85%
12.7
0%15
.11%
0.49
%16
.46%
28.5
3%2.
13%
1.26
%0.
68%
164,
673
5Pi
neap
ple
0.00
%0.
00%
5.37
%7.
21%
5.06
%5.
98%
1.67
%19
.98%
21.3
3%6.
44%
0.44
%9.
17%
8.13
%1.
84%
4.45
%2.
92%
65,1
80
6Ba
nana
0.00
%0.
00%
6.02
%8.
33%
8.24
%6.
94%
5.51
%8.
80%
8.56
%8.
29%
1.85
%6.
85%
10.6
5%0.
00%
10.1
5%9.
81%
21,6
03
7O
ther
Fru
its1.
49%
10.4
3%3.
48%
2.94
%5.
95%
7.23
%6.
78%
6.85
%7.
81%
7.27
%3.
39%
7.71
%7.
53%
7.50
%7.
45%
6.18
%13
,276
Tota
l Fru
its
1.07
%9.
73%
2.16
%3.
22%
3.16
%4.
13%
1.74
%13
.00%
12.6
6%10
.70%
1.08
%11
.97%
18.6
8%1.
96%
2.74
%2.
00%
297,
634
BVe
geta
bles
0.00
%30
.89%
0.00
%17
.27%
0.00
%0.
00%
0.00
%0.
00%
0.00
%0.
00%
0.00
%22
.11%
29.7
3%0.
00%
0.00
%0.
00%
7,08
7
CM
APs
11.3
1%13
.46%
4.50
%3.
46%
6.98
%4.
23%
4.02
%8.
10%
10.6
2%11
.00%
3.37
%3.
29%
5.17
%4.
19%
3.11
%3.
18%
108,
108
DSp
ices
1L.
Car
dam
om0.
00%
0.00
%3.
09%
3.53
%9.
85%
9.12
%3.
97%
7.35
%8.
82%
6.18
%2.
06%
6.03
%5.
44%
20.2
9%8.
53%
5.74
%68
0
2G
inge
r0.
00%
0.00
%0.
00%
0.00
%12
.90%
0.00
%0.
00%
3.23
%8.
06%
5.99
%0.
00%
31.6
8%19
.01%
12.9
0%6.
22%
0.00
%4,
340
Tota
l Spi
ces
0.00
%0.
00%
0.42
%0.
48%
12.4
9%1.
24%
0.54
%3.
78%
8.17
%6.
02%
0.28
%28
.21%
17.1
7%13
.90%
6.53
%0.
78%
5,02
0
Gra
nd T
otal
3.69
%10
.94%
2.71
%3.
48%
4.21
%4.
05%
2.29
%11
.40%
11.8
7%10
.54%
1.64
%10
.09%
15.3
5%2.
65%
2.83
%2.
26%
417,
849
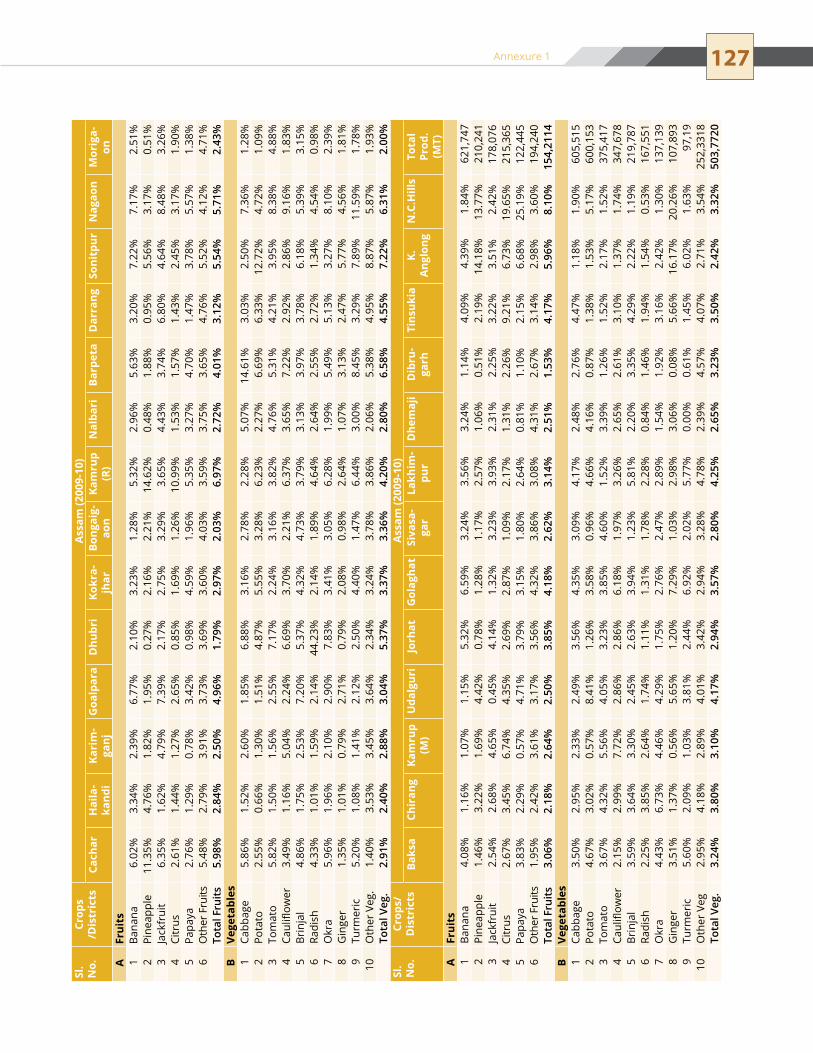
127 Annexure 1
Sl.
No.
Crop
s /D
istr
icts
Ass
am (2
009-
10)
Cach
arH
aila
-ka
ndi
Kari
m-
ganj
Goa
lpar
aD
hubr
iKo
kra-
jhar
Bong
aig-
aon
Kam
rup
(R)
Nal
bari
Barp
eta
Dar
rang
Soni
tpur
Nag
aon
Mor
iga-
onA
Frui
ts1
Bana
na6.
02%
3.34
%2.
39%
6.77
%2.
10%
3.23
%1.
28%
5.32
%2.
96%
5.63
%3.
20%
7.22
%7.
17%
2.51
%2
Pine
appl
e11
.35%
4.76
%1.
82%
1.95
%0.
27%
2.16
%2.
21%
14.6
2%0.
48%
1.88
%0.
95%
5.56
%3.
17%
0.51
%3
Jack
frui
t6.
35%
1.62
%4.
79%
7.39
%2.
17%
2.75
%3.
29%
3.65
%4.
43%
3.74
%6.
80%
4.64
%8.
48%
3.26
%4
Citr
us2.
61%
1.44
%1.
27%
2.65
%0.
85%
1.69
%1.
26%
10.9
9%1.
53%
1.57
%1.
43%
2.45
%3.
17%
1.90
%5
Papa
ya2.
76%
1.29
%0.
78%
3.42
%0.
98%
4.59
%1.
96%
5.35
%3.
27%
4.70
%1.
47%
3.78
%5.
57%
1.38
%6
Oth
er F
ruits
5.48
%2.
79%
3.91
%3.
73%
3.69
%3.
60%
4.03
%3.
59%
3.75
%3.
65%
4.76
%5.
52%
4.12
%4.
71%
Tota
l Fru
its5.
98%
2.84
%2.
50%
4.96
%1.
79%
2.97
%2.
03%
6.97
%2.
72%
4.01
%3.
12%
5.54
%5.
71%
2.43
%B
Vege
tabl
es1
Cabb
age
5.86
%1.
52%
2.60
%1.
85%
6.88
%3.
16%
2.78
%2.
28%
5.07
%14
.61%
3.03
%2.
50%
7.36
%1.
28%
2Po
tato
2.55
%0.
66%
1.30
%1.
51%
4.87
%5.
55%
3.28
%6.
23%
2.27
%6.
69%
6.33
%12
.72%
4.72
%1.
09%
3to
mat
o5.
82%
1.50
%1.
56%
2.55
%7.
17%
2.24
%3.
16%
3.82
%4.
76%
5.31
%4.
21%
3.95
%8.
38%
4.88
%4
Caul
iflow
er3.
49%
1.16
%5.
04%
2.24
%6.
69%
3.70
%2.
21%
6.37
%3.
65%
7.22
%2.
92%
2.86
%9.
16%
1.83
%5
Brin
jal
4.86
%1.
75%
2.53
%7.
20%
5.37
%4.
32%
4.73
%3.
79%
3.13
%3.
97%
3.78
%6.
18%
5.39
%3.
15%
6Ra
dish
4.33
%1.
01%
1.59
%2.
14%
44.2
3%2.
14%
1.89
%4.
64%
2.64
%2.
55%
2.72
%1.
34%
4.54
%0.
98%
7o
kra
5.96
%1.
96%
2.10
%2.
90%
7.83
%3.
41%
3.05
%6.
28%
1.99
%5.
49%
5.13
%3.
27%
8.10
%2.
39%
8G
inge
r1.
35%
1.01
%0.
79%
2.71
%0.
79%
2.08
%0.
98%
2.64
%1.
07%
3.13
%2.
47%
5.77
%4.
56%
1.81
%9
turm
eric
5.20
%1.
08%
1.41
%2.
12%
2.50
%4.
40%
1.47
%6.
44%
3.00
%8.
45%
3.29
%7.
89%
11.5
9%1.
78%
10O
ther
Veg
.1.
40%
3.53
%3.
45%
3.64
%2.
34%
3.24
%3.
78%
3.86
%2.
06%
5.38
%4.
95%
8.87
%5.
87%
1.93
%To
tal V
eg.
2.91
%2.
40%
2.88
%3.
04%
5.37
%3.
37%
3.36
%4.
20%
2.80
%6.
58%
4.55
%7.
22%
6.31
%2.
00%
Sl.
No.
Crop
s/
Dis
tric
tsA
ssam
(200
9-10
)Ba
ksa
Chir
ang
Kam
rup
(M)
Uda
lgur
iJo
rhat
Gol
agha
tSi
vasa
-ga
rLa
khim
-pu
rD
hem
aji
Dib
ru-
garh
Tins
ukia
K.
Ang
long
N.C
.Hill
sTo
tal
Prod
. (M
T)A
Frui
ts1
Bana
na4.
08%
1.16
%1.
07%
1.15
%5.
32%
6.59
%3.
24%
3.56
%3.
24%
1.14
%4.
09%
4.39
%1.
84%
621,
747
2Pi
neap
ple
1.46
%3.
22%
1.69
%4.
42%
0.78
%1.
28%
1.17
%2.
57%
1.06
%0.
51%
2.19
%14
.18%
13.7
7%21
0,24
13
Jack
frui
t2.
54%
2.68
%4.
65%
0.45
%4.
14%
1.32
%3.
23%
3.93
%2.
31%
2.25
%3.
22%
3.51
%2.
42%
178,
076
4Ci
trus
2.67
%3.
45%
6.74
%4.
35%
2.69
%2.
87%
1.09
%2.
17%
1.31
%2.
26%
9.21
%6.
73%
19.6
5%21
5,36
55
Papa
ya3.
83%
2.29
%0.
57%
4.71
%3.
79%
3.15
%1.
80%
2.64
%0.
81%
1.10
%2.
15%
6.68
%25
.19%
122,
445
6O
ther
Fru
its1.
95%
2.42
%3.
61%
3.17
%3.
56%
4.32
%3.
86%
3.08
%4.
31%
2.67
%3.
14%
2.98
%3.
60%
194,
240
Tota
l Fru
its3.
06%
2.18
%2.
64%
2.50
%3.
85%
4.18
%2.
62%
3.14
%2.
51%
1.53
%4.
17%
5.96
%8.
10%
154,
2114
BVe
geta
bles
1Ca
bbag
e3.
50%
2.95
%2.
33%
2.49
%3.
56%
4.35
%3.
09%
4.17
%2.
48%
2.76
%4.
47%
1.18
%1.
90%
605,
515
2Po
tato
4.67
%3.
02%
0.57
%8.
41%
1.26
%3.
58%
0.96
%4.
66%
4.16
%0.
87%
1.38
%1.
53%
5.17
%60
0,15
33
tom
ato
3.67
%4.
32%
5.56
%4.
05%
3.23
%3.
85%
4.60
%1.
52%
3.39
%1.
26%
1.52
%2.
17%
1.52
%37
5,41
74
Caul
iflow
er2.
15%
2.99
%7.
72%
2.86
%2.
86%
6.18
%1.
97%
3.26
%2.
65%
2.61
%3.
10%
1.37
%1.
74%
347,
678
5Br
inja
l3.
59%
3.64
%3.
30%
2.45
%2.
63%
3.94
%1.
23%
5.81
%2.
20%
3.35
%4.
29%
2.22
%1.
19%
219,
787
6Ra
dish
2.25
%3.
85%
2.64
%1.
74%
1.11
%1.
31%
1.78
%2.
28%
0.84
%1.
46%
1.94
%1.
54%
0.53
%16
7,55
17
okr
a4.
43%
6.73
%4.
46%
4.29
%1.
75%
2.76
%2.
47%
2.89
%1.
54%
1.92
%3.
16%
2.42
%1.
30%
137,
139
8G
inge
r3.
51%
1.37
%0.
56%
5.65
%1.
20%
7.29
%1.
03%
2.98
%3.
06%
0.08
%5.
66%
16.1
7%20
.26%
107,
893
9tu
rmer
ic5.
60%
2.09
%1.
03%
3.81
%2.
44%
6.92
%2.
02%
5.77
%0.
00%
0.61
%1.
45%
6.02
%1.
63%
97,1
910
Oth
er V
eg2.
95%
4.18
%2.
89%
4.01
%3.
42%
2.94
%3.
28%
4.78
%2.
39%
4.57
%4.
07%
2.71
%3.
54%
252,
3318
Tota
l Veg
.3.
24%
3.80
%3.
10%
4.17
%2.
94%
3.57
%2.
80%
4.25
%2.
65%
3.23
%3.
50%
2.42
%3.
32%
503,
7720
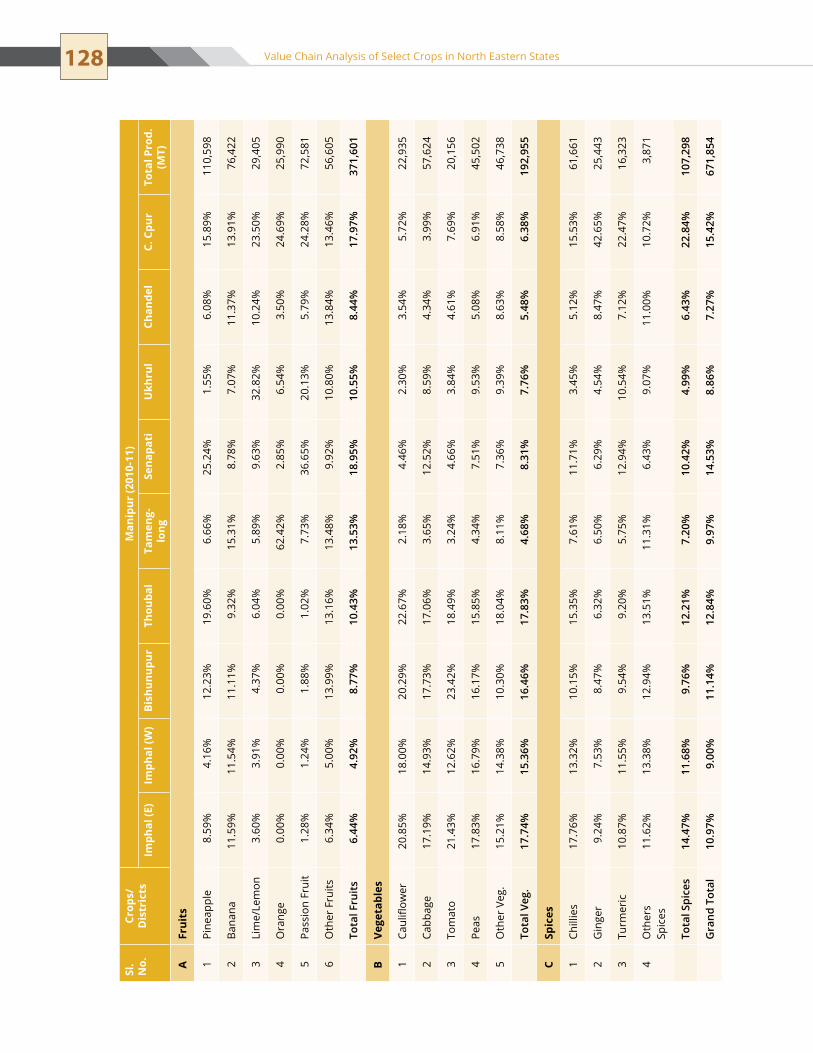
128 Value Chain Analysis of Select Crops in North Eastern States
Sl.
No.
Crop
s/
Dis
tric
tsM
anip
ur (2
010-
11)
Imph
al (E
)Im
phal
(W)
Bish
unup
urTh
ouba
lTa
men
g-lo
ngSe
napa
tiU
khru
lCh
ande
lC.
Cpu
rTo
tal P
rod.
(M
T)
AFr
uits
1Pi
neap
ple
8.59
%4.
16%
12.2
3%19
.60%
6.66
%25
.24%
1.55
%6.
08%
15.8
9%11
0,59
8
2Ba
nana
11.5
9%11
.54%
11.1
1%9.
32%
15.3
1%8.
78%
7.07
%11
.37%
13.9
1%76
,422
3Li
me/
Lem
on3.
60%
3.91
%4.
37%
6.04
%5.
89%
9.63
%32
.82%
10.2
4%23
.50%
29,4
05
4o
rang
e0.
00%
0.00
%0.
00%
0.00
%62
.42%
2.85
%6.
54%
3.50
%24
.69%
25,9
90
5Pa
ssio
n Fr
uit
1.28
%1.
24%
1.88
%1.
02%
7.73
%36
.65%
20.1
3%5.
79%
24.2
8%72
,581
6O
ther
Fru
its6.
34%
5.00
%13
.99%
13.1
6%13
.48%
9.92
%10
.80%
13.8
4%13
.46%
56,6
05
Tota
l Fru
its
6.44
%4.
92%
8.77
%10
.43%
13.5
3%18
.95%
10.5
5%8.
44%
17.9
7%37
1,60
1
BVe
geta
bles
1Ca
ulifl
ower
20.8
5%18
.00%
20.2
9%22
.67%
2.18
%4.
46%
2.30
%3.
54%
5.72
%22
,935
2Ca
bbag
e17
.19%
14.9
3%17
.73%
17.0
6%3.
65%
12.5
2%8.
59%
4.34
%3.
99%
57,6
24
3to
mat
o21
.43%
12.6
2%23
.42%
18.4
9%3.
24%
4.66
%3.
84%
4.61
%7.
69%
20,1
56
4Pe
as17
.83%
16.7
9%16
.17%
15.8
5%4.
34%
7.51
%9.
53%
5.08
%6.
91%
45,5
02
5O
ther
Veg
.15
.21%
14.3
8%10
.30%
18.0
4%8.
11%
7.36
%9.
39%
8.63
%8.
58%
46,7
38
Tota
l Veg
.17
.74%
15.3
6%16
.46%
17.8
3%4.
68%
8.31
%7.
76%
5.48
%6.
38%
192,
955
CSp
ices
1Ch
illie
s17
.76%
13.3
2%10
.15%
15.3
5%7.
61%
11.7
1%3.
45%
5.12
%15
.53%
61,6
61
2G
inge
r9.
24%
7.53
%8.
47%
6.32
%6.
50%
6.29
%4.
54%
8.47
%42
.65%
25,4
43
3tu
rmer
ic10
.87%
11.5
5%9.
54%
9.20
%5.
75%
12.9
4%10
.54%
7.12
%22
.47%
16,3
23
4o
ther
s sp
ices
11.6
2%13
.38%
12.9
4%13
.51%
11.3
1%6.
43%
9.07
%11
.00%
10.7
2%3,
871
Tota
l Spi
ces
14.4
7%11
.68%
9.76
%12
.21%
7.20
%10
.42%
4.99
%6.
43%
22.8
4%10
7,29
8
Gra
nd T
otal
10.9
7%9.
00%
11.1
4%12
.84%
9.97
%14
.53%
8.86
%7.
27%
15.4
2%67
1,85
4
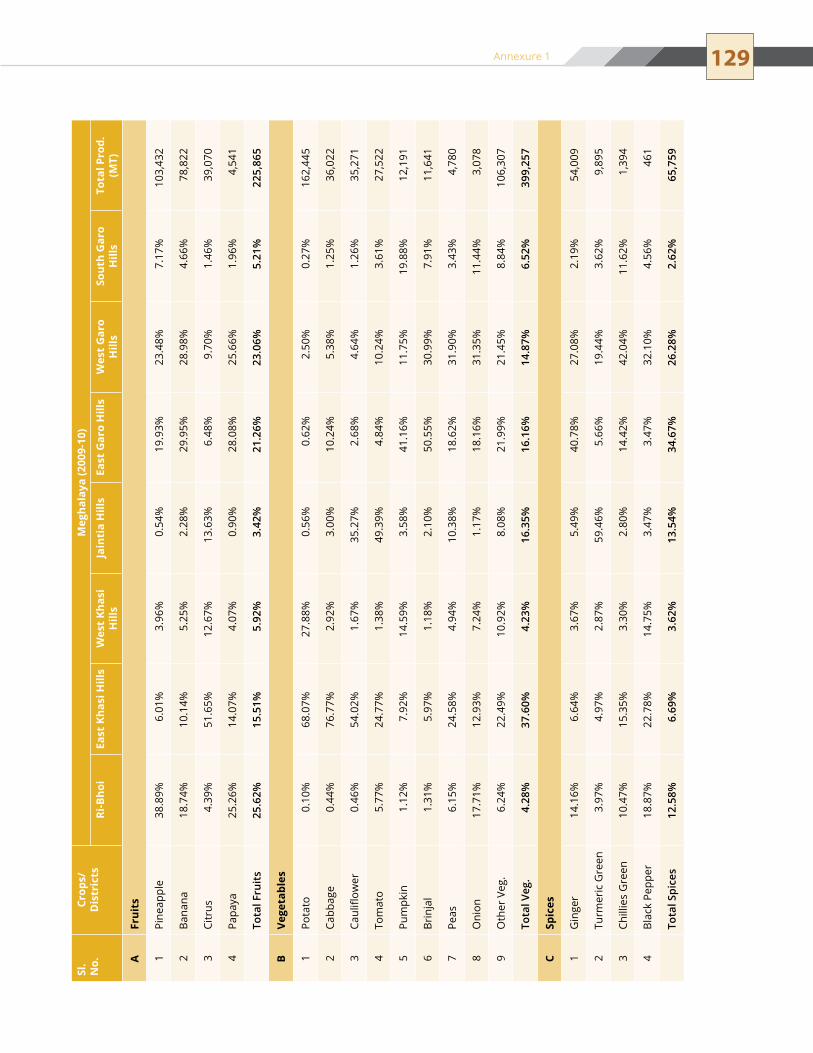
129Sl
. N
o.Cr
ops/
D
istr
icts
Meg
hala
ya (2
009-
10)
Ri-B
hoi
East
Kha
si H
ills
Wes
t Kh
asi
Hill
sJa
inti
a H
ills
East
Gar
o H
ills
Wes
t G
aro
Hill
sSo
uth
Gar
o H
ills
Tota
l Pro
d.
(MT)
AFr
uits
1Pi
neap
ple
38.8
9%6.
01%
3.96
%0.
54%
19.9
3%23
.48%
7.17
%10
3,43
2
2Ba
nana
18.7
4%10
.14%
5.25
%2.
28%
29.9
5%28
.98%
4.66
%78
,822
3Ci
trus
4.39
%51
.65%
12.6
7%13
.63%
6.48
%9.
70%
1.46
%39
,070
4Pa
paya
25.2
6%14
.07%
4.07
%0.
90%
28.0
8%25
.66%
1.96
%4,
541
Tota
l Fru
its
25.6
2%15
.51%
5.92
%3.
42%
21.2
6%23
.06%
5.21
%22
5,86
5
BVe
geta
bles
1Po
tato
0.10
%68
.07%
27.8
8%0.
56%
0.62
%2.
50%
0.27
%16
2,44
5
2Ca
bbag
e0.
44%
76.7
7%2.
92%
3.00
%10
.24%
5.38
%1.
25%
36,0
22
3Ca
ulifl
ower
0.46
%54
.02%
1.67
%35
.27%
2.68
%4.
64%
1.26
%35
,271
4to
mat
o5.
77%
24.7
7%1.
38%
49.3
9%4.
84%
10.2
4%3.
61%
27,5
22
5Pu
mpk
in1.
12%
7.92
%14
.59%
3.58
%41
.16%
11.7
5%19
.88%
12,1
91
6Br
inja
l1.
31%
5.97
%1.
18%
2.10
%50
.55%
30.9
9%7.
91%
11,6
41
7Pe
as6.
15%
24.5
8%4.
94%
10.3
8%18
.62%
31.9
0%3.
43%
4,78
0
8o
nion
17.7
1%12
.93%
7.24
%1.
17%
18.1
6%31
.35%
11.4
4%3,
078
9O
ther
Veg
.6.
24%
22.4
9%10
.92%
8.08
%21
.99%
21.4
5%8.
84%
106,
307
Tota
l Veg
.4.
28%
37.6
0%4.
23%
16.3
5%16
.16%
14.8
7%6.
52%
399,
257
CSp
ices
1G
inge
r14
.16%
6.64
%3.
67%
5.49
%40
.78%
27.0
8%2.
19%
54,0
09
2Tu
rmer
ic G
reen
3.97
%4.
97%
2.87
%59
.46%
5.66
%19
.44%
3.62
%9,
895
3Ch
illie
s G
reen
10.4
7%15
.35%
3.30
%2.
80%
14.4
2%42
.04%
11.6
2%1,
394
4Bl
ack
Pepp
er18
.87%
22.7
8%14
.75%
3.47
%3.
47%
32.1
0%4.
56%
461
Tota
l Spi
ces
12.5
8%6.
69%
3.62
%13
.54%
34.6
7%26
.28%
2.62
%65
,759
Annexure 1
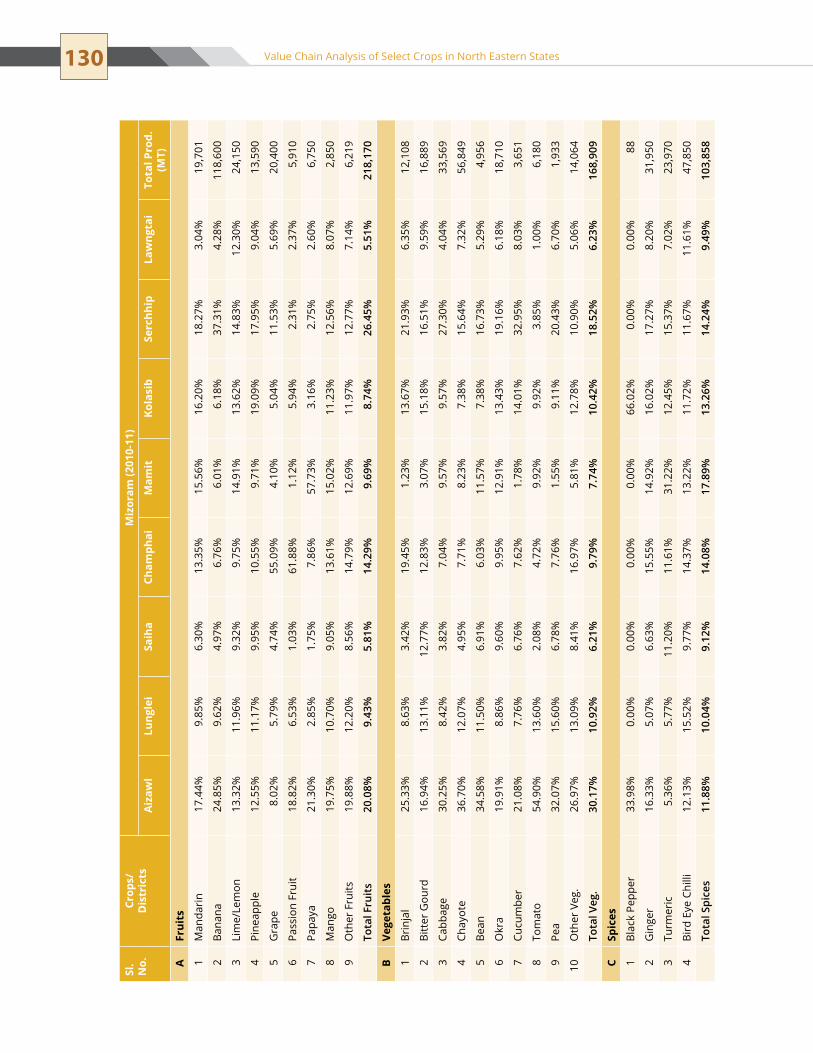
130 Value Chain Analysis of Select Crops in North Eastern States
Sl.
No.
Crop
s/
Dis
tric
tsM
izor
am (2
010-
11)
Aiz
awl
Lung
lei
Saih
aCh
amph
aiM
amit
Kola
sib
Serc
hhip
Law
ngta
iTo
tal P
rod.
(M
T)
AFr
uits
1M
anda
rin
17.4
4%9.
85%
6.30
%13
.35%
15.5
6%16
.20%
18.2
7%3.
04%
19,7
01
2Ba
nana
24.8
5%9.
62%
4.97
%6.
76%
6.01
%6.
18%
37.3
1%4.
28%
118,
600
3Li
me/
Lem
on13
.32%
11.9
6%9.
32%
9.75
%14
.91%
13.6
2%14
.83%
12.3
0%24
,150
4Pi
neap
ple
12.5
5%11
.17%
9.95
%10
.55%
9.71
%19
.09%
17.9
5%9.
04%
13,5
90
5G
rape
8.02
%5.
79%
4.74
%55
.09%
4.10
%5.
04%
11.5
3%5.
69%
20,4
00
6Pa
ssio
n Fr
uit
18.8
2%6.
53%
1.03
%61
.88%
1.12
%5.
94%
2.31
%2.
37%
5,91
0
7Pa
paya
21.3
0%2.
85%
1.75
%7.
86%
57.7
3%3.
16%
2.75
%2.
60%
6,75
0
8M
ango
19.7
5%10
.70%
9.05
%13
.61%
15.0
2%11
.23%
12.5
6%8.
07%
2,85
0
9O
ther
Fru
its19
.88%
12.2
0%8.
56%
14.7
9%12
.69%
11.9
7%12
.77%
7.14
%6,
219
Tota
l Fru
its
20.0
8%9.
43%
5.81
%14
.29%
9.69
%8.
74%
26.4
5%5.
51%
218,
170
BVe
geta
bles
1Br
inja
l25
.33%
8.63
%3.
42%
19.4
5%1.
23%
13.6
7%21
.93%
6.35
%12
,108
2Bi
tter
Gou
rd16
.94%
13.1
1%12
.77%
12.8
3%3.
07%
15.1
8%16
.51%
9.59
%16
,889
3Ca
bbag
e30
.25%
8.42
%3.
82%
7.04
%9.
57%
9.57
%27
.30%
4.04
%33
,569
4Ch
ayot
e36
.70%
12.0
7%4.
95%
7.71
%8.
23%
7.38
%15
.64%
7.32
%56
,849
5Be
an34
.58%
11.5
0%6.
91%
6.03
%11
.57%
7.38
%16
.73%
5.29
%4,
956
6o
kra
19.9
1%8.
86%
9.60
%9.
95%
12.9
1%13
.43%
19.1
6%6.
18%
18,7
10
7Cu
cum
ber
21.0
8%7.
76%
6.76
%7.
62%
1.78
%14
.01%
32.9
5%8.
03%
3,65
1
8to
mat
o54
.90%
13.6
0%2.
08%
4.72
%9.
92%
9.92
%3.
85%
1.00
%6,
180
9Pe
a32
.07%
15.6
0%6.
78%
7.76
%1.
55%
9.11
%20
.43%
6.70
%1,
933
10O
ther
Veg
.26
.97%
13.0
9%8.
41%
16.9
7%5.
81%
12.7
8%10
.90%
5.06
%14
,064
Tota
l Veg
.30
.17%
10.9
2%6.
21%
9.79
%7.
74%
10.4
2%18
.52%
6.23
%16
8,90
9
CSp
ices
1Bl
ack
Pepp
er33
.98%
0.00
%0.
00%
0.00
%0.
00%
66.0
2%0.
00%
0.00
%88
2G
inge
r16
.33%
5.07
%6.
63%
15.5
5%14
.92%
16.0
2%17
.27%
8.20
%31
,950
3tu
rmer
ic5.
36%
5.77
%11
.20%
11.6
1%31
.22%
12.4
5%15
.37%
7.02
%23
,970
4Bi
rd e
ye C
hilli
12.1
3%15
.52%
9.77
%14
.37%
13.2
2%11
.72%
11.6
7%11
.61%
47,8
50
Tota
l Spi
ces
11.8
8%10
.04%
9.12
%14
.08%
17.8
9%13
.26%
14.2
4%9.
49%
103,
858
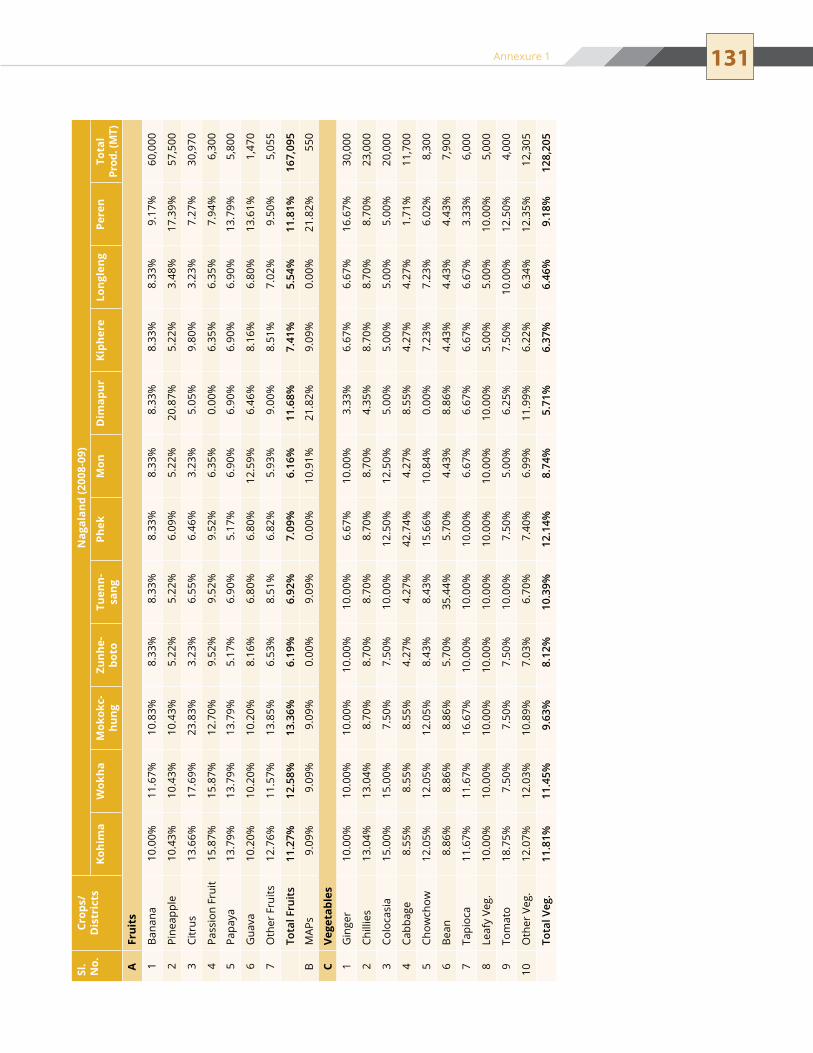
131Sl
. N
o.Cr
ops/
D
istr
icts
Nag
alan
d (2
008-
09)
Kohi
ma
Wok
haM
okok
c-hu
ngZu
nhe-
boto
Tuen
n-sa
ngPh
ekM
onD
imap
urKi
pher
eLo
ngle
ngPe
ren
Tota
l Pr
od. (
MT)
AFr
uits
1Ba
nana
10.0
0%11
.67%
10.8
3%8.
33%
8.33
%8.
33%
8.33
%8.
33%
8.33
%8.
33%
9.17
%60
,000
2Pi
neap
ple
10.4
3%10
.43%
10.4
3%5.
22%
5.22
%6.
09%
5.22
%20
.87%
5.22
%3.
48%
17.3
9%57
,500
3Ci
trus
13.6
6%17
.69%
23.8
3%3.
23%
6.55
%6.
46%
3.23
%5.
05%
9.80
%3.
23%
7.27
%30
,970
4Pa
ssio
n Fr
uit
15.8
7%15
.87%
12.7
0%9.
52%
9.52
%9.
52%
6.35
%0.
00%
6.35
%6.
35%
7.94
%6,
300
5Pa
paya
13.7
9%13
.79%
13.7
9%5.
17%
6.90
%5.
17%
6.90
%6.
90%
6.90
%6.
90%
13.7
9%5,
800
6G
uava
10.2
0%10
.20%
10.2
0%8.
16%
6.80
%6.
80%
12.5
9%6.
46%
8.16
%6.
80%
13.6
1%1,
470
7O
ther
Fru
its12
.76%
11.5
7%13
.85%
6.53
%8.
51%
6.82
%5.
93%
9.00
%8.
51%
7.02
%9.
50%
5,05
5
Tota
l Fru
its
11.2
7%12
.58%
13.3
6%6.
19%
6.92
%7.
09%
6.16
%11
.68%
7.41
%5.
54%
11.8
1%16
7,09
5
BM
APs
9.09
%9.
09%
9.09
%0.
00%
9.09
%0.
00%
10.9
1%21
.82%
9.09
%0.
00%
21.8
2%55
0
CVe
geta
bles
1G
inge
r10
.00%
10.0
0%10
.00%
10.0
0%10
.00%
6.67
%10
.00%
3.33
%6.
67%
6.67
%16
.67%
30,0
00
2Ch
illie
s13
.04%
13.0
4%8.
70%
8.70
%8.
70%
8.70
%8.
70%
4.35
%8.
70%
8.70
%8.
70%
23,0
00
3Co
loca
sia
15.0
0%15
.00%
7.50
%7.
50%
10.0
0%12
.50%
12.5
0%5.
00%
5.00
%5.
00%
5.00
%20
,000
4Ca
bbag
e8.
55%
8.55
%8.
55%
4.27
%4.
27%
42.7
4%4.
27%
8.55
%4.
27%
4.27
%1.
71%
11,7
00
5Ch
owch
ow12
.05%
12.0
5%12
.05%
8.43
%8.
43%
15.6
6%10
.84%
0.00
%7.
23%
7.23
%6.
02%
8,30
0
6Be
an8.
86%
8.86
%8.
86%
5.70
%35
.44%
5.70
%4.
43%
8.86
%4.
43%
4.43
%4.
43%
7,90
0
7ta
pioc
a11
.67%
11.6
7%16
.67%
10.0
0%10
.00%
10.0
0%6.
67%
6.67
%6.
67%
6.67
%3.
33%
6,00
0
8Le
afy
Veg.
10.0
0%10
.00%
10.0
0%10
.00%
10.0
0%10
.00%
10.0
0%10
.00%
5.00
%5.
00%
10.0
0%5,
000
9to
mat
o18
.75%
7.50
%7.
50%
7.50
%10
.00%
7.50
%5.
00%
6.25
%7.
50%
10.0
0%12
.50%
4,00
0
10O
ther
Veg
.12
.07%
12.0
3%10
.89%
7.03
%6.
70%
7.40
%6.
99%
11.9
9%6.
22%
6.34
%12
.35%
12,3
05
Tota
l Veg
.11
.81%
11.4
5%9.
63%
8.12
%10
.39%
12.1
4%8.
74%
5.71
%6.
37%
6.46
%9.
18%
128,
205
Annexure 1

132 Value Chain Analysis of Select Crops in North Eastern States
Sl.
No.
Crop
s/
Dis
tric
tsSi
kkim
(200
6-07
)N
orth
East
Sout
hW
est
Tota
l Pro
d. (M
T)A
Frui
ts1
ora
nge
0.81
%46
.18%
18.8
7%34
.14%
9,30
02
Pass
ion
Frui
t7.
11%
44.6
6%22
.92%
25.3
0%2,
533
Oth
er F
ruits
2.71
%37
.56%
24.4
0%35
.33%
3,94
6To
tal F
ruit
s1.
48%
43.6
3%20
.56%
34.3
2%13
,499
BVe
geta
bles
1Kh
arif
Veg.
10.5
1%32
.52%
31.9
3%25
.04%
14,1
992
Rabi
Veg
.5.
99%
32.5
2%34
.91%
26.5
8%17
,101
3O
ff s
easo
n Ve
g.9.
41%
30.1
6%32
.39%
28.0
5%12
,900
Tota
l Veg
.8.
44%
31.8
3%33
.22%
26.5
2%44
,200
CTo
tal R
oot &
Tub
er C
rops
6.70
%27
.97%
26.6
2%38
.70%
36,5
98D
Spic
es1
L. C
arda
mom
31.9
3%30
.61%
19.8
9%17
.57%
3,18
22
Gin
ger
1.82
%34
.08%
36.5
4%27
.57%
36,0
013
turm
eric
4.55
%25
.64%
47.0
3%22
.77%
2,02
0To
tal S
pice
s4.
28%
33.4
0%35
.76%
26.5
6%41
,203
Sl.
No.
Crop
s/D
istr
icts
Trip
ura
(200
9-10
)So
uth
Wes
t D
hala
i N
orth
To
tal P
rod.
(MT)
AFr
uits
1Ja
ckfr
uit
30.0
1%28
.37%
22.1
0%19
.52%
251,
569.
002
Pine
appl
e23
.41%
24.4
7%18
.11%
34.0
0%11
7,53
1.00
3Ba
nana
18.5
9%53
.83%
13.3
7%14
.21%
105,
615.
004
ora
nge
7.76
%0.
19%
11.1
3%80
.91%
22,2
30.0
05
Papa
ya27
.19%
24.7
3%22
.17%
25.9
1%18
,455
.00
6Li
tchi
38.5
2%20
.72%
16.5
9%24
.17%
16,9
72.0
07
Man
go51
.07%
25.9
8%7.
68%
15.2
8%13
,170
.00
8Li
me/
Lem
on26
.23%
39.4
8%23
.32%
10.9
8%11
,716
.00
9O
ther
Fru
its22
.77%
35.0
6%13
.10%
29.0
7%16
,567
.00
Tota
l Fru
its
26.0
5%31
.19%
18.5
3%24
.23%
573,
825.
00B
Vege
tabl
es1
Pota
to45
.12%
26.6
3%10
.69%
17.5
6%99
,416
.00
2to
mat
o32
.55%
43.0
4%9.
47%
14.9
4%29
,550
.00
3Br
inja
l22
.53%
63.1
8%6.
01%
8.27
%22
,651
.00
4Ra
dish
22.0
2%55
.81%
3.73
%18
.44%
19,0
68.0
05
Cola
casi
a24
.01%
30.8
2%4.
87%
40.3
0%18
,426
.00
6O
ther
Veg
etab
les
24.1
0%49
.86%
10.8
2%15
.22%
133,
886.
70To
tal V
eget
able
s25
.91%
49.5
4%8.
63%
15.9
2%34
7,52
7.70
CSp
ices
1G
inge
r61
.01%
11.3
0%12
.42%
15.2
8%7,
932.
002
turm
eric
40.4
9%28
.80%
6.82
%23
.89%
5,96
5.00
3Ch
illy
52.8
6%30
.47%
7.10
%9.
57%
3,04
2.00
4Bl
ack
Pepp
er16
.04%
41.5
1%2.
83%
39.6
2%10
6.00
5To
tal S
pice
s52
.45%
21.1
8%8.
83%
17.5
4%16
,929
.40

133
ANNEXuRE 2Agriculture Marketing and Post-Harvest InfrastructureArunachal PradeshScenario of Agricultural Marketing in Arunachal PradeshThe Government of Arunachal Pradesh has enacted the Arunachal Pradesh Marketing (Regulation) Act, 1989 to provide for a legal mechanism to establish and regulate markets in Arunachal Pradesh with a view to remove the handicaps from which a farmer was suffering. this will be done by ensuring fair and remunerative prices of their produce by rationalising/standardising various activities and practices in the markets through legislation.
In accordance with the provision of the said Act, 14 agricultural produce marketing committees have been established to facilitate and regulate transaction of agricultural and allied produces. So far 14 Agricultural Produce Marketing Committees are functioning in the state. The Arunachal Pradesh Agriculture Marketing Board is to oversee the functioning of Agricultural Produce Marketing Committees and to provide necessary assistance in establishment of infrastructural facilities such as market sheds, storage, godowns out of the grants released by the state government.
The efforts of the state government and Agricultural Produce Marketing Board (APAMB) have been supplemented to some extent by the Directorate of Marketing and Inspection, Government of India, under Mini Mission III of the Technology Mission for Development of Horticulture in the North East and Macro Management Programme. The facilities created under various financial supports at different locations are given in Table A, B and C. In order to promote better marketing access to the enterprising farmers, Arunachal Pradesh Agriculture Marketing (Regulation) Act, 1989 was amended during 2006, by incorporating contract farming and establishment of private market yards to facilitate private investment in agricultural marketing. This amendment will encourage the entrepreneurs in establishment of private market and facilitate the farmers to sell their products to the purchasers, which will considerably enhance the farmers’ income.
Table ‘A’: Statement Showing the Marketing Infrastructure Created in the Different APMCs under Marketing Board Against Grant-in-Aid
Sl. No. Name of APMC Infrastructure Created Location1 Khonsa Fish Market (12 seated Platform) Khonsa
Meat Market (6 seated Platformtwo shoes MarketOne store for fish tradersslaughter Houseone Market shed Rangluasextension of Market KhonsaMarket shed with CGI roofing DeomaliOBT shed for Fish Market DeomaliMIBt double unit cloth shed DeomaliRepairing/Renovation of Market shed LongdingMIBt single unit Market shed (3 ) LongdingOpen platform CC flooring Longding5 room transit camp at Tinsukia tinsukiasPt type Market shed (2) KhonsaConstruction of Cattle Market shed Kanubari
Annexure 2
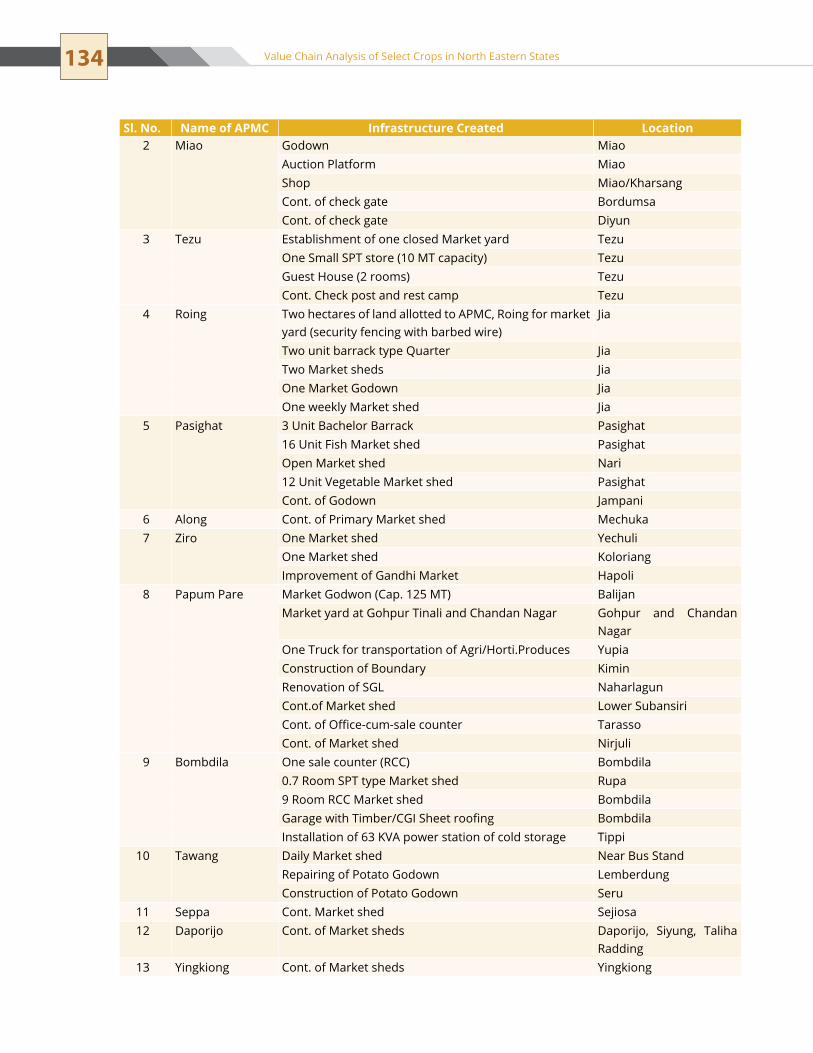
134 Value Chain Analysis of Select Crops in North Eastern States
Sl. No. Name of APMC Infrastructure Created Location2 Miao Godown Miao
Auction Platform Miaoshop Miao/KharsangCont. of check gate BordumsaCont. of check gate Diyun
3 tezu establishment of one closed Market yard tezuone small sPt store (10 Mt capacity) tezuGuest House (2 rooms) tezuCont. Check post and rest camp tezu
4 Roing two hectares of land allotted to APMC, Roing for market yard (security fencing with barbed wire)
Jia
two unit barrack type Quarter Jiatwo Market sheds JiaOne Market Godown Jiaone weekly Market shed Jia
5 Pasighat 3 Unit Bachelor Barrack Pasighat16 unit Fish Market shed Pasighatopen Market shed nari12 unit Vegetable Market shed PasighatCont. of Godown Jampani
6 Along Cont. of Primary Market shed Mechuka7 Ziro one Market shed yechuli
one Market shed KoloriangImprovement of Gandhi Market Hapoli
8 Papum Pare Market Godwon (Cap. 125 MT) BalijanMarket yard at Gohpur Tinali and Chandan Nagar Gohpur and Chandan
nagarOne Truck for transportation of Agri/Horti.Produces yupiaConstruction of Boundary KiminRenovation of SGL naharlagunCont.of Market shed Lower subansiriCont. of Office-cum-sale counter tarassoCont. of Market shed nirjuli
9 Bombdila one sale counter (RCC) Bombdila0.7 Room SPT type Market shed Rupa9 Room RCC Market shed BombdilaGarage with Timber/CGI Sheet roofing BombdilaInstallation of 63 KVA power station of cold storage tippi
10 tawang Daily Market shed near Bus standRepairing of Potato Godown LemberdungConstruction of Potato Godown seru
11 seppa Cont. Market shed sejiosa12 Daporijo Cont. of Market sheds Daporijo, siyung, taliha
Radding13 yingkiong Cont. of Market sheds yingkiong

135
Sl. No. Particulars Quantity District/Location1 establishment of Primary Market 3 1. Singchung, West Kameng District
2. Neri, East Siang Distict3. Aalo, West Siang District
2 establishment of Primary Marketa. 6 1. Raga, L/Subansiri Distict2. Ziro, L/Subansiri District3. Longding, Tirap District.4. Mirmir, East Siang District5. Ganga Market, Papumpare District6. Nari/Pam, East Siang District.
establishment of secondary Marketb. 6 1. Tenga, West Kameng Districttata truck – 709c. 6 1. Roing, L/Dibang valley District.
3 establishment of Primary Marketa. 3 1. yazali, L/Subansiri District2. Hija, L/Subansiri District.3. Nyapin, Kurung Kumey District
Rice Houllerb. 15 4. Pasighat, East Siang District - 6 5. Aalo, West Siang District - 4 6. Papumre District - 2.7. Kurung Kumey District - 1 8. Lohit District - 2.
tata truck – 709c. 2 1. Aalo, West Siang District - 1.2. Kurung Kumey District - 1
4 Mustard oil Milla. 4 1. East Siang District - 1 2. Lohit District -1 3. L/Dibang valley District - 1 4. Changlang District - 1
spices grading unitb. 3 1. Changlang District - 1 2. West Siang District - 1 3. West Kameng District - 1
Cattle food production unitc. 1 1. Papumpare District - 1.Rice Milld. 10 1. East Siang District - 3
2. West Siang District - 3 3. East Kameng District - 1 4. Tirap District - 1 5. upper Siang District - 2
Gur Making Machinee. 2 nos 1. Tirap District - 1 2. upper Subansiri District - 1.
tata truck-709f. 1 1. Lower Subansiri District -1 Construction of Transit Godowng. 1 1. Tirap Distict -1
5 establishement of Primary Marketa. 2 Bordumsa, Changlang District -1 Dolungmukh,L/subansiri District - 1
Mini Rice Millb. 10 1. East Siang District -2 2. West Siang District - 2 3. Lower District -24. Changlang District - 2.5. Ziro, L/Subansiri District - 2
Table ‘B’: statement showing the Infrastructure Creation Under Macro Management Scheme at different Location/District
Annexure 2

136 Value Chain Analysis of Select Crops in North Eastern States
Table ‘C’: Statement Showing the Marketing Infrastructure Created in the Different APMCs under technology Mission of Mini Mission - III
Wholesale Markets - 6 Rural Primary Markets - 24 State Grading Laboratories - 2
Sl. No. Name of APMC Infrastructure Created Location1 Khonsa one Rural Primary Market Kanubari2 Miao one Rural Primary Market Miao3 tezu one Wholesale Market tezu
5 nos. Rural Primary Market tezu/Chowkham/Hayuliang/Lathao/and Piyong
4 Roing one whole sale Market Roing2. One Rural Primary Market Roing
5 Pasighat one Wholesale Market Pasighat5 nos. Rural Primary Market Koyu/Bolong/nari/Koreng/MeboState Grading Laboratory Pasighat
6 Along one Rural Primary Market Likabali7 Ziro one Wholesale Market Hapoli
two Rural Primary Market Hapoli/Boushimla8 Papum Pare One Wholesale Market at Gohpur Tinali Itanagar
3 Rural Primary Market Chandan nagar/sagalee/KiminState Grading Laboratory naharlagun
9 Bomdila one Wholesale Market tenga5 Rural Primary Market Lui Kalaktang/Dirang/Kaspi/
thrizino & Bhalukpogn
Till 2010-11, Arunachal Pradesh Agriculture Marketing Board (APAMB) under Dept. of Agriculture was responsible for establishment of infrastructure and promotion of marketing activities. For the purpose, 3 cold storages in the region (West Kameng, Passighat and Lohit) are established but have remained unoperational/unutilised till date, 6 regulated markets (West Kameng, Papum Pare, Ziro, Passighat, Roing, Khonsa) are established by the Arunachal Pradesh Agriculture Marketing Board but due to lack of proper infrastructure facilities in the markets such as sheds, storages, boundary walls, weigh bridges, auction platforms etc. traders and farmers are not interested to operate and utilise the same.
Horticulture perspectives and future PolicyFrom the point of view of horticulture produce (perishables), the infrastructural facilities created so far are inadequate and traders & farmers are not keen on utilising the markets because of lack of basic infrastructure such as auction sheds, cold storages, boundary walls, weigh bridges, auction platforms, electricity, water, rest rooms and also due to location disadvantages. Therefore, there is a need for creation of market infrastructure facilities within the reasonable limit enabling traders and farmers to utilise the same.
the following infrastructural facilities are to be created: Adequate marketing infrastructure at village/circle/district and state level such as ��
rural primary market, storage godowns, grading, sorting and packing facilities.Transport facilities to be strengthened.��

137
APMCs are to be equipped with modern amenities.��
Appropriate linkage between producers and sellers.��
Wholesale and terminal market.��
Pre-cooling and cold storage facilities.��
Availability of manpower with proper market orientation.��
Credit support.��
Market intelligence.��
Processing and value addition.��
Rural road connectivity.��
ConclusionIn spite of all the efforts taken by the Dept. of Agriculture, Government of Arunachal Pradesh, the desired result could not be achieved with regard to agricultural marketing. This may be possibly due to dependence of marketing activities with the existing paraphernalia of the department as well as inadequate fund position.
In order to boost marketing of horticulture produce in the state, a separate Horticulture Marketing Board was established in 2011, under the Directorate of Horticulture which is solely responsible for horticulture produce marketing activities for speedy development and regulation but due to lack of funds, it is yet to take up these activities.
therefore, in view of the vast potential and resources in horticulture sector including aromatic and medicinal plants in the state, there is an urgent need for adequate infrastructural support as per suitability to streamline the Horticulture Marketing in the state to attract private investors and sponsor for contract farming.
Assam
Post-harvest and marketing infrastructure status in AssamMarket yards are a long felt need of the farming community of Assam as they go a long way in ensuring optimum if not higher remuneration to them through proper weighing, cleaning, grading and better price realisation of their produce. The farmers look forward to a regulated market yard as a dependable infrastructure for furtherance of their economic goal. The advantages of a regulated market yard system are immense and wherever such a system exists, it has been widely appreciated. Today, the farmers consider it a boon to be in a place where they can confidently sell their produce and get an appropriate return for the quantity and quality they produce year after year. The state has 20 Regulated Market Committees, 20 Primary Market yards and 206 Secondary Market yards.
Markets established under Technology MissionUparhali Market�� under Guwahati Sub-Divisional Market Committee in Kamrup district.Gauripur Market�� under Gauripur Regulated Market Committee in Dhubri district.Mandia Market�� under Baharihat Regulated Market Committee in Barpeta district.
Annexure 2
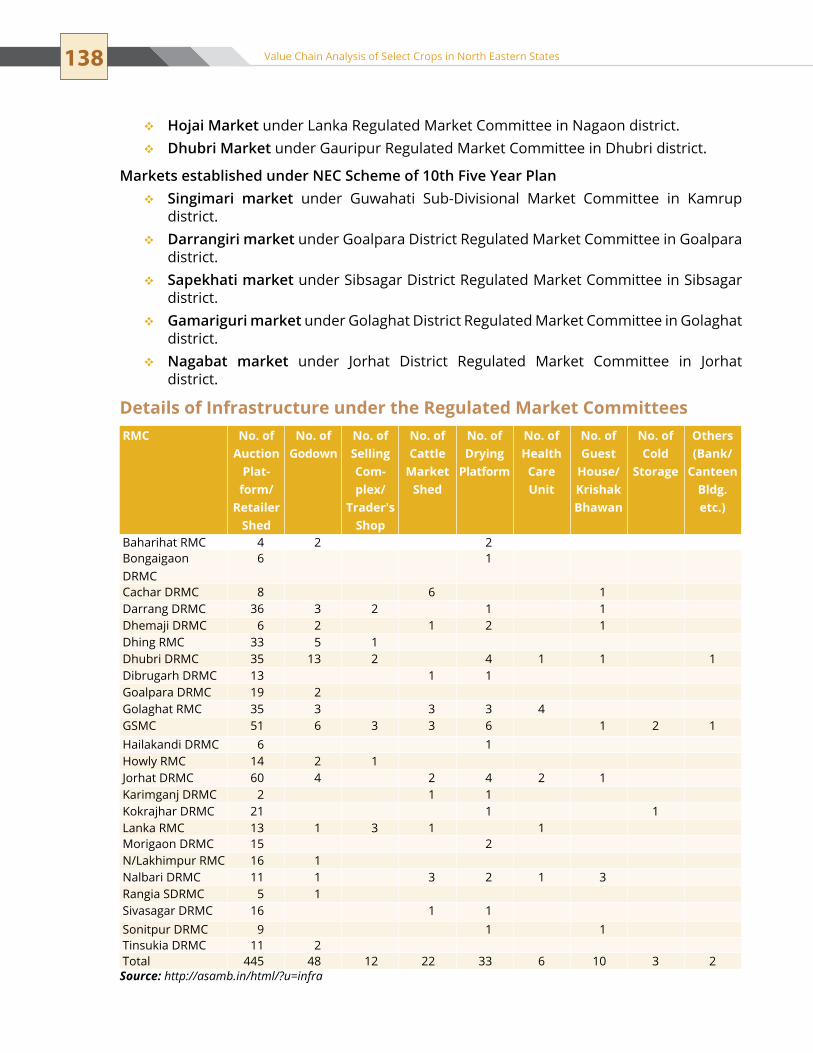
138 Value Chain Analysis of Select Crops in North Eastern States
Hojai Market�� under Lanka Regulated Market Committee in Nagaon district.Dhubri Market�� under Gauripur Regulated Market Committee in Dhubri district.
Markets established under NEC Scheme of 10th Five Year PlanSingimari market�� under Guwahati Sub-Divisional Market Committee in Kamrup district.Darrangiri market�� under Goalpara District Regulated Market Committee in Goalpara district.Sapekhati market�� under sibsagar District Regulated Market Committee in sibsagar district.Gamariguri market�� under Golaghat District Regulated Market Committee in Golaghat district.Nagabat market�� under Jorhat District Regulated Market Committee in Jorhat district.
Details of Infrastructure under the Regulated Market CommitteesRMC No. of
Auction Plat-
form/Retailer
Shed
No. of Godown
No. of Selling Com-plex/
Trader's Shop
No. of Cattle
Market Shed
No. of Drying
Platform
No. of Health
Care Unit
No. of Guest
House/Krishak Bhawan
No. of Cold
Storage
Others (Bank/
Canteen Bldg.etc.)
Baharihat RMC 4 2 2Bongaigaon DRMC
6 1
Cachar DRMC 8 6 1Darrang DRMC 36 3 2 1 1Dhemaji DRMC 6 2 1 2 1Dhing RMC 33 5 1Dhubri DRMC 35 13 2 4 1 1 1Dibrugarh DRMC 13 1 1Goalpara DRMC 19 2Golaghat RMC 35 3 3 3 4GSMC 51 6 3 3 6 1 2 1Hailakandi DRMC 6 1Howly RMC 14 2 1Jorhat DRMC 60 4 2 4 2 1Karimganj DRMC 2 1 1Kokrajhar DRMC 21 1 1Lanka RMC 13 1 3 1 1Morigaon DRMC 15 2n/Lakhimpur RMC 16 1nalbari DRMC 11 1 3 2 1 3Rangia sDRMC 5 1sivasagar DRMC 16 1 1sonitpur DRMC 9 1 1tinsukia DRMC 11 2total 445 48 12 22 33 6 10 3 2Source: http://asamb.in/html/?u=infra

139
Guwahati Sub-Divisional Market Committee (Kamrup)this is the one of the oldest market committees in the state and has total 8 market yards. In the following tables important features of each market have been discussed:
Sl. No. Name of the Market Yards
Features
1 Bijoynagar Market Daily primary market, total arrival of green vegetables about 1000 tons ��per annum and 70% of this is sent to Guwahati, not qualified market related infrastructure.
2 Boko Market Weekly market but not a F&V market��
3 Chhayagaon Market Biweekly market but not a F&V market ��
4 Fancy Bazar one of the oldest market in the heart of the city for fruits, vegetable ��and spices
5 Hahim Market Biweekly market��
6 Machkhowa market Machkhowa daily vegetable wholesale mandi was established in 1989 ��and located at 9 kms. From NH-37 in Guwahati. It is one of the largest vegetable markets in Assam, spread over two bigha area. Almost all the vegetables are traded in this market. Produces arrives from the markets as near as singimari (16 kms) and as far as from Karbi Anglang (350 kms). There are 25 traders, 85 commission agents (commodity wise), 145 Faria and 60 hamal (Coolie) involved in this wholesale mandi. Produce is sent to Greater Guwahati and Shillong from Machkhowa mandi.
Activities such as cleaning, filling, weighing, grading and standardisation ��is done manually in the market. Though Machkhowa is major vegetable mandi in Guwahati but it is lacking in basic facilities and post-harvest infrastructure. This mandi does not even have the facility of a board to display market price. It is lacking in post-harvest facilities such as sorting grading, washing, packaging and cold storage. It also does not have office building, auction platform, drying platform, godown, drinking water, sanitation and parking. Garbage disposal is very poor and the place is very much congested. Internal road in the market is very narrow.
Due to lack of above facilities, condition of Machkhowa market is ��very poor and traders have to sell their produce on a daily basis. By providing post-harvest infrastructure wastage can be checked to a major extent. Sorting, grading facilities, cold store and godowns should be availed to improve the market condition and for business of quality product.
7 nagabera Market Weekly market but not a vegetable market��
8 singimari Market Daily market and annual arrival of vegetables is about 700 tons and act ��as a feeder market for Machkhowa market.
Annexure 2

140 Value Chain Analysis of Select Crops in North Eastern States
Manipur
Post-harvest and marketing infrastructure status in Manipur
Proposed/upcoming processing projects in Manipur
Sl. No. Proposed Project Production Capacity
1 Fruits & vegetables processing 80 Mt/Day
2 Ginger dehydration and oleoresin 33 Mt/Day
3 spices processing plant 5 MT/Day
4 Integrated mushroom processing plant 15 MT/Day
5 Lime Ginger (RTS) Plant 100 lakh bottles of 200 ml per annum
6 Agri export zone for passion fruit 2 Mt/Hour
7 Manipuri traditional liquor plant (distillery) 9 lakh lt./annum
8 Integrated pineapple concentration plant 50 MT/day
Sl. No. Processing Unit
Sector Type Capacity MT/Annum
Type of Products
1 MAGFRuIT Hort. & Soil Conservation, Govt. of Manipur
ssI Unit 240 Canned fruits and vegetables, fruit syrups, pickles, jam jellies, Rts (Lime-ginger) cordials, squashes, candies, etc.
2 HEIRANG Co-operative ssI Unit 240 Canned fruits and vegetables, fruit syrups, pickles, jam jellies, Rts (Lime-ginger) cordials, squashes, candies, etc.
3 WAIFRu N.G.O. ssI Unit 240 Canned fruits and vegetables, fruit syrups, pickles, jam jellies, Rts (Lime-ginger) cordials, squashes, candies, etc.
4 RATNA FRuITS PRIVATE Cottage scale 50 Squashes, jam
5 LIKLA PRIVATE Cottage scale 50 Squashes, RTS, jam, jelly (Fruit based)
6 sAnA PRIVATE Cottage scale 50 Squashes, pickle, jelly, jam
7 MANIFRu PRIVATE Cottage scale 50 Squashes, pickle, jelly, jam
8 HILL FRuITS PRIVATE Cottage scale 50 Squashes, jam, etc.
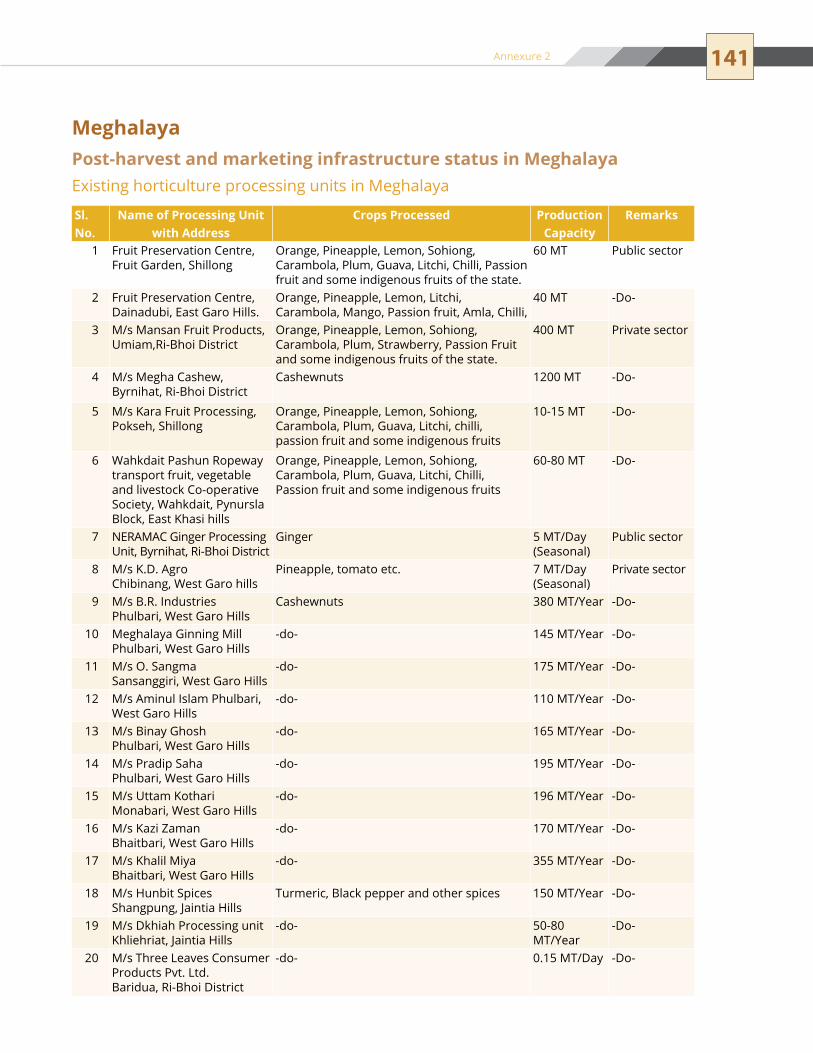
141
Sl. No.
Name of Processing Unit with Address
Crops Processed Production Capacity
Remarks
1 Fruit Preservation Centre, Fruit Garden, Shillong
orange, Pineapple, Lemon, sohiong, Carambola, Plum, Guava, Litchi, Chilli, Passion fruit and some indigenous fruits of the state.
60 Mt Public sector
2 Fruit Preservation Centre, Dainadubi, East Garo Hills.
orange, Pineapple, Lemon, Litchi, Carambola, Mango, Passion fruit, Amla, Chilli,
40 Mt -Do-
3 M/s Mansan Fruit Products, Umiam,Ri-Bhoi District
orange, Pineapple, Lemon, sohiong, Carambola, Plum, Strawberry, Passion Fruit and some indigenous fruits of the state.
400 Mt Private sector
4 M/s Megha Cashew, Byrnihat, Ri-Bhoi District
Cashewnuts 1200 Mt -Do-
5 M/s Kara Fruit Processing, Pokseh, shillong
orange, Pineapple, Lemon, sohiong, Carambola, Plum, Guava, Litchi, chilli, passion fruit and some indigenous fruits
10-15 MT -Do-
6 Wahkdait Pashun Ropeway transport fruit, vegetable and livestock Co-operative society, Wahkdait, Pynursla Block, east Khasi hills
orange, Pineapple, Lemon, sohiong, Carambola, Plum, Guava, Litchi, Chilli, Passion fruit and some indigenous fruits
60-80 Mt -Do-
7 NERAMAC Ginger Processing Unit, Byrnihat, Ri-Bhoi District
Ginger 5 MT/Day(seasonal)
Public sector
8 M/s K.D. AgroChibinang, West Garo hills
Pineapple, tomato etc. 7 Mt/Day(seasonal)
Private sector
9 M/s B.R. IndustriesPhulbari, West Garo Hills
Cashewnuts 380 MT/year -Do-
10 Meghalaya Ginning MillPhulbari, West Garo Hills
-do- 145 MT/year -Do-
11 M/s O. SangmaSansanggiri, West Garo Hills
-do- 175 MT/year -Do-
12 M/s Aminul Islam Phulbari, West Garo Hills
-do- 110 MT/year -Do-
13 M/s Binay GhoshPhulbari, West Garo Hills
-do- 165 MT/year -Do-
14 M/s Pradip sahaPhulbari, West Garo Hills
-do- 195 MT/year -Do-
15 M/s Uttam KothariMonabari, West Garo Hills
-do- 196 MT/year -Do-
16 M/s Kazi ZamanBhaitbari, West Garo Hills
-do- 170 MT/year -Do-
17 M/s Khalil MiyaBhaitbari, West Garo Hills
-do- 355 MT/year -Do-
18 M/s Hunbit spicesShangpung, Jaintia Hills
turmeric, Black pepper and other spices 150 MT/year -Do-
19 M/s Dkhiah Processing unitKhliehriat, Jaintia Hills
-do- 50-80 MT/year
-Do-
20 M/s three Leaves Consumer Products Pvt. Ltd.Baridua, Ri-Bhoi District
-do- 0.15 MT/Day -Do-
MeghalayaPost-harvest and marketing infrastructure status in Meghalayaexisting horticulture processing units in Meghalaya
Annexure 2
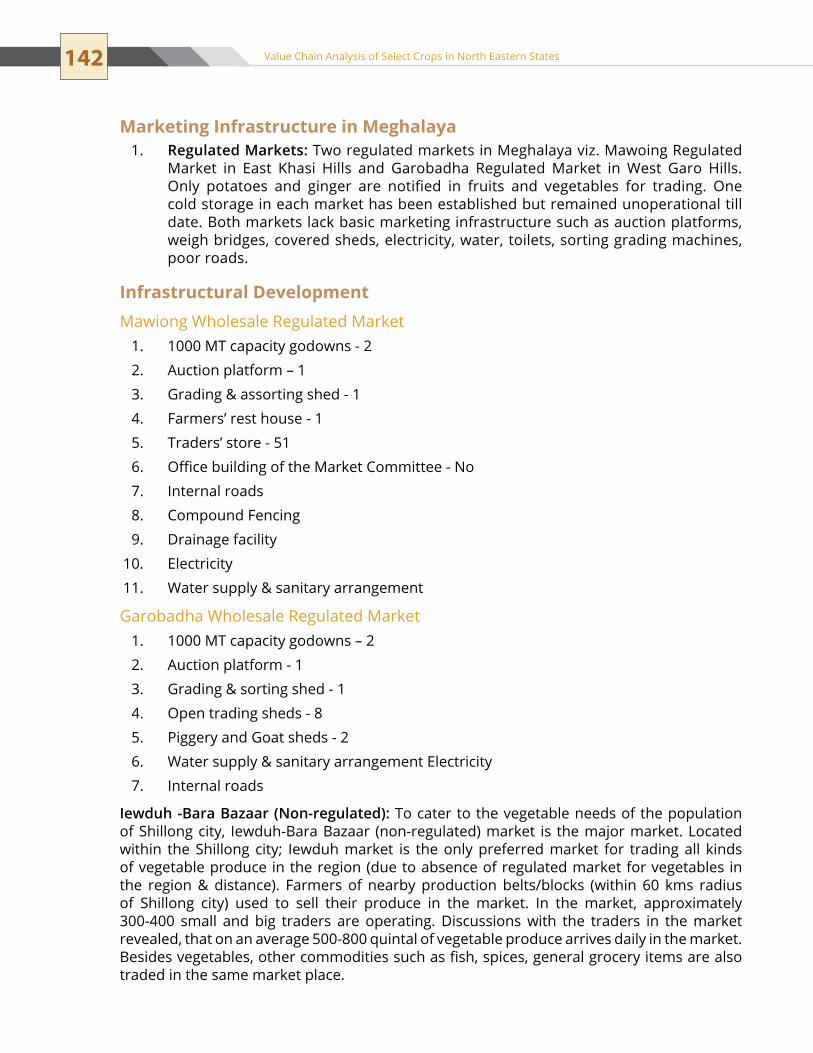
142 Value Chain Analysis of Select Crops in North Eastern States
Marketing Infrastructure in MeghalayaRegulated Markets:1. Two regulated markets in Meghalaya viz. Mawoing Regulated Market in East Khasi Hills and Garobadha Regulated Market in West Garo Hills. Only potatoes and ginger are notified in fruits and vegetables for trading. One cold storage in each market has been established but remained unoperational till date. Both markets lack basic marketing infrastructure such as auction platforms, weigh bridges, covered sheds, electricity, water, toilets, sorting grading machines, poor roads.
Infrastructural Development Mawiong Wholesale Regulated Market
1000 Mt capacity godowns - 2 1.
Auction platform – 1 2.
Grading & assorting shed - 1 3.
Farmers’ rest house - 1 4.
Traders’ store - 515.
Office building of the Market Committee - No6.
Internal roads7.
Compound Fencing8.
Drainage facility9.
electricity10.
Water supply & sanitary arrangement11.
Garobadha Wholesale Regulated Market1000 Mt capacity godowns – 21.
Auction platform - 1 2.
Grading & sorting shed - 1 3.
open trading sheds - 8 4.
Piggery and Goat sheds - 2 5.
Water supply & sanitary arrangement electricity6.
Internal roads7.
Iewduh -Bara Bazaar (Non-regulated): to cater to the vegetable needs of the population of Shillong city, Iewduh-Bara Bazaar (non-regulated) market is the major market. Located within the shillong city; Iewduh market is the only preferred market for trading all kinds of vegetable produce in the region (due to absence of regulated market for vegetables in the region & distance). Farmers of nearby production belts/blocks (within 60 kms radius of Shillong city) used to sell their produce in the market. In the market, approximately 300-400 small and big traders are operating. Discussions with the traders in the market revealed, that on an average 500-800 quintal of vegetable produce arrives daily in the market. Besides vegetables, other commodities such as fish, spices, general grocery items are also traded in the same market place.

143
The market serves both wholesale and retailing point for trading of vegetable produce. Farmers from nearby production belts bring their produce in wooden baskets/jute bags and sell it to traders who offer the maximum price. Traders in turn sell their produce to retailers as well as to consumers.
the market operates in a very congested area and unhygienic conditions and lacks basic infrastructure amenities for vegetable trading such as parking, even roads, clean and regular supply of water, irregular electricity, auction platforms/sheds, weigh bridges, sorting & grading machines, cold stores, godowns, market information system, garbage disposal system etc.
Iewduh is run and managed by the syiem of Mylliem, head of the traditional democratic institution of Syiemship. The most distinctive feature of this ancient market is the total domination of its retail trade by the Khasi women, who are everywhere, all over Iewduh. though the market is non-regulated, but discussions with the traders and farmers revealed payment of money to person deputed on behalf of the King for provision of facilities in the market such as sanitation, parking etc.
By and large, trading in horticulture produce is done in markets yet to be ‘regulated’. In fact, there is a resistance to transactions taking place in APMCs yards and the trading associations have moved the Hon’ble High Court for redressal of this matter.
In the interest of the future growth of the city, the need of the hour is to shift the Iewduh (Bara Bazaar) to Farmers Market at upper Shillong (under construction) which has hygienic conditions, sufficient parking space, pucca roads, auction platforms, sorting, grading and packing machines, electronic display system, ripening chamber & multipurpose cold storage facility in addition to small godowns etc.
Farmers Market at Upper Shillong (Under Construction):1. to provide marketing facility for these farmers, to enable them to market their produce, the Government of Meghalaya through the State Agricultural Marketing Board set out to establish a farmers’ market under ACA (Additional Central Assistance) at a cost of ` 47,18,731.00. The construction of this farmers’ market has been completed and it is likely to be inaugurated soon.
The main objectives of establishing the farmers’ market is (a) to provide a place which is equipped with infrastructure and facilities for the farmers to sell their produce in a transparent and fair manner to buyers and sellers alike, (b) to enable farmers to come together and manage the facility, (c) to provide a platform to farmers for exchanging information and for the Department of Agriculture to meet with farmers with a view to providing technical information and advisories, (d) to facilitate direct seller and trader interaction and trading between farmers and traders which eliminates the operation of superfluous middlemen to a great extent.
Infrastructural details of the Upper Shillong – Farmers’ Market The upper Shillong Farmers’ Market is built on land belonging to the State Agriculture Department at 5th Mile upper Shillong, on the road to Shillong peak. It consists of the structures as shown in the table given on page 144.
Collection and Forwarding Centre: to improve the marketability and add value to the produce brought by the farmers to the market, the State Government has proposed to set up a Collection and Forwarding Centre at upper-Shillong adjacent to the farmers’ market. At the Collection and Forwarding Centre, the produce will be properly graded stored and packed, before being transported to the larger markets outside shillong and even outside the state. This will provide a better market and better price for their marketable surplus produce and enable the farmers to enhance their income from their cultivation.
Annexure 2
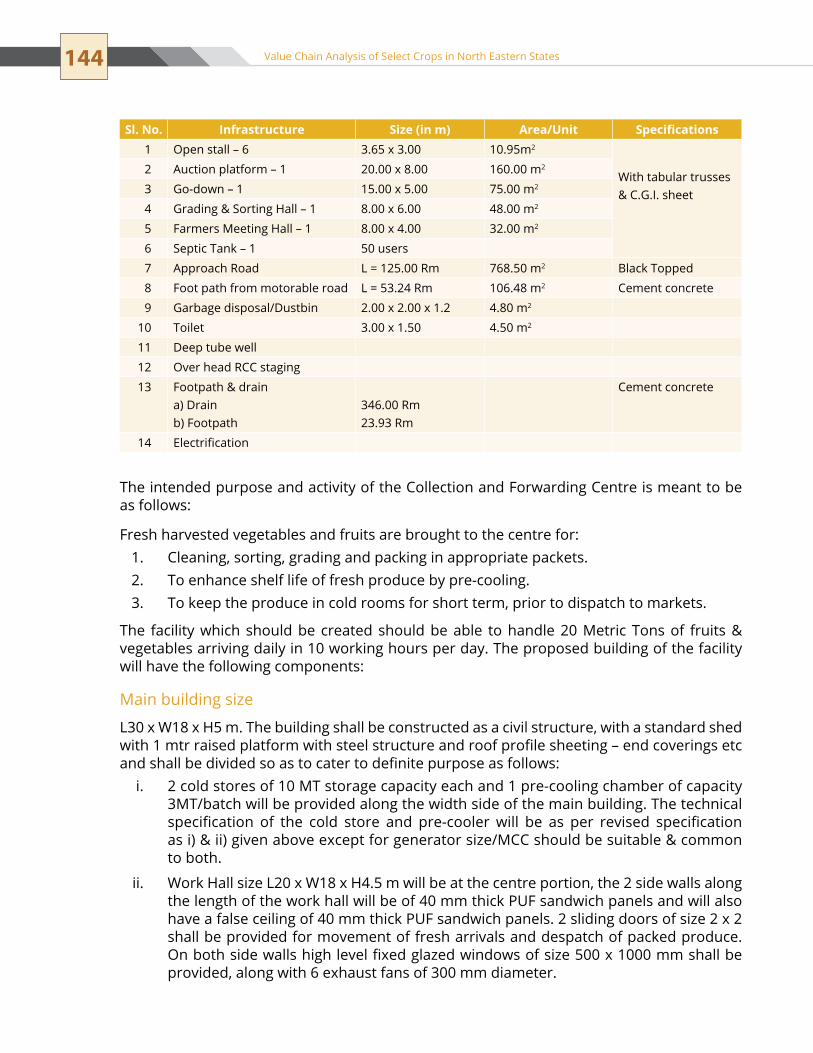
144 Value Chain Analysis of Select Crops in North Eastern States
The intended purpose and activity of the Collection and Forwarding Centre is meant to be as follows:
Fresh harvested vegetables and fruits are brought to the centre for: Cleaning, sorting, grading and packing in appropriate packets.1. To enhance shelf life of fresh produce by pre-cooling.2. To keep the produce in cold rooms for short term, prior to dispatch to markets.3.
the facility which should be created should be able to handle 20 Metric tons of fruits & vegetables arriving daily in 10 working hours per day. The proposed building of the facility will have the following components:
Main building size
L30 x W18 x H5 m. The building shall be constructed as a civil structure, with a standard shed with 1 mtr raised platform with steel structure and roof profile sheeting – end coverings etc and shall be divided so as to cater to definite purpose as follows:
2 cold stores of 10 Mt storage capacity each and 1 pre-cooling chamber of capacity i. 3MT/batch will be provided along the width side of the main building. The technical specification of the cold store and pre-cooler will be as per revised specification as i) & ii) given above except for generator size/MCC should be suitable & common to both.
Work Hall size L20 x W18 x H4.5 m will be at the centre portion, the 2 side walls along ii. the length of the work hall will be of 40 mm thick PuF sandwich panels and will also have a false ceiling of 40 mm thick PuF sandwich panels. 2 sliding doors of size 2 x 2 shall be provided for movement of fresh arrivals and despatch of packed produce. On both side walls high level fixed glazed windows of size 500 x 1000 mm shall be provided, along with 6 exhaust fans of 300 mm diameter.
Sl. No. Infrastructure Size (in m) Area/Unit Specifications1 open stall – 6 3.65 x 3.00 10.95m2
With tabular trusses & C.G.I. sheet
2 Auction platform – 1 20.00 x 8.00 160.00 m2
3 Go-down – 1 15.00 x 5.00 75.00 m2
4 Grading & Sorting Hall – 1 8.00 x 6.00 48.00 m2
5 Farmers Meeting Hall – 1 8.00 x 4.00 32.00 m2
6 septic tank – 1 50 users
7 Approach Road L = 125.00 Rm 768.50 m2 Black topped
8 Foot path from motorable road L = 53.24 Rm 106.48 m2 Cement concrete
9 Garbage disposal/Dustbin 2.00 x 2.00 x 1.2 4.80 m2
10 toilet 3.00 x 1.50 4.50 m2
11 Deep tube well
12 over head RCC staging
13 Footpath & draina) Drainb) Footpath
346.00 Rm23.93 Rm
Cement concrete
14 Electrification

145
The remaining side of the building will house supervisor’s office size L4 x W4 x H3 m, iii. Laboratory L4 x W3 x H3 m, ladies and gents toilets each L4 x W4 x H3 m with a middle corridor of size L4 x W2 x H3 m. This portion of the building will have all end walls and partition walls of brick plaster finished and painted. False ceiling either with wood or acoustic tiles shall be provided in this area. Toilets shall be fitted with WC/urinal/wash basin fittings appropriate for use by 40 persons. Suitable septic tank shall be provided for the toilet waste disposal.the lean to portion of the building will be a covered veranda to enable truck unloading/iv. loading and at the cold store end will be separated with brick wall (6 x 6 m area) for the utility equipment such as water filtration plant, EPT, DG set, electrical panels etc.Electrification of the building shall be as follows: lighting 2 in cold store, 10 in the v. work hall, 2 each in office, lab and toilets. 15 amp power sockets-12 in the work hall, 4 at the office, 2 in each toilet. Sufficient external lighting is to be provided as required.two compost pits of size L6 x W6 x D3 m are to be provided at least 100 m away from vi. the building for disposal of vegetable waste.
Plant and MachineryRefrigeration equipment for cold stores and pre-cooler and the specs of PuF insulated i. panels, cold store doors etc will be same as given in the revised specs given as item i and ii above.Sorting and grading tables size 1 x 2 m, qty. 10, SS304 sheet covered top, G.I. frame ii. and legs. 4 trolleys with raised handle for moving plastic crates, painted Ms construction with iii. 200 mm diameter rubber wheels, size 1 x 2 m.4 pallets trucks-hydraulic hand-operated, to move PVC pallets of size 1.2 x 1 m and iv. weight carrying capacity of 1,000 kg. 500 perforated plastic crates size 600 x 400 x 300 mm.v. 2 hand tools for strapping cartons.vi. 6 electronic table top weighing scales of 0-30 kg range. vii. 10 fly/insect killer for wall mounting/hanger type. viii. One platform type electronic weighing scale range upto 1,000 kg. ix. One silent diesel generator 85 KVA, 415V/3ph, 50 Hz. Complete with 500 Litre diesel x. tank, accessory electrical switch gear and monitoring panel. One water filtration to produce clean water at the rate of 1mxi. 3/hr complete with 5000 Litre storage tank. Rural Markets (Non-Regulated):2. Besides Bara Bazar (Iewduh Market), Mawiong (East Khasi Hills) and Garobadha (West Garo Hills) Regulated Market, each district has traditional non-regulated rural markets established at the block level. The periodicity of these markets is bi-weekly and ownership of management is mainly by local authorities. The small and marginal farmers of nearby villages mainly sell their produce in the local markets at block level. Being traditional establishments, all rural markets lack basic infrastructure facilities to handle fresh produce.
Annexure 2

146 Value Chain Analysis of Select Crops in North Eastern States
Block MarketsAmlarem DawkiBaghmara emangiri sibbariBetasing AmpatiChokpot ChokpotDadenggiri Dadenggiri RomagalDalu Dalu PurakhasiaDambo Rongjeng RongjengJirang Jirang PatharkhmahKharkuta Adokgiri KharkuttaKhliehriat Khliehriat UmkiangLaitkroh LaitlyngkotLaskein Raliang shangpungMairang Kynshi MairangMawkyrwat MawkyrwatMawphlang Mawngap sohiongMawryngkneng Mawryngkneng smitMawshynrut Riangdo shallangMawsynram Mawsynram tyrsadMylliem Iewduh(shillong) Mawiong Regulated Marketnongstoin nongstoin RambraiPynursla PynurslaRanikor BalatResubelpara Bajengdoba MendipatharRonggara Maheshkhola RonggaraRongram Rongram turasamanda Rongsak samandasamanda Williamnagarselsella Garobadha Regulated Marketshella-Bholaganj shella
Block-wise Listing of Markets in the State

147
Post-harvest and Marketing Infrastructure Status in MizoramFood Processing Plant, Sairang, Aizawl1.
Input Annual Input Capacity (Quintals) ProductPineapple 1200 Squash
orange 2500 Squash
Passion Fruit 2300 Squash
Bamboo shoots 2000 Canned
others 1200 tidbits, Rts, beverages
total 9200
Fruit Juice Concentrate Plant, Chhingchhip2.
Input Annual Input Capacity (TPA)Pineapple 250
orange 400
Passion Fruit 1120
total 1770
Both of the above facilities are underperforming currently, they are underutilised and in huge monetary loss. They are not able to pay the farmers in full for the procured raw materials.
Multipurpose Pack house at Horticulture Complex 3. Cold store (40Mt)��
Sorting grading (2.5 MT/hr)��
Washing, crushing, waxing and packaging facility��
This was constructed last year and has been now leased out to Shimla Hills Pvt. Ltd. @ a rent of ` 50,000 per month.
Block Marketssongsak songsakthadlaskein Jowai Khandulithadlaskein nartiang Wahiajertikrikilla Raksamgiri tikrikillaUmling 20th Mile ByrnihatUmling nongpoh UmdenUmsning Umroi UmsningZikzak Kalaichar Mahendraganj
Annexure 2

148 Value Chain Analysis of Select Crops in North Eastern States
small cold storage at4. Champhai��
serchhip��
Aizawl��
These cold stores are meant for spice storage but are not being used optimally.Wholesale and rural primary markets5.
There are 10 wholesale and 85 rural primary markets constructed by MAMCO. MAMCO charges nominal rent from the tenants.
Wholesale MarketsSl. No. Name of the Wholesale Market Location with District
1 Variengte Vairengte, Kolasib District
2 Kanhmun Kanhmun, Mamit District
3 Bairabi Bairabi, Kolasib District
4 Champhai Champhai, Champhai District
5 Hunthar Aizawl, Aizawl District
6 ngaizel ngaizel, Aizawl District
7 new Market Dawrpui Dawrpui, Aizawl District
8 Mission Vengthlang Mission Vengthlang, Aizawl District
9 Zemabawk north Zemabawk, Aizawl District
10 Farkawn Farkawn, Champhai District
Rural Primary Markets
Sl. No. Name of the Rural Primary Market Location with District1 Khumtung Khumtung, serchhip2 Chhingchhip Chhingchhip, Aizawl District3 tlungvel tlungvel, Aizawl District4 saitual saitul, Aizawl District5 Zawlnuam Zawlnuam, Mamit District6 Khawzawl Dinthar Khawzawl, Champhai District7 Kamalanagar Kamalanagar, Lunglei District8 Khawzawl Hermon Khawzawl, Champhai District9 Mamit Mamit, Mamit Dist.
10 tlabung Tlabung, Aizawl Dist.11 Khanpui Khanpui, Aizawl Dist.
12 Darlawn Darlawn, Aizawl Dist.13 Bilkhawthlir Bilkhawthlir, Kolasib Dist.
14 serchhip Serchhip, Serchhip Dist.
15 saiha Saiha, Saiha Dist.
16 Lawngtlai Lawngtlai, Lawngtlai Dist.
17 Zokhawthar Zokhawthar, Champhai Dist.
18 Bukpui Bukpui, Kolasib Dist.

149
Sl. No. Name of the Rural Primary Market Location with District19 Baktawng Vengpui Baktawng, Serchhip Dist.20 seling Seling, Aizawl Dist.21 Zanlawn Zanlawn, Aizawl Dist.22 sairang Sairang, Aizawl Dist.23 Kawnpui Kawnpui 'N' Kolasib Dist.24 Luangmual Luangmual, Aizawl Dist.25 Aibawk Aibawk, Aizawl Dist.26 Khabung 'S’ Khaaabung 'S' Chamhai Dist.27 Chawlhhmun Chawlhhmun, Aizawl Dist.28 Pukpui Pukpui (Lunglei )29 Haulawng Haulawng, Lunglie30 Kawlkulh Kawlkulh, Champhai Dist.31 West Phaileng W. Phaileng, Mamit Dist.32 thenzawl Thenzawl, Serchhip Dist.33 Khuangleng Khuangleng, Champhai Dist.34 Keifang Keifang, Aizawl Dist.35 tuikual 'n' Tuikual 'N', Aizawl Dist.36 tuipang Tuipang, Saiha Dist.37 Bualpui 'NG' Bualpui 'NG', Lawntlati Dist.38 Pangzawl Pangzawl, Lunglei Dist.39 Chawngtlai Chawngtlai, Champhai Dist.40 Durtlang Durtlang, Aizawl Dist.41 Sihphir Vengthar Shiphir Vengthar, Aizawl Dist.42 Durtlang Durtlang, Aizawl Dist.43 sialhawk Sialhawk, Champhai Dist.44 N.Vanlaiphai N.Vanlaiphai, Serchhip Dist.
45 Darlak Darlak, Mamit Dist.
46 tlangsam Tlangsam, Champhai Dist.
47 tawipui 's' Tawipui 'S', Lunglei Dist.
48 sawleng Sawleng, Aizawl Dist.
49 sangau Sangau, Lawntlai Dist.
50 Reiek Reiek, Mamit Dist.
51 Zotlang Zotlang, Aizawl Dist.
52 Nursery Veng Nursery, Aizawl Dist.
53 Republic Veng Republic, Aizawl Dist.
54 Chawnpui Veng Chawnpui veng, Aizawl Dist.
55 Dinthar Dinthar, Aizwla Dist.
56 Khawruhlian Khawruhlian, Aizawl Dist.
57 Zobawk Zobawk, Lunglei Dist.
58 Hrangchalkawn Hrangchalkawn, Lunglei Dist.59 thualthu Thualthu, Lunglei Dist.60 thingsai Thingsai, Lunglei Dist.
61 S. Vanlaiphai S.Vanlaiphai, Lunglei District
62 Lungsen Lungsen Lunglei Dist.
63 Diltlang 's' Diltlang 'S', Lawngtlai Dist.
Annexure 2
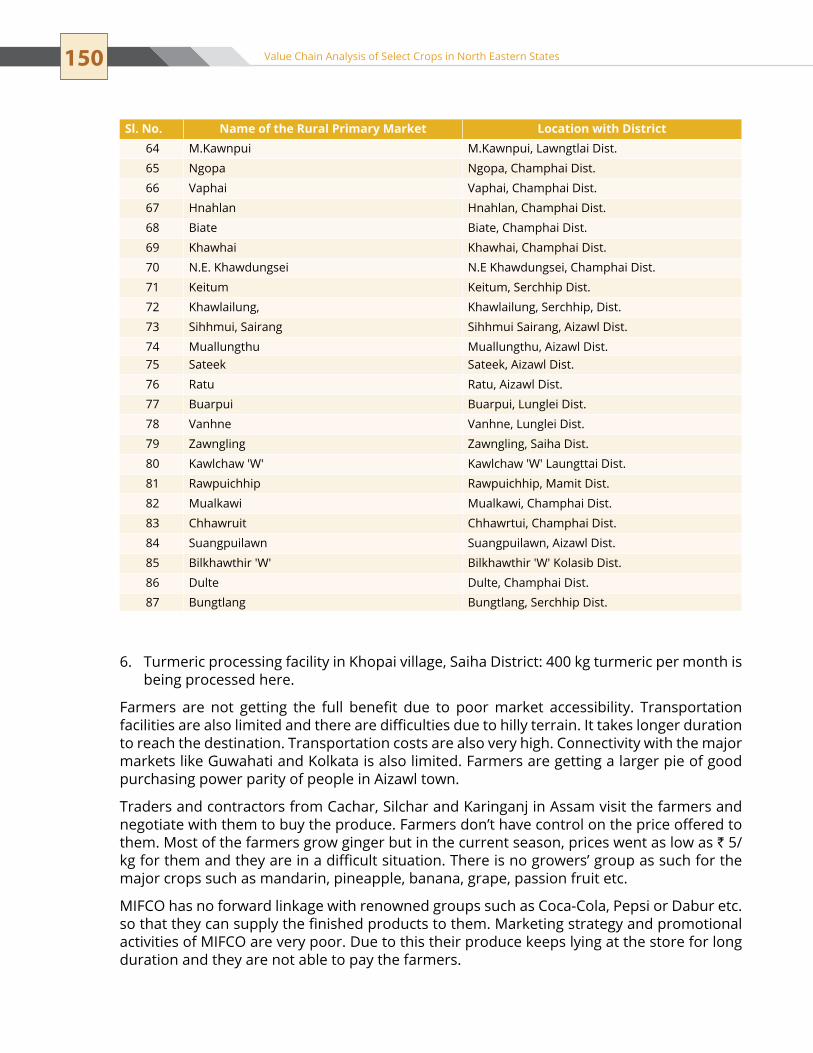
150 Value Chain Analysis of Select Crops in North Eastern States
turmeric processing facility in Khopai village, saiha District: 400 kg turmeric per month is 6. being processed here.
Farmers are not getting the full benefit due to poor market accessibility. Transportation facilities are also limited and there are difficulties due to hilly terrain. It takes longer duration to reach the destination. Transportation costs are also very high. Connectivity with the major markets like Guwahati and Kolkata is also limited. Farmers are getting a larger pie of good purchasing power parity of people in Aizawl town.
traders and contractors from Cachar, silchar and Karinganj in Assam visit the farmers and negotiate with them to buy the produce. Farmers don’t have control on the price offered to them. Most of the farmers grow ginger but in the current season, prices went as low as ` 5/kg for them and they are in a difficult situation. There is no growers’ group as such for the major crops such as mandarin, pineapple, banana, grape, passion fruit etc.
MIFCO has no forward linkage with renowned groups such as Coca-Cola, Pepsi or Dabur etc. so that they can supply the finished products to them. Marketing strategy and promotional activities of MIFCO are very poor. Due to this their produce keeps lying at the store for long duration and they are not able to pay the farmers.
Sl. No. Name of the Rural Primary Market Location with District64 M.Kawnpui M.Kawnpui, Lawngtlai Dist.
65 ngopa Ngopa, Champhai Dist.
66 Vaphai Vaphai, Champhai Dist.
67 Hnahlan Hnahlan, Champhai Dist.
68 Biate Biate, Champhai Dist.
69 Khawhai Khawhai, Champhai Dist.
70 N.E. Khawdungsei N.E Khawdungsei, Champhai Dist.
71 Keitum Keitum, Serchhip Dist.
72 Khawlailung, Khawlailung, Serchhip, Dist.
73 sihhmui, sairang Sihhmui Sairang, Aizawl Dist.
74 Muallungthu Muallungthu, Aizawl Dist.75 sateek Sateek, Aizawl Dist.
76 Ratu Ratu, Aizawl Dist.
77 Buarpui Buarpui, Lunglei Dist.
78 Vanhne Vanhne, Lunglei Dist.
79 Zawngling Zawngling, Saiha Dist.
80 Kawlchaw 'W' Kawlchaw 'W' Laungttai Dist.
81 Rawpuichhip Rawpuichhip, Mamit Dist.
82 Mualkawi Mualkawi, Champhai Dist.
83 Chhawruit Chhawrtui, Champhai Dist.
84 suangpuilawn Suangpuilawn, Aizawl Dist.
85 Bilkhawthir 'W' Bilkhawthir 'W' Kolasib Dist.
86 Dulte Dulte, Champhai Dist.87 Bungtlang Bungtlang, Serchhip Dist.

151
Nagaland
Post-harvest and Marketing Infrastructure Status in NagalandThe total cold storage capacity is 6150 MT with two multipurpose cold storages in Nagaland, one co-operative and the other privately owned. Following are the details:
Marcofed Cold Storage in Dimapur – Capacity 1150 MT1. Private Cold Storage in Dimapur- Capacity 5000 MT2.
since pineapple is a major crop of the region, a collection centre to collect the fruit from nearby villages has been set up by the Government at Jharnapani (in Dimapur).
there are two pineapple processing units which carry out pineapple slicing and canning and sell in the nearby markets:
naandi foundation has one pineapple processing centre in Medziphema run by ��
women members of SHGs. Zhimoni food processing centre in Dimapur. ��
List of Existing Markets in Nagaland
Annexure 2
WsM: Wholesale Market RPM: Rural Primary Market AM: Apni Mandi
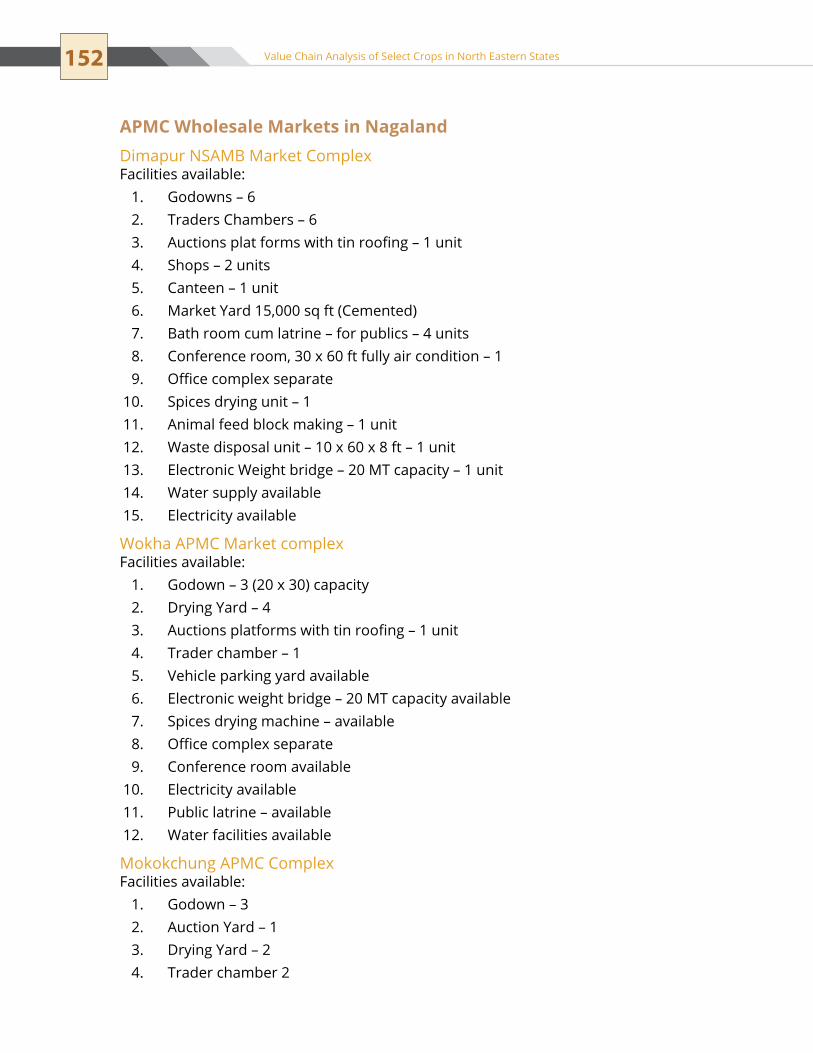
152 Value Chain Analysis of Select Crops in North Eastern States
APMC Wholesale Markets in NagalandDimapur nsAMB Market ComplexFacilities available:
Godowns – 6 1. traders Chambers – 6 2. Auctions plat forms with tin roofing – 1 unit3. shops – 2 units4. Canteen – 1 unit5. Market yard 15,000 sq ft (Cemented)6. Bath room cum latrine – for publics – 4 units7. Conference room, 30 x 60 ft fully air condition – 18. Office complex separate 9. spices drying unit – 1 10. Animal feed block making – 1 unit11. Waste disposal unit – 10 x 60 x 8 ft – 1 unit12. electronic Weight bridge – 20 Mt capacity – 1 unit13. Water supply available 14. electricity available15.
Wokha APMC Market complexFacilities available:
Godown – 3 (20 x 30) capacity1. Drying yard – 4 2. Auctions platforms with tin roofing – 1 unit3. trader chamber – 14. Vehicle parking yard available 5. electronic weight bridge – 20 Mt capacity available6. spices drying machine – available7. Office complex separate8. Conference room available 9. electricity available10. Public latrine – available11. Water facilities available12.
Mokokchung APMC ComplexFacilities available:
Godown – 3 1. Auction yard – 1 2. Drying yard – 2 3. trader chamber 2 4.

153
shops – 2 units5. Vehicle parking yard available 6. Water facilities available7. Conference room available8. spices drying machine – available9. electronic weight bridge – 20 Mt capacity - 1 available10. Electricity available. 11.
Mon APMC ComplexFacilities available:
Godown – 3 1. Conference room available2. traders chamber – 23. Auction yard available4. Drying yard – 2 5. Vehicle parking yard available 6. Public sanitation available7. Electricity available.8. spices drying unit – 1 9. Office complex separate.10.
tuensang APMC ComplexFacilities available:
Godown – 2 1. traders chambers – 1 2. Drying yard – 2 3. Auction yard – 14. electronic Weight Bridge – 20 Mt capacity- 1 5. Public sanitation available6. Water facilities available7. Vehicle parking yard available 8. Conference room available9. spices drying machine – available10. Office complex separate11.
Kohobuto APMC Complex, DimapurFacilities available
Godown – 2 1. Conference room available2. Drying yard – 2 3. Auction platform – 14.
Annexure 2
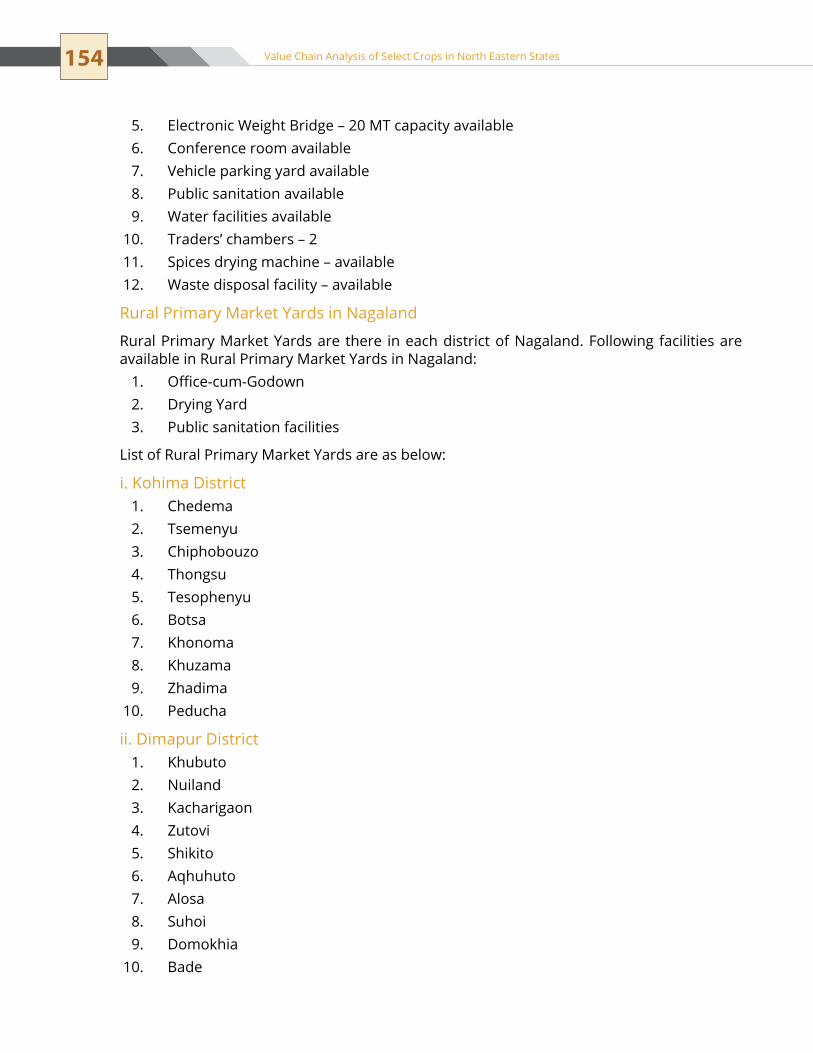
154 Value Chain Analysis of Select Crops in North Eastern States
electronic Weight Bridge – 20 Mt capacity available5. Conference room available6. Vehicle parking yard available 7. Public sanitation available8. Water facilities available9. Traders’ chambers – 2 10. spices drying machine – available11. Waste disposal facility – available12.
Rural Primary Market yards in Nagaland
Rural Primary Market yards are there in each district of Nagaland. Following facilities are available in Rural Primary Market yards in Nagaland:
Office-cum-Godown1. Drying yard2. Public sanitation facilities3.
List of Rural Primary Market yards are as below:
i. Kohima DistrictChedema1. tsemenyu2. Chiphobouzo3. thongsu4. tesophenyu5. Botsa6. Khonoma7. Khuzama8. Zhadima9. Peducha10.
ii. Dimapur District Khubuto1. nuiland2. Kacharigaon3. Zutovi4. shikito5. Aqhuhuto6. Alosa7. suhoi8. Domokhia9. Bade10.
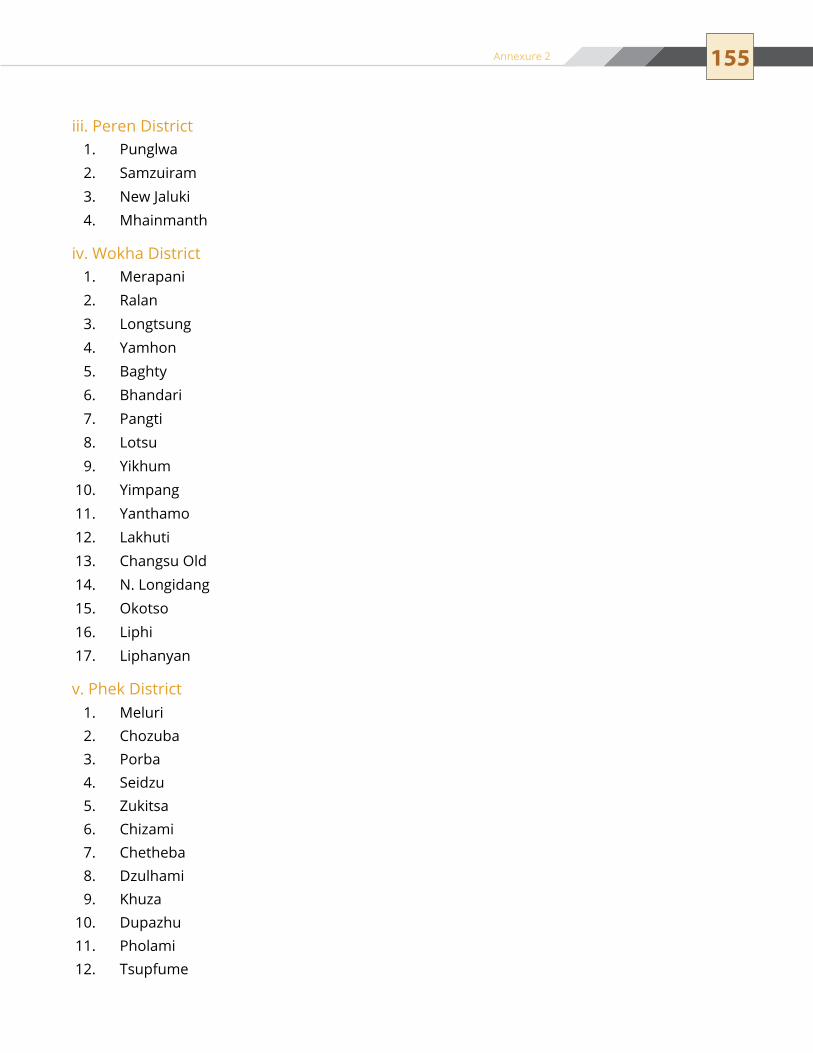
155
iii. Peren DistrictPunglwa1. samzuiram2. New Jaluki3. Mhainmanth4.
iv. Wokha DistrictMerapani1. Ralan2. Longtsung3. yamhon4. Baghty5. Bhandari6. Pangti7. Lotsu8. yikhum9. yimpang10. yanthamo11. Lakhuti12. Changsu old13. N. Longidang14. okotso15. Liphi16. Liphanyan17.
v. Phek DistrictMeluri1. Chozuba2. Porba3. seidzu4. Zukitsa5. Chizami6. Chetheba7. Dzulhami8. Khuza9. Dupazhu10. Pholami11. tsupfume12.
Annexure 2

156 Value Chain Analysis of Select Crops in North Eastern States
vi. Zunhebuto Districtsaptiga1. Ighanomi2. Hebolumi3. Kitsakita4. Asukhomi5. Kitami6. Akaito7. Mudutsughu8. sapotomi9.
vii. Kiphiri DistrictKiphiri town1. Amahator2.
viii. Longleng DistrictPungo1.
ix. Mokokchung DistrictAsangma1. Longjang2. tsutsung3. Longkhum4. Aliba (new camp)5. tuli6. Mokokchung village7. sungkumen8. tsurang valley9. Waromong10. Chungtia11. Merangkong12. Mopongchukit13. Chuchuyimpang14.
x. Mon DistrictAboi1. tobu2. Wakching3. yongkong4. tanhai5.
xi. Tuensang DistrictMangakhi1. shamator2.
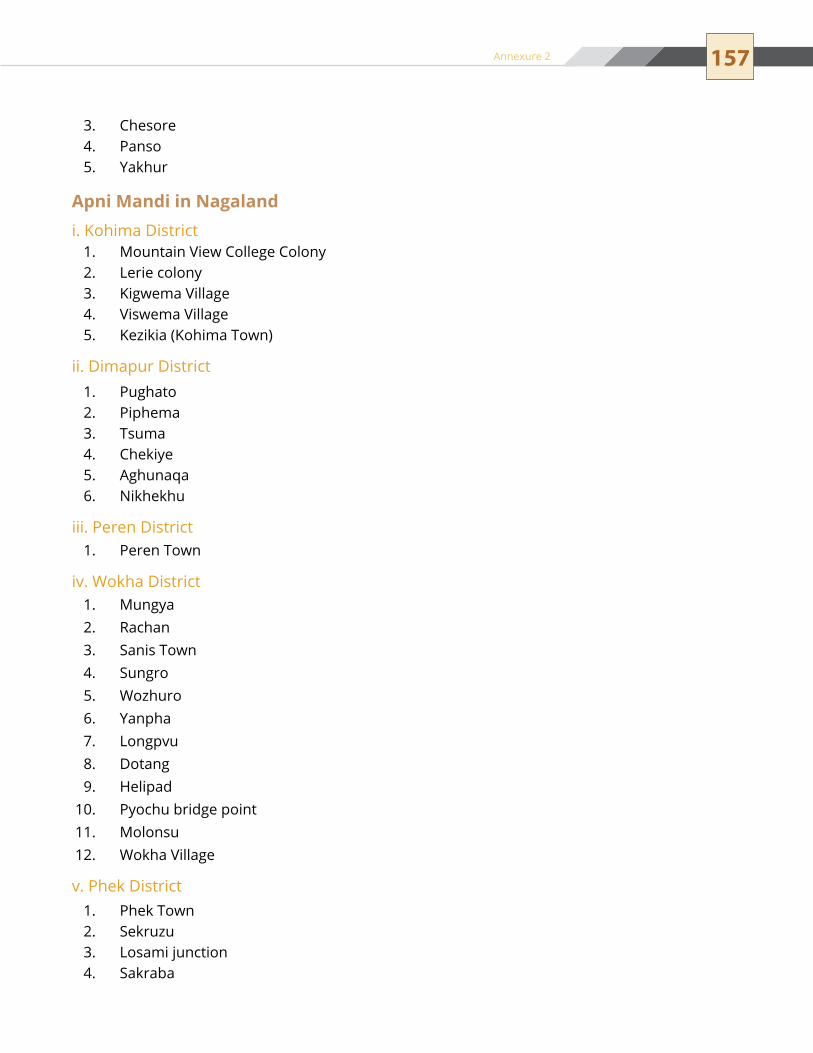
157
Chesore3. Panso4. yakhur5.
Apni Mandi in Nagalandi. Kohima District
Mountain View College Colony1. Lerie colony2. Kigwema Village3. Viswema Village4. Kezikia (Kohima town)5.
ii. Dimapur DistrictPughato1. Piphema2. tsuma3. Chekiye4. Aghunaqa5. nikhekhu6.
iii. Peren DistrictPeren town1.
iv. Wokha DistrictMungya1. Rachan2. sanis town3. sungro4. Wozhuro5. yanpha6. Longpvu7. Dotang8. Helipad9. Pyochu bridge point10. Molonsu11. Wokha Village12.
v. Phek DistrictPhek town1. sekruzu2. Losami junction3. sakraba4.
Annexure 2
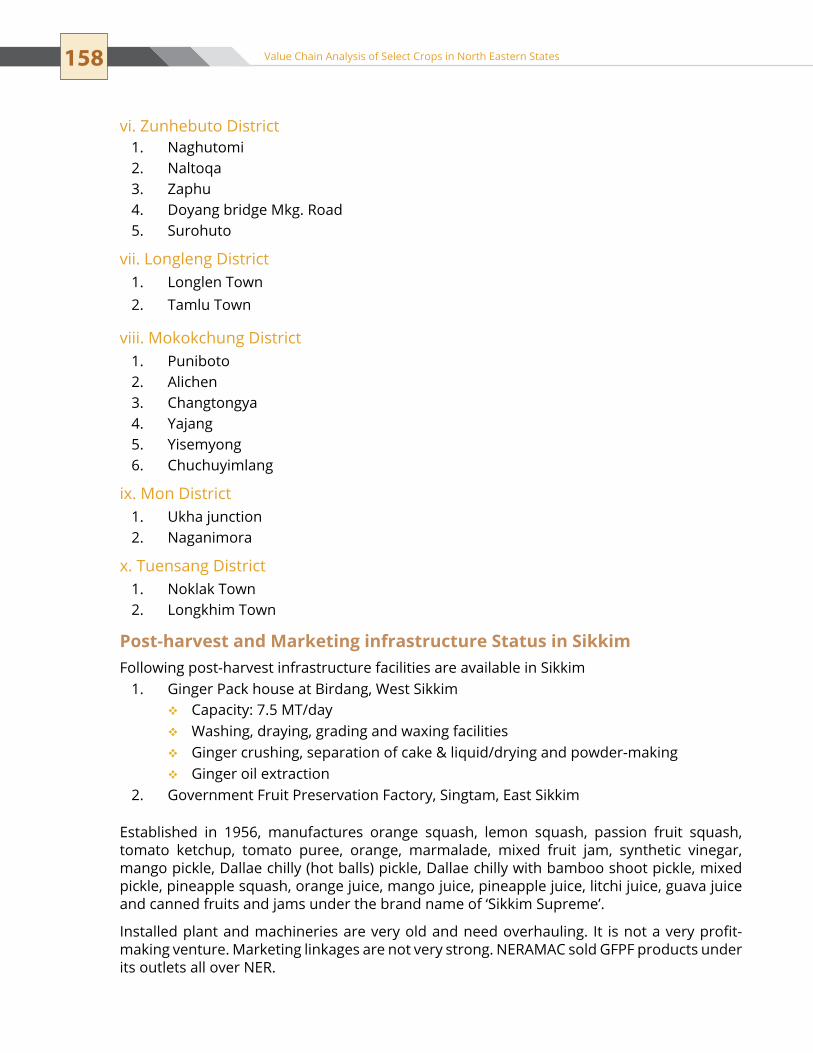
158 Value Chain Analysis of Select Crops in North Eastern States
vi. Zunhebuto Districtnaghutomi1. Naltoqa2. Zaphu3. Doyang bridge Mkg. Road4. surohuto5.
vii. Longleng DistrictLonglen town1. tamlu town2.
viii. Mokokchung DistrictPuniboto1. Alichen2. Changtongya3. yajang4. yisemyong5. Chuchuyimlang6.
ix. Mon DistrictUkha junction1. naganimora2.
x. Tuensang Districtnoklak town1. Longkhim town2.
Post-harvest and Marketing infrastructure Status in SikkimFollowing post-harvest infrastructure facilities are available in Sikkim
Ginger Pack house at Birdang, West Sikkim1. Capacity: 7.5 MT/day��
Washing, draying, grading and waxing facilities��
Ginger crushing, separation of cake & liquid/drying and powder-making��
Ginger oil extraction��
Government Fruit Preservation Factory, Singtam, East Sikkim2.
Established in 1956, manufactures orange squash, lemon squash, passion fruit squash, tomato ketchup, tomato puree, orange, marmalade, mixed fruit jam, synthetic vinegar, mango pickle, Dallae chilly (hot balls) pickle, Dallae chilly with bamboo shoot pickle, mixed pickle, pineapple squash, orange juice, mango juice, pineapple juice, litchi juice, guava juice and canned fruits and jams under the brand name of ‘Sikkim Supreme’.
Installed plant and machineries are very old and need overhauling. It is not a very profit-making venture. Marketing linkages are not very strong. NERAMAC sold GFPF products under its outlets all over NER.

159
Apart from these, there is one cold store in Rong Po, used for potato storage, flowers pack houses and agriculture check posts (Rong Po & Melli) to record the inflow and outflow of produce.
Agriculture marketing is not regulated in the states so the marketing of fruits and vegetables are also unorganised. Largest fruits and vegetable market in Kanchanjungha Complex in Gangtok is occupied by wholesalers/retailers. NERAMAC, SIMFED and few farmers’ groups and individuals have outlets in the complex. There is no other facility available as per the APMC guideline. Government made effort to organise horticulture trade by locating it under one regulated market in East Sikkim but due to non-interest of traders it could not be implemented.
Post-harvest and Marketing Infrastructure Status in TripuraThe state lacks post-harvest infrastructure for handling, however, there is sufficient cold storage capacity in the state. Total of 14 cold storages are there in Tripura with total capacity of 31,450 MT.
District-wise Cold Storage Capacity in TripuraDistrict No. of Cold Storage Capacity Remarknorth tripura 3 5200 Multipurpose
West tripura 7 16250 Multipurpose
Dhalai 1 2000 Multipurpose
south tripura 3 8000 Multipurpose
Total 14 31450 Source: Directorate of Marketing and Inspection, MoA, GoI
Out of total cold storage capacity, approximately 9750 MT of capacity has been created by private sector and 2000 Mt by cooperatives, rest cold storage capacity has been developed by the public sector. Most of the capacity is used for storage of potato.
At present, there are 21 regulated markets in tripura, of which 9 are in West tripura district, 6 in South Tripura and 3 each in Dhalai and North districts.
Sl. No.
District No. of Regulated Markets
Locations
1 West 9 Mohanpur, Bishalgarh, Champaknagar, teliamura, Bechaibari, Melagar, Sonamura, Kalyanpur, Jumpuijala
2 south 6 Garjee, Santirbazar, Barpathari, Kalashi, Nutanbazar, Silachari
3 Dhalai 3 Chawmanu, Gandachara, Kulai
4 north 3 Dasda, Pabiachhara, Panisagar
Although a sufficient number of regulated markets are present in Tripura, these markets are not functioning properly due to the various shortcomings like inefficient management systems, lack of infrastructure for the perishable products in the market etc. In addition to the regulated markets, there is large number of non-regulated markets in the state.
The regulated markets in the state do not have specific infrastructure for handling horticultural products. In addition to these regulated markets, there are 554 listed rural primary markets and 84 wholesale assembling markets.
Annexure 2

160 Value Chain Analysis of Select Crops in North Eastern States
For fruits and vegetables, biggest wholesale markets in the state are Golbazar and Battala markets in Agartala. Both of these markets are non-regulated markets. These two markets serve to Agartala as well as distribution centre for whole of tripura for products coming from other states. There are around 30-35 commission agents and wholesalers in the Golbazar market and around 15 Traders in Battala market.
Stakeholders Met During the Field Visits
Arunachal PradeshDirector Horticulture, Itanagar ��
Deputy Director Horticulture (HQ), Itanagar ��
Asst. Director Horticulture (R&D), Itanagar ��
Horticulture Marketing Officers, Itanagar ��
Director, AP Agriculture Marketing Board (APAMB), Itanagar ��
District Horticulture Officer, Papum Pare District��
Horticulture Development Officers, yupia, Papum Pare District��
District Horticulture Officer, Lower Subansiri District��
Horticulture Development Officers, Lower Subansiri District��
Wholesaler’s/Retailer’s (10), Papum Pare Regulated Market, Itanagar ��
Farmers’ FGDs (2) at yupia (Papum Pare) & Ziro- Lower Subansiri��
AssamDirector – Horticulture and Food Processing��
Deputy Director – Horticulture and Food Processing��
K K Choudhary – superintendent engineer, Agriculture engineering Department��
Horticulture statistics Inspector – Directorate of Horticulture��
Ashok Kr. Sharma – Executive Engineer – Cold Storage, Agriculture Engineering ��
DepartmentG. Baishya – Packhouse Division, Assam Industrial Development Corporation��
Dilip Bora, District Agriculture Officer, Kamrup��
Agriculture Development Officers of Boko, Khetri, Bongaon, Goroimari and Rani��
Agriculture Information Officer, Kamrup��
secretary, APMC Bijoynagar, Kamrup��
Wholesalers, retailers and commission agents (15), Machkhowa and Fancy Bazar, ��
GuwahatiFarmers’ FGD (2) in Bongaon and Boko (Kamrup)��
MeghalayaDirector Horticulture, shillong��
Deputy Director Horticulture, shillong��
Horticulture Development Officer (Marketing), Shillong��
Secretary, Meg. State Agriculture Marketing Board, Shillong��
District Horticulture Officer, East Khasi Hills��
Asst. Director of Horticulture (Fruit Preservation unit), Shillong��

161
Supervisor (Fruit Preservation unit), Shillong��
Block Development Officer (Horticulture), Sohara Block, East Khasi Hills��
Horticulture Development Officer, Sohara Block, East Khasi Hills��
Block Development Officer (Horticulture), Pynursala Block, East Khasi Hills��
Asst. Director Horticulture, Jaintia Hills��
Horticulture Development Officer, Jaintia Hills��
District Horticulture Officer, Ri Bhoi District��
Horticulture Development Officer, Ri Bhoi District��
Traders (5), Mawoing Regulated Market, Shillong��
Wholesaler’s/Retailer’s (10), Bara Bazar (Iewduh), Shillong��
Farmers’ FGDs (5) at Sohara & Pynursala (East Khasi Hills), Jowai (Jaintia Hills) and ��
Ri Bhoi
ManipurMr. K. Ngaciken, Director – Horticulture, Government of Manipur (Mb. 09436021887)��
Mr. Ratan Kumar – Head, Horticulture Technology Mission, Manipur��
Mr. Kipchen (Joint Director & Incharge NVI, Government of Manipur) (for further ��
information – Mr. Iboton PA to joint director – 09436603076)Dr. Suresh Kumar Methi – KVK Programme Coordinator, Tamenglong (Mb. 09206176715)��
Tawa Fruits – Lemon processors��
Mrs. Rehma – KVK Programme Coordinator, Imphal��
Mr. R. K. Darendrajit Singh (Superintendent – Custom Preventive Force & LCS, Moreh) – ��
(Landline 038722 264238, Mb. 09436025417)Mr. Holichand, Inspector, LCS Moreh (Mb. 09402757179)��
Dr. S. S. Roy, Horticulture expert, KVK, Imphal (09436891040)��
Nagaland
Sl. No. Name Post Address Contact No.1 Dr. N. Benjong Aier Joint Director Kohima 94360023812 Mr. Pawan Kumar Deputy Director - Planning Kohima 94364378063 Ms. Mesetuonuo Deputy Director Kohima 98561624654 Mr. Jerry Patton Divisional Horticulture Officer Kohima 94360090265 Mr. Engyol Divisional Horticulture Officer Dimapur 9856051130
6 Mr. Temsu Longkumer Area Horticulture Officer Dimapur 94360044867 Mr. Mishento Divisional Horticulture Officer Peren 94364220048 Dr. Akali Sema Director - CIH Medziphema 03862-247707 9 Mr. Prabin Kumar Marketing Officer - CIH Medziphema 03862-247707
10 Mr. Gimzie secretary-APMC Jalukie, Peren 943601834011 Mr. Loanry Horticulture Extension Officer Gaili, Peren 985653726012 Mr. Kishor Marketing Officer - ICCOA Dimapur 940116971913 Ms. Abea Mero MD, Naga Spices Pvt. Ltd. Dimapur 985612552914 Mr. Duolo Director - Kuda Cold storage Dimapur 943600830315 Mr. Velsete Manager - Kuda Cold storage Dimapur 961283665116 Wholesalers and retailers (10) at wholesale and retail markets in Dimapur17 FGD with farmers at Molvom, Dimapur (1); Kohima (1) and Gaili, Peren (1)
Annexure 2
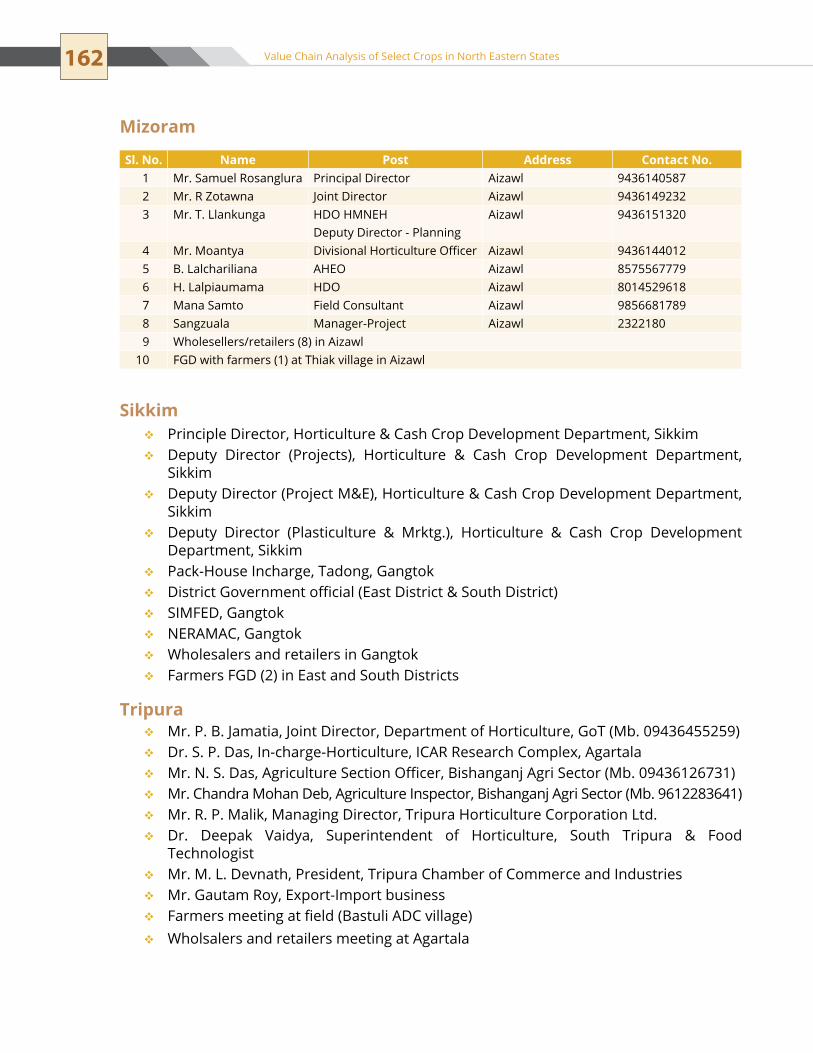
162 Value Chain Analysis of Select Crops in North Eastern States
Mizoram
Sl. No. Name Post Address Contact No.1 Mr. Samuel Rosanglura Principal Director Aizawl 94361405872 Mr. R Zotawna Joint Director Aizawl 94361492323 Mr. T. Llankunga HDo HMneH
Deputy Director - PlanningAizawl 9436151320
4 Mr. Moantya Divisional Horticulture Officer Aizawl 94361440125 B. Lalchariliana AHeo Aizawl 85755677796 H. Lalpiaumama HDo Aizawl 80145296187 Mana samto Field Consultant Aizawl 98566817898 sangzuala Manager-Project Aizawl 23221809 Wholesellers/retailers (8) in Aizawl
10 FGD with farmers (1) at Thiak village in Aizawl
SikkimPrinciple Director, Horticulture & Cash Crop Development Department, sikkim��
Deputy Director (Projects), Horticulture & Cash Crop Development Department, ��
sikkimDeputy Director (Project M&e), Horticulture & Cash Crop Development Department, ��
sikkimDeputy Director (Plasticulture & Mrktg.), Horticulture & Cash Crop Development ��
Department, sikkimPack-House Incharge, Tadong, Gangtok��
District Government official (East District & South District)��
SIMFED, Gangtok ��
NERAMAC, Gangtok ��
Wholesalers and retailers in Gangtok��
Farmers FGD (2) in East and South Districts��
TripuraMr. P. B. Jamatia, Joint Director, Department of Horticulture, GoT (Mb. 09436455259)��
Dr. S. P. Das, In-charge-Horticulture, ICAR Research Complex, Agartala��
Mr. N. S. Das, Agriculture Section Officer, Bishanganj Agri Sector (Mb. 09436126731)��
Mr. Chandra Mohan Deb, Agriculture Inspector, Bishanganj Agri Sector (Mb. 9612283641)��
Mr. R. P. Malik, Managing Director, Tripura Horticulture Corporation Ltd.��
Dr. Deepak Vaidya, Superintendent of Horticulture, South Tripura & Food ��
technologistMr. M. L. Devnath, President, Tripura Chamber of Commerce and Industries��
Mr. Gautam Roy, Export-Import business��
Farmers meeting at field (Bastuli ADC village)��
Wholsalers and retailers meeting at Agartala��
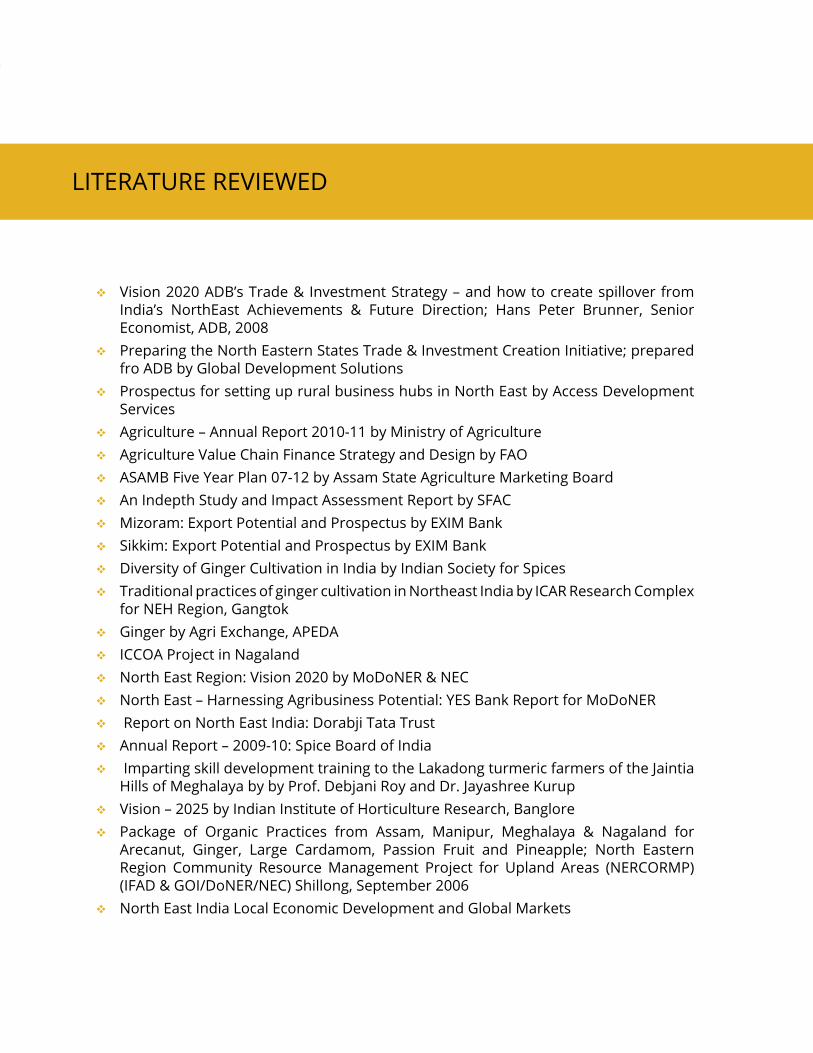
LITERATuRE REVIEWED
Vision 2020 ADB’s Trade & Investment Strategy – and how to create spillover from ��
India’s NorthEast Achievements & Future Direction; Hans Peter Brunner, Senior economist, ADB, 2008Preparing the north eastern states trade & Investment Creation Initiative; prepared ��
fro ADB by Global Development SolutionsProspectus for setting up rural business hubs in north east by Access Development ��
servicesAgriculture – Annual Report 2010-11 by Ministry of Agriculture��
Agriculture Value Chain Finance Strategy and Design by FAO��
ASAMB Five year Plan 07-12 by Assam State Agriculture Marketing Board��
An Indepth Study and Impact Assessment Report by SFAC��
Mizoram: Export Potential and Prospectus by EXIM Bank��
Sikkim: Export Potential and Prospectus by EXIM Bank��
Diversity of Ginger Cultivation in India by Indian Society for Spices��
traditional practices of ginger cultivation in northeast India by ICAR Research Complex ��
for NEH Region, GangtokGinger by Agri Exchange, APEDA��
ICCoA Project in nagaland��
North East Region: Vision 2020 by MoDoNER & NEC��
North East – Harnessing Agribusiness Potential: yES Bank Report for MoDoNER��
Report on north east India: Dorabji tata trust��
Annual Report – 2009-10: spice Board of India��
Imparting skill development training to the Lakadong turmeric farmers of the Jaintia ��
Hills of Meghalaya by by Prof. Debjani Roy and Dr. Jayashree KurupVision – 2025 by Indian Institute of Horticulture Research, Banglore��
Package of organic Practices from Assam, Manipur, Meghalaya & nagaland for ��
Arecanut, Ginger, Large Cardamom, Passion Fruit and Pineapple; North Eastern Region Community Resource Management Project for Upland Areas (neRCoRMP) (IFAD & GOI/DoNER/NEC) Shillong, September 2006North East India Local Economic Development and Global Markets��


Editorial TeamPravesh sharma��
D. Bhuyan��
M.J. Das ��
Case Study PreparationAlok Kumar srivastava, team Leader ��
sunil Kumar ��
Gaurav Vats��
om Prakash��
This document is a public resource and may be freely quoted and excerpted. However, any form of commercial exploitation is prohibited.
NOT FOR SALE© Small Farmers’ Agribusiness Consortium (SFAC), New Delhi, 2012.
Design and Print: Macro Graphics Pvt. Ltd. www.macrographics.com
Note for ReadersThis study has been conducted on behalf of SFAC by Indian Society of Agribusiness Professionals (ISAP). Due diligence has been exercised by the consultant to obtain authentic secondary data and conduct field studies and interviews in a professional manner. The analysis and conclusions drawn are also made in an objective and fair manner. All original
records related to the study are available with ISAP.
SFAC encourages all readers to bring any factual errors in this publication to our attention.


![ection (A) [75-80] - Chain and Sprocket, Roller Chain ... C-78 DrawBenchChainBarandPinChain C-79 DoubleFlexChainBarandPinChain C-80-C-81 EngineeredClassChainTool C-82 EngineeringClassChainSelectedIndustryApplicationsIntroduction](https://img.pdfslide.net/doc/110x75/5adb95927f8b9aee348e3b78/ection-a-75-80-chain-and-sprocket-roller-chain-c-78-drawbenchchainbarandpinchain.jpg)


![jkVªh; —fk ckt+kj - sfacindia.comsfacindia.com/UploadFile/Statistics/NAM_Hindi Brochure final.pdf · cktjk] tkS] Tokj] /kku] vjaM h dscht] ljlksa] lks; kchu] ewax Qyh] dikl] thjk]](https://img.pdfslide.net/doc/110x75/5a717f667f8b9aa7538ce67a/jkvh-fk-cktkj-sfacindiacomsfacindiacomuploadfilestatisticsnamhindi.jpg)